the influence of e-learning and learning interests on
TRANSCRIPT

2426 ______________________________________________________________ DOI: https://doi.org/10.33258/birci.v4i2.1943
The Influence of E-Learning and Learning Interests on
Learning Outcomes of Physical Education in 11th Students of
SMA Negeri 8 Medan
Denny Syahputra Panjaitan1, Nurhayati Simatupang2, Sanusi Hasibuan3, Indrakasih4 1,2,3,4Sports Education, Universitas Negeri Medan, Indonesia
I. Introduction
Learning is essentially a cognitive process that has the support of psychomotor
functions. The psychomotor function in the learning manifestations carried out by students,
almost certainly always involves a function of the realm of reason whose intensity of use is
certainly different from other learning events. So the teacher's job is to give examples of
the use of cognitive strategies that are appropriate, meaning that they are in accordance
with the general capacity of students and in accordance with the needs and levels of
difficulty of the material to be taught to them. (Arsani et al, 2020)
E-Learning consists of two parts, namely: "E" which stands for "electronic" and
"Learning" which means learning using electronic device assistance services, especially
computer devices. Therefore, e-learning is often referred to as online courses. In other
words, e-learning or learning through online is learning whose implementation is supported
by technology services such as telephone, audio, video tape, satellite or computer
transmission. Onlinecurse is how to take advantage of ICT (Information and
Communication Technology) for distance education so that those who want education can
be more accessible.
According to Andriani (2003: 305) e-learning is a form of distance learning (PJJ).
Those that utilize telecommunication and information technology, for example the internet,
video / audiobrodcasting, video / audioconferencing, CD-Room (Synchronous and
asynchronous). Furthermore, according to Dewi Salma (2007: 240) Thus, e-learning or
online learning is learning whose implementation is supported by technology services such
as telephone, audio, videotape, satellite or computer transmission.
During the pandemicovid-19 period, all schools were closed to study at home.
Automatically learn at home via distance and involve e-learning in learning. One of them
Abstract
The purpose of this study was to explain the effect of differences in learning outcomes of physical education through edmodo and google classroom on Class XI students of SMA Negeri 8 Medan. This research method uses an experimental method with a 2x2 level design. The data analysis technique used analysis of variance. The research instrument used a questionnaire. The results of the research that have been carried out state that: (1) Based on the results of the analysis of variance in the list of attachments at the level of α = 0.05, it is obtained that F0 <Ft is 0.279 <4.11. (2) Then in the Tukey test in groups A1B1 and A2B1 where = 1.681 and = 2.95. Research conclusions: 1) There are differences in physical education learning outcomes through edmodo and google classroom.
.
Keywords
learning outcomes;
google classroom;
edmodo

Budapest International Research and Critics Institute-Journal (BIRCI-Journal) Volume 4, No 2, May 2021, Page: 2426-2438
e-ISSN: 2615-3076 (Online), p-ISSN: 2615-1715 (Print) www.bircu-journal.com/index.php/birci
email: [email protected]
2427
is learning physical education which is quite difficult to implement in online learning.
Physical education is one of the subjects in schools which is a means of encouraging the
development of motor skills, physical abilities, knowledge, sportsmanship, habituation of
healthy lifestyles and character building (mental, emotional, spiritual and social) in order to
achieve the goals of the national education system.
Physical education is different from the sport, because of the physical education
teaching physical activity that aims to maintain a healthy body, strengthen muscles, and
shape the character of the students, while in sport there are physical activities that require
high-level skills and in actual use rules that have been agreed upon. Implementation of
learning sports physical education and health in primary schools there are not in
accordance with the concept of learning sports physical education and health. (Novianti et
al, 2020)
Physical education is useful for increasing quality human resources both in terms of
physical, spiritual, such as affective and cognitive as well as psychomotor. Physical
activities that are carried out only by prioritizing physical activity alone will not lead
students to think and take the values contained in the game will not be useful in everyday
life. Physical Education is a lesson that contains many character values that are useful for
everyday human life. Physical Education is one of the subjects that are carried out to form
a child's physical body so that they can maintain fitness, but apart from that through
Physical Education, children also learn to form positive characters that can be useful in
social life.
The objectives of Physical Education, Sports and Health include: (1) developing self-
management skills in an effort to develop and maintain physical fitness and a healthy
lifestyle through various selected physical activities and sports, (2) increasing physical
growth and better psychological development. , (3) improving basic movement skills and
abilities, (4) laying a strong moral character foundation through internalization of the
values contained in Physical Education, sports and health, (5) developing sportsmanship,
honesty, discipline, responsibility, cooperation , self-reliant and democratic, (6) developing
skills to maintain one's own safety,other people and the environment and (7) understand
the concept of physical activity and exercise in a clean environment as information to
achieve perfect physical growth, healthy lifestyles and fitness, skills, and have a positive
attitude (Depdiknas, 2003: 11).
Physical education researchers and teachers at SMA Negeri 8 Medan realized that
during the pandemic, online learning for learning motion was very difficult to do.
Becoming a physical education teacher is much more complicated than any other field of
study at this time. As a learning experience encapsulated in a curriculum, physical
education is more complicated for several reasons. First, the goal to be achieved is
comprehensive, because it is not only to improve the physical aspect with several relevant
elements, for example to stimulate the growth and development of organs. Second, the
achievement of the intended objectives depends on teaching tasks, in this case, in the form
of physical activities in the form of playing activities or sports. Third, how teaching
methods to deliver teaching tasks as a stimulus for growth also contribute to the
achievement of educational goals. Fourth, environmental factors which include physical
aspects, such as sports facilities and infrastructure determine whether teaching and learning
activities can run smoothly. Fifth, the learning atmosphere factor, the psychological
atmosphere reflected in the emotional reactions of all school personnel, including teachers
and students.
Then based on interviews from physical education teachers that the lack of interest in
learning physical education in SMA Negeri 8 Medan is seen from the way students take

2428
part in the learning process where they often argue that they do not have a network, no
examples of motion, do not have tools and are unable to perform the instructed
movements. This information was obtained from a physical education teacher at SMA
Negeri 8 Medan through an open interview by WhatsApp.
Based on the problems that occurred during the pandemicovid 19 period, researchers
are very interested in implementing EDMOD and Google Classroom. Edmodo is one
component of the learning service that is downloaded by the application on the Android /
iPhone. This application is perfect for students, teachers, lecturers, office employees and
professionals who like to make questions and send videos, pictures, and so on. In this
Edmodo platform both teachers and students can interact with each other easily. Of course
this will facilitate learning activities such as giving assignments, taking exams, quizzes,
and much more. For Edmodo students this will help them to be more disciplined and
collective in learning because usually the assignment given by the teacher is given a
deadline.
Then e-learning uses Google Classroom. Literature review through the Google
Classroom application assumes that the learning objectives will be more easily realized and
full of meaning. Therefore, the use of Google Classroom actually makes it easier for
teachers to manage learning and convey information appropriately and accurately to
students (Hardiyana. 2015). Teachers can take advantage of various features found in
Google Classroom such as assignments, grading, communication, time-cost, archive
courses, mobile applications, and privacy. Virtual class (virtual class) is a class based on
the web, where teachers and students can interact anytime and anywhere without being
limited by space and time. Just like in a conventional classroom, In learning that takes
place in a virtual classroom, students and teachers can interact with each other, which
means students enter the virtual classroom at the same time. Google classroom (or in
Indonesian, namely the Google classroom) is a learning platform that can be allocated to
any scope of education which is intended to help find solutions to the difficulties
experienced in making paperless assignments. This software has been introduced as part of
Google Apps for Education (GAFE) since August 12, 2014. This application makes it
easier for teachers and students to carry out the learning process more deeply. This is
because both teachers and students can collect assignments, distribute assignments.
II. Research Methods
The research was conducted using an experimental method. The experimental
method is a research method used to find the effect of certain treatments (Sugiyono, 2010:
12). In this study, this research is to compare two different e-learning, namely google
classroom and edmodo with variables. Attributes of student learning interest consisting of
high learning interest and low learning interest.
In accordance with the research design, there are two kinds of data that must be
collected, namely: (1) data on physical education learning outcomes, physical fitness
material which includes a pull up test for male students and a sit-up test for female
students, and (2) data about student interest in learning. To obtain data on physical
education learning outcomes, physical fitness material and student interest data, tests and
measurements were carried out. To measure the learning outcomes of physical education,
physical fitness material and student interest in learning, a research instrument was made.

2429
III. Results and Discussion
This research is an experimental study consisting of two variables, namely the
dependent variable and the independent variable. The dependent variable is in the form of
physical education learning outcomes, while the independent variable is learning, namely
the edmodo e-learning treatment and the e-learning google classroom treatment. As well as
the attribute variable is high interest in learning and low interest in learning. The data for
the learning interest variable was obtained from the data of students who were tested for
their ability as many as 72 (seventy two) people then divided into treatment groups for
each cell of 10 people who were given e-learning edmodo treatment and e-learning google
classroom treatment for 6 (six) Sunday. The manipulation of the learning treatment was
carried out from the beginning of the experiment to the end of the learning treatment, both
of which were carried out during the study. The data on the results of pull ups and sit ups,
by the judges on students when doing a physical fitness test, so that the learning outcomes
are the influence of the learning process carried out. The following is a summary of the
calculation of the statistical values for each treatment group.
Table 1. Summary of Statistical Calculation Results
practice
Interest
Study
e-learning google
classroom(A1)
edmodo e-learning
(A2)
High
(B1)
10
1X553
2
1X30785
X 55.3
s = 4.76
10
2X518
2
2X27364
2X 51.8
s = 7.69
20
2X1071
2
2X58148
2X 6.48
s = 53.55
Low
(B2)
10
3X512
2
3X26566
3X 51.2
s = 6.25
10
4X525
2
4X275625
4X 52.50
s = 7.25
20
4X 1037
2
4X54601
4X 51.85
s = 6.62
Total 20
1X1065
2
1X57351
1X 53.25
s = 5.80
20
2Xk1043
2
2Xk55399
2Xk 52.15
s = 7.28
Results of physical fitness tests (pull ups and sit ups), Group of students treated with
e-learning google classroom. Overall (Group A2). From the data on the results of physical
fitness tests (pull ups and sit ups), the whole group of students who were given the e-
learning google classroom treatment. Obtained a range between 42 to 62, there is an
average price of 53.25 and the standard deviation of 5.80. As well as the frequency
distribution as shown in table 2 below

2430
Table 2. Frequency distribution of physical fitness test results (pull ups and sit ups) of
groups of students treated with google classroom e-learning. Overall (A1)
No. Interval Class F. Absolute F. Relative F. Cumulative
1. 42 - 45 3 15 15
2. 46 - 49 2 10 30
3. 50 - 53 4 20 50
4. 54 - 57 6 30 80
5. 58 - 61 4 20 95
6. 62 - 65 1 10 100
amount 20 100
Results of physical fitness tests (pull ups and sit ups), a group of students who were
given edmodo e-learning treatment. Overall. (Group A2). From the data on the results of
the physical fitness test (pull ups and sit ups), the group of students who were given the
Edmodo e-learning treatment, as a whole. Obtained a range between 42 to 65, there is an
average price of 52.15 and the standard deviation of 7.28 And the frequency distribution
as shown in table 3, as follows.
Table 3. The frequency distribution of the results of the physical fitness test (pull ups and
sit ups) of the group of students treated with Edmodo e-learning, Overall (A2).
No. Interval Class F. Absolute F. Relative F. Cumulative
1. 42 - 46 5 25 25
2. 47 - 51 5 25 50
3. 52 - 56 5 25 75
4. 57 - 61 2 10 85
5. 62 - 66 3 15 100
amount 20 100
The distribution of the frequency distribution of the results of the physical fitness test
(pull ups and sit ups), the whole group of students who were given e-learning education
treatment, is presented on the histogram as follows. Results of physical fitness tests (pull
ups), groups of students who have high learning interest. Overall (Group B1).
From the data on the results of the physical fitness test (pull up) groups of students
who have a high interest in learning. Obtained a range between 42 to 65, there is an
average price of x 53.55 and the standard deviation of 6.48 and the frequency
distribution as shown in table 4 below
Table 4. Frequency distribution of physical fitness test results (pull ups), groups of
students who have high learning interest. Overall (B1).
No. Interval Class F. Absolute F. Relative F. Cumulative
1. 42 - 46 3 15 15
2. 47 - 51 3 15 30
3. 52 - 56 7 35 65
4. 57 - 61 4 20 85
5. 62 - 66 3 15 100
amount 20 100
2431
The distribution of the frequency distribution of the results of the physical fitness test
(pull up), groups of students who have high learning interest, is presented on the histogram
as follows.
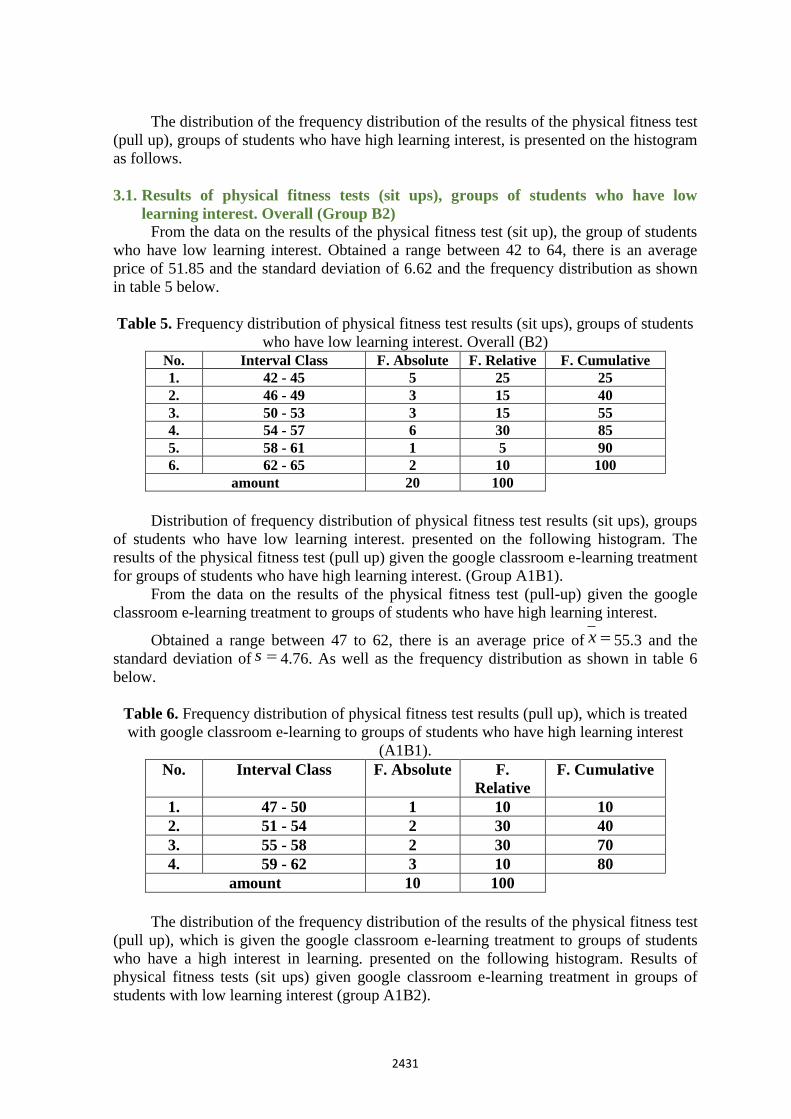
3.1. Results of physical fitness tests (sit ups), groups of students who have low
learning interest. Overall (Group B2)
From the data on the results of the physical fitness test (sit up), the group of students
who have low learning interest. Obtained a range between 42 to 64, there is an average
price of 51.85 and the standard deviation of 6.62 and the frequency distribution as shown
in table 5 below.
Table 5. Frequency distribution of physical fitness test results (sit ups), groups of students
who have low learning interest. Overall (B2)
No. Interval Class F. Absolute F. Relative F. Cumulative
1. 42 - 45 5 25 25
2. 46 - 49 3 15 40
3. 50 - 53 3 15 55
4. 54 - 57 6 30 85
5. 58 - 61 1 5 90
6. 62 - 65 2 10 100
amount 20 100
Distribution of frequency distribution of physical fitness test results (sit ups), groups
of students who have low learning interest. presented on the following histogram. The
results of the physical fitness test (pull up) given the google classroom e-learning treatment
for groups of students who have high learning interest. (Group A1B1).
From the data on the results of the physical fitness test (pull-up) given the google
classroom e-learning treatment to groups of students who have high learning interest.
Obtained a range between 47 to 62, there is an average price of x 55.3 and the
standard deviation of s 4.76. As well as the frequency distribution as shown in table 6
below.
Table 6. Frequency distribution of physical fitness test results (pull up), which is treated
with google classroom e-learning to groups of students who have high learning interest
(A1B1).
No. Interval Class F. Absolute F.
Relative
F. Cumulative
1. 47 - 50 1 10 10
2. 51 - 54 2 30 40
3. 55 - 58 2 30 70
4. 59 - 62 3 10 80
amount 10 100
The distribution of the frequency distribution of the results of the physical fitness test
(pull up), which is given the google classroom e-learning treatment to groups of students
who have a high interest in learning. presented on the following histogram. Results of
physical fitness tests (sit ups) given google classroom e-learning treatment in groups of
students with low learning interest (group A1B2).

2432
From the data on the results of the physical fitness test (sit-up) given the google
classroom e-learning treatment to groups of students who have low learning interest.
Obtained a range between 42 to 59, there is an average price of x 51.20 and the standard
deviation of s 6.25. As well as the frequency distribution as shown in table 7 below.
Table 7. Frequency distribution of physical fitness test results (sit ups), which is treated
with google classroom e-learning to groups of students who have low learning interest
(A1B2). No. Interval Class F. Absolute F. Relative F. Cumulative
1. 42 - 45 3 30 30
2. 46 - 49 1 10 40
3. 50 - 53 1 10 50
4. 54 - 57 4 40 90
5 58 - 61 1 10 100
amount 10 100
The distribution of the frequency distribution of the results of the physical fitness test
(sit up), which is given the google classroom e-learning treatment to groups of students
who have low learning interest. Presented on the following histogram. The results of the
physical fitness test (pull up) given the Edmodo e-learning treatment in a group of students
who have high learning interest. (Group A2B1).
From the data on the results of the physical fitness test (pull-up) which was given the
Edmodo e-learning treatment to a group of students who had high learning interest.
Obtained a range between 42 to 65, there is an average price of x 51.80 and the standard
deviation of s 7.69. As well as the frequency distribution as shown in table 8 below.
Table 8. Frequency distribution of physical fitness test results (pull up), which is treated by
Edmodo e-learning in groups of students who have high learning interest
(A1B1).
No. Interval Class F. Absolute F. Relative F. Cumulative
1. 42 - 47 4 40 40
2. 48 - 53 2 20 60
3. 54 - 59 2 20 80
4. 60 - 65 2 20 100
amount 10 100
The distribution of the frequency distribution of the results of the physical fitness test
(pull up), which is given the Edmodo e-learning treatment to groups of students who have
high learning interest. presented on the following histogram. The results of physical fitness
tests (sit ups) which are given the treatment of e-learning edmodo in a group of students
who have low learning interest. (Group A2B2). From the data on the results of the physical fitness test (sit-ups) which were given the
Edmodo e-learning treatment on groups of students who had low learning interest.
Obtained a range between 42 to 64, there is an average price of x 52.50 and the standard
deviation of s 7.24. As well as the frequency distribution as shown in table 9 below.

2433
Table 9. Frequency distribution of physical fitness test results (sit ups), which is treated by
Edmodo e-learning in groups of students who have low learning interest (A2B2).
No. Interval Class F. Absolute F. Relative F. Cumulative
1. 42 - 47 3 30 30
2. 48 - 53 3 30 60
3. 54 - 59 2 20 80
4. 60 - 65 2 20 100
amount 10 100
The distribution of the frequency distribution of the results of the physical fitness test
(sit-up), which is given the Edmodo e-learning treatment to groups of students who have
low learning interest presented on the following histogram.
Table 10. Summary of Normality Test Results with the Liliefors Test.
Group n 0L
tL 05,0
Conclusion
1
2
3
4
5
6
7
8
20
20
20
20
10
10
10
10
0.0717
0.0960
0.1064
0.1664
0.0148
0.0879
0.0020
0.0251
0.190
0.190
0.190
0.190
0.258
0.258
0.258
0.258
Normal
Normal
Normal
Normal
Normal
Normal
Normal
Normal
Information:
Group 1 :
Groups of students who were given the e-learning google
calssroom as a whole. (A1)
Group 2 : Groups of students who were given edmodo e-learning
treatment as a whole. (A2)
Group 3 : Group of students who have high learning interest, as a whole
(B1)
Group 4 : The group of students who have low interest in learning, as a
whole. (B2)
Group 5 : Groups of students who have high learning interest who are
given the e-learning google calssroom treatment. (A1B1)
Group 6 : Groups of students who have low learning interest, who are
given the e-learning google calssroom treatment. (A1B2)
Group 7: Groups of students who have a high interest in learning who are
given the edmodo e-learning treatment. (A2B1)
Group 8: Groups of students who have low learning interest, who are
given the edmodo e-learning treatment. (A2B2)

2434
0L : Liliffors price counts
tL : Prices table Liliffors at tarap significance 05,0
n : Many sampel each group
3.2 Homogeneity Test
The next analysis requirement that must be carried out is the homogeneity test which
aims to determine whether the variance between the existing groups is homogeneous. The
homogeneity test of the result scores (pull ups and sit ups) in Physical Fitness in each
sample group was carried out using the Barlett test at the significance level α = 0.05.
Homogeneity testing includes groups A1 and A2, groups B1 and B2, as well as groups
A1B1, A1B2, A2B1 and A2B2.
a. Homogeneity Test of Variance for Groups A1 and A2
The sample in this group each consisted of group A1, totaling 20 (nA1) and group
A2, totaling 20 (nA2). The summary of the results of the homogeneity test in this study can
be seen in table 11 below.
Table 11. Summary of Homogeneity Test Results for Groups A1 and A2.
Sample
Group
Variance
(Si2)
Combined
Variants
Db h
2 t
2 05,0
Conclusion
A1
A2
52.98
33.67
43.32368
38
1.2586
3,840
Homogeneous
From the calculation results as shown in the table above are obtained h2 smaller
than t2 840.32586.1 22 tabelhitung
. Thus H0 is accepted, which means that
the variance of the data for groups A1 and A2 comes from a homogeneous population.
b. Homogeneity Test of Group B1 and B2 Variances
The samples in this group each consisted of group B1 which amounted to 20 (nB1)
and group B2 which amounted to 20 (nB2). The summary of the results of the
homogeneity test in this study can be seen in table 12 below.
Table 12. Summary of Homogeneity Test Results for Groups B1 and B2.
Sample
Group
Variance
(Si2)
Combined
Variants
Db h2
t2
05,0 Conclusion
B1
B2
41.94
43.82
42,881
38
0.0118
3,840
Homogeneou
s
From the calculation results as shown in the table above are obtained h2 smaller
than t2 840,30118,0 22 tabelhitung
. Thus H0 is accepted, which means that
the data variance of groups B1 and B2 comes from a homogeneous population.
c. Homogeneity Test of Variance for Groups A1B1, A1B2, A2B1 and A2B2
The samples in this group each consisted of 10 (n1) A1B1 groups, 10 (n2) A1B2
groups, 10 (n3) A2B1 and 10 (n4) groups. The summary of the results of the homogeneity
test in this study can be seen in table 13 below.

2435
Table 13. Summary of Homogeneity Test Results for Groups A1B1, A1B2, A2B1 and
A2B2.
Sample
Group
Variance
(Si2)
Combined
Variants h2
t2
05,0 Conclusion
A1B1
A1B2
A2B1
A2B2
22.67
39.07
59.07
52.5
43,328 2,241 7,810
Homogeneou
s
Information:
A1B1 group: Groups of students who have high learning interest who are
given the e-learning google calssroom treatment. A1B2 group: Groups of students who have low learning interest, who are
given the e-learning google calssroom treatment. A2B1 group: Groups of students who have a high interest in learning who
are given the edmodo e-learning treatment. A2B2 group: Groups of students who have low learning interest, who are
given the edmodo e-learning treatment.
From the calculation results as shown in the table above are obtained h2 smaller
than t2 810.7241,2 22 tabelhitung
. Thus H0 is accepted, which means that the
data variance of groups A1B1, A1B2, A2B1 and A2B2 comes from a homogeneous
population.
Overall, the requirements of the analysis on normality and homogeneity testing have
been met so that it can be continued to hypothesis testing
3.3 Hypothesis Testing and Discussion
From the results of the normality and homogeneity test, it was found that the research
data on the results scores (pull ups and sit ups) in Physical Fitness were normally
distributed and had homogeneous variances, so the requirements for data analysis had been
met. Furthermore, hypothesis testing was carried out by means of two-way Analysis of
Variance (ANOVA), at the level of significance 05,0 can be done. Two-way analysis of
variance is intended to test the main effect hypothesis. With statistical
hypothesis 210 : H and 211 : H Where 0H will be rejected if tFF 0 . This
means that there is a difference between the two groups being compared. And continued
with the Tukey-Test.
From the research results will also be tested the hypothesis about the interaction
between the provision of plyometric training and interest in learning to the results (pull ups
and sit ups) in Physical Fitness. If there are differences and interactions between groups,
the analysis is continued with the Tukey-Test to test the simple effect hypothesis. This test
aims to determine which group is more influential than the groups being compared.
Hypothesis testing using the two-way analysis of variance (ANOVA) technique. The
summary of the calculation results can be seen in table 14, below.

2436
Table 14. Summary of Two-way Variance Analysis Results
Source of
Variance
JK Db RJK countF Ftable
05,0 01,0 Among 12.1 1 12.1 0.279 * 4.11 7.39
Between B 28.9 1 28.9 0.667 * 4.11 7.39
AB
interactions 57.6 1 57.6 1,329 * 4.11 7.39
In (D) 1559.8 36 43.32778 - - -
Total 2110982 39 - - - -
Interest:
JK : Sum of the Squares
AJK : Number of Squares Variable A (e-learning treatment)
BJK : Sum of Squares of Variable B (Interest in learning)
ABJK : Sum of the Squares of the Interaction AB
dJK : Sum of the Squares in
tJK : Sum of total squares
db : Degrees of freedom
RJK : Average of the Squares
0F : Price hitungF
tF : Price tabelF
* : Significant at the level 05,0
** : Very significant at the level 01,0
IV. Conclusion
Based on the research conducted, several conclusions can be explained, as follows:
1. Overall results, the group of students who were given e-learning google classroom
treatment was better, than the group of students who were given e-learning edmodo
treatment.
2. For students who have high learning interest, the group of students who are given e-
learning google classroom treatment is better, than the group of students who are given
e-learning edmodo treatment. Judging from the mean value in the two treatment groups
there is a difference, statistically the difference is quite significant. This means that the
two treatments are equally good in providing an effect on test results (pull ups and sit
ups) in physical fitness.
3. For students who have low learning interest, physical fitness results are given better e-
learning treatment than those given google classroom e-learning treatment.
4. There is an interaction between e-learning treatment (A) and interest in learning (B) on
test results (pull ups and sit ups) in physical fitness.
2437
Suggestion There are several suggestions put forward in this study, namely:
1. E-learning google classroomboth used to provide practical learning material. So the
physical education teacher at SMA Negeri 8 Medanda is recommended to use e-learning
google classroom to be used as an online learning guide in the practical learning
process, especially physical fitness material.
2. This study only examines the results (pull ups and sit ups) in physical fitness. It is
advisable to research more about physical fitness with different test forms and
measurements.
References
Abdoellah, (1999). Theory and Practice Curriculum Development. Jakarta: Primary Media
Style.
Abdul Kadir Ateng. (1992). Principles and Foundations of Physical Education. Ministry of
Education and Culture, Directorate General of Higher Education, Educational
Personnel Development Project.
Adang Suherman. (2000). Basics of Physical Education. Ministry of Education and
Culture, Directorate General of Primary and Secondary Education, Section D-III
Junior Secondary Teacher Upgrading Project.
Allen, Michael. (2013).Michael Allen's Guide to E-learning. Canada: John Wiley & Sons.
Ardiansyah, Ivan. (2013). Exploration of Communication Patterns in Discussions Using
Moddle in Chemistry Learning Simulation Lectures, University of Education
Indonesia, Bandung-Indonesia.
Arsani et al. (2020). Differences in Motivational Orientation in Physical Education in
terms of Gender Differences. Budapest International Research and Critics in
Linguistics and Education (BirLE) Journal. P. 1428-1434
Asyhar, R., (2012). Creatively developing learning media. Bandung: Rosdakarya.
Aunurrahman. (2012). Learning and Learning. Bandung: CV Alfabeta.
Ega Trisna Rahayu. (2013). Physical Education Learning Strategies. Implementation of
Physical Education, Sports and Health Learning. Bandung: CV Alfabeta.
Fathurrahman. (2015). 'The Concept of Persuasive Da'wah Communication in the
Perspective of the Qur'an', AT-TABSYIR: Journal of Islamic Broadcasting
Communication,
Gunawan, FI & Sunarman, SG, (2018). Development of Virtual Classroom with Google
Classroom in Problem Solving Skills on Vector Topics for High School Students to
Support Learning.
Hakim, AB, (2016). The Effectiveness of Using E-Learning Moodle, Google Classroom
and Edmodo. I-STATEMENT: Information System and Technology Management, 2
(1).
Hamalik, Oemar. (2010). Teaching and Learning Process. Jakarta: PT. Earth Literacy
Hanum, NS, (2013). E-Learning Effectiveness as Learning Media (Evaluation Study of E-
Learning Learning Model of Telkom Sandhy Putra Purwokerto Senior High School).
Journal of Vocational Education, 3 (1).
Husdarta. (2011). Physical Education Management. Bandung: Alfabeta.
Makmum Khairani. (2013). Learning Psychology. Yogyakarta: Aswaja Pressindo.
Miarso, yusufhadi. (2007). Sowing the seeds of educational technology. Jakarta. Kencana
Prenada Media Group.
Miarso, Y., (2004). Sowing the seeds of educational technology, Kencana.

2438
Moleong, LJ. (2004). Qualitative Research Methodology Revised Edition. Bandung:
Rosdakarya.
Novianti et al. (2020). Improvement of Physical, Honesty, Discipline and Cooperation in
Class IV Elementary School Students through Circuit Training Learning Model. P.
Budapest International Research and Critics in Linguistics and Education (BirLE)
Journal. P. 244-250
Parwoto, A. (2007). Inferential statistics laboratory guide. Jakarta: Gramedia Widiasarana
Indonesia.
Pranoto, Alvini. Et al. (2009). Science and Technology. Jakarta: PT Gramedia Pustaka
Utama.
Prawiradilaga, Dewi Salma et al. (2007). Educational Technology Mozaik. Jakarta.
Kencana Pernada Media Group.
Rusli Lutan. (2000). Physical Education Teaching and Learning Strategies. Ministry of
Education and Culture, Directorate General of Primary and Secondary Education,
Section D-III Junior Secondary Teacher Upgrading Project.
Rusli Lutan. (2000). Measurement and Evaluation of Physical Education and Health.
Ministry of Education and Culture, Directorate General of Primary and Secondary
Education, Section D-III Junior Secondary Teacher Upgrading Project.
Samsudin. (2008). The role of interactive multimedia in learning. accessed on 3/20/2018
on pagehttp://eprints.uny.ac.id/7848/3/BAB%202-08403244039.pdf.
Sanjaya, Vienna. (2010). Educational Process Standards Oriented Learning Strategy.
Jakarta: Prenada Media Group
Sardiman, AM. (2009). Interaction and Learning Motivation. Jakarta: PT Rajagrafindo
Persada.
Sarwono Wirawan Sarlito. (2000). Adolescent Psychology. Jakarta PT Grafindo Persada.
Smaldino, SE, Lowther, DL & Russell, JD, (2008). Instructional technology and media for
learning.
Slameto. (2010). Learning & Influencing Factors. Jakarta: PT Rineka Cipta.
Soedjiarto. (2000). Relevant and Quality National Education Methods. Jakarta: Balai
Pustaka.
Sugiyono. (2010). Educational Research Methods with Quantitative Approaches,
Qualitative, and R & D. Bandung: Alfabeta.
Sujana, Janti Gristinawati and Yuyu Yulia. (2005). Development of Libraries in Indonesia.
Bogor: IPB Press.
Suyono, Harianto. (2015). Learning And Learning. Bandung: Youth Rosdakarya.
Syaiful Bahri Djamarah. (2011). Psychology of Learning. Jakarta: PT Rineka Cipta
Trianto. (2018). Designing Innovative-Progressive Learning Models. Jakarta: Kencana
Prenada Media Group
Vasti, Safari. (2008).: 3. Interest Indicator.
Yamin, Martinis. (2009). Teacher Professionalization & Implementation of KTSP. Jakarta:
Echoes of Persada Pre,
Yrama Widya . (2014). Sports and Health Physical Education for SMA / SMK, Jakarta
Zamroni. (2012). Introduction to Educational Theory Development. Yogyakarta: Tiara
Discourse