the influence of environmental contamination on …€™s towhee cie 0.124 0.045 nd 0.059 0.131...
TRANSCRIPT
The Influence of Environmental
Contamination on Riparian Bird
Populations at Tumacacori National
Historical Park
Dominic LaRoche, Courtney J. Conway,
Chris Kirkpatrick, and Gabrielle Robinson
School of Natural Resources, Univ. of Arizona
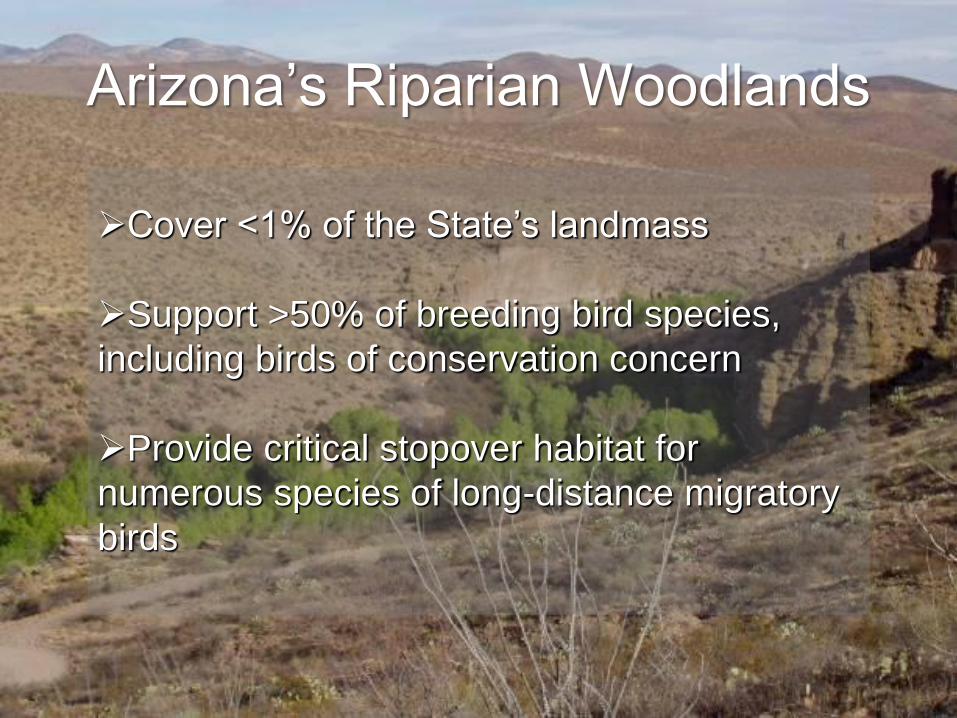
Cover <1% of the State’s landmass
Support >50% of breeding bird species,
including birds of conservation concern
Provide critical stopover habitat for
numerous species of long-distance migratory
birds
Arizona’s Riparian Woodlands

Increasing demand for
limited water resources
in Arizona
Population growth
Continued drought
Climate change
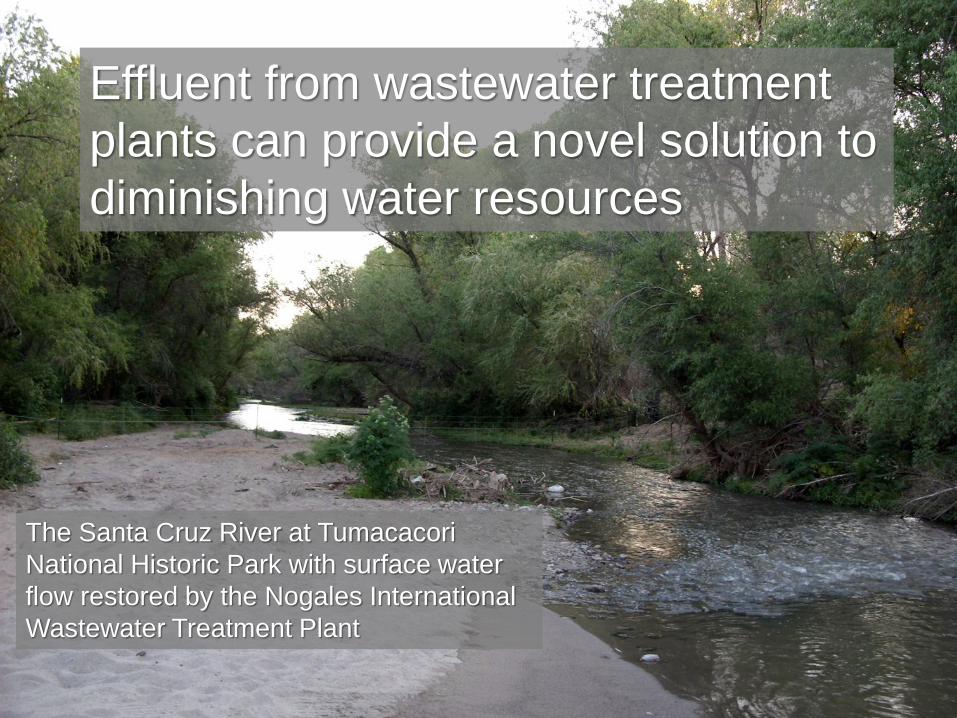
Effluent from wastewater treatment
plants can provide a novel solution to
diminishing water resources
The Santa Cruz River at Tumacacori
National Historic Park with surface water
flow restored by the Nogales International
Wastewater Treatment Plant
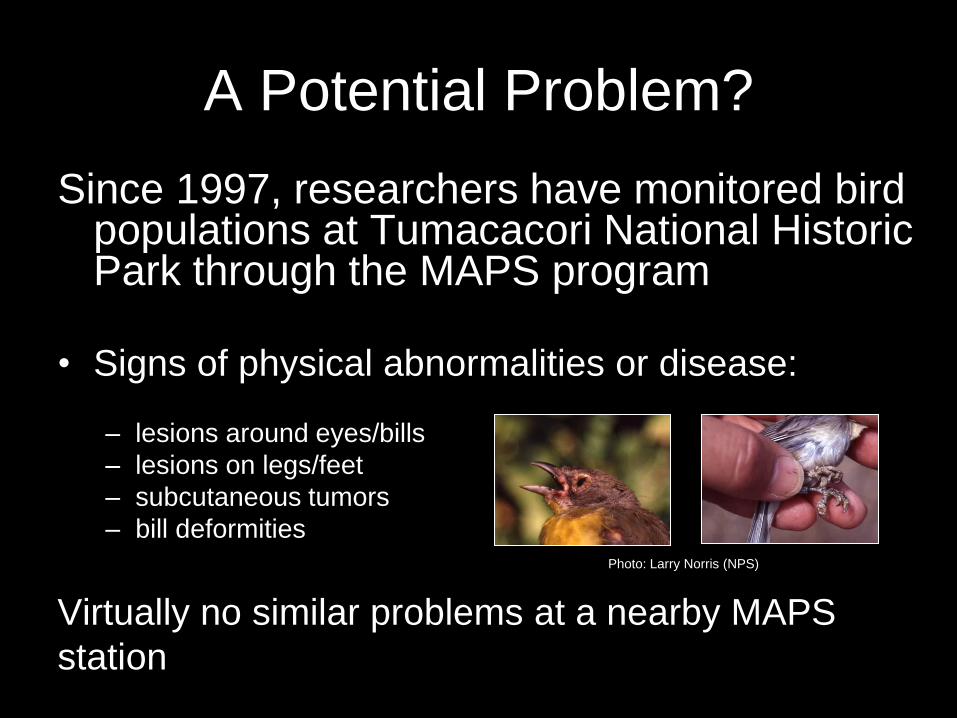
A Potential Problem?
Since 1997, researchers have monitored bird populations at Tumacacori National Historic Park through the MAPS program
• Signs of physical abnormalities or disease:
– lesions around eyes/bills
– lesions on legs/feet
– subcutaneous tumors
– bill deformities
Virtually no similar problems at a nearby MAPS
station
Photo: Larry Norris (NPS)
A Potential Problem?
Possible explanations for observed abnormalities:
• Birds infected with avian pox?
• Birds negatively affected by environmental
contaminants?
• Interaction between environmental contaminants
and disease?
Project Objectives
At both Tumacacori NHP and a control site at
Cienega Creek:
• Quantify prevalence of physical abnormalities or disease in adult and nestling birds
• Measure avian reproductive parameters
• Identify underlying causes of any observed abnormalities or disease
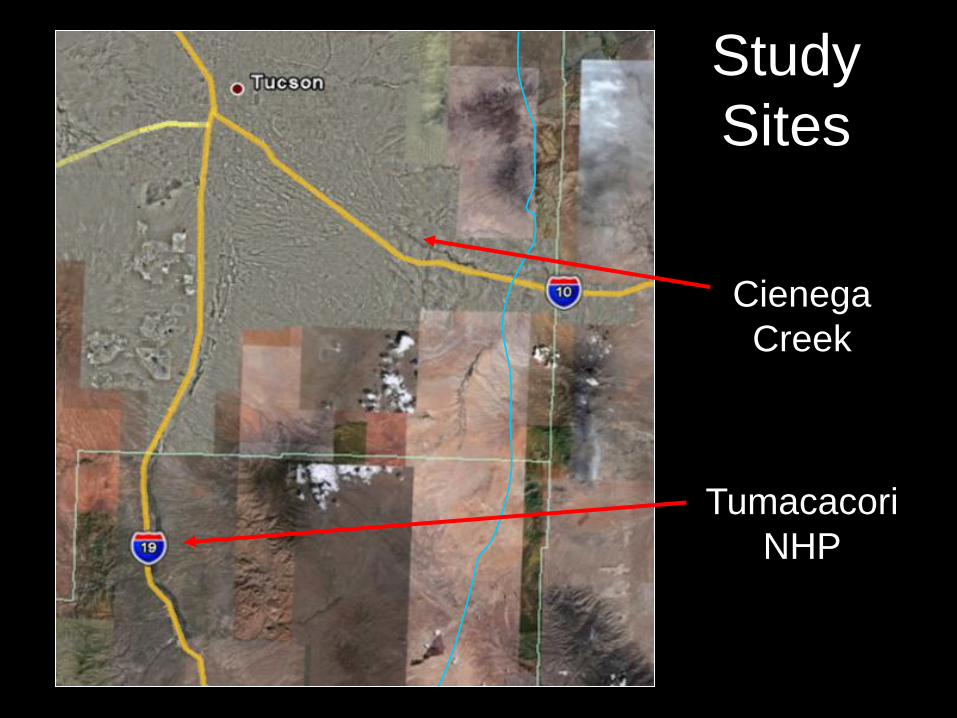
Study
Sites
Cienega
Creek
Tumacacori
NHP
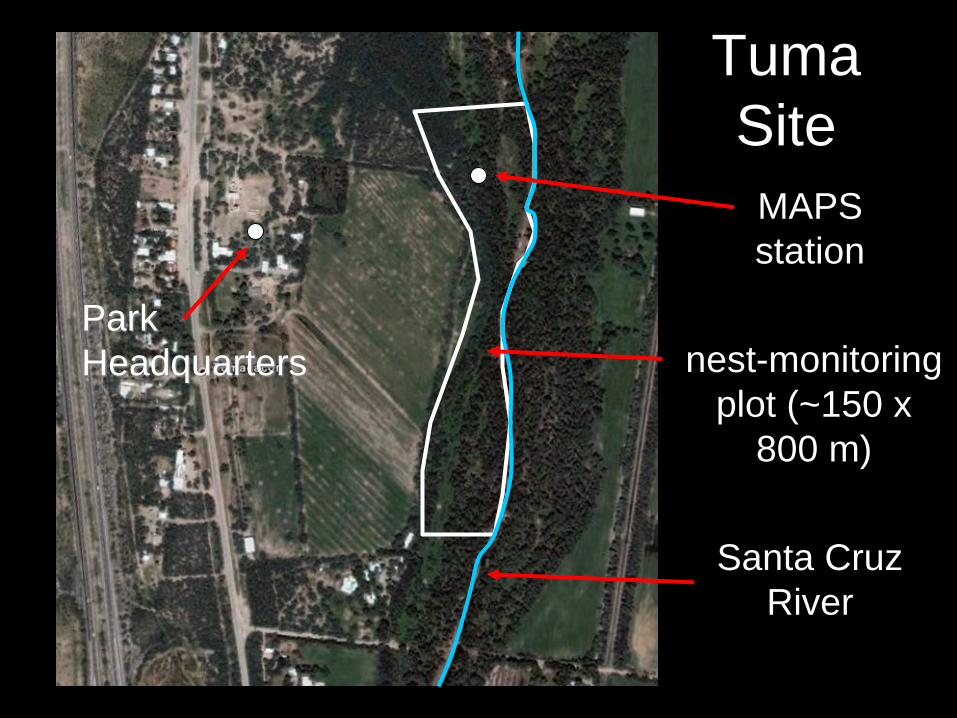
Tuma
Site
Santa Cruz
River
nest-monitoring
plot (~150 x
800 m)
MAPS
station
Park
Headquarters
Methods
• Nest Monitoring
– Measure reproductive parameters
– Conduct physical examination of nestlings
– Collect tissue samples at nests
• Adult Birds
– Collect tissue samples from adult birds
– Conduct physical examinations on adult birds
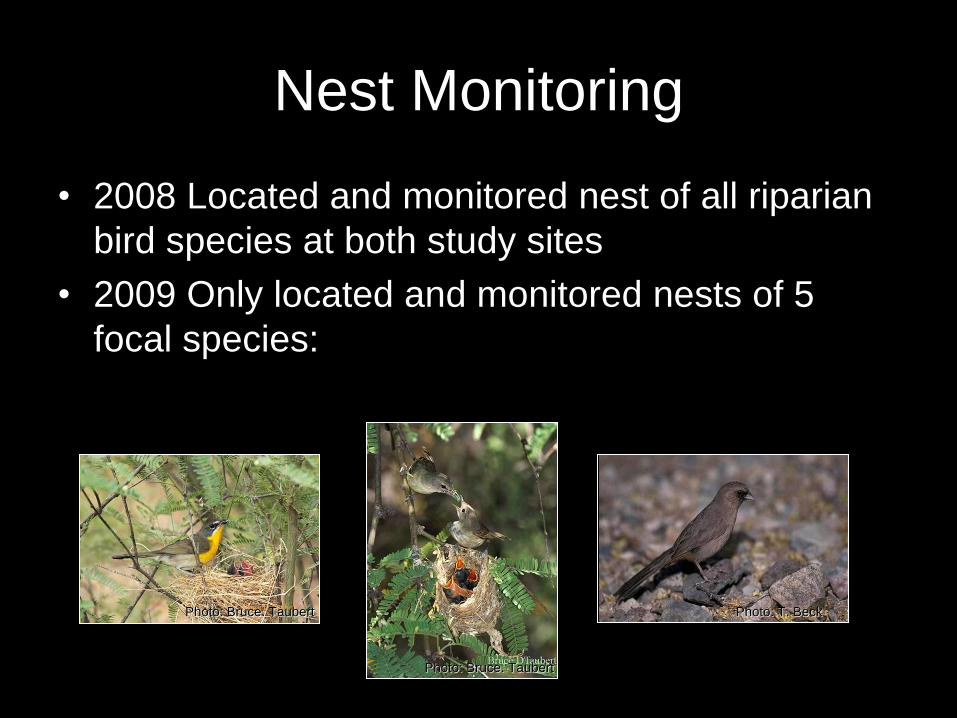
• 2008 Located and monitored nest of all riparian
bird species at both study sites
• 2009 Only located and monitored nests of 5
focal species:
Nest Monitoring
Photo: Bruce. Taubert
Photo: Bruce. Taubert
Photo: T. Beck
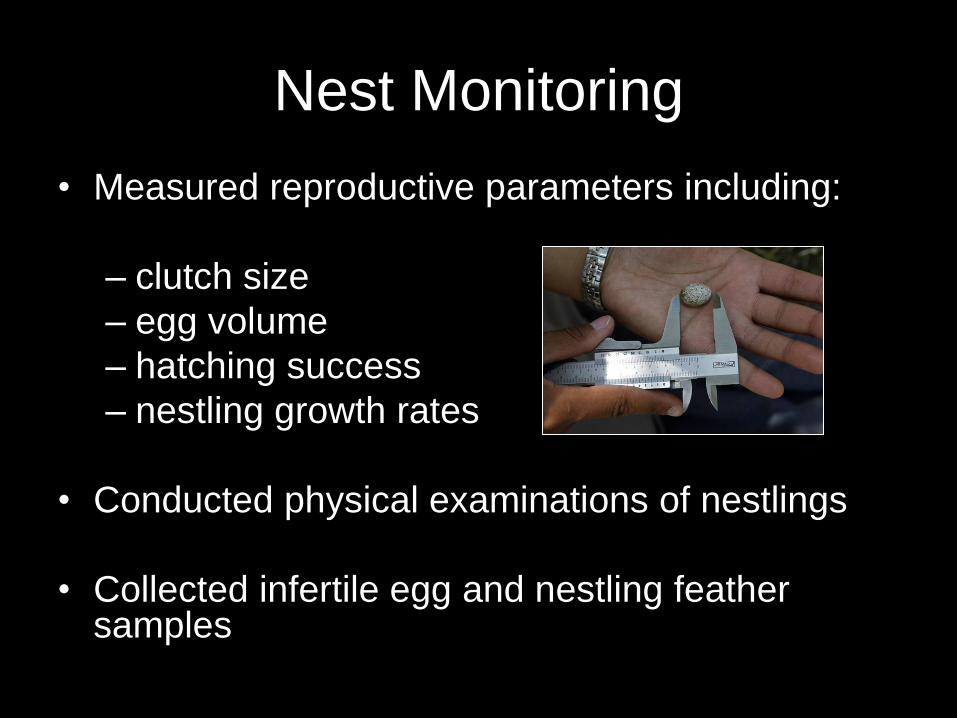
Nest Monitoring
• Measured reproductive parameters including:
– clutch size
– egg volume
– hatching success
– nestling growth rates
• Conducted physical examinations of nestlings
• Collected infertile egg and nestling feather samples
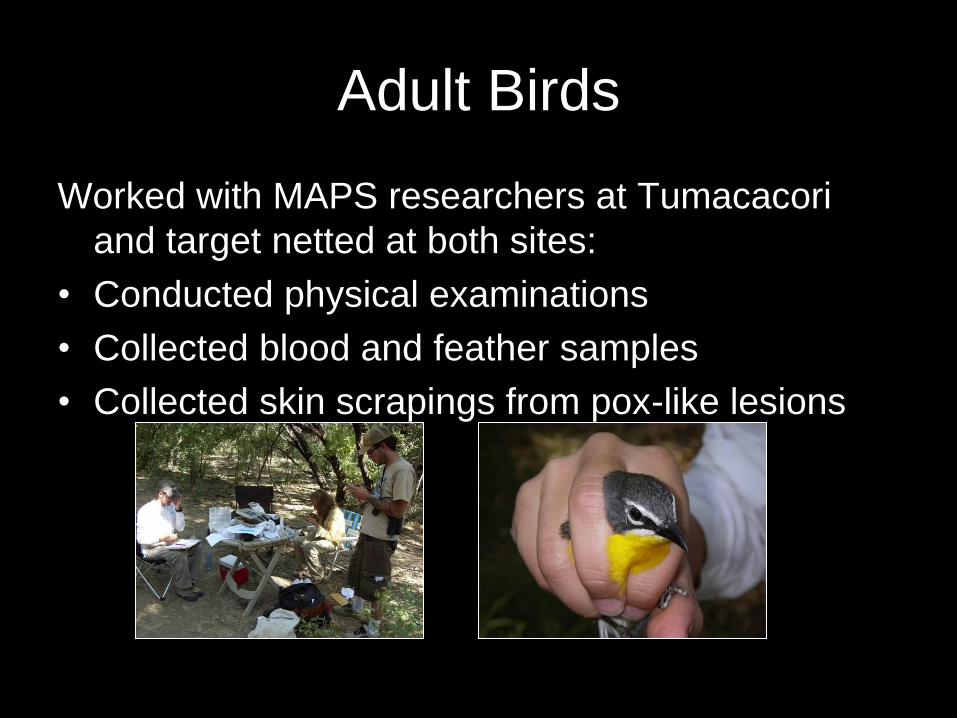
Adult Birds
Worked with MAPS researchers at Tumacacori
and target netted at both sites:
• Conducted physical examinations
• Collected blood and feather samples
• Collected skin scrapings from pox-like lesions

Blood and Feather Analysis
• Collected 102 blood samples and >300 feather samples
• Analyzed 29 blood and feather samples for metal
concentrations at Trace Elements Research Laboratory
(TERL; College Station, Texas)
– Only tested feathers for Hg (Direct Hg Analysis)
– Tested blood for AS, Cd, Cr, Cu, Hg, Ni, Se, Pb, and Zn
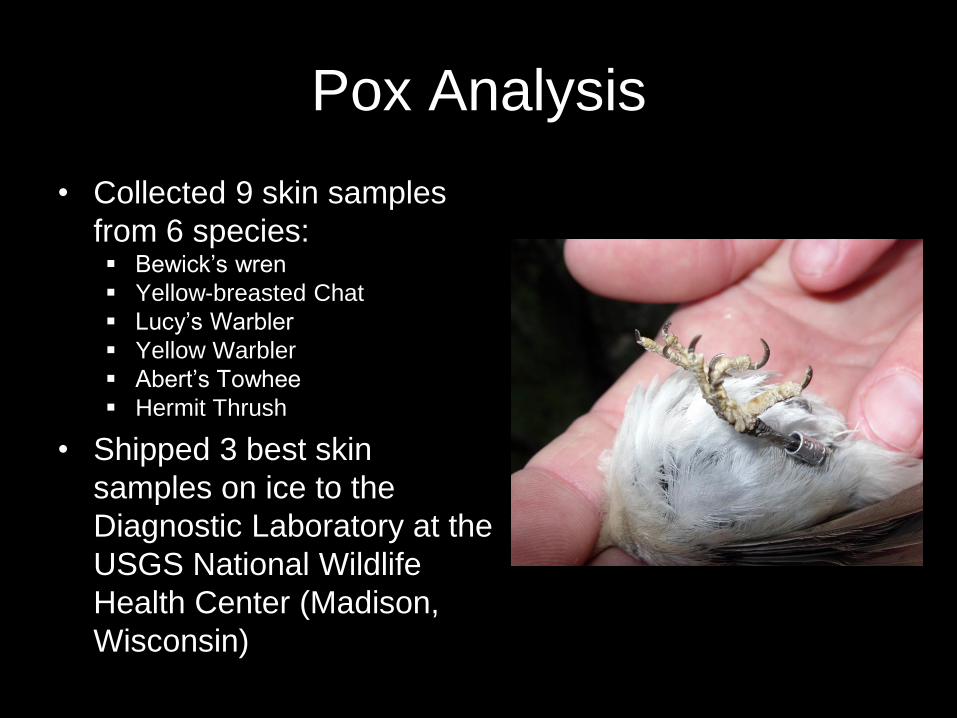
Pox Analysis
• Collected 9 skin samples
from 6 species: Bewick’s wren
Yellow-breasted Chat
Lucy’s Warbler
Yellow Warbler
Abert’s Towhee
Hermit Thrush
• Shipped 3 best skin
samples on ice to the
Diagnostic Laboratory at the
USGS National Wildlife
Health Center (Madison,
Wisconsin)
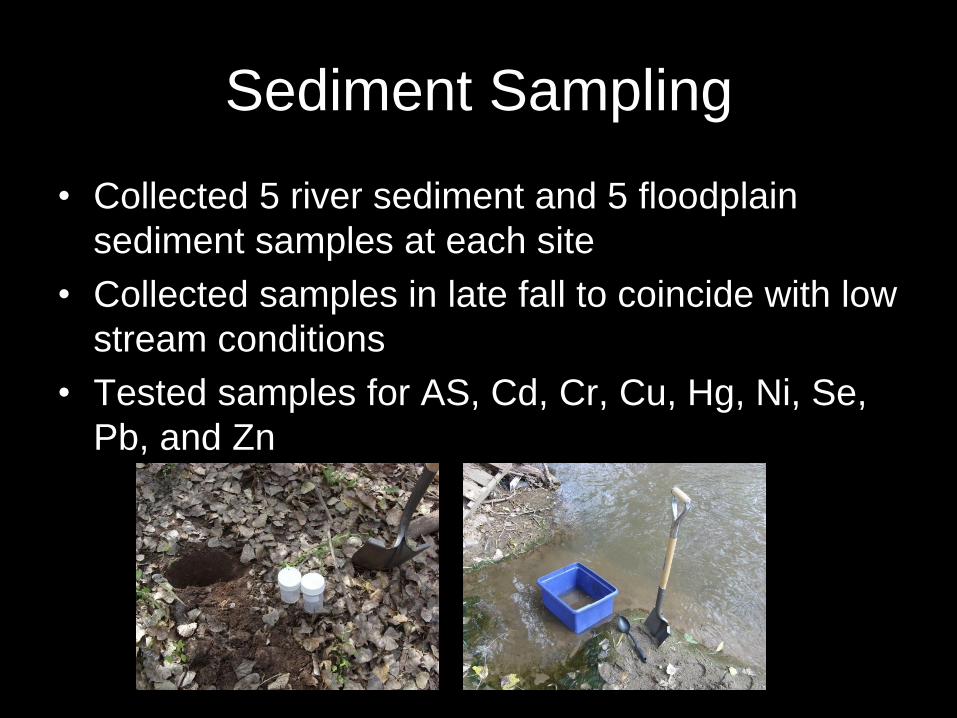
Sediment Sampling
• Collected 5 river sediment and 5 floodplain
sediment samples at each site
• Collected samples in late fall to coincide with low
stream conditions
• Tested samples for AS, Cd, Cr, Cu, Hg, Ni, Se,
Pb, and Zn
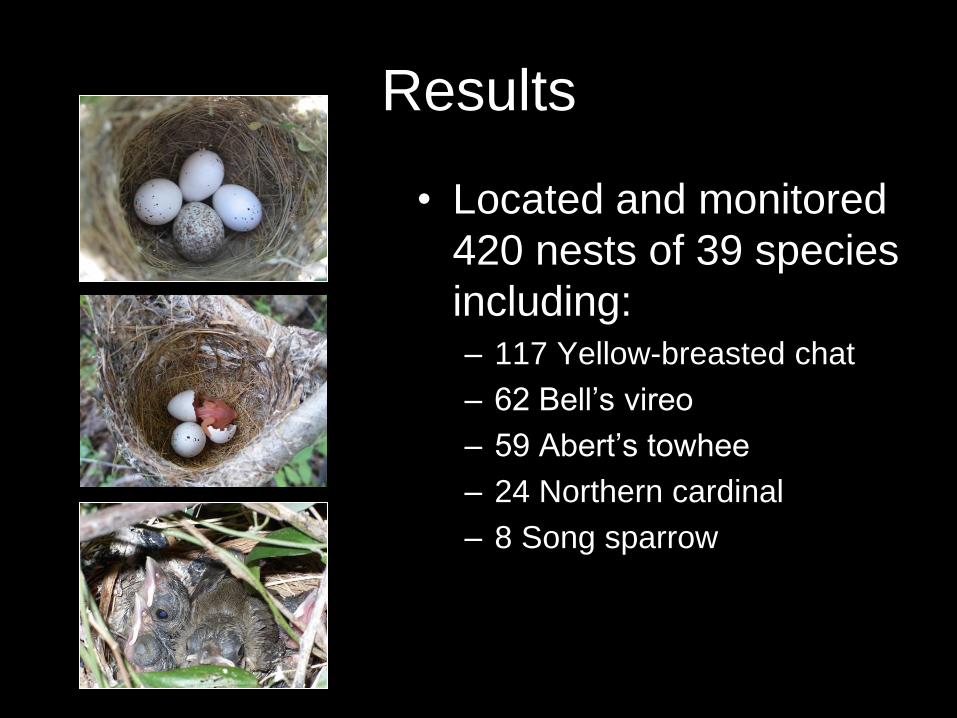
Results
• Located and monitored
420 nests of 39 species
including: – 117 Yellow-breasted chat
– 62 Bell’s vireo
– 59 Abert’s towhee
– 24 Northern cardinal
– 8 Song sparrow
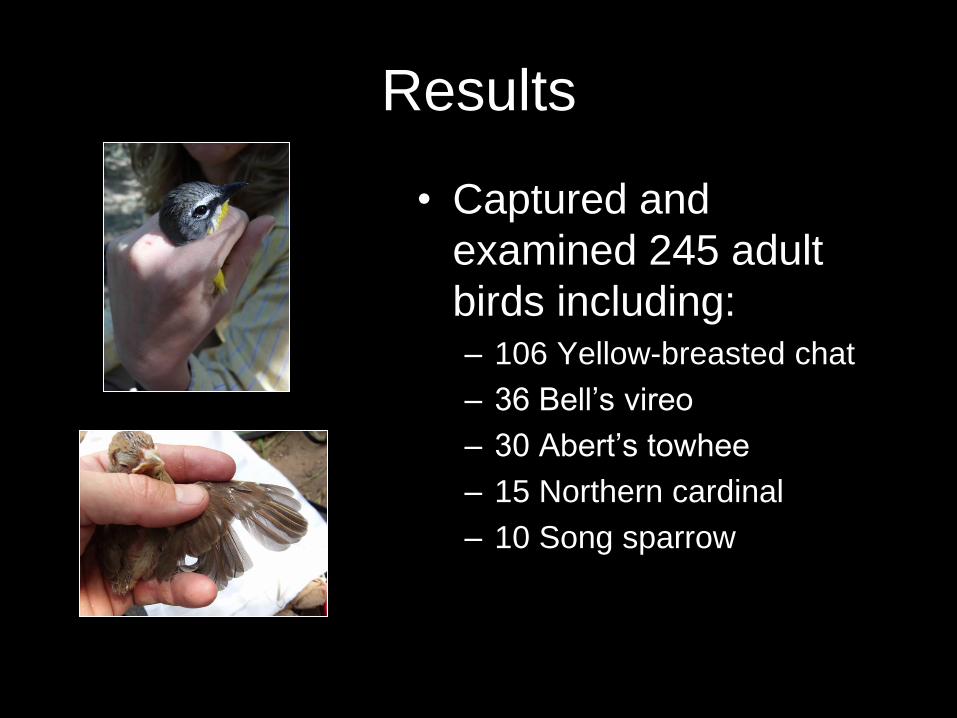
Results
• Captured and
examined 245 adult
birds including: – 106 Yellow-breasted chat
– 36 Bell’s vireo
– 30 Abert’s towhee
– 15 Northern cardinal
– 10 Song sparrow
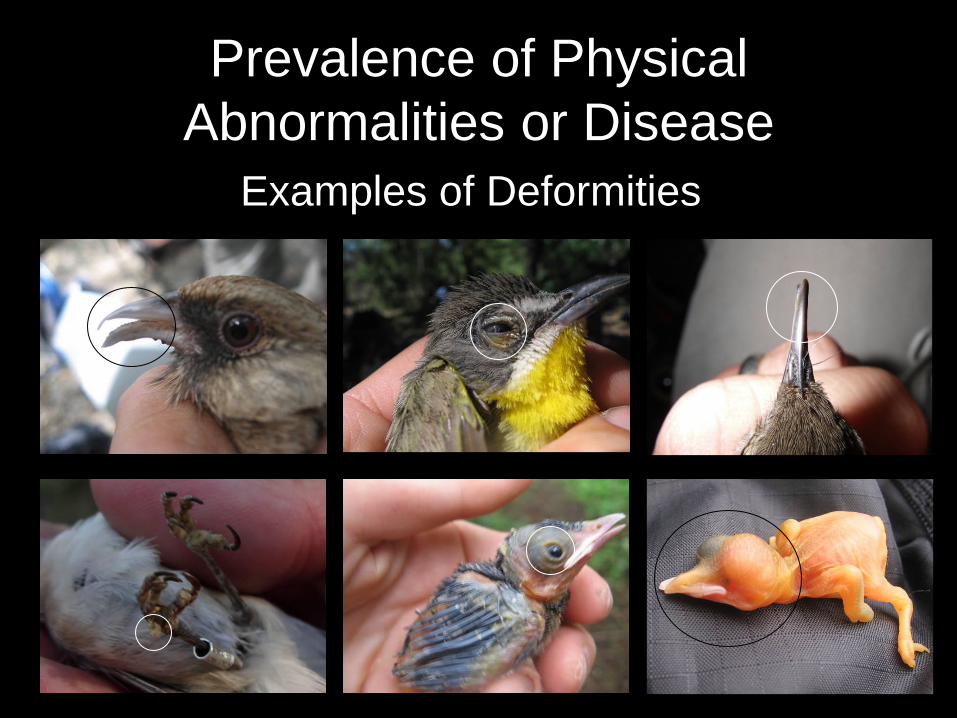
Examples of Deformities
Prevalence of Physical
Abnormalities or Disease
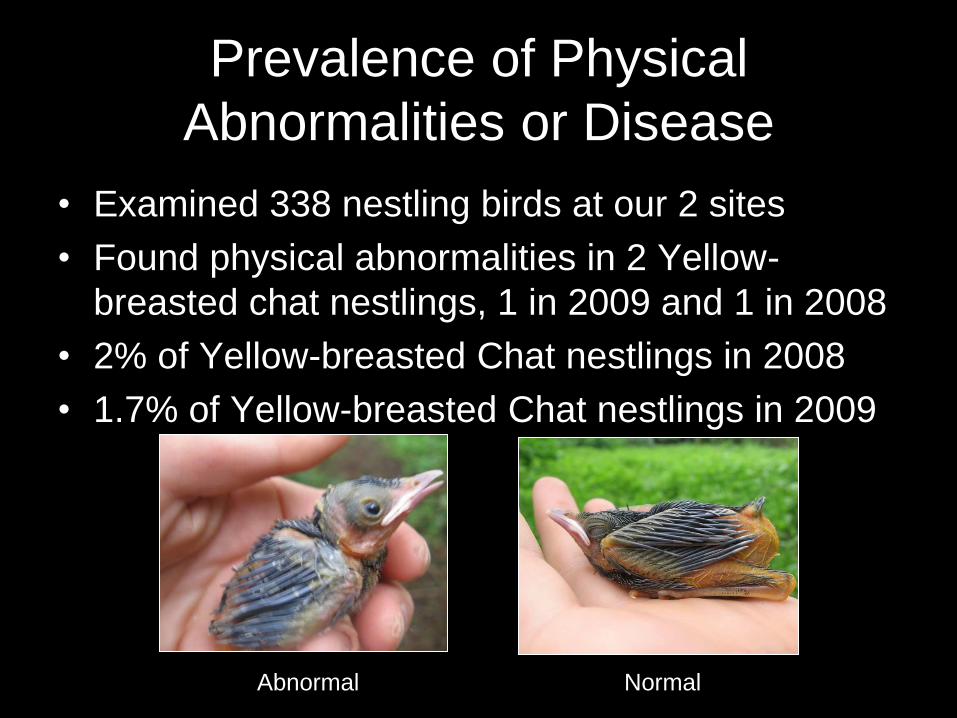
Prevalence of Physical
Abnormalities or Disease
• Examined 338 nestling birds at our 2 sites
• Found physical abnormalities in 2 Yellow-
breasted chat nestlings, 1 in 2009 and 1 in 2008
• 2% of Yellow-breasted Chat nestlings in 2008
• 1.7% of Yellow-breasted Chat nestlings in 2009
Abnormal Normal
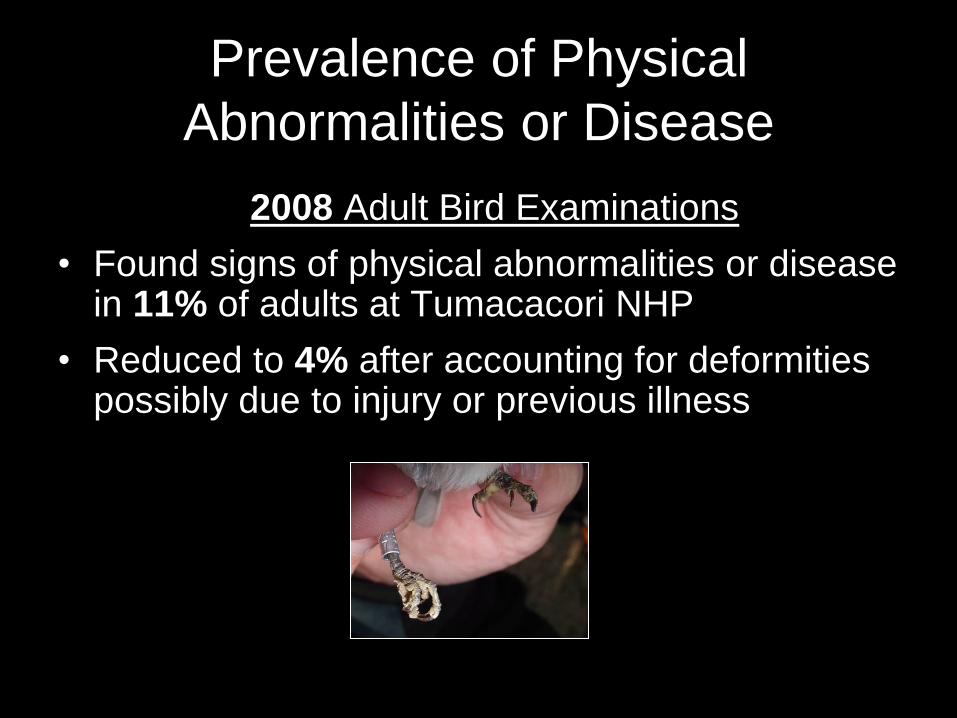
Prevalence of Physical
Abnormalities or Disease
2008 Adult Bird Examinations
• Found signs of physical abnormalities or disease in 11% of adults at Tumacacori NHP
• Reduced to 4% after accounting for deformities possibly due to injury or previous illness
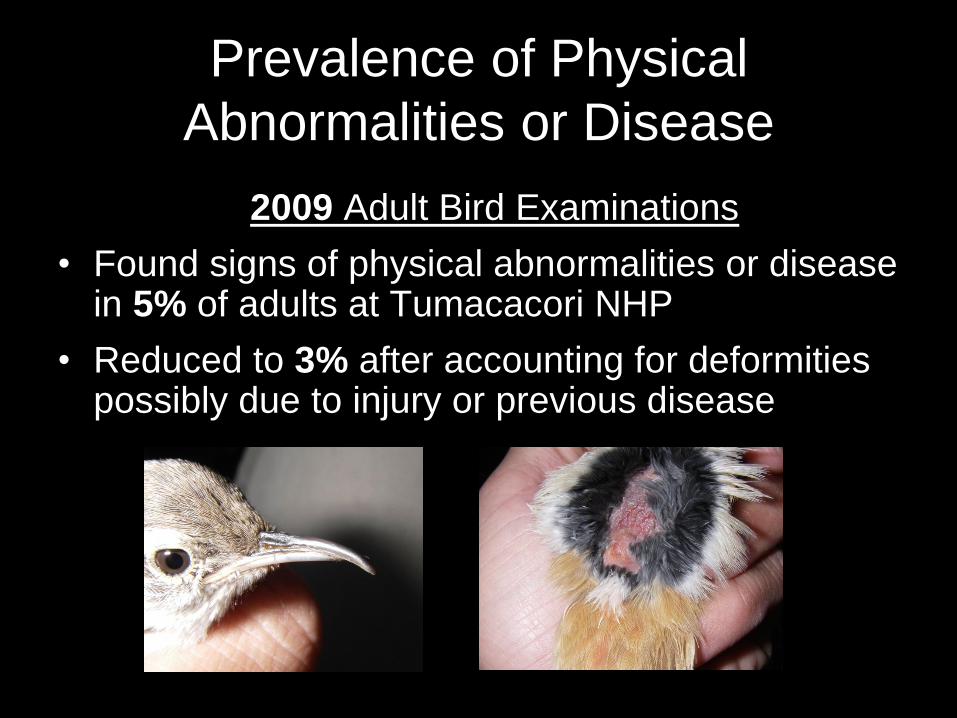
Prevalence of Physical
Abnormalities or Disease
2009 Adult Bird Examinations
• Found signs of physical abnormalities or disease in 5% of adults at Tumacacori NHP
• Reduced to 3% after accounting for deformities possibly due to injury or previous disease
Prevalence of Physical
Abnormalities or Disease
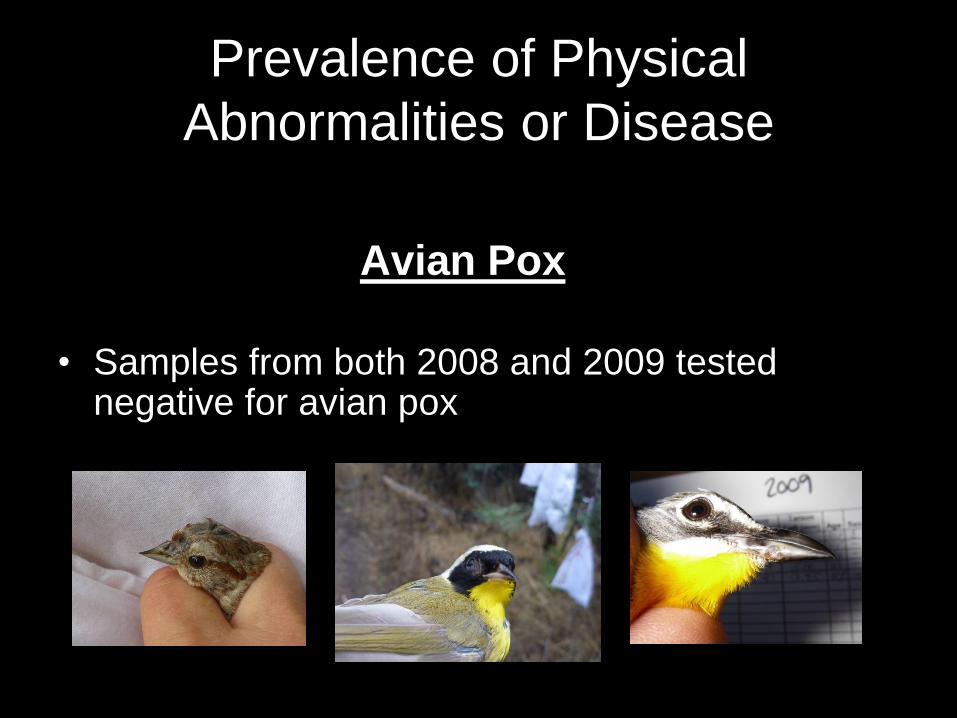
Avian Pox
• Samples from both 2008 and 2009 tested negative for avian pox
0.0
0.5
1.0
1.5
2.0
2.5
3.0
3.5
4.0
4.5
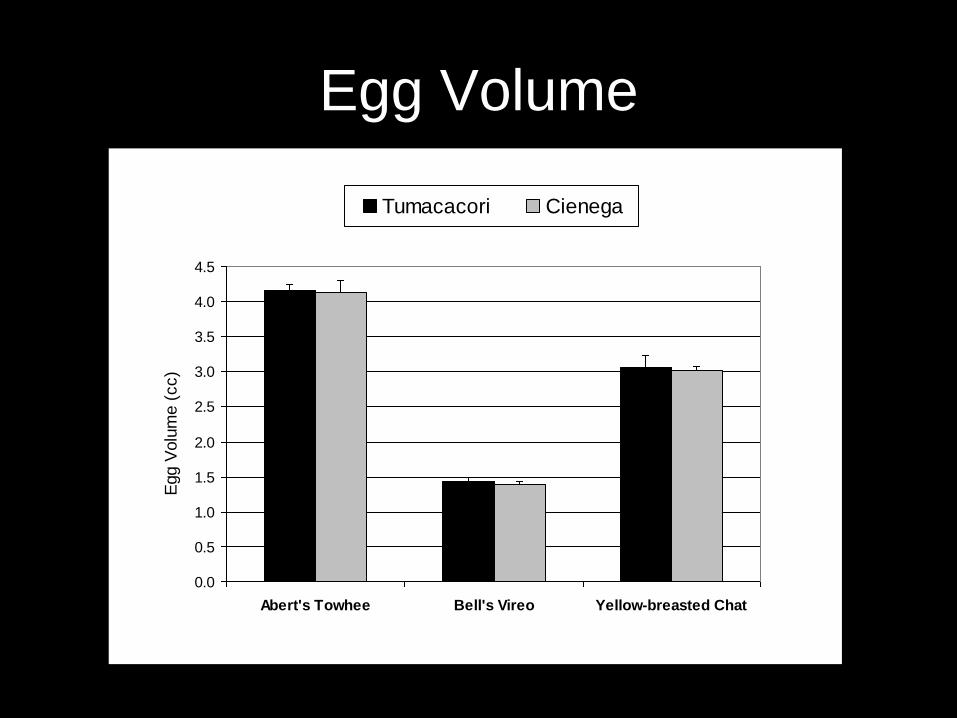
Abert's Towhee Bell's Vireo Yellow-breasted Chat
Egg V
olu
me (
cc)
xx
Tumacacori Cienega
Egg Volume
0
10
20
30
40
50
60
70
80
90
100
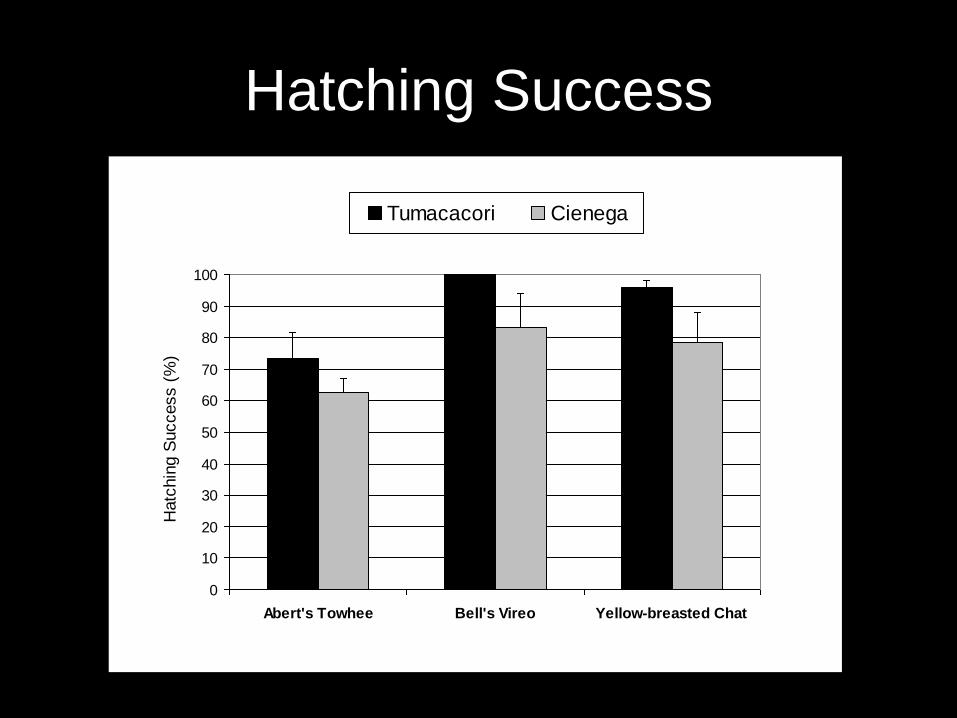
Abert's Towhee Bell's Vireo Yellow-breasted Chat
Hatc
hin
g S
uccess (
%)
xx
Tumacacori Cienega
Hatching Success
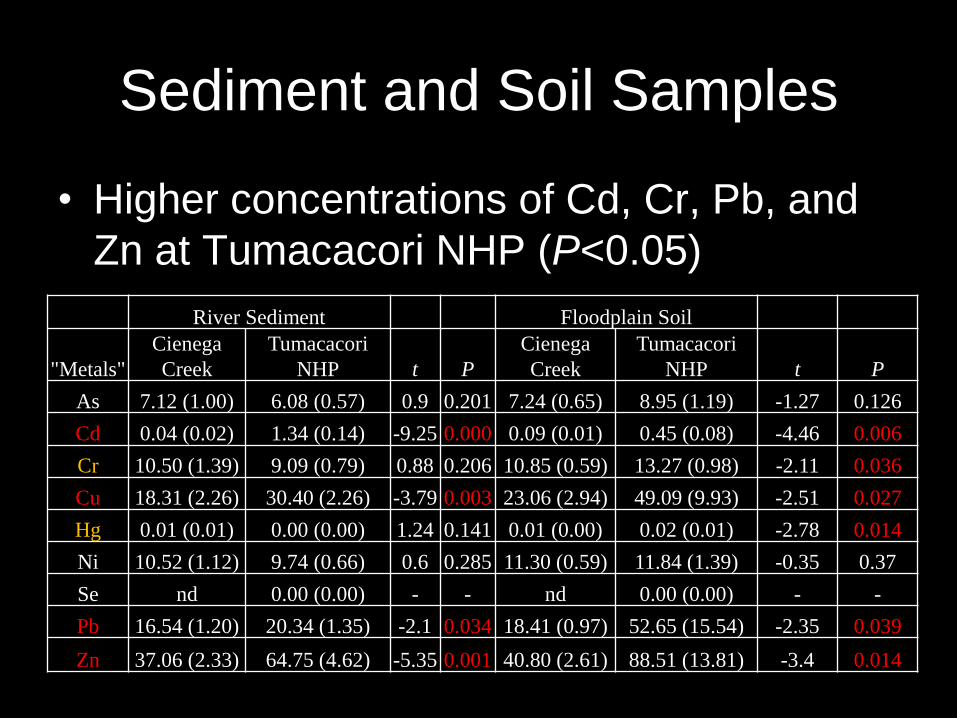
Sediment and Soil Samples
• Higher concentrations of Cd, Cr, Pb, and
Zn at Tumacacori NHP (P<0.05)
River Sediment Floodplain Soil
"Metals"
Cienega
Creek
Tumacacori
NHP t P
Cienega
Creek
Tumacacori
NHP t P
As 7.12 (1.00) 6.08 (0.57) 0.9 0.201 7.24 (0.65) 8.95 (1.19) -1.27 0.126
Cd 0.04 (0.02) 1.34 (0.14) -9.25 0.000 0.09 (0.01) 0.45 (0.08) -4.46 0.006
Cr 10.50 (1.39) 9.09 (0.79) 0.88 0.206 10.85 (0.59) 13.27 (0.98) -2.11 0.036
Cu 18.31 (2.26) 30.40 (2.26) -3.79 0.003 23.06 (2.94) 49.09 (9.93) -2.51 0.027
Hg 0.01 (0.01) 0.00 (0.00) 1.24 0.141 0.01 (0.00) 0.02 (0.01) -2.78 0.014
Ni 10.52 (1.12) 9.74 (0.66) 0.6 0.285 11.30 (0.59) 11.84 (1.39) -0.35 0.37
Se nd 0.00 (0.00) - - nd 0.00 (0.00) - -
Pb 16.54 (1.20) 20.34 (1.35) -2.1 0.034 18.41 (0.97) 52.65 (15.54) -2.35 0.039
Zn 37.06 (2.33) 64.75 (4.62) -5.35 0.001 40.80 (2.61) 88.51 (13.81) -3.4 0.014
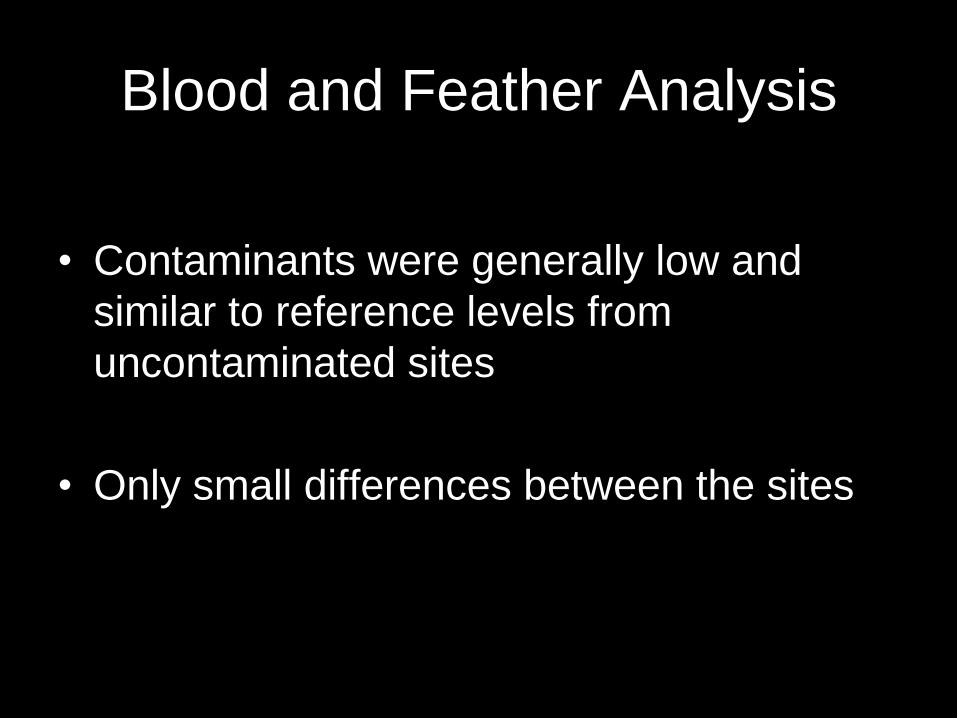
Blood and Feather Analysis
• Contaminants were generally low and
similar to reference levels from
uncontaminated sites
• Only small differences between the sites
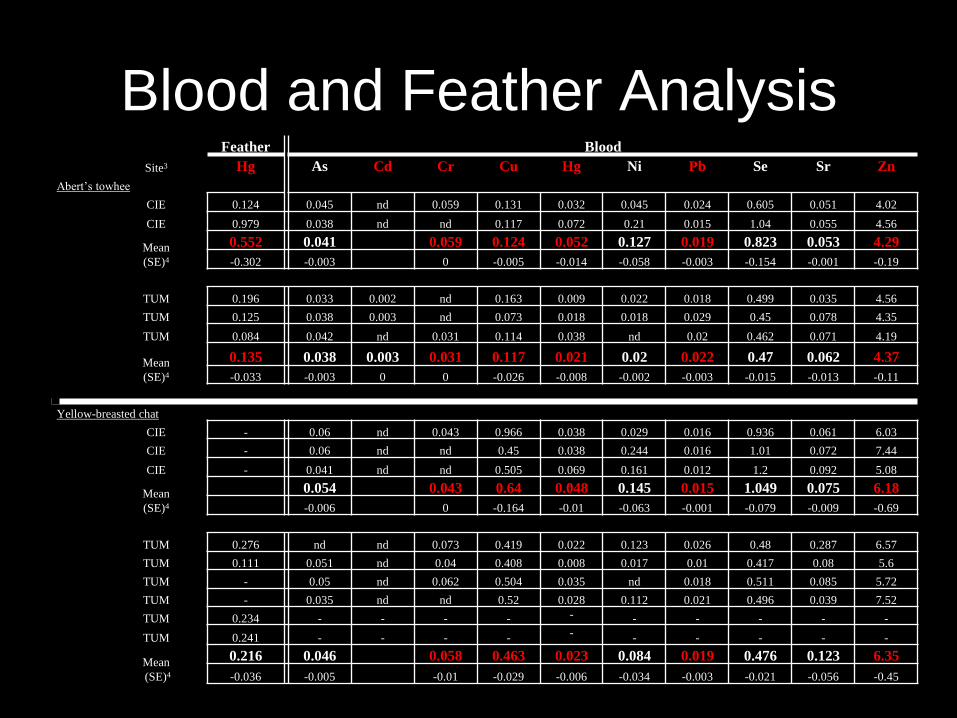
Blood and Feather Analysis Feather Blood
Site3 Hg As Cd Cr Cu Hg Ni Pb Se Sr Zn
Abert’s towhee
CIE 0.124 0.045 nd 0.059 0.131 0.032 0.045 0.024 0.605 0.051 4.02
CIE 0.979 0.038 nd nd 0.117 0.072 0.21 0.015 1.04 0.055 4.56
Mean
(SE)4
0.552 0.041 0.059 0.124 0.052 0.127 0.019 0.823 0.053 4.29
-0.302 -0.003 0 -0.005 -0.014 -0.058 -0.003 -0.154 -0.001 -0.19
TUM 0.196 0.033 0.002 nd 0.163 0.009 0.022 0.018 0.499 0.035 4.56
TUM 0.125 0.038 0.003 nd 0.073 0.018 0.018 0.029 0.45 0.078 4.35
TUM 0.084 0.042 nd 0.031 0.114 0.038 nd 0.02 0.462 0.071 4.19
Mean
(SE)4
0.135 0.038 0.003 0.031 0.117 0.021 0.02 0.022 0.47 0.062 4.37
-0.033 -0.003 0 0 -0.026 -0.008 -0.002 -0.003 -0.015 -0.013 -0.11
Yellow-breasted chat
CIE - 0.06 nd 0.043 0.966 0.038 0.029 0.016 0.936 0.061 6.03
CIE - 0.06 nd nd 0.45 0.038 0.244 0.016 1.01 0.072 7.44
CIE - 0.041 nd nd 0.505 0.069 0.161 0.012 1.2 0.092 5.08
Mean
(SE)4
0.054 0.043 0.64 0.048 0.145 0.015 1.049 0.075 6.18
-0.006 0 -0.164 -0.01 -0.063 -0.001 -0.079 -0.009 -0.69
TUM 0.276 nd nd 0.073 0.419 0.022 0.123 0.026 0.48 0.287 6.57
TUM 0.111 0.051 nd 0.04 0.408 0.008 0.017 0.01 0.417 0.08 5.6
TUM - 0.05 nd 0.062 0.504 0.035 nd 0.018 0.511 0.085 5.72
TUM - 0.035 nd nd 0.52 0.028 0.112 0.021 0.496 0.039 7.52
TUM 0.234 - - - - - - - - - -
TUM 0.241 - - - - - - - - - -
Mean
(SE)4
0.216 0.046 0.058 0.463 0.023 0.084 0.019 0.476 0.123 6.35
-0.036 -0.005 -0.01 -0.029 -0.006 -0.034 -0.003 -0.021 -0.056 -0.45
Summary
• Prevalence of physical abnormalities and signs of
disease were higher than expected for wild bird
populations in adult birds at Tumacacori
• River and floodplain soils had higher concentrations of
contaminants at Tumacacori
• Contamination in birds was generally low for both sites
• Reproductive parameters at Tumacacori were either
equal to or greater than those at our control site at
Cienega Creek
• Breeding populations appear to have been healthy at
Tumacacori in 2008 and 2009
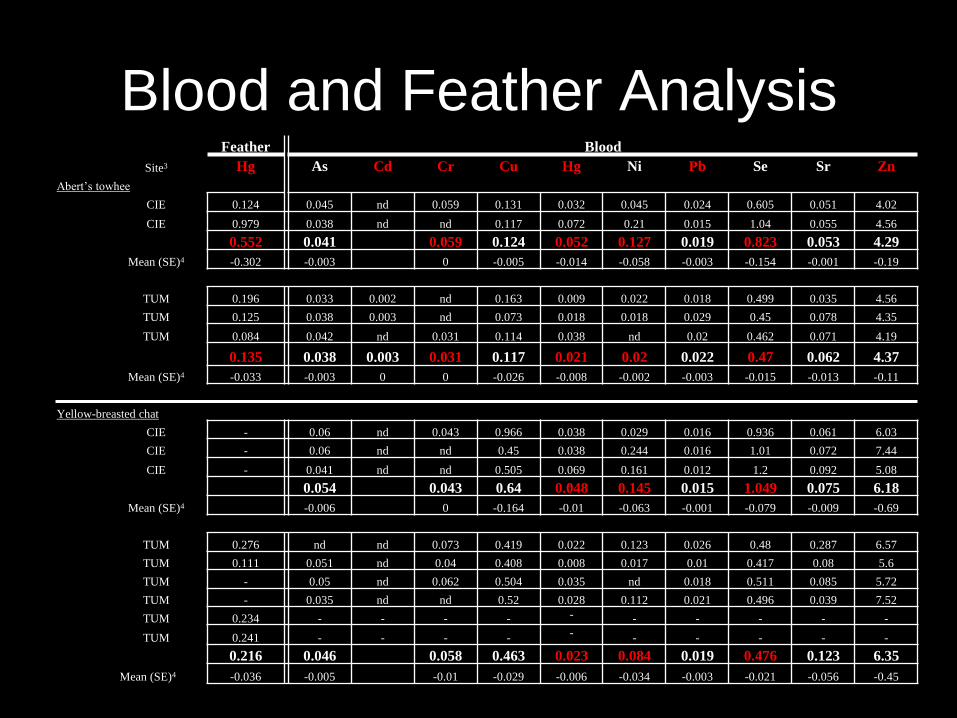
Blood and Feather Analysis Feather Blood
Site3 Hg As Cd Cr Cu Hg Ni Pb Se Sr Zn
Abert’s towhee
CIE 0.124 0.045 nd 0.059 0.131 0.032 0.045 0.024 0.605 0.051 4.02
CIE 0.979 0.038 nd nd 0.117 0.072 0.21 0.015 1.04 0.055 4.56
Mean (SE)4
0.552 0.041 0.059 0.124 0.052 0.127 0.019 0.823 0.053 4.29
-0.302 -0.003 0 -0.005 -0.014 -0.058 -0.003 -0.154 -0.001 -0.19
TUM 0.196 0.033 0.002 nd 0.163 0.009 0.022 0.018 0.499 0.035 4.56
TUM 0.125 0.038 0.003 nd 0.073 0.018 0.018 0.029 0.45 0.078 4.35
TUM 0.084 0.042 nd 0.031 0.114 0.038 nd 0.02 0.462 0.071 4.19
Mean (SE)4
0.135 0.038 0.003 0.031 0.117 0.021 0.02 0.022 0.47 0.062 4.37
-0.033 -0.003 0 0 -0.026 -0.008 -0.002 -0.003 -0.015 -0.013 -0.11
Yellow-breasted chat
CIE - 0.06 nd 0.043 0.966 0.038 0.029 0.016 0.936 0.061 6.03
CIE - 0.06 nd nd 0.45 0.038 0.244 0.016 1.01 0.072 7.44
CIE - 0.041 nd nd 0.505 0.069 0.161 0.012 1.2 0.092 5.08
Mean (SE)4
0.054 0.043 0.64 0.048 0.145 0.015 1.049 0.075 6.18
-0.006 0 -0.164 -0.01 -0.063 -0.001 -0.079 -0.009 -0.69
TUM 0.276 nd nd 0.073 0.419 0.022 0.123 0.026 0.48 0.287 6.57
TUM 0.111 0.051 nd 0.04 0.408 0.008 0.017 0.01 0.417 0.08 5.6
TUM - 0.05 nd 0.062 0.504 0.035 nd 0.018 0.511 0.085 5.72
TUM - 0.035 nd nd 0.52 0.028 0.112 0.021 0.496 0.039 7.52
TUM 0.234 - - - - - - - - - -
TUM 0.241 - - - - - - - - - -
Mean (SE)4
0.216 0.046 0.058 0.463 0.023 0.084 0.019 0.476 0.123 6.35
-0.036 -0.005 -0.01 -0.029 -0.006 -0.034 -0.003 -0.021 -0.056 -0.45
Future Work
• Test collected egg samples for both
metals and emerging contaminants
• Test blood samples for emerging
contaminants
• Resample Tumacacori after treatment
plant upgrade
Thanks To:
• Field Techs: Ann Johnson, Robert Beatson, Jake Mohlmann, Moez Ali, Jan Wilson, & Art Schaub
• Larry Norris, Wade Leitner, and the entire MAPS banding crew
• Lisa Carrico, Jeremy Moss, and the staff at Tumacacori NHP
• Kerry Baldwin (PAG)