the influence of extreme news - xinwen chen
TRANSCRIPT


2
Overview
11 Introduction & Data Preparation
33 Possible Trading Strategies & Performances • Buy & Hold (Benchmark)• Buy on Good News• Sell on Bad News
22 Method & Model Interpretation
3
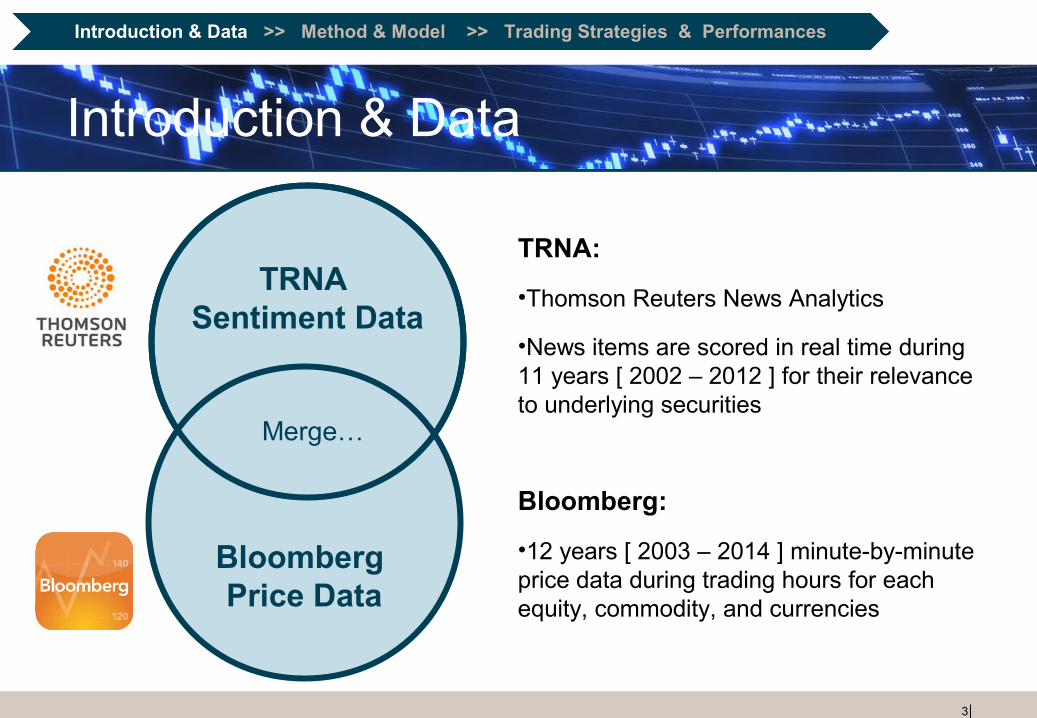
Introduction & Data
TRNA Sentiment Data
Bloomberg Price Data
Merge…
TRNA:
•Thomson Reuters News Analytics
•News items are scored in real time during 11 years [ 2002 – 2012 ] for their relevance to underlying securities
Bloomberg:
•12 years [ 2003 – 2014 ] minute-by-minute price data during trading hours for each equity, commodity, and currencies
Introduction & Data >> Method & Model >> Trading Strategies & Performances

4
Introduction & Data
Concentrate on 30 Dow Jones Components (2003 ~ 2012):
TICKER NAME # of News Items TICKER
NAME # of News Items TICKER NAME # of News Items
MMM 3290 GE 14967 NKE 2090
AXP 3893 GS 9706 PFE 2963
AAPL 8884 HD 4026 PG 3487
BA 11738 INTC 7833 TRV 1697
CAT 3632 IBM 9876 UNH 3176
CVX 3567 JNJ 4576 UTX 2906
CSCO 7798 JPM 11674 VZ 15755
KO 2830 MCD 4398 V 2038
DD 3940 MRK 5852 WMT 2273
XOM 10036 MSFT 12631 DIS 6152
Introduction & Data >> Method & Model >> Trading Strategies & Performances

5
Can we use news items to predict the price changes
in the near future?
6
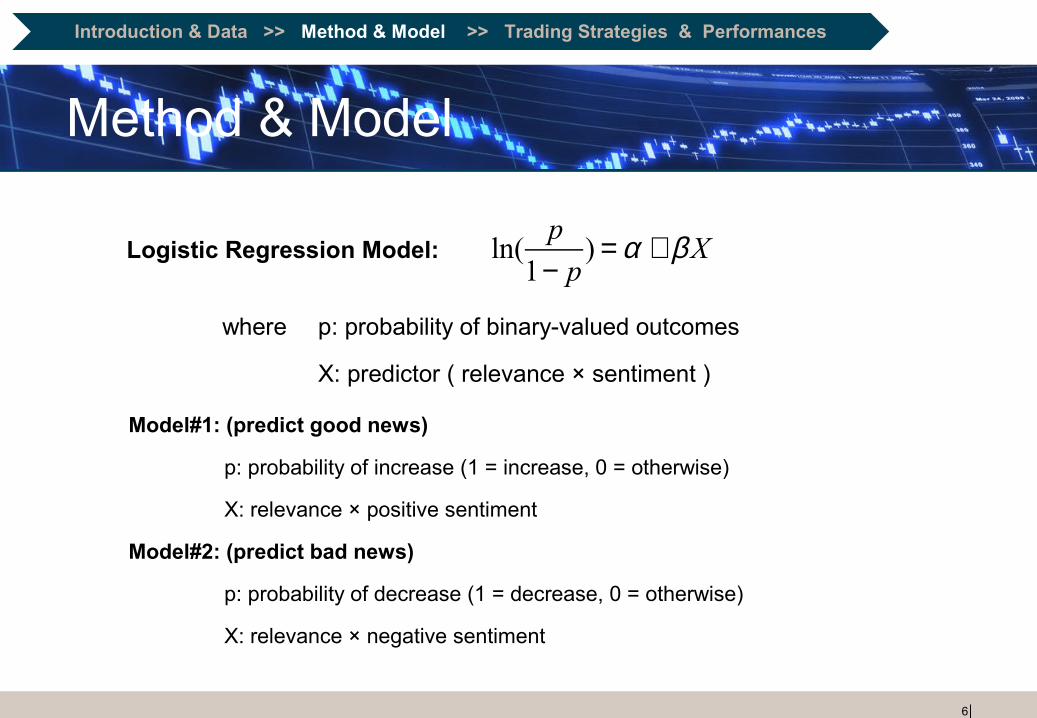
Method & Model
Logistic Regression Model:
where p: probability of binary-valued outcomes
X: predictor ( relevance × sentiment )
ln(p
1− p) = α + βX
Introduction & Data >> Method & Model >> Trading Strategies & Performances
Model#1: (predict good news)
p: probability of increase (1 = increase, 0 = otherwise)
X: relevance × positive sentiment
Model#2: (predict bad news)
p: probability of decrease (1 = decrease, 0 = otherwise)
X: relevance × negative sentiment

7
• Output of fitted model is the estimated probability of an price increase (decrease) following a given news item
• Need to find a probability threshold that leads to make a positive prediction (trade on the news)
Method & Model
Find the best cutoff value:
Example: (Boeing Company)
First 70% as training set
Last 30% as testing set
Validation Error Rate: 38.7%
Cutoff Value: 0.4801
Introduction & Data >> Method & Model >> Trading Strategies & Performances

8
Trading Strategies
Return
Benchmark: Buy & Hold• Open position at time 0 and close by the end of trading period
• take the profit / loss in the middle
Time t = 0
Time t = T
Introduction & Data >> Method & Model >> Trading Strategies & Performances

9
Trading Strategies
Strategy #1 : Buy on Good News• Open position only when the modeled probability above best
cutoff (good news)
• Hold till the next news item
Introduction & Data >> Method & Model >> Trading Strategies & Performances
Buy on Good News
Buy and Hold
TIME
10
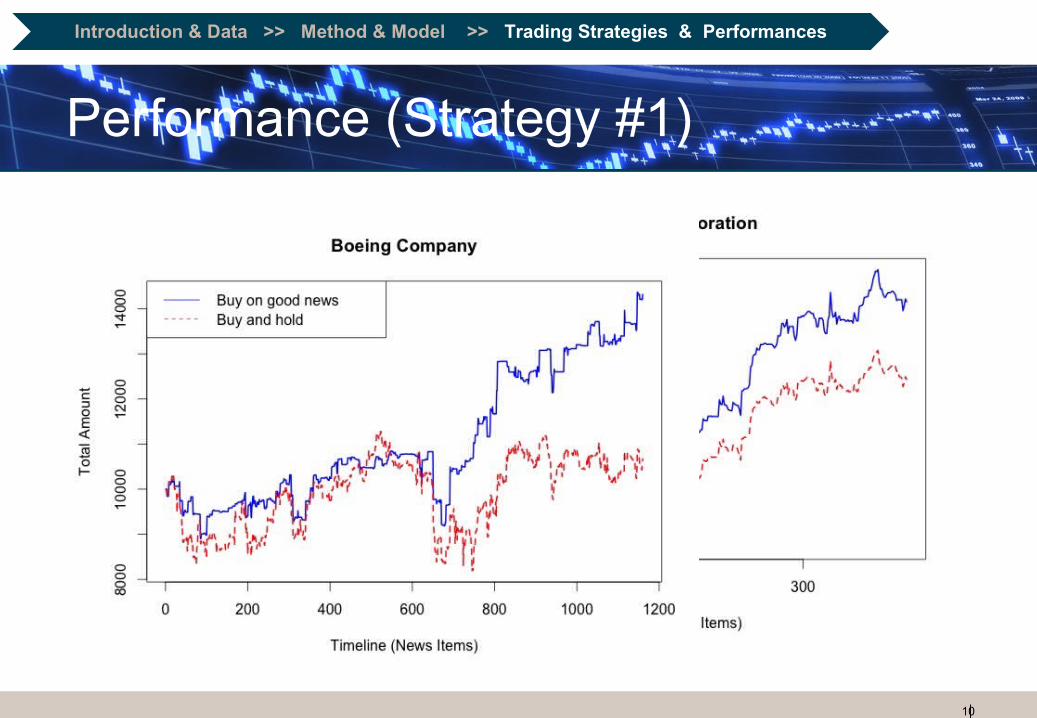
Performance (Strategy #1)
Introduction & Data >> Method & Model >> Trading Strategies & Performances

11
Performances (Strategy #1)
Introduction & Data >> Method & Model >> Trading Strategies & Performances
TICKER NAME
AnnualOutperformance(vs. Buy & Hold)
TICKER NAME
AnnualOutperformance(vs. Buy & Hold)
TICKER NAME
AnnualOutperformance(vs. Buy & Hold)
BA 13.82% CAT 11.80% CVX 11.35%
CSCO 10.38% KO 7.86% NKE 6.53%
PG 5.82% DD 5.56% PFE 4.70%
GS 4.65% XOM 2.52% UNH 2.24%
MMM 1.58% V 1.13% MCD 0.98%
JPM 0.52% JNJ 0.20% INTC - 3.55%
MSFT - 5.45% UTX 5.52% AXP - 7.35%
TRV - 9.00% DIS - 9.52% WMT - 11.44%
GE - 13.63% MRK - 14.44% VZ - 19.61%
IBM - 20.62% HD - 30.12% AAPL - 37.32%
12
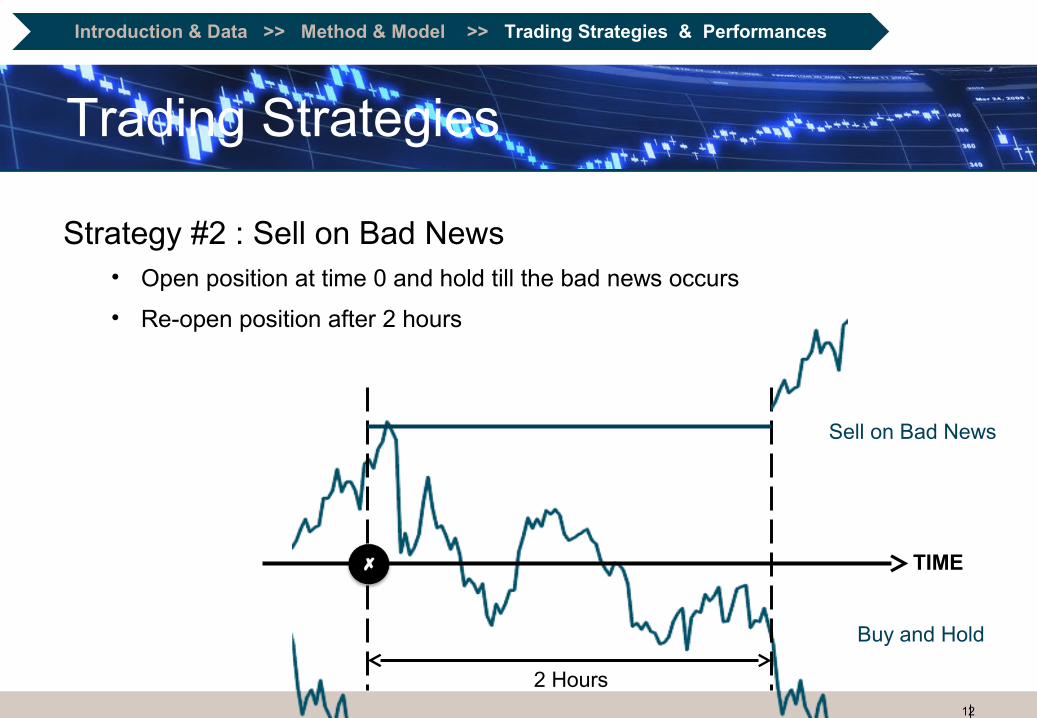
Trading Strategies
Strategy #2 : Sell on Bad News• Open position at time 0 and hold till the bad news occurs
• Re-open position after 2 hours
Introduction & Data >> Method & Model >> Trading Strategies & Performances
Buy and Hold
TIME
2 Hours
Sell on Bad News

13
Trading Strategies
Strategy #2 : Sell on Bad News• Open position at time 0 and hold till the bad news occurs
• Re-open position after 2 hours
Introduction & Data >> Method & Model >> Trading Strategies & Performances
Buy and Hold
TIME
2 Hours
Sell on Bad News

14
Performances (Strategy #2)
Introduction & Data >> Method & Model >> Trading Strategies & Performances
15
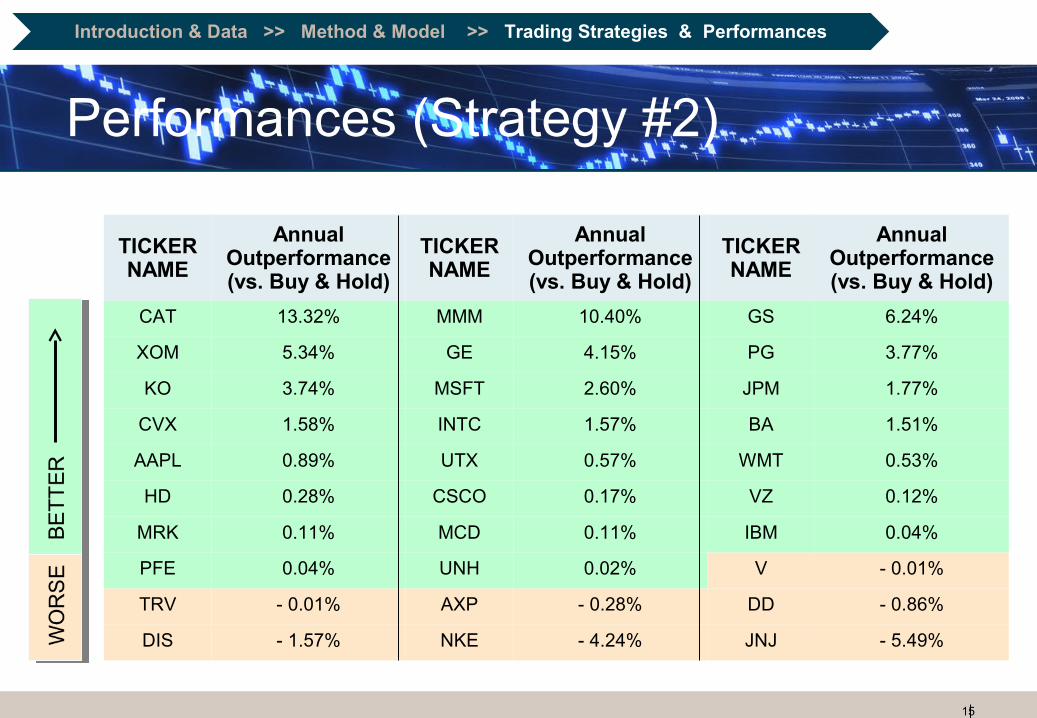
Performances (Strategy #2)
Introduction & Data >> Method & Model >> Trading Strategies & Performances
TICKER NAME
AnnualOutperformance(vs. Buy & Hold)
TICKER NAME
AnnualOutperformance(vs. Buy & Hold)
TICKER NAME
AnnualOutperformance(vs. Buy & Hold)
CAT 13.32% MMM 10.40% GS 6.24%
XOM 5.34% GE 4.15% PG 3.77%
KO 3.74% MSFT 2.60% JPM 1.77%
CVX 1.58% INTC 1.57% BA 1.51%
AAPL 0.89% UTX 0.57% WMT 0.53%
HD 0.28% CSCO 0.17% VZ 0.12%
MRK 0.11% MCD 0.11% IBM 0.04%
PFE 0.04% UNH 0.02% V - 0.01%
TRV - 0.01% AXP - 0.28% DD - 0.86%
DIS - 1.57% NKE - 4.24% JNJ - 5.49%

16
Conclusions
• We are able to identify several stocks that appear to be quite sensitive to news.
• Both “buy on good news” and “sell on bad news” strategies outperform the benchmark for majority stocks.
• For “buy on good news” strategy, the number of stocks for which we achieve out-performance is not significantly different from 50% of them
• For “sell on bad news” strategy, 50% stocks only have a small out-performance comparing with the benchmark.

17
Q & A