the influence of formative assessment in primary grades on ...€¦ · the influence of formative...
TRANSCRIPT
Formative assessment and student achievement
The Influence of Formative Assessment in Primary Grades on Students’ Number Sense
Achievement
Abstract
This study examined primary grades students’ achievement on number sense tasks administered
through an internet-based formative assessment tool, AMC Anywhere. Data was analyzed from
2,357 students in participating teachers’ classrooms, 1,427 students from teachers who had
participated in the project in the year prior, and 9,783 students in the comparison group.
Analyses indicated that all students in the treatment group demonstrated growth, and that student
achievement was influenced by the frequency of assessment. Further, there was a relationship
between districts’ socio-economic status and growth, meaning students from impoverished
backgrounds grew more than their peers. Implications for subsequent studies call for a more
specific analysis of teachers’ specific practices.
Key words: formative assessment, mathematics, elementary school
Note: This work is supported by the <state blinded> Department of Education Mathematics
Science Partnership Grant Program. The findings and statements in this article do not reflect the
opinion of the <state blinded> Department of Education.

Formative assessment and student achievement
The Need to Improve Students’ Mathematics Achievement
In the current era of educational accountability, educational leaders and researchers are
constantly seeking ways to increase students’ achievement and learning. While a teachers’
effectiveness continues to be identified as the most influential variable on students’ learning,
there is a need to more explicitly identify the teacher practices and characteristics that have the
greatest benefit to students (Hattie, 2008; Nye, Konstantopoulos, & Hedges, 2004).
The National Math Panel reported that their synthesis of research on mathematics
learning indicated “mutually reinforcing benefits of conceptual understanding, procedural
fluency, and automatic (i.e., quick and effortless) recall of facts (USDE, 2008, p. xiv).” Further,
the Panel called for more intensive and long-term studies of students’ mathematics learning as a
result of instructional interventions and the use of specific practices (USDE, 2008). NCTM’s
Principles to Action (2014) draws heavily on research that found benefits in having students
explore rigorous, cognitively-demanding mathematical tasks as well as activities that promote
computational fluency. This idea of a balanced curriculum focused on problem solving and
fluency follows long-standing recommendations from the field (National Research Council,
2001).
Of particular interest in efforts to positively impact student achievement are chronically
low-performing students, especially those from impoverished backgrounds (National Center for
Educational Statistics [NCES], 2013). Research from the National Assessment for Educational
Progress cites that while student achievement in the United States continues to increase on the
Grade 4 and Grade 8 mathematics tests, Caucasian students still greatly outperform African
American students, and students from impoverished and urban backgrounds underperform
compared to their peers from more privileged settings (NCES, 2013, 2014).
Formative assessment and student achievement
In mathematics, leaders have identified a range of high-leverage instructional practices
that have been empirically linked to students’ achievement (National Council of Teachers of
Mathematics [NCTM], 2014; U.S. Department of Education [USDE], 2008). Students’
mathematics learning is more likely to improve if teachers emphasize problem solving through
the implement of cognitively-demanding mathematical tasks, pose high-level questions that
support students’ reasoning and development of connections between mathematical ideas, and
teachers differentiate and modify instruction based on students’ performance and teachers’
formative assessment (NCTM, 2014; USDE, 2008). In recent years internet-based tools have
been developed and adopted to support formative assessment practices. This study examines the
influence of formative assessment practices on primary grades students’ number sense skills
using the internet-based formative assessment tool, AMC Anywhere.
Synthesis of the Literature
Formative Assessment
Multiple meta-analyses of research studies have found that, “when implemented well,
formative assessment practices can effectively double the speed of student learning” (Wiliam,
2007/2008, p. 36). In an analysesIn an analysis of research of effect sizes of instructional
practices’ student achievement, Hattie (20082011) identified formative assessment practices as
one of the most impactful instructional practices. Formative assessment practices involve the
process of collecting data, analyzing it, and using it to plan, modify, and differentiate instruction.
Empirical studies show the benefit of formative assessment practices on student achievement in
literacy (Fuchs & Fuchs, 1986) as well as mathematics (Author, 2014, 2015; Wiliam, 2007,
2010).

Formative assessment and student achievement
Formative assessment refers to the evaluation of student learning during the learning
process with student learning as its main priority. The literature suggests several components of
effective formative assessments: (a) opportunities for teachers and students to express learning
goals; (b) use feedback to move forward; (c) engage in peer assessment; (d) uncover student
reasoning; and (e) create follow up instruction that extends thinking (Baroudi, 2007; Heritage,
2007; Hodgen, 2007; Huinker & Freckmann, 2009). Empirical studies indicate that student
achievement significantly increases when teachers use formative assessments appropriately
(Black & Wiliam, 1998; Wiliam, 2007). Teachers who use formative assessment are able to
better understand the learner and use the data for the development of individualized instruction
for each specific learner.
A meta-analysis was employed to examine the effects of systematic formative evaluation
and noted that the effect sizes were significant for students whose learning processes were
monitored systematically (Fuchs & Fuchs, 1986). Moreover, effect sizes were even higher when
teachers used data-utilization rules. Fuchs and Fuchs (1986) work also found that for struggling
learners who are sometimes referred to as at-risk, formative assessment practices started to close
the achievement gap in literacy. Related studies are needed in the field of mathematics.
Formative Assessment in Mathematics
In mathematics education, formative assessment has long been identified as a high-
leverage and impactful instructional practice (NCTM, 2000, 2015; Wiliam, 2007; Wiliam &
Thompson, 2007). Formative assessment research cites that the practice is most valuable to the
teaching and learning when teachers use data to modify instructional goals, instructional
Formative assessment and student achievement
activities, and instructional pedagogies (Black, Harrison, Lee, Marshall, & Wiliam & Thompson,
2007; Heritage, 2007).
The research base has documented teachers’ difficulties carrying out the various aspects
of formative assessment practices (Phannkuch, 2001; Wiliam & Thompson, 2007; Author,
2014). Abrams (2007) noted that teachers opted to not collect data frequently due to the time
demands associated with planning and teaching their standards. In essence, teachers did not feel
that they had the time to implement formative assessment. Further, Cizek (2010) found that
teachers were eager to use summative end of unit assessments, but did not use formative
assessment practices, despite espousing their potential benefit to student achievement. In New
Zealand, Phannkuch (2001) conducted a 10 year longitudinal study and found that while primary
grade teachers used a variety of assessment practices, they were focused on mastery learning and
did not include a lot of formative or informal assessments of students’ mathematics learning.
In Australia, Mushin, Gardner, & Munro (2013) found that oral assessments accurately
give teachers information about students’ mathematical thinking, but that language barriers with
oral speaking may impede the assessment process about what students can actually do.
More recently Authors (in press-a, in press-b) found that after participating in a formative
assessment professional development project, teachers’ implementation varied. Some teachers
demonstrated consistent use of both the internet-based formative assessment tool and the
modification of their instruction, while others only assessed their students and did not modify
their instruction (Authors, in press-b). Further, some teachers opted to assess their students
frequently during the year, while others only used the tool the minimum number of times
(Author, 2014, in press-a). The number of times that teachers have used that system has been
empirically linked to students’ achievement (Author, 2014). Additionally, research indicated that
Formative assessment and student achievement
teachers’ use of formative assessment practices was statistically significantly different from other
districts and influenced by curriculum and school factors (Author, in press-a).
Clearly formative assessment practices have potential to increase students’ achievement.
However, more research is needed to examine the influence of formative assessment on students’
achievement. This is especially true in mathematics. This study focuses on primary grades’
students development of number sense due to the large focus placed on them in the Common
Core State Standards for Mathematics (CCSS-M; Common Core State Standards Initiative,
2011).
Purpose and Research Question
This study focuses on the research question: Is there a significant relationship between
teacher use of formative assessment and student growth in mathematical skills? Specifically,
variables such as poverty, school size, and the frequency of the use of formative assessment
practices were examined as possible contributors to variance to students’ achievement.
Methods
Context
The data analyzed in this study came from teacher-participants in the Assessment
Practices to Support Mathematics Learning and Understanding for Students (APLUS)
professional development project funded by the <state blinded> Department of Education’s
Mathematics Science Partnership grant program. The APLUS project provided teachers with
approximately 70 hours of learning experiences related to the use of the internet-based formative
assessment tool, Assessing Math Concepts (AMC Anywhere, Richardson, 2012), the
Formative assessment and student achievement
accompanying Developing Number Concepts (DNC) curricular resources (Richardson, 1998).
All participating teachers were using standards-based mathematics curricular resources, so the
project also included support aligning their districts’ curricular resources, AMC Anywhere
assessments, DNC, and the Common Core State Standards for Mathematics (CCSSI, 2011).
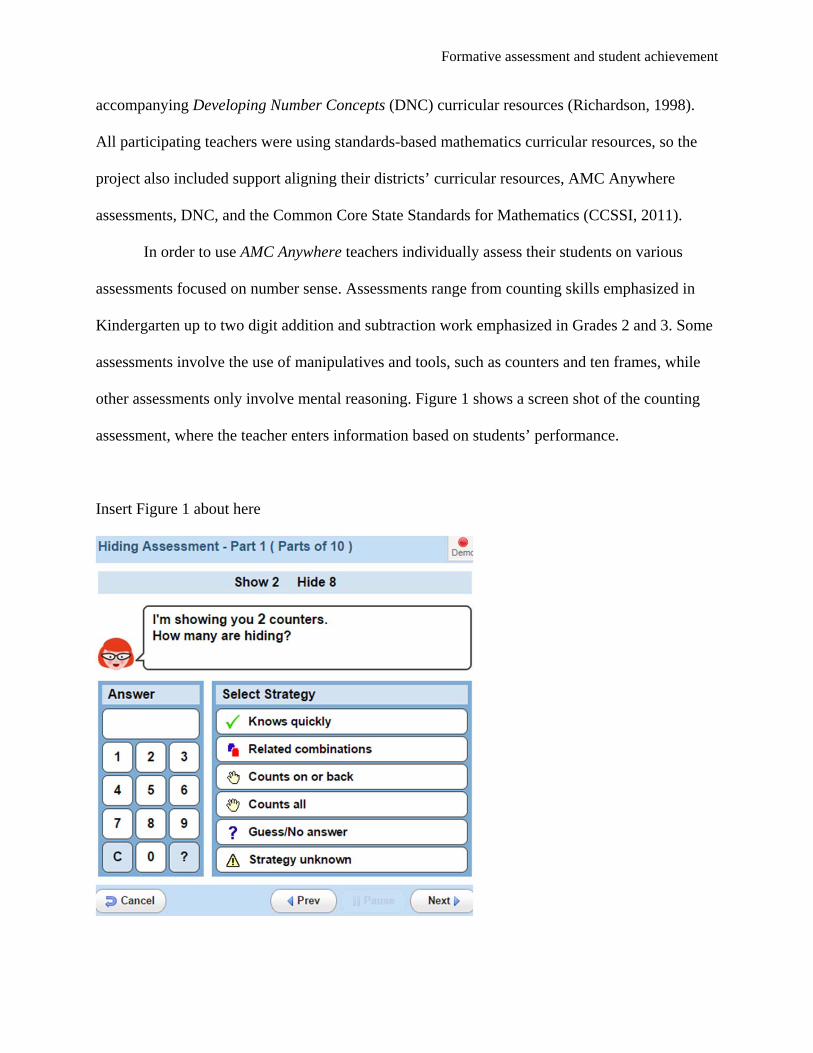
In order to use AMC Anywhere teachers individually assess their students on various
assessments focused on number sense. Assessments range from counting skills emphasized in
Kindergarten up to two digit addition and subtraction work emphasized in Grades 2 and 3. Some
assessments involve the use of manipulatives and tools, such as counters and ten frames, while
other assessments only involve mental reasoning. Figure 1 shows a screen shot of the counting
assessment, where the teacher enters information based on students’ performance.
Insert Figure 1 about here
Formative assessment and student achievement
Figure 1: Screen shot of Hiding Objects Recording Screen
As an internet-based tool, AMC Anywhere allows teachers to collect, store, and analyze
data throughout the school year. Further, its reporting features provide teachers with information
about students’ instructional needs as well as links to the accompanying curricular resources,
Developing Number Concepts (DNC; Richardson, 1998), which provide tasks for students to
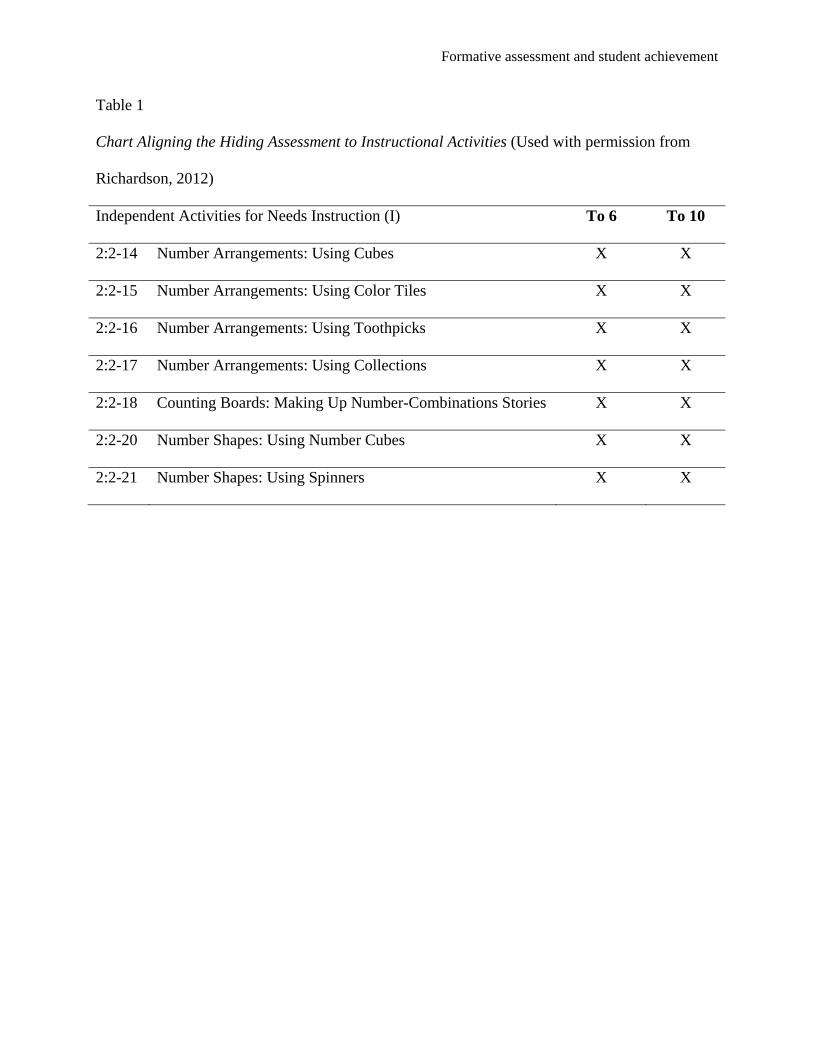
explore related to the skills in the assessments. Figure 2 shows a screen shot of the classroom
report, while Table 1 provides an example about how the assessments link to instructional
activities. The goal of AMC Anywhere and DNC is that teachers would use formative
assessments as an integral part of the process of analyzing students’ mathematical understanding.
Insert Figure 2 about here

Formative assessment and student achievement
Figure 2: Screen shot of Classroom Instruction Report for Hiding Assessment
<Insert Table 1 about here>
Participants
Participants of this study are 906 teachers and their 13,567 students in Grades K-2 in
elementary schools in <state blinded>. Of these 13,567 students, 763 (6%) were in Kindergarten,
5,815 (43%) were in the first grade, and 6,989 (51%) were in the second grade. These students

Formative assessment and student achievement
were put into three groups: Treatment Group (n = 2357, 17%), Prior-Year Group (n = 1427,
11%),), and Comparison Group (n = 9783, 72%), Treatment group students are from the 127
(14%) teachers who participated in the APLUS program. Prior-Year Group students are from the
81 (9%) teachers who participated in the APLUS program last year. The rest of the teachers (n =
698, 77%) and their students served as the Comparison Group. The teachers in the Comparison
Group volunteered to use AMC Anywhere, but never participated in the program. The data from
all the students were available in the AMC Anywhere program as long as their teachers use the
program for formative assessments. These data are anonymous, and we have obtained the waiver
of consent forms from these participants with the approval of the Institutional Review Board at
our university. Since this is not an experimental design, we are aware of the potential differences
in teacher and student characteristics of the three groups of teachers with their students. These
differences make simple mean comparisons across the groups meaningless. Therefore, we
adopted a linear growth model that estimates the initial status of the student’s mathematics
achievement at the beginning of the treatment and the monthly growth rate for all students.
Linear growth models accommodate various initial status as well as non-simultaneous data
collection at the same time (Raudenbush & Bryk, 2002).
All teacher-participants hold a state license in elementary education which spans from
Kindergarten through Grade 6. Additionally, all teachers in the study use an internet-based
formative assessment tool, MClass (Amplify, 2015), which the state mandated for literacy. The
state has not mandated the use of a formative assessment tool for mathematics.
Research Design

Formative assessment and student achievement
This is part of a three-year professional development program provided to the school
district with the support of Mathematics Science Program (MSP) grant from the State
Department of Public Instruction. The school district has the authority to decide which teachers
to receive the treatment each year. The goal of the district is to have all teachers participate in the
treatment in three years. The authors of this paper are Co-Principal Investigators on the grant and
have close contact with the school district through the professional development but have no
conflict of interest with the company that provided AMC Anywhere program. The achievement
measure focused on the Hiding Assessment in the AMC Anywhere internet-based formative
assessment system. The Hiding Assessment includes two separate parts with distinct tasks. Part
One requires students to find the missing addend of numbers using counters to assist students.
For example, in Figure 1 students count out 10 counters and the teacher then takes away 8
counters when the students are not looking. The student looks at the pile sees 2 counters, and has
to then determine how many counters the teacher took away or is hiding. Part Two consists of
the same tasks, but without counters and only mental reasoning. Both parts assess students’
ability to differentiate ways to solve tasks involving the numbers 3 through 10. Teachers were
asked to assess student growth in mathematical skills frequently but to keep the assessments at
least two weeks apart, allowing time for instruction and student growth. The teachers record
student responses in AMC Anywhere, which generates the assessments reports for each
individual student with the letter grades A, P+, P, P-, I, and N. The letters, from the highest to the
lowest score, stand for Apply, Practice, Instruction, and Needs prior skill(s).
Data Analytical Procedure

Formative assessment and student achievement
Item Response Theory (IRT) was employed to transform the teachers’ assessment of
student mathematical skills from the original letter grade scaling into interval-level scale scores
using the Rasch model (Author, in press; Andrich, 1978) with Winsteps software (Linacre,
2012). The standardized scaled scores have a mean of 500 and a standard deviation of 100. Since
students were assessed multiple times during the academic year, month was used as the unit of
analysis in time so that each assessment is associated with the number of months elapsed from
the start of the academic school year (August 15). Due to the nature of nested data in our project
(student data are nested within classrooms and classroom data are nested within schools), a
multi-level data analytic procedure (i.e., hierarchical linear models) was adopted to account for
the variances between classrooms as well as between schools (Raudenbush & Bryk, 2002). A
four-level hierarchical linear model (HLM4) was employed to predict the student initial status of
mathematical skills as well as the monthly growth rate for the students during the academic year
at Level One. Level One is simply a linear growth model where the dependent variable is the
student performance on the mathematics achievement measure (i.e., hiding task) and the
independent variable is time (coded as 0 if the measurement took place in August, 1 in
September, 2 in October, etc. so that the slope of the regression represents monthly increase).
The number of assessments each student received (Assessment) was used as a predictor (group-
mean centered) at Level Two (Student Level). At Level Three, the average number of
assessments in each classroom (Mean_Assess) and the group status (treatment group versus
comparison group) were entered as predictors (group-mean centered, Classroom Level)). Finally,
the school size (size) and the percentage of free/reduced price lunch children (poverty) were used
as predictors (grand-mean centered) at Level Four (School Level).
Formative assessment and student achievement
Results
Group Mean Differences
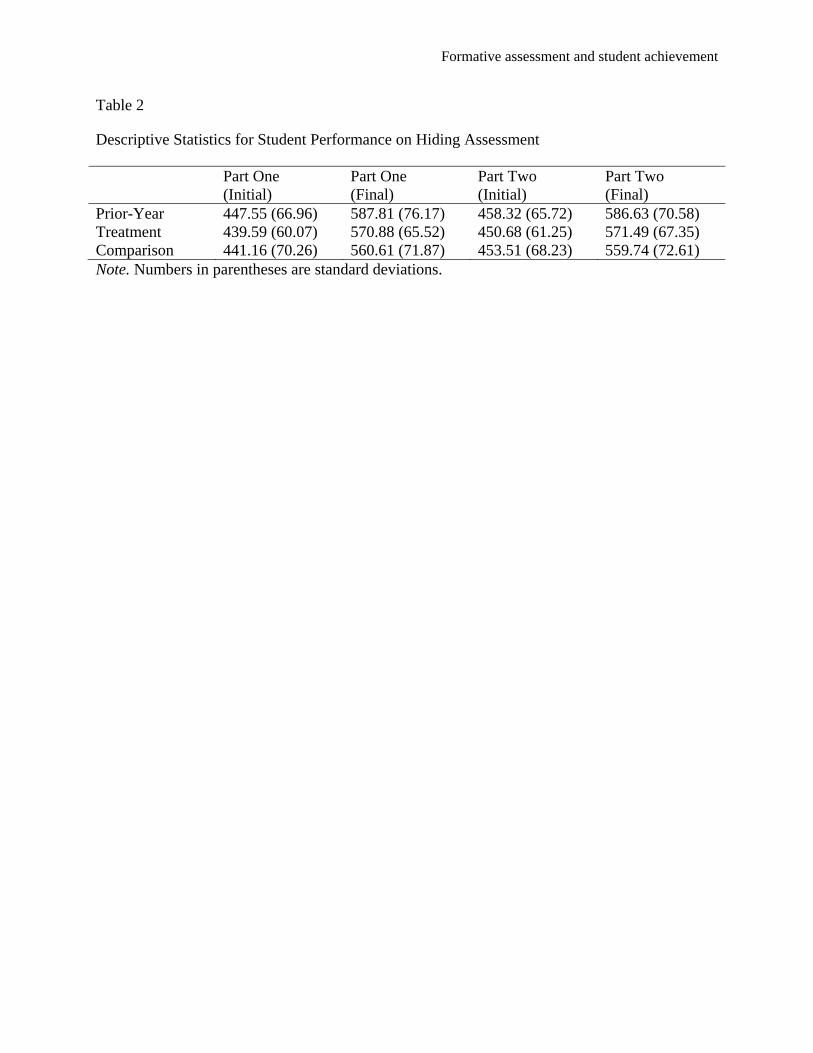
Descriptive statistics of student performance on the Hiding assessment are reported in
Table 2. Only the initial status and the final score of the students in each of the three groups were
included because each student was measured multiple times (ranged from 1 to 13). The
assessment that was administered at the beginning of the school year (i.e., August or September)
was treated as the initial status whereas the assessment that was administered at the end of the
school year (i.e., April or May) was treated as the final score of the student performance on the
Hiding assessment.
<Add Table 2 about here>
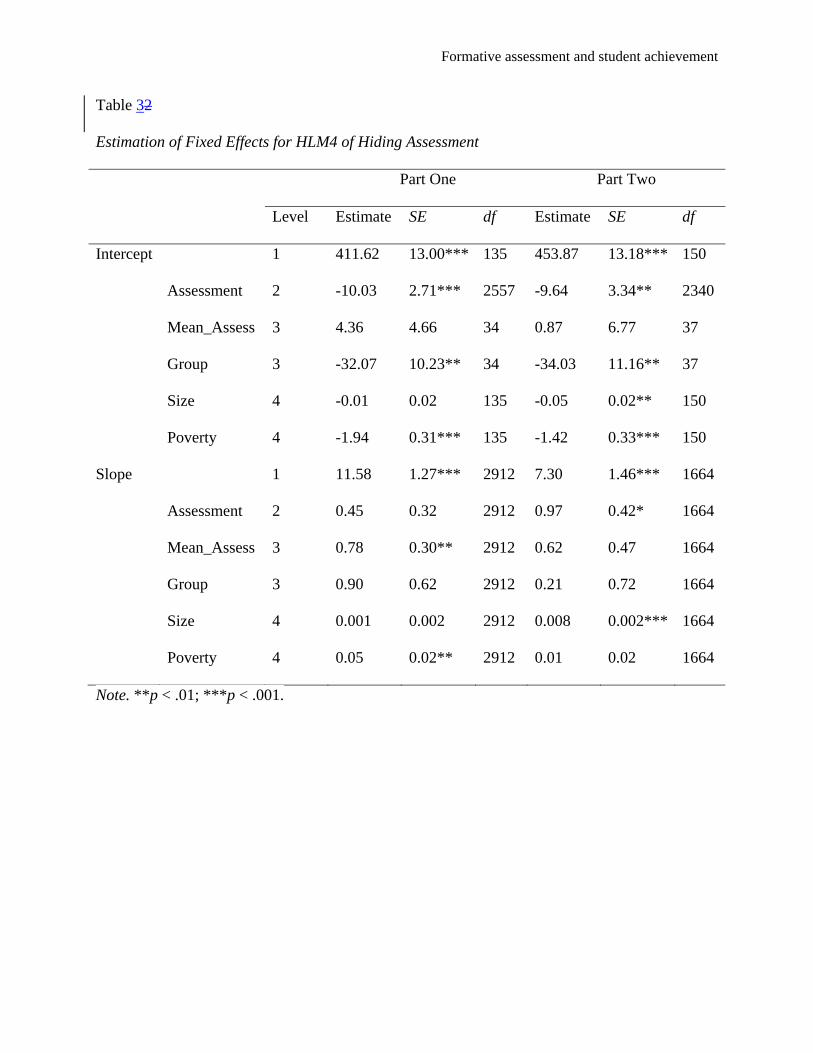
Estimates of the Initial Status and Monthly Growth Rate (Part One)
The parameter estimates of the fixed effects for HLM4 are presented in Table 32. In Part
One of the Hiding Assessment, a comparison group student’s performance in an average
classroom and at a school of average level of poverty is estimated to be 411.62 at the beginning
of the academic year (August 15th), and the monthly growth rate of the student is estimated to be
11.58, which means that a student’s performance on this assessment is expected to increase by
11.58 every month. Students from poverty schools were at significantly lower levels at the
beginning of the academic year, t (135) = -6.24, p < .001. This negative relationship between
poverty level and student achievement is manifested as: With an increase of one more percent of
students who are qualified for free/reduced price lunch program in the school, students’
achievement in this assessment is estimated to be 1.94 lower than that from a school with an
average level of poverty.
Formative assessment and student achievement
Across all of the students, treatment group students’ initial performance on the
assessment was significantly lower than that of the comparison group students, t (34) = -3.13, p =
.004. Students in the treatment group were expected to be 32.07 less than that in the comparison
group at the beginning of the academic year. This means that the teachers who volunteered to be
in the comparison group are from classrooms whose students are above the average level of
performance, assuming that all the treatment group students are from average classrooms.
Moreover, the number of assessments that each student received is negatively related to the
estimated initial status of the assessment, t (2557) = -3.71, p < .001. With each additionalone
more assessment, a student’s initial status is expected to be 10.03 less, which suggests that the
teachers used AMC Anywhere more with the students who had more difficulty in learning
mathematics. The other two predictors of the intercept (classroom mean number of assessments
and school size) did not have any statistically significant impact on the estimation of the initial
status of the assessment.
As for the predictors of the slope, classroom mean number of assessments had a
statistically and significantly positive impact on the monthly growth rate, t (2912) = 2.62, p =
.009. For each additionalWith one more classroom mean assessment in the classroom level,
students’ monthly growth rate is expected to increase by 0.78, i.e., from 11.58 to 12.36.
Similarly, the school average poverty level also had a significantly positive impact on the
monthly growth rate, t (2912) = 2.88, p = .004. With an increase of one more percent of students
eligible for the free/reduced price lunch program, the student’s monthly growth rate is expected
to increase by 0.05, i.e., from 11.58 to 11.63. The other predictors in the model (school size,
classroom mean number of assessments, and the number of assessments for each student) did not
have any statistically significant impacts on the monthly growth rate.

Formative assessment and student achievement
Estimates of the Initial Status and Monthly Growth Rate (Part Two)
For Part Two of the Hiding Assessment, a comparison group student’s performance in an
average classroom and at a school of average level of poverty is estimated to be 453.87 at the
beginning of the academic year (August 15th), and the monthly growth rate of the student is
estimated to be 7.30, which means that a student’s performance on this assessment is expected to
increase by 7.30 every month. This monthly growth rate (slope) is statistically significantly
different from zero, t (1664) = 5.01, p < .001. Students from large schools (more than a thousand
students) were at significantly lower levels at the beginning of the academic year in comparison
to small schools (less than 500 students), t (150) = -2.98, p = .003. Students from poverty schools
were also at significantly lower levels at the beginning of the academic year, t (150) = -4.29, p <
.001. With an increase of one more one percent of students who are qualified for free/reduced
price lunch program in the school, students’ achievement in this assessment is estimated to be
1.42 lower than that from a school with an average level of poverty. Treatment group students’
initial status of the assessment was significantly lower than that of the comparison group
students, t (37) = -3.05, p = .004. Students in the treatment group were expected to be 34.03 less
than that in the comparison group at the beginning of the academic year. Moreover, the number
of assessments that each student received is negatively related to the estimated initial status of
the assessment, t (2340) = -2.89, p = .004. For each additionalWith one more assessment, a
student’s initial status is expected to be 9.64 less, which suggests that the teachers targeted at the
students who had more difficulty in learning mathematics and gave these students more
assessments during the academic year. The other predictor of the intercept (classroom mean
number of assessments) did not have any statistically significant impact on the estimation of the
initial status of the assessment.
Formative assessment and student achievement
As for the predictors of the slope, school size had a positive impact on the monthly
growth rate, t (1664) = 3.54, p < .001. With an increase of 100 more students in the school
population, students’ monthly growth rate is expected to increase by 0.20, i.e., from 7.30 to 7.50.
Similarly, the number of assessments each student received also had a significantly positive
impact on the monthly growth rate, t (1664) = 2.88, p = .004. For each additionalWith an
increase in the number of assessments that the teacher conducted, the student’s monthly growth
rate is expected to increase by 0.42, i.e., from 7.30 to 7.72. The other predictors in the model
(school poverty level, classroom mean number of assessments, and the treatment or comparison
group status) did not have any statistically significant impacts on the monthly growth rate.
Discussion
The findings from this study related to the significant relationships between school-level
poverty, school size, and the number of assessments on the monthly growth rate of student
achievement warrant further discussion. Additionally, there are implications for future research
and practice based on this study.
Relationship between Poverty Level and Student Achievement
In Part One of the assessment where students found missing parts of numbers using
counters, the school-level poverty had a positive impact on the growth rate, and students from
schools with lower socio-economic status showed statistically significant growth compared to
others. These findings must be taken with caution due to the difference in achievement at the
beginning of the study. Students in poverty and large schools were found to be significantly
lower-achieving in mathematics at the beginning of the school year, which is a possible

Formative assessment and student achievement
explanation why these students are relatively making a faster growth. A more cautious
interpretation is This finding suggests that the use of the AMC Anywhere formative assessment
tool led to growth in this disadvantaged group ofall students, and helped to decrease the
achievement gap between impoverished settings and other students.
The differences in student achievement between students from higher and lower socio-
economic settings has been noted in large-scale studies (NCES, 2013, 2014). While prior studies
have identified positive relationships between formative assessment and student achievement
(Author, 2014; Hattie, 20082011; Wiliam & Thompson, 2007), this study found statistically
significantly greater gains for impoverished students as a result of formative assessment in
mathematics. This extends earlier work done in literacy (Fuchs & Fuchs, 1986), only this study
focuses specifically on number sense with primary grades’ students. Future studies should
explicate and further detail the processes of teachers enacting formative assessment practices for
all students within classrooms to see if their decisions and actions differ depending on their
students’ abilities.
School Size and Student Achievement
In Part Two of the assessment, school size had a positive impact on the growth rate.
Larger schools were associated with higher growth rates. This finding, however, does not mean
that students in larger schools have better performance on the assessment because students in
larger schools were found to have lower initial status at the beginning of the academic year. The
higher monthly growth rate can be explained by the well-known effect that disadvantaged
schools show more growth. One possible explanation for this higher growth rate in large
schoolsfinding could be the amount of support and collaboration at larger schools, which led to a
Formative assessment and student achievement
higher fidelity of implementation of AMC Anywhere and formative assessment processes. In
prior work, researchers found that teacher collaborative structures, sometimes termed
professional learning communities, led to greater implementation of reform-based practices
(Author, 2009, 2015; Dufour, Dufour, & Eaker, 2008).
In the school districts that participated in the project, larger schools often had
mathematics-specific support, such as a mathematics facilitator or coach. These personnel
typically assist in instructional planning, and preparation for the enactment of specific practices,
including formative assessment (Author, 2015). Future work should see what specific aspects
these larger schools have that may lead to these statistically significant differences.
Number of Assessments and Student Achievement
Another noteworthy finding was the positive relationship between the number of
assessments for students and the monthly growth rate of student achievement. The implication of
these findings suggests that teachers should be encouraged to use assessments more frequently in
classroom instruction not only to better understand the student’s status of learning but also to
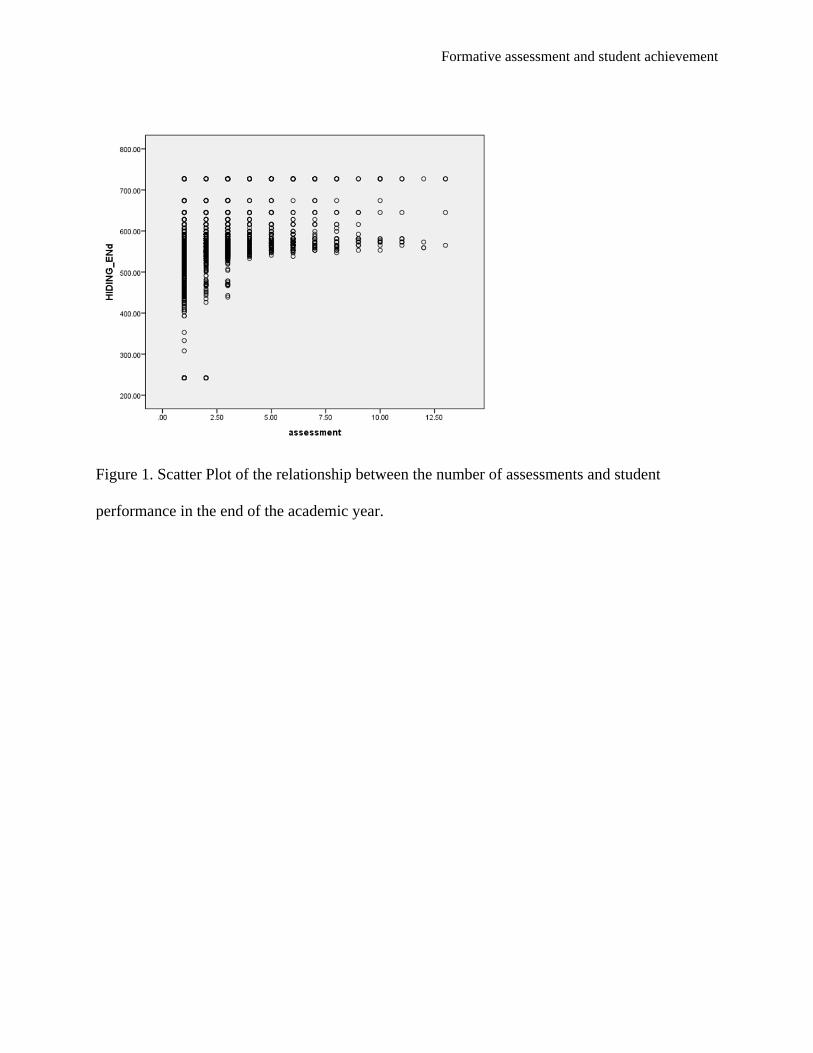
make the students aware of their own progress. This interpretation is really important because a
close examination of the frequency distribution table suggests that most of the students (99%)
were assessed less than 8 times. Students who were assessed between 8 and 13 times only
consisted of 1% of the sample. We understand that it is not only the dosage effect but the use of
formative assessment that provides feedback to the teacher that helps the students improve their
number sense. The information that the teacher gained from analysis of these formative
assessments guided their instruction and made differentiated instruction possible. A close look at
the scatter plot (Figure 1) between the number of assessment and the student performance in the
Formative assessment and student achievement
end of the academic year suggests that students who were assessed more than three times (which
is required for all teachers who participated in the professional development program) were all
above the average. While this work is similar to prior findings (Author, 2014; Wiliam &
Thompson, 2007), the significant relationship between the number of assessments, poverty level,
school size, and student achievement is novel and contributes to the knowledge base.
<Insert Figure 1 about here>
Further, the findings indicate that teachers used the AMC Anywhere formative assessment
tool more frequently for lower-performing struggling learners. We interpreted this finding as not
only the The results from this study extend those from previous work in that teachers are able to
identify those students who need more assistance in learning mathematics and give them more
frequent assessments to understand if they still need more assistance (Author, 2013, in press-a).
However, in prior work (Author, 2014), there was not statistically significant differences
between poverty level and student achievement.
Implications
Internet-based technologies continue to be purchased by state departments of education,
school districts, and schools in order to support teachers’ formative assessment practices. In this
present study, there were statistically significant relationships between the use of formative
assessment practices and primary grades students’ achievement on number sense tasks using the
internet-based tool, AMC Anywhere. Further, students from impoverished settings, larger
schools, and students who were assessed more frequently were associated with greater growth
than their peers.
Formative assessment and student achievement
While the findings are promising, there is a need for further investigation. Future research
is needed to further detail out teachers’ specific assessment practices. State-wide each
participating teacher was using standards-based mathematics curriculum, as well as Developing
Number Concepts resources to teach the Common Core State Standards in Mathematics.
Subsequent studies should examine how the combination of specific curricular resources and
formative assessment practices influence student achievement. Further, little is known about
teachers’ day-to-day process of analyzing data and making instructional decisions. While AMC
Anywhere was used a few times a year, more research is needed to examine teachers’ daily use of
more informal formative assessment practices.
Lastly, our research studies identified that despite professional development and access to
AMC Anywhere, some teachers do not use the tool much to assess their students or they
inconsistently enact formative assessment practices (Author, 2014, 2015, in press-a, in press-b).
As a result, there is a need to examine ways to best support teachers’ adoption of formative
assessment practices. For some teachers, the use of an internet-based tool, such as AMC
Anywhere, may be ambitious, and more informal, paper-based assessments may be more feasible
as a starting point for supporting teachers’ use of formative assessment processes.
Formative assessment and student achievement
References
Abrams, L.M. (2007). Implications of high-stakes testing for the use of formative classroom
assessment. In H. McMillan (Ed.), Formative assessment classroom: Theory into practice
(pp. 70-98). NY: Teachers College Press.
Andrich, D. (1978). A rating formulation for ordered response categories. Psychometrika, 43,
561-573.
Amplify (2015). MClass 3D Reading. Retrieved from:
http://www.amplify.com/assessment/mclass-reading-3d.
Author, in press.
Baroudi, Z. (2007). Formative assessment: Definition, elements and role in instructional practice.
Postgraduate Journal of Education Research, 8(1), 37-48.
Black, P. & Wiliam, D. (1998). Assessment and classroom learning. Assessment in Education, 5,
7-71.
Cizek, G. J. (2010). An introduction to formative assessment: History, characteristics, and
challenges. In H. Andrade & G. Cizek, (eds.) Handbook of formative assessment (pp. 3-
17). New York: Taylor and Francis.
Dufour, R., DuFour, R. & Eaker, R. (2008). Revisiting Professional Learning Communities at
Work: New Insights for Improving Schools. Bloomington, IN: Solution Tree Press.
Fuchs, L. S., & Fuchs, D. (1986). Effects of Systematic Formative Evaluation: A Meta-
Analysis. Exceptional Children, 53(3), 199-208.
Hattie, J. (2011). Visible learning for teachers: Maximizing impact on learning. New York:
Routledge.
Formative assessment and student achievement
Hattie, J. (2008). Visible learning: A Synthesis of Over 800 Meta-analyses on Achievement.
London: Routledge.
Heritage, M. (2007). Formative assessment: What do teachers need to know and do? Phi Delta
Kappan, 89(2), 140-145.
Hodgen, J. (2007). Formative assessment: tools for transforming school mathematics towards
dialogic practice? Paper presented at the CERME 5: Fifth Congress of the European
Society for Research in Mathematics Education. Larnaca: Cyprus.
Huinker, D. & Freckmann, J. (2009). Linking principles of formative assessment to classroom
practice. Wisconsin Teacher of Mathematics, 60(2), 6-11.
Linacre, J. M. (2012). Winsteps®(Version 3.75. 0)[Computer Software]. Beaverton, Oregon:
Winsteps. com. Retrieved January 1, 2012.
National Council of Teachers of Mathematics (2014). Principles to Action: Ensuring
Mathematical Success for All. Reston, VA: Author.
National Center for Educational Statistics (2013). The Nation’s Report Card, A First Look: 2013
Mathematics and Reading Trial Urban District Assessment. Washington, DC: Author.
National Center for Educational Statistics (2014). The Nation’s Report Card, A First Look: 2013
Mathematics and Reading. Washington, DC: Author.
National Research Council (2001). Adding it Up: Helping Children Learn Mathematics.
Washington, DC: Author.
Nye, B., Konstantopoulos, S., & Hedges, L. V. (2004). How large are teacher effects?
Educational Evaluation and Policy Analysis, 26(3), 237-257.
Pfannkuch, M. (2001). Assessment of school mathematics: Teachers’ perceptions and practices.
Mathematics Education Research Journal, 13(3), 185-203.
Formative assessment and student achievement
Raudenbush, S., & Bryk, A (2002). Hierarchical linear models: Applications and data analysis methods.
Thousand Oaks, CA: Sage.
Richardson, K. (1998). Developing Number Concepts: Counting, Comparing, and Pattern. New
York: Dale Seymour.
Richardson, K. (2012). How Children Learn Number Concepts: A Guide to the Critical Learning
Phases. Bellingham, WA: Math Perspectives.
U.S. Department of Education (USDE) (2008). Foundations for Success: The Final Report of the
National Mathematics Panel. Retrieved from:
http://www2.ed.gov/about/bdscomm/list/mathpanel/report/final-report.pdf
Wang, C., Cifarelli, V., Stephan, M., Martin, C., Pugalee, D., & Lambert, R. (2013). Assessment
practices to support mathematics learning and understanding for students. In J. Novotna
& H. Moraova (Ed.), Proceedings: Tasks and tools in elementary mathematics (pp. 331-
336). Prague, Czech Republic: International Symposium Elementary Maths Teaching.
Wiliam, D. (2007). What does research say the benefits of formative assessment are? National
Council of Teachers of Mathematics Research Brief. Retrieved from:
http://www.nctm.org/uploadedFiles/Research_News_and_Advocacy/Research/Clips_and
_Briefs/Research_brief_05_-_Formative_Assessment.pdf.
Wiliam, D. (2007/2008). Changing classroom practice. Educational Leadership, 65(4), 36-42.
William, D. (2010). An integrative summary of the research literature and implications for a new
theory of formative assessment. In H. Andrade, & G. Cizek (Eds.), Handbook of
formative assessment (pp. 18-40). New York, NY: Routledge.

Formative assessment and student achievement
Formative assessment and student achievement
Table 1
Chart Aligning the Hiding Assessment to Instructional Activities (Used with permission from
Richardson, 2012)
Independent Activities for Needs Instruction (I) To 6 To 10
2:2-14 Number Arrangements: Using Cubes X X
2:2-15 Number Arrangements: Using Color Tiles X X
2:2-16 Number Arrangements: Using Toothpicks X X
2:2-17 Number Arrangements: Using Collections X X
2:2-18 Counting Boards: Making Up Number-Combinations Stories X X
2:2-20 Number Shapes: Using Number Cubes X X
2:2-21 Number Shapes: Using Spinners X X
Formative assessment and student achievement
Table 2
Descriptive Statistics for Student Performance on Hiding Assessment
Note. Numbers in parentheses are standard deviations.
Part One (Initial)
Part One (Final)
Part Two (Initial)
Part Two (Final)
Prior-Year 447.55 (66.96) 587.81 (76.17) 458.32 (65.72) 586.63 (70.58) Treatment 439.59 (60.07) 570.88 (65.52) 450.68 (61.25) 571.49 (67.35) Comparison 441.16 (70.26) 560.61 (71.87) 453.51 (68.23) 559.74 (72.61)
Formative assessment and student achievement
Table 32
Estimation of Fixed Effects for HLM4 of Hiding Assessment
Part One Part Two
Level Estimate SE df Estimate SE df
Intercept 1 411.62 13.00*** 135 453.87 13.18*** 150
Assessment 2 -10.03 2.71*** 2557 -9.64 3.34** 2340
Mean_Assess 3 4.36 4.66 34 0.87 6.77 37
Group 3 -32.07 10.23** 34 -34.03 11.16** 37
Size 4 -0.01 0.02 135 -0.05 0.02** 150
Poverty 4 -1.94 0.31*** 135 -1.42 0.33*** 150
Slope 1 11.58 1.27*** 2912 7.30 1.46*** 1664
Assessment 2 0.45 0.32 2912 0.97 0.42* 1664
Mean_Assess 3 0.78 0.30** 2912 0.62 0.47 1664
Group 3 0.90 0.62 2912 0.21 0.72 1664
Size 4 0.001 0.002 2912 0.008 0.002*** 1664
Poverty 4 0.05 0.02** 2912 0.01 0.02 1664
Note. **p < .01; ***p < .001.
Formative assessment and student achievement
Figure 1. Scatter Plot of the relationship between the number of assessments and student
performance in the end of the academic year.