the influence of leadership competencies on sustainable
TRANSCRIPT
Journal of Public Administration and Governance
ISSN 2161-7104
2017, Vol. 7, No. 3
http://jpag.macrothink.org 246
The Influence of Leadership Competencies on
Sustainable Funding of Local Non-Governmental
Organizations in Uganda
Paul Kyalimpa (Corresponding Author)
Institute of Management Sciences, Mbarara University of Science, and Technology
PO Box 1410, Mbarara, Uganda.
E-mail: [email protected]
John Baptist Asiimwe
Bishop Stuart University, 09, Mbarara, Uganda.
Fulufhelo Godfrey Netswera & Edward Malatse Rankhumise
Tshwane University of Technology, Pretoria, South Africa.
Received: August 1, 2017 Accepted: August 18, 2017 Online published: September 8, 2017
doi:10.5296/jpag.v7i3.11824 URL: https://doi.org/10.5296/jpag.v7i3.11824
Abstract
Introduction. When a leader with a vision launches a Local Non-Governmental Organization
(LNGO or NGO), the NGO’s motivation and decision-making often become intertwined with
the leader’s personality and character to the effect that it may collapse when the NGO leader
departs. Uganda has a higher percentage of NGOs inactivity and mortality due to
unsustainable funding. Therefore, this study investigated the influence of NGO leadership
competencies on sustainable funding of NGOs.
Methods. This study utilized a descriptive correlation design. A proportionate stratified
sample of 103 NGOs was obtained and their leaders were interviewed using self-administered
questionnaires. Records reviews were conducted to obtain data on NGO funding.
Results. This study found a 90.1% to 100% agreement by participants on possession of the
various leadership competencies by the NGO leaders. A marked rise in NGO incomes from
all sources was recorded between 2010 and 2014, with external donors, local donors, and
Journal of Public Administration and Governance
ISSN 2161-7104
2017, Vol. 7, No. 3
http://jpag.macrothink.org 247
own income accounting for 67%, 13.5%, and 19.5% of the total funds, respectively. The
average donor-dependency ratio and survival ratio over the 5 year period was 80.54% and
71.216 days respectively. The NGO leader understanding and working with whatever
resources that are available (β=-9.802, P=.002) and spearheading the implementation of
major investment decisions (β=15.720, P=.004) were the only competencies found to be
statistically significant predictors of NGO financial sustainability.
Recommendations. Government funding of NGOs, prioritization of Income Generating
Activities and capacity building of NGO leaders in effective and efficient resource utilization
and investment by NGOs, are crucial to NGO Survival.
Keywords: Leadership Competencies, Sustainable Funding, Local NGOs
1. Introduction
The last decade has been marked by an increased involvement of NGOs in the development
process due to the failure of development assistance to governments of poor countries, to
generate growth or to reach the poor. On the other hand, the success of non-governmental
initiatives, especially the Grameen Bank in Bangladesh put forward as a model, has been put
forth in development circles as an illustration of NGO potential to better deliver the
much-needed development to the poor (Barr, Fafchamps, & Owens, 2003). In the African
continent where governments' capacity and revenue are often very limited to deliver the
much-needed services to the public, NGOs play a pivotal role to poverty alleviation.
Despite the above contribution, the NGO sector remains highly dependent on external donor
funding. The findings of the NGO Sustainability Index for Sub-Sahara Africa (2009) revealed
that while NGOs' ability to provide service to underserved populations had the highest score
in all 19 countries sampled in Africa including Uganda, funding sustainability was the
weakness. A common issue for many NGOs in sub-Sahara Africa, Uganda at the heart, is
reliance on a single, external source for funding. While reliance on the external source of
funding is reflective of the wider economic context of African countries, in this situation, if
international funding were to disappear, many of the NGOs would collapse (USAID, 2010).
Imperative to note is that scholars on the sustainability of NGOs, including Manyeruke
(2012), concurred that sustainable funding remained one of the major challenges that NGOs
in Africa faced and will continue to face in the next decade.
A study by the Office of the Prime Minister in 2003 about the NGO sector in Uganda found
that between 15-30% of the NGOs that register go operational (Barr, Fafchamps & Owens
2003). This was attributed to failure to successfully mobilize funding to commence
operations. An NGO funding sustainability is paramount as it enables it to survive so that it
can continue to serve its citizenry. This means that an organization will be able to fulfill
commitments to “its clients, its patrons, and the community in which it operates” so that the
groups who depend on it can “place their trust in that commitment” (Weerawardena et al.,
2009, p. 2). The research findings on the role of Non-Governmental Organizations (NGOs) in
social development in Uganda revealed that the major limitations of NGOs’ Contribution to
Development are inadequate funding of NGO Activities, NGO dependency on external donor

Journal of Public Administration and Governance
ISSN 2161-7104
2017, Vol. 7, No. 3
http://jpag.macrothink.org 248
funding and non-sustainability of NGO activities (Wamai, Walera, and Wamai, 2007).
Additionally, the study findings of NORAD (2002), indicated that the character and role of
the majority of NGOs in Uganda are influenced by among other factors such as availability of
funds and interests of funders/donors. In Uganda, availability of donor funds is a stronger pull
factor for individuals starting an NGO and has a more dominant influence on sustainability
(Sanjeev, Powell & Yang, 2006). In such situations, if international funding were to disappear,
many of the NGOs would collapse.
In the study of NGO sustainability, it is imperative to consider the influence of organizational
mission and leadership, which are central concepts in the description of NGOs (Burger &
Owens, 2012). NGOs mission and drive have been found to be intimately linked to
charismatic leadership to the extent that when an individual launches an NGO, the
organization’s motivation and decision-making often become so intimately intertwined with
the leader’s personality and character to the effect that the NGO may collapse when the
leader departs (Burger & Owens 2012; Sooryamoorthy & Gangrade, 2001). Research in
leadership has established typical competencies commonly associated with NGO leaders and
these include the ability of a leader to initiate, communicate, and implement a mission and
vision, fundraising, staff empowerment and responsiveness to changing the environment
(Burger & Owens, 2012; Sooryamoorthy & Gangrade 2001). According to research
conducted in the UK, NGO leaders exhibited an unusually broad range of competencies
compared to leaders in the public and private sectors (Bolton & Abdy, 2003).
Despite the fact that, little research has been conducted to link leadership competencies and
financial sustainability, there have been some efforts to promote leadership competence
development by many international NGOs. For example, the International Federation of the
Red Cross and Save the Children Alliance have created assessment tools that try to capture
leadership competencies based on the individual leader’s ability to envision (create and
communicate individual strategy), enable (identify and apply appropriate tools, processes,
and people), empower (develop effective teams), and energize (communicate and inspire)
through personal leadership (Hailey, 2006). In addition, there have been interventions geared
towards developing a new generation of NGO leaders that among other will foster
sustainability. This is reflected by the increasing investment of international development
agencies such as Save the Children Fund, Organization Development Department of the
International Federation of the Red Cross, CARE International, and a consortium of
US-based NGOs in Leadership Development Programs (LDPs) (James, 2005a; Hailey &
James 2004; Lewis 2001). These interventions though limited, point to increasing funding for
leadership competence development as well as a growing awareness of the importance of
developing the role and skills of NGO leaders.
Despite their prominent role and capacity building interventions on leadership, no research
has been done on the competencies that affect the survival of NGOs and the influence that
their leadership exerts towards their sustainability. Because of the limited reach on the
survival of NGOs and influence of leadership, existing literature also reveals that the work
that does exist is piecemeal and based on case studies (Burger & Owens, 2012). Specifically,
there is no empirical evidence on the competencies of NGO leaders in Uganda and the extent
Journal of Public Administration and Governance
ISSN 2161-7104
2017, Vol. 7, No. 3
http://jpag.macrothink.org 249
to which these competencies influence their sustainable funding. This research, therefore,
investigated the competencies of NGO leaders and the extent to which they influence
sustainable funding as a step towards reducing the high level of donor dependency that makes
Uganda's NGO sector very fragile and poses a threat to the sustainability of its activities.
2. Methods
2.1 Sample and Procedure
The survey was conducted among NGOs from all the four regions of Uganda over a
three-month period (August to November 2016). Five hundred and seventy-two (572) NGOs
who were registered as of November 2016 with Uganda National NGO Forum (UNNGOF)
database formed the study population. The Uganda National NGO Forum database is the only
umbrella forum that is independent, inclusive and a coordinating national platform for all
registered NGOs and their members are from all the various programmatic sectors, and
regions of the country and membership is voluntary. For studying smaller target populations,
with a sample size of less than 1000, Mugenda and Mugenda (2003) recommends a sample
size of at least 10% of the total target population as satisfactory, although, for comprehensive
data analysis and large statistical power, this can range from 10% to 30% or even larger. This
study utilized a sample size of 103 NGOs, which constituted about 18% of the study
population (572). Using the four regions as strata, proportionately stratified sampling
procedures were used to distribute the sample size above, depending on the percent
registration of NGOs per region on the UNNGOF database. To carter for the non-response
rate, five (5) extra NGOs per region were randomly selected and invited to participate in the
study.
During the data collection phase, the research assistants were trained in the administration of
this study research tool. At the NGO site, the research assistant gave a self-administered
semi-structured questionnaire to the NGO leaders (study participants) after introducing the
study to them and obtaining consent from them. Those selected to participate in this study
were senior staff who knew the financial status of the organizations and these included
executive directors, program managers, and finance managers. Senior staff members who
were not available during the period of the study, such as those on leave (maternity, sick, and
study) were not included in the study. The research assistant also obtained consent from NGO
leaders to access the financial records in the finance sections/departments, in order to fill in
the financial aspects of the questionnaire. Records that were reviewed included the audit
reports, annual financial performance reports, and signed contracts. Approval to conduct this
study was obtained from Mbarara University institutional research review board.
2.2 Rigor
The questionnaire was pretested with a selected pilot group of ten (10) NGO representatives.
Feedback from the pre-test was used to improve the design of the final tools for this study. In
reliability analyses, internal consistency of the tool was evaluated using Cronbach alpha
(Table 1). Alpha values of 0.7 or higher were considered acceptable (Sweet & Martin, 2008).
Where alpha was below 0.7, items were deleted based on their ability to increase the alpha
Journal of Public Administration and Governance
ISSN 2161-7104
2017, Vol. 7, No. 3
http://jpag.macrothink.org 250
values above 0.7. Item analyses were also conducted testing each item’s association with
other items (inter- item correlations-IIC) and with the total item scores (corrected item total
correlations-ITC). The findings of this study were based on 23 items, with an overall
Cronbach alpha of .857 and MIIC of .212 (Table 1).
Table 1. Internal Consistency and Measurement Properties of Items
Competencies Item
(N)
MIIC Cronbach’s
α
NIIC>0.30
Overall 23 .212 .857 19
Strategic, Financial and Investment Planning
Considerations
3 .629 .834 3
Investment Considerations 2 .716 .834 2
Fundraising Strategy Considerations 2 .739 .850 2
Income Diversification Considerations 2 .655 .791 2
Funding Partners 2 .661 .795 2
Income Generating Activities 2 .753 .859 2
Responsiveness 4 .646 .879 4
Attributes of NGO Leader 2 .548 .707 2
Empowerment 2 .3955 .667 2
Motivation of Staff 2 .611 .755 2
Note. Mean inter-item correlation (MIIC), Inter- item correlations-IIC, number of items with
NIIC>0.30 (positive correlation of 0.30 or more are desirable). For items less than 10,
Cronbach alpha could be smaller and thus the MIIC (acceptable range, 0.2-0.4) is a better
measure of internal consistency.
2.3 Measures
2.3.1 Dependent variables
Lewis (2009) lays down financial measures NGOs could use to measure financial
sustainability and those used in this study included dependency ratios and survival ratios
(Sharma, 2012). The donor dependency Ratio is a measure of the organization’s donor
income to the total income generated during the year. In this study, a higher NGO donor
dependency ratio was interpreted as that NGO being financially unsustainable and vice versa
and this was calculated as follows: Donor Income/Total Income* 100 (Results expressed in
percentages (%). On the other hand, survival ratios are an indicator of how long an
organization can survive if all its funds are dried up and there are no donations received
during the year (Sharma, 2012) and the higher the NGO survival ratio, the higher likelihood
that the NGO is financially sustainable and vice versa. Survival ratios were calculated as
follows: General Reserves/Total Income*52 or 365 (Results expressed in days). In addition,
the total average income computed from local donors, external donors, and income
generating activities (IGA) incomes of NGOs were also examined in this study as a measure
of financial sustainability. This outcome was interpreted as the higher the income an NGO
obtained from all sources over a period of five years, the more likely that organization was
sustainable and vice versa.
Journal of Public Administration and Governance
ISSN 2161-7104
2017, Vol. 7, No. 3
http://jpag.macrothink.org 251
2.3.2 Independent Variables
The first group of independent variables was the leadership competencies. Participants were
requested to rate their level of agreement with statements regarding various categories of
competencies: Strategic, financial and Investment planning considerations (6 items),
investment considerations (3 items), fundraising strategy considerations (3 items), Income
diversification considerations (3 items), funding partners (3 items), income generating
activities (3 items), responsiveness (4 items), attributes of NGO leader (3 items),
empowerment (3 items), motivation of Staff (3 items), and teamwork (3 items). As shown in
table 1, the final items analyzed were 23. Response alternatives were recorded and entered as
follows: To a very great extent= 5, to a great extent=4, to a moderate extent=3, to a little
extent=2, not at all=1. High values indicated a highly held opinion about how the
Participants perceived NGO leader’s competencies in their respective NGOs’.
The second group of independent variables was the NGO and participant characteristics.
These groups of variables were included in multivariate analyses to control for spurious
relationships that may have occurred between leadership competencies and financial
sustainability measures. These variables were measured at the nominal and ordinal level and
are shown in Table 2.
2.4 Data Analysis
Data was entered and analyzed using SPSS (vs 20). Preliminary analyses were conducted to
ensure no violation of the assumptions of normality, linearity, multicollinearity, and
homoscedasticity. However, dependent variables were skewed, even after log transformation,
but due to a large sample size (n=103), parametric tests were conducted.
Frequencies and percentages were calculated for each of the categorical variables. The
relationship between the leadership competencies and sustainable funding measures were
examined using Pearson product-moment correlation coefficient. A correlation of 0.30 or
above was considered a “good correlation” and a correlation above 0.4 was considered “a
strong correlation” (Sweet & Martin, 2008). Correlations reported were significant at 0.05 or
0.01.
Independent Variables that significantly correlated with the dependent variables were entered
into bivariate linear regression in order to obtain the explanatory and predictive power of
each of the independent on dependent variables. The explanatory power of the
model/independent variables on the dependent variables was presented as an adjusted R
square (R2). Meanwhile, the predictive power of the independent variables on the dependent
variables was presented as unstandardized coefficients (β). Coefficients reported were
significant at 0.05 or 0.01.
Independent variables that were significant in bivariate linear regression were entered into the
standard multivariate linear regression to establish the final independent variables that have
an influence on financial sustainability measures. Variables that were not significant in the
regression model were eliminated until a final model with all the variables significant was
obtained.
Journal of Public Administration and Governance
ISSN 2161-7104
2017, Vol. 7, No. 3
http://jpag.macrothink.org 252
3. Results
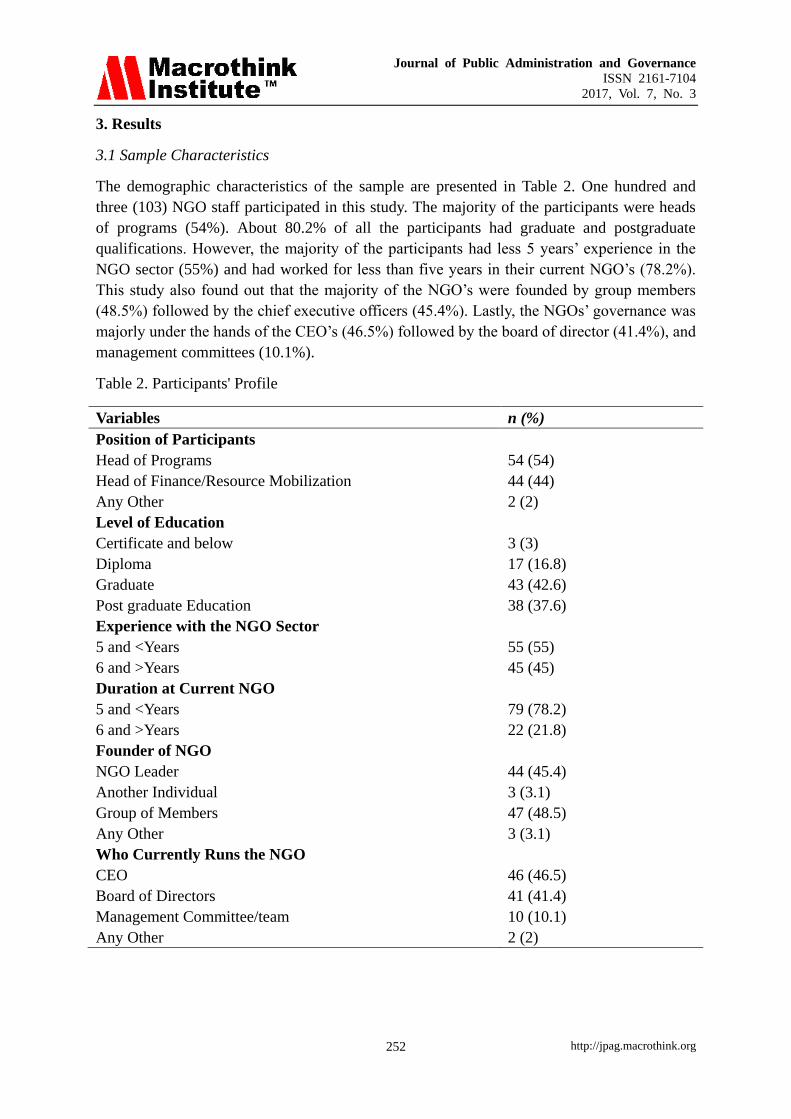
3.1 Sample Characteristics
The demographic characteristics of the sample are presented in Table 2. One hundred and
three (103) NGO staff participated in this study. The majority of the participants were heads
of programs (54%). About 80.2% of all the participants had graduate and postgraduate
qualifications. However, the majority of the participants had less 5 years’ experience in the
NGO sector (55%) and had worked for less than five years in their current NGO’s (78.2%).
This study also found out that the majority of the NGO’s were founded by group members
(48.5%) followed by the chief executive officers (45.4%). Lastly, the NGOs’ governance was
majorly under the hands of the CEO’s (46.5%) followed by the board of director (41.4%), and
management committees (10.1%).
Table 2. Participants' Profile
Variables n (%)
Position of Participants
Head of Programs 54 (54)
Head of Finance/Resource Mobilization 44 (44)
Any Other 2 (2)
Level of Education
Certificate and below 3 (3)
Diploma 17 (16.8)
Graduate 43 (42.6)
Post graduate Education 38 (37.6)
Experience with the NGO Sector
5 and <Years 55 (55)
6 and >Years 45 (45)
Duration at Current NGO
5 and <Years 79 (78.2)
6 and >Years 22 (21.8)
Founder of NGO
NGO Leader 44 (45.4)
Another Individual 3 (3.1)
Group of Members 47 (48.5)
Any Other 3 (3.1)
Who Currently Runs the NGO
CEO 46 (46.5)
Board of Directors 41 (41.4)
Management Committee/team 10 (10.1)
Any Other 2 (2)

Journal of Public Administration and Governance
ISSN 2161-7104
2017, Vol. 7, No. 3
http://jpag.macrothink.org 253
3.2 NGO Characteristics
The majority of NGOs’ were local by nature (73.5%) and from western Uganda (35.3%, See
Table 3). About 89.2% of the NGOs had less than four programmatic areas of operations. On
the other hand, 88.2% and 85.3% of the NGOs’ surveyed had active strategic and financial
plans respectively. Unfortunately, a bare majority of NGOs’ (55.4%) had a fundraising
strategy to support their financial plans. When it came to the question, of either, the NGO
invests or not and whether it has an investment plan or not, only 50% and 21.9% of the
NGOs’ invested and had an investment plan respectively. On a positive note, among those
NGOs with plans and strategies mentioned in this section, 81.1%, 74.7%, 75.9%, and 73.3%
had long-term strategic plans, financial plans, fundraising strategy, and investment plans
respectively.
Table 3. NGO Characteristics
Variables n (%)
Type of NGO
Trust 2 (2)
Private Voluntary Organization (PVO) 8 (7.8)
Local NGO 75 (73.5)
National NGO (all Regions) 12 (11.8)
Local & International 5 (4.9)
Region
Central 13 (12.7)
North 25 (24.5)
East 11 (10.8)
West 36 (35.3)
Four regions 13 (12.7)
2 and 3 regions 4 (3.9)
No. of Thematic Areas/ Programmatic Sectors
1-2 39 (38.2)
3-4 52 (51)
5+ 11 (10.8)
Presence of an Active Strategic Plan
Yes 90 (88.2)
No 12 (11.8)
Duration of the Strategic Plan
1-2 years "Short term" 2 (2.2 )
3-4 years "Medium term" 5 (5.6)
5 and above "Long term" 73 (81.1)
Expired 10 (11.1)
Presence of Financial Plan
Yes 87 (85.3)
No 15 (14.7)

Journal of Public Administration and Governance
ISSN 2161-7104
2017, Vol. 7, No. 3
http://jpag.macrothink.org 254
Duration of the Financial Plan
1-2 years "Short term" 8 (9.6)
3-4 years "Medium term" 5 (6.0)
5 and above "Long term" 62 (74.7)
Expired 7 (8.4)
Presence of a Fundraising Strategy
Yes 56 (55.4)
No 45 (44.6)
Duration of the financial strategy
1-2 years "Short term" 3 (5.6)
3-4 years "Medium term" 4 (7.4)
5 and above "Long term" 41(75.9)
Expired 2 (3.7)
If NGO Invests
Yes 51 (50)
No 51 (50)
Presence of Investment Plan
Yes 21 (21.9)
No 75 (78.1)
Duration of the investment plan
1-2 years "Short term" 2 (13.3)
3-4 years "Medium term" 2 (13.3)
5 and above "Long term" 11 (73.3)
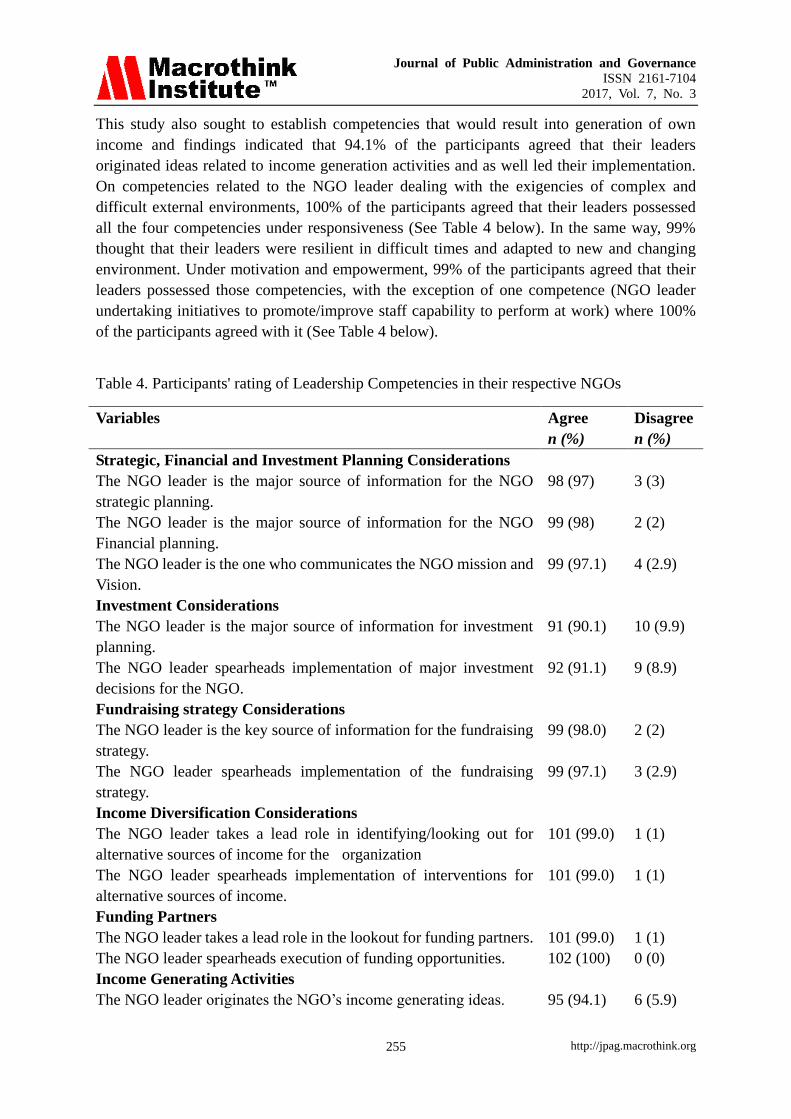
3.3 NGO Leadership Competences
This study sought to explore the participants’ perception of the leadership competencies that
the various NGO leaders possessed. Details of the findings are summarized in Table 4.
Findings indicated that the majority of the participants agreed that their NGO leaders were
the major source of information on strategic planning (97%), financial planning (98%), and
were the ones who majorly communicated the NGO mission and Vision (97.1%).
Nevertheless, this study found lower percentages of participants who agreed on investment
considerations competencies, where 90.1% and 91.1% of the participants thought their NGO
leaders were a source of information on investment and were the ones who spearheaded the
implementation of the major investment decisions for their NGOs’ respectively. Among the
organizations with a fundraising strategy, the majority of respondents agreed that their NGO
leaders were, also, a major source of that strategy (98%) and led its implementation (97.1%).
On issues related to funding, nearly 99% of the participants concurred with the fact that their
NGO leaders’ were responsible for finding and implementing alternative sources of income.
Similarly, there was a strong agreement on competencies related to funding partners where
the NGO leader took lead in looking out for funding partners (99%) and led the execution of
funding opportunities (100%).
Journal of Public Administration and Governance
ISSN 2161-7104
2017, Vol. 7, No. 3
http://jpag.macrothink.org 255
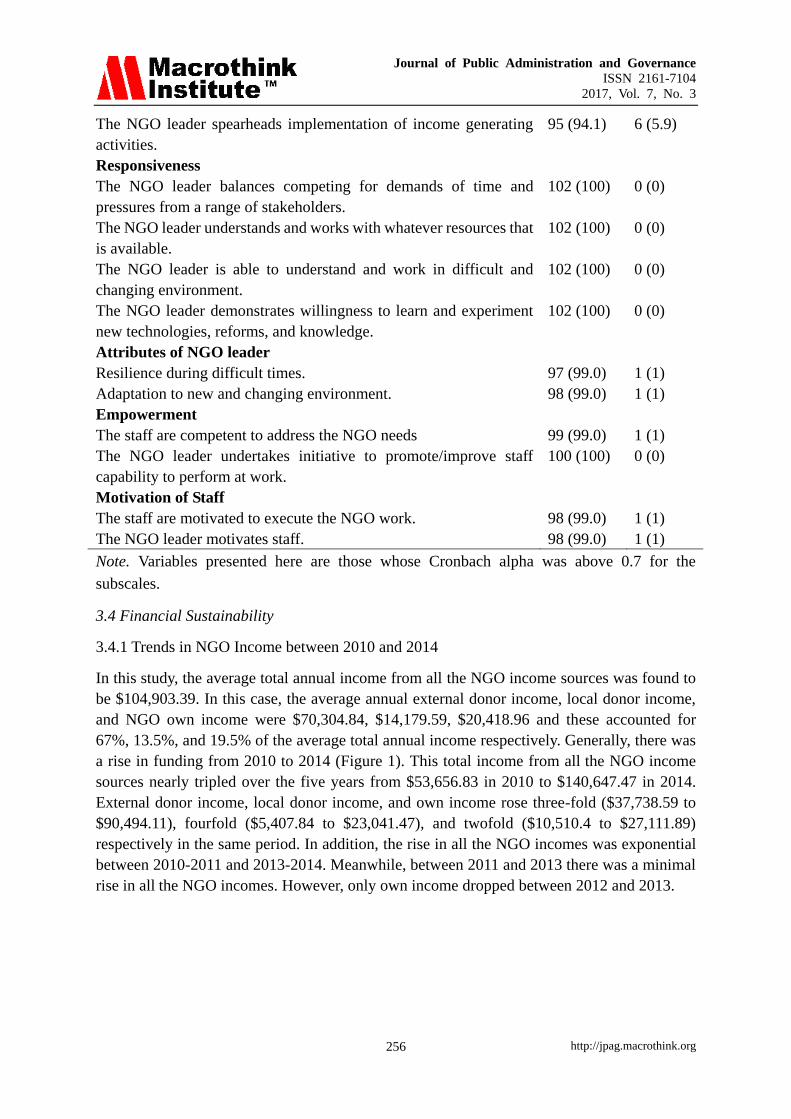
This study also sought to establish competencies that would result into generation of own
income and findings indicated that 94.1% of the participants agreed that their leaders
originated ideas related to income generation activities and as well led their implementation.
On competencies related to the NGO leader dealing with the exigencies of complex and
difficult external environments, 100% of the participants agreed that their leaders possessed
all the four competencies under responsiveness (See Table 4 below). In the same way, 99%
thought that their leaders were resilient in difficult times and adapted to new and changing
environment. Under motivation and empowerment, 99% of the participants agreed that their
leaders possessed those competencies, with the exception of one competence (NGO leader
undertaking initiatives to promote/improve staff capability to perform at work) where 100%
of the participants agreed with it (See Table 4 below).
Table 4. Participants' rating of Leadership Competencies in their respective NGOs
Variables Agree
n (%)
Disagree
n (%)
Strategic, Financial and Investment Planning Considerations
The NGO leader is the major source of information for the NGO
strategic planning.
98 (97) 3 (3)
The NGO leader is the major source of information for the NGO
Financial planning.
99 (98) 2 (2)
The NGO leader is the one who communicates the NGO mission and
Vision.
99 (97.1) 4 (2.9)
Investment Considerations
The NGO leader is the major source of information for investment
planning.
91 (90.1) 10 (9.9)
The NGO leader spearheads implementation of major investment
decisions for the NGO.
92 (91.1) 9 (8.9)
Fundraising strategy Considerations
The NGO leader is the key source of information for the fundraising
strategy.
99 (98.0) 2 (2)
The NGO leader spearheads implementation of the fundraising
strategy.
99 (97.1) 3 (2.9)
Income Diversification Considerations
The NGO leader takes a lead role in identifying/looking out for
alternative sources of income for the organization
101 (99.0) 1 (1)
The NGO leader spearheads implementation of interventions for
alternative sources of income.
101 (99.0) 1 (1)
Funding Partners
The NGO leader takes a lead role in the lookout for funding partners. 101 (99.0) 1 (1)
The NGO leader spearheads execution of funding opportunities. 102 (100) 0 (0)
Income Generating Activities
The NGO leader originates the NGO’s income generating ideas. 95 (94.1) 6 (5.9)
Journal of Public Administration and Governance
ISSN 2161-7104
2017, Vol. 7, No. 3
http://jpag.macrothink.org 256
The NGO leader spearheads implementation of income generating
activities.
95 (94.1) 6 (5.9)
Responsiveness
The NGO leader balances competing for demands of time and
pressures from a range of stakeholders.
102 (100) 0 (0)
The NGO leader understands and works with whatever resources that
is available.
102 (100) 0 (0)
The NGO leader is able to understand and work in difficult and
changing environment.
102 (100) 0 (0)
The NGO leader demonstrates willingness to learn and experiment
new technologies, reforms, and knowledge.
102 (100) 0 (0)
Attributes of NGO leader
Resilience during difficult times. 97 (99.0) 1 (1)
Adaptation to new and changing environment. 98 (99.0) 1 (1)
Empowerment
The staff are competent to address the NGO needs 99 (99.0) 1 (1)
The NGO leader undertakes initiative to promote/improve staff
capability to perform at work.
100 (100) 0 (0)
Motivation of Staff
The staff are motivated to execute the NGO work. 98 (99.0) 1 (1)
The NGO leader motivates staff. 98 (99.0) 1 (1)
Note. Variables presented here are those whose Cronbach alpha was above 0.7 for the
subscales.
3.4 Financial Sustainability
3.4.1 Trends in NGO Income between 2010 and 2014
In this study, the average total annual income from all the NGO income sources was found to
be $104,903.39. In this case, the average annual external donor income, local donor income,
and NGO own income were $70,304.84, $14,179.59, $20,418.96 and these accounted for
67%, 13.5%, and 19.5% of the average total annual income respectively. Generally, there was
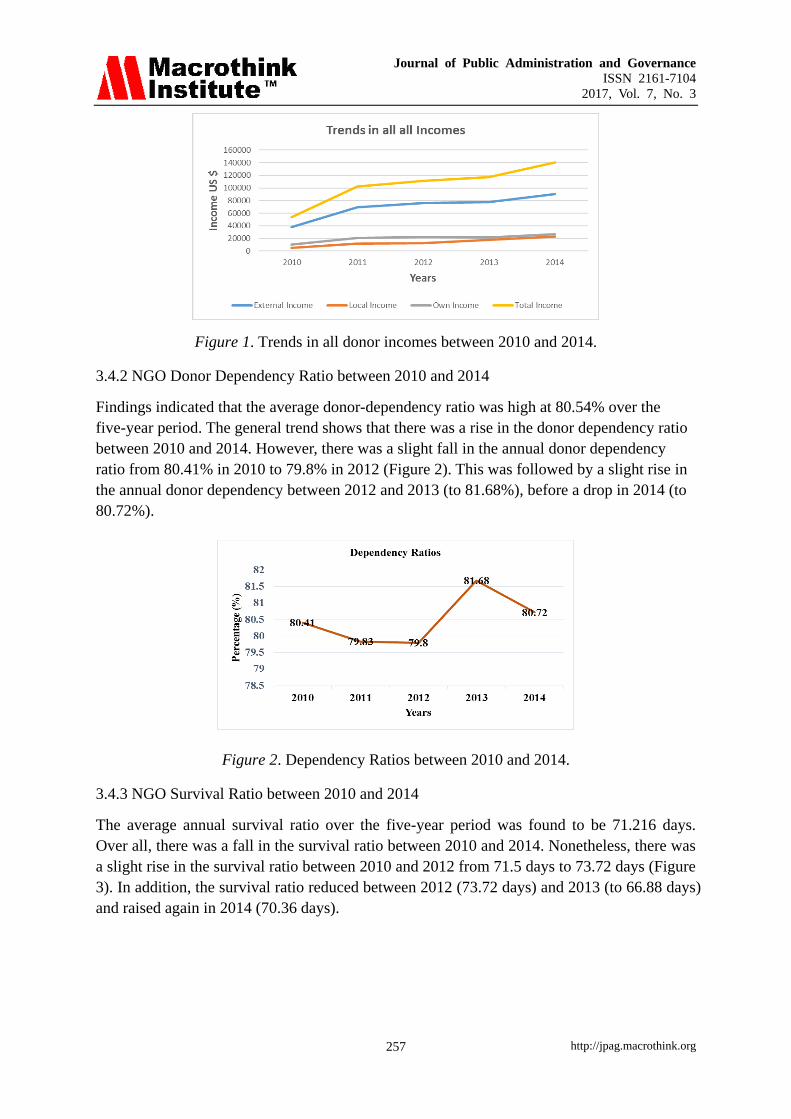
a rise in funding from 2010 to 2014 (Figure 1). This total income from all the NGO income
sources nearly tripled over the five years from $53,656.83 in 2010 to $140,647.47 in 2014.
External donor income, local donor income, and own income rose three-fold ($37,738.59 to
$90,494.11), fourfold ($5,407.84 to $23,041.47), and twofold ($10,510.4 to $27,111.89)
respectively in the same period. In addition, the rise in all the NGO incomes was exponential
between 2010-2011 and 2013-2014. Meanwhile, between 2011 and 2013 there was a minimal
rise in all the NGO incomes. However, only own income dropped between 2012 and 2013.
Journal of Public Administration and Governance
ISSN 2161-7104
2017, Vol. 7, No. 3
http://jpag.macrothink.org 257
Figure 1. Trends in all donor incomes between 2010 and 2014.
3.4.2 NGO Donor Dependency Ratio between 2010 and 2014
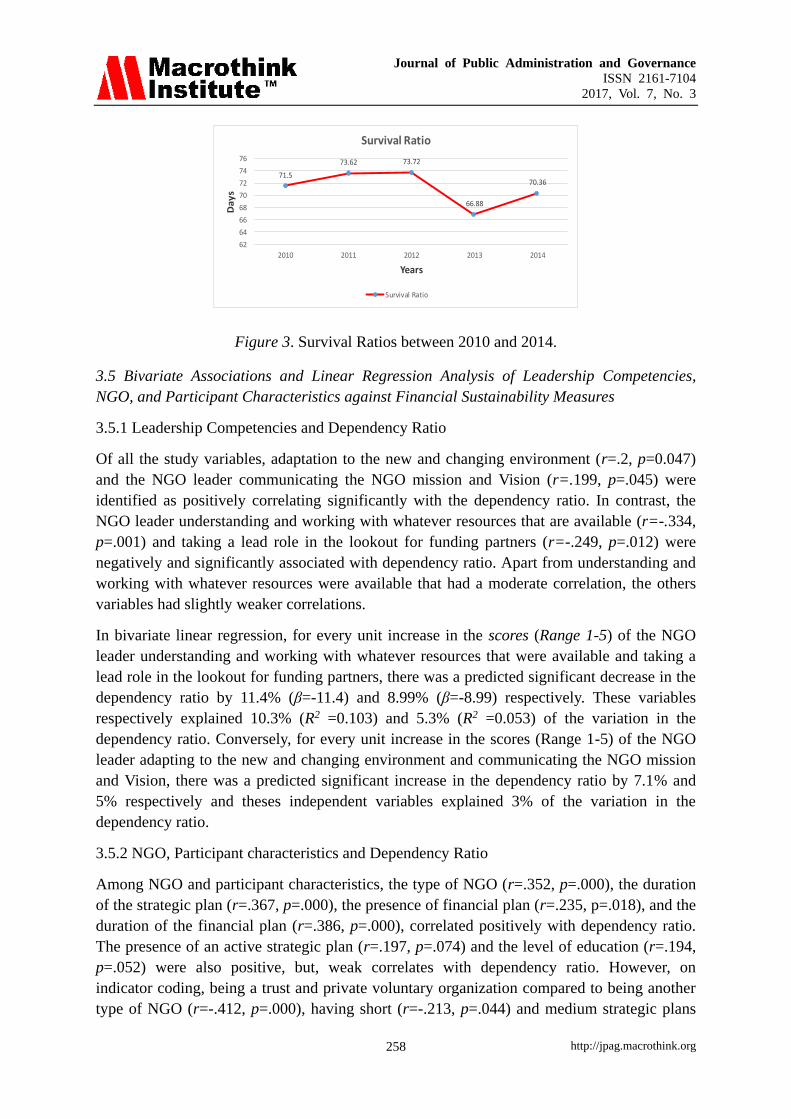
Findings indicated that the average donor-dependency ratio was high at 80.54% over the
five-year period. The general trend shows that there was a rise in the donor dependency ratio
between 2010 and 2014. However, there was a slight fall in the annual donor dependency
ratio from 80.41% in 2010 to 79.8% in 2012 (Figure 2). This was followed by a slight rise in
the annual donor dependency between 2012 and 2013 (to 81.68%), before a drop in 2014 (to
80.72%).
Figure 2. Dependency Ratios between 2010 and 2014.
3.4.3 NGO Survival Ratio between 2010 and 2014
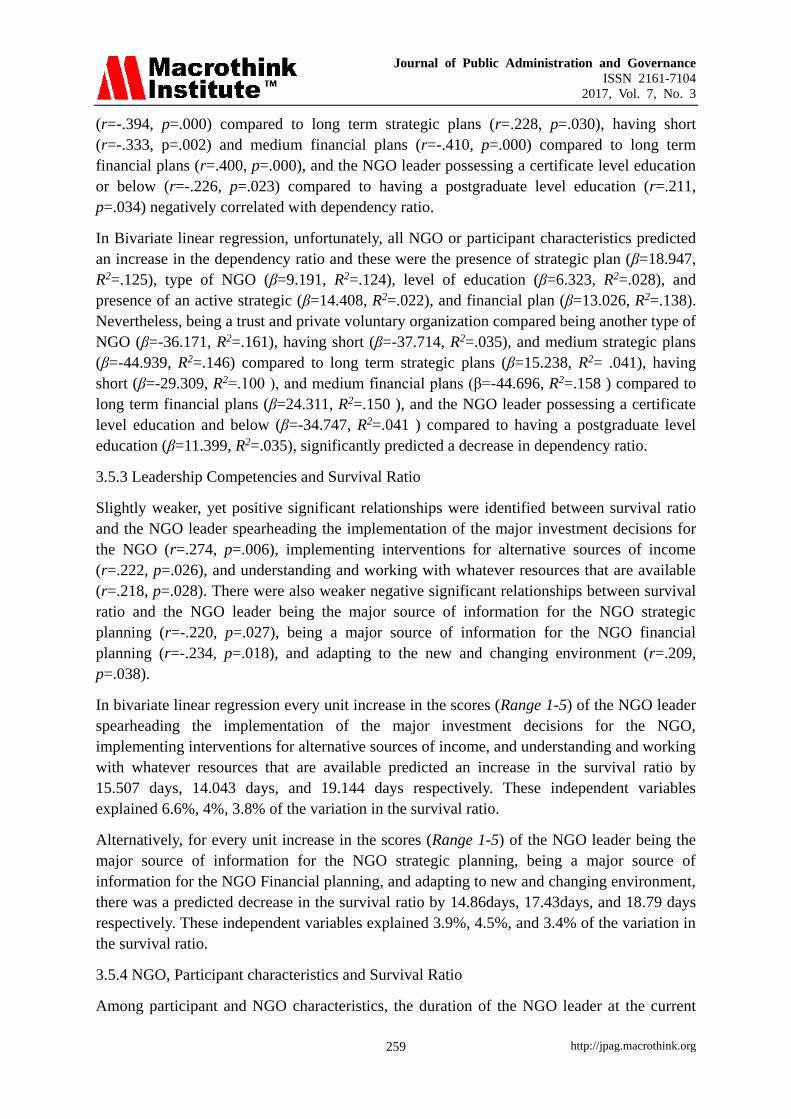
The average annual survival ratio over the five-year period was found to be 71.216 days.
Over all, there was a fall in the survival ratio between 2010 and 2014. Nonetheless, there was
a slight rise in the survival ratio between 2010 and 2012 from 71.5 days to 73.72 days (Figure
3). In addition, the survival ratio reduced between 2012 (73.72 days) and 2013 (to 66.88 days)
and raised again in 2014 (70.36 days).
Journal of Public Administration and Governance
ISSN 2161-7104
2017, Vol. 7, No. 3
http://jpag.macrothink.org 258
71.5
73.62 73.72
66.88
70.36
62
64
66
68
70
72
74
76
2010 2011 2012 2013 2014
Da
ys
Years
Survival Ratio
Survival Ratio
Figure 3. Survival Ratios between 2010 and 2014.
3.5 Bivariate Associations and Linear Regression Analysis of Leadership Competencies,
NGO, and Participant Characteristics against Financial Sustainability Measures
3.5.1 Leadership Competencies and Dependency Ratio
Of all the study variables, adaptation to the new and changing environment (r=.2, p=0.047)
and the NGO leader communicating the NGO mission and Vision (r=.199, p=.045) were
identified as positively correlating significantly with the dependency ratio. In contrast, the
NGO leader understanding and working with whatever resources that are available (r=-.334,
p=.001) and taking a lead role in the lookout for funding partners (r=-.249, p=.012) were
negatively and significantly associated with dependency ratio. Apart from understanding and
working with whatever resources were available that had a moderate correlation, the others
variables had slightly weaker correlations.
In bivariate linear regression, for every unit increase in the scores (Range 1-5) of the NGO
leader understanding and working with whatever resources that were available and taking a
lead role in the lookout for funding partners, there was a predicted significant decrease in the
dependency ratio by 11.4% (β=-11.4) and 8.99% (β=-8.99) respectively. These variables
respectively explained 10.3% (R2 =0.103) and 5.3% (R2 =0.053) of the variation in the
dependency ratio. Conversely, for every unit increase in the scores (Range 1-5) of the NGO
leader adapting to the new and changing environment and communicating the NGO mission
and Vision, there was a predicted significant increase in the dependency ratio by 7.1% and
5% respectively and theses independent variables explained 3% of the variation in the
dependency ratio.
3.5.2 NGO, Participant characteristics and Dependency Ratio
Among NGO and participant characteristics, the type of NGO (r=.352, p=.000), the duration
of the strategic plan (r=.367, p=.000), the presence of financial plan (r=.235, p=.018), and the
duration of the financial plan (r=.386, p=.000), correlated positively with dependency ratio.
The presence of an active strategic plan (r=.197, p=.074) and the level of education (r=.194,
p=.052) were also positive, but, weak correlates with dependency ratio. However, on
indicator coding, being a trust and private voluntary organization compared to being another
type of NGO (r=-.412, p=.000), having short (r=-.213, p=.044) and medium strategic plans
Journal of Public Administration and Governance
ISSN 2161-7104
2017, Vol. 7, No. 3
http://jpag.macrothink.org 259
(r=-.394, p=.000) compared to long term strategic plans (r=.228, p=.030), having short
(r=-.333, p=.002) and medium financial plans (r=-.410, p=.000) compared to long term
financial plans (r=.400, p=.000), and the NGO leader possessing a certificate level education
or below (r=-.226, p=.023) compared to having a postgraduate level education (r=.211,
p=.034) negatively correlated with dependency ratio.
In Bivariate linear regression, unfortunately, all NGO or participant characteristics predicted
an increase in the dependency ratio and these were the presence of strategic plan (β=18.947,
R2=.125), type of NGO (β=9.191, R2=.124), level of education (β=6.323, R2=.028), and
presence of an active strategic (β=14.408, R2=.022), and financial plan (β=13.026, R2=.138).
Nevertheless, being a trust and private voluntary organization compared being another type of
NGO (β=-36.171, R2=.161), having short (β=-37.714, R2=.035), and medium strategic plans
(β=-44.939, R2=.146) compared to long term strategic plans (β=15.238, R2= .041), having
short (β=-29.309, R2=.100 ), and medium financial plans (β=-44.696, R2=.158 ) compared to
long term financial plans (β=24.311, R2=.150 ), and the NGO leader possessing a certificate
level education and below (β=-34.747, R2=.041 ) compared to having a postgraduate level
education (β=11.399, R2=.035), significantly predicted a decrease in dependency ratio.
3.5.3 Leadership Competencies and Survival Ratio
Slightly weaker, yet positive significant relationships were identified between survival ratio
and the NGO leader spearheading the implementation of the major investment decisions for
the NGO (r=.274, p=.006), implementing interventions for alternative sources of income
(r=.222, p=.026), and understanding and working with whatever resources that are available
(r=.218, p=.028). There were also weaker negative significant relationships between survival
ratio and the NGO leader being the major source of information for the NGO strategic
planning (r=-.220, p=.027), being a major source of information for the NGO financial
planning (r=-.234, p=.018), and adapting to the new and changing environment (r=.209,
p=.038).
In bivariate linear regression every unit increase in the scores (Range 1-5) of the NGO leader
spearheading the implementation of the major investment decisions for the NGO,
implementing interventions for alternative sources of income, and understanding and working
with whatever resources that are available predicted an increase in the survival ratio by
15.507 days, 14.043 days, and 19.144 days respectively. These independent variables
explained 6.6%, 4%, 3.8% of the variation in the survival ratio.
Alternatively, for every unit increase in the scores (Range 1-5) of the NGO leader being the
major source of information for the NGO strategic planning, being a major source of
information for the NGO Financial planning, and adapting to new and changing environment,
there was a predicted decrease in the survival ratio by 14.86days, 17.43days, and 18.79 days
respectively. These independent variables explained 3.9%, 4.5%, and 3.4% of the variation in
the survival ratio.
3.5.4 NGO, Participant characteristics and Survival Ratio
Among participant and NGO characteristics, the duration of the NGO leader at the current
Journal of Public Administration and Governance
ISSN 2161-7104
2017, Vol. 7, No. 3
http://jpag.macrothink.org 260
NGO (r=.333, p=.001), the presence of the investment plan (r=.386, p=.000), and the current
governance of the NGO (r=.235, p=.019) positively correlated with survival ratio.
Contrariwise, the duration of the financial plan (r=-.347, p=.001), the type of the NGO
(r=-.325, p=.001), and the level of education (r=-.361, p=.000) also significantly and
moderately but negatively correlated with survival ratio. Other competencies as shown in
Table 4 above did not significantly correlate with survival ratio. Indicator coding showed that
having long term strategic plans (r=-.260, p=.018) compared to short-term strategic plans
(r=.289, p=.006), having long-term financial plans (r=-.260, p=.009) compared to short-term
financial plans (r=.474, p=.000), and the NGO leader possessing postgraduate level education
(r=-.315, p=.001), compared to having a certificate level education or below (r=.369, p=.000),
and the NGO leader having worked for less than 5years at an NGO (r=-.298, p=.002),
negatively correlated with survival ratio. Only management committee as a governance
structure as compared to other forms of governance structures correlated weakly but
positively with survival ratio (r=.216, p=.032).
Bivariate linear regression showed that, the NGO and personal characteristics that predicted
an increase in survival ratio included the duration of NGO leader at the NGO (β=24.484,
R2=.102), the presence of the investment plan (β=62.439, R2=.140), and who governed the
NGO (β=21.051, R2=.045). Meanwhile, the duration of the financial plan (β=-27.825,
R2=.110), the type of the NGO (β=-6.457, R2=.008), and the level of education (β=-30.349,
R2=.122), predicted a decrease in survival ratio. Results also showed that having long-term
financial plans (β=,-40.398 R2=.056) compared to short-term financial plans (β=106.586,
R2=.215), the NGO leader possessing postgraduate level education (β=-43.424, R2=.090)
compared to certificate level education and below (β=145.308, R2=.128), the NGO leader
having worked for less than 5years at an NGO (β=-48.304, R2=.080), predicted a decrease in
survival ratio. Again, only management committee as a governance structure as compared to
others forms of governance structures predicted an increase in the survival ratio (β=47.838,
R2=.037).
3.5.5 Leadership Competencies and Total NGO Income
The two competencies that were found to be significant but weakly and negatively associated
with total NGO income included the NGO leader being the major source of information for
the NGO strategic planning (r=-.232, p=.020), and the NGO leader being the one who
communicates the NGO mission and Vision (r=-.195, p=.050).
Bivariate linear regression showed that for every unit increase in the scores (Range 1-5) of
the NGO leader being the major source of information for the NGO strategic planning and
being the one who communicates the NGO mission and Vision, there was a predicted
decrease in the total NGO income by $18651.412, and $15831.927 respectively. These
independent variables explained 4.4% and 2.8% of the variation in the total NGO income. In
this study, none of the leadership competencies correlated or predicted an increase in total
NGO Income.

Journal of Public Administration and Governance
ISSN 2161-7104
2017, Vol. 7, No. 3
http://jpag.macrothink.org 261
3. 5.6 NGO, Participant Characteristics, and Total NGO Income
Variables under NGO and personal characteristics that were found to negatively correlate
with NGO total income included the duration of the strategic plan (r=-.362, p=.000) and the
duration of the financial plan (r=-.275, p=.012). On the other hand, if an NGO had
investments (r=.226, p=.022), had an investment plan (r=.233, p=.022), had a fundraising
Strategy (r=.203, p=.042), the region where an NGO was located (r=.303, p=.002), the
duration of the NGO leader at an NGO (r=.299, p=.003), and the governance structure of the
NGO (r=.304, p=.002) correlated positively with total NGO income. However, when these
variables were indicator coded, the NGOs that were located in the western part of Uganda
(r=.415, p=.000) compared to those in the north (r=-.238, p=.016) and having short-term
strategic (r=.360, p=.000) and financial (r=.291, p=.008) plans positively correlated with total
NGO income. Meanwhile, the NGO leader having worked at the NGO for less than 5years
negatively correlated with total NGO income (r=-.187, p=.031).
In bivariate regression, if an NGO invested, had an investment plan, and had a fundraising
Strategy compared to those that did not have them, there was a predicted increase in the total
NGO income by $36,309.083, $45,331.563, and $32,815.891 respectively. These independent
variables explained 4.2%, 4.4%, and 3.2% of the variation in the total NGO income
respectively. Similarly, if the NGO leader had worked at the NGO for greater than 5years and
the NGO was from the western part of Uganda, there was a predicted increase in the total
NGO income by $26,116.576, and $17,286.355 respectively. These independent variables
explained 8% and 8.3% of the variation in the Total NGO income. Nevertheless, the NGO
being located in the western part of Uganda (β=69,810.187, R2=.164), compared to the north
(β=-44,429.441, R2=.047), and having short-term strategic (β=19,6267.389, R2=.120), and
financial plans (β=78,739.377, R2=.073) as compared to those with medium and long term
plans, predicted an increase in total NGO income. Lastly, the NGO leader working at the
NGO for less than 5years predicted a decrease in total NGO income (β=-36,307.179,
R2=.025).
3.6 Multiple Linear Regression Analysis of Leadership Competencies and NGO
Characteristics That Predict Dependency Ratio
Standard multiple regression was used to determine the influence of leadership competencies,
NGO, and personal characteristics on dependency ratio of an NGO. The model explained
37.1% (F (5, 103) =11.486, P=.000) of the variance in dependency ratio and thus slightly
over 60% of the dependency ratio is explained by factors not included in the model. In the
final model, two competencies and three NGO characteristics were found to be statistically
significant predictors of dependency ratio. Finding indicated that for every unit increase in
the scores (Range 1-5) of the NGO leader understanding and working with whatever
resources that are available, there is 9.802% decrease in the dependency ratio (Table 5). On
the other hand, higher scores on the NGO leader being the one who communicates the NGO
mission and Vision, there was a predicted increase the dependency ratio by 5.172%. The type
of NGO the participant came from and the NGO leader being able to understand and work
with whatever resources made the strongest contribution in explaining the dependency ratio
Journal of Public Administration and Governance
ISSN 2161-7104
2017, Vol. 7, No. 3
http://jpag.macrothink.org 262
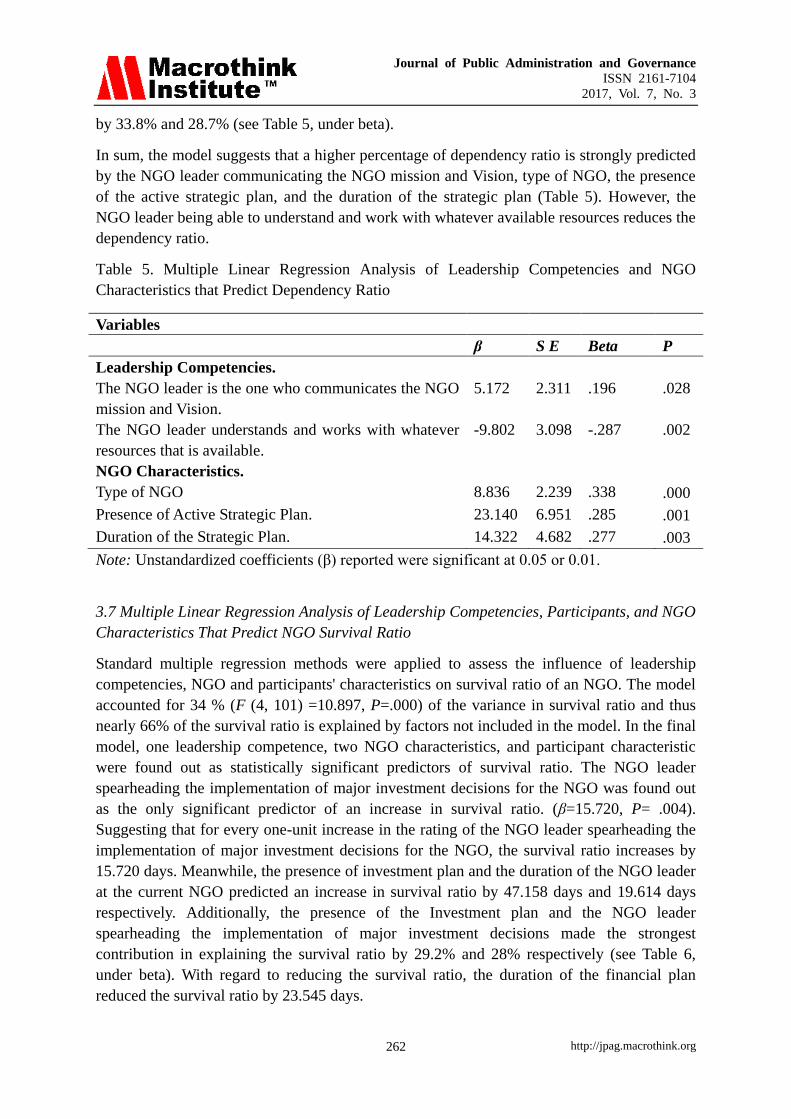
by 33.8% and 28.7% (see Table 5, under beta).
In sum, the model suggests that a higher percentage of dependency ratio is strongly predicted
by the NGO leader communicating the NGO mission and Vision, type of NGO, the presence
of the active strategic plan, and the duration of the strategic plan (Table 5). However, the
NGO leader being able to understand and work with whatever available resources reduces the
dependency ratio.
Table 5. Multiple Linear Regression Analysis of Leadership Competencies and NGO
Characteristics that Predict Dependency Ratio
Variables
β S E Beta P
Leadership Competencies.
The NGO leader is the one who communicates the NGO
mission and Vision.
5.172 2.311 .196 .028
The NGO leader understands and works with whatever
resources that is available.
-9.802 3.098 -.287 .002
NGO Characteristics.
Type of NGO 8.836 2.239 .338 .000
Presence of Active Strategic Plan. 23.140 6.951 .285 .001
Duration of the Strategic Plan. 14.322 4.682 .277 .003
Note: Unstandardized coefficients (β) reported were significant at 0.05 or 0.01.
3.7 Multiple Linear Regression Analysis of Leadership Competencies, Participants, and NGO
Characteristics That Predict NGO Survival Ratio
Standard multiple regression methods were applied to assess the influence of leadership
competencies, NGO and participants' characteristics on survival ratio of an NGO. The model
accounted for 34 % (F (4, 101) =10.897, P=.000) of the variance in survival ratio and thus
nearly 66% of the survival ratio is explained by factors not included in the model. In the final
model, one leadership competence, two NGO characteristics, and participant characteristic
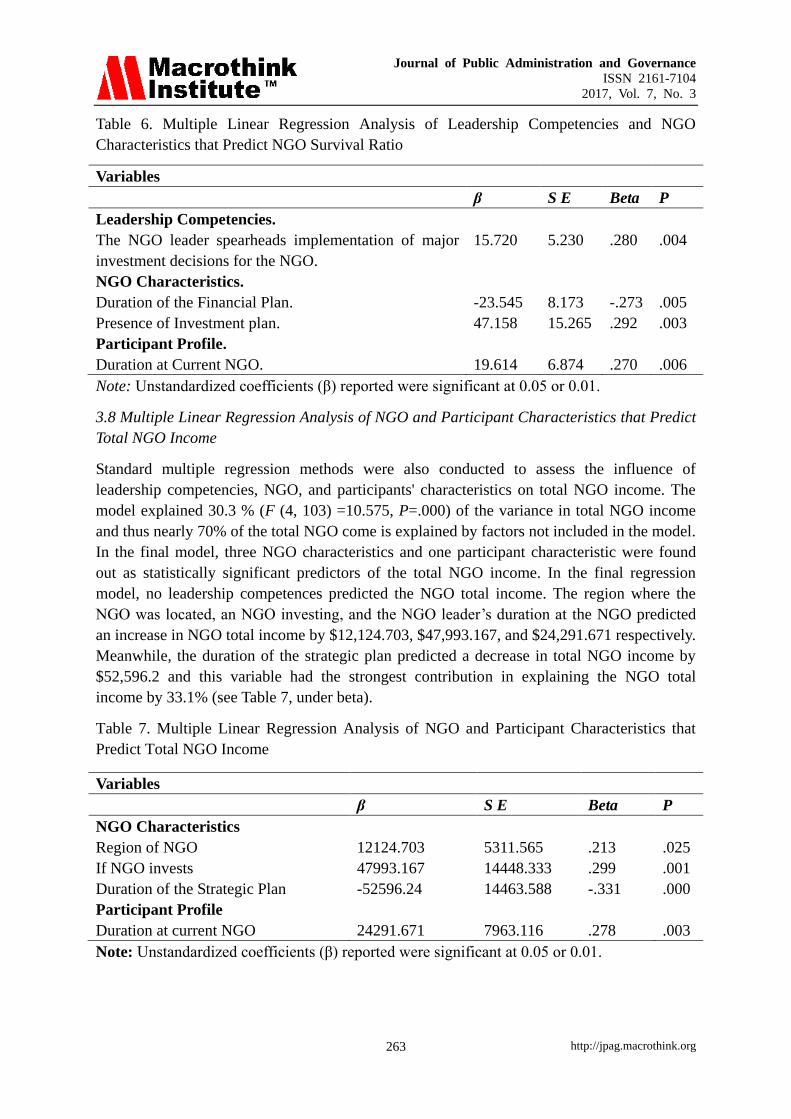
were found out as statistically significant predictors of survival ratio. The NGO leader
spearheading the implementation of major investment decisions for the NGO was found out
as the only significant predictor of an increase in survival ratio. (β=15.720, P= .004).
Suggesting that for every one-unit increase in the rating of the NGO leader spearheading the
implementation of major investment decisions for the NGO, the survival ratio increases by
15.720 days. Meanwhile, the presence of investment plan and the duration of the NGO leader
at the current NGO predicted an increase in survival ratio by 47.158 days and 19.614 days
respectively. Additionally, the presence of the Investment plan and the NGO leader
spearheading the implementation of major investment decisions made the strongest
contribution in explaining the survival ratio by 29.2% and 28% respectively (see Table 6,
under beta). With regard to reducing the survival ratio, the duration of the financial plan
reduced the survival ratio by 23.545 days.
Journal of Public Administration and Governance
ISSN 2161-7104
2017, Vol. 7, No. 3
http://jpag.macrothink.org 263
Table 6. Multiple Linear Regression Analysis of Leadership Competencies and NGO
Characteristics that Predict NGO Survival Ratio
Variables
β S E Beta P
Leadership Competencies.
The NGO leader spearheads implementation of major
investment decisions for the NGO.
15.720 5.230 .280 .004
NGO Characteristics.
Duration of the Financial Plan. -23.545 8.173 -.273 .005
Presence of Investment plan. 47.158 15.265 .292 .003
Participant Profile.
Duration at Current NGO. 19.614 6.874 .270 .006
Note: Unstandardized coefficients (β) reported were significant at 0.05 or 0.01.
3.8 Multiple Linear Regression Analysis of NGO and Participant Characteristics that Predict
Total NGO Income
Standard multiple regression methods were also conducted to assess the influence of
leadership competencies, NGO, and participants' characteristics on total NGO income. The
model explained 30.3 % (F (4, 103) =10.575, P=.000) of the variance in total NGO income
and thus nearly 70% of the total NGO come is explained by factors not included in the model.
In the final model, three NGO characteristics and one participant characteristic were found
out as statistically significant predictors of the total NGO income. In the final regression
model, no leadership competences predicted the NGO total income. The region where the
NGO was located, an NGO investing, and the NGO leader’s duration at the NGO predicted
an increase in NGO total income by $12,124.703, $47,993.167, and $24,291.671 respectively.
Meanwhile, the duration of the strategic plan predicted a decrease in total NGO income by
$52,596.2 and this variable had the strongest contribution in explaining the NGO total
income by 33.1% (see Table 7, under beta).
Table 7. Multiple Linear Regression Analysis of NGO and Participant Characteristics that
Predict Total NGO Income
Variables
β S E Beta P
NGO Characteristics
Region of NGO 12124.703 5311.565 .213 .025
If NGO invests 47993.167 14448.333 .299 .001
Duration of the Strategic Plan -52596.24 14463.588 -.331 .000
Participant Profile
Duration at current NGO 24291.671 7963.116 .278 .003
Note: Unstandardized coefficients (β) reported were significant at 0.05 or 0.01.
Journal of Public Administration and Governance
ISSN 2161-7104
2017, Vol. 7, No. 3
http://jpag.macrothink.org 264
4. Discussion
This study is one of the first to assess the relationship between leadership competencies and
financial sustainability measures in sub-Saharan Africa. We found out that there was a very
strong agreement by participants on possession of the leadership competencies among NGO
leaders in Uganda ranging from 90.1% to 100%. However, that agreement was highest
among competencies related to the responsiveness of NGO leaders to changing funding
environment and low among competencies related to investment considerations and
alternative sources of income. One possible reason for this low rating on investment and
income generating activities leadership competencies could have arisen from the fact that
nearly 50% of the NGOs surveyed did not invest some of their funding and a few had income
generating activities. Nevertheless, this study finding is consistent with research findings by
Hailey (2006) who revealed that NGO leaders demonstrated an unusually broad range of
competencies that include self-awareness and self-management. Also, Bolton & Abdy (2003)
found out that leaders had the ability to communicate NGO vision, identifying and exploiting
opportunities, inspiring teams, motivating NGO staff, creating and managing donor
relationship (Bolton & Abdy, 2003). However, we were unable to find previous studies that
rated the possession of these competencies among NGO leaders.
On financial sustainability, our findings show that the average annual external donor income,
local donor income, and own income accounted for 67%, 13.5%, and 19.5% of the average
total annual income respectively. In addition, there was a general there was a rise in funding
from 2010 to 2014. On the contrary, previous studies in Zimbabwe, Kenya, and Ghana
conducted showed a declining external donor funding of NGOs mostly attributed to the
global economic crisis (Gyamfi, 2010; Manyeruke (2012) Njoroge 2013; Saungweme, 2014;
Waiganjo et al. 2012). Possibly, the cordial relationship between Uganda and the other donor
countries coupled with the service gap left by the government, the high rating on the majority
of the leadership competencies, and majority of the NGOs being founded and run by the same
NGO leaders may explain the rise in the donor funding in Uganda during the period of
2010-2014. The average annual survival ratio over the five-year period for NGOs was found
to be 71.216 days. Over all, there was a fall in the survival ratio between 2010 and 2014. This,
therefore, means that NGOs’ can hardly survive beyond two months if all its funds are dried
up and if there are no donations received during the year. Similarly, findings by Saungweme
(2014) established very low survival ratios for NGOs, the highest being 22.01 days. In this
study, the average donor-dependency ratio was found to be high at 80.54% over the five-year
period. The general trend also shows that there was a rise in the donor dependency ratio
between 2010 and 2014. Above all, this donor dependency was coupled with a low
investment by NGOs where 50% and 21.9% of the NGOs’ invested and had an investment
plan respectively. Similarly, study findings by Waiganjo (2012) in Kenya revealed 70% of
NGO funding was from external donors while Saungweme (2014) established that NGOs in
Zimbabwe had very high donor dependency ratios, the lowest being 93.97%. Saungweme
(2014) also found out that 71% of the organizations did not have investment/financial plans
and yet over 82 percent of NGOs noted that investment planning was important to the
sustainable funding of their organizations.
Journal of Public Administration and Governance
ISSN 2161-7104
2017, Vol. 7, No. 3
http://jpag.macrothink.org 265
Although many leadership competencies significantly correlated with the three financial
sustainability measures, only two of those competencies provided a meaningful interpretation
in the final model and these included of the NGO leader understanding, working with
whatever resources that are available and the NGO leader spearheading the implementation
of major investment decisions. The NGO leader understanding and working with whatever
resources that are available, predicted a 9.802% decrease in the dependency ratio. Meanwhile,
the NGO leader spearheading the implementation of major investment decisions for the NGO
predicted an increase in survival by 15.720 days. Additionally, none of the leadership
competencies did have the influence on the total NGO income. However, we did not access
any previous study to make comparisons.
4.1 Implications and Recommendations
A local NGO possessing an investment and implementing it are two separate matters. NGOs
may establish the investment plan either as a basis of attracting donor funding or as a funding
requirement by the donor. In either case, what remains important is the implementation of the
investment or financial plan that will have a bearing on sustainable funding on the NGO.
Therefore, NGOs should invest in investment planning and establish alternative sources of
funding, as well as commit to implementation of those plans to increase NGO funding and
become sustainable. The investment plans should be able to attract donor funding, as well as,
help in diversification of income from multiple sources.
These study findings, underpin the importance of the responsiveness of the NGO leader to the
changing funding environment, and also reveals the need for dynamic, innovative and
proactive leadership in the NGO sector. It is therefore imperative for funders and NGOs to
adopt and build the capacity of leaders in investment and optimal resource utilization
(effective and efficient resource management) to become sustainable with respect to funding.
The general rise in NGO funding between 2010 and 2014 can be attributed to commitment in
donor funding of NGO activities in Uganda. It further points to a recovery in the global
economic position since the financial crisis 2008/9. The global economic recovery is an
opportunity for financial resource mobilization of the NGO sector in Uganda and the world
over. The 13.5% local contribution as compared to 67% external donor funding position
reveals a very low local funding and fundraising culture in Uganda. Thus, there is need to
cultivate fundraising culture in Uganda to boost local income and improve sustainable
funding of NGOs.
When compared to the findings by Saungweme (2014) among NGOs in Zimbabwe for 2012,
the average annual survival ratio over the five-year period for NGOs in Uganda was higher
by 49.206 days. However, this survival ratio is still low and depicts limited capacity of NGO
leaders to mobilize resources to sustain their activities. Henceforth, there is need to boost
local sources of funding especially income Generating Activities (IGAs) to improve survival
of NGOs in Uganda. NGOs should prioritize investments in IGAs as core sources of funding
and donors should build the capacity of and support NGOs to establish IGAs to reduce
over-dependence on a single source of funding.
Journal of Public Administration and Governance
ISSN 2161-7104
2017, Vol. 7, No. 3
http://jpag.macrothink.org 266
This study, like in previous research findings indicates a prevalently high donor-dependency
ratio pointing to a persistent donor-dependency syndrome for developing countries, especially,
in Africa and Uganda in particular. The high donor-dependence is a threat to NGO
independence in terms of agenda implementation. If not overcome, the NGOs will continue
being viewed as sub-contractors of international NGOs and therefore a risk of loss of local
legitimacy and relevance in serving an international or external agenda. Therefore, there is a
need for deliberate government policies to support NGOs preferably through their network
organizations, where governments would allocate a sufficient budget and resources for
implementation of NGOs’ agenda that is in line with the national development plans and
priorities. This will enhance NGO participation in national development agenda especially to
serve the underserved and those citizens that are unable to access government services,
thereby strengthen partnership with national governments by serving local/national agenda
and subsequently reducing donor dependency. Lastly, further research in other countries is
needed to establish the leadership competencies of NGO leaders and how they influence
sustainable funding of NGOs. In addition, further research utilizing a larger sample size is
also needed to develop a tool to measure NGO leadership competencies.
4.2 Limitations of the Study
This study had some limitations. The respondents of this study were majorly NGO leaders
and this self-report may have been over or understated. In addition, the majority of NGOs
provided categorized figures of their annual incomes. Computing categorized data into
continuous data may have led to the loss of some meaningful data.
5. Conclusion
This study suggests that the NGO leader understanding, and working with any available
resources and the NGO leader spearheading the implementation of major investment
decisions are key factors influencing financial sustainability of NGOs.
Acknowledgement
Special thanks go to Fulufhelo Godfrey Netswera and Edward Malatse Rankhumise, of
Tshwane University of Technology.
References
Barr, A., Fafchamps, M., & Owens. M. (2003). Non-governmental organizations in Uganda:
A report to the Government of Uganda Centre for the Study of African Economies,
Department of Economics Oxford University. Retrieved from
http://www.csae.ox.ac.uk/reports.
Bolton, M., & Abdy, M. (2003). Leadership. London, England: ACEVO.
Burger. R., Owens. T. (2012). The Survival Prospects of African Nongovernmental
Organizations (Research Paper No. 11/07).
Gyamfi, P. (2010). Financing local non-governmental organizations in Ghana: issues and
challenges. Master's thesis. Accra: Kwame Nkrumah University.
Journal of Public Administration and Governance
ISSN 2161-7104
2017, Vol. 7, No. 3
http://jpag.macrothink.org 267
Hailey, J. (2006). NGO leadership development. Praxis Paper No. 10.
Hailey, J., & James, R. (2004). Trees die from the top: International perspectives on NGO
leadership development. Voluntas, 15(4), 343–353.
https://doi.org/10.1007/s11266-004-1236-8
James, R. (2005a) The Crushing Impact of HIV/AIDS on Leaders in Malawi, Praxis Note
No.10, Oxford: INTRAC www.intrac.org/pages/praxis_notess Accessed: 20 June 2014.
James, R. (2005). Autocratics Anonymous: A Controversial Perspective on Leadership
Development. Praxis Note No. 14.
Lewis, D. (2001). Management of Non-Governmental Development Organizations: An
Introduction. London, England: Routledge. https://doi.org/10.4324/9780203002162
Manyeruke, C. (2012). Mitigating the effects of the global financial crisis in Zimbabwe: the
alternative strategies for the non-governmental organizations. African Journal of Social
Sciences, 2(2), 1-9.
Mugenda , O., M. & Mugenda, A., G. (2003). Research Methods: Quantitative and
Qualitative Approaches. Nairobi, Kenya: African Centre for technological studies.
Njoroge, G.B. (2013). An investigation on the factors influencing the sustainability of NGOs
in Kenya. Masters of Science thesis. Nairobi: University of Nairobi.
NORAD. (2002). A report of a Study on the civil society in Uganda for the Royal Norwegian
embassy in Uganda. Retrieved from
https//www.norad.no/en/toolpublications/publications/2009
Sanjeev, G., Powell, R., & Yang, Y. (2006). Macroeconomic Challenges of Scaling Up Aid to
Africa (Working Paper No. WP/05/179.). Retrieved from https://books.google.com
Saungweme, M. (2014). Factors influencing the financial sustainability of local NGOs: the
case of Zimbabwe (Doctoral dissertation). Stellenbosch University: Stellenbosch. Retrieved
from http//hdl.handle.net/10019.1/97293
Sharma, P. (2012). Performance measurements in NGOs. The Management
Accountant.1442-1444
Sooryamoorthy, R., & Gangrade, K., D. (2001). NGOs in India: A Cross Sectional Study.
Retrieved from www.bokus.com/bok
Sweat, S., A. & Martin K. S. (2008). Data analysis with SPSS: A first course in applied
statistics. Boston, USA: Pearson Education, Inc.
USAID. (2010). 2009 NGO Sustainability Index for Sub-Sahara Africa. Retrieved from
https//www.usaid.gov/africa-civil-socety/2009.
Waiganjo, E.W., Ng'ethe, J.M. and Mugambi, D.N. (2012). An investigation into the
strategies adopted by the non-governmental organization in Kenya to increase financial
sustainability. International Journal of Current Research, 4(4), 74-78.
Journal of Public Administration and Governance
ISSN 2161-7104
2017, Vol. 7, No. 3
http://jpag.macrothink.org 268
Wamai, N., Walera, I., & Wamai G. (2002): The Role of Non-Governmental Organizations
(NGOs) in Social Development. A study of Health Sector NGOs in Mbale and Mubende
Districts, 1997. Retrieved from Stanford University libraries website:
https://searchworks.standford.edu
Weerawardena J., McDonald R., & Mort G. (2009). Sustainability of nonprofit organizations:
An empirical investigation. Journal of World Business 45, 346-356.
https://doi.org/10.1016/j.jwb.2009.08.004
Copyright Disclaimer
Copyright for this article is retained by the author(s), with first publication rights granted to
the journal.
This is an open-access article distributed under the terms and conditions of the Creative
Commons Attribution license (http://creativecommons.org/licenses/by/4.0/).