the influence of mixing on the morphology and properties of blends · pdf filethe influence of...
TRANSCRIPT

Loughborough UniversityInstitutional Repository
The influence of mixing onthe morphology and
properties of blends ofnatural and nitrile rubber
This item was submitted to Loughborough University's Institutional Repositoryby the/an author.
Additional Information:
• A Master's Thesis submitted in partial fulfilment of the requirements forthe award of Master of Philosophy of Loughborough University.
Metadata Record: https://dspace.lboro.ac.uk/2134/11267
Publisher: c© Dilhara Githanjali Edirisinghe
Please cite the published version.

This item was submitted to Loughborough University as an MPhil thesis by the author and is made available in the Institutional Repository
(https://dspace.lboro.ac.uk/) under the following Creative Commons Licence conditions.
For the full text of this licence, please go to: http://creativecommons.org/licenses/by-nc-nd/2.5/

• • Loughborough • University
Pilkington Library
AuthorlFiling Title .... ~~. ).(?,~.~ .1. !':'.~!t~ ............... .
VoI.No ............. ClassMark ........ T .............. .
Please note that fines are charged on ALL overdue items.
0402221184
/111111 '"' "'/ 1111'


THE INFLUENCE OF MIXING ON THE
MORPHOLOGY AND PROPERTIES OF BLENDS
OF NATURAL AND NITRILE RUBBER
by
DILHARA G. EDIRlSINGHE, B.Se., M.Se.
A Master's thesis submitted in partial fulfilment of
the requirements for the award of
Master of Philosophy
of the
Loughborough University
July 1999
Supervisor
Dr. Philip K. Freakley, Ph.D., F.I.M
Institute of Polymer Technology and Materials Engineering
© D1LHARA GITHANJALI EDIRISINGHE.1999

CI8"~
Acc No.

ACKNOWLEDGEMENTS
I would like to express my sincere thanks and gratitude to my supervisor, Dr. P.K.
Freakley, for his invaluable guidance, assistance and encouragement throughout this
research and for being very understanding of my situation as a student and a mother at
the same time.
My special thanks to Dr.(Mrs) Jane Clarke for her advice, invaluable suggestions and
assistance during the course of this research. Her assistance during the writing of this
thesis is greatly appreciated.
The financial support provided by the Agricultural Research Project (ARP), Sri Lanka
and the Institute of Polymer Technology and Materials Engineering, Loughborough
University is gratefully acknowledged.
I wish to thank Dr. L.M.K. Tillekeratne, Director, Rubber Research Institute of Sri
Lanka (RRISL) and Dr.(Mrs) N.M.V. Kalyani Liyanage, Head, Rubber Technol. and
Develop. Dept., RRISL, for approving the leave to undertake this research. My special
thanks are also due to Dr.(Mrs) K.G. Kamika De Silva, Head, Rubber Chemistry
Dept., RRISL, without whose help studying at Loughborough University would not
have been originated.
I also wish to express particular thanks to:
Mr. Barry Clarke and other members of the technical staff at IPTME, for their
assistance.
Mr. John Bates and Mr. Frank Page of the Electron Microscope Unit for
spending their invaluable time on obtaining the required electron micrographs.
Heartiest thanks to my husband Ajith who also sought a degree at the same time, for
all his help and understanding during the course of this research. A big thank you is
due to our dearest son Eshan for'his endurance during the long hours of preoccupation
in my studies.
Many thanks to all RuPEC members, including my colleagues for the pleasure of their
company and their support.
Finally, I wish to thank my family members for their support during this research.
ii

ABSTRACT
The overall objective of this research is to develop natural rubber/acrylonitile
butadiene rubber (NRlNBR) blends having physical properties superior to NBR
compounds and a tolerable resistance to swelling in oils and fuels. This would
increase consumption of NR by replacing NBR used in various engineering
applications with less costly NRlNBR blends.
The rheology of blend components was studied in detail in order to choose mixing
conditions and interpret the morphology of NRlNBR blends filled with 20 phr N660
carbon black. It was found that a high shear ratelhigh temperature combination results
in similar apparent viscosities for the two elastomers.
Blends were prepared according to single-stage and masterbatch mixing techniques
with an intermeshing rotor internal mixer. Rheological, cure and physical properties
of the blends were measured and related to mixing conditions, morphology and
carbon black distribution.
The filled 40/60 NRlNBR single-stage blends prepared at a high rotor speed had a
finer morphology than the blends prepared at a low rotor speed. The fine textured
blends showed higher tensile strength, lower abrasion resistance and improved
compression set at elevated temperatures over those of coarse textured blends. Also,
the fine textured blends showed a positive synergism of tensile strength. Modulus and
tear strength were highest with most of the carbon black in the NBR phase, whereas
ASTM oil and toluene uptake were lowest with most of the carbon black in the NR
phase. However, percentage compression set was lowest with carbon black equally
distributed between the phases.
It was concluded that an NBR (26.6% acrylonitrile) compound could be replaced by
the single-stage blends, particularly the fine textured ones, with regard to physical
properties such as moduli, hardness, tear strength and compression set in engineering
applications, where 2-4 % (by mass) oil swell is tolerable. Oil swell of the NRlNBR
single-stage blends is about 5 % (by mass) lower than the predicted.
iv

TABLE OF CONTENTS
TITLE PAGE
ACKNOWLEDGEMENTS
CERTIFICATE OF ORIGINALITY
ABSTRACT
TABLE OF CONTENTS
LIST OF FIGURES
LIST OF TABLES
LIST OF ABBREVIATIONS
CHAPTER ONE: INTRODUCTION
1.1 General Introduction
1.2 Objectives
1.3 Plan of the Thesis
References
CHAPTER TWO: A REVIEW OF RUBBER TECHNOLOGY
2.1 General Background of Natural Rubber
2.1.1 Structure and Properties ofNR
2.1.2 Uses ofNR
2.1.3 The SMR Scheme
2.2 General Background of Acrylonitrile-Butadiene Rubber
2.2.1 Structure and Properties ofNBR
2.2.2 Compounding, Processing and Uses ofNBR
2.3 Reinforcement with Carbon Black
2.3.1 The Nature of Carbon Black
2.3.2 The Phenomenon of Reinforcement
v
11
III
IV
v
x
xviii
xx
1
3
4
6
7
7
9
9
9
9
14
16
16
17

2.3.3 Fracture and Wear of Filler Loaded Rubbers
2.4 Rubber Mixing
2.4.1 The Batch Mixing System
2.4.2 Process Variables and Control
2.4.3 Effect of Mixing on Properties
2.5 Rheology of Polymer Melts
2.5.1 General Rheological Behaviour
2.5.2 Effect of Temperature on Viscosity
2.5.3 Effect of Fillers on Viscosity and Effective Filler Volume
Fraction
2.6 Compounding and Vulcanisation
2.6.1 Introduction
2.6.2 Sulphur Vulcanising Systems
2.6.3 The Chemistry of Accelerated Sulphur Vulcanisation
2.6.4 Cure Systems and Cure Characteristics ofNBR Mixes
2.6.5 Influence of Fillers on Vulcanisation
2.6.6 Effect of Vulcanisation on Vulcanisate Properties
2.7 Swelling of Rubber Networks
2.7.1 Introduction
2.7.2 Degree of Swelling and its Relationship to the Degree of
Crosslinking
2.7.3 Swelling of Filled Rubbers
References
CHAPTER THREE: A REVIEW OF RUBBER BLENDS
3.1 Methods of Blending Rubbers
3.2 Major Factors Affecting Properties of Polymer Blends
3.2.1 Introduction
3.2.2 Effect of Composition on Vulcanisate Properties
vi
22
27
27
31
35
40
40
43
43
48
48
SO
51
53
SS
57
58
58
59
60
61
67
68
68
68

3.2.3 Compatibility of Elastomer Blends
3.2.3.1 Solubility Parameter Approach
3.2.3.2 Thermodynamic Approach
3.2.3.3 Glass-Transition Temperature
3.2.3.4 Characterisation of Compatibility using
Microscopy
3.2.4 Blend Morphology
3.2.4.1 Introduction
3.2.4.2 Effect of Composition on Morphology
3.2.4.3 Effect of Relative Mixing Viscosity of the
Components and Mixing Conditions on
Morphology
3.2.4.4 Effect of Morphology on Properties
3.3 Carbon Black Distribution and Transfer
3.3.1 Introduction
3.3.2 Effect of Type of Polymer
3.3.3 Effect of Relative Mixing Viscosities of the Components
3.3.4 Effect of Type of Carbon Black
3.3.5 Effect of Different Mixing Techniques
3.3.6 Summary of Major Findings
3.3.7 Effect of Varied Carbon Black Distribution on Blend
Morphology
3.3.8 Effect of Varied Carbon Black Distribution on Properties
References
CHAPTER FOUR: EXPERIMENTAL
4.1 Introduction
4.2 Materials and Formulations
4.2.1 Materials
4.2.2 Formulations
vii
74
76
77
78
78
80
80
80
81
84
85
85
85
86
87
88
88
89
90
95
99
102
102
103

4.3 Mixing Equipment 107
4.3.1 Francis Shaw K1 Intermix 107
4.3.2 Two-roll Mill 107
4.4 Test Methods 108
4.4.1 Determination of the Solubility Parameters ofNR and NBR 108
4.4.2 Rheometry 109
4.4.3 Cure Testing 111
4.4.4 Analysis of Morphology and Carbon Black Distribution
using Microscopy 111
4.4.5 Physical Testing 114
4.4.6 Swelling Measurements 117
4.5 Single-Stage Mixing of Filled NRlNBR Blends 118
4.5.1 Experimental Design 118
4.5.2 Mixing Conditions 119
4.5.3 Testing and Characterisation 119
4.6 Masterbatch Mixing of Filled NRlNBR Blends 120
4.6.1 Experimental Design 120
4.6.2 Mixing Conditions 121
4.6.3 Testing and Characterisation 122
4.7 Mixing of Filled NR and NBR Compounds 122
4.7.1 Mixing Procedure 122
4.7.2 Mixing Conditions 123
4.7.3 Testing and Characterisation 123
4.8 Mixing of the NRlNBR Single-Stage Gum Blend 124
4.8.1 Mixing Procedure 124
4.8.2 Mixing Conditions 124
4.8.3 Testing and Characterisation 125
4.9 Mixing of the Filled NRlNBR Single-stage Blend with a
Short Mixing Cycle 125
viii
4.9.1 Mixing Procedure
4.9.2 Mixing Conditions
4.9.3 Testing and Characterisation
References
CHAPTER FIVE: RESULTS AND DISCUSSION
5.1 ChemicallMolecular Compatibility ofNR and NBR
5.2 Rheology of Blend Components
5.2.1 Rheology of Raw NR and NBR
5.2.2 Rheology ofNR and NBR Masterbatches
5.3 Phase Morphology ofNR and NBR Blends
5.3.1 Morphology of the Single-Stage Gum Blend
5.3.2 Effect of Mixing Conditions on the Morphology of
Filled Single-Stage Blends
5.4 Carbon Black Distribution in NR and NBR Blends
5.4.1 Effect of Mixing Conditions on the Carbon Black
Distribution of Single-stage Blends
5.4.2 Carbon Black Distribution and Transfer in Masterbatch
125
126
126
127
129
\31
131
133
138
138
139
145
145
Blends 152
5.5 Properties of Blends
5.5.1 Rheology of Blends
5.5.2 Cure Characteristics ofNR and NBR Blends
5.5.3 Physical Properties ofNR and NBR Blends
5.5.4 SweIling Resistance in ASTM Oil No.2 and Toluene
References
CONCLUSIONS
RECOMMENDATIONS FOR FURTHER WORK
APPENDIX
ix
159
159
163
172
193
198
201
204
206

LIST OF FIGURES
Fig. 2.1 Structural unit of cis-l ,4-polyisoprene 7
Fig. 2.2 Dependence of the swelling resistance ofNBR on the
content of combined acrylonitrile: ASTM Oil NoJ, 70 h at
100°C 12
Fig. 2.3 Swelling of acrylonitrile-butadiene copolymers 12
Fig. 2.4 Swelling of acrylonitrile-butadiene copolymers 13
Fig. 2.5 Tear strength (Source: Ashland Chemical Co., Carbon Black
Div.) 19
Fig. 2.6 Molecular slippage model of reinforcement mechanism 21
Fig. 2.7 Scallamach abrasion patterns ofNR and SBR tread
compounds on different road surfaces and the profile of an
abrasion pattern obtained from a worn tire surface 26
Fig.2.8(a) Cross section of a Farrel Bridge Banbury showing
tangential rotor~ 28
Fig.2.8(b) Cross section of a Francis Shaw Intermix showing
interlocking rotors 29
Fig. 2.9 Tensile strength ofNBR vulcanisates formulated with both
HAF (N330) and ISAF (N2l9) carbon black as a function of
mixing temperature at various rotor speeds 37
Fig. 2.10 Tensile strength ofNBRvulcanisates formulated with both
HAF (N330) and ISAF (N219) carbon black as a function of
rotor speed at various temperatures 38
Fig. 2.11 Strain at break (Eb) ofNBR vulcanisates formulated with
both HAF (N330) and ISAF (N219) carbon black as a
function of mixing temperature at various rotor speeds 38
Fig. 2.12 Strain at break (Eb) ofNBR vulcanisates formulated with
both HAF (N330) and ISAF (N219) carbon black as a
function of rotor speed at various mixing temperatures 39
x

Fig. 2.13 Plot of shear stress t against the shear rate 1 for a non- 42
Newtonian fluid
Fig. 2.14 Apparent viscosity-shear rate curves for a dilatant, a
Newtonian and a pseudoplastic fluid which have the same
apparent viscosity at zero shear rate 42
Fig. 2.15 Apparent viscosity vs. shear stress for a carbon black filled
narrow distribution linear copolymer ofbutadiene and
styrene 45
Fig. 2.16 Apparent viscosity vs. shear stress for carbon black filled
conventional SBR 46
Fig. 2.17 Cure Curve 50
Fig. 2.18 Effect of carbon black loading as shown on the oscillating
disc rheometer trace 56
Fig. 2.19 The effects of vulcanisation 57
Fig. 2.20 Tensile strength and modulus against time of cure: (a) NR,
(b) SBR 58
Fig. 3.1 Variation of modulus with carbon black loading for
NRJNBR blends 69
Fig. 3.2 Variation of tensile strength with hardness for NRJNBR
blends 70
Fig. 3.3 Variation of tear strength with hardness for NRJNBR blends 70
Fig. 3.4 Variation of compression set with hardness for NRJNBR
blends 71
Fig. 3.5 Volume swelling in ASTM oil No.3 for NRJNBR blends at
room temperature 71
Fig. 3.6 Dependence of tensile properties on NRJNBR (Breon 1041)
ratio 73
Fig. 3.7 Dependence of hardness on NRJNBR (Breon 1041) ratio 73
Fig. 3.8 Dependence of volume swelling in ASTM No.1 and No.3
oils on NRJNBR (Breon 1041) ratio 74
Fig. 3.9 Pure gum blends of NBR 'with NR as imaged by the
quantimet 81
xi

Fig. 3.10 Schematic representation of observed elastomer phase
distributions for 50/50 NRJSBR and NRlBR blends 91
Fig. 3.11 Shear viscosity versus shear rate for 80 parts SBR, 20 parts
BR and 20 phr carbon black (N303) model compounds.
Mixing time is one minute 93
Fig. 3.12 Shear viscosity vs. shear rate for 80 parts SBR, 20 parts BR
and 20 phr carbon black (N303) model compounds. Mixing
time is 8 minutes 94
Fig. 4.1 Schematic diagram of the sequence of experiments 101
Fig. 4.2 Cross-section showing the biconical rotor, the cavity and the
dies ofthe TMS rheometer 109
Fig. 5.1 Shear stress against shear rate plots ofNR and NBR at
different temperatures 131
Fig. 5.2 Temperature-cross-over shear rate plot of raw NR and NBR 132
Fig. 5.3 Temperature-cross-over shear stress plot of raw NR and
NBR 132
Fig. 5.4 Apparent viscosity against shear rate plots ofNR
masterbatches 134
Fig. 5.5 Apparent viscosity against shear rate plots ofNBR
masterbatches 135
Fig. 5.6 Apparent viscosity against shear rate plots of the pair of
masterbatches combined in the NRI0NBR90 blend 136
Fig. 5.7 Apparent viscosity against shear rate plots of the pair of
masterbatches combined in the NR50NBR50 blend 136
Fig. 5.8 Apparent viscosity against shear rate plots of the pair of
masterbatches combined in the NR90NBRl 0 blend 137
Fig. 5.9 Transmitted light micrograph of the single-stage gum blend
at 400X magnification 138
Fig. 5.1 O(A) Transmitted light micrograph of the S20T20 single-stage
NRlNBR blend at 400X magnification (mixer rotor speed-
20 rpm, initial NBR temperature - 20·C) 140
xii

Fig. 5.1 O(B) Transmitted light micrograph of the S20T85 single-stage 140
NRlNBR blend at 400X magnification (mixer rotor speed -
20 rpm, initial NBR temperature - 85°C)
Fig. 5.1 O(C) Transmitted light micrograph of the S60T20 single-stage
NRlNBR blend at 400X magnification (mixer rotor speed -
60 rpm, initial NBR temperature - 20°C) 141
Fig.5.1 0 (D) Transmitted light micrograph of the S60T85 single-stage
NRlNBR blend at 400X magnification (mixer rotor speed -
60 rpm, initial NBR temperature - 85°C) 141
Fig. 5.11 Batch temperature against mixing time of the S20T20 and
S20T85 single-stage blends 143
Fig. 5.12 Batch temperature against mixing time of the S60T20 and
S60T85 single-stage blends 143
Fig. 5.13 Transmitted light micrograph of the single-stage blend with
a short mixing cycle at 400X magnification 145
Fig. 5.14(A) Scanning transmission electron micrograph of the S20T20
single-stage blend (x 4000 magnification) 147
Fig. 5.14(B) Scanning transmission electron micrograph of the S20T20
single-stage blend (x 10000 magnification) 147
Fig. 5.14(C) Scanning transmission electron micrograph of the S60T20
single-stage blend (x 4000 magnification) 148
Fig. 5.14(D) Scanning transmission electron micrograph of the S60T20
single-stage blend (x 10000 magnification) 148
Fig. 5.15 Scanning transmission electron micrograph of the S20T20
single-stage blend (x 5000 magnification) 149
Fig. 5.16(A) Scanning transmission electron micrograph of the S60T20
single-stage blend (x 1000 magnification) 150
Fig. 5.16(B) Scanning transmission electron micrograph of the S60T20
single-stage blend (x 5000 magnification) 151
Fig. 5.16(C) Scanning transmission electron micrograph of the S60T20
single-stage blend (x 20000 magnification) 151
Fig. 5.17(A) Transmitted light micrograph of the NRIONBR90
masterbatch blend at 400X magnification 153
xiii

Fig. 5.17(B) Transmitted light micrograph of the NR50NBRSO
masterbatch blend at 400X magnification 153
Fig. 5.17(C) Transmitted light micrograph of the NR90NBRIO
masterbatch blend at 400X magnification 154
Fig.5.18(a) Scanning transmission electron micrograph of the
NRIONBR90 masterbatch blend (x 5000 magnification) 156
Fig.5.18(b) Scanning transmission electron micrograph of the
NRSONBRSO masterbatch blend (x 5000 magnification) 156
Fig. 5.18(c) Scanning transmission electron micrograph of the
NR90NBRIO masterbatch blend (x 5000 magnification) 157
Fig. 5.19 Scanning transmission electron micrograph of a stained
section of the NR90NBRIO masterbatch blend (x 20000
magnification) 158
Fig. 5.20 Apparent viscosity vs shear rate plots of the filled (20phr,
N660) S20T20 blend at different temperatures 159
Fig. 5.21 Shear rate - apparent viscosity plots of the filled (20phr,
N660) single-stage blends at 120°C 160
Fig. 5.22 Effect of the blending conditions on the apparent viscosity
of filled (20phr, N660) NRlNBR blends at 40 s·\ shear rate
and 100°C 161
Fig. 5.23 Effect of location of carbon black on the apparent viscosity
of filled (20phr, N660) masterbatch blends at 40 s·\ shear
rate and 100°C 162
Fig. 5.24 Influence of mixing conditions on the scorch time of filled
(20phr, N660) single-stage blends 165
Fig. 5.25 Influence of mixing conditions on the 90% cure time of
filled (20phr, N660) single-stage blends 165
Fig. 5.26 Influence of mixing conditions on the cure rate index of
filled (20phr, N660) single-stage blends 166
Fig. 5.27 Influence of mixing conditions on the (Max.- Min.) torque
of filled (20phr, N660) single-stage blends 167
Fig. 5.28 Effect of blending conditions on the cure rate index of filled
(20phr, N660) NRlNBR blends 168
xiv

Fig. 5.29 Effect of blending conditions on the (Max.- Min.) torque of
filled (20phr, N660) NRlNBR blends 169
Fig. 5.30 Influence of location of carbon black on the scorch time of
filled (20phr, N660) masterbatch blends 169
Fig. 5.31 Influence of location of carbon black on the 90% cure time
of filled (20phr, N660) masterbatch blends 170
Fig. 5.32 Influence of location of carbon black on the cure rate index
of filled (20phr, N660) masterbatch blends 170
Fig. 5.33 Influence of location of carbon black on the (Max.- Min.)
torque of filled (20phr, N660) masterbatch blends 171
Fig. 5.34 Influence of mixing conditions on the modulus at 100% of
filled (20 phr, N660) single-stage blends 173
Fig. 5.35 Influence of mixing conditions on the modulus at 300% of
filled (20 phr, N660) single-stage blends 173
Fig. 5.36 Effect of blending conditions on the 100% modulus of filled
(20phr, N660) NRlNBR blends 174
Fig. 5.37 Effect of blending conditions on the 300% modulus of filled
(20phr, N660) 174
Fig. 5.38 Influence of location of carbon black on the 100% modulus
of filled (20phr, N660) masterbatch blends 175
Fig. 5.39 Influence of location of carbon black on the 300% modulus
of filled (20phr, N660) masterbatch blends 175
Fig. 5.40 Influence of mixing conditions on the tensile strength of
filled (20phr, N660) single-stage blends 176
Fig. 5.41 Effect of blending conditions on the tensile strength of filled
(20 phr, N660) NRlNBR blends 178
Fig. 5.42 Influence of location of carbon black on the tensile strength
of filled (20phr, N660) masterbatch blends 179
Fig. 5.43 Influence of mixing conditions on the tear strength of filled
(20phr, N660) single-stage blends 180
Fig. 5.44 Effect of blending conditions on the tear strength of filled
(20 phr, N660) NRlNBR blends 181
xv

Fig. 5.45 Influence of location of carbon black on the tear strength of 182
filled (20pbr, N660) masterbatch blends
Fig. 5.46 Influence of mixing conditions on the hardness (Shore A) of
filled (20pbr, N660) single-stage blends 182
Fig. 5.47 Effect of blending conditions on the hardness (Shore A) of
filled (20 pbr, N660) NRlNBR blends 183
Fig. 5.48 Influence of location of carbon black on the hardness
(Shore A) of filled (20pbr, N660) masterbatch blends 184
Fig. 5.49(a) Influence of mixing conditions on the abrasion resistance
(Akron) of filled (20pbr, N660) single-stage blends 185
Fig. 5.49(b) Influence of mixing conditions on the abrasion resistance
(DIN) of filled (20pbr, N660) single-stage blends 185
Fig. 5.50(A) Scanning electron micrograph showing the abrasion pattern
of the filled (20 pbr, N660) S20T20 single-stage blend,
Magnification 18.5 times 186
Fig. 5.50(B) Scanning electron micrograph showing the abrasion pattern
of the filled (20 pbr, N660) S60T20 single-stage blend,
Magnification 18.5 times 186
Fig. 5.51 Effect of blending conditions on the abrasion resistance
(DIN) of filled (20 pbr, N660) NRlNBR blends 187
Fig. 5.52 Influence of location of carbon black on the abrasion
resistance (DIN) of filled (20pbr, N660) masterbatch blends 188
Fig. 5.53 Influence of mixing conditions on the compression set of
filled (20pbr, N660) single-stage blends at room temperature 189
Fig. 5.54 Influence of mixing conditions on the compression set of
filled (20pbr, N660) single-stage blends at 70°C 190
Fig. 5.55 Effect of blending conditions on the compression set of
filled (20pbr, N660) NRlNBR blends at room temperature 191
Fig. 5.56 Effect of blending conditions on the compression set of
filled (20 pbr, N660) NRlNBR blends at 70°C 191
Fig. 5.57 Influence of location of carbon black on the compression
set % of filled (20 pbr, N660) masterbatch blends at room
temperature 192
xvi

Fig. 5.58 Influence of location of carbon black on the compression
set % of filled (20 pbr, N660) masterbatch blends at 70°C 192
Fig. 5.59 Influence of mixing conditions on the percentage swell of
filled (20pbr, N660) single-stage blends in ASTM Oil No.2
at 20°C 193
Fig. 5.60 Influence of mixing conditions on the percentage swell of
filled (20pbr, N660) single-stage blends in toluene at 20°C 194
Fig. 5.61 Effect of blending conditions on the percentage oil swell of
filled (20 pbr, N660) NRlNBR blends 194
Fig. 5.62 Effect of blending conditions on the percentage toluene
swell of filled (20 pbr, N660) NRlNBR blends 195
Fig. 5.63 Influence oflocation of carbon black on the percentage
swell of filled (20 pbr, N660) masterbatch blends in ASTM
Oil No.2 196
Fig. 5.64 Influence of location of carbon black on the percentage
swell of filled (20 pbr, N660) masterbatch blends in toluene 196
xvii

LIST OF TABLES
Table 2.1 Volume swell of nitrile vulcanizates (standard recipe) in a
light petroleum-benzene mixture (3:1) after 72 hrs at 23°C 10
Table 2.2 Effect of mixing time on properties of single-stage mix of
ISAF (N220) carbon black in oil-extended SBR 1712 36
Table 2.3 Classification of sulphur vulcanising systems 50
Table 2.4 Vulcanisation systems (phr) for nitrile rubber 54
Table 4.1 Materials 103
Table 4.2 Compound formulations of the single-stage blends and the
standard ASTM reference compound 104
Table 4.3 Stage I : Masterbatch formulations 104
Table 4.4 Stage II : Masterbatch blend formulations 105
Table 4.5 Compound formulations of filled NR and NBR compounds 106
Table 4.6 Compound formulations of the NRlNBR gum blend 107
Table 4.7 Testing sequence of shear rates and the corresponding step
durations 110
Table 4.8 Combinations of rotor speed and initial NBR temperature
used for the single-stage blend formulation 118
Table 4.9 Mixing sequence and the corresponding mixing times of the
single-stage blends at 20 and 60 rpm rotor speeds 119
Table 4.10 Stage I : Mixing sequence and the corresponding mixing
times of the masterbatches at 60 rpm rotor speed 121
Table 4.11 Stage II : Mixing sequence and the corresponding mixing
times of the masterbatch blends at 60 rpm rotor speed 121
Table 4.12 Mixing sequence and the corresponding mixing times of
filled NR and NBR compounds at 40 and 60 rpm rotor
speeds 123
Table 4.13 Mixing sequence and the corresponding mixing times of the
NRlNBR gum blend at 60 rpm rotor speed 124
xviii
Table 4.14 Mixing sequence and the corresponding mixing times of the
filled single-stage blend with a short mixing cycle, at 20 rpm
rotor speed
Table 5.1 Average values of area/frame % of the lighter phase
125
calculated from the results obtained from four selected fields 144
Table 5.2 Cure characteristics of all the rubber compounds obtained
using the Wallace Shawbury Precision Cure Analyser at
150°C 164
xix

LIST OF ABBREVIATIONS
ACN Acrylonitrile
ARI Abrasion Resistance Index
ASTM American Society for Testing and Materials
BUR Bromobutyl Rubber
BR Polybutadiene Rubber
BS British Standards
CBS N-Cyclohexyl-2-benzothiazolyl Sulphenamide
CDB Cyclohexyl-dithiobenzothiazole
CIDM Controlled Ingredient Distribution Mixing
CUR Chlorobutyl Rubber
CR Chloroprene Rubber
CRI Cure Rate Index
CTM Cavity Transfer Mixer
CTP N-(Cyclohexylthio) Phthalimide
CV Conventional Vulcanising
D.R.C. Dry Rubber Content
DBPA Dibutyl Phthalate Absorption
DCP Dicumyl Peroxide
DOP Dioctyl Phthalate
DTDM Dithio~imorpholine
ENR Epoxidised Natural Rubber
EPDM Ethylene-Propylene-Diene Terpolymer
EPM / Ethylene-Propylene Rubber
EPR
EV Efficient Vulcanising
xx

GPF
HAF
HR
IR
IRHD
ISAF
MB
MBT
MBTS
MC
MRPRA
NBR
General Pwpose Furnace
High Abrasion Furnace
Isobutene-Isoprene (Butyl) Rubber
Polyisoprene Rubber
International Rubber Hardness Degrees
Intennediate Super Abrasion Furnace
Masterbatch
2-Mercaptobenzothiazole
Bis(2-benzothiazolyl) Disulphide
Magnesium Carbonate
Malaysian Rubber Producers' Research Association
Acrylonitrile-Butadiene (Nitrile) Rubber
NBRMB Nitrile Rubber Masterbatch
NR Natural Rubber
NRMB Natural Rubber Masterbatch
OTOS
phr
PPO
PVC
PVI
RAPRA
rpm
RSS
SBR
N-Oxydiethylene dithiocarbamyl-N'-Oxydiethylene-Sulfenamide
Parts per hundred rubber
Poly(2,6-dimethylphenylene Oxide)
Polyvinyl Chloride
Prevulcanising Inhibitor
Rubber and Plastics Research Association
Revolutions per minute
Ribbed Smoked Sheet
Styrene-Butadiene Rubber
SEM Scanning Electron Microscopy
SMR CV Standard Malaysian Rubber- Constant Viscosity
SRF Semi Reinforcing Furnace
STEM
TBBS
Scanning Transmission Electron Microscopy
N-tert.-Butyl-2-Benzothiazolyl Sulphenamide
xxi

TEM
TMS
TMTD
TMTM
TSR
ZDMC
Transmission Electron Microscopy
Turner, Moore and Smith
Tetramethylthiuram Disulphide
Tetramethylthiuram Monosulphide
Technically Specified Rubber
Zinc Dimethyl-dithiocarbamate
xxii

CHAPTER ONE
INTRODUCTION
1.1 GENERAL INTRODUCTION
The development of many new types of polymer blends as well as the usage of blends
has increased remarkably during the past few decades. This is because, for many
applications, single polymers provide inadequate performance. It is significantly
cheaper to produce a new material by mixing existing polymers than it is to develop
new monomers possibly requiring new polymerisation processes. Blends are often
used to combine the desired properties of individual polymers to obtain an improved
product. This is possible by careful selection and mixing of the component polymers.
There are two ways of forming polymer blends i.e. chemical blending and physical
blending. The properties of physical blends are different from those of parent
polymers and often are not simply an averaging of the properties of the two
components. They can be unique. The physical properties are also determined by the
physical structure of the blend. For many practical purposes, rubber products are
manufactured from blends of two or more dissimilar polymers. These blends are
generally classified as rubber-rubber and rubber-plastic blends.
Mixing of elastomers and compatibility began to be of scientific and technological
interest with the arrival of synthetic rubbers. Natural rubber (NR) is blended with
synthetic rubbers for a wide variety of purposes. These blends offer considerable
potential for the development of future new materials. The use of blends of NR with
general purpose synthetic rubbers mainly polybutadiene rubber (BR) and styrene
butadiene rubber (SBR) is (;Ommon place in the industry, especially in tyre building.
McDonel et al.(l) have reviewed the usage of elastomer blends in tyre applications.
Reduced compound cost, simplification or improvement in tyre building and
enhanced final product performance were the three main reasons for utilising blends
rather than individual elastomers. The development of the radial ply tyre is a
particular case where elastomer blends have proved to be beneficial. Blends of 70/30
NRlSBR have been found to give an optimum balance between the flex cracking
associated with NR and ozone cracking associated with SBR in radial tyre sidewalls(2).
Most elastomer blending continues to be based on physical blending procedures and is
widely carried out using internal mixers, two-roll mills and extruders. The properties

of new materials formed after blending are often determined by the exact mixing
technique.
The great bulk of polymer blends possess a heterogeneous morphology by virtue of
their immiscibility. The early work ofWalters and Keyte(3) on blends ofNR with SBR
was the beginning of an approach to e1astomer blends from both technical and
economic points of view. They demonstrated that elastomer blends are never truly
homogeneous and show discrete areas of each elastomer varying from - 0.5 flm
upward, depending on methods of mixing, elastomer viscosity, crystallinity, etc. An
elastomer blend need not be necessarily physically homogeneous to exhibit good
physical properties. The advantages of physically inhomogeneous systems in terms of
the ability to alter the phase morphology for specific performance criteria have now
been recognised(4). Frequently, it is possible to obtain new property combinations only
in this way, and hence, blended systems have become an important and accepted field
of elastomer technology. However, Bhowmick et al. reported that many physical
properties of rubber blends are insensitive to the details of the two phase structure(5).
Rubber product manufacturers currently using 100% special-purpose synthetic
rubbers or speciality rubbers in their compounds may well find that use of blends of
these rubbers with NR will enable them to achieve improvement in technical
properties with reduced compound costs by substituting part of the synthetic
component with NR. Blends of NR with speciality synthetics which combine the
excellent qualities of NR with the special properties of the synthetic component have
gained considerable importance in the field of polymer science. Nitrile rubber (NBR)
which falls in this group of speciality synthetic rubbers is regarded as the engineer's
rubber, as it combines excellent resistance to oils both at normal and elevated
temperatures with good physical properties and moderate cost. NBR is the basic
product used by rubber manufacturers in the preparation of a wide range of
engineering components. Attempts have been made in the past to blend NBR with
NR, for it was thought that the use ofNR would bring about improved processability
and better building tack, in addition to reduced material costs. When dimensional
stability is important for NBR vulcanisates, NR is often added in small amounts as a
non-extractable plasticizer or process aid, so that shrinkage of the vulcanisate due to
extraction of plasticizer during solvent or oil swelling is avoided. High green strength
and high strength of gum vulcanisates are the other favourable properties introduced
by NR into the blends with NBR.
Because of its strong polar properties, NBR is poorly compatible with NR which has a
non-polar, aliphatic nature. Since the polarity of NBR increases, with increasing
acrylonitrile, the compatibility of NR becomes poorer accordingly. For this reason,
2

NBR types with relatively low amounts of acrylonitrile are generally considered for
blending with NR. But, even with NBR containing only 28% acrylonitrile, the over
all picture of physical properties shows impairment with increasing amounts ofNR in
the blend. With up to 10 or 20% of NR in the combined weights of the rubbers, the
weakening of the strength level and other physical properties is still tolerable. The
very good swelling resistance of NBR compared with NR deteriorates with this
amount ofNR in the blend. Hence, NRlNBR blends are frequently used for economic
reasons, and in applications, where there is only a moderate demand on solvent swell
resistance.
With the increasing demands of the automobile industry (petrols with a higher content
of aromatic substances, higher operational temperatures), the requirements for the
resistance of rubbers to swelling and heat increase. Nitrile rubber with a very high
content of acrylonitrile, which has been used as the major blend component
throughout this study, represents a solution for these requirements.
1.2 OBJECTIVES
The main reason for carrying out this research is to assess the feasibility of increasing
market opportunities for NR by development of natural rubber (NR)/speciality
elastomer blends, to the benefit ofNR producers.
The availability of these blends will enable NR to take up part of the markets of
speciality synthetic rubbers. For example, if a manufacturer requires oil resistance in a
particular product, he will be forced to use an oil resistant rubber such as nitrile rubber
(NBR) because NR is deficient in this property. If the oil resistance of, say a 40/60
NRlNBR blend is adequate for that manufacturer's need, then NR will be able to
reach 40% of that market through displacement ofNBR.
This research is focused on blends of NR and NBR. NBR was selected as the
speciality elastomer because of its wide commercial usage in engineering
applications. Although NR is deficient in the above mentioned properties, it possesses
good gum stock tensile strength, tear strength, resilience, etc., which are also required
for engineering applications. Hence, new property combinations suitable for
specialised applications are to be expected from these NRlNBR blends. It is hoped
that NRlNBR blend compounds having physical properties superior to NBR
compounds and a tolerable degree of swelling in oils and fuels could be developed.
This would satisfy the ultimate aim of increasing consumption of NR by replacing
NBR used in various engineering applications with the NRlNBR blends.
3

The specific objective of this research is to study the physical properties of the
developed NRlNBR blend compounds in relation to rheology and compatibility of the
individual rubbers and mixing treatment, morphology and carbon black distribution in
the blends.
1.3 PLAN OF THE THESIS
Chapter 1 : Introduction
Chapter 2: A Review of Rubber Technology
The purpose of this chapter is to review fundamentals of rubber technology relevant to
this study. Initially a general background about NR and NBR, which are the two blend
components used throughout the study, is given. Details of the rubber mixing system
employed in this work and the influence of mixing on properties are considered. Short
summaries of factors affecting rheological properties of polymer melts; in particular,
the effect on viscosity are considered. This chapter also gives a detailed account of
reinforcement with carbon black, compounding and vulcanisation, all of which
influence the ultimate physical properties of a rubber vulcanisate. Finally, the swelling
of rubber networks and the influence of fillers on swelling are reviewed briefly.
Chapter 3 : A Review of Rubber Blends
This chapter provides a literature review of relevant work on rubber blends carried out
by other researchers. It includes a brief account of different techniques of blending
polymers, followed by a detailed review of factors which influence the properties of
polymer blends. In addition, parameters affecting carbon black distribution and
transfer in rubber blends and its effect on morphology and properties are considered.
A short summary of the major findings on carbon black distribution and transfer is
included.
Chapter 4 : Experimental
The purpose of this chapter is to provide sufficient details of experimental procedures
including standard test methods employed in the preparation of rubber compounds,
analysis of rheological behaviour, analysis of cure characteristics, microscopical
analysis, determination of physical properties and swelling measurements, in order to
4

guide interpretation of methods. This chapter also gives other researchers necessary
information to repeat this work, for future studies.
Chapter 5 : Results and Discussion
The results of the research mainly in the form of graphs are provided in this chapter.
The main purpose of this chapter is to discuss the results of the experiments conducted
throughout the research project. First of all, immiscibility ofNR and high nitrile (45%
ACN) blends is assessed in terms of solubility parameters of the two elastomers.
Subsequently, the rheology of blend components used in the preparation of both
single-stage and masterbatch blends is discussed. This is followed by detailed
discussion of the results of analysis of phase morphology, carbon black distribution
and properties; rheology, cure characteristics and physical properties. The
explanations are mainly based on the effects of mixing conditions and location of
carbon black within the blend rubber phase.
5

REFERENCES
1. Mc Donel, E.T., Baranwal, K.C. and Andries, J.C., "Polymer Blends", Vol. 11,
Paul, D.R. and Newman, S., Eds., Academic Press, New York, San Francisco,
London (1978) Chap.19
2. Sweeney, T. and Thomley, E.R., J. lnst. Rubber lnd., 1(6) (1967) 326
3. Waiters, M.H. and Keyte, D.N., Rubber Chem. Technol., 38 (1965) 62
4. Roland, C.M., Rubber Chem. Technol., 62 (1989) 456
5. Bhowrnick, A.K. and Stephens, H.L., "Handbook of Elastomers", Marce!
Dekker, Inc. (1988) p.193
6
CHAPTER TWO
A REVIEW OF RUBBER TECHNOLOGY
2.1 GENERAL BACKGROUND OF NATURAL RUBBER
2.1.1 STRUCTURE AND PROPERTIES OF NR
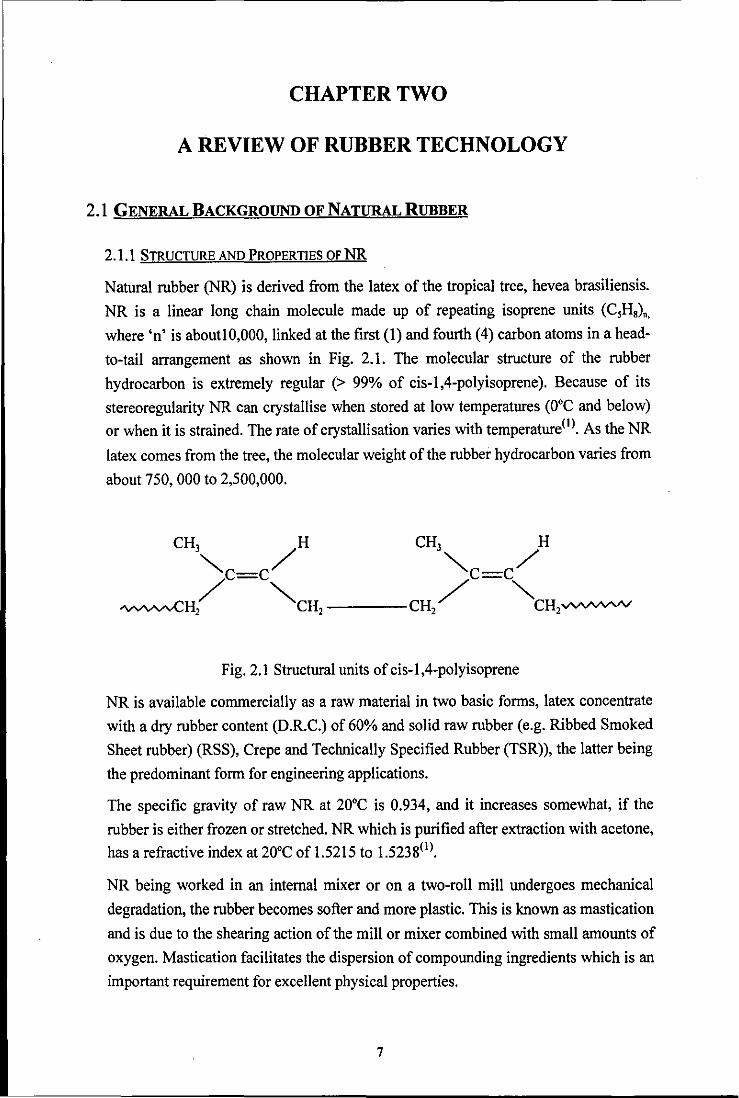
Natural rubber (NR) is derived from the latex of the tropical tree, hevea brasiliensis.
NR is a linear long chain molecule made up of repeating isoprene units (C,H,) •.
where 'n' is about10,000, linked at the first (I) and fourth (4) carbon atoms in a head
to-tail arrangement as shown in Fig. 2.1. The molecular structure of the rubber
hydrocarbon is extremely regular (> 99% of cis-I ,4-polyisoprene). Because of its
stereoregularity NR can crystallise when stored at low temperatures (O'C and below)
or when it is strained. The rate of crystallisation varies with temperature(l). As the NR
latex comes from the tree, the molecular weight of the rubber hydrocarbon varies from
about 750, 000 to 2,500,000.
Fig. 2.1 Structural units of cis-I ,4-polyisoprene
NR is available commercially as a raw material in two basic forms, latex concentrate
with a dry rubber content (D.R.C.) of 60% and solid raw rubber (e.g. Ribbed Smoked
Sheet rubber) (RSS), Crepe and Technically Specified Rubber (TSR)), the latter being
the predominant form for engineering applications.
The specific gravity of raw NR at 20'C is 0.934, and it increases somewhat, if the
rubber is either frozen or stretched. NR which is purified after extraction with acetone,
has a refractive index at 20'C of 1.5215 to 1.5238(1).
NR being worked in an internal mixer or on a two-roll mill undergoes mechanical
degradation, the rubber becomes softer and more plastic. This is known as mastication
and is due to the shearing action of the mill or mixer combined with small amounts of
oxygen. Mastication facilitates the dispersion of compounding ingredients which is an
important requirement for excellent physical properties.
7

To be practically useful, NR must be crosslinked to tie the NR molecules into a three
dimensional network. The chemical reaction between NR with sulphur under heat,
gives rise to the formation of crosslinks between long chain molecules. This
phenomenon is known as vulcanisation and is dealt with in greater detail in Section
2.5. Besides the use of free sulphur, sulphur donors such as tetramethylthiuram
disulphide (TMTD) and peroxide cures give rise to vulcanisates with good heat
resistance.
Another beneficial property of NR is its high rate of cure. However, since NR has a
relatively poor heat resistance, it can comparatively easily revert during cure.
Therefore, curing is generally done at relatively low temperatures, and the length of
cure cycles have to be strictly controlled. The higher the cure temperatures, the poorer
are the mechanical properties of the vulcanisates.
NR is amorphous under most conditions. It has an outstanding combination of strength
and resilience qualities, and in consequence its overall performance in engineering
applications is not yet matched by any other rubber. Due to the previously mentioned
strain crystallisation, which also occurs in vulcanisates, NR has, contrary to most types
of synthetic rubber, a high tensile strength of 20 MPa or more, even in gum
vulcanisates. By adding reinforcing fillers to compounds, the tensile strength can rise
up to 30 MPa. Even at higher temperatures, NR vulcanisates have a good tensile
strength(2) NR also has excellent resistance to chipping, cutting and tearing, and has a
high abrasion resistance. The tear resistance is also influenced by the strain
crystallisation ofNR(3,4) and is therefore very good, and much better than that of most
synthetic rubber vulcanisates. Highly reinforcing fillers in NR compounds give a much
better tear resistance than non-reinforcing fillers.
At ambient and slightly elevated temperatures, the compression set of NR vulcanisates
is relatively low. At lower temperatures the compression set appears to be poor due ~o
the tendency of the rubber to crystallise, while at higher temperatures, the poor heat
resistance of the NR vulcanisate has a detrimental effect on the compression set due to
chemical reactions(5)
Since NR is non-polar, its vulcanisates have little resistance to swelling in non-polar
oils and solvents. When in contact with mineral oils, benzene and gasoline, the volume
of NR vulcanisates increases several hundred percent. In alcohols, ketones and esters,
the vulcanisates swell less, however.
8

2.1.2 USESOFNR
NR is a very versatile raw material. It is used mainly as solid rubber. NR is used in
virtually all the major engineering applications, other than those involving special
requirements in heat, weathering or oil resistance.
NR has always been of great importance for producing truck tyres due to its low heat
build-up(6).
An important application of NR in the latex form is in the production of thin-walled,
soft products with a high strength, such as balloons, surgical gloves or sanitary rubber
products. Due to its strain crystallisation and thus, self reinforcing properties, NR still
dominates in these applications.
Its high elasticity, combined with a low hysteresis, also makes it an important material
for producing suspension elements and bumpers(7).
2.1.3 THE SMR SCHEME
Standard Malaysian Rubber (SMR) was the first, and is still today the most important
NR grade belonging to the group of Technically Specified Rubbers (TSR). The SMR
Scheme has been developed by Malaysia and the first Scheme was introduced in
1965(8). Other NR producing countries mainly Sri Lanka, Indonesia and Thailand have
joined this Scheme because of the strong marketing successes of SMR grades. All
rubber which has been classified according to this Scheme is generally referred to as
Technically Specified Rubber (TSR). By treating NR latices with hydroxyl amine
saits(9) it is possible to obtain NR grades which are largely stabilised against storage
hardening, e.g. SMR CY. The new SMR Scheme comprises of two new SMR CY
grades namely, SMR 10CY and SMR 20CY. These are identical to field grade material
SMR 10 and SMR 20, but with the constant-viscosity features obtained by treatment
with hydroxyl amine neutral sulphate. The viscosity levels of the two new grades 60
(+7, -5) Mooney units for 10 CY and 65 (+7, -5) Mooney units for 20Cy(lO) are
producer limits only. The viscosity-stabilised grades facilitate the production of
particularly uniform compounds.
2.2 GENERAL BACKGROUND OF ACRYLONITRILE-BuTADIENE RUBBER
2.2.1 STRUCTURE AND PROPERTIES OF NBR
Acrylonitrile-butadiene rubber, commonly known as nitrile rubber (NBR) is a
copolymer of butadiene and acrylonitrile (ACN). NBR is produced by emulsion
9

". ,
polymerisation and most of the synthesis processes are batch processes. Synthesis of
NBR is shown below.
IC;oN
CH2=CH-CH=CH2 + CH2=CH
butadiene acrylonitrile polymerisation
f;oN
+CH2 - CH = CH - CH2 HCH2 - CH+m1-'
acrylonitrile-butadiene rubber
Butadiene is a very stable non-polar hydrocarbon due to the symmetry of its molecular
structure. Acrylonitrile is a very polar molecule due to the lack of symmetry of the
triple-bonded nitrogen coupled with the nitrogen lone-pair electron effect. The lone
pair effect plus a large dipole moment created by the nitrogen develops a very strong
H-bonding potential. The butadiene monomer copolymerises into three distinct
structures i.e. trans-I,4, cis-l,4 and 1,2. The proportion of the individual forms differ
slightly with the temperature of polymerisation. The trans configuration dominates
(- 78%) in a typical nitrile rubber.
Commercially available NBR's differ in three major aspects:
(I) ACN content
(2) Polymerisation temperature
(3) Mooney viscosity
Classification of nitrile rubbers according to the content of acrylonitrile, together with
approximate values of swelling resistance are given in Table 2. I.
Acrylonitrile Content (%) Volume Swell (%)
low about 20 80-90
medium low 25 50-60
medium 30 40-50
medium high 35 33-40
high 40 25-33
very high above 40 less than 25
Table: 2. I Volume swell of nitrile vulcanizates (standard recipe) in a light petroleum
benzene mixture (3: I) after 72 hrs at 23°C(5)
10

.,".
Many of the vulcanisate properties are directly related to the proportion of ACN in the rubber(l 1,12) as shown below.
Low ""( -------- Acrylonitrile Content --------~) High
~( --------- Cost increases )
""Resistance to petroleum-based fluids & hydrocarbon fluids increases ~
( Solubility in ketones and esters increases (uncured) )
( Resistance to gas permeation increases )
( Compression set deteriorates )
( Heat & ozone resistance improves )
( Abrasion resistance improves )
( Tensile strength increases )
< Hardness increases )
( Density increases )
( Solubility in aromatic solvents decreases )
( Resilience decreases )
( Low-temperature flexibility decreases )
The polarities of acrylonitrile and butadiene are very different, and the polarity of the
copolymer becomes greater with increasing amounts of acrylonitrile. With increasing
ACN content in the copolymer, the solubility parameter also increases, changing the
solubility of NBR in solvents of various polarity. For example, acetone is a good
solvent for NBR containing 34% ACN. Similar criteria are also valid for indicating the
resistance ofNBR's to swelling in oils and other liquids.
Specific gravity of nitrile rubber is 0.96-1.00 and that of nitrile rubber compounds is 1.00-1.80. Refractive index of high nitrile NBR is 1.596(13)
NBR vulcanisates have good physical properties over a wide hardness range. The main
property of nitrile rubber is its oil and fuel resistance. It is this property, in conjunction
with its excellent physical properties, which account for much of its commercial use.
The strongly polar nitrile side groups increase the total polarity of nitrile rubbers, thus
decreasing the degree of swelling in substances of non-polar or slightly polar character,
such as petrols and mineral oils (Fig. 2.2). Swelling is less for carbon black filled
systems than for non-black fillers.
11

5or---------------,
50~ _ i
~ I ~ 40r
~ 30~ ~ I
~ 20~ ~ 10~
! O~
-m~~~~25~-3~O~~~~~4~O-~45~~~~ content of acrylonitrile ('le)
Fig. 2.2 Dependence of the swelling resistance of NBR on the content of combined
acrylonitrile: ASTM Oil No.3, 70 h at 100·d5)
In strongly polar solvents e.g. acetone, the NBR vulcanisates swell much more than
non-polar vulcanisates such as NR. Figures 2.3 and 2.4 show swelling of NBR in
various solvents! (4) The swelling resistance depends very much on the NBR grade, the
compound components, filler loading, type and amount of plasticizer, immersion
temperature, nature of the liquid and the degree of vulcanisation. Polymers of high
ACN content (35 to 40%) are not soluble in aromatic solvents such as toluene.
,------_._----------...,
Fig. 2.3 Swelling of acrylonitrile-butadiene copolymers! (4)
12

Fig. 2.4 Swelling of acrylonitrile-buta die ne copolymers(14)
Only nitrile rubbers with a low content of ACN are sensitive to the degree of
vulcanisation and they swell strongly at low crosslink densities. For nitrile rubber with
a high content of ACN, degree of vulcanisation has a relatively small effect on the
degree of swelling except in highly swelling liquids, the reason being that the origin of
the resistance to swelling is mainly the attraction between the dipoles of the -CN
groups of the ACN units.
Unlike NR, NBR's do not crystallise, either spontaneously or on stretching, and
therefore they have a low tensile strength in the unfilled state.
Like most other rubbers, NBR is not perfectly elastic, but exhibits some plastic
properties. Thus if deformed for a period, particularly at elevated temperatures it does
not completely recover, but exhibits a permanent set, the extent of which depends on
deformation experienced, time and temperature. In addition to retention of physical
properties in air or fluids at elevated temperatures, NBR used in sealing applications
must retain its ability to seal. The compression set of vulcanisates has commonly been
regarded as an indicator of their ability to seal in service. The resistance of NBR to
compression set is good and this enables its use in articles which are used under
permanent compression such as o-rings and seals. Compression set in sulphur
vulcanisates is lowest for carbon black filled compounds in optimised low
sulphur/sulphur donor systems(15) The compression set characteristics are generally
13

improved by longer curing times, higher curing temperatures and by using EV systems
or peroxides.
NBR vulcanisates have a distinctly better heat resistance than NR. Vulcanisates of
NBR are generally considered to be serviceable up to 120·C for continuous use(5,16),
while the maximum service temperature of NR is 100·C(lI,17). If oxygen is excluded
the ageing resistance ofNBR vulcanisates becomes even better(18). Naturally, the heat
resistance depends very much on the compound formulation. The thermal conductivity
ofNBR is of the same order as for NR.
NBR vulcanisates formulated with reinforcing fillers have an abrasion resistance which
is about 30% greater than that of comparable NR vulcanisates(19) The abrasion
differences between NR and NBR are largely dependent upon the filler loading ; they
become smaller with increasing loading. The viscosity of the raw NBR has almost no
effect on the abrasion loss(20)
Properties of vulcanised NBR can be modified to a great extent by the type and
quantity of the various other ingredients added to produce the final mix. Unfortunately
it is not possible to have all the desirable properties developed to the maximum extent
simultaneously and to achieve some desired result, sacrifice in some other property is
usually necessary.
2.2.2 COMPOUNDING, PROCESSING AND USES OF NBR
(a) Compounding and Processing
NBR compounds are mixed and processed using conventional rubber machinery and
follow general procedures used for NR (21) Compounding of NBR is similar to NR
with nearly the same ingredients used in NR compounds, but due allowance must be
made for the toughness of NBR. Processing is improved by the use of 'ester' type
plasticisers e.g. dioctyl phthalate (DOP). Addition ofNR also facilitates processing, the
slight reduction in solvent resistance is often tolerable.
Nitrile rubbers are not broken down by mastication to the same extent as NR and,
therefore, the viscosity of the rubber as produced has an important effect on its
processing properties, in addition to polymerisation temperature. "Cold" rubbers
require little premastication, and develop less heat during mixing. Low Mooney
viscosity rubbers absorb fillers and plasticisers more easily than high Mooney grades;
they also cause less heat build-up during mixing and fast extrusion rates can be
obtained(22). The decrease in Mooney viscosity through mastication is higher in those
types with a high original viscosity and very low in types with a low original
viscosity(5) For compounds with a low content of softeners and fillers, the NBR types
14

,-:,. with Mooney viscosities about 45-60 ML units are suitable. More highly viscous types
(70-80 ML units) are suitable for compounds with a high content of softeners and
fillers.
In order to achieve good mechanical properties, reinforcing fillers must be added
because the unfilled vulcanisates do not crystallise on stretching and hence lack self
reinforcing properties. Whilst all types of carbon black and non-black fillers may be
used with NBR, the most common practice is to use mainly the semi-reinforcing
varieties because this is a means of obtaining suitable physical properties allied to low raw material costs(22)
Nitrile rubbers are vulcanised by sulphur and accelerators in the conventional manner
used for NR. However, a main difficulty and a cause of reduced physical properties in
NBR vulcanisates is poor dispersion of normal ground sulphur. One way of
overcoming this difficulty is to use a MgC03 coated sulphur which produces free
flowing, non caking powders(23). Optimum sulphur and accelerator content depends on
a number of factors, include the danger of scorching due to heat development in
mixing. Increasing the amount of sulphur increases hardness as is the case with NR. A
sulphur content which is too high lowers tear resistance and elongation at break. For
optimum heat resistance and high temperature compression set properties, the sulphur
content should be kept low(12) Hofinann(24) recently studied the optimisation of
compression set in sulphur/sulphur donor cures of NBR. He concluded that the
following are required:
(a) NBR oflow acrylonitrile content
(b) N550 or N770 carbon black filler
(c) low plasticiser content ( or none)
(d) a combination of the accelerators tetramethylthiuram disulphide (TMTD), Bis(2-
benzothiazolyl) disulphide (MBTS), N-oxydiethylene dithiocarbamyl-N' -oxydiethylene
sulfenamide (OTOS) and optimised sulphur and/or 4,4' dithiodimorpholine (DTDM
sulphur donor) curative levels
(b) Uses
Because of its relatively high price, NBR is used in applications where, besides good
mechanical properties, there is also the requirement for good resistance to swelling in
oils and gasoline, good resistance to heat ageing, abrasion resistance and low
permanent set. NBR is the oil-resistant elastomer of choice for typical fluid sealing
applications. In many oil seal applications, low compression set and creep
characteristics are equal in importance to swelling resistance.
15

The main use sectors are:
(1) Automotive and aeronautical construction, which account for 65% of commercial
outlets. All parts expected to be in permanent or accidental contact with fuels, oils
or greases, such as o-rings, radiator hoses, and pressed cork gaskets.
(2) Hydrocarbon handling and transport, hoses for tanker loading and unloading,
flexible tanks, valve and piping gaskets. Dunn and Vara(25) reported that NBR
with 50% acrylonitrile appears to be good for automotive or marine engine fuel
line hose tubes.
(3) Rollers and cylinder lining in the textile, paper and printing industries.
(4) Safety shoe soles
(5) Adhesives for cementing:
(a) rubber
(b) plasticised PVC on various supports, since the presence of the polar group
renders it compatible with PVC
2.3 REINFORCEMENT WITH CARBON BLACK
2.3.1 THENA11JRE OF CARBON BLACK
Carbon black is formed by thermal decomposition of hydrocarbons. The particles of
carbon black are not discrete, but are fused 'clusters' of individual particles termed as
aggregates. An aggregate is composed of a number of spheroidal particles which are
formed in the flame and fused together in a single paracrystalline entity in which the
graphitic carbon layers are arranged parallel to the surface. An aggregate is the
smallest basic unit of carbon black under well dispersed conditions. These aggregates
appear to be the working unit, as they can be seen in vulcanised rubber.
The principal relevant properties of carbon black include
(1) Particle size, surface area and polarity
(2) Aggregate structure (bulkiness)
(3) Amount of carbon per aggregate
(4) Surface activity
(5) Surface chemistry and
(6) Trace constituents
The fusing of particles into aggregates is associated with the concept of carbon black
'structure', where 'structure' is a measure of the bulkiness of the aggregates. The
16

aggregates flocculate to form agglomerates (larger structure), held together by van der
Waals forces(26l Agglomeration has an important effect on the ease with which a
carbon black is incorporated in rubber. As aggregates are largely unaffected by the
mixing process, they exert an influence on the final reinforcement. Generally, the
higher the structure, the higher is the modulus of the vulcanisate.
Carbon blacks are mainly classified as channel blacks, furnace blacks and thermal
blacks according to the type of manufacturing process.
The surface of the carbon black particle, is very important for adsorption processes. A
carbon black particle consists of roughly concentric layers of graphitic structures or
very small crystallites with a high degree of disturbed and exposed graphitic layers and
their edges, giving it high irregularity and adsorption power(27). Besides the
geometrical factor of adsorption, the reactive groups of carbon black surface such as
acid groups, phenolic groups, quinone groups and carboxylic lactone groups
significantly influences adsorption(28)
2.3.2. THE PHENOMENON OF REINFORCEMENT
Reinforcement by fillers, especially carbon black, is one of the most important aspects
of rubber technology. For a long time technologists accepted the fact that the addition
of carbon black gave improved properties to rubber vulcanisates. Increased
reinforcement has been defined as increased modulus, rupture energy, tear strength,
tensile strength and abrasion resistance. A practical definition' of reinforcement is the
improvement of the service life of a rubber article. Kraus(29) has reported that a precise
definition of the term "reinforcement" is difficult because it depends somewhat on the
experimental conditions and the intended effects of the filler addition. He regards
reinforcement broadly as tl:e modification of the viscoelastic and failure properties of a
rubber by a filler to produce one or more favourable results without serious loss of
reversible extensibility. Kraus from his review of the literature on carbon black
polymer interaction concluded that bonding of polymer molecules to the surface can
occur by a variety of mechanisms, both physical and chemical. Moreover, he concluded
that the various complex phenomena of reinforcement are governed by strength of
surface bonds, a limiting state of adhesion, the particular distribution of bonding
energies or by the mobility of surface attachments(30). Uncured elastomers which are
mixed with a sufficient quantity of finely divided carbon black form a "carbon-gel
network" or "bound rubber,,(29)
The degree of reinforcement provided by a filler depends mainly on the development of
a large polymer-filler interface, which can only be obtained with particles of colloidal
17

dimensions. In non-reinforcing carbon black filled systems, the associations between
polymer and carbon black are weak, primarily physical, with the dispersed particles
free to move about in the matrix and through particle-to-particle associations, to
flocculate and c1uster(31), whereas in reinforcing carbon black filled systems, strong
carbon-polymer bonds are substituted for weak bonds, with the result that the filler
particles, form a part of the elastomer network and are no longer free to move
independently. The net result of this difference is improved modulus and failure
properties such as tensile strength and abrasion resistance.
Carbon blacks and silicas are the commonly used reinforcing fillers in the rubber
industry. In order to reinforce, carbon black must be adequately dispersed. In the early
stages of incorporation into rubber, the pellets are broken down into rubber-filled
fragments ('inclusions'). Continued shear stretches out the inclusions and brings about
colloidal dispersion of the aggregates(32) Hence, good dispersion involves reduction in
the size and number of highly loaded regions (inclusions), and bringing the matrix to
approximately the nominal loading of carbon black, at a scale of segregation(33)
approaching that of the carbon black aggregates. Gessler(34) found higher aggregate
breakdown with increasing compound viscosity or polymer molecular weight.
Moreover, he found that the breakdown was less in the low unsaturation polymers and
hence suggested that interaction between carbon black and polymer may exert an
influence.
Inclusions act as flaws when the rubber is stretched(35) and it is these pellet fragments
or inclusions which actually degrade the failure properties. The size of the iriclusions
affect the tensile strength(32). Schallamach(36) has shown that abrasion involves the
rupture of a great many tendrils of microscopic size and thus the presence of a large
number of small inclusions (each of which can produce premature failure of a small
tendril) is as harmful as the presence of a small number oflarge inclusions (which may
lead to breaking away of large pieces under abrasion conditions). Consequently, in
abrasion, it is the total volume of inclusions that is important rather than their size(32)
The choice of a grade of carbon black for a particular application depends on the
properties it will impart to the rubber vulcanisate, its processability and its cost. In
compounding with carbon black, the most important properties are surface area,
structure and loading. Generally the cost decreases with decreasing surface area
(increasing particle size). Dispersion time also decreases with decreasing surface area.
On the matter of vulcanisate properties, one of the most commonly specified properties
is the hardness which is related to the modulus at fairly low deformation. Hardness is
affected by carbon black loading. The same is true for the 300% tensile modulus. With
18
a given carbon black, tensile strength passes through a maximum as the loading is
increased through the practical range. The same is true for NR compounds(37). The
elongation at break decreases with increasing loading, over the same range.
Byers(3S) reported that the surface area and loading are the most important factors for
abrasion resistance. The lower surface area GPF (general-purpose furnace) carbon
blacks (N650 and N660) showed a rather small improvement in abrasion resistance of
NR compounds, regardless of the loading level, in comparison with the improvement in
abrasion resistance shown by the NR compounds containing HAF (N339 and N356)
carbon blacks. The abrasion resistance of the latter is considerably better and it is
highly dependent on the carbon black loading and influenced by structure.
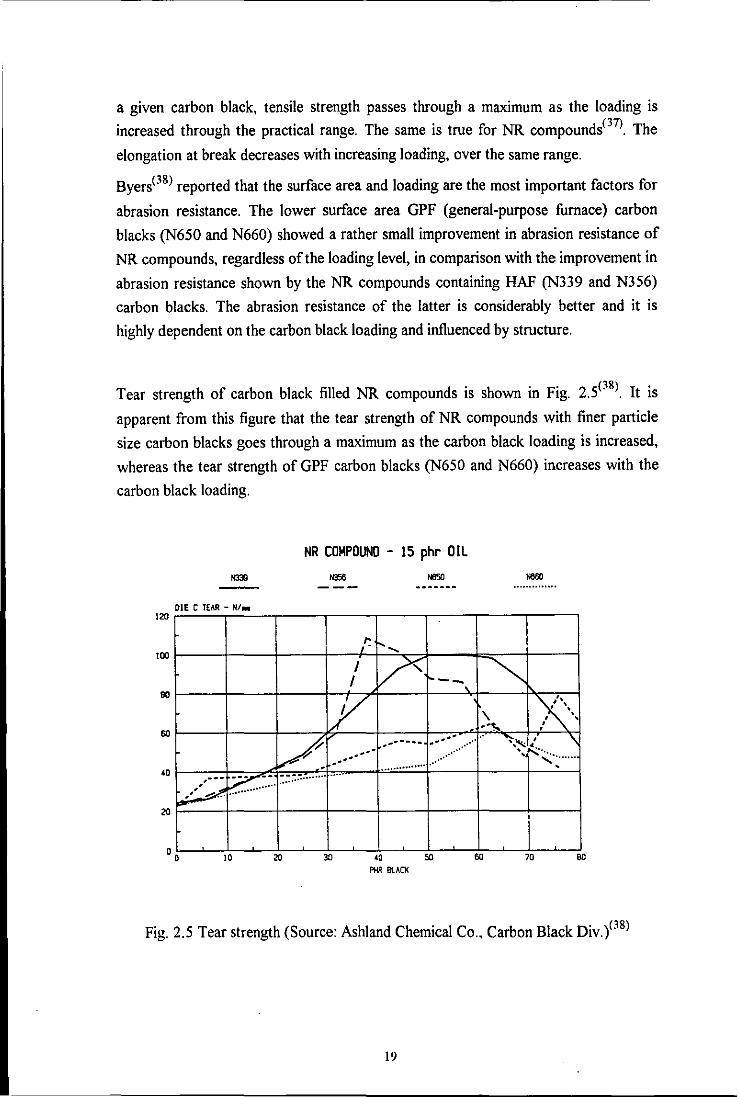
Tear strength of carbon black filled NR compounds is shown in Fig. 2.5(3S) It is
apparent from this figure that the tear strength of NR compounds with finer particle
size carbon blacks goes through a maximum as the carbon black loading is increased,
whereas the tear strength of GPF carbon blacks (N650 and N660) increases with the
carbon black loading.
NR COMPOUND - 15 ph~ Oil N660
DIE C TEAR - NI .. 120 r::---'--,--'=---,----,---,----,---,----,-----,
°O~~~10~~~20~~~~~-.~O-~~~~~~Mt-~~70~~~OO· PHR BLACK
Fig. 2.5 Tear strength (Source: Ashland Chemical Co., Carbon Black Div.PS)
19

Two important molecular network mechanisms of reinforcement are Bueche's
mechanism and Dannenberg's molecular slippage model.
Bueche(39), first of all, reported that reinforcing fillers e.g. various carbon blacks
have two things:
(1) they can be highly dispersed in rubber with particle diameters reaching as low as
IOnm
(2) the surface of each is chemically active and can undergo direct molecular bonding
with the rubber
He makes the point that with non-reinforcing fillers there is no molecular bonding
between the filler and rubber, and that in this case the filler can be treated as particulate
matter suspended in a viscoelastic material.
Reinforcing fillers increase modulus at high extensions to a greater extent than similar
non-reinforcing fillers because, in addition to the viscous contribution related only to
suspended particulate matter, there is an elastic contribution resulting from the strong
bonding between rubber and carbon black. The strong bonding acts as additional
crosslinking in the rubber vulcanisate and is associated, in Bueche's view, with the
stress softening (Mullins effect) which reinforced vulcanisates exhibit when they are
relaxed and then stretched for a second time.
Bueche, in his theory, deals also with the recovery from Mullins softening which
occurs when a vulcanisate is heated (up to 90°C) following the second extension cycle.
At elevated temperatures, network chains break and reform, and in the process the
original random distribution of network chains which is destroyed by the breakage of
shortest chains between filler particles (which leads to stress softening), is restored.
Dannenberg( 40) has pointed out that at elevated temperatures, filler particles are able to
move more easily in the matrix as the vulcanisate is stretched, and this movement
serves to distribute the stress load more effectively to the rubber network chains than
was the case before the sample was heated.
Dannenberg(30,40) in contrast to Bueche, reported that the attachments between rubber
and reinforcing fillers range from weak van der Waals bonds to primary chemical
bonding due to the energetically heterogeneous nature of the carbon black surface. His
view is that a major portion of the rubber molecules located at the filler surface can
undergo slippage and other molecular rearrangements when the resulting vulcanised
rubber system is stressed.
20

Dannenberg's molecular slippage model is shown in Fig. 2.6.
(I) ~ (2) ~
(3) .:.:..
(4) :::_ I I
(5)
(6) ~
Fig. 2.6 Molecular slippage model of reinforcement mechanism(30,40)
In Fig. 2.6 (top) three rubber chains attached to two filler particles are shown,
( 1) in the initial relaxed state (2) when complete extension of the shortest chain occurs on continued stretching
(3) & (4) molecular slippage, which requires much less energy than chain breakage (as
in the Bueche process) or the desorption or detachment of a surface bond, takes place
(indicated by the marks on the chains)
The above mechanism for stress distribution and molecular alignment has been
proposed by Dannenberg for the increase in strength of the rubber phase in reinforced
vulcanisates. As extension increases the deforming force becomes shared by more and
more of the rubber chain segments connecting the filler particles as molecular slippage
occurs.
When the sample is relaxed after extension, retraction is produced by elastic recovery
of the crosslinked matrix network. Recovery is not complete due to the rupture and re
formation of network chains under strain. An important point is that the chains in the
relaxed sample in contrast to the case of the initial relaxed sample «I) in Fig. 2.6) have
chains of equal length «5) in Fig. 2.6) produced by molecular slippage. Therefore a
second extension of the pre-stressed sample gives a lower modulus (Mullins softening).
As the system rests, random chain length is achieved «6) in Fig. 2.6), and eventually
the system returns nearly to its initial relaxed state.
21

2.3.3 FRACTIJRE AND WEA.'< OF FILLER LOADED RUBBERS
(A) Fracture
Fracture of rubber always takes place from points of weakness. These include flaws,
heterogeneities of composition or structure, cuts, moulding defects, gels, unavoidable
dirt particles, etc. When a rubber is deformed, the stresses concentrate in these regions
of weakness, are magnified greatly and can be many times larger than the average
applied stress(41) Generally, there will be a single flaw at which the stress is magnified
to the greatest degree and where fracture begins.
The strength of a rubber vulcanizate depends on its viscoelastic properties and such
processes as crack formation and growth which again determine the life-span of a
specimen. It has been shown(42, 43) that failure surfaces manifest typical characteristics
dependent on the nature of the test. Tensile failure is believed to be due to initiation of
a crack (from a small flaw) followed by its growth or propagation. It has been
found(42) that in a filled NBR vulcanisate the flaw leading to tensile failure starts from
one corner of the specimen. The tensile fracture surface also shows occurrence of two
different tear rates in the case of the filled NBR vulcanisate (slow tear markings
originate from the flaw, and at a certain loss of cross-sectional area fast tear and
ultimate failure occurs). Reinforcing fillers strengthen the tear resistance of non
crystallising NBR. In a filled NBR vulcanisate, tear starts from the nick end and tear
fracture is characterised by a few long flow lines. These flow lines merge, after some
length, to a long tear line. In filled NBR, the character of the tearing is a discontinuous
stick-slip process. A tensile ruptured NR filled specimen has shown(43) formation of a
deep depression at the sample edge, while tear fractured NR filled specimens have
shown the enhancement of crystallinity throughout the matrix and a rough surface.
Gent( 44) demonstrated crack initiation from spherical inclusions of various sizes and
coatings, embedded in rubber and obtained an expression for the minimum applied
stress for debonding as
O'k = 2[1tG;cE/3 rp]ll2
where G;c is the interfacial fracture energy, rp is radius of the filler particle and
E is the Young's modulus of rubber.
There is always some characteristic stress and energy for a fracture to begin and
the energy approach is most widely used in rubber.
Although the initiation of fracture is similar for all elastomeric materials, the
propagation of the same is very much different. The propagation depends on the strain
22

energy release rate G which is defined as the rate at which the strain energy is
converted into fracture energy with the growth of a crack. This' is shown
mathematically as
G = -2 ( oW I BA )
where W is the strain energy density of rubber
A is the surface area of the specimen
The crack propagation, or tearing, depends on factors such as viscoelasticity, strain
crystallisation in elastomers e.g. NR, reinforcement with carbon black, etc(45). In
multi-phase elastomers and interpenetrating networks, the higher strength arises from
the mechanism of higher viscoelastic losses.
Reinforcing carbon blacks increase the fracture energy over a range of temperatures
and rates. This is due to the following three processes:
(a) an increase in intrinsic strength
(b) higher energy dissipation in filled rubbers
(c) a change in the character offracture from a smooth process to a stick-slip or knotty
process which requires more energy.
In contrast, Mathew, Bhowmick and De( 46) reported that on the addition of fillers such
as HAF (N330) carbon black makes the matrix brittle and there are more cracks on the
fracture surface. Goldberg et al(47) made detailed studies on initiation of flaw sites of
SBR filled with 15, 25 and 35 phr carbon black and reported an increase in the size of
the flaw with an increase in the carbon black loading.
Also, the addition of carbon black must reduce the degree of stress magnification (and
hence load on the chains) at the tips of flaws. A filled elastomer has a higher resistance
to deformation than an unfilled one. This fact implies that for a given degree of
macroscopic extension, the chains in a filled specimen carry an average load that is
greater than for an unfilled specimen (due, in part, to strain amplification).
Flaws originally present in a sample are very small and cracks originating from them
become visible only after about 90% of the life of the test specimen has elapsed. For a
long strip of rubber with a small cut of length c, deformed in simple extension, the tearing energy is given by(48)
T = 2KcW
23
where W is the energy stored per unit volume in the portion of the strip under simple
extension (away from the cut) or simply the strain energy density
K is an insensitive function of the extension ratio which may be taken as
constant
(B) Wear
Wear of rubber is a complicated process which accompanies, in many cases, the
formation of ridge patterns and the detachment of small and large particles called
'debris'. The prime interest in the abrasion of rubber is due to the wear of tyres.
Conveyor belting, printing rolls and shoe soles are the other major areas where
abrasion plays a role. Abrasion is defined as the removal of rubber from a surface in
sliding contact with another surface. Abrasion is a mechanical cut growth process
which starts from stress concentrations set up in the rubber in the vicinity of track
asperities both due to the load on them and particularly to the stresses which are set up
in the rubber because offrictional forces between rubber and track asperities.
The abrasion loss will depend on the environmental conditions such as the pressure
between the two surfaces in contact, the nature of the hard surface against which the
rubber slides and whether sliding takes place over the whole of the contact area or only
over part of it. It will also depend on the material properties of a particular rubber.
It is generally believed(49) that abrasion of polymer occurs by two mechanisms:
(a) abrasive - resulting from microcutting by solid projections on the surface of
the abraded body
(b) frictional - resulting from the forces of friction created by proj ections which
deform the surface layers of the elastic material many times and
separate them off without tearing.
In the first type longitudinal furrows are formed on the abraded surface, and transverse
ridges in the second. The abrasive mechanism (a) of abrasion is less dependent on the
thermal properties of the elastomer used and more sensitive to the rubber (or
compound) properties that increase its resistance to cutting. i.e. type and level of
reinforcement.
Bhowmick et al.(50) have reported that the frictional mechanism (b) is observed in the
filled vulcanisates.
Mahdi(51) reported that compound factors which involve in the complicated process
of wear can be divided as primary and secondary factors. If other abrasion factors
24

are constant, the following were considered as the primary factors which favour
resistance to abrasive wear.
(a) low coefficient of friction ( J.l)
(b) high tearing energy ( T )
(c) high (up to certain level) hardness (H)
(d) high tan I:i (high hysteresis)
(e) an elastomer that has, or elastomers that have, low coefficient of abrasion ( ex )
Secondary factors are :
(a) increased tensile strength
(b) increased elongation at break and modulus
Estimation of the values of the primary factors may provide a possible prediction of the
performance of a rubber under specific abrasion conditions. Secondary factors may not
necessarily provide a good prediction of the extent of wear under given conditions.
The formation of a ribbed structure on the abraded surface of a filled vulcanisate may
occur through the mechanism of abrasion by roll formation(52). For example, Akron
abrasion tests on an NBR vulcanisate generated fibrillar coils which are agglomerated
in a ribbed structure on the surface(l9) Southern and Thomas(53) indicated that crack
growth (under dynamic condition) is an important factor in ridge formation. In filled
NR as the crack growth resistance is high, the small abraded particles coalesce to form
a large mass before removal. Removal of the ridges depends on the deformation and
strength properties of the elastomer at a range of temperatures. Abrasion appears to be
a combination of crack growth processes strongly influenced by temperature and
oxygen whereby the temperature is largely generated in the friction process itself
Schallamach(36) was the first to point out that very often in an abrasion process equally
spaced ridges normal to the direction of sliding appear as a result of abrasion. These
have been called abrasion, or Schallamach patterns (Fig. 2.7). Also shown in Fig. 2.7
is a cross-section of an abraded surface and the direction of abrasion. The mode of
mechanical failure in pattern abrasion is thought to be intermediate between tensile
break and tear propagation.
Abrasion by roll formation which is often observed with filled vulcanisates, has all the
features of pattern abrasion in a more severe form. In addition to the high extensibility
of the compound involved, smeary abrasion debris is also present. The edges of the
pattern turn over and stick to the flap forming a roll which leads to a co-ordinated
peeling action of the rubber, thereby increasing the abrasion considerably(54) Gent and
Pulford(55) noticed that under similar experimental conditions smearing also depends
on the type of compound. Carbon black filled compounds tend to smear more than
25

unfilled ones, especially NR, SBR and EPR. They suggested three contributions to the
abrasion process: (a) thermal degradation due to local frictional heating (b) oxidation
which could be assisted by the frictional temperature rise and (c) the formation offree
radicals in the rupture process which then also oxidise.
ABRASION --
Fig. 2.7 Schallamach abrasion patterns of two carbon black filled NR tread
compounds on different road surfaces and the profile of an abrasion pattern
obtained from a worn tire surface(36)
1,2 - 25 phr HAF ; 3,4 - 45 phr HAF 1,3 - fine tarmac; 2,4 coarse concrete
Magnification = 14x
Bhowmick(56) indicated that abrasion resistance of a filled compound may become
high due to dissipation of some of the sliding energy on the old surface which would
have otherwise been utilised to create new surfaces for crack growth. He concluded
that the size and shape of the ridges depend upon the frictional force per unit length of
the abrader in contact with the rubber and the nature of the rubber and the abrasive.
Also he observed that the small abraded particles which occur in the first step of ridge
formation due to microtearing, are not loose, and, hence, are not removed easily if the
strength of the matrix is high.
Zhang(l9) investigated the abrasion of filled NBR at various stages of wear. He found
that the addition of carbon black notably reduced the wear rate of NBR, especially
under severe conditions, and reduced its dependence on frictional work. He stated that
this could be due to the tensile strength gain of filled NBR as pointed out by Gent and
Pulford. Moreover, Zhang has reported that abrasion of NBR appears as a dry
26
(particulate) wear. The fonnation of macroridges on filled NBR appeared to involve
two distinct ridges one fonned after the other. First, fine and tightly spaced primary
ridges, followed by rough and sparsely spaced secondary ridges. As for the filled NBR,
both the scale and roughness of the secondary ridges happened to be uneven, even if
steady state had been reached.
The intensity of abrasion patterns increases with increasing coarseness of the track and
with decreasing stiffuess of the compound. The most important characteristic, is that
they increase the rate of abrasion. Mahdi(51) has shown recently that the finer the
abrasion pattern the lower the abrasion loss. The intensity and spacing of abrasion
patterns fonned with slipping wheels e.g. Akron abrasion tester, depends not only on
the load, but on the length of the sliding path.
Both ridge height and ridge spacing, two characteristic features of an abrasion pattern,
increase with increasing severity ofwear(57) In long wearing compounds, the pattern is
. very shallow and absent in some regions. The spacing of the abrasion pattern increases
with the load and depends on the elastic properties of the rubber. Rubbers with a high
extensibility and low modulus fonn more pronounced patterns than hard ones of low extensibility(54 ).
Thavamani and Bhowmick(58) found that, abradability increases linearly with ridge
spacing per unit frictional force. Further they found that abradability is inversely
proportional to breaking energy and shear loss modulus and is independent of the
nature of diene rubbers, their composition and the testing temperature.
2.4 RUBBER MIXING
2.4.1 THE BATCH MIXING SYSTEM
The rubber industry is dominated by batch mixing technology. While the throughput
advantages of continuous mixing are well recognised, commercial rubber operations
usually employ batch mixing because rubber is obtained in large solid bales, whereas a
continuous mixer is supplied continuously with particulates or free flowing materials.
The objective of the batch mixing process is to produce a compound with its
ingredients sufficiently thoroughly incorporated and dispersed so that it will process
easily in the subsequent forming operations, cure efficiently and develop the necessary
properties for end-use; all with the minimum expenditure of machine time and energy.
Viscosity, dispersion, scorch stability and cure rate are the properties relevant to
27

subsequent operations. Thus, in order to mix efficiently and profitably, one must direct
attention to raw materials, mixing procedures, mixing equipment and quality control.
Internal mixers are batch mixers which have become the workhorse of the rubber
industry due to their versatility and efficiency. In contrast to the two-roll mill, more
uniform compounds and larger batches can generally be prepared using the internal
mixers.
Common features of internal batch mixers are: (a) ability to exert a high localised shear stress to the material being mixed (dispersive
mixing) (b) a lower shear rate stirring (distributive mixing)
There are two basic designs of rotor in internal mixers; non-intermeshing (e.g. Farrel Banbury) (Fig. 2.8(a)(59», and intermeshing (e.g. Francis Shaw Intermix) (Fig.
2.8(b )(59».
WEIGHT CYl_INCIER---l
FEED MODULE
FLOATING WEIGHT ----jjHti!j~·I~
FEED HOPPE:R---l1H1--l-
DRILLED SIDIES--.
ROTORS --\-f-IHfHld-W\'1-r;
MIXING MOIDUI_t
DOORTOP ~==l~~~~~~~~~~ DQORTOP SUPPORT
LOCKING MECHANISM
~~~~--1
a
Fig. 2.8(a) Cross section of a Farrel Bridge Banbury showing tangential rotors(59)
28

b2======:!:::J
Fig. 2.8(b) Cross section ofa Francis Shaw Intennix showing interlocking rotors(59)
Intenneshing rotors provide better heat transfer and are therefore better for heat
sensitive compounds with lengthy mixing cycles. Intenneshing rotors such as used with
the Shaw Intennix machines are far less susceptible than those used with Banbury to
the slippage problem which occurs as the rotors try to draw the rubber into the
chamber(60).
29

Mixing Operation
There are four main processes, which take place during the mixing cycle.
(1) Viscosity reduction - In this stage the rubber is rapidly converted to a state in
which it will accept compounding ingredients and is achieved by three interdependent
mechanisms: mastication, temperature rise and chain extension(59).
(2) Incorporation - This stage is when the initially free ingredients become attached to
the rubber. This is also known as the wetting stage. The elastomer undergoes large
scale shearing and stretching deformations increasing the surface area for accepting
filler agglomerates, which are then sealed inside when masses of the elastomer are
folded or recombined.
(3) Distributive mixing - This is the process by which the composition of the rubber
compound is homogenised and the scale of segregation reduced. There are two sub
processes: laminar shear mixing and exponential (subdivision) mixing, of which the
latter is more efficient. A fill factor of less than one is needed for effective exponential
distributive mixing. Fill factor is the proportion of the mixing chamber volume
occupied by the finished mix. As the fill factor is increased a transition occurs from
exponential to laminar distributive mixing(59)
(4) Dispersive mixing - In this stage the filler agglomerates are broken down to their
constituent primary aggregates giving a fine scale of mixing. This is especially
important in the case of carbon black because at this stage an intimate contact between
the surface of the carbon black and the elastomer develops, resulting in strong
reinforcement. High stress is required for the disruption of filler agglomerates and
result from both shear and elongational deformations. Funt(60) and Mason(61)
discovered that the rate of agglomerate size reduction is proportional to deformation
rate. Furthermore, they found that for the same total strain, elongational flows give
significantly higher dispersion. More recently Clarke and Freakley(62) discovered that
dispersive mixing occurs by a sub-divisional fracture mechanism in both shear and
elongational flow regimes and under conditions of both low and high stress ..
Each of the above processes can occur simultaneously.
30

2.4.2 PROCESS VARIABLES AND CONIROL
(1) PROCESS VARIABLES
The following are the important variables affecting quality and efficiency of internal
mixing.
(a) Shear Stress
The general conclusion drawn from a number of theoretical analyses on the dispersive
mixing of carbon black in elastomers is that high shear stresses and low particle-particle
attraction increase the rate of dispersion, but that for a given particle there is a critical
stress below which dispersion will not occur. The maximum shear stress is inversely
proportional to the square of the gap, so this clearance is critical(63). Elongational flow is
also important in particle size reduction(64) .
(b) Shear Strain and Rate of Shear Strain
The total shear strain necessary for a particular degree of mixing can be imposed at any
rate, the shorter time required at high rates being offset by higher power consumption and
heat generation. Shear strain rates for a variety of types and sizes of mixers approximate
to rlx, where r is the peripheral rotor speed and x is the rotor tip clearance. Therefore,
small mixers must be run at higher rotational frequencies to give the same shear strain rate
as larger mixers(63)
(e) Rotor Speed
Rotor speed directly affects shear strain rate (or deformation rate) and thus the speed of
mixing. Although high rates of deformation obtained by high rotor speeds give rise to high
torques in the early stages of a mixing cycle, they are rapidly reduced due to the reduction
in batch viscosity associated with the rise in batch temperature and can result in a
deterioration in dispersive mixing. This has been attributed to the strongly non-Newtonian
behaviour of rubber(59) Hence to retain a high viscosity in the rubber for dispersive
mixing, a low rotor speed is desirable, to minimise the increase in batch temperature.
Low rotor speeds may enable the requirement for a second dispersive mixing operation to
be avoided (due to improved filler dispersion) and, allow curatives to be added (due to the
low batch temperature), considerably reducing the total cost of mixing and the associated
batch handling(65) As rotor speed is reduced, at the expense of extended mixing times,
mixed-material properties which depend on filler dispersion are improved. The rate of
31

distributive mixing is a function of rotor speed, proceeding more rapidly as speed is
increased.
(d) Ram Pressure
The function of the ram is to keep the compounding ingredients in the mixing area. In
practice a high ram pressure, up to 0.55 MPa, has definite advantages, especially for high
viscosity mixes, as it decreases voids within the mixture and increases shear stress by
reducing slippage. In addition, increasing pressure increases the contact force between the
rubber and the rotor surface, thus increasing the critical stress so that flow begins at a lower temperature(63).
The force applied to the ram should be sufficient to prevent the upthrust of the batch from
displacing it upwards. The upthrust is strongly dependent on fill factor. Often, available
ram force places a practical limit on fill factor.
A substantial reduction in ram pressure causes a drop in the mixing efficiency.
(e) Temperature
Temperature control is an important factor in mixing as the temperature of the mixer
exerts a strong influence on the characteristics of mixing. This is shown by the first-batch
effect, where the physical properties of batches produced immediately after
commencement of mixing are significantly different from those subsequently produced
when the mixer has achieved its "operating temperature". This effect and subsequent
variations in the properties of batches are reduced by controlling the circulating water
temperature.
Water-tempering systems usually control the circulating-water temperature in a range
extending from the feed-water temperature up to approximately 80°C. Batch-batch
uniformity of mixing has been improved in this way. However, only the temperature of the
circulating water is controlled directly. The temperature gradients through the chamber
and rotors, and the batch temperature, will also depend on other mixing variables(59)
With a mixer having a variable-speed drive the batch temperature can be controlled
directly. The batch temperature will remain constant if the mechanical energy input via the
rotors is equal to the heat extracted from the batch.
32

(f) Fill Factor
Fill factor is the proportion of the mixing chamber volume occupied by the finished mix. It
is calculated as shown below.
Fill factor = Volume of batch
Net volume of chamber
where Volume of batch = Batch weight
Specific gravity
Efficient mixing occurs when the mixing chamber is underfilled(66). Freakley and Wan
Idris(66) found that the flow patterns depend upon the fill factor. Fill factors in the range
0.65-0.85 are generally used, depending on mix type. Highly reinforced compounds mix
more successfully towards the lower end of the range, while moderately reinforced
compounds can be mixed effectively at the upper end of the range(59). Dizon(67) has shown
that there is a maximum fill factor for effective dispersion which depends upon the type of
carbon black. Very low fill factors are uneconomic and very high fill factors result in some
of the material not taking part in mixing. Batch temperature, measured at either a constant
mixing time or energy, increases substantially as fill factor is increased, over the whole
range of fill factors(65)
(g) Mixing sequence
In an ideal mixing sequence, all the ingredients of a compound are charged into an internal
mixer together and mixed in a single cycle, without danger of scorch. General-rubber
goods compounds can be mixed according to this ideal sequence, by using a variable
speed drive or, in the case of single speed mixers, by mixing at a sufficiently low rotor
speed to avoid increase in batch temperature, which would prevent the addition of
curatives.
Three-stage mIXIng sequences having the sequence: masterbatch, remill, and final mix,
are used for compounds containing large quantities of reinforcing fillers. Each stage is
carried out in an internal mixer. In the masterbatch stage, the rubber and the reinforcing
filler are mixed at a high rotor speed (40-60 rpm, depending on the size of the mixer),
together with any other ingredients which are insensitive to temperature. For moderately
33

reinforced compounds the remill stage may not be necessary or as an alternative a two-roll
mill can be used for the remill stage, as the environmentlhealth problem of loose filler does
not arise.
Freakley(68) has reported that mixing time (or mixing energy), fill factor and rotor speed
are the dominant variables, while ram pressure and circulating water temperature exert a
lesser effect on mixing performance.
Brantley(69) evaluated the effect of rotor speed on mixing and found that
Increasing rotor speed:
(a) increases energy consumption
(b) reduces mixing time
(c) increases discharge temperature
(d) reduces Mooney viscosity
(2) PROCESS CONTROL
There are three main criteria used to determine when a compounding ingredient should be
charged into an internal mixer or when to end the mixing process. These are mixing time,
batch temperature and mixing energy. The aim is to guarantee the quality of the end
product, avoid overmixing and reduce variation between batches. Mixing time and energy
are often used to determine when materials should be added into the mixer, whereas
temperature is generally used only as a discharge criterion.
Mixing time does not provide any compensatory adjustment for the influence of relatively
uncontrolled variables, such as mixer temperature and feedstock properties, on mixing
performance. Batch temperature is influenced strongly by variations in mixer
temperature(70) It is sensitive to mixing performance and provides a good indication of
state of mix. The changes in power consumption in a typical rubber mix are indicative of
stages in the process, such as wetting, dispersion and plasticisation and can be related to
the development of end product properties. A more precise and reproducible control of
the mixing cycle can be obtained by considering the energy input at various stages in the
cycle in terms of both instantaneous power and integrated power or work input. Mixing
energy, which is the power consumed by an internal mixer, minus the power consumed to
run the empty mixer is measured by a power integrator and this criterion provides a
reasonable indication of mixing performance(59,71).
34

Brantley, Jr., reported that a mixing procedure based on the power profile gives more
uniform mix quality than one based on temperature. Energy required for mixing can be
reduced with slightly higher discharge temperature by increasing cooling water
temperature(69).
2.4.3 EFFECT OF MIXING ON PROPERTIES
Mechanical properties of SBR 1712 compounds and vu1canisates containing ISAF (N220)
carbon black obtained from very short to more than adequate mixing procedures are
given in Table 2.2(32). The data show how reinforcing abilities are influenced by variations
in mixing procedure. After 1.5 min. of mixing, the tensile strength attained is two-thirds of
its maximum value. Other failure properties such as elongation and abrasion behave in a
similar manner, i.e. reaches a maximum and then levels off. The abrasion resistance is
about 40% of that of the best dispersion (two-stage). However the tear strength is quite
insensitive to mixing time. 100% modulus drops from 34 kgf/cm2 for the short-time mixed
vu1canisate to less than half that value for the vu1canisate from the fully mixed compound.
The reduction in 100% modulus with increased mixing time, which is a reflection of the
reduction in viscosity has been attributed to the breakdown of carbon black agglomerates.
The mechanism proposed by Boonstra and Medalia for the reduction in viscosity of a
compound with increased mixing is given in Sub-section 2.5.3. More recently Clarke and
Freakley(72) attributed the reduction in viscosity of an uncured SBRJN330 carbon black
compound during mixing to disagglomeration of carbon black and mastication of the
elastomer. The effect of mixing time on mechanical properties of SBR compounds and
vu1canisates is in line with the results ofDannenberg(73).
Also, Dannenberg studied the effect of carbon black mixing time on properties of a NR
tread compound and a nitrile rubber compound both containing 50 phr carbon black.
Increasing the carbon black mixing time from 1.1 to 4 min. did not significantly alter the
properties of the NR tread compound. Hence Dannenberg suggested that the mixing of
carbon black with NR is accompanied by a concurrent process of rapid wetting and
disintegration of carbon aggregates and further mixing does not significantly influence the
aggregate size. The nitrile rubber compound showed a rapid increase in tensile strength
with increased carbon black mixing time, as its pure gum tensile properties are in the same
class as SBR. However similar to NR, in other properties NBR is rather insensitive to
mixing.
35

Mixing Time (min.)
Property 1.5 2 2.5 3 4 8 16 Two
stage
Tensile strength 173 220 245 265 260 265 255 265
(kgflcm2)
100% Modulus 34 31 27 20 17 15 12 15
(kgflcm2)
300% Modulus 130 146 142 127 128 122 119 123
(kgflcm2)
Elongation (%) 380 460 490 540 530 540 530 540
Hardness (IRHD) 65 65 64 62 61 59 59 57
Tear strength (kgflcm) 40 40 40 43 41 41 39 41
Abrasion (Akron, vol. 289 194 142 133 136 - - 122
loss,cm3/106 rev.)
Permanent set, % 4.6 4.2 4.2 3.8 3.4 2.9 2.8 -
Mooney viscosity 133 122 114 97 83 68 63 35
ML (1+4) 100°C
Dispersion rating (%) 23.6 71.4 86.4 96.9 99.3 100 100 100
Heat build-up 51 49.5 48.5 46 44.5 41 38.5 -
Cure time: 60 min. @ 144°C for sheets, 70 min. @ 144°C for thicker specimens
Table: 2.2 Effect of mixing time on properties of single-stage mix of ISAF (N220) carbon black in oil-extended SBR_1712(32)
Hess et al(74) reported that for SBR compounds, with increasing mixing energy, the
modulus levels were slightly higher for the finer carbon blacks and lower for the coarser
grades. Also he found that the 300% modulus of EPDM compounds increased slightly at
higher mixing times, but the dominant variables were dibutyl phthalate absorption
36

(DBPA), carbon black loading and oil loading in that order of significance. In SBR
compounds the tensile strength increased by about 8-12% (across the range of carbon
blacks studied) as the mixing energy was increased from 750-1400 MJ/m3• Carbon black
surface area was the main variable affecting the tensile strength.
Wijayarathna et al.(75) studied the effect of mixing temperature and rotor speed on the
tensile strength and elongation at break of nitrile rubber vulcanisates containing both HAF
(N330) and ISAF (N219) carbon black. The stress at break (ab) or in other words tensile
strength reaches maximum values at temperatures between 65·C and 100·C at a rotor
speed of80 rpm as shown in Fig. 2.9. When mixing is carried out at low temperatures and
high speeds, the local heat generation facilitates incorporation, reducing the stiffness of the
rubber matrix and the slippage between the mix and the mixing chamber. Thus the rate of
improving stress at break by increasing rotor speed is higher for low temperature mixing
(Figures 2.9 and 2.10). However, the stress at break is reduced when mixing is carried out
at increased rotor speed and very high mixing temperatures. This was attributed to
reduced shear stresses in the gap between rotor nip and chamber wall causing inferior filler
dispersion. Poor mechanical properties of compounds mixed at very high temperatures and
high rotor speeds also result from thermal and mechanical degradation of the rubber.
11. ~
U.O , ,Qr - 0"0-6 - - -04
, 0-0' _---0-- __ 12.5 ,p'..... 0 -'0-- -, ,
'-0 .6 .uA - __ IO.G
I ... 6 l1 ....
• " I:>.
, ~ , --,f'. 0,
, -.(;> >., - , , I:>.
I 0"
, .. ~/I:>. 0 ,. ' .. tor J;l'ud I
I:>. '"
2.5 _
, , • " " " '" U~ 150 I7S
Fig. 2.9 Tensile strength ofNBR vulcanisates formulated with both HAF (N330) and
ISAF (N219) carbon black as a function of mixing temperature at various rotor speeds(75)
37
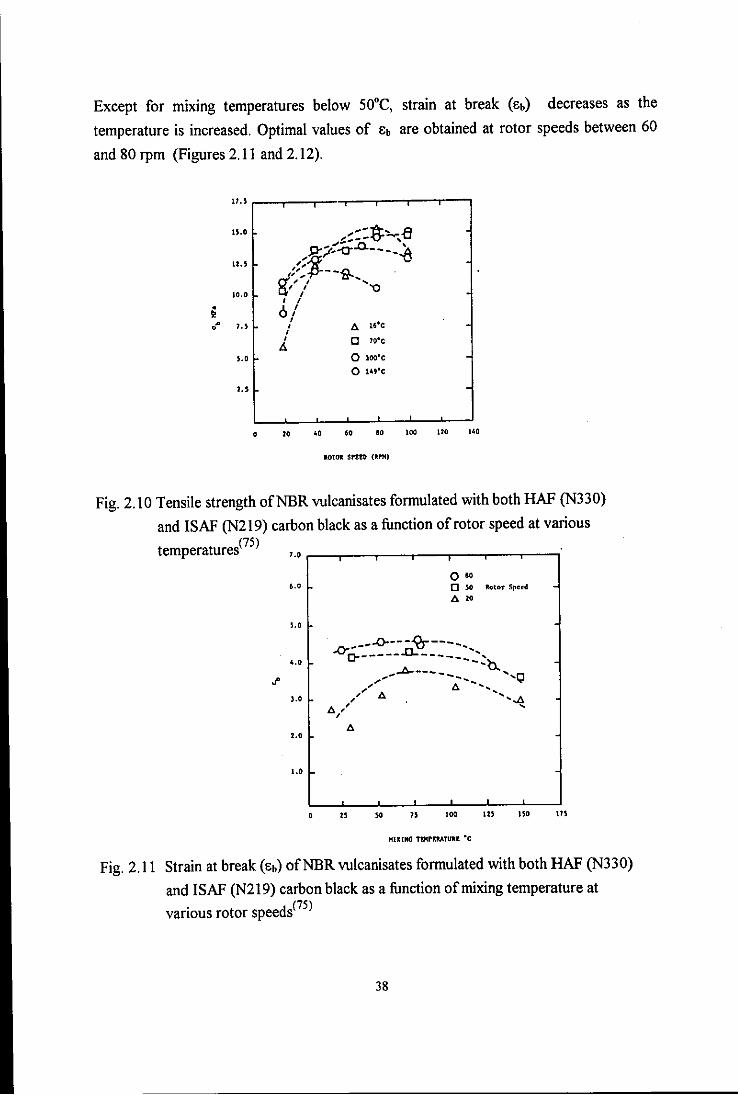
Except for miXIng temperatures below 50'C, strain at break (eb) decreases as the
temperature is increased. Optimal values of eb are obtained at rotor speeds between 60
and 80 rpm (Figures 2.11 and 2.12).
17.5
15.0
U.5
10.0
• ~ • 7.' 0
'.0 -
7.S -
.OTM SPUD (UM)
Fig. 2.10 Tensile strength ofNBR vulcanisates formulated with both HAF (N330)
and ISAF (N219) carbon black as a function of rotor speed at various
temperatures(75) 7.0 ,----.,r---r--..---.--..,----,--,
0" 6.0 o so Rotor SI'~t'd
'" 20
'.0 -0----:<2;----0:0---: ____ ..0.: - ___ : ..........
-- b-~--- ..... ......... --...... 'Q ,'" ~ .......
" A ...... ~
'.0
'.0 A " ... ,
'.0
1.0 I-
• o " so " 100 125 150 '"
MIXIIIG TtKI'E1V.TUltIt ·c
Fig. 2.11 Strain at break (eb) ofNBR vulcanisates formulated with both HAF (N330)
and ISAF (N219) carbon black as a function of mixing temperature at various rotor speeds(75)
38

7.' 0 , 6.' A " .
o 100 ITn,. ·c)
0130
••• , ... ,/!A-----6.... ~" 0 .........
'.0 ,.. o----~-()-----~---~ .!' .0----
,,' 0- ....
••• " "''0.. 6 ........ , 0,
2.'
I.'
o
• 20 .. .. .. '00 110 1'0
"aroa SPl:UI (JI'K)
Fig. 2.12 Strain at break (eh) ofNBR vu1canisates formulated with both RAF (N330)
and ISAF (N219) carbon black as a function of rotor speed at various mixing
temperatures(75)
Dannenberg(73) reported that high temperature mixing resulting from high speed internal
mixing effects only a slight change in mechanical properties of a NBR compound
containing SO phr HAF (N330) carbon black, and this property of heat resistance makes
NBR an outstanding industrial product. However high temperature mixing caused an
increase in 300% modulus, lower tensile strength, and elongation, lower hardness, lower
hysteresis losses, lower permanent set, increased abrasion resistance and lower tear
strength of the NR tread compound. He attributed these changes to changes in the NR
matrix such as thermal breakdown, oxidative crosslinking of the rubber and the formation
of a carbon black-rubber gel complex.
Lee(76) established a new technique for improving the degree of mixing of the filler in an
elastomer matrix and studied the effect of the same on mechanical and permeability
properties. This technique includes a unique heating and cooling mixing procedure in
conjunction with surface modification of the carbon black and choice of polymers. It was
proposed that the cooling cycle enhanced carbon black dispersion, while the heating cycle
decreased micro-void concentration. The rubber used in this study was polychloroprene.
39

Cyclically mixed polychloroprene showed an improvement in the degree of mixing over
the conventionally mixed polychloroprene. It was noted that mechanical properties such as
tensile strength, ultimate elongation, fatigue life, permanent set, hysteresis and
permeability properties of the cyclically mixed polychloroprene are superior to those of the
conventionally mixed polychloroprene. Lee, finally concluded that the good state of mix
obtained using the new mixing technique (Table 1 of Appendix) can enhance the
mechanical and permeability properties of filled elastomers.
2.5 RHEOLOGY OF POLYMER MELTS
2.5.1 GENERAL RHEOLOGICAL BEHAVIOUR
Rheology in its broadest definition is the science of flow and deformation of matter. The
greater part of rheology is concerned with the interrelation of stress, strain and time and
their dependence upon such factors as temperature, shear rate, molecular weight,
concentration of various additives and chemical constitution. Polymeric fluids exhibit
viscous behaviour in steady-state flows, but transient flows invoke viscoelasticity.
Simple shear is the most important type of deformation in studies of polymeric materials.
For example, steady-state laminar flow of a liquid between two parallel plates set in
relative motion at constant speed is a simple shear flow with a constant strain rate(77)
The viscosity of rubber can vary substantially with deformation rate, and thus the
rheological properties cannot be defined by measuring viscosity at one strain rate.
Rheological properties are often presented in the form of a flow diagram which plots shear
stress as a function of rate of deformation.
For Newtonian (ideal) fluids these parameters are related by
t = 11 Y
where 11 is the viscosity
t is the shear stress
y is the shear rate
40

For non-Newtonian fluids e.g. polymer melts,
t = f( y)
For many polymers it has been found that the flow curves - shear stress against shear rate -
can be described by a simple power law of the form
t = K yn (also known as the Ostwald de Waele equation/97)
where K and n are material parameters
K is the consistency index and is a measure of the fluidity of the material, a high value of K
indicates a very viscous material. n is the power law (flow) index and is a measure of the
non- Newtonian behaviour of the fluid. For a Newtonian fluid n = 1 and K is the viscosity.
The more n differs from unity, the more the system is non-Newtonian. For
n < 1, a fluid is called 'pseudoplastic' and the viscosity decreases with increasing shear
rate; for n > 1, a fluid is called 'dilatant', and the viscosity increases with increasing shear
rate. For rubbers n is generally in the range 0.15-0.4 (n < 1)(59) and K is generally in the range 70-120 kPa.s(79).
The Ostwald de Waele power equation is the most widely used empirical model for
representing melt-flow behaviour because of its analytical simplicity as well as its ability to
represent the viscous behaviour of the system.
In logarithmic form the power law equation may be written
log t = log K + n log y Plots of log t versus log y for various polymers are often linear through substantial ranges
of operation.
It is a direct consequence of the shape of a pseudoplastic flow curve (plot of t against
y) that there is no constant of proportionality between shear stress and shear rate.
Therefore instead of the coefficient of viscosity (,,) which we use with Newtonian liquids,
it is more common to refer to the 'apparent viscosity' ". defined as shear stress/shear rate
i.e. ". = t / Y
The apparent viscosity is the slope of the secant line from the origin to the shear stress at
the given value of shear rate as shown in Fig. 2.13.
41

SHEAR STRESS T
RATE OF SHEAR '1
o , !
Fig. 2.13 Plot of shear stress 1 against shear rate y for a non-Newtonian fluid(80)
Behaviour of apparent viscosity with rate of shear for dilatant, Newtonian and
pseudoplastic fluids is illustrated in Fig. 2.14, shown below.
>-
DILUIJIT FLUlO
i r-E==:::::=--------NNEiEw~TON1AN :;: flUID
!i; w
~ !:l
SHW RAlt:(jl
I'SEUOOf'LJSnc FUJIO
Fig. 2.14 Apparent viscosity-shear rate curves for a dilatant, a Newtonian and a pseudoplastic fluid which have the same apparent viscosity at zero shear rate(81)
42

The decrease in the apparent viscosity as the rate of shear increases is of great importance
in the processing and fabrication of e1astomers. Viscosity decreases nearly linearly with y on a log-log plot. In this linear range, the power law
't = Kyn
1]. = K Y n·( equation applies
2.5.2 EFFECT OF TEMPERATIJRE ON VISCOSITY
Two important aspects of rubber mixing are the dependence of viscosity on temperature
and shear rate.
The viscosity of most polymers changes greatly with temperature according to the
Arrhenius equation(80)
1] = A e EIRT
at temperatures 80°C or more above their glass transition temperatures. A is a constant at
a given shear stress or rate. E is the activation energy and is generally in the range 40 -
200 kJ I mole. R is the universal gas constant and T is the absolute temperature.
Shear stress is a significant parameter in filler dispersion; it is directly dependent on
viscosity. Hence, shear stress is dependent on the temperature of the mix.
In the case of polymer melts apparent viscosity, 1]. is a function of the rate of shear
characterised by either 't or y , as well as a function of temperature. The temperature
coefficient of the apparent viscosity must be specified at constant shear stress
(8r!a loT ), or constant shear rate (01]alaT )i . In general the two will not be equal and two
Arrhenius equations resuIt(77).
( n) = Ae EilRT "a y
2.5.3 EFFECT OF FILLERS ON VISCOSITY AND EFFECTIVE FILLER VOLUME FRACTION
The rheological curves of rubber-carbon black systems conform approximately to the
Ostwald de Waele empirical equation, given in Sub-section 2.5.1.
43

Zakharenko and co-workers(82) found that the non-Newtonian or power-law index (n)
increases with the content of active filler i.e. n changes linearly with the filler content. For
P-20 polyisobutylene and its mixtures with carbon black
n = 1 + 0.012 c
where c is the filler content ( parts per 100 parts of polymer by weight)
However the value of n is unchanged in the presence of inactive filler e.g. chalk. i.e. it is
the same as for the pure rubber.
Moreover these researchers found that the viscosity-temperature relationship of carbon
black filled rubbers is also governed by the exponential expression 'l] = A eFJRT, as for pure
elastomers. The temperature coefficient of viscosity ilrl.lOT and the activation energy E,
were found to be independent of the nature and amount offiller(82)
The relative influence of different types of carbon black on the viscosity does not appear
to depend strongly on shear rate(83). Higher carbon black structure gives higher viscosity
which is readily understood on the basis of the occluded rubber theory(84). An even
stronger effect is found from surface area. At constant structure level carbon blacks of
higher surface area (i.e. lower particle size) give higher viscosity(83), which may be due to
the formation of more bound rubber, or to the stronger inter-aggregate association
expected with higher area carbon blacks. Increased carbon black loading has the obvious
effect of increasing the viscosity of the compound and can be counteracted by using more
oil in the compound(8S).
The greatest effect of carbon black on the viscosity relative to unfilled polymer is observed
at low shear stresses or rates as illustrated in Fig. 2.15(29) with data on HAF (N330)
carbon black in a linear narrow distribution solution copolymer of butadiene and styrene
(75:25) of Mw = 260,000. Kraus has suggested that this phenomenon involves secondary
aggregation effects. At high shear rates the effects of aggregation are smaller.
44

~ ..
,o'~ ____ --,;:--___ ~ 10' 10' 10'
'1"1 dynu/cm2
Fig. 2.15 Apparent viscosity vs. shear stress for a carbon black filled narrow distribution linear copolymer ofbutadiene and styrene(29)
When the unfilled polymer is strongly non-Newtonian, the additional shear dependence
due to added carbon becomes small and the viscosity-shear stress curves become more
nearly equidistant along the log 1"\ axis. Fig. 2.15 shows the ratio 1"\(filled)/1"\(unfilled) to
increase greatly as the shear stress is reduced below 10s N/m
2•
At high shear stresses i.e. above 10s N/m2, the unfilled polymer becomes increasingly non
Newtonian, the viscosity ratio becomes roughly constant (at equal shear stress), as in the
data reported by Smit<86) for RAF (N330) carbon black in SBR 1509 (Fig. 2.16).
Smit has found that the relative viscosity
l]r = [1"\(filled) 11"\(unfilled) 1 "'''''.n~e·Cons''n'
where c is the volume fraction of filler, varies relatively little with shear stress
(t > 1 OS N/m2) or temperature.
45

10'
.' .' " ,,'
10'
0 ~
•• " Q ~
'" 10' ~.~~
,,~ -Si
'I'
10' 10' 10' 10'
1"', dynu/em2
Fig. 2.16 Apparent viscosity vs. shear stress for carbon black filled conventional SBR(86)
Smit assumed that the particles are covered by a rigid, immobilised adsorption layer,
which effectively increases the filler concentration as no reasonable shape factor was
found based on representation of the structure aggregates. The estimated thickness of this
layer was between 2.5 and 7 nm. This work was superseded by the work ofClarke and
Freakley(72), who found that there is no immobilised rubber associated with primary
aggregates either as occluded rubber or as an adsorbed layer on the carbon black surface.
This is in contrast to Medalia who postulated the existence of occluded rubber within
primary aggregates which, in a similar way to the immobilised rubber, contributes to the
effective volume fraction of filler(87) Clarke and Freakley(72) attributed this finding by
Medalia to incomplete mixing of the compound used in the experiments. They suggested
that if some agglomerates remained due to incomplete mixing, then the rubber immobilised
within the agglomerates would be assumed to be associated with primary aggregates.
The effect of fillers on the viscosity of polymer compounds has been described by theory
used to model the rheological behaviour of suspensions(88). Einstein derived the following
46

theoretical viscosity equation(89) to describe the behaviour of suspensions of non
attracting spherical particles:
1]= 1]0(1+2.5<1»
where 1] = viscosity of the suspension
1]0 = viscosity of the suspending medium and
<I> = volume fraction of suspended particles
The above equation can only be applied at low particle concentrations because the
particles are assumed to behave independently. As suspensions become more
concentrated, particles will increasingly interact with each other. This effect has been
accomodated by the addition of a further term to the Einstein equation, as shown below(89)
where kl is a constant with theoretical values which vary according to the assumed spatial
arrangement or packing of spherical particles.
This expanded version of Einstein equation applies to suspensions of non-attracting
spherical particles. Vand(90) determined a theoretical value of 7.35 for kI, while Guth and
Gold(91) found a value of 14.1. More recently, Clarke and Freakle/72) found kl values of
15. \3 for a well mixed rubber compound and 9.69 for badly mixed rubber compounds and
suggested that although the spherical particles are fused together into primary aggregates,
rubber flows freely and closely around them. Moreover, their results also indicated that the
carbon black in both primary aggregate and agglomerate form behaves as non-attracting
spherical particles.
Volume fraction of filler can be calculated from the weight of filler and the densities of the
filler and polymer. There is a general increase in relative viscosity with increase in volume
fraction of filler, but the relationship depends on the characteristics of the filler and the
polymer.
It has been shown that particle size has little effect on relative viscosity for relatively large
particles(89) Boonstra and Medalia(92) have shown that for particles less than about Illm
diameter, relative viscosity increases with decreasing particle size.
47

Boonstra and Medalia(92) have proposed that disagglomeration of carbon black may result
in a reduction in relative viscosity by causing a decrease in the effective volume fraction of
filler, which includes the carbon black itself and elastomer which is immobilised within
agglomerates. They suggested that immobilised rubber behaves as part of the filler
particle. Clarke and Freakle/72) also suggested that reduction in relative viscosity of a
compound during mixing is entirely due to disagglomeration of carbon black. The
mechanism proposed by Clarke and Freakley by which the relative viscosity of the
compound decreases with increasing mixing is as follows: "agglomerates in a compound
contain immobilised rubber, which behaves as part of the solid agglomerate and hence,
contributes to the effective volume fraction of filler in the compound. As agglomerates are
broken down during mixing, immobilised rubber is released, causing a reduction in
effective volume fraction of filler and a consequent decrease in the relative viscosity".
Values of relative viscosity have been used in their study instead of apparent viscosity in
order to isolate the effect of mastication on the viscosity of the compound from the effect
of disagglomeration.
Gessler et al.(93), suggested that in thoroughly mixed compounds, carbon black aggregates
make their individual contribution to viscoelastic properties, because of their own volume
and that of the rubber occluded within them. Also they suggested that at shorter mixing
times the highly loaded regions (inclusions) act as large filler particles. The effective
volume of these inclusions is higher than that of the carbon black alone, owing to both the
rubber occluded within the aggregates and the additional rubber immobilised between the
aggregates. Hence these inclusions make a larger contribution to viscous properties than
well dispersed carbon black. Improved dispersion of carbon black lowers the Mooney
viscosity in the same way as progressive decrease in molecular weight which has been
attributed in the past to mechanical breakdown of rubber molecules.
2.6 COMPOUNDING AND VULCANISATION
2.6. I INTRODUCTION
(A) Compounding
Long(94) has defined rubber compounding as "the art and science of selecting and
combining elastomers and additives to obtain an intimate mixture that will develop the
necessary physical and chemical properties for a finished product".
48

The objectives of rubber compounding are:
(J) to secure certain properties in the finished product to satisfy service requirements
(2) to attain processing characteristics necessary for efficient utilisation of available
equipment
In other words, the most important criterion in compounding is to secure an acceptable
balance between demands arising from these two criteria(94)
A practical compound formulation is usually one that consists of ten or more ingredients.
Each ingredient has a specific function and an impact on properties, processability and
price. Compounding ingredients can be classified into ten major categories as shown
below.
1. Elastomers
2. Vulcanising agents
3. Accelerators
4. Activators and retarders
5. Antidegradants (antioxidants, antiozonants, protective waxes)
6. Processing aids (peptizers, lubricants, release agents)
7. Fillers (carbon blacks, non-black materials)
8. Plasticizers, softeners and tackifiers
9. Colour pigments
10. Special purpose materials (blowing agents, deodorants, etc.)
(B) Vulcanisation
Gardiner(95) has defined vulcanisation as "an irreversible process during which an
elastomeric compound is, through chemical crosslinking in its molecular structure,
converted from a thermoplastic to a thermoset having improved elastic properties". A
vulcanised piece of rubber can undergo large deformation on stretching. When released, it will recoil to nearly its original dimension provided that adequate time is allowed. A
vulcanised rubber does not dissolve but swells when immersed in a good solvent.
Crosslinking occurs at points in the rubber molecule which are reactive to vulcanising
agents and accelerators. During vulcanisation some bonds are broken and allowed to react
with other materials such as sulphur bearing ingredients. These intermediates then react
with adjacent polymer chains which then become attached to one another or crosslinked.
Practically all unsaturated rubbers are vulcanisable by sulphur, which is the most widely
used vulcanising agent in the rubber industry. Natural rubber and nitrile rubber are two
49

examples of commonly used rubbers which are cured this way. These rubbers differ in
their basic structure, degree of unsaturation and location of the double bonds. Thus, they are expected to react with sulphur in a different way.
Critical parameters related to the process of vulcanisation are the time elapsed before it
starts (called scorch time), the rate at which it occurs, and the extent. A typical cure curve is shown in Fig. 2.17(94).
Torque
-_ .......... C R I d' .... .-- .. - ~MH-No Maximum Curve ure ate n ex I .".' , .... , ~~ .. ~~-----:~--
/': .......... ~HF-Equ;t;br;um Curve
I MHR-Reverting Curve I I I I~Oprimum Cure Time I I
.; (90)
......... ...:._.- I Scorch I I I-T' , I ImetSI I
I I
Time
Fig. 2.17 Cure Curve(94)
2.6.2 SULPHUR VULCANISING SYSTEMS
Sulphur vulcanising systems are classified as given in Table 2.3.
Class Sulphur Accelerator Approximate range
concentration (pphr) concentration (pphr) of EO values obtained
EV (Efficient) 0.3 - 1.0 6.0 - 2.0 1.5 - 4 • Semi-EV 1.0 - 2.0 2.5 - 1.0 4-8
CV (Conventional) 2.0 - 3.5 1.0 - 0.5 10 - 25
Very inefficient 3.5 - 10 0.5 - 0 25 - 100
Table 2.3 Classification of sulphur vulcanising systems(96)
* E is defined as the number of network-combined sulphur atoms present per physicallyeffective chemical crosslink.
50

Out of the vulcanising systems listed above, semi-EV and conventional (CV) vulcanising
systems are in common use. In the initial stages of vulcanisation all these systems give
rather similar networks in which the crosslinks and the accelerator-terminated pendent
groups are di- or polysulphidic. The difference in the final networks appears progressively
as the cure time is increased: EV systems eventually form simple networks in which the
crosslinks are exclusively monosulphidic. The networks from conventional and very
inefficient systems become increasingly more complex, containing mixtures of mono-,
di-, and polysulphidic crosslinks, and the rubber chains become more and more modified
with olefinic and sulphur containing groups. These changes in structure are accompanied
by corresponding changes in physical properties(96).
Sulphur vulcanising systems for NR usually contain sulphur in amounts of 2. 5-3 pphr and
accelerator in amounts of 0.5-1.0 pphr (conventional system). The synthetic rubbers
require a higher proportion of accelerator (1.5 pphr) with a corresponding reduction in the
amount of sulphur: often equal parts of accelerator and sulphur give a useful vulcanisate.
Synthetic rubbers are slower curing than NR and hence mixtures of accelerators are often
used to bring curing times within the range customary for NR. The use of zinc oxide
(ZnO) and stearic acid as the activator system is also usual, although the effect seems to
be less marked than it is for NR(97).
EV and semi-EV systems significantly reduce reversion and improve ageing resistance in
NR vulcanisates due to the reduction of polysulphidic crosslinks and the preponderance of
di- and monosulphidic crosslinks formed in the network. The latter are much more stable
thermally than the polysulphidic crosslinks(98). In general a conventional (CV) system
gives rise to a vulcanisate with high tensile strength, resilience and resistance to fatigue
and abrasion. An EV system shows improved heat ageing, reversion resistance and low
compression set. Semi-EV systems have properties intermediate between those of CV and
EV systems.
2.6.3 THE CHEMISTRY OF ACCELERATED SULPHUR VULCANISATION
Vulcanisation of rubber by sulphur in the presence of an accelerator or a combination of
accelerators in general occurs by a mixed ionic and free radical mechanism. The relative
extent of each mechanism depends on the nature of the rubber, the type of accelerators
and whether ZnO and fatty acid are used.
51

The wlcanisation process generally proceeds in three main steps as schematically shown below(98)
Accelerator (s), activator, sulphur, rubber
1 (1) Active sulphurating agent
( AS -- Sx -- SA or AS -- Sx -- Zn -- S --A)
Where A denotes an accelerator
(2)
(3)
1 Rubber ( RH )
Rubber bound intermediate
Crosslinking precursor
(R-- Sy--A)
1 Rubber
Crosslinked rubber network
(R-- Sx--R)
A rubber bound intermediate consists of accelerator groups pendant to the rubber chain
backbone.
Zinc oxide and stearic acid is the most widely used activating system in the rubber
industry. Zinc stearate which is formed in situ is only sparingly soluble in rubber.
In terms of efficiency, the accelerated sulphur wlcanisation system in general requires only
from 1-15 sulphur atoms to form a chemical crosslink in contrast to 40-55 sulphur atoms
for an unaccelerated sulphur wlcanisation system. In reacting with the rubber molecule,
the sulphur attacks almost exclusively at the a-methylene carbon atoms(99).
Accelerators are classified as slow, medium fast, fast and ultra fast. Thiuram disulphides
are regarded as ultra fast accelerators while sulphenamides fall to the class of fast
accelerators. Sulphenamides are the most widely used accelerators today due to their
unique combination ofiong scorch delay and relatively fast cure rate. The delay in onset of
crosslinking is believed to be related to the disappearance of the original sulphenamides,
which in turn depends on the amount of mercaptobenzothiazole (MBT) formed in situ on
heating. Hence, the onset of crosslinking is expected to be delayed either by increasing the
concentration of the sulphenamide or by removing the MBT as fast as it is being
formed(IOO) A prew\canization inhibitor (PVI), when used with a sulphenamide,
52

scavenges the MBT formed at the beginning of vulcanisation. This prevents, the
autocatalytic depletion of sulphenamide, thus, delaying crosslinking. N-(Cyclohexylthio)
phthalimide (CTP) is the widely used PVI in the rubber industry. Although CIP delays the
onset of crosslinking, it has no effect on the rate of vulcanisation.
2.6.4 CURE SYSTEMS AND CURE CHARACTERISTICS OF NBR MIXES
Normally sulphur and accelerator are used for vulcanisation. Sulphur-free vulcanisations
may also be carried out by addition of thiuram disulphide or organic peroxides. Peroxides
are only used in special cases. In usual vulcanisations, the sulphur concentration is
generally lower than it is with natural rubber(\OI). This is because NBR already has some
crosslinks depending on its production process. The number is always generally greater
than for NR. The dosage of sulphur usually does not exceed 1.5-2.0 phr. Nitrile rubbers
which contain a relatively high proportion of acrylonitrile generally require less sulphur for
vulcanisation than do those types which contain relatively less acrylonitrile.
In principle, practically all the accelerators which are commonly used in NR may be used
in NBR but their activity in NBR is often quite different than in NR. Addition of thiuram
accelerators results in a longer scorch period(20) Processing safety and outstanding
vulcanizate characteristics are attained also with the use of dibenzothiazyldisulfide
(MBTS) and of sulphenamides, which in many cases are activated with basic accelerators
or with TMTM. Vulcanisates which have been made with TMTD with little or no sulphur
tend to 'bloom' because of the high dosage but this can be reduced or eliminated by the
simultaneous use of MBT, MBTS or CBS. The torque vs. time curves are almost linear
over a wide range of vulcanisation times. Therefore a low state of vulcanisation is
obtained with short curing times and a high state with longer heating.
Sulphur donor and peroxide curing systems are normally used for applications requiring
good high-temperature performance and low compression set. Also, semi-EV and EV
systems, play a special role in NBR vulcanisates to obtain a high heat resistance and a low
compression set. A particularly good heat resistance is obtained if TMTD is used without
or with little (0.25 phr) sulphur or a sulphur donor (0.5 phr) such as 4,4'
dithiodimorpholine (DTDM). Cadmium oxide, which is, however, undesirable because of
its toxicity, gives vulcanisates with a high heat resistance(18,I02). The compression set
characteristics are also improved by longer curing times and higher curing temperatures(5).
More recently, the use ofN-oxydiethylene dithiocarbamyl-N'-oxydiethylene sulphenamide
(OTOS), or that of a new optimised accelerator blend, coded DEOVULC EG 28 (DOG
53

Deutsche Oelfabrik, Hamburg), has been proposed in pl\lce of CdO-based cure
systems( 103) These new cure systems give a particularly low compression set at high
temperatures and a high heat resistance.
For various applications specific vulcanisation systems are required. A scheme
representing the most commonly used sulphur and sulphurless systems, with an indication
of their advantages, is given in Table 2.4.
OC?o 1.6 MBTS 3
ZO£DC 1.5 5 0.3
slower decrease of the elongation at break during ageing
I DC? 1 6 l- peroxide
L..:::=---':::' J vulcanizatIOn
more raPid '/IJ'.r.l'Jnization
more rapid vulcanization
I MBT 1.S ZQ€OC 1.5 5 1.5
TMTM 0.4 5 1.5
smcUer compresSIOn set and tower price
better t"Jgelng reslstenc;!
MBTS
S
lower ~s- _ MBTS ~ set TMTO
5
beHer resistance to ageing at etevoteo temperatures
?-.-~~ tower compression set no bloom
1.5 0.5 1.5
~ I
MBTS 3 TMTO 0.4 ZOEOC l.S
better scorch safety
TMTO 2 CBS 1 S 0.5
Table 2.4 Vulcanisation systems (phr) for nitrile rubber(5)
NBR is insensitive to over-vulcanisation. NBR compounds may be cured at 200·C and
higher in absence of oxygen without harm to the material. Vulcanisates with especially
good resistance to hot air are obtained when compounds contain TMTD, with or without
small proportions of sulphur.
54
",,,,,,
'.'c..
2.6.5 INFLUENCE OF FILLERS ON VULCANISATION
Kraus(104) has reported that reinforcement by carbon black is non-specific with regard to
the chemistry of widely different crosslinking reactions. Interactions of carbon black with
polymer through the vulcanisation recipe occur and can contribute to reinforcement
phenomena.
Dogadkin et a1.(105) have shown that sulphur combines with carbon black during
vulcanisation and the reaction is favoured by high hydrogen content of the carbon black.
Rivlin et a1.(106) investigated the chemisorption of an olefin (2-methyl-2-octene), both in
absence and presence of vulcanising agents. Their work showed that chemisorption takes
place simply by heating the olefin with furnace black at vulcanisation temperature. Sulphur
alone increases the chemisorption but accelerator (benzothiazyl disulphide) decreases it,
presumably by competitive adsorption with the olefin(107). These changes are small
compared to the direct chemisorption of the olefin. The direct chemisorption also provides
a more stable linkage.
Channel blacks are known to retard the cure as compared with furnace blacks. The cause
of this retardation can be traced to the greater or lesser acidity of the filler which
influences the kinetics of the crosslinking reaction. Channel blacks are acidic compared to
furnace blacks.
Cotten( 108) has shown that the chemistry of the carbon black surface plays an important
role in the initial steps preceding the actual crosslinking reaction as well as in the
crosslinking rate itself. In a rheometer trace dLmax, is the maximum change in torque
during vulcanisation. The effect of the loading of carbon black on this value is shown in
Fig. 2.18. When this entity is plotted against the loading X, a straight line is obtained, the
slope of which has been called UF by WoltfI09). This parameter UF is used to characterise
the structure of fillers, in particular of carbon blacks. In principle, LiL.n .. is closely related
to the modulus at rather low strain.
55

.... ~
" C" ~
~_~. 50 p.p.h.r.
~--r- 35 p.p.h.r.
4.L mOll t SO)
~----t"T Gum
,2 ... '-~ ___________ : _____________ -_~~~_T .. ' Iguml
o 10 20 30 Time (mint
Fig. 2. 18 Effect of carbon black loading as shown on the oscillating disc rheometer trace(22)
Gessler et al(llO) have reported that the surface chemistry of carbon blacks and trace
constituents are chiefly important in affecting the cure rate for general purpose rubbers,
although they may have additional effects with speciality rubbers.
The determination of the concentration of chemical crosslinks in the presence of filler
rubber bonds and rubber-rubber entanglements is a difficult task. A filler may influence the
degree of crosslinking. Reinforcing fillers such as carbon blacks interact strongly with
unsaturated hydrocarbon rubbers during milling or mastication in an internal mixer. The
amount of 'bound rubber' (rubber which remains associated with the rubber when the
mixture is subsequently immersed in a rubber solvent) is often used as a measure of this
interaction. The adsorption of rubber on the filler surface alters the stress-strain properties
and reduces the extent of swelling in a solvent. Stress-strain behaviour and equilibrium
swelling measurements are the principal means of assessing crosslink density, but when a
reinforcing filler is present in the rubber the effects of crosslinks cannot be readily
distinguished from the effects of rubber-filler interaction.
Porter( Ill) noted that carbon black increases the efficiency of crosslinking of sulphur
systems. The effect of the filler is to cause a reduction in polysulphide crosslinks and
increases in di- and monosulphide crosslinks.
Carbon blacks are often considered to "activate the cure" of elastomeric compounds.
Kraus( 112) has reported that when the number of network chains in a carbon black stock is
56

determined from swelling data, the result will include the contribution of all types of
linkages and will represent the number of effective network chains in an equivalent
network of tetrafunctional crosslinks. He concluded that the filler "contribution" depends
on the degree of cure, the vulcanisation system and the filler particle or aggregate shape. It
depends only slightly on the particle size or surface area of the filler.
2.6.6 EFFECT OF VULCANISATION ON VULCANISATE PROPERTIES
Major effects of vulcanisation are shown in Fig. 2.19. The increase in modulus and
decrease in permanent set are due to the extra load bearing linkages holding the network
chains together giving higher retractive forces. The maximum in tear strength and tensile
strength is reached due to the inextensibility of the rubber network; too many crosslinks
shorten the network chains and hence reduce the molecular mobility of the chains, making them more prone to rupture(98,lOO)
1 en ... ~ ... ~ a: ...
[
TEAR STR£t«ITII.
(I FATIGUE LIFE.
\.. TOUGHNESS
CROSS-LINK OENSITY---
Fig. 2.19 The effects of vulcanisation (100)
The properties shown in Fig. 2.19 are also affected by the type of crosslink, the nature of
the rubber, the type and amount of filler, etc. Modulus and hardness depend only on
degree of crosslinking. Elongation at break and solvent swelling decrease with increasing
degree of crosslinking, whereas abrasion resistance increases with increasing degree of
crosslinking. These properties are partly dependent on degree of crosslinking(I13).
57

Curing curves for NR and SBR show differences. Thus the tensile strength of NR reaches
a peak and then declines (i.e. reversion occurs). The modulus behaves very similarly,
except that the peak is later than that for tensile strength (Fig. 2.20 (a». SBR does not
show any reduction of tensile strength on overcure: it remains approximately constant and
a 'marching cure' occurs. i.e. the modulus rises gradually (Fig. 2.20 (b». Nitrile rubbers
show curing characteristics very similar to those of SBR, except that they exhibit a very
pronounced improvement in compression set on prolonged cure.
Fig. 2.20 Tensile strength and modulus against time of cure: (a) NR, (b) SBR(97)
2.7 SWELLING OF RUBBER NETWORKS
2.7.1 INTRODUCTION
The phenomenon of swelling is the increase in volume of a rubber due to the absorption of
a liquid. Swelling causes deterioration of physical properties. Raw rubbers are completely
soluble in certain liquids, but vulcanised rubbers are virtually insoluble. Strong bonds, such
as chemical crosslinks between the rubber chains, prevent rubber molecules becoming
completely surrounded by the liquid and restrict the deformation of the rubber.
58

The swelling of rubbers by liquids occurs as the liquid diffuses from one part of the sample
to another. As this process proceeds, the dimensions of the rubber increase until the
concentration of the liquid is uniform and equilibrium is achieved.
The amount of a given solvent that will diffuse into the rubber until it reaches
equilibrium depends on:
(I) the cohesive energy densities (square of solubility parameter) of the rubber
and liquid
(2) the number and type of crosslinks which determine the modulus of the
network
(3) the amount and type of non-rubber ingredients.
The greater the number of crosslinks per unit volume, the shorter the average length of
rubber chains between crosslinks and the lower the degree of swelling.
2.7.2 DEGREE OF SWELLING AND ITS RELATIONSHIP TO TIIE DEGREE OF CROSSLINKING
The degree of swelling can be expressed as the percentage increase in volume or as the
volume fraction of rubber in the swollen gel (Vr). The degree of swelling also depends
upon the compatibility of the rubber and liquid on a molecular scale and the amount and
type of filler present in the rubber. The rate at which swelling proceeds also depends upon
the relative molecular size of the diffusing liquid molecule.
If rubber and liquid molecules are compatible on a molecular scale, then the liquid will
readily swell the rubber. In practice it is found that in the absence of a specific interaction
between dissimilar molecules, and of crystallisation, a rubber and liquid will be compatible
if their values of solubility parameter are within unity of each other. The degree of swelling
is generally highest with chloroform (0 = 9.3 (cal.cm-3)112) for all rubbers except butyl (0 =
7.6 (cal.cm-3)112). Acetone (0 = ID (cal.cm-3)112) is a poor swelling agent, except in strongly
polar nitrile rubber (0 = 9.9 (cal. cm-3) 112).
In swelling, the mixing of polymer chains with solvent is opposed by the elastic retraction
of the network. At equilibrium these two effects are balanced. The equilibrium degree of
swelling can therefore be treated in terms of a combination of solution theory with the theory of rubber elasticity(l14) The equilibrium degree of swelling attained by a rubber
network in a swelling agent is related to physically manifested crosslinks (nph)"') by the Flory-Rehner equation(lIS) or by the modified equation(116).
59

-In ( 1 - V, ) - V, - x V/ = 2 P VD nphJ" V/13 - Flory-Rehner equation(1l5)
- In ( 1 - V,) - V,- X V/ = 2 P VD nphJ" (V/13 - V,/2 ) - Modified Flory_Rehner(1l6)
equation
where V, is the volume fraction of rubber in the swollen gel at equilibrium
VD is the molar volume of the swelling liquid
X is a parameter characteristic of interaction between the rubber network and the
swelling liquid referred to as the rubber-solvent interaction parameter
P is the density of rubber
nphJ" or the physical degree of crosslinking is equal to the number of gram-moles of
physically manifested crosslinks per gram of rubber in the network.
2.7.3 SWELLING OF FILLED RUBBERS
The effect of fillers on swelling is relatively small compared with the effect of the rubberliquid interaction. However, Boonstra and Dannenberg(1l7) have noted a very pronounced
decrease in matrix swelling with some fillers when the filler loading is increased. With
carbon black, the decrease in matrix swelling is an almost linear function of the loading,
particularly with channel black and when strongly swelling liquids are used.
For a filled rubber, the network chain density v = v'pp, an apparent effective network chain density. Kraus(29) has stated that
v,pp := v, x f ( c, ......... )
where f ( c, ......... ) is a function of carbon black loading and other variables relating
to the particular carbon black employed, e.g. structure and particle size. For any given
carbon black at any fixed loading c, the apparent network chain density becomes a
"relative" measure of the true v, and not of filler-rubber attachments (vr).
Unlike in gum stocks, determination of the number of effective network chains in filler
reinforced compounds by the swelling technique is advantageous over modulus data as the results are not obscured by linkages between rubber and filler(I 12).
60

REFERENCES
1. Hofmann, w., "Rubber Technology Handbook", Hanser Pub., Munich (1989)
Chap.2
2. Bell, G.L., Stinson, D., Thomas, A.G., Rubber Chem. Technol., 55 (1982) 66
3. Hamed, G.R., Rubber Chem. Technol., 54 (1981) 403
4. McGiIl, W.1., Joosk, D.A.: A Theory of Green Strength in NR, Rubbercon'87,
June 1-5 (1987) Harrogate, GB, Proc. AS
5. Bohumil Meissner, Miroslav Schatz and V1adimir Brajko "Elastomers and
Rubber Compounding Materials", Franta I., Ed., Elsevier Pub. (1989) Chap. 4
6. Bamard, D., Baker, C.S.L., Wallace, I.R., Rubber Chem. Technol., 58 (1985)
740
7. Freakley, PK, Payne, A.R. "Theory and Practice of Engineering with
Rubber", Elsevier Appl. Sci. Pub., Barking (1978)
8. Sekhar, B.C., Malaysian Natural Rubber, New Presentation Process., Publ.
Rubber Res. Inst., Malaysia, Kuala Lumpur (1970)
9. Smith, M.G., Rubber J. 149 (1967) 28
10. The New SMR Scheme, Rubber Developments, 44(4) (1991) 74
11. Khairi Nagdi "Rubber as an Engineering Material": Guideline for Users,
Munich: Hanser (1993) Chap.8
12. Stem, H.1. "Rubber Natural and Synthetic", Maclaren and Sons Ltd., London
(1967)
13. Marsh, P.A., Voet, A., Price, L.D. and Mullens, T.1., Rubber Chem. Technol.,
41 (1968) 344
14. Starmer, P.H. and Lufter, c.H., Rubber Chem. Technol., 34 (1961) 964
IS. Dunn, J.R., Rubber World, June (1984) 16
16. Dunn, J.R., Pfisterer, H.A., Ridland, J.1., Rubber Chem. Technol., 52 (1979)
331
17. Jacques, J.E. "Rubber Technology and Manufacture", Blow, C.M., Ed.,
Butterworth & Co. Ltd., London (1971) Chap.9
18. Coulthard, D.C., Gunter, W.D., J. Elast. Plast., 9 (1977) 131
61

19. Zhang, S. w., Rubber Chem. Technol., 57 (1984) 769
20. Hofmann, w., Rubber Chem. Technol., Rubber Reviews, 36 (1963) Chap.5,
p.154
21. Minnerly, H.E., Rubber World, 152(1) (1965) 76
22. Fletcher, W.P. "Rubber Technology and Manufacture", Blow, C.M., Ed.,
Butterworth & Co. Ltd., London (1971) Part C, Chap.4
23. Stephens, HL., "Rubber Technology", 3'd Edition, Morton, M., Ed., Van
Nostrand Reinhold Co., New York (1987) Chap.2
24. Hofmann, W., Paper Presented at ACS Rubber Division Meeting, Houston,
Texas, October (1983)
25. Dunn, J.R., Vara, R.G., Elastomerics, May (1986) 29
26. Hess, WM., Ban, L.L., McDonald, G.C., Rubber Chem. Technol., 42 (1969)
1209
27. Medalia, A.I. and Heckman, FA, Carbon, 7 (1948) 277
28. Donnett, J.B. and Voet, A., "Carbon black, Physics, Chemistry and Elastomer
Reinforcement", M. Dekker, New York, Basel (1976)
29. Kraus, G., Adv. Polym. Sci., 8 (1971) 155
30. Dannenberg, E.M., Trans. Inst. Rubber Ind., T26 (1966) 42
31. Ford, F.P. and Gessler, A.M., Ind. Eng. Chem. 44 (1952) 819
32. Boonstra, B.B. and Medalia, A.I., Rubber Chem. Technol., 36 (1963) 115
33. Danckwerts, P.V., Appl. Sci. Research, A3 (1951-3) 279
34. Gessler, A.M., Rubber Chem. Technol., 43 (5) (1970) 943
35. Hess, W.M. and Ford, F.P., Rubber Chem. Technol., 36 (1963) 1175
36. Schallamach, A., Trans. Inst. Rubber Ind., 28 (1952) 256
37. Boonstra, B.B. "Rubber Technology and Manufacture", Blow, C.M., Ed.,
Butterworth and Company Ltd., London (1971) Chap.7
38. Byers, J.T. "Rubber Technology", 3rd Edition, Morton, M., Ed., Van
Nostrand Reinhold Co., New York, (1987) Chap.3
39. Bueche, F. "Physical Properties of Polymers" Interscience Pub., John Wiley &
Sons, New York (1962)
40. Dannenberg, E.M., Rubber Chem. Technol., 48 (1975) 410
62

41. Inglis, C.E., Trans. Inst. Nav. Archit. (London), 55 (19\3) 219
42. Bhowmick, AK, Basu, S. and De, S.K., Rubber Chem. Technol., 53 (1980)
321
43. Bhowmick, AK, Nando, G.B., Basu, S. and De, S.K., Rubber Chem.
Technol., 53 (1980) 327
44. Gent, AN., J. Mater. Sci., 15 (1980) 2884
45. Gent, A.N., "Science and Technology of Rubber", Eirich, F.R., Ed., Academic
Press, New York (1978) Chap. 10
46. Mathew, N.M., Bhowmick, AK and De, S.K., Rubber Chem. Technol., 54
(1982) 51
47. Goldberg, A, Lesuer, D.R. and Patt, J. Paper presented at the Dallas Severe
Environment Symposium, 133 rd, Rub. Division Meeting, ACS, Dallas, Texas
April 19-22(1988); Rubber Chem. Technol., 62 (1989) 272
48. Rivlin, R.S. and Thomas AG., J. Polym. Sci., 10 (1953) 291
49. Ratner, S.B., Dokl. Akad. Nauk. SSR, 135 (1960) 294
50. Bhowmick, A.K., Nando, G.B., Basu, S and De, S.K., Rubber Chem.
Technol., 53 (1980) 327
51. Mahdi, H. H., Ph.D. Thesis, Loughborough Univ. of Tech. (1990)
52. Schallamach, A., Proc. Phys. Soc., 67B (1954) 883
53. Southern, E. and Thomas AG., Rubber Chem. Technol., 52 (1979) 1008
54. Grosch, KA "Fractography of Rubber Materials" Bhowmick, AK and De,
S.K., Ed., Elsevier Science, Pub., London (1991)
55. Gent, A.N. and Pulford, C.T.R., J. Appl. Polym. Sci., 28 (1983) 943
56. Bhowmick, AK, Rubber Chem.Technol., 55 (1982) lOSS
57. Gent, A.N. and Pulford, C.T.R. "Developments in Polymer Fracture-I",
Andrews, E.H., Ed., Applied Sci. Pub., London, Chap.5.
58. Thavamani, P and Bhowmick, A.K. Rubber Chem.Technol., 67 (1994) 129
59. Freakley, P.K. "Rubber Processing and Production Organisation", Plenum
Press, New York (1985) Chap.3
60. Funt, J.M., "Rubber Mixing", Rapra Publications, Shawbury, VI< (1977)
61. Mason, S.G., J. Colloid Interface Sci., 58 (1977) 275
63

62. Clarke, J. and Freakley, P. K., Plast. Rubber Composites Proc. Appl., 24,
No.5 (1995) 261
63. Johnson, P.S. "Basic Compounding and Processing of Rubbers", Long, H.,
Ed., Rubber Division, ACS, The Univ. of Akron, Akron, Ohio, USA(1985)
Chap.3
64. Funt, J.M., Rubber Chem.Technol., 53 (1980) 772
65. Ebel!, P.C., Ph. D. Thesis, Loughborough Univ. of Technology, UK (1981)
66. Freakley, P.K. and Wan Idris, W.Y., Rubber Chem. Technol., 52 (1979) 134
67. Dizon, E.S., Rubber Chem. Technol., 49 (1976) 12
68. Freakley, P.K., Paper F3, Vo1.2, Presented at the Inter. Rubber Conf.,
Harrogate, UK. 8-12, June (I 981)
69. Brantley, Jr., H.L., Rubber World, February, 191 (1985) 30
70. Johnson, P.S, Paper Presented at ACS Rubber Division's 1 16th Meeting,
Cleveland, Ohio
71. Newel!, W.W., Porter, J.P. and Jacobs, H.L., Presented at a meeting of the
Rubber Division, ACS, Cleveland, Ohio, May 1975: Abstract in Rubber Chem.
Technol. 48 (1975) 1098
72. Clarke, J. and Freakley, P.K., Rubber Chem. Technol., 67 (1994) 700
73. Dannenberg, E.M., Ind. Eng. Chem., 44 (1952) 813
74. Hess, W.M., Swor, R.A. and Micek, E.J., Rubber Chem.Technol., 57 (1984)
959
75. Wijayarathna, 8., Chang, W.V. and So!ovey, R., Rubber Chem. Technol., 51
(1978) 1006
76. Lee, M.C.H., J. Appl. Polym. Sci., 29 (1984) 499
77. Williams, D.J., "Polymer Science and Engineering", Prentice Hal!, Inc.
Englewood Cliffs, NJ., Chap.! 0
78. Harwood, JAC. "Rubber Technology and Manufacture", Blow, C.M., Ed.,
Butterworth & Co. Ltd., London (1971) Chap.3
79. Quant, S.J., M.Phil. Thesis, Loughborough Univ. (1997)
80. Johnson, P.S., Rubber World, April (1979) p.47
81. Brydson, J.A. "Flow Properties of Polymer Melts", Butterworth & Co. (Pub.)
Ltd., London (1970) Chap. 1
64

82. Zakharenko, N.Y., Tolstukhina, F.S. and Bartenev, G.M., Rubber Chem.
TechnoI., 35 (1962) 326
83. White, J.L. and Crowder, J.w., J. AppI. Polym. Sci., 18 (1974) 1013
84. Toussaint, H.E., Unger, W.N. and Schafer, H.O., Kautsch. U. Gummi Kunstst.
25 (1972) 155
85. Technical Report RG-129, Cabot Corp., Boston, Mass
86. Smit, P.PA, Rheol. Acta, 8 (1969) 277
87. Medalia, AI., Rubber Chem. TechnoI., 45 (1972) 1176
88. McCabe, C.C., "Reinforcement ofElastomers", Kraus, G., Ed., Interscience,
New York (1965), Chap.7
89. Hiemenz, P.C., "Principles of Colloid and Surface Chemistry", Marcel Dekker
Inc., New York (1977) Chap.2
90. Vand, V., J. Phys. Colloid Chem., 52 (1948) 277
91. Waiters, M.H. and Keyte, D.N., Trans. Inst. Rubber Ind., 38 (1962) 40
92. Boonstra, B.B. and Medalia, AI., Rubber Age, 92 (1963) 892; 93 (1963) 82
93. Gessler, AM., Hess, W.M. and Medalia, AI., Plast. Rubber Proc. AppI.,
September (1978) 109
94. Long, H., "Basic Compounding and Processing of Rubber", Long, H., Ed.,
Rubber Division, ACS, Inc., The Uni. of Akron, Akron, Ohio, U.SA (1985)
95. Gardiner, R.A, "Basic Compounding and Processing of Rubber", Long, H.,
Ed., Rubber Division, ACS, The Uni. of Akron, Akron, Ohio, U.SA (1985)
96. Chapman, AV. and Porter, M. "Natural Rubber Science and Technology",
Roberts, AD., Ed., Oxford Uni. Press, N.Y. (1988) Chap.l2
97. Morrei, S.H., "Rubber Technology and Manufacture", Blow, C.M., Ed.,
Butterworth & Co. Ltd., London (1971) Chap.5
98. Kuan, T.H., Rubber World, August, 192 (5) (1985) 20
99. Skinner, T.D., Rubber Chem. TechnoI., 45 (1972) 182
100. Coran, AY., "Science & Technology of Rubber", Eirich, F.R., Ed., Rubber
Division of the ACS, Academic Division, Inc. (London) Ltd. (1978) Chap.7
101. Kemp, AR. and Peters, H., Ind. Eng. Chem., Anal. Ed., 15 (1943) 453
102. Dunn, J.R., Byme, P.S., CouIthard, D.C., Heat Resistant Nitrile Rubber, 14th
65
Annual Meeting of liS RP, May (1973), San Francisco, CA.
103. Hofmann, w., Plast. Rubber Proc. Appl., 5 (1985) 209
104. Kraus, G., Rubber Chem. Technol., 38 (1965) 1070
105. Dogadkin, B., Lukin, B., Tarzova, Z., Skorodumova, Z., Tutorskii, 1. :
KoUoidn. Zh., 18 (1956) 413
106. Rivin, D., Aron, J., MedaIia, A.I., Rubber Chem. Technol., 41 (1968) 330
107. Blokh, G.A., Kogan, M.S., Bagdanovich, N.A., Clavina, V.S., Krokina, M.V.,
. Bdozerova, T.v.: Soviet Rubber Technology (English Transl.) 21(5) (1967)
20
108. Cotten, G.R., Kautsch Gummi Kunstst., 22 (1969) 477
109. Wolff, S., Kautsch Gumrni Kunstst., 23 (1970) 7
110. Gessler, A.M., Hess, W.M. and Medalia, A.I., Plast. Rubber Proc., March
(1978)p.1
Ill. Porter, M., Rubber Chem. Technol., 40 (1967) 866
112. Kraus, G., Rubber World, Oct. (1956) 67; Nov. (1956) 254
113. Morrison, N.J. and Porter, M., Rubber Chem. Technol., 57 (1984) 63
114. Bateman, L., Moore, C.G., Porter, M. and Saville, 8., "The Chemistry and
Physics of Rubber-like Substances", Madaren, London (1963), Chap.15
115. Flory, PJ. and Rehner, J., 1. Chem. Phys., 11 (1943) 521
116. Flory, PJ., J. Chem. Phys., 18 (1950) 108
117. Boonstra, B.B. and Dannenberg, E.M., Rubber Chem. Technol., 32 (1959)
825
66
CHAPTER THREE
A REVIEW OF RUBBER BLENDS
3.1 METHODS OF BLENDING RUBBERS
Rubber-rubber blends can be prepared by a variety of methods which include: latex
blending, solution blending, solution and latex blending, mechanical blending and
blending of powdered rubbers. Mechanical blending is the most widely practiced
procedure and the method employed in the preparation of blends throughout this
study. Hence, the other general blending methods are beyond the scope of this study,
however, details can be found in the literature(I,2). The high shearing forces required to
blend high molecular weight elastomers are such that mechanical blending is confined
to internal mixers, two-roll mills and extruders.
The above blending methods may be further divided into the two general categories of
"preblending" (most commonly used for the mixing of elastomer blends in an internal
mixer) and "phase mixing". In the former, the compounding ingredients are generally
added to the premixed e1astomers in a manner similar to the mixing of a single
elastomer whereas in phase mixing, the specific locations of filler and/or extender oil
and curing agents are controlled. This is generally done by the preparation of separate
masterbatches which are then blended mechanically.
The masterbatch formulation may
(a) be the same as the compound formulation, but without curatives
(b) contain only rubber, filler and some softeners; or
(c) contain more filler than the final compound
In type ( c), it is difficult to disperse the hard filler masterbatch in the relatively soft
elastomers added in the second stage. The masterbatch technique has found general
acceptance in mechanical blending technology(3,4). Where elastomers of different cure
rates are to be blended, a masterbatch process may be desirable(5)
Evans and Partridge(6) found that mixing compounding ingredients directly into a blend
of the elastomers (preblending) have advantages over previously prepared
masterbatches. They showed that a single stage preblending procedure was a more
cost-effective method for preparing blends of NBR and chlorobutyl (CUR) rubber.
However, it was found that rubber properties were not significantly different for the
two blending methods. Bristow(7) also found no major differences in properties of
67

NRlBR blends prepared according to different methods namely, preblending, addition
of ingredients with no preblending and the blending of masterbatches containing
proportionate amounts of the compounding ingredients. However, no studies were
carried out with uneven proportions of compounding ingredients added to the separate
masterbatches. In contrast, Hess and Chirico(8) reported that for best results, the
polymer components of a blend should be mixed for a short time (= 0.5 min.) prior to
addition of fillers and other compounding ingredients.
In addition to the general blending methods discussed above, a number of special
mixing techniques have been developed to control more exactly the different aspects of
the overall homogeneity, phase morphology, filler distribution and interfacial
interaction of the different components of elastomer blends. This includes the use of a
Cavity Transfer Mixer (CTMi9), Controlled Ingredient Distribution Mixing (CIDM)
h · (10) .. (11) d . I" (12) d tec mque , constant temperature rmxmg , ynarmc vu camsatlOn an
compatibilisation(13).
3.2 MAJOR FACTORS AFFECTING PROPERTIES OF POLYMER BLENDS
3.2.1 INTRODUCTION
The properties of a polymer blend depend on several factors which are themselves
interdependent(l4)
These include
(I) choice of polymers;
(2) composition;
(3) compatibility of the polymers;
(4) phase morphology ;
(5) method of blend preparation
In addition to the above factors, distribution of compounding ingredients especially
reinforcing fillers, also has a great effect on the properties of elastomer blends. Factors
(1) and (2) are obvious.
3.2.2 EFFECT OF COMPOSITION ON VULCANISATE PROPERTIES
The properties of a polymer blend do not depend in a simple manner on its
composition. Baker, Hallam and Smith(15) studied the trends in vulcanizate properties
of filled, sulphur cured, NRlNBR (41 % acrylonitrile) blends differing in composition,
over a wide hardness range by altering the carbon black loading. A steady crosslink
density was achieved for the unfilled blends by varying the sulphur/accelerator
concentrations proportionately to the single elastomers present in the blends (Fig. 3.1).
68

At high loading the blends showed a higher modulus than either NR or NBR and a
marked peak in modulus was shown by the 40/60 NRlNBR blend (Fig. 3.1). The
relationship of hardness to SRF (N770) carbon black loading for NRlNBR blends and
single elastomers was similar to that of modulus. The maximum tensile strength
decreases in the order 80/20, 20/80, 60/40, 40/60 NRlNBR and most of these blends
are inferior to NR and NBR vulcanisates themselves as shown in Fig. 3.2. Poor tensile
strength values were recorded at low hardness. This indicated some incompatibility
between the two rubbers and has been attributed to reduced shear stresses during
mixing at low filler loadings. The tear strength of the 80/20 NRlNBR blend was
superior to all other blends and to the two single rubbers (Fig. 3.3). Compression set
improved as the NR content was reduced. Similarly, compression set improved with
increase in hardness. Hence, very low set was obtained with 20/80 and 40/60 NRlNBR
blends as shown in Fig. 3.4. Swelling measurements showed that the 20/80 NRlNBR
blend has the least swelling in ASTM oil No.3 at room temperature followed by the
40/60 NRlNBR blend (Fig. 3.5). Swelling decreased at high hardness.
Modulus (MR '00) MN/m2
4-4
4'0
3·6
3·2
2·8
2·4
2·0 NR
',6
,·2 f 0·8
i=--" 0-4 L:!:-' --~':----:':' ,..--~':---:':' ,..---:"":-o m ~ ~ ro m
"
SRF Black loading, ph'
Fig. 3.1 Variation of modulus with carbon black loading for NRlNBR blends( 1 5)
69
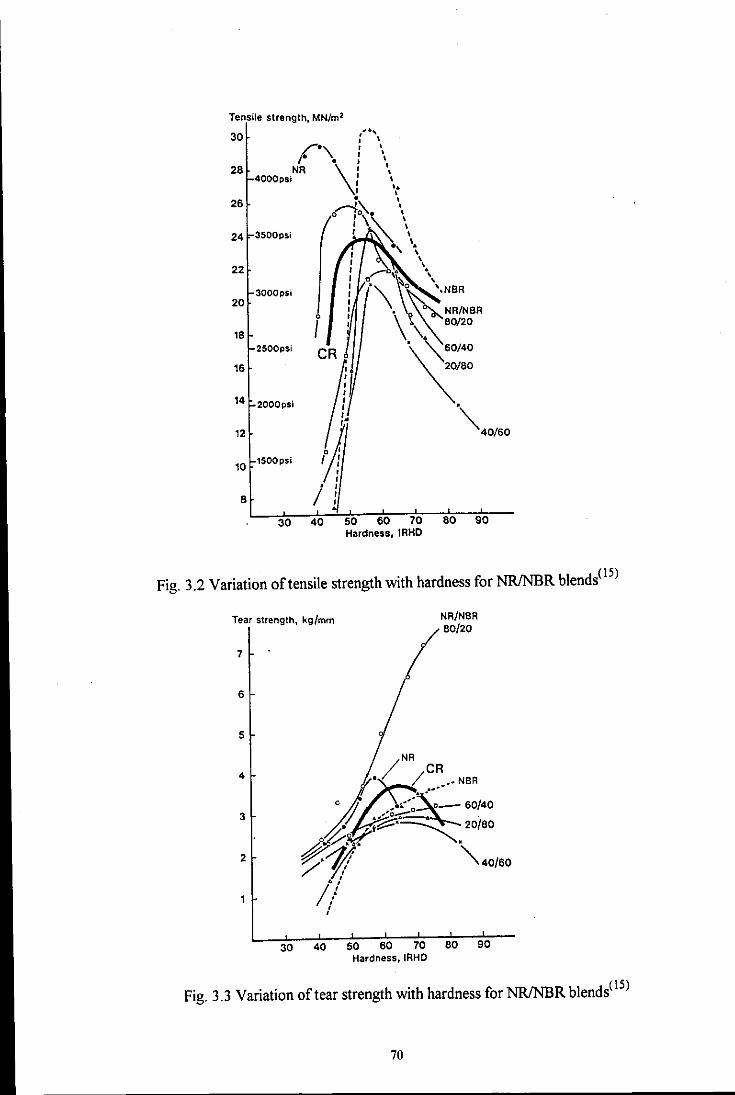
Tensile strength, MN/m2
30
28
26
24
22
20
18
16
14
12
10
8
", : \
f'\ : • •
'\! \ \ NR • 4000psi \
" • , '~ \
o:\~\ 3500psi
I \ \ ., \ ..
I \ I \ I ,,-0,4 \\ I 0 ~ ,
3000 psi :. 0 \NBR
! \. ~NR/N8R 0
I I \ 6 80/20 \.
2500psi
.~"" 20/80
2000psi
'~40/60 1500psi
30 40 50 60 70 80 90 Hardness, lRHO
Fig. 3.2 Variation of tensile strength with hardness for NRfNBR blends(1S)
Tear strength, kg/mm NR/N8R 80/20
7
6
5
4
3
2
NR
/ CR • /., NBR
c /I ""',;'S.::~ 60/40 'I, ./ o-..-~~ .
~' 'i~~~ 20/80
gY'Ikt' "'-. ~'1! '\40/60
• • // • •
30 40 50 60 70 80 90 Hardness, IRHO
Fig. 3.3 Variation of tear strength with hardness forNRfNBR blends(lS)
70

Compress~on set, 24 h/70·C, 7.
40
36
32
28
24
20
16
12
8
4
~:~ .~
, ~ 0'
".~'~ • /NR o • \ v. , . ,
• ~,~~ NR/NBR
" ~ 'SO/20 , .. \ \0
\ \
\ \ ,
\ \ \ ..
\ . \ \ \ NBR
30 40 SO 60 70 SO 90 Hardness. IRHO
Fig. 3.4 Variation of compression set with hardness for NRlNBR blends(IS)
Volume swelling. % 36
32
2S
24
20
16
12
S
4
o
7 days at room temperature
-4~~--~~--~~--~~ 30 40 SO 60 70 SO 90
Hardness, IRHO
Fig. 3.5 Volume swelling in ASTM oil No.3 for NRlNBR blends at room temperature(lS)
71

Baker et al. concluded that replacement ofNBR by a 20/80 NRlNBR blend should be
acceptable in virtually all applications except where the maximum degree of oil
resistance is required. Under some conditions where the NBR vulcanisate shows
shrinkage, the 20/80 NRlNBR blend has a slight swell which is of advantage in sealing
applications. The results also suggest that replacement of NBR by a 40/60 NRlNBR
blend should be acceptable with regard to hardness and modulus. However these
researchers have not assigned any reasons for these variations in vulcanizate properties
with composition. The data of a SRF carbon black loaded (0-75 phr) polychloroprene
(CR) compound included in all figures are not relevant to this review.
On the other hand Ahmad and Wheelans(16) studied the variation in vulcanizate
properties of unfilled NRlNBR (41 % Acrylonitrile) blends with composition. Dicumyl
peroxide (DCP) was chosen as the curative. In the absence of fillers tensile properties
were very poor. A sharp fall in tensile strength and elongation at break was observed
when 10-20% NBR was added to NR (Fig. 3.6). When the ratio changed from 70/30
to 50/50 NRlNBR both of these properties increased and fell again at higher ratios of
NBR. Ahmad and Wheelans suggested that this may be due to either the blend
morphology or the result of cutting through or around large particles of poorly
dispersed rubber in the tensile test piece. The trend in the variation of tensile strength
with composition is not similar to that of Baker et al. However modulus, hardness and
volume swelling results support the work of Baker et al. Modulus and hardness rose as
the percentage of NBR increased (Figures 3.6 and 3.7), but volume swelling was
reduced (Fig. 3.8). The variation in tensile properties was attributed to the changes in
morphology as the blend ratio was altered. The mosaic pattern created by the 70/30
and 50/50 NRlNBR blends due to the existence of co-continuous phases, was
suggested as the main cause for the higher tensile strength and elongation at break of
these blends in comparison to the other NRlNBR blends. The latter showed both
discrete and continuous phases which accounts for the lower tensile strength.
72

Elongation at break. %
400
100
OL-__ ~ __ ~ __ ~ __ ~--~
Tensile strength and ModulJs. tv1Pa
12
10
8
6
4 o o-M200
,/" 2 ,...0-0-0·0 0 M100
.0_0-_0-0-0-0'0
t-R 100 Brea11041 0
80 20
60 40
40 60
• 20 0 80 100
Fig. 3.6 Dependence of tensile properties on NRlNBR (Breon 1041) ratio(16)
Hardness. IRHO
60
50
40
NR 100 Breon1041 0
80 20
80 40
40 60
20 0 80 100
Fig. 3.7 Dependence of hardness on NRlNBR (Breon 1041) ratio(l6)
73

Volume swelling, % 180
o
140
120 o 0
100 o ASTM No.3 oil
80 \0 \
" 0 60
40
20
o
NR m Breon 1041 0
o \ ~ 0
O~ ASTM No.1 oi~ 0
o "'- ~
80 20
60 40
40 60
o
"'" 20 0 80 100
Fig. 3.8 Dependence of volume swelling in ASTM No.l and NO.3 oils on NR/NBR
(Breon 1041) ratio(l6)
3.2.3 COMPATIBILITY OF ELASTOMER BLENDS
A mixture of two components is said to be compatible on a molecular scale, only if
mutual solution takes place during mixing and the resultant blend constitutes a
thermodynamically stable single-phase system at room temperature. In the literature
the term miscibility is often used interchangeably with the word compatibility to
indicate single phase behaviour. An immiscible blend exhibits a two phase morphology.
The majority of elastomer blends consists of two phase systems i.e. they are not truly
compatible on a molecular scale, but on a slightly larger (macroscopic) scale, and
especially in cured compounds containing a high loading of carbon black, may function
effectively as one phase. In a two phase system the discrete phase is dispersed in the
continuous phase or the two phases exist as co-continuous. The major blend
74

component will generally tend to form the continuous phase, while the minor component the discrete phase(17,I8,I9,20).
Attention must be focused on aspects of polymer miscibility as it is one of the
important factors affecting the physical properties of polymer blends. Roland and
Bohm(2I) have related the adhesion of plied rubbers to their miscibility. Peel adhesion
was found to increase with time as a result of interdiffusion of polymer between the
plies. Miscibility was reported for blends ofNR with 1,2-BR. However miscibility is
not a requirement for most rubber applications. Homogeneity at a fairly fine level is
necessary for optimum performance, but some degree of micro heterogeneity is
required to preserve the individual properties of the respective polymer components.
Almost all physically blended bulk mixes of elastomer blends are micro heterogeneous
to varying degrees. Microheterogeneity may diminish when carbon black is added to
the preblended elastomers, but may also increase when carbon black is mixed
selectively into one of the polymer components.
A limited number of compatible blends are known, such as PPO i.e. poly(2,6-
dimethylphenylene oxide)/polystyrene(22) and ENR (epoxidized natural rubber)-
501PVcC23) In the above blends compatibility is due to specific interactions between
the two components of the blend.
In general compatibility depends on the type of polymers, relative viscosities,
preparation and mixing conditions.
Incompatibility between dissimilar rubbers may occur due to:
1) the difference in viscosities; which prevents or greatly delays the formation of .. bl d (2425) intImate en s '
2) thermodynamic incompatibility, which prevents mixing on the molecular scale(26,27)
3) the difference in cure rate(27)
In an extreme case of cure rate incompatibility, the faster curing component polymer
consumes a greater portion of the curative which is available in a composition than the
other polymer.
Compatibility of a blend may be characterised by the solubility parameters of the
individual polymers, thermodynamics, glass transition temperature of the blend and
microscopy. These techniques will be dealt with in detail in the forthcoming sub
sections.
75

3.2.3.1 SOLUBILITY PARAMETER APPROACH
The miscibility of the constituents of a polymer blend can be judged by the similarity of
their solubility parameters (B) via the Flory-Huggins segmental interaction parameter X.
The smaller the difference in B between two polymers, the greater the segmental interaction, and hence, the miscibility.
The polymer/polymer interaction parameter (XAB) between two non-polar or slightly
polar (weakly interacting) polymers A and B is related to the Hildebrand solubility parameters(28), BA and BB according to the following equation,
where V, - reference volume taken as close to the molar volume of the smaller
polymer repeat unit, often taken as 100 cm 3
R - universal gas constant
T - absolute temperature
The individual solubility parameter of a polymer is estimated from either the Group 'Contribution Method(29,30) as given in the experimental section or by experiment.
Experimentally, the solubility parameter of a polymer is estimated by immersing
identical crosslinked samples in a range of solvents until equilibrium swelling is
reached. Solubility parameter of the solvent giving the greatest swelling is taken as the solubility parameter of the polymeP 1)
Complete miscibility occurs only if XAB is less than a critical value (XAB)'ri' given by (14 l,
(XAB)'ri' = 0.5 « 1/ mA) 0.1 + ( 1/ mB) 0.1) ) 2
where mA and mB are the degree of polymerisation of A and B respectively.
Bohn(32) and Corish(33) compiled lists of compatible and incompatible polymer pairs,
detailing the solubility parameter differences between the components. The solubility
parameter difference between compatible polymers is always small (less than 0.5
(caI.cm-3)112 ;: 103 (Jm-3
)112). However Bohn concluded that solubility parameters do
not give a precise measure of polymer interaction as there are numerous examples of
incompatible blends with similar small values. According to the list compiled by
Corish, the solubility parameters of NR, Iow nitrile NBR (20% ACN) and high nitrile
76

NBR (40% ACN) are 8.25, 8.93 and 9.92 (cal.cm·3)112 respectively. The solubility parameter ofNBR (45% ACN) is 10.5 (cal.cm·3)112 (34) Consequently a blend ofNR
and high nitrile NBR appears to be more incompatible than a blend of NR and low
nitrile NBR.
3.2.3.2 THERMODYNAMIC APPROACH
Criteria for a miscible rubber blend can be obtained from the Gibbs free energy of
mixing (~Gmix) relationship, which is defined as :
The basic criterion for miscibility is negative ~Gmix (~Gm", < 0 ). However this is not a
sufficient criterion. The state of mixing is determined by the shape of the free energy of
mixing curve as a function of composition(3l). Mixtures with negative ~Gm;x can be
unstable relative to an intermediate composition and will lead to phase separation
(partial miscibility). mm;x and ~Sm;x are the enthalpy (or heat of mixing) and entropy
of mixing respectively. The smaller the mm;x or the larger the ~Sm;x the greater is the
possibility of molecular miscibility. ~Smix decreases as the degree of polymerisation
increases. Hence in high molecular weight polymers, ~Sm", becomes negligible and the
~Hm;x term determines miscibility. Therefore miscibility in most pairs of polymers results from a negative ~Hm;x. This has been attributed(36,37) to the presence of specific
interactions between the two components such as hydrogen bonding.
The Flory-Huggins theory of polymer solutions(38,39,40) has been successfully applied
to polymer mixtures and the Flory-Huggins equation has been used in predicting the polymer blend miscibility(41,42)
The Flory-Huggins equation yields the Gibbs free energy of mixing (~Gmix ).
~Gm;x = (R T V I V,)( (<j)AI XA) In <j)A + (<j)BI XB) In <j)B + J(AB<j)A<j)B»
where V - total volume of two weakly interacting polymers
<j) A and <j)B - volume fractions of polymers A and B respectively
XA and XB - degree of polymerisation of polymers A and B in terms of V,
(e.g. 100 cm3/mole) respectively and X=M/lOO where M is the
polymer molecular weight.
V" Rand T are defined as mentioned in Section 3.2.3.1.
J(AB is the interaction parameter between the two polymers A and B as given in
Section 3.2.3.1. With two polar polymers, a negative J(AB due to specific interactions
77

between the two polymers is not excluded. A near zero XAB (or MImix ) results if the
solubility parameters of the two polymers are nearly equal.
3.2.3.3 GLASS 1RANSITIONTEMPERATIJRE
The most common method for assessing the degree of polymer blend compatibility is
via the determination of glass-transition temperatures (Tg), but it does not provide any
specific information on biend morphology. Glass transition temperatures of NR, NBR
(40% ACN) and NBR (50% ACN) are -70, -20 and -15 respectively<43)
As temperature is reduced the glass transition occurs when the segmental motions in
the amorphous regions of a polymer cease. Below Tg, the motion in the polymer main
chain is restricted to vibrational motions. Tg is accompanied by changes in properties
such as specific volume, heat capacity, modulus, etc.(44).
Since most polymer blends are incompatible, they have two Tg values, one
characteristic of each separate component. As the polymers become compatible, the
component Tg's broaden until at complete miscibility they merge to a single
intermediate Tg. However the appearance of a single Tg does not necessarily imply
that the blend components are compatible because if the two components have equal
or close Tg's, then the resolution of the technique employed may not be sufficient. In
semi-compatible polymer blends, the transitions are shifted towards each other. A
broadening of the width of the glass transition over a wide temperature range also
suggests a semi-compatible blend and indicates micro heterogeneity of a polymer blend(45)
3.2.3.4 CHARACTERISATION OF COMPATIBILITY USING MICROSCOPY
Although glass transition studies have shown compatibility in some binary blends, two
phases have been observed microscopically. Hence microscopy is the most widely used
technique today, to assess the compatibility of polymer blends. At present two main
microscopy techniques i.e. phase contrast microscopy and electron microscopy, are
used. Transmitted light microscopy is more commonly used with polymer blends than
reflected light microscopy and it is the microscopy technique used throughout this
study.
Usually refractive index differences in polymer systems are small and the visibility of
the features in a normal light microscope is difficult. This difficulty can be overcome by
78

using phase contrast light microscopy. In phase contrast microscopy the sample is
illuminated with light and the differences in refractive index determine the ability to
observe the heterogeneity of a polymer blend(2,24,46) The microscope optics produce a
phase shift between the diffracted and transmitted light, which provides phase contrast
with only small differences in refractive index. The higher refractive index elastomer
appears darker. Phase contrast light microscopy requires very thin specimens (1-4 Ilm)
which can be prepared by cryo-sectioning. Limitations of the phase contrast method
are Iow resolution and poor contrast with certain polymer combinations, distortion of
the polymer phases from swelling and the limited applicability to carbon black filled
systems. Carbon black raises the refractive index difference of polymer mixtures and
eliminates the phase contrast mechanism(2). Furthermore, this technique is only
qualitative.
On the other hand in electron microscopy thickness differences determine the ability to
observe heterogeneity. Hence phase differentiation is caused by dissimilar swelling and
extension. Marsh et aI.(46) found that no phase difference could be observed using a
non-swelling liquid and phase differences appear only in stretched sections. The
elastomer having the higher degree of swelling corresponds to the lighter phase(46),
since it will stretch more easily than the other under equal stress reducing its thickness.
Since the presence of carbon black reduces the swelling of a vuIcanisate, electron
micrographs of sections of filled elastomer blends are not as simply interpreted as those
of pure elastomers(47) A filled elastomer will stretch much less under a given load than
the unfilled elastomer and these differences are emphasised after swelling. e.g. in
unfilled elastomer blends of IR and BR, IR is always the lighter phase and BR the
darker, since swollen unfilled IR stretches more than swollen unfilled BR. The
presence of carbon black in the IR will reverse this phenomenon. Transmission electron
microscopy (TEM) is an ideal method because of its high resolution and applicability
to both filled and unfilled elastomers. Thin microtome sectioning (0.1 Ilm or less) is a
requirement for TEM. However, for most elastomer blends there is no contrast
between polymer phases in a TEM. Osmium tetroxide (OS04) staining is a commonly
used method for developing contrast in polymer blendS< 48) containing elastomers of
widely different unsaturation levels. However, achieving contrast for TEM analysis of
blends of high unsaturation rubbers is a problem. Plasma etching technique( 49) is
another method which can be used to achieve contrast between the phases in a highly
filled blend.
Phase contrast microscopic method was first applied by Waiters and Keyte(17) to the
analysis of binary blends. They examined a variety of binary blends using phase
contrast and electron microscopy. In the case of SBRlBR blends heterogeneity was
79

observed and the domain size ranged from 0.2 Ilm to several microns. The blends were
also incompatible when blended in solution. In contrary, the work of Marsh et al(46)
using phase and electron microscopy showed that SBRlBR blends are completely
compatible after two minutes of mixing. Kiyek and Schoon(50) also examined a range
of rubber blends, excluding SBRlBR but never found them to be completely
compatible. The work of Callan, Topcik and Ford(18) on ethylene-propylene-diene
terpolymer (EPDM)lbutyl rubber (HR) blends using phase contrast microscopy
showed that there is a tendency for low molecular weight EPDM to be compatible with
HR.
3.2.4 BLEND MORPHOLOGY
3.2.4.1 INTRODUCTION
For incompatible rubber blends the basic factors that govern blend morphology are:
I) Composition of the components
2) Relative mixing viscosities of the components
3) Mixing conditions or the method employed to produce the
blend
These are sometimes interrelated. The major blend component in a binary blend will
tend to form the continuous phase, while the other the discrete phase. This behaviour
has been supported by many workers(17,18,19,20). The general aim is to achieve as fine a
dispersion of the minor component as possible, which generally means the use of
compounding equipment generating high shear stresses and long mixing times. The
degree of shear stress determines the size of the discrete phase. The basic parameters
used to characterise blend morphology are phase continuity and width and shape of the
domains.
3.2.4.2 EFFECT OF COMPOSITION ON MORPHOLOGY
As previously mentioned (Section 3.2.2), composition (or blend ratio) significantly
influences the physical properties, mainly the tensile properties, via changes in the
morphology of a blend. Although the work of Ahmad and Wheelans(l6) on unfilled
blends of NRlNBR (41% ACN) showed the existence of co-continuous phases in
50/50 NRlNBR blends, in contrary, Scott et al.(51) reported that the NBR is the
80

dispersed phase in 50/50 NrJNBR blends (unfilled) and exhibits very large domains ..
All the other unfilled 50/50 blends of NR with eis-BR, SBR-1500, CR, Chlorobutyl
and EPDM were co-continuous and the domains were very much smaller than the
NRlNBR blends. The relatively large domains exhibited by the unfilled NRlNBR as
well as the unfilled SBRlNBR blends were attributed to the very high viscosity (or
molecular weight) of NBR(20). Also these researchers reported a significant change in
the morphology of the unfilled NRlNBR blends with composition. Quantimet phase
contrast micrographs of 25/75, 50/50 and 75/25 NRlNBR blends are shown in
Fig. 3.9.
I lOJlm
NR 75% 50% 25%
Fig. 3.9 Pure gum blends of NBR with NR as imaged by the quantimet(20)
The NR phase appears to be the lighter phase in this blend system. NR is the discrete
phase in the 25/75 NRlNBR blend, whereas NBR is the discrete phase in the 75/25
NRlNBR blend. This means a phase reversal takes place when the composition of the
blend is changed from 25/75 to 75/25 NRlNBR.
3.2.4.3 EFFECT OF RELATIVE MIXING VISCOSITY OF TIlE COMPONENTS AND MIXING
CONDITIONS ON MORPHOLOGY
In incompatible blends such as NRlNBR, it is primarily the rheological factors which
control the morphology. Hence, knowledge of the rheology of the component
polymers is useful. The early work of Waiters and Keyte(17) on NR!SBR and NR/BR
blends showed that, in the case of mechanical blending, the dimensions of the domains
are influenced by the relative viscosities of the component elastomers. They concluded
that smaller domains are obtained at a 50:50 blend ratio when the Mooney viscosities
of the components are similar. The above phenomenon was also supported by
Avgeropoulos et al.(25) and they concluded that, at equal component ratio, the
continuous phase is invariably found in rubber of lower viscosity. Their work was
based on EPDMlBR blends and the relative viscosities were varied by changing the
shear rate and/or mixing temperature. It was also possible to shift the disperse phase
from one polymer to another even though that polymer was the minor component. In
81

this instance, the low viscosity phase encapsulates the high viscosity component and
then becomes continuous.
Avgeropoulos et al. explained the dependence of blend morphology on the relative
viscosities of the components in terms of a tearing or fracture mechanism. They
proposed that for SO/50 blends of unequal viscosity, this tearing or fracture would
occur first in the high-viscosity material, which would thus become the discrete phase.
For equal mixing viscosities and hence equal mixing torques, tearing would be equally
likely in both phases, and a co-continuous system would be obtained.
The shape of the domains is more nearly spherical when the high viscosity component
is the disperse phase. A softer disperse phase gives elongated domains(25). Kiyek and
Scoon(50) also found that in polymer blends the harder component is embedded in the
softer in the form of spheres. Supportive results have been obtained by Hess and
Chirico(8), when separate masterbatches were blended. In contrast, Tokita(52) found
that the domains of EPM in a NRlEPM blend are clearly spherical in shape when the
Mooney viscosity of the EPM is lowest. The highest-Mooney EPM domains were
irregular in shape and showed a wide range of sizes at short mixing times, but with
increasing mixing time, the shape of the particles became spherical.
Tokita developed a theoretical expression for blending based on the assumption that an
equilibrium domain size of dispersed phase will be reached when the break down rate
and the coalescence rate are balanced.
R* = y(12/7t)pcr<pD/(rrr-(4/7t)P<PDEDd
where R * - equilibrium domain size
p - probability that a collision will result in a coalescence
E DK - macroscopic breaking energy
y - shear rate
11 - apparent viscosity of the matrix phase
cr - interfacial tension
<P D - volume fraction of the dispersed phase
In order for breakdown to occur, the apparent shear stress, 11Y must exceed the
macroscopic breaking energy density of the dispersed phase. The above equation then
can be expressed as
82
The above equations indicate that the equilibrium domain size becomes smaller when,
(i) the apparent stress field (which is mainly due to the matrix viscosity) is
increased
(ii) the macroscopic breaking energy becomes smaller under the same stress
field
(iii) the interfacial tension becomes smaller
and (iv) the concentration of dispersed phase decreases
An unfilled NRlEPM blend was used to verifY this theory. The changes in the domain
size of EPM were studied with regard to the above four factors. Mooney viscosity of
the EPM samples was taken as a measure of EOK , since an appropriate method to
measure EOK at high rotor speed (60 rpm) was not known. EOK was postulated as
proportional to Mooney viscosity of the EPM samples since all of them had the same
microstructure and narrow molecular weight distribution.
Quantitatively, the experimental results were found to be consistent with the
theoretical prediction. Experimental results also indicated that viscosity matching
between matrix and dispersed phases is desirable to obtain small dispersed domains in a
short time, or in other words, to increase the blending efficiency. Tokita concluded that
on changing from an internal mixer to a two-roll mill, temperature becomes one of the
most influential factors that control the domain size. Higher mixing temperature
appeared to reduce domain size by diminishing the interfacial tension. Since the
temperature normally goes up during mixing, high shear stress blending of polymers
with similar viscosities will give the most homogeneous mixtures.
Ahmad and Wheelans(l6) studied the effect of mixing time and mixer rotor speed on
the morphology of unfilled 80120 NRiNBR (41 % ACN) blends. Only a small reduction
in domain size was reported with increasing the Banbury mixing time from 3 to 6
minutes at 77 rpm and there was no further reduction in domain size after 10 or 20
minutes of mixing. This is possibly associated with the viscosity of NBR, which is the
dispersed phase as the work of Tokita(52) has shown that the rate of break down is
slower in a higher-Mooney dispersed phase than in a lower-Mooney one. No
improvement in vu1canisate properties was reported with increased mixing time, as a
consequence of there being no change in blend morphology. Increases in Banbury
rotor speed to 116, 155 and 230 rev./min. caused a significant increase in work done
and dump temperatures at constant Banbury mixing time, but there was no reduction in
the domain size of the NBR The highest rotor speed caused the worst tensile
properties due to the larger domain size, while modulus remained unchanged. The
batches discharged were' crumbly' at all mixing speeds.
83
In addition to the previously mentioned factors, addition of homogenising agents,
variations in polarity and the amount and type of filler also affect the domain size.
There was evidence from the work of Ahmad and Wheelans(l6) that reduction of
interfacial tension by addition of homogenising resins such as Strucktol 60 NS and
Strucktol THlO (Schill and Seilacher, Hamburg), 5 phr to 80120 NRlNBR (41% ACN)
blends (unfilled) helped to reduce domain size giving better adhesion between NR and
NBR. There was no further advantage in using 10 phr Strucktol 60 NS instead of 5
phr. Addition of SBR to NR and NBR to the ratio 35/35/30 NRlNBRlSBR also helped
to reduce the domain size ofNBR to 10-1511m. Addition of Struck to I 60 NS gave no
further reduction of domain size in this ternary blend. Strucktol 60 NS weakens the
adhesion between NBR and other rubbers (NR and SBR).
Further studies on unfilled NRlNBR (41 % ACN) showed that the acrylonitrile content
of NBR also has an influence on the domain size. These researchers concluded that
80120 NRlNBR blends have a coarse domain structure if the ACN content of the NBR
is greater than 34%, while if the ACN% is 28% or less, 80120 blends have a fine
domain size with domains too small to be resolved by the optical microscope. Holes in
xylene-swollen microtomed sections of NRlNBR blends suggested poor adhesion
between NBR domains and the continuous NR phase. Low peel strength values also
confirmed poor bonding between NR and NBR. Moreover, they concluded that if the
swelling resistance is not too critical for an application, blends ofNRINBR would have
better mechanical properties based on NBR 's with an ACN content of 28% or less.
Gessler et al(53) reported that the addition of fillers reduces the size of the separate
polymer domains. In 50/50 NRlBR blends where the loading of ISAF carbon black
was varied from 10-40 phr, the darker BR phase becomes finer and more continuous
with increased carbon black. The improvement in blend uniformity is attributable to the
carbon black, which raises viscosity and hence increases stress during the mixing cycle.
3.2.4.4 EFFECT OF MORPHOLOGY ON PROPERTIES
Phase morphology does not appear to have a major effect on modulus(54,55) In
EPDMlBR blends, at comparable polymer concentrations modulus did not change
significantly when the BR was changed from the continuous to disperse phase.
Supportive results have been obtained by WaIters and Keyte(J7), who studied the effect
of domain size on gum stock physical properties ofNRISBR and NRlBR blends. They
reported that modulus as well as hardness, tear strength and tensile strength are not
greatly affected by the size of the domains. The work of Ahmad and Wheeians(16) on
unfilled NRlNBR blends has also shown that modulus does not change with domain
size. However the blend with the largest domain size showed the worst tensile
84

properties. The work ofHamed(S6) on unfilled 75/25 EPDMlBR blends has shown that
the energy at break (Eb) increases significantly when the disperse phase (BR) changes
from large and fibrous to small and spherical. The polymer of highest strength as the
continuous phase is a criterion for maximising tear resistance(8).
3.3 CARBON BLACK DISTRIBUTION AND TRANSFER
3.3.1 INfRODUCTION
The physical properties of vulcanised rubber blend compounds are also greatly
influenced by the distribution of compounding ingredients (especially reinforcing fillers
like carbon black) in addition to the heterogeneity of the blend. In general, the
properties are more significantly affected by filler distribution than they are by
morphology(2). Therefore, knowledge about the distribution of carbon black between
the phases in a blend will be of use to explain the variations in physical properties.
Transmission electron microscopy (TEM) in conjunction with cryosectioning and
staining techniques, has proved to be the best means of resolving filler distribution.
The work of many researchers indicates that carbon black distribution in elastomer
blends is determined by a combination of complex factors including the ability of an
elastomer to wet and form strong attachments to the filler surface, relative polymer
viscosities, and mixing technique, the effect of which is discussed herein.
3.3.2 EFFECT OF TYPE OF POLYMER
Displacement of carbon black from one elastomer to another was noted by Callan,
Topcik and Ford(l8) for EPDM/butyl rubber (HR) and by Craig and FowleP7) for
NRlNBR blends. The work of Call an and co-workers showed that EPDM has a higher
affinity for carbon black than HR, since carbon black transferred from HR to EPDM
during blending. This was attributed to the chain entanglement of the long, supple
molecules of EPDM, which readily occlude or "entrap" large volumes of fillers. The
studies of Craig and Fowler involved the addition by milling of NBR to a NR and
carbon black masterbatch. The carbon black was assumed to be displaced from NR by
the more polar NBR, due to the higher affinity for carbon black of NBR than NR. In
both the works mentioned above, studies on stocks with higher carbon black loading
(> 20 phr) were hampered because of poor inter-zone contrast and inability to cut
85

suitably thin specimens. Similar variations in the relative affinity of polymers for carbon
black were reported by Hess, Marsh and Eckert(58).
The work of Callan, Hess and Scott(20) also showed that NBR has a appreciably higher
affinity for carbon black than NR. Further studies on 50150 blends of several other
commercially important rubbers indicated that carbon black transfers from butyl to BR,
NR and SBR. Also transfer occurred from NRlcarbon black (N330) masterbatch mixed
in the two-roll mill (with low heat history) to BR, but carbon black did not transfer
from NRlcarbon black (N330) masterbatch mixed in the internal mixer (with high heat
history) to BR or SBR. They suggested that transfer of carbon black from one phase to
another can occur when the adsorptive capacity of the carbon black has not been fully
utilised and this situation can exist if the masterbatch has minimum heat or mechanical
history, or involves low molecular weight or low unsaturation elastomers such as butyl
rubber.
On the contrary, carbon black distribution studies done by Marsh and co-workers(59)
on mill mixed blends of NR with SBR and BR using electron microscopy did not
indicate large scale phase transfer of carbon black during mixing. The lack of carbon
black transfer from the NR to the BR phase was attributed to the low modulus level of
such blends. Polychloroprene exhibited a strong affinity for carbon black in blends with
NR. In this system, with the carbon black predispersed in the NR, the carbon black
particles were observed at the polychloroprene interface, but had not entered that
phase.
3.3.3 EFFECT OF RELATIVE MIXING VISCOSITIES OF TIffi COMPONENTS
There was evidence from the early work of Waiters and Keyte(17) on NRlSBR and
NRlBR blends that carbon black is not always evenly distributed between the
components of a blend, and this may affect physical properties. They predicted that
carbon black mixes initially into the least viscous elastomer, since it is here that most of
the shear strain is taking place. Thus the viscosity of this elastomer would be raised,
and when it approaches that of the more viscous elastomer, the carbon black would be
taken up by both elastomers. This would result in the softer elastomer being more
highly loaded than the stiffer elastomer.
Supportive evidence for the viscosity dependence of carbon black affinity has been
obtained from the work of Hess and co-workers(19) They reported that carbon black
locates preferentially in the polybutadiene (BR) in a 50150 preblend with NR and this
affinity depends on the viscosity and can be varied. However they suggested that
polarity factors can supersede viscosity considerations and determine filler locations in
the blend. Gessler et al.(53) also found that the lower initial viscosity of the BR,
86

compared to NR in the NRlBR blends studied would tend to favour the acceptance of
carbon black. Experiments in which the BR viscosity was increased significantly
produced a reversal of this distribution pattern, i.e. a higher percentage of the carbon
black was then located in the NR phase. It is to be noted that the lower viscosity NR,
which results due to the breakdown ofNR during mixing (mastication), has more of an
affinity for carbon black than does the original NR of higher viscosity<49) The work of
Hess and Chirico(8) also indicated preferential BR location in NRlBR preblends. It was
not as great as that observed for SBR in NR/SBR preblends, or as that found in
previous studies of NRlBR blends(19) due to lower viscosity of the NR employed in
this work.
3.3.4 EFFECT OF TYPE OF CARBON BLACK
The affinity of a rubber for the carbon black varies depending on polymer used, mixing
technique and especially the carbon black type. Inert (partially graphitized) carbon
blacks tend to distribute more evenly between the blend components regardless of
which polymer contained them initially(60). Cotton and Murphy(60) showed that N6S0
carbon black (partially graphitized) distributed in both elastomers NR and EPDM in a
blend ofNRIEPDM with some preference for the EPDM whereas, the untreated N6S0
sample located almost entirely in the NR phase when added to the preblend (premixed
elastomers). With the untreated (standard) carbon black, the unsaturation of the NR is
the factor governing carbon black distribution. Differences in polymer molecular
weight probably play a much greater role with the graphitized carbon black. However
no significant difference has been observed in the NR/SBR distribution of a partially
graphitized carbon black relative to its untreated (standard) sample.
In the case of phase mixed EPDMINR blends, the untreated carbon black did not
transfer significantly from either masterbatch into the other rubber (some carbon black
migrated from EPDM to NR), whereas the partially graphitized N6S0 sample
transferred between the phases, resulting in a more uniform carbon black distribution.
However when butyl rubber-N6S0 masterbatches were blended with NR, the untreated
as well as the partially graphitized carbon black transferred into the NR phase. In the
case of the latter, some carbon black particles were seen remaining in the HR domains
or at the phase boundaries.
Furthermore, Cotton and Murphy(60) showed that carbon black is located preferentially
in the SBR phase in SO/SO NR/SBR blends and this preference increased in the
direction of higher carbon black surface area (or lower particle size). The lesser
amounts of carbon black in the NR phase of NR/SBR blends were attributed by these
87

authors to a lower degree of carbon black-polymer interaction in comparison to SBR
and related this to steric hindrances caused by the NR microstructure, i.e. the inability
for two adjacent double bonds to be in contact with the carbon black surface
simultaneously.
3.3. S EFFECT OF DIFFERENT MIxING TECHNIOUES
Massie et al.(49) evaluated the distribution of an NSSO carbon black in blends of SO/SO
NRlBR prepared in a Haake System 40 Brabender. They prepared these blends
according to three different mixing schemes and concluded that NSSO has no
preference for either phase. When mixed simultaneously with both polymers, the
carbon black distributed itself evenly between the phases. Analysis of phase-mixed
(rubber-carbon black masterbatch technique) samples showed that majority of carbon
black remains in the polymer phase to which it is originally added. No significant
carbon black transfer occurred even after ten minutes of mixing. An even distribution
of carbon black between the phases has also been observed in SBRlNBR blends
prepared according to the preblending technique (addition of carbon black to premixed
elastomers)(59). The above studies indicate that distribution of carbon black in NRlBR
blends differs according to the mixing technique employed.
3.3.6 SUMMARY OF MAJOR FINDINGS
Summary of findings on carbon black distribution and transfer reported by many researchers is as follows:
(I) Affinity of carbon black for elastomers decreases in the order
BR, SBR, eR, NBR, NR, EPDM, IIR(20)
(2) Transfer of carbon black from one rubber-carbon black masterbatch to the other
rubber phase can occur if the rubber-carbon black masterbatch has a minimum
thermal or mechanical history (e.g. solution masterbatch) or involves low
molecular weight or low unsaturation elastomers (e.g. butyl) in which bound
rubber formation is minimised(20,61,62). The bulk of the carbon black is always
found in the more highly unsaturated elastomer.
(3) When carbon black is added to the pre-blended elastomers, it does not redistribute
if both elastomers have equally high interaction with the carbon black and a high
degree of compatibility with each other(62).
88

(4) Surface polarity ofthe carbon black influences its distribution. Inorganic fillers like
silica tend to accumulate in the NR phase. For example in cis BRINR blends, silica
tends to accumulate in the NR phase(l9,51)
(5) Point of addition of carbon black, viscosities of the elastomers and the method of
blending also influence carbon black distribution(l9,51).
(6) No significant amount of carbon black migrates from one rubber phase to the other upon Brabender mixing of a masterbatch with a second rubbepo,62,63,64,65)
Based on the above findings Lee proposed the Controlled Ingredient Distribution
Mixing (CIDM) theory(66) and an alternate stage addition mixing process(67).
According to the former, the major and minor rubber components are individually
preblended with the appropriate amounts of the compounding ingredients including
carbon black and the curing agents. Finally they are cross-blended. This gives rise to a
compound that has heterogeneous ingredients distribution in the individual phases.
Lee, finally studied the heterodistribution of fillers on properties such as flow
properties, green strength, crack-growth resistance, heat build-up, oil swelling , I '" b'I' d I 'I ' (63 64 68 69) resistance, covu carusatlon, air permea Ilty an e ectnca properties ' , , .
3.3.7 EFFECT OF VARIED CARBON BLACK DISTRIBUTION ON BLEND MORPHOLOGY
There is evidence from the work of several researchers that the morphology of an
elastomer blend is significantly affected by the distribution of carbon black between the
phases. The work of Lee(64) showed that the morphology of SBRlBR blends prepared
by free carbon black (20 phr N330) mixing of the three components, SBR, BR and
carbon black is similar to that of blends prepared by mixing SBR-carbon black
masterbatch with BR (at constant mixing time), However this morphological feature
was significantly different from that of blends prepared by mixing BR-carbon black
masterbatch with SBR.
On the other hand Hess et al(70) reported that the sizes of the BR domains in an 80/20
NRlBR blend compounds were fairly similar for the preblend (addition of carbon black
into premixed elastomers) and the blends containing 30 and 60 phr of carbon black
(N299) in the BR. The BR domains were about the same size as those in the unfilled
80/20 blend. Overall, the blended carbon black masterbatches tend to produce larger
polymer domain sizes in comparison to the polymer preblends. The 80/20 NRlBR
blend containing the 90 phr carbon black loading in the BR showed considerably larger
BR domains (0.5 - > 50 !-lm). This morphology was represented by all the blends
89

containing a relatively high carbon black loading in the BR masterbatch, except when
the BR content was 80% of the blend. At a 50/50 NRlBR blend ratio, BR appeared to
be the more continuous phase in the blended masterbatches of equivalent carbon black
loading, but NR was more continuous with a 90 phr carbon black loading in the BR
phase. At 30 phr in the BR, both polymers exhibited elongated domains with the NR
phase being somewhat more continuous. Hess et al. (70) suggested that this appears to
be an important consideration in maximising tear strength and fatigue life.
3.3.8 EFFECT OF VARIED CARBON BLACK DrSlRIBUTION ON PROPERTIES
Carbon black phase distributional variations can cause significant changes in physical
properties of an elastomer blend. Hess and co-workers(19) reported that road wear
resistance and tensile strength of 50/50 NRlBR blends were highest with most of the
carbon black (N220) in the polybutadiene (BR) phase (based on solution-mixed
masterbatches). The increase in tensile strength with increasing percentage of carbon
black in the BR phase is in agreement with the recognised need for carbon black
reinforcement to develop optimum mechanical properties of polybutadiene and the
ability of NR to exhibit an alternate mechanism of reinforcement by crystallisation
under stress. Tear strength was optimised with about 60% of the carbon black in the
BR phase. However the above authors have not given any explanation for the observed
changes in tear strength and road wear resistance with variation in carbon black
distribution.
Sircar et al(65) also reported low tensile strength for NRlBR and NR/SBR blends with
a lower carbon black loading in the synthetic e1astomer. Krakowski and Tinker(71) have
also shown that preferential placement of the carbon black (N330) in the BR phase of
NRlBR blends significantly improves the resistance to abrasion. However the studies
of Hess and Chirico (8) on the rubber properties for a N220 carbon black with different
phase distributions in 50:50 blends of NR/SBR, NRlBR and SBRlBR showed only
slight variations in modulus and tensile strength. Tread wear results also showed only
a minimal dependence in carbon black location (based on masterbatches mixed in the
internal mixer).
As in the case of the previous work of Hess et al. (l91, tear strength results of Hess and
Chirico(8) showed significant variations in NR/SBR and NRlBR as a function of carbon
black location. In NR/SBR, the highest tear strength was achieved with most of the
carbon black in the SBR. The tear strength of the preblend was quite similar to that of
the 75% carbon black-SBR compound. The NRlBR, showed a reverse pattern, i.e. tear
strength was highest with 75% of the carbon black in the NR due to the co-continuous
90

nature of the NR phase, even with a high carbon black content and lowest with high
carbon black in the BR phase. High tear strength is apparently related to a high carbon
black loading in the continuous polymer phase. This is the case in
NR!SBR when the carbon black is added either to the preblend or preferentially to an
SBR masterbatch (Fig. 3.10).
HIGH BLACK LOADING _ LOW BLACK LOADING r:: ... :-i
Fig. 3.10 Schematic representation of observed elastomer phase distributions for
50/50 NRlSBR and NRlBR blends(8)
Addition of carbon black preferentially to NR produces large NR-carbon black
domains surrounded by SBR with a relatively low carbon black loading. It has been
suggested that the rupture path in this configuration can move freely through the
weaker SBR domains, thus lowering the tearing energy. In contrast the high-carbon
black-SBR three-dimensional mesh configurations, which also impart higher hysteresis,
are able to divert the rupture path and dissipate energy along the domain boundaries.
In the case of NRlBR blends, the most continuous carbon black-elastomer three
dimensional mesh configuration was formed when the carbon black was added
preferentially to the NR. The NRlBR blends with a high carbon black loading in the
BR phase and a low carbon black loading in the NR phase gave poor tear resistance
due to a preferential failure path through the continuous phase with low carbon black
91

loading. In NRlBR blends, the tear resistance showed an even greater improvement
over that of NRlSBR blends. Hence, it may also be desirable to have the stronger
elastomer (NR) or in other words the e1astomer of highest strength as the continuous
phase with high carbon black loading for maximising tear resistance. Supportive results
have been obtained by Hess et al.(70), who studied the changes in tear strength of
NRlBR blends as a function of carbon black phase distribution.
Although there is evidence for some improved abrasion resistance with a preferential
carbon black-BR phase distribution in blends ofNRIBR and SBRlBR, there appear to
be anomalies relating to mixing procedure and carbon black type/loading. For example,
in the case of solution mixed masterbatches tread wear resistance increased
progressively with increasing carbon black in the BR phase, whereas in the case of
masterbatches mixed in the internal mixer (Farrel Banbury) no significant wear
differences were observed as a function of carbon black phase distribution(8). Also,
N220 carbon black showed some wear advantage for the BR phase distribution,
whereas the differences were much smaller for the larger particle size carbon blacks
and the effects of phase distribution were inconsistent(8).
Comparison of mixing methods (chlorobutyllNBR blend) have shown an advantage in
physical properties, for directly mixing compounding ingredients into the blend of
elastomers over mixing previously prepared masterbatches(6) Stress-strain data on
SBRJNBR blends have also shown that the best balance of tensile strength and
modulus can be obtained by preblending the elastomers before adding carbon black,
which gives rise to an even distribution of carbon black between the phases(59).
Several researchers have also studied the effect of carbon black distribution on
rheological properties ~s discussed herein. The work of Bhowmick et al(72) on
EPDMlbromobutyl rubber (BUR) blends has shown that viscosity increases with more
carbon black mixed into the BUR phase.
Sircar et al.(65) reported that the viscosity values of blends prepared by diluting
masterbatches mixed in the internal mixer with unfilled elastomers are much lower than
those prepared by conventional mixing techniques and than the single elastomers at the
50 phr carbon black loading due to the carbon black structure development, Le. the
second elastomer segregates the carbon black e1astomer aggregates formed in the first
-stage, resulting in discontinuous carbon black structure units surrounded by layers of
unfilled e1astomer. In contrast, Hess et al(19) reported an unexpected phenomenon that
NRlBR blends had higher viscosities than the single elastomers. Their work also
indicated that, NR phase undergoes fairly excessive molecular breakdown, while BR
92

does not. They suggested that the free radicals formed by chain scission of the NR
molecules react with the BR forming graft interpolymers, which in turn raise the
viscosity of the blends due to the high molecular weight of the grafted molecules.
On the other hand Lee(64) found that the shear viscosity of SBRlBR blends containing
20 phr N303 carbon black is not affected by mixing and the location of carbon black in
the individual rubber phases has little effect on the shear viscosity
(Figures 3.11 and 3.12). The experimental results were in agreement with the
theoretically calculated viscosity values. The model used was a blend of two different
fluids (the carbon black preloaded rubber was considered as one fluid).
,,'
SHEA~ RAfE !Cite"'1
Fig. 3.11 Shear viscosity versus shear rate for 80 parts SBR, 20 parts BR and 20 phr carbon black (N303) model compounds. Mixing time is one minute(64)
A = free mixing, B = mechanically mixed SBR-carbon black masterbatch approach,
C = mechanically mixed BR-carbon black masterbatch approach
93

'c' 0 ,.
c .. : ,. l ,.
, I
-;;
~ .. ~IO! C ; ;;
, • ,
" • 0'
-. • J. ., " "" S~E;,q ~,HE :Sfc")
Fig. 3.12 Shear viscosity vs. shear rate for 80 parts SBR, 20 parts BR and 20 phr carbon black (N303) model compounds. Mixing time is 8 minutes(64)
A = free mixing, B = mechanically mixed SBR-carbon black masterbatch approach,
C = mechanically mixed BR-carbon black masterbatch approach
94

REFERENCES
1. C0I1Sh, PJ., "Science and Technology of Rubber", Eirich, F.R., Ed.,
Academic Press, Inc. New York (1978) Chap.l2
2. Hess, W.M., Herd, C.R. and Vegvari, P.C., Rubber Chem. Technol., 66
(1993) 329
3. Livingston, DJ. and Rongone, RL., Proc. Int. Rubber Technol. Conf,
Brighton (1968) p.337
4. Shundo, M., Imoto, M. and Minoura, Y., J. Appl. Polym. Sci., 10 (1966)
939
5. Rehner, J. and Wei, P., Rubber Chem. Technol., 42 (1969) 985
6. Evans, L. and Partridge, E.G., ACS/CIC, Div. Rubber Chem., 83rd Meet.,
(1963); Rubber Age, 94(2) (1963) 272
7. Bristow, G. M., NR Technol., 9(1) (1978) 1
8. Hess, W.M. and Chirico, V.E., Rubber Chem. Technol., 50 (1977) 301
9. Hindemarch, RS. and Gale, G.M., Rubber Chem. Technol., 56 (1983) 344
10. Lee, B.L.(to B.F. Goodrich Co.), US Patent No. 4,455,399 (June 19, 1984)
11. Trexler, HE. and Lee, M.C.H, Kautsch. Gummi Kunstst., 40 (1987) 945
12. Gessler, A.M. and Haslett, Jr. WH(to ESSO Research and Engineering
Co.) US 3,037,954 (June5, 1962)
13. Setua, DK and White, J.L., Kautsch. Gummi Kunstst., 40 (1987) 945
14. Alger, M.S.M. and Dyson, RW. "Engineering Polymers"-Thermoplastic
Composites, Chap. 1
15. Baker, C.S.L., Hallam, W.G. and Smith, I.F., NR Technol., 5(2) (1974) 29
16. Ahmad, Md. Aris bin and Wheelans, M.A., NR Technol., 15(4) (1984) 78
17. Waiters, M.H. and Keyte, D.N. , Rubber Chem. Technol., 38 (1965) 62
18. Callan, J.E., Topcik, B. and Ford, F.P., Rubber World, 151(6) (1965) 60
19. Hess, W.M., Scott, C.E. and Callan, J.E., Rubber Chem. Technol., 40
(1967) 371
95

20. Callan, J.E., Hess, W.M. and Scott, C.E., Rubber Chem. Technol., 44
(1971) 814
21. Roland, C.M., and Bohm, G.G.A., Macromolecules, 18 (1985) 1310
22. Bair, H.E., Polym. Eng. Sci., 10(4) (1970) 247
23. Margaritis, A.G. and Kalfoglou, NK, Polymer, 28 (1987) 497
24. Waiters, M.H. and Keyte, D.N., Trans. lost. Rubber Ind., T41 (1962) 38
25. Avgeropoulos, N., Weissert, F.C., Biddison, P.H. and Bohm, G.G.A.,
Rubber Chem. Technol., 49 (1976) 93
26. Olabisi, 0., Robeson, L.M. and Shaw, M.T. "Polymer Miscibility",
Academic Press, New York (1979)
27. Kerrutt, G., Blumel, N. and Weber, H., Kautsch. Gummi. Kunstst., 22
(1969) 413
28. Hildebrand, J.H. and Scott, RL., "The Solubility of Non-electrolytes" ,
Dover, N.Y., (1964)
29. Hoy, K.L., J. Paint Technol., 42 (1970) 76
30. Small, P.A., J. Appl. Chem., 3 (1953) 71
31. Brydson, J.A., "Rubber Chemistry", Applied Science Publishers Ltd.,
London (1978) Chap.4
32. Bohn, L., Rubber Chem. Technol., 41 (1968) 495
33. Corish, PJ., Rubber Chem. Technol., 40 (1967) 324
34. Hofmann, W., Prog. Rubber Technol., 46 (1984) 46
35. Koningsveld, R., Ph.D. Thesis, Leiden (1967)
36. Coleman, M.M., Moskala, EJ., Painter, P.C., Walsh, DJ. and Rostami, S.,
Polymer, 24 (1983) 1410
37. Cruz, C.A., Barlow, J,W. and Paul, D.R, Macromolecules, 12 (1979) 726
38. Flory, PJ., J. Chem. Phys., 9 (1941) 660
39. Huggins, M.L., J. Chem. Phys., 9 (1941) 440
40. Flory, PJ., "Principles of Polymer Chemistry", Comell University Press,
N.Y. (1953) 555
41. Scott, R.L., J. Chem. Phys., 17 (1949) 279
42. Tompa, H, Trans. Faraday Soc., 45 (1949) 1142
96

43. Roberts, AD., "Natural Rubber Science and Technology", Oxford Uni.
Press, N.Y., (1988) p.927
44. Billmeyer, F.W., "Textbook of Polymer Science", 2nd Edition, Wiley
Interscience Pub., N.Y. (1970)
45. Nielsen, L.E., J. Am. Chem. Soc., 75 (1953) 1435
46. Marsh, P.A., Voet, A and Price, L.D., Rubber Chem. Technol., 40 (1967)
359
47. Boonstra, B.B. and Taylor, G.L., Rubber Chem. Technol., 38 (1965) 943
48. Kruse, I.E., Rubber Chem. Technol., 46 (1973) 653
49. Massie, J.M., Hirst, R.C. and Halasa, AF., Rubber Chem. Technol., 66
(1993) 276
50. Kiyek, H. and Scoon, Th.G.F., Rubber Chem. Technol., 40 (1967) 341
51. Scott, C.E., Callan, J.E. and Hess, W.M., J. Rubber Res. Inst. Malaya, 22
(1969) 242
52. Tokita, N., Rubber Chem. Technol., 50 (1977) 292
53. Gessler, AM., Hess, W.M. and Medalia, AI., Plast. Rubber Proc., June
(1978) 37
54. Roland, C.M., Rubber Chem. Technol., 62 (1989) 456
55. Nelson, C. J., Avgeropoulos, G.N., Weissert, F.C. and Bohm, G. G. A.,
Angew. Makromol. Chem., 60/61 (1977) 49
56. Hamed, G., Rubber Chem. Technol., 55 (1982) 151
57. Craig, D. and Fowler, R.B., Abstracts in Rubber World, 146(6) (1962)
79; Rubber Age (N.Y.) 91(6) (1962) 966; Division of Rubber Chemistry
Meeting (1962)
58. Hess, W.M., Marsh, P.A. and Eckert, FJ., Presented at a Meeting of the
Rubber Division, ACS, Miami Beach, Florida (1965)
59. Marsh, P.A., Voet, A, Price, L.D. and Mullens, TJ., Rubber Chem.
Technol., 41 (1968) 344
60. Cotton, G. and Murphy, LJ., Rubber Chem. Technol., 61 (1988) 609
61. Marsh, P.A., Mullins, TJ. and Price, L.D., Rubber Chem. Technol., 43
(1970) 400
62. Sircar, AK. and Lamond, T.G., Rubber Chem. Technol., 46 (1973) 178
97

63. Lee, B.L. and Singleton, CJ., J. AppI. Polym. Sci., 24 (1979) 2169
64. Lee, B.L. , Polym. Eng. Sci., 21(5) (1981) 294
65. Sircar, A.K., Lamond, T.G. and Pinter, P.E., Rubber Chem. TechnoI., 47
(1974) 48
66. Lee, B.L., Polym. Eng. Sci., 25 (1985) 729
67. Lee, B.L., Polym. Eng. Sci., 22 (1982) 902
68. Lee, B.L., l AppI. Polym. Sci., 27 (1982) 3379
69. Lee, B.L., "Polymer Blends and Composites in MuItiphase Systems" ,
Han, C.D. (Bd.) ACS, Advances in Chemistry Series, No.206, ACS,
Washington D.C. (1984) pp. 185-209
70. Hess, W.M., Vegvari, P.C. and Swor, R.A., Rubber Chem. TechnoI., 58
(1985) 350
71. Krakowski, FJ. and Tinker, A.l, Elastomerics, 122(6),34; 122(7),24
(1990)
72. Bhowmick, T.K., De, P.P., Bhowmick, A.K. and Gupta, B.R., Kautsch.
Gummi. Kunstst., 42 (1989) 115
98

CHAPTER FOUR
EXPERIMENTAL METHODS
4.1 INTRODUCTION
The main stages of this study and their purpose are described briefly here.
1. Single-Stage Mixing of Filled NRlNBR Blends
For the initial stage of experimentation, the effect of internal mixer rotor speed and
initial temperature of NBR on morphology, carbon black distribution and properties
was investigated.
The aim was to determine the influence of these variables on properties via domain
size. Variation of mixer rotor speed was chosen to adjust the ratio of apparent
viscosities of the NR and NBR, which is known to have an effect on the dimensions of
the domains(I,2,3) . The initial temperature of the NBR (45% ACN) was also varied to
affect viscosity and hence domain size. Both mixer rotor speed and initial NBR
temperature were selected with reference to rheological characterisation of the two
elastomers.
2. Masterbatch Mixing of Filled NRlNBR Blends
For the second stage of experimentation, the effect of distribution of carbon black on
morphology and properties was investigated, since the properties of elastomer blends
are known to be significantly affected by carbon black distribution(4,5,6,7,8,9) . Carbon
black distribution in the blends was varied by varying the level of carbon black in each
elastomer. Transfer of carbon black from one rubber/carbon black masterbatch to the
other was also investigated.
NR exhibits self reinforcement due to strain crystallisation, whereas reinforcing fillers
must be added to NBR because the unfilled vulcanisates do not strain crystallise and
hence lack self-reinforcement. Hence the aim was to explore the effect of varied carbon
black distribution on properties via changes in the degree of reinforcement of the two
phases NR and NBR.
99

3. Mixing of Filled NR and NBR Compounds
For the third stage of experimentation, properties of the filled NR compound, NBR
(45% ACN) compound and the filled NBR control (26.6% ACN) compound were
investigated.
The aim of this investigation was to compare with the properties of the filled single
stage blends in order to determine the suitability of the latter as a replacement for
NBR compounds, particularly the control NBR compound which is used in the
manufacture of oil seals.
4. Mixing o(the NRlNBR Single-Stage Gum Blend
For the fourth stage of experimentation the morphology of the NRlNBR single-stage
gum blend was investigated.
The aim was to ascertain the influence of carbon black on the morphology via a
comparison with the corresponding filled compounds.
5. Mixing o(the Filled NRlNBR Single-Stage Blend with a Short Mixing CYcle
For the final stage of experimentation, a partially mixed single-stage NRlNBR blend
was prepared with the idea of ascertaining the location of carbon black in the NRlNBR
single-stage blends.
The aim was to obtain a very coarse textured morphology consisting of domains larger
than aggregates of carbon black via a short mixing cycle, so that investigation of
distribution of carbon black between the two phases NR and NBR would be easier
than in the case of fine textured blends.
A schematic illustration of the sequence of experiments undertaken is shown by the
flow diagram in Fig. 4.1.
lOO

Rheological characterisation ofNR and NBR
Mixing, analysis of morphology, carbon black distribution
and properties of filled NRlNBR single-stage blends
Mixing, analysis of morphology, carbon black transfer
and properties of filled NRlNBR masterbatch blends
Mixing and analysis of properties of
filled NR and NBR compounds
Mixing and analysis of morphology of the
NRlNBR single-stage gum blend
Mixing and analysis of location of carbon black of the filled
NRlNBR single-stage blend with a short mixing cycle
Fig. 4.1 Schematic diagram of the sequence of experiments
101

4.2 MATERIALS AND FORMULATIONS
4.2.1 Materials
Material Grade Chemical Name Trade Name Supplier Country
of Supply
NR TSR Cis-I,4- SMR 10CV MRPRA Malaysia
polyisoprene
NBR 45% Acrylonitrile- Nipol DN 001 Zeon UK
ACN butadiene rubber W45
NBR 26.6% Acrylonitrile- Paracril AL T Uniroyal UK
ACN butadiene rubber
Zinc Rubber BDTP UK
oxide grade
Stearic Rubber BDTP UK
acid grade
Carbon GPF Sterling V Cabot UK
black (N660) Carbon
Sulphur. MC Schill & UK
Seilacher
TMTD Tetramethyl Perkacit TMTD Flexysys UK
thiuram disulphide -Thiurad
CBS N-cyclohexyl-2- Santocure CBS Flexysys UK
benzothiazolyl
sulphenamide
TBBS N-tert-butyl-2- Santocure Flexysys UK
benzothiazolyl TBBS
sulphenamide
PVI N-( cyclohexylthio) Santogard PVI Flexysys UK
(CTP) phthalimide
Continued on page 103
102

Antioxid- Polymerised 1,2- Flectol H Flexysys UK
antTQ dihydro-2,2,4-
trimethyl quinoline
ASTM RAPRA UK
oil No.2
Toluene Fisher UK
Scientific
Xylene Fisher UK
Scientific
Cedar Raymond UK
wood oil Lamb
Osmium Agar UK
tetroxide Scientific
(5%)
Table 4.1 Materials
Note: The Mooney viscosities ofSMR IOCV and NBR (45% ACN) are 55 and 41 Mooney units respectively.
4.2.2 FORMULATIONS
1. Filled NR/NBR Blends for Single-Stage Mixing
The compound formulation of filled single-stage blends and the standard ASTM (ASTM D 2934-89) reference formulation for oil seals(lO) are given in Table 4.2. A
low level of N660 carbon black was used as the morphology of highly filled blends is difficult to interpret by microscopy, as evident from the Iiterature(ll).
103

Compounding Standard ASTM Single-stage
Ingredient Reference Blend
Formulation Formulation ~-~-
SMR 10CV 40
NBR(45% ACN) 60
NBR(Paracril BJL T) 100
ZnO 5 5
Stearic acid 0.5 0.5
Flectol H 2 2
Carbon black(N660) 20
Carbon black(N539) 60
TMTD 2 2
CBS 1
TBBS 1
Sulphur 0.5 1
PVI 2
DOP 5
Table 4.2 Compound formulations of the single-stage blends and the
standard ASTM reference compound, phr
2. Masterbatches and Filled NRlNBR Blends for Masterbatch Mixing
The formulations ofNR and NBR masterbatches (Stage I) and the compound
formulations of filled masterbatch blends (Stage 11) are given in Tables 4.3 and 4.4
respectively.
A B C D E F
NR 100 100 100 - - -NBR - - - 100 100 100
Carbon black' 5 25 45 3.33 16.7 30
Table 4.3 Stage I : Masterbatch formulations, phr • N660
104

: NRI0NBR90 : NR50NBR50 : NR90NBRI0
Compound : Compound Compound -.-.. ~.--------------.-~---.--~-.......j.---.. -----.+-----.--.----Diblend components NR:NBR NR:NBR NR:NBR
Component ratio 40:60 40: 60 40:60
% carbon black in NR 10 50 90
% carbon black in NBR 90 50 10
Carbon black loading, 20 20 20
phr
Composition a
MB.A 42
MB.B 50
MB.C 58
MB.D 62
MB.E 70
MB.F 78
ZnO 5 5 5
Stearic acid 0.5 0.5 0.5
Flectol H 2 2 2
TMTD 2 2 2
CBS 1 1 1
Sulphur 1 1 1
PVI 2 2 2
Table 4.4 Stage II : Masterbatch blend formulations
a MB = Masterbatch, see Table 4.3
3. Filled NR and NBR Compounds
The formulations of the filled NR compound, NBR compound and the control NBR
compound are given in Table 4.5. Formulation of the control compound was derived
from the ASTM reference formulation for oil seals (see Table 4.2).
105

Compounding NR NBR Control NBR
Ingredient Formulation Formulation Formulation ---- -----
NR 100
NBR (45% ACN) 100
NBR (26.6% ACN) 100
ZnO 5 5 5
Stearic acid 0.5 0.5 0.5
Flectol H 2 2 2 1 I Carbon black (N660) 20 20 20
ITMTD 2 2 2
I 1 I CBS
I ! TBBS
1 Sulphur 1 I 0.5
I PVI 2 2
Table 4.5 Compound formulations of filled NR and NBR compounds, phr
4. The NRlNBR Gum Blend for Single-Stage Mixing
The formulation of the NRJNBR gum blend is given in Table 4.6.
5. Filled NRlNBR Blend with a Short Mixing Cycle for Single-Stage Mixing
The partially mixed filled NRJNBR blend was prepared with the single-stage blend
formulation in Table 4.2.
106

Compounding
Ingredient
NR
NBR (45% ACN)
ZnO
Stearic acid
Flectol H
TMTD
CBS
Sulphur
PVI
NRlNBRGum
Blend
40
60
5
0.5
2
2
1
1
2
Table 4.6 Compound formulation of the NRlNBR gum blend, phr
4.3 MIXING EOUIPMENT
4.3.1 FRANCIS SHAwKI INTERMIX
A Francis Shaw Kl Intermix with intermeshing rotors (see Fig. 2.9 (b) of Section
2.4.1) and a mixing action closer to that of the two-roll mill was used throughout this
work for mixing filled rubber compounds and the NRlNBR gum blend. The K 1
Intermix has a chamber volume of 5.5 litres and is fitted with a variable speed drive
and circulating water temperature control system. The main cycle and the feeding of
ingredients are computer controlled.
4.3.2 TWO-ROLL MILL
A laboratory two-roll mill (J.R.Dare Ltd.) with a friction ratio of 1.0: 1.1 and a
circulating water temperature of 50·C was used to sheet out each rubber mix
discharged from the Kl Intermix by a single pass, while hot.
107

4.4 TEST METHODS
4.4.1 DETERMINATION OF THE SOLUBILITY PARAMETERS OF NR AND NBR
Solubility parameter of a polymer can be calculated as proposed by Small( 12) according
to the following equation.
Ii = p L Fe M
where, p is the density of the polymer at any temperature
___________________ (i)
M is the molecular weight of the repeat group in the polymer and
L F; is the sum of all the molar attraction constants of the chemical groups in
the polymer repeat unit
The values of F; have been improved and updated by Hoy<I3) . These revised values are
given in Appendix (Table 2).
The above equation can be modified(l4) for a random copolymer as shown below, in
order to take into account the fraction of the two types of molecules (IP)·
Ii = p ( L F ~l + L F2ihJ ------------------ (ii)
( M11P1 + M21P2 )
Hence, the solubility parameters of NR (IiNR) and NBR (IiNBR) were calculated using
the above equation taking into account the following values and the molar attraction
constants of the respective chemical groups.
Molecular weight ofNR unit = 68. \3
Density ofNR = 0.934 Mgm-3
Molecular weight of ACN unit = 53
Molecular weight ofbutadiene unit = 54
Density ofNBR = 1.00 Mgm-3
!Os

4.4.2 RHEOMETRY
Since knowledge of the rheology of the component rubbers is useful for understanding
the factors controlling morphology, rheological characterisation of raw rubbers,
masterbatches and rubber compounds was carried out using the Negretti TMS
biconical rotor rheometer.
The Negretti TMS biconical rotor rheometer(lS) is an instrument designed to give
comprehensive information on the processing characteristics of raw elastomers,
unvulcanised rubber compounds and other polymers. The TMS can assess viscous flow
and viscoelastic characteristics of polymeric materials. In conjunction with excellent
temperature control, the conditions found in practical processes can be simulated and
evaluated. This instrument involves rotary shear deformation of a sample enclosed in a
heated cavity. The TMS has a biconical rotor with a cone angle of 6°, to give
approximately uniform shear throughout the test specimen. Fig. 4.2 shows a cross
section of the TMS rheometer.
•
8i<onical ro(or
Fig. 4.2 Cross-section showing the biconical rotor, the cavity and the dies of the
TMS rheometer
The cavity filling is either by injection or compression. In this study the cavity filling
was by compression. The biconical form enables a closed test cavity to be used, so that
the test specimen can be effectively pressurised to eliminate edge fracture. The rotor is
driven by a stepper motor giving programmable speed control. The variable rotor
speed enables data acquisition over a range of shear rates. Speed profiles are possible
and closed-loop control of rotor torque can be achieved.
109

The relationship between shear stress and shear rate under conditions of steady-state
viscous flow can be obtained between shear rates of 0.1 to 100 S·l at temperatures
between 50°C and 200°C. However the standard test temperature is 100·C. The
required number of shear rate steps is programmed into the instrument together with
the run time (or duration) at each step. The shear stress at each step is then recorded at
the specified programmable data acquisition (or sampling) rate.
The following are the test conditions set up for the evaluation.
Preheating time
Filling time
Sampling rate
No. of steps
200 seconds
10 seconds
10 readings / s
7
Table 4.7 shows the shear rates applied in the ascending order and the corresponding
step durations used, to achieve the steady state.
Step No. Step duration (s) Shear rate (S·l) Sampling mode
1 35 0.1 Continuous
2 10 0.4 Continuous
3 10 1 Continuous
4 10 4 Continuous
5 5 10 Continuous
6 5 40 Continuous
7 5 100 Continuous
Table 4.7 Testing sequence of shear rates and the corresponding step durations
The results are obtained in fundamental units and hence these can complement results
from other test methods.
Shear stress values obtained directly from the microprocessor were plotted against
time by the use of a spread sheet to ascertain the steady-state shear stress values
corresponding to the seven shear rates employed. The results are presented mainly in
the form of logarithmic plots of shear stress (t) against shear rate (y) and apparent
viscosity (1]. = t/y) against shear rate.
110

4.4.3 CURE TESTING
Determination of Cure Characteristics with a Wallace ShawburyPrecision Cure
Analyser
Cure analysis of all rubber compounds was carried out using the Wallace Shawbury
Precision Cure Analyser.
This Curemeter is a rotorless instrument which deforms the test sample by the
oscillatory motion of the lower half of the die cavity. The test sample required for this
is small and the upper and lower dies have high thermal mass, thus minimising the
effect of sample heating time on the results. As cure proceeds, the torque required to
shear the rubber increases and a curve of torque versus time (see Fig. 2.18 of Section
2.6.1) is generated.
Torque versus time plots together with the cure characteristics i.e. scorch time (time to
achieve 2% of the cross-link density, 90% cure time (time to optimum cure), Cure
Rate Index (CRI) [100/(90% cure time - scorch time)] or cross-link insertion rate and
(Max. -Min.) torque, which is an indication of cross-link density, are obtained from the
Analyser. The torque value is directly related to the shear modulus of the sample and
hence to crosslink density. Frequency and strain applied were 1.7 Hz and 0.25
respectively for all the mixes.
4.4.4 ANALYSIS OF MORPHOLOGY AND CARBON BLACK DISTRIBUTION USING
MICROSCOPY
(AJ Transmitted Light Microscopy
Phase morphology of the rubber blends was analysed using transmitted light
microscopy.
Thin sections (I micron thick) were prepared from tiny pellets of vulcanised material
using a sledge type microtome fitted with a carbon dioxide cooling stage. The pellets
were cooled to below the glass-transition temperature ofNR which is very much lower
than Tg of NBR, prior to sectioning using a glass knife mounted perpendicular to the
sledge at an angle 10 degrees to the horizontal. After each stroke the rolled up
sections were removed from the knife edge and stretched on glass slides using xylene.
Xylene swells both NR and NBR and makes it easy to unroll the sections. It is also
sufficiently volatile and dries out quickly from the section when it has been mounted.
Swelling also makes the sections more transparent. Sections were mounted in a
111

suitable fluid and covered with a cover slip to avoid appearance of holes due to
degradation of the rubbers. Glycerol with low volatility and having a refractive index of
1.46 which is close to the refractive index ofNR was used as the immersion oil to fill
any air space which might remain between the slide and the cover slip. This also
minimises the thickness variations and other artefacts.
Sections were then examined in a transmitted light phase contrast microscope using
phase contrast illumination. As the contrast between the phases was poorer with phase
contrast illumination when compared to bright field transmitted light illumination (zone
boundaries were more clear) sections were examined using the latter. A pIano type
objective lens with a magnification of 40X and a numerical aperture of 0.65 was used
for this examination. The pIano objective is outstanding in the visual surveying oflarge
areas of specimens. It improves the flatness of a field when compared to the
conventional objective. PIano objectives are also at their best for transmitted light
when used with rather thin specimens.
The phase structures of all the blends were photographed as video prints.
Identification of the NR and NBR phases was carried out using the Becke Line method
and Computer-aided Image Analysis technique as described herein.
Becke line method
The Becke line arises due to a phenomenon associated with a vertical contact of two
substances of different indices of refraction observed on the stage of a microscope. The
Becke line may not be seen when the microscope is exactly focused on a specimen.
When the tube of the microscope is slightly raised, a narrow line of light which is
referred to as the Becke line appears just inside or outside one of the phases of a
diblend. If the Becke line moves into say phase 1 when the microscope tube is raised
(or the stage is lowered), the refractive index of phase one is higher than that of phase
2 or vice versa. Lowering the tube (or raising the stage) reverses the effect. The
greater the difference in the refractive indices between the two phases, the greater is
the displacement of the Becke line as the microscope tube is raised or lowered(l6).
Cedar wood oil was added between the glass slide and the cover slip to eliminate
thickness effects during the microscopical analysis( 17) and get a clear picture of the
phase structures. A conventional objective lens with a magnification of 45X and a
numerical aperture of 0.65 was used for this identification.
112

Compl/ter-aided image analysis
A transmitted light microscope was used to identifY the NR and NBR phases by
measuring the area/frame % of the lighter phase in a selected field. The thin
microtomed sections (1 micron thick) used in this analysis were prepared as described
previously. The video camera was mounted on the microscope and focusing of the
specimen was done by viewing the specimen on a monitor. An objective lens with a
magnification of25 X was used. For each blend, area/frame % 's (lighter phase) off our
selected fields were determined. Data were coIlected using image analysis software
(VIDS V) and stored on the hard disc of the associated MS-DOS computer. FinaIly,
average values of the area/frame % 's (lighter phase) of the four selected fields were
calculated for each NRlNBR blend.
(B) Scanning Transmission Electron Microscopy
Carbon black distribution and transfer in the blends were analysed using scanning
transmission electron microscopy, since electron microscopy has played a major role in
analysing carbon black distribution and transfer in elastomer blends. The scanning
transmission electron microscope (STEM) combines features of the scanning electron
microscope (SEM) and the transmission electron microscope (TEM). It consists of a
series of lenses which focuses a probe onto the specimen which is then scanned in the
usual way. Unlike in the SEM modes of operation however, the specimen is made
sufficiently thin to aIlow the transmission of electrons. After transmission these are
detected and the signals amplified and displayed.
Differential swelling technique first utilised by CaIlan et al(18) was employed with the
idea of obtaining inter-phase contrast, which is the major problem in electron
microscopy. Thin sections were coIlected from xylene in a swoIlen condition.
Thereafter the sections were stretched on specimen support grids and observed, after
solvent evaporation in the stretched state using a TEM based JEOL JEM 100CX
scanning transmission electron microscope. Contrast is further increased by
degradation and removal of the highly sweIling phase by electron bombardment (at an
accelerating voltage of 100 kV). The phase that sweIls to a greater extent appears lighter and the domains are thinner(l8). Since the presence of carbon black restricts
swelling, this technique is not suitable for compounds containing a high carbon black loading(ll). It was assumed that the low level of carbon black (20 phr) present in the
blends wiIl not have a significant effect on the amount of swelling of any of the two
phases. Micrographs were obtained at different magnifications using bright field
illumination.
113

Also the thin sections were stained with osmium tetroxide (OS04P9.20) with the idea
of getting a better contrast between the two phases. Contrasting with OS04 is based
upon the capability of this material of reacting with the carbon-carbon double bonds of
the rubber. The selective reaction of the OS04 stains with the higher unsaturation
elastomer makes that phase darker in TEM due to greater opacity to electrons. Cudby
and Gilbey(21) have reported that NR is stained to a greater extent than NBR. Hence.
the NR phase would be expected to appear darker and the NBR phase lighter in OS04
stained thin sections of these blends.
The phase structures were photographed on a polaroid film. The phase structures
recorded on the polaroid film were developed and enlarged onto Kodak bromide
paper.
4.4.S PHYSICAL TESTING
Physical testing of all filled rubber compounds was carried out after preparation of the
relevant test pieces by moulding in an electrically heated platen press according to the
90% cure times. However. the compression set test pieces were prepared according to
the cure times stated below. Since longer curing times give better resistance to
compression set(22). the test pieces used for ageing were prepared by curing beyond
the 90% cure times.
Compression set at room
temperature
Compression set at 70°C
Compression set at 70°C
Cure Time Cure Temperature (0C)
90% cure time 140/1 SO
90% cure time + = S min. 140
90% cure time + = 2.S min. ISO
The time. additional to the 90% cure time at 1 SO°C was taken as half of that at 140°C
as it was experienced from the single-stage blends that the 90% cure time at 1 SO°C is
approximately half of that at 140°C.
(1) TENSILE PROPERTIES
The tensile properties of all the filled rubber compounds were determined at room
temperature in accordance with BS 903 : Part A2 (1971). using a "Hounsfield SOOL"
tensile testing machine with a laser extensometer. The rate of separation of the grips
114

was 500 mm/min. Modulus, tensile strength and % elongation at break values
calculated according to the equations given below were obtained directly from the
microprocessor. For each mix six dumb-bell shaped specimens were tested and the
average values of the results were calculated.
Tensile strength (TS) = Load at break
Original cross-sectional area
Modulus at 100% elongation = Load at 100% elongation
Modulus at 300% elongation =
Original cross-sectional area
Load at 300% elongation
Original cross-sectional area
% Elongation at break = (Distance between bench marks at the breaking
(2) TEAR STRENGTII
point - Original distance between bench marks) x 100
Original distance between bench marks
The tear strength of all the filled rubber compounds was determined in accordance
with Method B, Procedure (a), BS 903 : Part A3 (1982), using a "Hounsfield 500L"
tensile testing machine. Angle test pieces were cut from vulcanised sheets and 1 0 test
pieces were tested for each compound. This test is a combination of tear initiation and
propagation. The stress is built up at the base of the angle until it is sufficient to initiate
a tear and then further stresses propagate this tear. This method enables only to
measure the overall force required to rupture the test piece. A cross-head speed of 500
mmlmin. was used as given in the standard for angle test pieces.
The tear strength which is generally calculated according to the following equation was
directly obtained from the microprocessor in N/mm which is equivalent to kN/m (or
kJ/m2).
Tear strength
(3) HARDNESS
= Maximum force (N)
Thickness (mm)
Hardness is defined as the resistance to indentation under conditions that do not
puncture a rubber. It is also a measurement of the elastic modulus of a rubber by
determining its resistance to a rigid indentor to which is applied a force. The
115

indentation is usually measured with a dial gauge with its scale calibrated in Shore A or
in International Rubber Hardness Degrees (IRHD).
Hardness determination of all the filled rubber compounds was carried out using a
Shore A Micro Hardness Tester (Durometer type). The Shore A scale corresponds
approximately to the IRHD scale.
(4) COMPRESSION SET
Compression set is the unrecovered amount of deformation after removal of an applied
stress or strain in compression. It does give some relative indication of the success
achieved in producing an elastic material. Elastic properties are important in seal
applications. Hence, compression set is a more important parameter when jUdging
sealing efficiency than creep or stress relaxation. The distorted rubber exerts a pressure
on' the contacting surface to maintain the seal. The results of compression set
measurements are sensitive to the state of cure. Therefore, it may serve as an indication
of state of vulcanisation. Longer curing times give better resistance to compression set
as stated earlier.
Compression set measurements of all the filled rubber compounds were conducted in
accordance with Method A ofBS 903 : Part A6 (1969) at room temperature (20°C)
and at elevated temperature (70°C).
The compression set at constant strain (25%) was calculated according to the
following equation.
Compression set = J,,-~ x 100
to - t.
where, to = original thickness of test piece
t, = thickness of test piece after recovery
t. = thickness of the spacer (4.73 ± 0.01 mm)
Three sets of test pieces (three for each set) were tested for each compound and the
results were averaged.
(5) ABRASION RESISTANCE
Abrasion is of major importance when considering elastomeric components for
dynamic applications. Dynamic seals for example can undergo abrasion when sliding
over a dry surface where friction is correspondingly high.
116

Initially the Akron abrader was used to measure the abrasion mass loss of the filled
blends according to BS 903 : Part A9 (1988) (Method B). The test piece is a moulded
wheel driven by an electric motor at a constant speed and held against the abrasive
wheel by a constant force of 45 N. The planes of the test piece and the abrasive wheel
are inclined at an angle (called slip angle) to each other. Akron abrader is distinctive
for its ability to vary slip angle in a simple manner (150 is the standard for all rubbers
except those whose abrasion resistance is large). Density of the blends were
determined in accordance with BS 903 : Part Al (1980) (Method B) and the abrasion
volume loss per 1000 revolutions was calculated accordingly.
Subsequently, the abrasion resistance of all the filled rubber compounds was
determined using the DIN abrader, since this method is very convenient, rapid and well
suited to quality control. A disc test piece in a holder is traversed across a rotating
drum covered with a sheet of the abradant. The degree of slip (the ratio of rate of
slipping of the test piece to rate of movement of the test piece (or abradant) expressed
as a percentage) is 100%. The test was conducted according to BS 903 : Part A9
(1988) - Method A and the abrasion resistance index (ARl) was calculated using the
equation
ARl = ~ x 100
V,
where V,is the volume loss of the test rubber (mm3)
V, is the volume loss of the standard rubber (mm3)
These volume losses were calculated from the respective mass losses and densities.
Densities were determined according to BS 903 : Part Al (1980) - Method A.
Abrasion resistance is the reciprocal of volume loss.
Analysis of the abraded surface of blends for the specific abrasion pattern or more
commonly the Schal1amach abrasion pattern was conducted using a Cambridge
Instruments Stereo Scan 360, Scanning Electron Microscope (SEM) (at an
accelerating voltage of 10 kV) at 10 and 18.5 times magnifications in order to interpret
the results of abrasion resistance. The use of SEM general1y involves much simpler
specimen preparations than TEM. The abraded surfaces were examined, after coating
with a thin layer of gold to avoid electrostatic charging and poor image resolution.
4.4.6 SWELLING MEASUREMENTS
Swelling measurements of all the filled rubber compounds were conducted at room
temperature using toluene and ASTM oil No.2. Cured test pieces of dimensions
117

30 x 5 x 2 mm (length x width x thickness) were weighed to the nearest 1 mg (using an
analytical balance) and each test piece was immersed in a stoppered glass vessel
containing the oiVfuel for a period of 72 hours. The vessels were kept in the dark to
prevent oxidation. The samples were then removed from the glass vessels and excess
oiVfuel removed by lens blotting paper. Subsequently the samples were placed in
closed vessels, to prevent evaporation and the masses of the swollen samples were
determined. Three specimens were tested for each compound and the results were
averaged. % increase in mass was calculated according to the following equation as
given in ASTM: D 471-479.
Increase in mass, % = (M1 - M0 x 100
Ml
where Ml is the initial mass of specimen (g) and
M2 is the mass of specimen (g) after immersion
4.5 SINGLE-STAGE MIXING OF FILLED NRlNBR BLENDS
4.5.1 EXPERIMENTAL DESIGN
Mixing was carried out according to a two-level two-variable factorial Illixmg
experiment (Table 4.8). Mixer rotor speed and initial NBR temperature were taken as
the two variables because the rheological measurements showed that the apparent
viscosity of NR and NBR changes significantly with shear rate and temperature
respectively, and could be expected to influence the mixing behaviour.
---Comp~:nd No. T Rotor speed Initial NBR temperature J : (rpm) ("C)
· .. ·i·~"j~~~j"·······ij····S20T20······· .. ··········· ·········i"6····························~~~~·t~;;;p~~;t~·~~···"(~··2·0·)···
factorial 2) S20T85 i 20 85
points 3) S60T20
4) S60T85
60
60
room temperature (;: 20 )
85
Table 4.8 Combinations of rotor speed and initial NBR temperature used for the
single-stage blend formulation
S - Mixer rotor speed, T - Initial temperature ofNBR
118
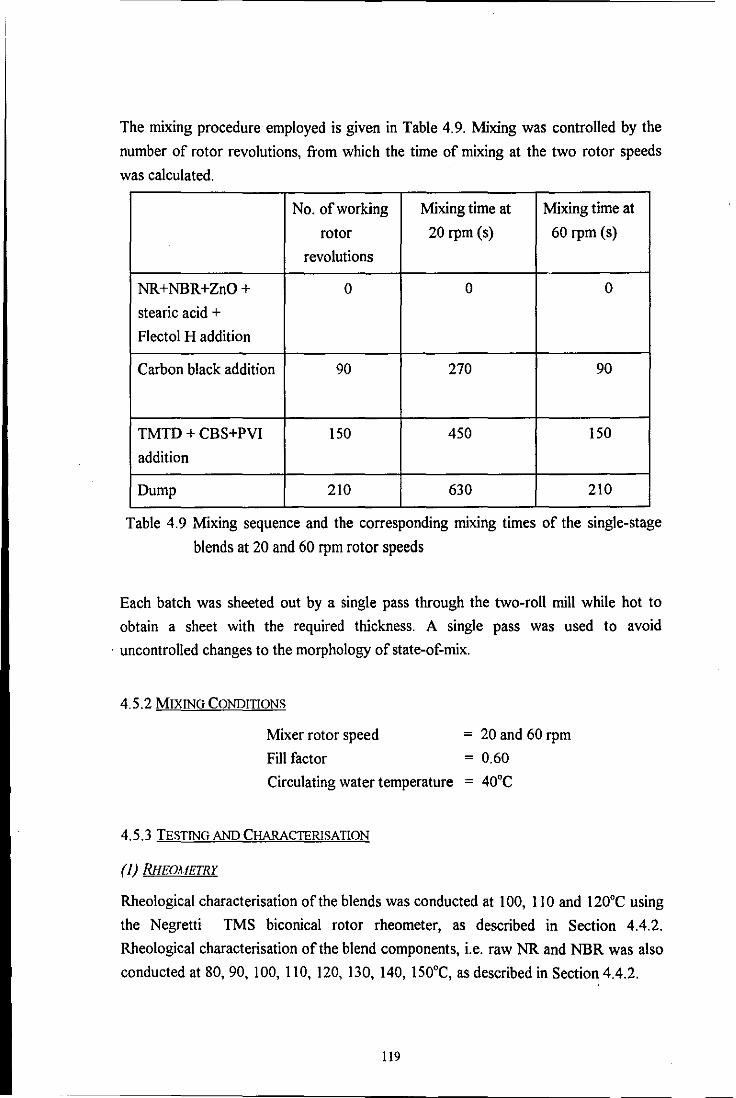
The mixing procedure employed is given in Table 4.9. Mixing was controlled by the
number of rotor revolutions, from which the time of mixing at the two rotor speeds
was calculated.
No. of working Mixing time at Mixing time at
rotor 20 rpm (s) 60 rpm (s)
revolutions
NR+NBR+ZnO + ° ° 0
stearic acid +
Flectol H addition
Carbon black addition 90 270 90
TMTD + CBS+PVI 150 450 150
addition
Dump 210 630 210
Table 4.9 Mixing sequence and the corresponding mixing times of the single-stage
blends at 20 and 60 rpm rotor speeds
Each batch was sheeted out by a single pass through the two-roll mill while hot to
obtain a sheet with the required thickness. A single pass was used to avoid
. uncontrolled changes to the morphology of state-of-mix.
4.5.2 MIXING CONDITIONS
Mixer rotor speed
Fill factor
= 20 and 60 rpm
= 0.60
Circulating water temperature = 40·C
4.5.3 TESTING AND CHARACTERISATION
(l) RHEOMETRY
Rheological characterisation of the blends was conducted at 100, 110 and 120·C using
the Negretti TMS biconical rotor rheometer, as described in Section 4.4.2.
Rheological characterisation of the blend components, i.e. raw NR and NBR was also
conducted at 80, 90, 100, 110, 120, 130, 140, 150·C, as described in Section 4.4.2.
119
(2) CURE TESTING
Cure characteristics of the blends were determined at 140 and 150·C using the Wallace
Shawbury Precision Cure Analyser, as described in Section 4.4.3.
(3) MICROSCOPf
Phase morphology of the blends was analysed using the transmitted light phase
contrast microscope, as described in Section 4.4.4 (A). Carbon black distribution
between the phases was investigated using the scanning transmission electron
microscope, as described in Section 4.4.4 (8). The electron micrographs of the 1
micron thin sections were obtained at magnifications 4,000 and 10,000. Since most of
the 1 micron thin sections consisted of holes, 2 micron thin sections were prepared out
of the S60T20 blend and micrographs were obtained at different magnifications
including 20,000 and 50,000. Staining with OS04 was carried out on the 2 micron thin
sections of S20T20 and S60T20 blends and the micrographs were obtained at 20,000
magnification. However application of this staining technique to S20T20 and S60T20
blends was unsuccessful as it was difficult to identifY carbon black as well as the two
phases from the respective electron micrographs.
(4) PHYSICAL TESTING
Physical properties; tensile, tear, hardness, compression set and abrasion of the blends
were determined under standard conditions as described in Section 4.4.6.
Also the abraded surface of S20T20 and S60T20 blend test pieces was analysed for the
Schallamach abrasion pattern using the scanning electron microscope, in order to
interpret the results of abrasion resistance.
(5) SWELliNG MEASUREMENTS
Swelling measurements of the blends were conducted in ASTM oil No.2 and toluene
as described in Section 4.4.7.
4.6 MASTERBATCH MIXING OF FILLED NRlNBR BLENDS
4.6.1 EXPERIMENTAL DESIGN
Mixing was conducted in two stages. The initial location and proportion of the carbon
black in each elastomer phase of the diblend was varied by making individual
120

elastomer/carbon black masterbatches in the first stage of the mixing cycle. In the
second stage, blending of the masterbatches followed by the addition of other
compounding ingredients was carried out to produce 40/60 NRlNBR blends with
either 10, 50, 90% of the carbon black located initially in each elastomer (Table 4.4).
Mixing cycle used in the preparation of masterbatches (stage I) and masterbatch blends
(stage II) is given in Tables 4.10 and 4.11 respectively.
No. of working rotor Mixing time at 60 rpm (s)
revolutions
NR or NBR addition 0 0
Carbon black addition 90 90
Dump 210 210
Table 4.10 Stage I: Mixing sequence and the corresponding mixing times of the
masterbatches at 60 rpm rotor speed
No. of working Mixing time at
rotor revolutions 60 rpm (s)
NRMB+NBRMB + ZnO + 0 0
stearic acid + F1ectol H
addition
TMTD+CBS+sulphur+PVI 60 60
addition
Dump 120 120
Table 4.11 Stage II : Mixing sequence and the corresponding mixing times of the
masterbatch blends at 60 rpm rotor speed
4.6.2 MIXING CONDITIONS
Mixer rotor speed
Fill factor
Circulating water temperature
121
= 60 rpm
= 0.60 = 40·C

4.6.3 TESTING AND CHARACTERISATION
(l) RHEOMETRY
Rheological analysis of the NR and NBR masterbatches containing 5, 25, 45 and 3.33,
16.7, 30 phr of carbon black respectively, as well as that of the three masterbatch
blends, was carried out at the standard test temperature. i.e. 100·C, as described in
Section 4.4.2.
(2) CURE TESTING
Cure characteristics of the blends were determined at 150·C, as described in Section
4.4.3.
(3) MICROSCOPY
Phase morphology of the blends was analysed, as described in Section 4.4.4 (A).
Carbon black transfer between the phases was investigated, as described in Section
4.4.4 (B). The electron micrographs of the 2 micron thin sections were obtained at
magnifications 5,000, 10,000 and 20,000. Staining with OS04 was also carried out and
the micrographs were obtained at 20,000 magnification. This was unsuccessful as in
the case of single-stage blends.
(4) PHYSICAL TESTING
Physical properties; tensile, tear, hardness, compression set and abrasion of the blends
were determined under standard conditions as described in Section 4.4.6.
(5) SWELLING MEASUREMENTS
Swelling measurements of the blends were conducted in ASTM oil No.2 and toluene
as described in Section 4.4.7.
4.7 MIXING OF FILLED NR AND NBR COMPOUNDS
4.7.1 MIXING PROCEDURE
A 20 phr carbon black filled NR compound, NBR compound and a control NBR
compound were prepared with the mixing cycle in Table 4.12. The number of working
rotor revolutions employed in each step was similar to that of the single-stage blends.
122

The filled NR compound was prepared at 60 rpm rotor speed, whereas both the filled
NBR compounds were prepared at 40 rpm, since the filled NBR (45% ACN)
compound prepared at 60 rpm rotor speed scorched (partially crosslinked), probably
due to the high heat build-up in the compound at high rotor speeds. However, the
number of working rotor revolutions employed was similar in each case.
No. of working Mixing time Mixing time
rotor at at
revolutions 40 rpm (s) 60 rpm (s)
NR or NBR (45% ACN) or NBR 0 0 0
(26.6% ACN) +ZnO + Stearic
acid +Flectol H addition
Carbon black addition 90 135 90
TMTD+CBS+Sulphur+PVI 150 225 150
addition
Dump 210 315 210
Table 4.12 Mixing sequence and the corresponding mixing times of filled NR and
NBR compounds at 40 and 60 rpm rotor speeds
4.7.2 MIxINGCONDlTIONS
Mixer rotor speed
Fill factor
= 40 or 60 rpm
= 0.60
Circulating water temperature = 40°C
4.7.3 TESTING AND CHARACTERISATION
(1) CURE TESTING
Cure characteristics of the filled NR compound, NBR (45% ACN) compound and the
control NBR compound were determined at 150, 150 and 140°C respectively as
described in Section 4.4.3.
(2) PHYSICAL TESTING
Physical properties; tensile, tear, hardness, compression set and abrasion of the three
filled rubber compounds were determined under standard conditions as described in
Section 4.4.6.
123

(3) SWELLING MEASUREMENTS
Swelling measurements of the three filled rubber compounds were conducted in ASTM
oil No.2 and toluene as described in Section 4.4.7.
4.8 MIXING OF THE NRlNBR SINGLE-STAGE GUM BLEND
4.8.1 MIxING PROCEDURE
The mixing cycle employed in the preparation of the NRlNBR single-stage gum blend
is given in Tables 4.13. It is to be noted that the mixing cycle of single-stage gum blend
is similar to that of the filled NRlNBR single-stage blends, with the exception of the
carbon black addition step.
No. of working Mixing time at
rotor revolutions 60 rpm (s)
NR+NBR+ZnO+Stearic acid+ 0 0
Flectol H addition
TMTD+CBS+Sulphur+PVI 150 150
addition
Dump 210 210
Table 4.13 Mixing sequence and the corresponding mixing times of the NRlNBR gum
blend at 60 rpm rotor speed
4.8.2 MIXING CONDITIONS
NR/NBR single-stage gum blend:
Mixer rotor speed
Fill factor
Circulating water temperature
124
=60 rpm
=0.60 =40·C

4.8.3 TESTING AND CHARACTERISATION
(1) CURE TESTING
Cure characteristics of the NR/NBR single-stage gum blend were determined at 150·C
as described in Section 4.4.3.
(2) MICROSCOPY
Phase morphology of the NR/NBR single-stage gum blend was analysed as described
in Section 4.4.4 (A). The thickness of the sections had to be increased to 5 microns as
the I micron thin sections prepared initially, were difficult to stretch on glass slides
without the formation of holes.
4.9 MIXING OF THE FILLED NRlNBR SINGLE-STAGE BLEND WITH A
SHORT MIXING CYCLE
4.9.1 MIXING PROCEDURE
The mixing cycle employed in the preparation of this filled NR/NBR single-stage blend
is given in Table 4.14.
No. of working Mixing time at
rotor revolutions 20 rpm (s)
NR+NBR (45% ACN)+ZnO+ 0 0
stearic acid+Flectol H addition
Carbon black addition IS 45
TMTD+CBS+Sulphur+PVI 50 150
addition
Dump 90 270
Table 4.14 Mixing sequence and the corresponding mixing times of the filled single
stage blend with a short mixing cycle, at 20 rpm rotor speed
125

4.9.2 MIXING CONDITIONS
Mixer rotor speed
Fill factor
= 20 rpm
=0.60
Circulating water temperature = 40°C
4.9.3 TESTING AND CHARACTERISATION
(1) CURE TESTING
Cure characteristics of this filled NRlNBR single-stage blend were determined at
150°C as described in Section 4.4.3.
(2) MICROSCOPY
Phase morphology of this filled NRlNBR single-stage blend was analysed as described
in Section 4.4.4 (A), in order to ascertain the location of carbon black in filled
NRlNBR single-stage blends.
126

REFERENCES
I. Waiters, M.H. and Keyte, D.N., Rubber Chem. Technol., 38 (1965) 62
2. Avgeropoulos, N., Weissert, F.C., Biddison, P.H. and Bohm, G.G.A., Rubber
Chem. Technol., 49 (1976) 93
3. Tokita, N., Rubber Chem. Technol., 50 (1977) 292
4. Hess, W.M., Scot!, C.E. and Callan, J.E., Rubber Chem. Technol., 40 (1967)
371
5. Sircar, A.K., Lamond, T.G. and Pinter, P.E., Rubber Chem. Technol., 47
(1974) 48
6. Krakowski, FJ. and Tinker, AJ., Elastomerics, 122(6), 34; 122(7), 24 (1990)
7. Hess, w.M. and Chirico, V.E., Rubber Chem. Technol., 50 (1977) 301
8. Hess, W.M., Vegvari, P.e. and Swor, R.A., Rubber Chem. Technol., 58
(1985) 350
9. Bhowmick, T.K., De, P.P., Bhowmick, A.K. and Gupta, B.R., Kautsch.
Gummi. Kunstst., 42 (1989) 115
10. 1992 Annual Book of ASTM Standards-Rubber Products, Industrial
Specifications and Related Test Methods, Vol. 09.02, Designation D 2934-
89, p.264
I!. Marsh, P.A., Voet, A. and Price, L.D., Rubber Chem. Technol., 40 (1967)
359
12. Small, PA, J. Appl. Chem., 3 (1953) 71
13. Hoy, K. L., 1. Paint Technol., 42 (1970) 76
14. Abdul Rahman, H., M.Phil. Thesis, Loughborough Univ. of Tech. (1990)
15. Trim, R.S., Rubber World, November (1989) p.31
16. Wahlstrom, E.E., "Optical Crystallography" 3rd Edition, John Wiley & Sons,
Inc. New York (1960) Chap.5
17. Call an, I.E., Hess, W.M. and Scot!, C.E., Rubber Chem. Technol., 44 (1971)
814
18. Callan, I.E., Topcik, B. and Ford, F.P., Rubber World, 151(6) (1965) 60
19. Kruse, I.E., Rubber Chem. Technol., 46 (1973) 653
127

20. Hess, W.M., Rubber Chem. Technol., 64 (1991) 386
21. Cudby Paul E.F. and Gilbey Barry A., Rubber Chem. Technol., 68 (1995) 342
22. Dunn, J.R., Rubber World, June (1984) p.17
128

CHAPTER FIVE
RESULTS AND DISCUSSION
5.1 CHEMICAL /MOLECULAR COMPATIBILITY OF NR AND NBR
It has been found(lj that the miscibility of a blend can affect physical properties. Thus,
it is necessary to determine whether blends of NR and high nitrile (45% ACN) NBR
are miscible at molecular level.
The methods generally employed to characterise the miscibility of a diblend have been
reviewed in Chapter 3. The most common method is to determine the difference
between the solubility parameters of the two rubbers. Group Contribution by Small's
Method (utilising the molar attraction constants of the chemical groups) is a simple
way of obtaining the solubility parameters of the rubbers. The solubility parameters of
NR (ONR) and NBR (ONBR) were calculated using the equations given in Chapter 4,
Section 4.4.1, as shown below. Since NBR is a random copolymer, equation (ii) which
takes into account the fraction of the acrylonitrile and butadiene units was used in the
calculation ofits solubility parameter.
(i) Total molar attraction constants for NR unit:
No.ofGroups
1
2
1
1
Usingtheequation,o=pLF;/M,
Type of Group
-CH3
- CH2 -
-CH=
:.c=
Molar Attraction Constant
147.3
2x131.5
121.53
84.51
ONR = (0.934 x 616.34) /68.13 = 8.4 (cal.cm-3)112
I.e. ONR = 17.19 x 10³ (Jm-3)112
Note: the conversion factor to SI is, 1 (cal.cm-3)112 = 2.046 x 10³ (Jm-3
)1/2
129

(ii) Total molar attraction constants for acrylonitrile (45%) unit:
No.ofGroups Type of Group Molar Attraction Constant
1 - CH2 - 131.5
1 -C",N 354.56
1 ::CH- 85.99
Total molar attraction constants for butadiene (55%) unit:
No.ofGroups Type of Group
2 - CH2 -
2 - CH=
Using the equation, cS = P ( h F JilIlI + h F2; lQz..)
(Ml <jll + M2<jl2)
Molar Attraction Constant
2x131.5
2 x 121.53
cSNBR = 1.00 ( 572.05 x 0.45 + 506.06 x 0.55) = 10 (cal.cmo1
)112
( 53 x 0.45 + 54 x 0.55 )
i.e. cSNBR = 20.46 X 101 (Jmo1)112
The calculated cSNR and cSNBR indicate that blends of NR and NBR (45% ACN) are
highly immiscible at molecular level as there is a marked difference [3.27 x 101
(Jmo')1I2] between the two values which is greater than 101 (Jmo
3)1/2, the normal limit of
miscibility(2). However, rheological matching between the blend components would be
expected to produce a blend with a very fine textured morphology.
130

5.2 RHEOLOGY OF BLEND COMPONENTS
5.2.1 RHEOLOGYOFRAwNRANDNBR
Many researchers(3,4,5) have found that viscosity of the two components in a blend can
be an important factor in determining the morphology. The smallest domains have been
obtained when the mixing viscosities of the components are equal. Hence, this
rheological study was carried out to find the conditions of shear rate and temperature,
which give rise to similar viscosities for the two components, NR and NBR.
Fig.S.1 shows the log r -Iogy plots of raw NR (SMR 10CV) and NBR (45% ACN)
at temperatures 80, 120, and lS0·C measured in the Negretti TMS rheometer as
described in Section 4.4.2. Although testing was conducted at eight temperatures, in
the temperature range 80-150·C, only three temperatures which represent the range
are shown here, in order to get a clear picture of the variation of shear stress with
shear rate of the two elastomers at different temperatures. It was not possible to obtain
accurate shear stress values for both the rubbers at 80·C when the applied shear rate
was 100 S-I. This may be due to improper flow of the rubbers at low temperatures.
3,------------------------,
1 A
.0'" o·
~ 0.5
O+----+----~--~--~----+---~
-1 -0.5 o 0.5 1 1.5 2
log (Shear rate) (s")
--+--NR-80·C
... <> .. NBR-80·C
--.--NR.120·C
.. A· .... NBR-I20·C
--+--NR-I50·C
··0 .. NBR-150·C
Fig. 5.1 Shear stress against shear rate plots of NR and NBR at different temperatures
It is apparent from this figure that at temperatures 80· and 120·C, the plots of
log r - log f for NR and NBR, at the same temperature, cross-over at shear rates
between 4-100 S-I. At these shear rates the viscosities of the two rubbers become
equal. The shear rate and the corresponding shear stress at which the viscosities of the
two rubbers become equal is denoted as cross-over shear rate and cross-over shear
stress respectively. At lS0·C, the shear rate at which the viscosities of NR and NBR
I3I

become equal, exceeds 100 S·l and hence the cross-over point cannot be determined
using this equipment.
Fig.S.2 shows the variation of cross-over shear rate of raw NR and NBR with
temperature. There is a marked increase in the cross-over shear rate as the temperature
is increased from 80 -120°C.
90
.Sl 80
/ ca 70 ~
~
60 ca Cl)
.<:~ If) ~ 50 Q; en 40 > ~
30 0
~ 0 ~
0
20 10 ..------0
80 90 100 110 120 Temperature ("C)
Fig. 5.2 Temperature-cross-{)wr shear rate plot of raw NR and NBR
Fig.S.2 indicates that a low temperature and a low shear rate or a high temperature and
a high shear rate give similar viscosities and thus might be expected to result in good
blending for the NR and NBR used in this study(3,4) The increase in the cross-over
shear stress with temperature is less significant in comparison to that of shear rate
(Fig.5.3), owing to the pseudoplastic behaviour of the two eiastomers.
~ ca a. ..>< ~
ill Cl) ~
1i) ~
ca Cl)
.<: If) ~
Cl)
> 0
~ 0 ~
0
240 230 220 210 200 190 180 170 160 150
80 90 100 110 120
Temperature ( "C )
Fig.5.3 Temperature - cross-{)wr shear stress plot of raw NRand NBR
132

If cross-over conditions can be achieved in the mixer, it should be possible to produce
a good blend ofNR and NBR.
According to Fig.5.2, the apparent viscosities of NR and NBR cross-over at a low
shear rate when the temperature is low and at a high shear rate when the temperature is
high. Hence, a low shear rate / low temperature combination or high shear rate / high
temperature combination would be expected to favour the production of a single-stage
blend ofNR and NBR with a fine textured morphology. However, at low shear rates,
the stresses which result from the imposed shear field as well as from elongational
deformations are small and may not be high enough to greatly reduce the size of the
domains(5) in order to produce a good blend. Thus, it may be necessary to aim for a
high shear rate / high temperature combination. In practice, a high shear rate achieved
by using a high mixer rotor speed imparts considerable mechanical energy to the batch,
which is converted to heat due to friction between molecules, causing a rapid rise in
batch temperature. This phenomenon is commonly known as shear heating. Hence, at
high rotor speeds, the high shear rate / high temperature combination is automatically
satisfied in the mixer.
Early in the mixing operation (before a high temperature has been reached), an
alternative way of achieving similar viscosities is to add rubber at different
temperatures. At a low temperature, the cross-over point is situated towards lower
shear rate in comparison to that at high temperature (Figure 5.2). Hence, at low
temperature the apparent viscosity of NBR is higher than that of NR at most shear
rates. It was reported earlier that the apparent viscosity of NBR is more sensitive to
temperature than NR even at high shear rates. Thus, the cross-over point could be
achieved by adding NR together with heated NBR at the commencement of mixing.
Thus, the reason for selecting mixer rotor speed (20 and 60 rpm) and initial NBR
temperature (20° and 85°C) as the two variables, was to bring about the above
mentioned changes in viscosity, which was expected to affect the physical properties of
the blends via changes in morphology.
5.2.2 RHEOLOGY OF NR AND NBR MASTERBATCHES
This rheological study of the masterbatches (Sections 4.2.2-2, 4.6.1 and 4.6.2) was
conducted in the shear rate range 0.1-100 S·l at loooe using the Negretti TMS
rheometer (Section 4.4.2). Variation of apparent viscosity of the three NR
masterbatches containing 5, 25 and 45 phr of carbon black, with shear rate is shown in
Fig. 5.4.
133

7
6.5 6
U! 5.5 '" a.. 5 ~
r=- 4.5 C> 4 .2
3.5 3
-1 -0.5 o 0.5 1 1.5 2
log (shear rate) (s" )
__ NRf.'B (5 ph, C.B.) -0- NRMB (25 ph' C.B.) ~ NRf.'B (45 ph' C.B.)
Fig. 5.4 Apparent viscosity against shear rate plots of NR masterbatches
It can be seen from these plots that apparent viscosity of the masterbatches decreases
in the order ofNRMB (45 phr C.B.), NRMB (25 phr C.B.), NRMB (5 phr C.B.) and
this order is maintained throughout the shear rate range studied. Thus the data reflect a
rise in the viscosity with increasing the proportion of carbon black. This is in accord
with the original Einstein equation as well as with the expanded version of the Einstein
equation proposed by Guth and Gold, which applies to suspensions of non-attracting
spherical particles(6) .
As expected, the difference in apparent viscosity between the three masterbatches is
somewhat greater at lower shear rates and becomes smaller as the shear rate is
increased. This implies that the influence of the proportion of carbon black on the
viscosity diminishes at high shear rates. KrauP), attributed this phenomenon to
secondary aggregation effects which become smaller at high shear rates. However, he
reported that the additional shear stress or rate dependence of viscosity due to added
carbon becomes small when the unfilled polymer is strongly non-Newtonian.
The apparent viscosity of the three NBR masterbatches containing 3.33, 16.7 and 30
phr of carbon black (Sections 4.2.2-2, 4.6.1 and 4.6.2) plotted against shear rate,
obtained using the Negretti TMS rheometer (Section 4.4.2) is shown in Fig. 5.15.
134
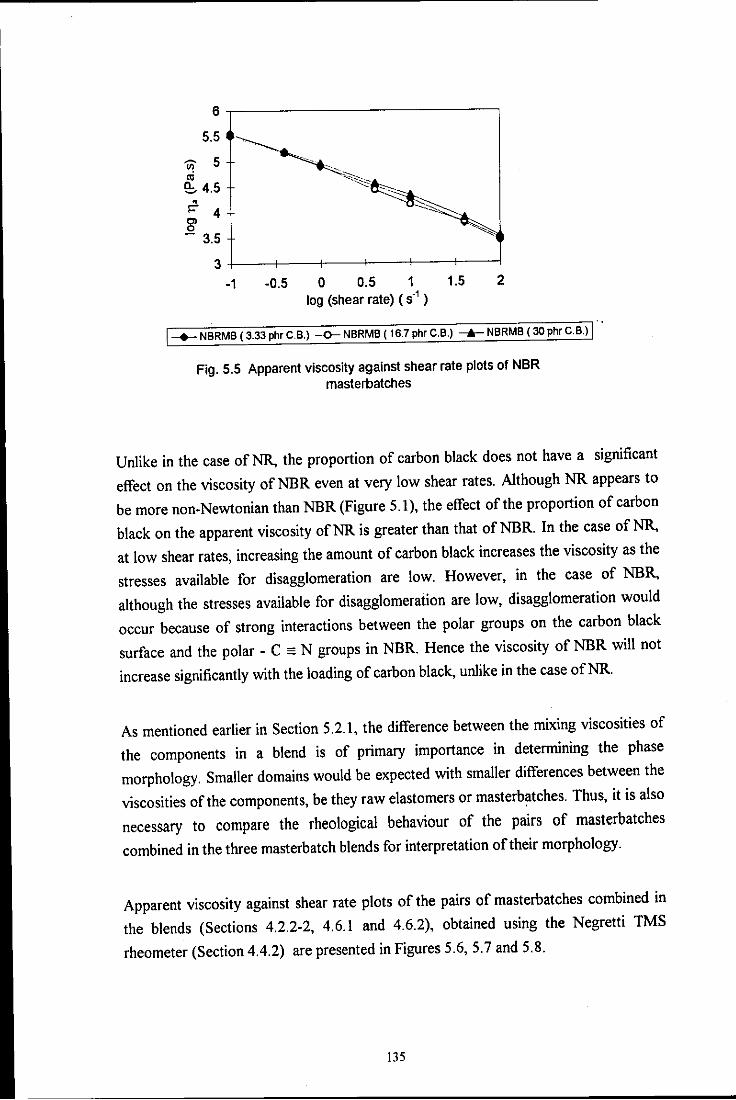
6,------------------------.
-1 -0.5 0 0.5 1 1.5 2 log (shear rate) (5.' )
--+-- NBRMB (3.33 phrC.B.) -0- NBRMB (16.7 phr C.B.) ...... NBRMB (30phrC.B.)
Fig. 5.5 Apparent viscosity against shear rate plots of NBR masterbatches
Unlike in the case ofNR, the proportion of carbon black does not have a significant
effect on the viscosity of NBR even at very low shear rates. Although NR appears to
be more non-Newtonian than NBR (Figure 5.1), the effect of the proportion of carbon
black on the apparent viscosity of NR is greater than that of NBR. In the case of NR,
at low shear rates, increasing the amount of carbon black increases the viscosity as the
stresses available for disagglomeration are low. However, in the case of NBR,
although the stresses available for disagglomeration are low, disagglomeration would
occur because of strong interactions between the polar groups on the carbon black
surface and the polar - C ~ N groups in NBR. Hence the viscosity of NBR will not
increase significantly with the loading of carbon black, unlike in the case ofNR.
As mentioned earlier in Section 5.2.1, the difference between the mixing viscosities of
the components in a blend is of primary importance in determining the phase
morphology. Smaller domains would be expected with smaller differences between the
viscosities of the components, be they raw elastomers or masterbatches. Thus, it is also
necessary to compare the rheologieal behaviour of the pairs of masterbatches
combined in the three masterbatch blends for interpretation of their morphology.
Apparent viscosity against shear rate plots of the pairs of masterbatches combined in
the blends (Sections 4.2.2-2, 4.6.1 and 4.6.2), obtained using the Negretti TMS
rheometer (Section 4.4.2) are presented in Figures 5.6,5.7 and 5.8.
135
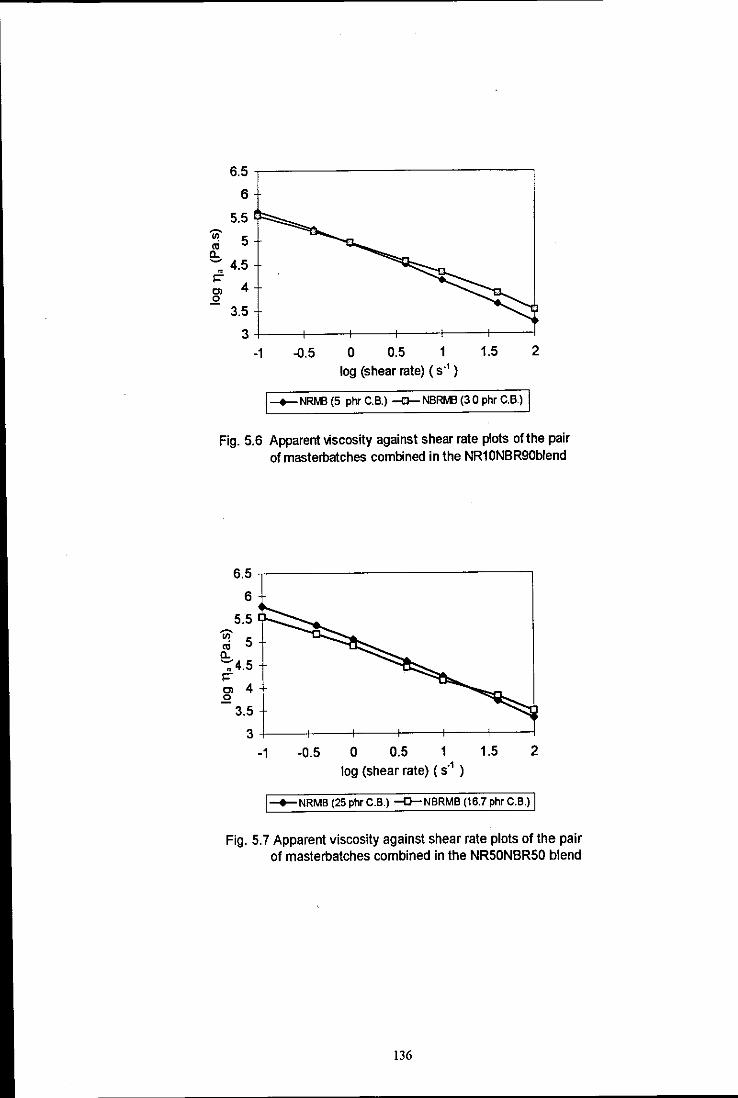
6.5
6
5.5 'Uf 5 to 0.. -: 4.5 1= Cl 4 .2
3.5
3 -1 .{).5 0 0.5 1 1.5 2
log (shear rate) (s" )
1 __ NRMl (5 phr C.B.) -0- NBRMl (3 0 ph' C.B.) 1
Fig. 5.6 Apparent ,,;scosity against shear rate plots ofthe pair of masterbatches combined in the NR10NBR90blend
6.5.,--------------,
6
5.5
~ 5 0.. --:: 4.5 1= Cl 4 .2
3.5 3+--+--~-_r-_+-~-~
-1 -0.5 0 0.5 1 1.5 2 log (shear rate) (S" )
I __ NRMB (25 ph,C.B.) -o-NBRMB (16.7 ph'C.B.) I
Fig. 5.7 Apparent viscosity against shear rate plots of the pair of masterbatches combined in the NR50NBR50 blend
136

6.5
6
5.5
'Cii' 5 01 a.
--:: 4.5 f=" ~ 4
3.5
3+---~---r---+----~--+---~
-1 -0.5 o 0.5 1 1.5 2
log (shear rate) (s" )
I-.-NRM3 (45 phr C.B.) -O--N8RM3(3.33 phr C.B.) I
Fig. 5.8 Apparent Ioiscosity against shear rate plots ofthe pair of masterbatches combined in the NR90NBR10 blend
It is apparent from all the three figures that the drop in apparent viscosity of the NR
masterbatch as the shear rate is increased is greater than that of the respective NBR
masterbatch. Hence, the effect of shear rate on the viscosity of filled NR in relation to
NBR is very much similar to that of the raw or unfilled elastomers.
It is also observed from the three figures that at high shear rates (> 40 S·I),
corresponding to high rotor speeds in the mixer, the difference in viscosity between the
pairs of master batches decreases in the order Fig.5.6, Fig.5.7, Fig.5.S. Thus the domain
size of the blends would be expected to decrease in the order NRIONBR90,
NR50NBRSO, NR90NBRIO. In other words the finest morphology would be expected
from the NR90NBRIO blend.
137

5.3 PHASE MORPHOLOGY OF NR AND NBR BLENDS
The ultimate physical properties of a rubber blend compound are great ly influenced by
the morphology of the blend. It was reported earlier in Section 5.1 that blends of NR
and high ni trile (45% ACN) NBR are highly immiscible and thus a heterogeneous
morphology is to be expected from these blends. Roland(8) reported that
heterogeneous polymer blends have advantages because of the abi lity to alter the
morphology for specific end uses. As evident from the work of several
researchers(J,4,5), morphology of an incompatible blend is primarily contro lled by the
relative viscosities of the blend components. However, factors such as mixi ng
conditions and mixing technique employed to produce blends may also have an
influence on morphology. Hence, the aim of this study, conducted using transmitted
light microscopy, is to relate blend morphology to the relative mixing viscosities of the
components and mixing conditions.
5.3 .1 MORPHOLOG Y OF SINGLE-STAGE B LENDS
(A) MORPHOLOGY OF THE SINGLE-STAGE GUM BLEND
A video print of the transmitted light micrograph of the single-stage gum blend
(Sections 4.2.2-4, 4.8.1 and 4.8.2) at a magnification of 400X (Section 4.4.4(A» is
shown in Fig.5.9. .. •• • . ..,
•
10 llm
Fig. 5.9 Transmitted light micrograph of the single-stage gum blend at 400X
magnification
138

It is clearly visible that the elastomers are immiscible due to the appearance of a lighter
continuous phase and a darker discrete phase and hence the observation is in accord
with the calculated solubility parameters of NR and high nitrile (45% ACN) NBR as
reported in Section 5.1. The micrograph exhibits very large domains which indicates
high immiscibility between the two elastomers. It is difficult to report the exact size of
the domains as they are of different sizes. However, the mean domain size is
approximately 60 j!m.
Visual identification of the two phases was hampered due to the presence of nearly
equal proportions ofNR and NBR in the blend. Hence, identification of the phases was
conducted by the Becke Line Method described in Section 4.4.4(A), using a
conventional microscope. The Becke line is visible just outside the darker phase of the
micrograph, as the microscope was not exactly focussed on the thin section. The test
indicated that the darker phase has the lower refractive index, while the lighter phase
has the higher refractive index. According to published data, high nitrile NBR has a
higher refractive index (1.596i9) than NR (1.5215 toI.5238)(IO). Hence, the result
implies that the continuous phase (lighter) is NBR and the discrete (darker) phase is
NR. This means that the major blend component (NBR) has become the continuous
phase. This behaviour confirms the previous findings of many researcheri4,ll,12,13).
This is in agreement with the rheological curves of raw NR and NBR obtained for the
high shear rate 1 high temperature combination corresponding to mixing condition 60
rpm rotor speed (see Fig. 5.1 of Section 5.2.1). In contrast, Scott et al(14) reported
that in 50/50 NRlNBR blends NBR was the dispersed phase with very large domains.
This was attributed to the very high viscosity ofNBR.
(B) EFFECT OF MIXING CONDITIONS ON mE MORPHOLOGY OF FILLED SINGLE-STAGE
BLENDS
Analysis of phase morphology of the single-stage blends using phase contrast
illumination was hampered by the presence of carbon black. Carbon black is known to
raise the refractive index of polymer blends and obscure the phase contrast (see
Section 3.2.3.4), which is mainly associated with small differences in refractive index.
Thus, the morphological analysis was based on conventional transmitted light
microscopy. The mean widths of the domains (lighter phase) of all four filled NRlNBR
single-stage blends were estimated using the micrographs by averaging the widths of
ten selected domains (excluding very small and very large ones).
Video prints of the transmitted light micrographs of the four 40/60 NRlNBR single
stage blend compounds (Sections 4.2.2-1, 4.5.1 and 4.5.2 ) designated as S20T20,
139
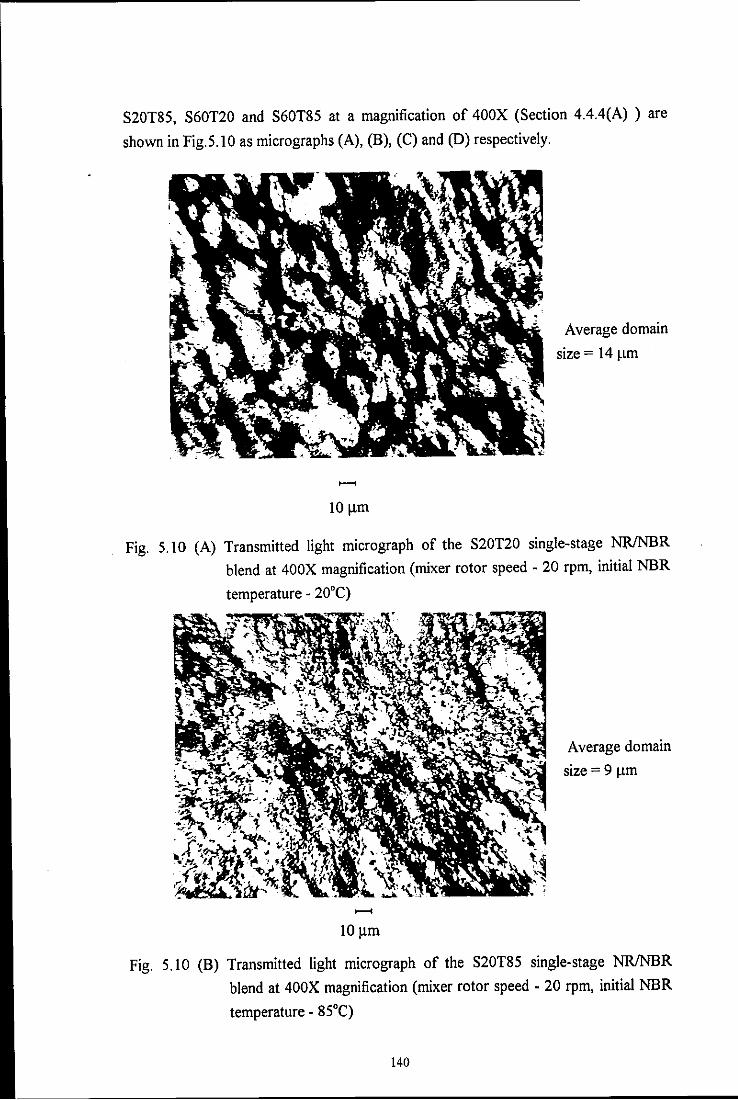
S20T8S, S60T20 and S60T8S at a magnification of 400X (Section 4.4.4(A) ) are
shown in Fig.S.10 as micrographs (A), (B), (C) and (D) respectively.
10 ~m
Average domain
size = 14 ~lm
Fig. 5.10 (A) Transmitted light micrograph of the S20T20 single-stage NlUNBR
blend at 400X magnification (mixer rotor speed - 20 rpm, initial NBR
temperature - 20°C)
10~m
Average domain
size = 9 Ilm
Fig. 5.10 (B) Transmitted light micrograph of the S20T8S single-stage NR/NBR
blend at 400X magnification (mixer rotor speed - 20 rpm, initial NBR
temperature - 8S0C)
140

10~m
Average width
of the domains
= 5 ~Lm
Fig. 5.10 (C) Transmitted light micrograph of the S60T20 single-stage NR/NBR
blend at 400X magnification (mixer rotor speed - 60 rpm, initial NBR
temperature - 20°C)
Average width
of the domains
=3 ~m
Fig. 5.10 (D) Transmitted light micrograph of the S60T85 single-stage NR/NBR
blend at 400X magnification (mixer rotor speed - 60 rpm, initial NBR
temperature - 85°C)
141

These micrographs confirm that the elastomers NR and NBR are incompatible.
Incompatibility is distinctly distinguished from the appearance of a lighter and a darker
phase, which supports the work of many researchers. It is difficult to identify the two
phases visually as NR and NBR are present in nearly equal proportions (NR:NBR =
40:60). Presence of carbon black in the two phases renders the identification more
difficult. However, according to the micrograph of the S20T20 blend (micrograph
(A», the lighter phase which is mostly in the form of large domains of varying
dimensions is the discrete phase and the darker phase is the matrix or the continuous
phase. Appearance of a co-continuous phase structure in some parts of the micrograph
suggests that the two phases are somewhat interconnecting. The phase morphology of
the S20T85 blend (micrograph (8» is very much similar to the S20T20 blend.
However, the discrete phase size of the former is somewhat smaller than the latter. i.e.
the mean width of the domains (lighter phase) of S20T20 and S20T85 blends are
approximately 14 and 9 Jlm respectively.
The lighter phase of the S60T20 and S60T85 blends consists of almost evenly
dispersed fine elongated domains, and hence, the morphology is more towards
co-continuous. These blends show microheterogeneity at a very fine level. The mean
widths of the domains (lighter phase) of the S60T20 and S60T85 blends are
approximately 5 and 31lm respectively.
The above mentioned morphological observations suggest that a marked reduction in
the domain size occurs, or in other words blending improves in filled single-stage
blends as the mixer rotor speed is increased. This is mainly due to the high stresses
imposed by high mixer rotor speeds, which are required to break down domains. The
reduction in domain size as the rotor speed is increased was expected on the basis of
the results of rheological measurements reported in Section 5.2.1. This behaviour
supports the influence of the mixing viscosity of the component elastomers on the
domain size of the dispersed phase as reported by several researchers(4,12,I3)
Another factor which may be able to account for the reduction in domain size at high
shear rates is the reduction in interfacial tension between the phases due to the rise in
mixing temperature as reported by Tokita(S) Tokita found that the domain size is
reversible with the mixing temperature, but is not controlled by the stress field (which
is mainly due to the matrix viscosity) itself The interfacial tension between the phases
in S60T20 and S60T85 blends can be regarded as lower than that of S20T.20 and
S20T85 blends due to the greater rise in batch temperature, as observed from the
corresponding plots of batch temperature against mixing time (Figures 5.11 and 5.12),
obtained from the Francis Shaw KI Intermix. Thus, the lower interfacial tension
between the phases of the former blends in relation to the latter blends may have also
142

contributed to the reduction in domain size, in addition to the effect of difference
between the apparent viscosities of the two elastomers.
120
100
2: 80 ., ~
:::l
E 60 ., c. E 40 ., I-
20
0 0 200 400 600 800
Mixing lime (5)
Fig. 5.11 Batch temperature against mixing time of the S20T20 and S20T85
single-stage blends
160
140
~
~ 120
., 100 ~
:::l - 80 ca ~ ., c. 60 E ., I- 40
20
0 0 50 100 150 200 250 300
Mixing lime (5)
Fig. 5.12 Batch temperature against mixing time of the S60T20 and S60T85
single-stage blends
The reduction in domain size with increasing mixer rotor speed is in contrast to the
findings reported by Ahmad and Wheelans(l5) on unfilled blends ofNR and NBR and
143

can be attributed to the viscosity equalizing(4) and strain increasing effects of carbon
black.
A computer-aided image analysis technique which is generally used to determine the
distribution of carbon black (using YIDS V software) (Section 4.4.4 (A», was used in
the identification of the lighter and the darker phases. The results obtained for the four
single-stage NRlNBR blend compounds (Sections 4.2.2-1, 4.5.1 and 4.5.2 ) are given
in Table 5.1.
Compound No. Area/Frame % of the lighter phase
I) S20T20 24.2
2) S20T85 24.7
3) S60T20 21.5
4) S60T85 26.2
Table 5.1 Average values of area/frame % of the lighter phase calculated from the
results obtained from four selected fields
The above results indicate that the lighter phase is NR in all the four blends as the
area I frame % is closer to 40%, which is the actual proportion ofNR in the blend. The
values obtained are less than the actual proportion of NR (40%) in the blends. This
may be due to the presence of carbon black in relatively large amounts in some areas of
the NR phase, making those areas almost similar in darkness to that of the NBR phase.
The results suggest that the major blend component (NBR) has formed the continuous
phase and supports the work reported by many researchers(4,11,12,13).
In the case of the single-stage gum blend, the darker (discrete) phase is NR and the
lighter (continuous) phase is NBR (see Section 5.5.1). The darker phase in the filled
single-stage blends happens to be NBR. This may be due to the presence of sufficient
carbon black in the NBR phase, which raises the refractive index of NBR making it
darker than the NR phase. It was reported at the begining of this section that the
average domain size of the S60T20 blend (filled with 20 phr carbon black)
(approximately 5 I!m) is twelve times smaller than that of the single-stage gum blend
(approximately 60 I!m) prepared according to the same mixing conditions. This
reduction in the size of the discrete phase domains in the former blend can be ascribed
to the addition of carbon black, which tends to equalize the viscosity of the blend
components as predicted by Waiters and Keyte(4) and also increase stresses imposed by
the shear field during the mixing cycle. Thus, the morphological observations from the
current work are in agreement with the work of Gessler et al.(16) who also found that
addition of fillers reduces the size of the domains.
144

In general, a high rotor speed and a high initial NBR temperature are the best mixing
conditions to achieve a small domain size.
5.4 CARBON BLACK DISTRIBUTION IN NR AND NBR BLENDS
The properties of elastomer blends are known to be more significantly affected by
carbon black di stribution than they are by morphology<' 7) Hence the main aims of this
study, conducted using mainly scanning transmission electron microscopy (STEM), is
to determine the effect of mixing conditions on the carbon black di stribution of single
stage blends and whether large scale transfer of carbon black occurs from one rubber
carbon black masterbatch to the other upon blending in the Francis Shaw K I Intermix
5.4. 1 E FFECT OF MIXING C ONDITIONS ON THE CARBON B LAC K D ISTR IBUTION OF
S INGLE-STAGE B LENDS
Fig. 5.13 shows a video print of the transmitted light micrograph (Sections 4.4.4(A))
of the filled single-stage NRINBR blend prepared accord ing to a short mixing cycle as
given in Sections 4.2.2-5, 4.9.1 and 4.9.2.
10 ~m
Fig. 5.13 Transmitted light micrograph of the single-stage blend with a short mixing
cycle at 400X magnification
145

The idea of employing a short mixing cycle was to produce a single-stage blend with a
very coarse-textured morphology, in order to study the carbon black distribution
between the phases. Although, the morphology is coarse textured, it is difficult to
differentiate between the phases as the inter-zone contrast is very poor. It appears from
the micrograph that carbon black is poorly dispersed. Carbon black agglomerates are
visible as dark black patches and appear to be almost similar in size to that of the
domains. Thus identification of the phases was more difficult, which in turn meant that
the aim could not be achieved. Hence, electron microscopy had to be employed to
study the carbon black distribution between the phases.
Carbon black distribution between the phases of the single-stage blends was studied
initially using III thin sections. Fig.5.14 (A) and (B) show the scanning transmission
electron micrographs (Section 4.4.4(8» of the S20T20 blend (Sections 4.2.2-1, 4.5.1
and 4.5.2) at magnifications 4,000 and 10,000 respectively, while Fig.5.14 (C) and (D)
show the micrographs of the S60T20 blend (Sections 4.2.2-1, 4.5.1 and 4.5.2) at
similar magnifications.
A dark and a light phase can be seen from these micrographs indicating heterogeneity,
but carbon black agglomerates or primary aggregates are not clearly visible. Generally,
rubber compound fonnulations contain ZnO in excess. Hence the sharp edged black
objects distributed in both the phases may be either particles of ZnO, ZnS (extra
network material), zinc dimethyldithiocarbamate (ZDMC), decomposition products of
cyclohexyl-dithiobenzothiazole (CD8) or a combination of any of these materials. It is
evident from literature(18) that in electron microscopy, the elastomer having the higher
degree of swelling corresponds to the lighter phase, since it stretches more than the
other under equal stress and becomes much thinner, making the passage of electrons
easier. Since NR has a higher degree of swelling in xylene (swelling liquid) than NBR,
the lighter phase corresponds to NR, while the darker phase corresponds to NBR.
146

· ... ,r'·· ,~ .
•
Fig. 5.14 (A) Scanning transmission electron micrograph of the S20T20 single-stage
blend (x 4000 magnification)
Fig. 5.14 (B) Scanning transmission electron micrograph of the S20T20 single-stage
blend (x 1 0000 magnification)
1~7

. Ii~ .' . .. . '\: . ..... . ,. .j "
.:1'
,. .
Fig. 5.14 (C) Scanning transmission electron micrograph of the S60T20 single-stage
blend (x 4000 magnification)
• •
~., . .. " . ,
•• ' . • \ \
\ -~-- .-'-'---
Fig. 5.14 (D) Scanning transmission electron micrograph of the S60T20 single-stage
blend (x 10000 magnification)
1~8

Carbon black may also influence the differential swelling technique as predictel! by
Marsh and co-workers(l8), but the effect would be very small because only 20 phr of
carbon black is present in the blend.
Freshly cut 2~l thin sections of the single-stage blends were analysed for carbon black
distribution as carbon black primary aggregates were not visible in the micrographs
obtained from I ~l thin sections. The 2~l thin sections were more uniform in thickness
and carbon black particles were visible even at a magnification of 5,000.
FigSI5 shows the scanning transmission electron micrograph of a 2~l thin section of
the S20T20 blend (Sections 4.2.2-1, 4.5.1 and 4.5.2 ) at a magnification of 5,000
(Section 4.4.4(B».
Fig. 5.15 Scanning transmission electron micrograph of the S20T20 single-stage blend
(x 5000 magnification)
It is apparent from the micrograph that carbon black resides in the NR (lighter) phase
and in the outer regions (closer to the interface) of the NBR (darker) phase. However,
presence of carbon black in the inner regions of the NBR phase is not clearly visible as
this phase appears to be very dark, probably due to swelling restriction in the presence
1~9

of a greater proportion of carbon black(\ 9) and the presence of more carbon black
itself.
The scanning transmission electron micrographs of the S60T20 blend (Sections
4.2.2-1,4.5.1 and 4.5.2) at magnifications 1000,5000 and 20000 (Section 4.4.4(B»
are shown in Fig.5.16 (A), (B) and (C) respectively. It is clear from micrographs (A)
and (B) that the contrast between the phases is not simply due to random microtoming
effects as the shape of the domains takes an elongated form and hence similar to that of
the corresponding transmitted light micrograph shown earlier in Fig.5.1 0 (C). Also, the
mean width of the domains is similar to that of the corresponding transmitted light
micrograph. The presence of aggregates of carbon black in the NR phase can be seen
more clearly from micrograph (C).
110 Ilm
Fig. 5.16 (A) Scanning transmission electron micrograph of the S60T20 single-stage
blend (x 1000 magnification)
ISO

Fig. 5.16 (B) Scanning transmission electron micrograph of the S60T20 single-stage
blend (x 5000 magnification)
Fig. 5.16 (C) Scanning transmission electron micrograph of the S60T20 single-stage
blend (x 20000 magnification)
151

The batch temperature of the S20T20 blend, just prior to addition of carbon black is
approximately 90·C, whereas that of the S60T20 blend is approximately 120·C
(Figures 5.11 and 5.12). It was observed from Fig.5.1 of Section 5.2.1, that the
apparent viscosity ofNBR is slightly lower than that ofNR at 120·C and at high shear
rates corresponding to high mixer rotor speeds such as 60 rpm. This may be expected
to result in the preferential location of carbon black in the NBR phase of the S60T20
blend, since carbon black has been found to mix initially into the least viscous
elastomer. However, it is difficult to say whether the viscosity of NBR is lower than
that of NR at 90·C and at 20 rpm mixer rotor speed, since there will be a spectrum of
strain rates in the mixer and it is not possible to identifY an exact equivalent shear rate.
Carbon black distribution studies of the S20T85 and S60T85 blends were hampered
due to holes in the thin sections. However, since the effect of shear rate on the
viscosity of the elastomers was higher than the effect of initial temperature ofNBR, the
carbon black distribution in the S20T85 and S60T85 blends would be expected to be
similar to that of S20T20 and S60T20 blends respectively.
Although it is difficult to see carbon black in the inner regions of the NBR (darker)
phase, carbon black is located preferentially in the NBR phase of all the four NR/NBR
single-stage blends. This can be explained by comparing the viscosities of NR and
NBR at low strain rates. Generally, incorporation of carbon black into an elastomer
occurs between the rotors of the internal mixer, where strain rates are low. Also,
carbon black has been found to mix initially into the lower viscosity e1astomer of a
blend of e1astomers(4,12,16) Since NBR has a lower viscosity than NR at very low
strain rates (see Sub-section 5.2.1), it is reasonable to conclude that carbon black is
located preferentially in the NBR phase of all the four single-stage blends.
5.4.2 CARBON BLACK DISTRIBUTION AND TRANSFER IN MASTERBATCH BLENDS
Video prints of the transmitted light micrographs ofNR10NBR90, NR50NBRSO and
NR90NBRI0 blends (Sections 4.2.2-2, 4.6.1 and 4.6.2) at a magnification of 400X
(Sections 4.4.4(A) ) are shown in Fig.5.17.
152

10 J..l m
Fig. 5.17 (A) Transmitted light micrograph of the NR I ONB R90 masterbatch blend at
400X magnificat ion
-10 J..lm
Fig. 5.17 (B) Transmitted light micrograph of the NR50NBR50 masterbatch blend at
400X magnification
153
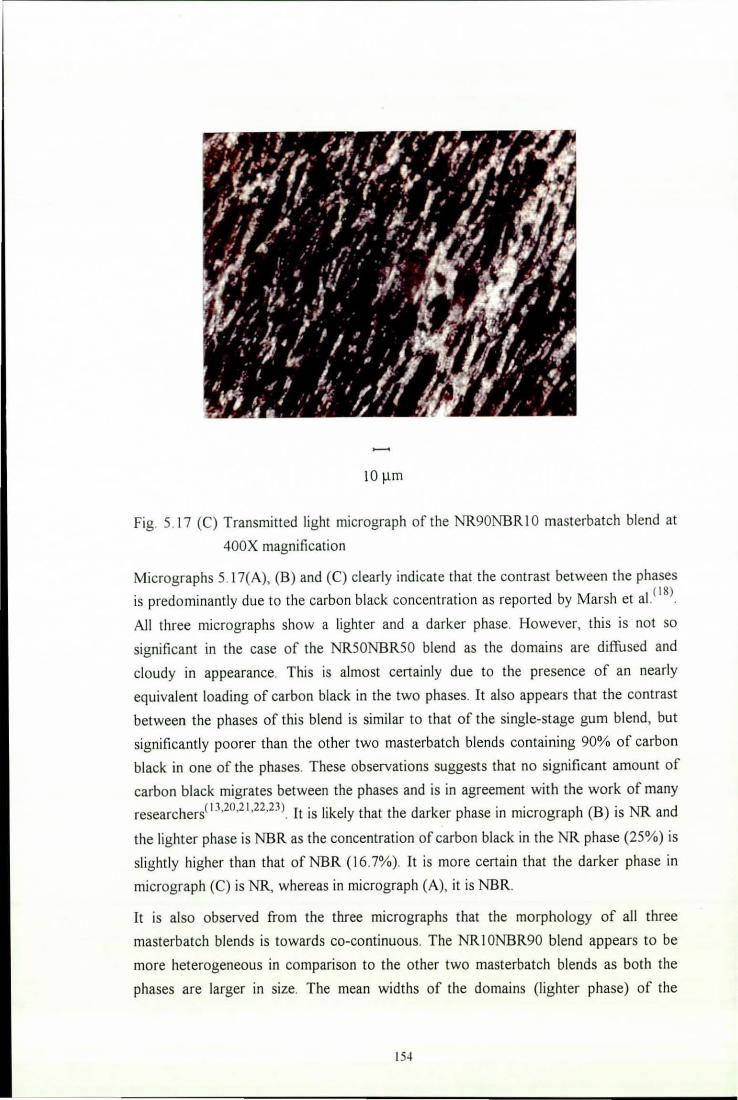
Fig. 5. 17 (C) Transmitted light micrograph of the NR90NB R I 0 masterbatch blend at
400X magnification
Micrographs 5. 17(A), (8 ) and (C) clearly indicate that the contrast between the phases
is predominantly due to the carbon black concentration as reported by Marsh et al ( 18)
All three micrographs show a lighter and a darker phase. However, this is not so
significant in the case of the NR50NBR50 blend as the domains are diffused and
cloudy in appearance. This is almost certainly due to the presence of an nearly
equivalent loading of carbon black in the two phases. It also appears that the contrast
between the phases of this blend is similar to that of the single-stage gum blend, but
significantly poorer than the other two masterbatch blends containing 90% of carbon
black in one of the phases. These observations suggests that no significant amount of
carbon black migrates between the phases and is in agreement with the work of many researchers( 13,20,21 ,22,23) It is likely that the darker phase in micrograph (8) is NR and
the lighter phase is NBR as the concentration of carbon black in the NR phase (25%) is
slightly higher than that of NBR (16.7%). It is more certain that the darker phase in
micrograph (C) is NR, whereas in micrograph (A), it is NBR.
It is also observed trom the three micrographs that the morphology of all three
masterbatch blends is towards co-continuous. The NR I ONBR90 blend appears to be
more heterogeneous in comparison to the other two masterbatch blends as both the
phases are larger in size. The mean widths of the domains (lighter phase) of the
154

NRI0NBR90, NRSONBRSO and NR90NBRI0 blends are approximately 7.5, 5 and
4 Ilm respectively. The observed difference in morphology between these blends is
possibly a result of the variation in the difference in viscosity between the pairs of
masterbatches combined in these blends at high shear rates corresponding to high
mixer rotor speeds, as previously reported in Section 3.2.4.3. The difference in
apparent viscosity (log scale) of the pairs of masterbatches combined in the
NRI0NBR90, NRSONBRSO and NR90NBRI0 blends at 40s·1 shear rate
corresponding to high mixer rotor speed is 0.248, 0.106 and 0.01 Pa.s respectively (see
Section 5.2.2). Thus the difference in viscosity at high shear rates is greatest between
the pairs of masterbatches combined in the NRI0NBR90 blend, which may be able to
account for its greater heterogeneity in relation to the other two masterbatch blends.
The slightly greater domain size observed for the NRSONBRSO blend in relation to the
NR90NBRI0 blend can also be attributed to the slightly greater difference in viscosity
between the pair of masterbatches combined in the former blend in comparison to that
of the latter blend (see Figures 5.7 and 5.8 of Section 5.2.2).
This morphological study indicates that a greater percentage of carbon black in the NR
phase produces more intimate blending at high shear rates in comparison to that
containing a greater percentage of carbon black in the NBR phase, solely due to the
smaller difference in viscosity between the component masterbatches.
The scanning transmission electron micrographs of NRI0NBR90, NRSONBRSO and
NR90NBRI0 blends (Sections 4.2.2-2, 4.6.1 and 4.6.2 ) at a magnification of 5,000
(Section 4.4.4(B» are shown in Fig.S.18 (a), (b) and (c) respectively. Comparison of
micrographs 5.18 (a) and 5.18 (c) reveals that the lighter phase in these micrographs is
NR, as the lighter phase of the latter appears to have a much greater amount of carbon
black than that of the former. Thus, the above observation confirms the findings from
phase identification of single-stage blends, reported earlier in Section S.3.1(B). Also, it
implies that no large scale transfer of carbon black occurs between phases. Thus, the
observations on phase mixed compounds suggest that majority of carbon black remains
in the elastomer phase to which it is originally added, which is in agreement with the
work ofMassie et al.(24).
155

Fig. 5.18 (a) Scanning transmission electron micrograph of the NRiONBR90
masterbatch blend (x 5000 magnification)
Fig. 5.18 (b) Scanning transmission electron micrograph of the NR50NBR50
masterbatch blend (x 5000 magnification)
156

Fig. S .18 (c) Scanning transmission electron micrograph of the NR90NBR 10
masterbatch blend (x SOOO magnification)
The scanning transmission electron micrograph of the stained (with OsO.) thin section
(Section 4.4.4(B» corresponding to the NR90NBRIO blend (Sections 4.2.2-2, 4.6.1
and 4.6.2 ) at a magnification of 20,000 is shown in Fig. S.19. No significant difference
was observed between the electron micrographs of the stained sections corresponding
to the NRlONBR90 and NRSONBR SO blends and the NR90NBRIO blend. Thus the
former micrographs have not been included under this section. As in the case of the
electron micrographs of stained sections of single-stage blends (Sections 4.4.4(B) and
4.S.3(C», it is difficult to identifY carbon black particles. However, the cloudy
appearance in the lighter regions may be due to the presence of carbon black in the
NBR phase. Hence the staining technique employed on the masterbatch blends with the
idea of obtaining further information on carbon black distribution and transfer was
unsuccessful. However, confirmation of the morphology and identification of the
phases would have been possible with electron micrographs of stained thin sections
obtained at a low magnification, since NR is stained to a greater extent than NBR (25 >.
157

I ~lm
Fig. 5. 19 Scanning transmission electron micrograph of a stained section of the
NR90NBRJO masterbatch blend (x 20000 magnification)
158

5.5 PROPERTIES OF BLENDS
5.5.1 RHEOLOGY OF BLENDS
(A) EFFECT OF MIXING CONDITIONS ON mE RHEOLOGY OF SINGLE-STAGE BLENDS
As mentioned previously in Section 4.5.1, the four single-stage blends are denoted as
S20T20, S20T85, S60T20 and S60T85. The numeric following the letter'S' denotes
the mixer rotor speed in rpm, whilst the numeric following the letter 'T' denotes the
initial temperature ofNBR in centigrade degrees.
Fig.5.20 illustrates the variation of apparent viscosity with shear rate of the S20T20
blend (Sections 4.2.2-1,4.5.1 and 4.5.2), obtained using the Negretti TMS rheometer
(Sections 4.2.2-2,4.6.1 and 4.6.2) at temperatures lOO, 110 and 120°C.
6
5.5
!if 5 &. ~ 4.5 • ~
4
3.5
3
~ ~
---+- At too'c
-D-At 110'e
~,~ -A-At 120'C
-1 o 1 2 log (shear rate) (s" )
Fig. 5.20 Apparent viscosity vs shear rate plots of the filled (20 phr, N660) S20T20 blend at different temperatures
It is apparent from this figure that the variation of rheological behaviour of the
single-stage blend with temperature is similar to that of the component elastomers
(Figure 5. I of Section 5.2.1).
159

Apparent viscosity against shear rate plots of the four unvulcanised single-stage blends
(Sections 4.2.2-1, 4.5.1 and 4.5.2), obtained using the Negretti TMS rheometer
(Sections 4.2.2-2,4.6.1 and 4.6.2) at 120·C are shown in Fig.5.21.
5.5,..---------------,
5 'Ui' ~ 4.5
r=- 4
~ 3.5
3+--+--~-~-_r-~-~
-1 -0.5 o 0.5 1 1.5 2
log (shear rate) (5·')
__ S20T20
-O-S20TB5 __ S60T20
-O-S60TB5
Fig.5.21 Shear rate-apparent viscosity plots of the filled
(20phr, N660) single-stage blends at 120·C
The four plots coincide throughout the shear rate range studied reflecting a similar
rheological behaviour. This indicates that the rotor speed and initial temperature of
NBR do not exert a significant effect on the apparent viscosity of the single-stage
blends. Also the apparent viscosity of single-stage blends is not significantly affected by
morphology. Similar rheological behaviour of the four single-stage blends also
indicates that the distribution of carbon black is the same for all four blends, or that the
blend viscosity is independent of the distribution of carbon black within the blend
rubber phase.
A comparison between !he apparent viscosities of the four single-stage blends
(Sections 4.2.2-1, 4.5.1 and 4.5.2), NRIONBR90 blend and the masterbatches
combined in the latter blend (Sections 4.2.2-2, 4.6.1 and 4.6.2), obtained using the
Negretti TMS rheometer (Section 4.4.2) is presented in Fig. 5.23.
Fig.5.22 clearly indicates that the apparent viscosity of the NR90NBRIO blend is much
lower than the predicted value. A similar behaviour is observed in the apparent
viscosities of the NR50NBR50 and NRIONBR90 blends in relation to the predicted
values. Lowering of apparent viscosity of the masterbatch ( two-stage) blend may be
attributed to an improved carbon black dispersion due to the longer mixing time (5.5
min.), in comparison to the 3.5 min. mixing time of the masterbatches and the single
stage blends. Another factor which may be able to account for the lowering of
apparent viscosity of the masterbatch blend is continued mastication with mixing time.
160

The results are in agreement with the work of Boonstra and Medalia(26) and Sircar et
al(23). Both groups of researchers prepared the two-stage blends by diluting the
masterbatches with unloaded elastomers.
U) .; 0.. ~
• C"
6500,..---------------,
6000 NBRMB (3.33 phr C.B.) £' Predicted
5500
5000 8 Single-stage
4500 to NR90NBR10
4000 0 20 40 60
Weight % NR in blend
NRMB (4 phr C.B.)
80 10U
.S20T20
.S20T85
OS60T20
OS60T85
to NR90NBR 1 0
Fig.5.22 Effect of blending conditions on the apparent viscosity of filled (20 phr, N660) NRlNBR blends at 40 5" shear rate and
100°C
. Boonstra and Medalia(26) attributed the marked lowering of Mooney viscosity in
blends prepared by a two-stage mixing process solely to an improved carbon black
dispersion in each of the phases, due to increased mixing time in relation to that of a
single-stage mixing process. As carbon black dispersion improves, rubber trapped
within carbon black agglomerates, i.e. immobilised rubber is released, which in turn
lowers the viscosity due to the mobility of these rubber molecules. Sircar and
coworkers attributed the marked lowering of Mooney viscosity of two-stage blends in
comparison to those prepared by conventional mixing techniques or the single
elastomer compounds (with 50 pbr carbon black loading), to the formation of
discontinuous carbon black structure units surrounded by layers of unloaded
elastomers. However, Sircar et aI.' s model on carbon black structure development
cannot be applied to explain the viscosity behaviour of the blends prepared according
to a two-stage mixing process, as both the elastomers were initially loaded at least with
10% of carbon black prior to blending.
In contrast to the above phenomenon, Hess et al.(12) reported an unexpected result that
blends of NR and BR had higher viscosities than the single elastomer compounds. This
was mainly attributed to the formation of graft interpolymers of NR and BR, which in
turn raise the viscosity of the blends due to the high molecular weight of the grafted
molecules.
It is also to be noted that the masterbatch viscosity ratios (log scale) of NR to NBR of
NRIONBR90, NR50NBR50 and NR90NBRIO blends (Sections 4.2.2-2, 4.6.1 and
4.6.2), obtained using the Negretti TMS rheometer (Section 4.4.2) at 40 s'\ shear rate
161

and 100·C are 0.936,0.972 and 0.997 respectively. These ratios indicate that there is
no significant difference in the carbon black dispersion between the three masterbatch
blends at the same total mixing time. Dispersion in all the three blends can be regarded
as good because the ratios are approximately I, since a viscosity ratio (log scale) of
about I to 3 produces a good dispersion, as found by Hess et al. (27)
(B) EFFECT OF mE LOCATION OF CARBON BLACK ON mE APPARENT VISCOSITY OF
MASTERBATCH BLENDS
The measured and predicted apparent viscosity values of the masterbatch blends
(Sections 4.2.2-2, 4.6.1 and 4.6.2) obtained using the Negretti TMS rheometer at
40 S·l shear rate and 100·C (Section 4.4.2) plotted against the percentage of carbon
black in the NR phase is shown in Fig. 5.23.
6500
6000
Ci) 5500
~ 5000 ~
• 4500 .,. 4000
3500
3000
0
---- -..------...
. ----_ .. -. --------------------• 10 20 30 40 50 60 70 80 90 100
Weight % carbon black in the NR phase
Fig. 5.23 Effect of location of carbon black on the apparent viscosity of filled (20 phr, N660) masterbatch
blends at 40s·1 shear rate and 100·e
It can be seen from this figure that the predicted and measured trends in the variation
of apparent viscosity with percentage of carbon black in the NR phase are more or less
similar. The apparent viscosity of masterbatch blends increases slightly with more
carbon black premixed into the NR phase. This is probably a reflection of the greater
effect of carbon black on the apparent viscosity of NR in relation to NBR, as discussed
in Section 5.2.2.
It is concluded that the location of carbon black in the individual rubber phases has a
little effect on the apparent viscosity of NRlNBR blends. This is in agreement with the
work of Lee(21), based on shear viscosity measurements of SBRlBR blends. This
confirms that the distribution of carbon black is the same for all four single-stage
blends (see Section 5.5.1 (A)).
162

5.5.2 CURE CHARACTERISTICS OF NR AND NBR BLENDS
The ultimate properties of a cured elastomer blend compound are influenced by the
state of mix of the unvulcanised compound. For a compound to process easily in the
subsequent forming operations, cure efficiently and develop the required properties for
end-use, it should be well mixed. Thus it is necessary to have a knowledge of the
processing characteristics ofNRJNBR blends in order to aim for optimum properties.
The four basic cure characteristics generally determined using a cure analyser as
described in the experimental section are scorch time, 90% cure time, cure rate index
and (Max.-Min.) torque. Determination of scorch time is one of the most frequently
used tests for assessing the processability of rubber compounds, whilst 90% cure time,
cure rate index and (Max.-Min.) torque give an indication of cure behaviour. One of
the main aims is to study the effect of mixing conditions on these four parameters. The
other is to determine whether location of carbon black within the rubber blend phases
has any influence on the cure characteristics, since several researchers have found that presence of fillers influence the vulcanisation procesPS,29,30,31,32,33).
It is also necessary to study the cure efficiency of NRJNBR blends relative to that of
NBR compounds, in order to determine the suitability of the former as a replacement
for the latter, which would satisfy the ultimate aim of increasing consumption ofNR.
It is also worthwhile to study the influence of the blending technique on cure
characteristics, so that the best blending technique with regard to cure efficiency can be
found.
Cure characteristics of all the rubber compounds prepared throughout this research
project are tabulated in Table 5.2.
(A) INFLUENCE OF MIXING CONDITIONS ON mE CURE CHARACTERISTICS OF SINGLE-STAGE BLENDS
In contrast to the crumbly, powdery appearance observed by Ahmad and Wheelans for
unfilled blends of NRJNBR (41 % ACN) at discharge from the mixer, all the filled
NRJNBR (45.5% ACN) blends studied in this project discharged in a smooth coherent
manner (without a trace of crumbliness). This indicates that the two rubbers and the
compounding ingredients are well mixed in all the single-stage blends. One of the
reasons for this is the high mixing shear stress caused by the presence of carbon black
which produces more intimate blending, and hence may reduce crumbliness. The
powdery nature of the blends of NRJNBR observed by Ahmad and Wheelans is
connected with inefficient mixing, slipping or skidding in the internal mixer.
163

Compound Scorch Time 90% Cure Cure Rate (Male-Min.)
(min.) Time (min.) Index Torque (Nm)
(C.R.I.)
Filled NR 1.27 5.6 23.5 1.71
Filled NBR (45% 4.37 11.7 13.7 1.69
ACN)
Filled NBR (26.6% 1.83 * 14.1 * 8.1 * 1.75 * ACN) - Control
Single-stage gum blend 3.65 10.3 15.2 1.0
S20T20 blend 2.83 7.93 19.7 1.47
S20T85 blend 3.28 7.73 22.7 1.42
S60T20 blend 2.23 6.05 26.2 1.47
S60T85 blend 2.48 6.25 26.5 1.39
NR10NBR90 blend 3.9 9.9 16.6 1.49
NR50NBR50 blend 3.9 9.6 17.5 1.50
NR90NBR10 blend 3.9 9.8 16.6 1.52
Filled single-stage 3.13 9.7 15.3 1.07
blend - short mixing
cycle
Table 5.2 Cure characteristics of all the rubber compounds obtained using the Wallace
Shawbury Precision Cure Analyser (Section 4.4.3(A)) at l50·C
* Tested at l40·C
The variation in scorch time and 90% cure time of the four single-stage blends
(Sections 4.2.2-1, 4.5.1 and 4.5.2), obtained using the Wallace Shawbury Precision
Cure Analyser (Section 4.4.3(A)) at 150·C is shown in Figures 5.24 and 5.25
respectively. It is clearly seen that the S20T20 and S20T85 blends show higher scorch
and cure times than S60T20 and S60T85 blend. The observed differences in scorch
and cure times of the blends with rotor speed may be attributed to the heat history of
164
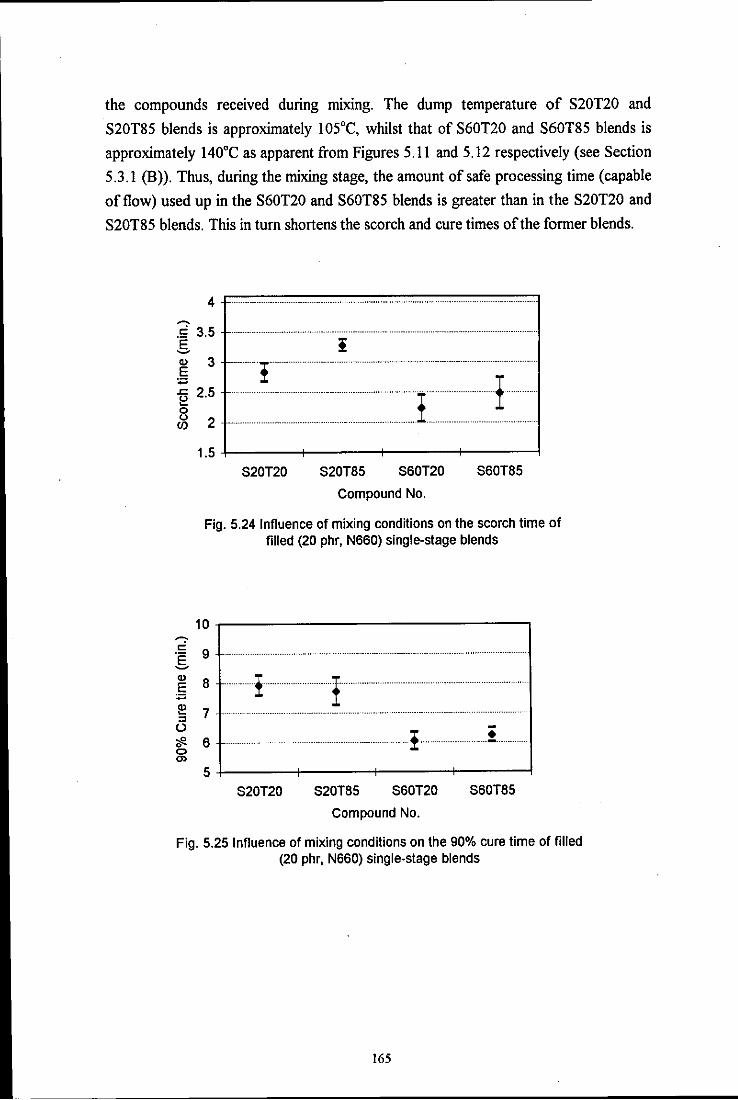
the compounds received during Illixmg. The dump temperature of S20T20 and
S20T85 blends is approximately 105°C, whilst that of S60T20 and S60T85 blends is
approximately 140°C as apparent from Figures 5.11 and 5.12 respectively (see Section
5.3.1 (B». Thus, during the mixing stage, the amount of safe processing time (capable
of flow) used up in the S60T20 and S60T85 blends is greater than in the S20T20 and
S20T85 blends. This in turn shortens the scorch and cure times of the former blends.
4 ~
.~ 3.5
.§. ~ 3---1:-- ........ ............. .....-
:.;::::; I
···························1····· J:: 2.5 ~ 8 (f) 2 ............................................. 1
1.5 -1-----+----+---+------1 S20T20 S20TS5 S60T20 S60TS5
Compound No.
Fig. 5.24 Influence of mixing conditions on the scorch time of filled (20 phr, N660) single-stage blends
10,---------------,
~ SI :.;::::; I ~ 7 :::J t.)
eft 6 o m
......... ! ......................... l 5-1-----+---~---+---~
S20T20 S20TS5 S60T20 S60TS5
Compound No.
Fig. 5.25 Influence of mixing conditions on the 90% cure time of filled (20 phr, N660) single-stage blends
165

The variation in cure rate index of the single-stage blends (Sections 4.2.2-1,4.5.1 and
4.5.2), which gives an indication of cross link insertion rate, obtained using the Wallace
Shawbury Precision Cure Analyser (Section 4.4.3(A», is shown in Fig. 5.26.
35~-----------------------------,
33 1Il 31 '" 29 c: Cl> 27 1ii 25 a: 23 ~ 21 t> 19
.•••...••.••.••• ! ..................:~~! .•••. 17 15+------+------~----~------~
S20T20 S20T85 S60T20 S60T85
Compound No.
Fig. 5.26 Influence of mixing conditions on the cure rate index of filled (20 phr, N660) single-stage blends
It is apparent from this figure that the cure rates of the S60T20 and S60T85 blends are
higher than those of the S20T20 and S20T85 blends. These differences in cure rates
with rotor speed may again be due to the heat history of the compounds received
during mixing, since a higher cure rate generally reflects a lower cure time.
The variation in (Max.-Min.) torque (directly related to the shear modulus and hence
to the crosslink density) of the four single-stage blends (Sections 4.2.2-1, 4.5.1 and
4.5.2), obtained using the Wallace Shawbury Precision Cure Analyser (Section
4.4.3(A» is shown in Fig. 5.27. No significant difference is observed between the
torque values of these blends. This implies that the overall crosslink density of all the
four blends is almost the same, although there may be differences in crosslink
distribution. Hence the results indicate that the overall crosslink density of single-stage
blends is unaffected by both rotor speed and initial NBR temperature, despite
differences in morphology.
166

E 2r-----------------------------,
~ 1.8 C1) :::J
.§ 1.6
...,. c: 1.4 ~ , ~ 1.2
::!! ~
1 +-----~------_r------+_----~ 820T20 820T85 860T20 860T85
Compound No.
Fig. 5.27 Influence of mixing conditions on the (Max.-Min.) torque of filled (20 phr, N660) single-stage blends
The control NBR (26.6% ACN) compound, which is expected to have a good oil
resistance, was prepared in order to determine the suitability of the NRlNBR blends as
a replacement for the former especially in oil sealing applications. Unfortunately it is not possible to determine the suitability of the NRlNBR blends as a replacement for the
control NBR compound with regard to cure efficiency due to the difference in the heat
history of the compounds. According to the results given in Table 5.2, the estimated
value of the 90% cure time of the control NBR (26.6% ACN) compound at 150·C is
shorter than the 90% cure time of the NBR (45% ACN) compound at the same
temperature. Thus the control NBR compound cures faster than the NBR (45% ACN)
compound. This is probably due to the more efficient vulcanising system (with less
sulphur) employed in the preparation of the former.
The results also indicate that the scorch and cure times of the masterbatch blends are
higher than those of the single-stage blends. These differences may be related to the
heat history of the compounds. Since the mixing cycle (at 60 rpm rotor speed)
employed in the preparation of single-stage blends was longer than that employed in
the second stage of masterbatch blends, the amount of scorch time used up is expected
to be greater in the former blends. Hence resulting in shorter scorch and cure times
obtained for the single-stage blends in relation to the masterbatch blends.
A comparison between cure rate index (C.R.I.) of single-stage blends (Sections
4.2.2-1, 4.5.1 and 4.5.2), masterbatch blends (Sections 4.2.2-2, 4.6.1 and 4.6.2) and
single elastomer compounds (Sections 4.2.2-3, 4.7.1 and 4.7.2), obtained using the
Wallace Shawbury Precision Cure Analyser (Section 4.4.3(A» is shown in Fig. 5.28.
167

30
25 )(
" 20 "0 .E .Sl 15 '" 0::
" 10 ~
::> 0 5
0
• • Single-stage _.~_._---~ ---A-edicted __ ~ • ._-----------
__ ----.-.------t~sterbatch -----
0 10 20 30 40 50 60 70 80 90 100
Weight % NR in blend
Fig. 5.28 Effect of blending conditions on the cure rate Index of filled (20phr, N660) NRlNBR blends
.520120
.5201"85
<> 560T20
<> 5601"85
.t. NR10NBR90
A NR50NBR50
'" NR90NBR10
The results indicate that the NR compound cures much faster than the comparable
NBR compound (Table 5.2). This may be attributed to the non-rubber components in
NR, mainly proteins acting as accelerators for the vulcanisation process(34). It is also
interesting to note that the cure rate of most of the single-stage blends is closer to that
of the NR compound than predicted. The fine textured single-stage blends show a
positive synergism of cure rate.
It is clear from the above figure that the cure rate of the single-stage blends is well
above the additivity line of the single elastomers, whereas the cure rate of the
masterbatch blends is just below the additivity line. The higher cure rate of the single
stage blends in relation to that of the masterbatch blends is probably due to the
difference in heat history received during mixing.
The (Max. -Min.) torque (an indication of degree of crosslinking) of both the types of
blends (Sections 4.2.2-1, 4.5.1, 4.5.2 and Sections 4.2.2-2, 4.6.1 and 4.6.2), obtained
using the Wallace Shawbury Precision Cure Analyser as mentioned earlier (Section
4.4.3(A», is slightly below the additivity line of the single e1astomer compounds
(Fig. 5.29). This indicates that the overall cross-link density of the blends is lower than
that of the single elastomer compounds. No significant difference is observed between
the (Max.-Min.) torque of the single-stage and masterbatch blends. This indicates that
the overall crosslink density is the same, whether the blending technique is single-stage
or two-stage. Also the overall crosslink density is not significantly affected by
morphology.
168

2,-------------------------, E z 1.8 ;;. A-edicted ~ ------------~----------------. El- 1.6
.s 1.4
i 1.2 , lii 1 6
• Masterbatch e Single-stage
0.8 +--+--+--t--_+__-+---f---+--+---+---l o 10 20 30 40 50 60 70 80 90 100
Weight % NR in blend
.S2012O • S20T85
oS6012O oS60T85 ANR10NBR90 .e.NR50NBR50 A NR90NBR10
Fig. 5.29 Effect of blending conditions on the (Max .-Min.) torque of filled (20 phr, N660) NRlNBR blends
Overall, the comparisons reveal that the masterbatch blends are superior to the single
stage blends in terms of processing safety, whereas the single-stage blends are superior
to the masterbatch blends in terms of cure efficiency.
(B) INFLUENCE OF LOCATION OF CARBON BLACK ON TIffi CURE CHARACTERISTICS OF
MASTERBATCH BLENDS
The variation in scorch time, 90% cure time, cure rate index and (Max.-Min.) torque
of the masterbatch blends (Sections 4.2.2-2, 4.6.1 and 4.6.2), obtained using the
Wallace Shawbury Precision Cure Analyser (Section 4.4.3(A» is shown in Figures
5.30, 5.31, 5.32 and 5.33 respectively.
4.6 -r------------------------------, ~ 4.4 .~ 4.2 ~ 4 ., .~ 3.8 -e 3.6 8 3.4 rJ) 3.2
···············1 •••• · •••• · •••••••• m •••• • •••• • ••• ::l-· .......... : .... ;]: ••••••••... 3f---------..,f----------+---------!
NR PhasE: NBR Phase
10 90
50 50
90 10
% Carbon black
Fig. 5.30 Influence of location of carbon black on the scorch time of filled (20 phr, N660) masterbatch blends
169

11
:? 10.5 E ~ 10 Q)
E :;:; 9.5
~===~_ .• -••.•• --J.r-...... -....... -....... -...... -.... --J;I~' ~ ::J
9 0 ':!? 0
8.5 0 m
8+--------+--------+---------1 NR Phase
NBR Phase 10 90
50 50
% Carbon black
90 10
Fig. 5.31 Influence of location of carbon black on the 90% cure time of filled (20 phr. N660) masterbatch blends
24
22 X Q) 20 'C .=
18 Q) -ca 16 a::
~ 14 ::J
0 12
10 NR Phase
NBR Phase
mmm •••••• r •• · •• ·•····· .. m ... m.mml··· .~~
10 90
50 50
% Carbon black
90 10
Fig. 5.32 Influence of location of carbon black on the Cure Rate Index of filled (20 phr. N660) masterbatch blends
170

1.65.,----------------, E z 1.6 ~
~ 1.55 e-o 1.5 -~ 1.45
~ 1.4 ::a: 1.35
l=='''~'''''' --Q-= i=" ...... = .................... ='1' .............................. " .............. " ...... ..
~ 1.3 +-----+-----+-----1 NR Phase
NBR Phase 10 90
50 50
% Carbon black
90 10
Fig. 5.33 Influence of location of carbon black on the (Max.-Min.) torque of filled (20 phr, N660)
masterbatch blends
No significant difference is observed between the cure characteristics of these blends
prepared by varying the proportion of carbon black in the individual rubber phases,
despite the difference in morphology. This implies that the location of carbon black
within the blend rubber phases does not significantly influence the cure characteristics
of masterbatch blends.
171

5.5.3 PHYSICAL PROPERTIES OF NR AND NBR BLENDS
An elastomer blend can exhibit unique physical properties instead of an averaging of
the properties of the individual elastomers in the blend. From a practical point of view,
elastomer blends are studied to obtain novel property combinations from mixtures of
elastomers with contrasting physical properties such as NR and NBR. The physical
properties of the NRlNBR blends were therefore evaluated. The effect of mixing
conditions and location of carbon black on properties ofNRINBR blends were studied.
An attempt has been made to relate the variations in physical properties of the single
stage blends as well as the masterbatch blends to the rheology, morphology and carbon
black distribution.
A comparison of physical properties of single-stage blends with those of masterbatch
blends was also conducted in order to determine the best blending technique with
regard to each of the properties. Physical properties of both the types of blends were
also compared with those of single e1astomer compounds, especially NBR compounds
in order to determine the suitability of NRlNBR blends as replacements for NBR
compounds, which is the overall objective of this research project.
(1) MODULUS
(a) Effect of Mixing Conditions on the Moduli of Single-stage Blends
Figures 5.34 and 5.35 show the variation in modulus at 100% and 300% elongation of
the single-stage blends (Sections 4.2.2-1, 4.5.1 and 4.5.2) obtained using the
Hounsfield tensile testing machine (Section 4.4.6(1». It is clear from these figures that
there is no significant difference between the moduli values of the four blends. In
general, modulus is strongly affected by the crosslink density. Hence, the results imply
that the overall crosslink density of the four blends is almost similar, since the
distribution of carbon black is the same for all four blends (see Sections 5.5.1 (A) and
(B» and agrees with the results of (Max.-Min.) torque (see Section 5.5.2 (A». In
other words, the rotor speed and initial temperature of NBR do not exert a significant
effect on the moduli and hence the overall crosslink density of single-stage blends. The
results also imply that the moduli and hence the overall crosslink density of single
stage blends are not affected by the morphology as well. The former agrees with the work of several researchers(4,8,]S,35).
172

3.5 ~ 3.3 '" n.
3.1 :2 ~
2.9 ;f!. 0 2.7 0
2.5 ~ - 2.3 '" (/) 2.1 :J
:; 1.9 "0
0 1.7 :2 1.5
S20T20
I -I
S20T85
'r ............. 1
S60T20
Compound No.
.! ••• : .•••.....
S60T85
Fig. 5.34 Influence of mixing conditions on the modulus at 100% of filled (20 phr, N660) single-stage blends
16r-----------------------------,
C? 14 n. e #. 12 o g 10
"'1 ······1 .. ····"· .
(/) 8 ........................... . :J :; "8 6 ......................................................................................................... . :2
4~------r------+------~------4 S20T20 S20T85 S60T20 S60T85
Compound No.
Fig. 5.35 Influence of mixing conditions on the modulus at 300% of filled (20 phr, N660) single-stage blends
A comparison between moduli (100% and 300%) of the single-stage blends
(Sections 4.2.2-1, 4.5.1 and 4.5.2), masterbatch blends (Sections 4.2.2-2, 4.6.1 and
4.6.2) and single elastomer compounds (Sections 4.2.2-3,4.7.1 and 4.7.2), obtained
using the Hounsfield tensile testing machine (Section 4.4.6(1» is shown in Figures
5.36 and 5.37 respectively. It is not possible to compare the moduli or many of the
other physical properties of the single-stage blends with those of masterbatch blends,
since properties vary greatly with total mixing time(26) At 300% elongation, the single
stage blends, especially the fine textured blends, have a higher modulus than the
control NBR (26.6% ACN) compound, whilst at 100% elongation the modulus of the
fine textured single-stage blends is only slightly lower than that of the control NBR
compound.
173

It is evident from literature(36) that hardness, which is related to the modulus at low
strain, increases with increasing the acrylonitrile content of NBR. Hence, a low
modulus for the control NBR (26% ACN) compound in comparison to that of the
NBR (45% ACN) compound is to be expected.
4.-------------------------~
3.5 o ~
;j< tU 3 oa. 0::;;; ~~
10 " 2.5 I/)~ :::J tU 2 :; g' -g 0
::;;; Cii 1.5
1 o
A"edK:ted C;:i;;ti:or---.-_ ft'
~ge--------~ Mlsterbatch
20 40 60 80 100
Weight % NR in blend
Fig. 5.36 Effect of blending conditions on the 100% modulus offilled (20 phr, N660) NRlNBR blends
16 " 0 15 "" tU 14 Cl .. Mlsterbatch
" 0 13 Cii
12 ~~ o to
• Centrol
.520120
• 520T85
0560120
oS60T85
.. NR10NBR90
ANRSONBRSO
" NR90NBR10
oa. ~~
11 A"edK:ted "'-.. • Single-stage
------------.. •
• Centrol
.520120
• 520T85
0560120
o 560T85 -tU If) :::J :; ." 0 ::;;;
10 Centrol 9 8 7 6
0 20
A Mlsterbatch
40 60
Weight % NR in blend
80 100
.. NR10NBR90
ANRSONBRSO
" NR90NBR10
Fig. 5.37 Effect of blending conditions on the 300% modulus of filled (20 phr, N660) NRlNBR blends
174

(b) Effect ofLocation of Carbon Black on the Moduli of Masterbatch Blends
The variation in moduli (100% and 300%) of the three masterbatch blends (Sections
4.2.2-2, 4.6.1 and 4.6.2), obtained using the Hounsfield tensile testing machine
(Section 4.4.6(1» is shown in Figures 5.38 and 5.39 respectively.
3.5,--------------,
~ 'C1i' 3 00.. 0:2 :: ~ 2.5 '" 0 fI) ._
..2'CU 2 " Cl u <: 00 :2 Qi 1.5
1+-------+-------+-----~ NR Phase
NBR Phase 10 90
50 50
90 10
% Carbon black
Fig. 5.38 Influence of location of carbon black on the 100% modulus of filled (20 phr, N660) masterbatch
blends
<: o
20~--------------------------,
~ 18 Cl § 16 Qi ... 0 _ 14 0- '" g ~ 12 ... -- 10 '"
8
~=-~":-=~~~~~ 6
4+--------+--------+-------~
NR Phase NBR Phase
10 90
50 50
% Carbon Black
90 10
Fig. 5.39 Influence of location of carbon black on the 300% modulus of filled (20 phr, N660) masterbatch
blends
A significant feature from Figures 5.36 and 5.37 is that the modulus (or stiffness) of
the NBR compound is higher than that of the NR compound (both filled with 20 phr
carbon black as in the case of the blends) at low strain (100%). At higher strain
(300%) the difference is not significant, most probably due to the ability of NR to
exhibit reinforcement by crystallisation under strain (a self-reinforcing property) in
addition to reinforcement caused by carbon black. Thus the results imply that NBR
(45% ACN) vulcanisates formulated with carbon black have a modulus which is higher
175
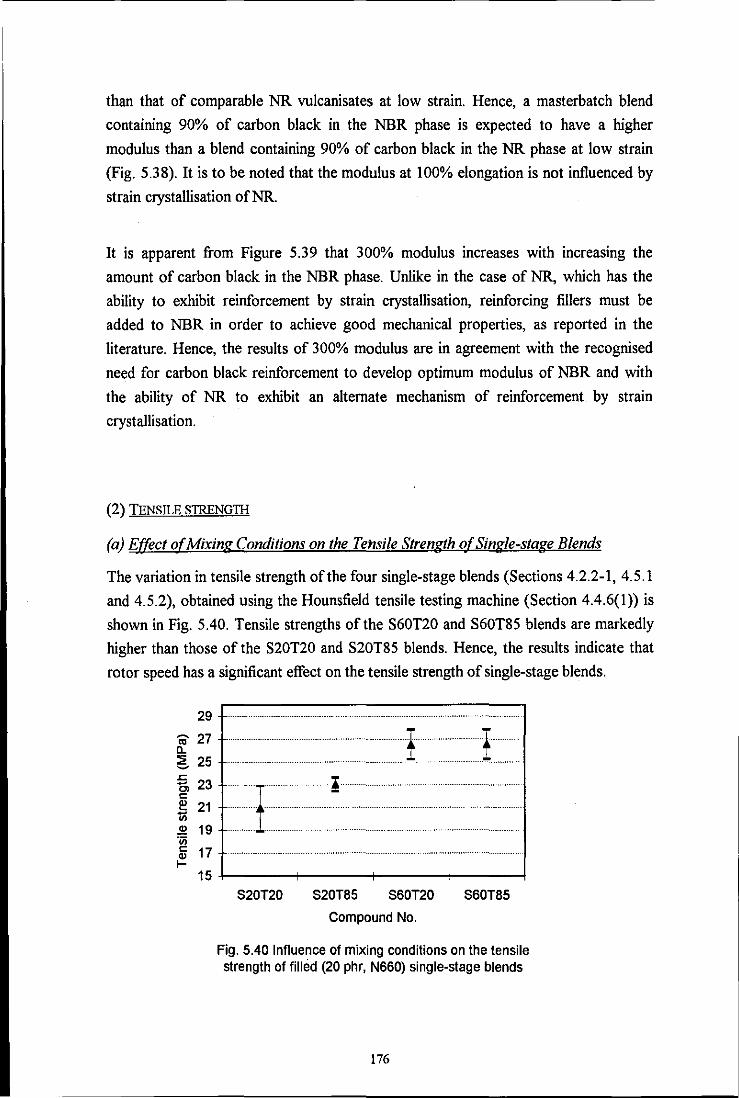
than that of comparable NR vulcanisates at low strain. Hence, a masterbatch blend
containing 90% of carbon black in the NBR phase is expected to have a higher
modulus than a blend containing 90% of carbon black in the NR phase at low strain
(Fig. 5.38). It is to be noted that the modulus at 100% elongation is not influenced by
strain crystallisation ofNR.
It is apparent from Figure 5.39 that 300% modulus increases with increasing the
amount of carbon black in the NBR phase. Unlike in the case of NR, which has the
ability to exhibit reinforcement by strain crystallisation, reinforcing fillers must be
added to NBR in order to achieve good mechanical properties, as reported in the
literature. Hence, the results of 300% modulus are in agreement with the recognised
need for carbon black reinforcement to develop optimum modulus of NBR and with
the ability of NR to exhibit an alternate mechanism of reinforcement by strain
crystallisation.
(2)TENS~ESTRENGTH
(a) Effect of Mixing Conditions on the Tensile Strength of Single-stage Blends
The variation in tensile strength of the four single-stage blends (Sections 4.2.2-1,4.5.1
and 4.5.2), obtained using the Hounsfield tensile testing machine (Section 4.4.6(1» is
shown in Fig. 5.40. Tensile strengths of the S60T20 and S60T85 blends are markedly
higher than those of the S20T20 and S20T85 blends. Hence, the results indicate that
rotor speed has a significant effect on the tensile strength of single-stage blends.
29
., 27··· 0.. 5 25 .................................. .
15+-------+-------+-------r-----~
S20T20 S20T85 S60T20 S60T85
Compound No.
Fig. 5.40 Influence of mixing conditions on the tensile strength of filled (20 phr, N660) single-stage blends
176

Higher tensile strengths of the S60T20 and S60T85 blends over those of the S20T20
and S20T85 blends may be ascribed to the finer morphology (see Section 5.3.1 (B) ).
Generally the size of the dispersed discrete phase influences strength properties. The
finer the morphology, i.e. the smaller the discrete phase size, the higher the tensile
strength of unfilled blends(15). Since the distribution of carbon black between the
phases is similar for all the four single-stage blends (see Section 5.5.1), it will not exert
a significant effect on the strength properties.
Tensile failure is believed to be due initiation of a crack followed by its propagation. A
crack is known to initiate from points of weakness as stresses concentrate in these
regions. Since S20T20 and S20T85 blends are more heterogeneous than S60T20 and
S60T85 blends there are regions where the stresses can concentrate easily, especially
near the edges of the sample. In other words large domains will act as stress raisers
and increase the applied stress thereby favouring crack initiation.
Size of the domains (or the number of domains present) can also influence crack
propagation, Since the interfacial crosslinking in the single-stage blends is expected to
be weak, a crack that has propagated to the interface between the continuous and the
dispersed phase will be deviated without tearing through the dispersed phase as
postulated by Hamed(37). The deviated crack may propagate around the domain
interface or tear through the continuous phase in a distorted direction until it meets
another domain of the dispersed phase. The strength of a blend increases with
increasing crack deviation, which increases with increasing interfacial area or with
decreasing domain size. Since the crack travels from one domain to another, the
amount of reinforcement depends on the number of domains present. For a given
composition as the domain size decreases, the number of domains increases. Hence the
number of domains in the S60T20 and S60T85 blends (domain size is approx.
3-5 J.lm) is greater than that of the S20T20 and S20T85 blends (domain size is approx.
9-14 J.lm). This results in a higher reinforcement and thus a higher tensile strength for
the former blends.
The domain spacing of the S60T20 and S60T85 blends is smaller than that of the
S20T20 and S20T85 blends (see Figures 5.10 (A)-(D) of Section 5.3.1 (B». Thus in
the case of the latter blends, a crack can propagate more easily through the blend
without interference from many dispersed domains than in the case of the former
blends, causing a lower value for the tensile strength as shown in Fig. 5.40.
177

The effect of rotor speed on tensile strength is not in agreement with the work of
Ahmad and Wheelans(l5). In this current work on carbon black filled NRlNBR blends,
higher internal mixer rotor speeds gave better tensile strength, whereas in Ahmad and
Wheelans work on unfilled NRlNBR blends, the highest rotor speed caused the worst
tensile strength. This discrepancy implies that the variation in tensile strength of
NRlNBR blends with rotor speed is greatly influenced by the presence of carbon black.
It is interesting to note that the tensile strength of the S60T20 and S60T85 blends is
about 6MPa higher than that of the comparable blend (40:60 NRlNBR, at 20 phr
carbon black loading) prepared by Baker et al. (38) 100% modulus of the four NRlNBR
blends is also about 1.5 MPa higher than that of the comparable blend of Baker et al.
This increase in the tensile strength as well as the 100% modulus of the single-stage
blends over that of the comparable blend of Baker et al. may be associated with the
finer morphology of the former blends.
A comparison between tensile strength of the single-stage blends (Sections 4.2.2-1,
4.5.1 and 4.5.2), masterbatch blends (Sections 4.2.2-2, 4.6.1 and 4.6.2) and single
elastomer compounds (Sections 4.2.2-3, 4.7.1 and 4.7.2), obtained using the
Hounsfield tensile testing machine (Section 4.4.6(1» is shown in Fig. 5.41.
35
~ 30 Control tU i Masterbatch • Control a. <> .S20T20 ~ 25 Predicted Single-stage
.S20T85 .<:: .~~ . 0, 20 f--- I oS60T20 c: Q) ~ 15 oS60T85 1i) Q) ... NR10NBR90 ~ 10 c: A NR50NBR50 Q)
I- 5 A NROONBR10
0 0 20 40 60 80 100
Weight % NR in blend
Fig. 5.41 Effect of blending conditions on the tensile strength of filled (20 phr, N660) NRlNBR blends
Tensile strength of the NR compound is higher than that of the NBR (45% ACN)
compound (both filled with 20 phr carbon black) and hence is in accord with the
published ratings(39) An interesting observation from this figure is that the tensile
strength of the fine textured single-stage blends is about 5 MPa higher than the
predicted. Also, the fine textured single-stage blends show a positive synergism of
tensile strength.
178

(b) E(fect ofLocation of Carbon Black on the Tensile Strength of Master batch Blend~
Fig. 5.42 shows the variation in tensile strength of the masterbatch blends (Sections
4.2.2-2,4.6.1 and 4.6.2), obtained from the Hounsfield tensile testing machine (Section
4.4.6(1». In contrast to the results of moduli, the NR90NBRI0 blend shows a higher
tensile strength than the NRI0NBR90 blend. However, there is no significant
difference between the tensile strength values of NR90NBRI0 and NR50NBR50
blends, which is in agreement with the morphological observations. The significantly
lower tensile strength obtained for the NRI0NBR90 blend in comparison to the other
two blends can be attributed mainly to its coarse textured morphology (larger domain
size) as described in Section 5.5.3 (2)-(a). Thus for tensile strength, morphology has a
dominant effect over carbon black distribution.
40,---------------------------, ~
~ 35 6 .s:: 30 c;, ~ 25 1i) ~ 20 'iii lii 15 I-
10~------~--------_+--------~
NR Phase NBR Phase
10 90
50 50
% Carbon black
90 10
Fig. 5.42 Influence of location of carbon black on the tensile strength of filled (20 phr, NeeO) masterbatch
blends
It is to be noted that the effect of mixing conditions and location of carbon black on
the elongation at break of the single-stage and masterbatch blends respectively have
not been discussed under Section 5.5.3, since the trend in the variation of elongation at
break is generally similar to that of tensile strength. The arguments put forward to
explain the variation in tensile strength are generally valid for elongaton at break.
179

(3) TEAR SlRENGTII
(a) Effect of Mixing Conditions on the Tear Strength of Single-stage Blends
Measurement of tear strength using angle test pieces is a combination of tear initiation
and propagation. In this case, the overall force needed to rupture the test piece is
measured and cannot be separated into the two components producing initiation and
propagation (BS 903: Part A3 (1982» It appears from Fig. 5.43 that differences in
domain size produced by varying rotor speed do not exert a significant effect on the
overall force needed to rupture the test piece and hence on tear strength. This is
probably due to similar viscoelastic losses as all four blends exhibit high-carbon black
NBR three dimensional mesh configurations. As reported by Hess and Chirico(40) for
NRlSBR blends, these high-carbon black-NBR three dimensional mesh configurations
also exhibit high values for tear strength due to the ability to divert the rupture path
and dissipate energy along the zone boundaries.
38
37 ~
E 36 -~ 35 ~
rm 1-:--:Ll::=t· .<:: -Cl
c: ~ 1ii ~
'" Q)
t-
34 33
32
31
30 29
S20T20 S20T85 S60T20 S60T85
Compound No.
Fig. 5.43 Influence of mixing conditions on the tear strength of filled (20 phr, N660) single-stage blends
Fig. 5.44 shows a comparison between the tear strength of single-stage blends
(Sections 4.2.2-1,4.5.1 and 4.5.2), masterbatch blends (Sections 4.2.2-2,4.6.1 and
4.6.2) and single elastomer compounds (Sections 4.2.2-3, 4.7.1 and 4.7.2), obtained
using the Hounsfield tensile testing machine (Section 4.4.6(2». It is clear from this
figure that the single-stage blends are superior in tear strength to the masterbatch
blends. Literature(26) indicates that tear strength is quite insensitive to mixing time.
However the single-stage blends show markedly higher tear strengths than the
NR90NBRI0 masterbatch blend. This may be due to the high-carbon black-NBR three
180

dimensional mesh configurations exhibited by all the four blends. Also, the tear
strength of the single-stage blends is closer to that of the NR I ONBR90 blend than to
the NR90NBR I 0 blend. This indicates that most of the carbon black is in the NBR
phase of the single-stage blends. It is also apparent from this figure that the tear
strength of these blends is lower than "predicted", but is independent of morphology.
This is attributed tentatively to weak interfacial cross-linking between the two phases
NR and NBR, as a crack that has propagated to the interface would continue its
propagation easily through the weak interface.
45.---------------------------,
:€ 40
~ ?; 35 -Cl C
~ 30 -'" ~ 25
----' A'edicted ~, __
~----coiil,";;, R Single-stage
Masterbatch
20+-----r---~----_+----~--~
• Control
• S20120
o S20T85
oS60T20
() S60T85
& NR10NBR90
11 NR50NBRSO
11 NR90NBR10
o 20 40 60 80 100 Weight % NR in blend
Fig. 5.44 Effect of blending conditions on the tear strength offilled (20 phr, N660) NRlNBR blends
It is interesting to note that the tear strength of single-stage blends is almost similar to
the two 100% NBR compounds.
(b) Effect ofLocation of Carbon Black on the Tear Strength of Master batch Blends
Fig. 5.45 shows the variation in tear strength of the three masterbatch blends (Sections
4.2.2-2, 4.6.1 and 4.6.2), obtained using the Hounsfield tensile testing machine
(Section 4.4.6(2». Tear strength is highest with 90% of the carbon black in the NBR
phase and lowest with 90% of the carbon black in the NR phase. However the tear
strength of the NRIONBR90 blend is not significantly different from that of the
NR50NBR50 blend, despite the large difference in morphology (see Section 5.3.2).
This indicates that the tear strength of NRlNBR masterbatch blends is not significantly
affected by morphology as in the case of single-stage blends.
ISI

40 ~
E - 35 z .>< ~
.<: - 30 Cl c: e! 1ii ~ 25 tU ., I-
20 NR Phase 10
90 50 50
90 10 NBR Phase
% Carbon black
Fig. 5.45 Influence of location of carbon black on the tear strength of filled (20 phr, N660) masterbatch
blends
Higher tear strength of the NRIONBR90 blend in comparison to the NR90NBRIO
blend is in agreement with the necessity for carbon black reinforcement to develop
optimum tear strength ofNBR and the ability ofNR to exhibit an alternate mechanism
of reinforcement by strain crystallisation.
(4) HARDNESS
(a) Effect of Mixing Conditions on the Hardness of Single-stage Blends
Although there was no significant difference between the modulus values of the single
stage blends at low strain (which is related to hardness), the rotor speed has a small
effect on the hardness (Shore A) of the single-stage blends (Fig. 5.46). This may not be
of practical importance, even though the error bars show that it is significant.
64~------------------------~
:? 63
~ 62 .<:
!2 61 :a ., ~ 60 tU :c 59
.....• . ....................•....
··············I········ ···················I···· ................................. .
58~-----r------~-----r----~ S20T20 S20T85 S60T20 S60T85
Compound No.
Fig. 5.46 Influence of mixing conditions on the hardness (Shore A) of filled (20 phr, N660) single-stage blends
182
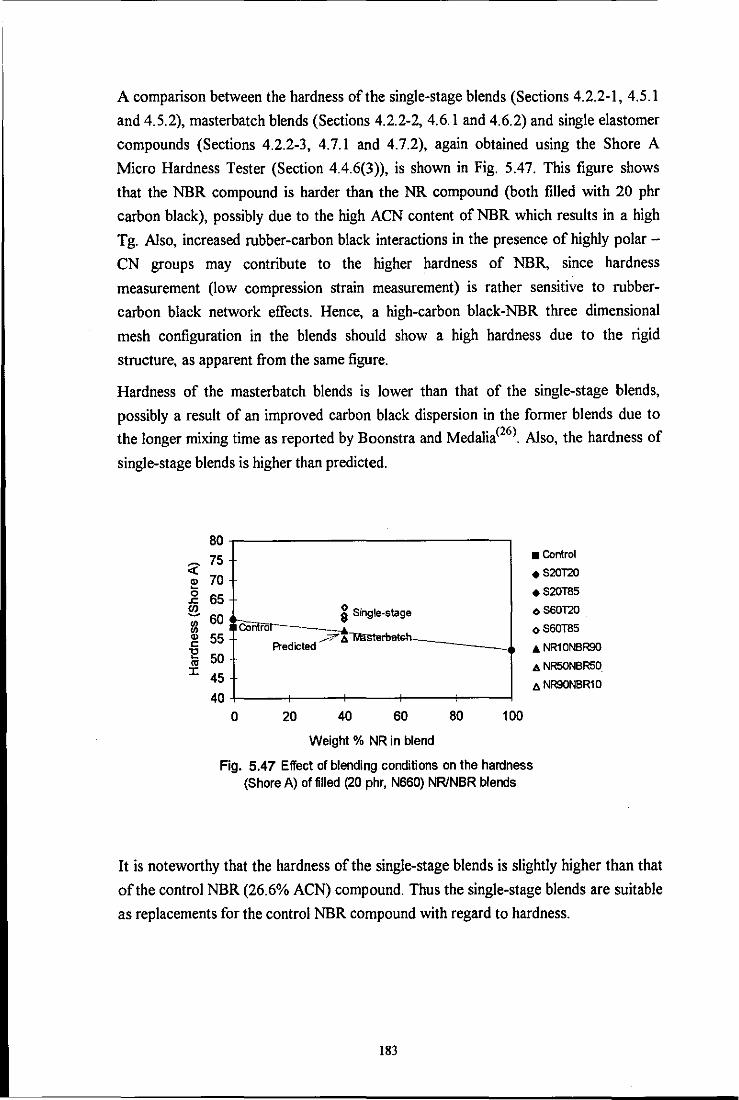
A comparison between the hardness of the single-stage blends (Sections 4.2.2-1, 4.5.1
and 4.5.2), masterbatch blends (Sections 4.2.2-2, 4.6.1 and 4.6.2) and single elastomer
compounds (Sections 4.2.2-3, 4.7.1 and 4.7.2), again obtained using the Shore A
Micro Hardness Tester (Section 4.4.6(3», is shown in Fig. 5.47. This figure shows
that the NBR compound is harder than the NR compound (both filled with 20 phr
carbon black), possibly due to the high ACN content of NBR which results in a high
Tg. Also, increased rubber-carbon black interactions in the presence of highly polar -
eN groups may contribute to the higher hardness of NBR, since hardness
measurement (low compression strain measurement) is rather sensitive to rubber
carbon black network effects. Hence, a high-carbon black-NBR three dimensional
mesh configuration in the blends should show a high hardness due to the rigid
structure, as apparent from the same figure.
Hardness of the masterbatch blends is lower than that of the single-stage blends,
possibly a result of an improved carbon black dispersion in the former blends due to
the longer mixing time as reported by Boonstra and Medalia(26) Also, the hardness of
single-stage blends is higher than predicted.
«" ~ 0
.s:;
~ !Z " " "E '" J:
80 75 70 65
60 55
50 45
40 0
~ Single-stage COilffat--_:::-A
/?' 6 MlstElbatcn_ A-edicted
20 40 60
Weight % NR in blend
80 100
• Control
.S20120
.S2OT85
<> S60120
<> S60T85
.. NR10NBR90
I!. NR50NBR50.
t. NR90NBR10
Fig. 5.47 Effect of blending conditions on the hardness (Shore A) of filled (20 phr, N660) NRlNBR blends
It is noteworthy that the hardness of the single-stage blends is slightly higher than that
of the control NBR (26.6% ACN) compound. Thus the single-stage blends are suitable
as replacements for the control NBR compound with regard to hardness.
183

(b) Effect ofLocation of Carbon Black on the Hardness of Master batch Blendy
The variation in hardness (Shore A) of the masterbatch blends (Sections 4.2.2-2, 4.6.1
and 4.6.2) is shown in Fig. 5.48. This comparison shows clearly that the NRlONBR90
blend has a higher hardness than the other two masterbatch blends, in accord with the
moduli values. The high hardness of the NRI0NBR90 blend can be ascribed to the
rigid structure inherited through the high-carbon black-NBR three dimensional mesh
configuration, as in the case of the single-stage blends. However, no significant
difference is observed between the hardness values of the NR90NBRI0 and
NR50NBR50 blends. Hence the results suggest that the hardness of masterbatch
blends is affected by carbon black distribution via morphology.
59
Z 58 ~
57 0 .<:: en ~ 56 Cl) Cl) Q)
55 c: t! to 54 J:
53
NR Phase NBR Phase
10 90
............................•.••...••. '0. -----1;1;1; I
50 50
% Carbon black
90 10
Fig. 5.48 Innuence of location of carbon black on the hardness (Shore A) of filled (20 phr, N660)
masterbatch blends
(5) ABRASION RESISTANCE
(a) Effect of Mixing Conditions on the Abrasion Resistance of Single-stage BlendY
Fig. 5.49 (a) and (b) show the variation in abrasion resistance of the four single-stage
blends (Sections 4.2.2-1, 4.5.1 and 4.5.2), obtained using the Akron and DIN abraders
(Section 4.4.6(5» respectively. It appears from Fig. 5.49 (a) and (b) that the abrasion
resistance of the S20T20 blend is much higher than the others. The lowest abrasion
resistance is shown by the S60T20 blend. The abrasion resistance of the S20T20 and
S20T85 blends can be regarded as higher than that of the S60T20 and S60T85 blends.
This implies that the abrasion resistance is influenced by rotor speed via the effect of
morphology. S60T20 and S60T85 blends show higher extensibilities than S20T20 and
S20T85 blends (Section 5.5.3 (2) (a». Hence abrasion by rol\ formation which is the
184

mechanism of abrasion in filled compounds( 41) would be easier in the former blends
thereby increasing abrasion.
0.3 -.-----------------,
~ ~ 0.25
Ea> ~ 0.2 :J 0 0 0 > 0 0.15 ~ c: _
.~ ME 0.1 '" <) ~ ~ 0.05
~ " .: !'l c:
'" US 'iij Q)
0:: c: 0 'iij
~ .c «
0+----+------+---+------4
S20T20 S20T85 S60T20 S60T85 Compound No.
Fig. 5.49 (a) Influence of mixing conditions on the abrasion resistance (Akron) of filled (20 phr, N660) single
stage blends
85
80
75
70
65
60
55
50
45
1 ...................... - .-.. -.. -.-.. _._._"-." ................................. _ ... ..
......................................................... -.. ".-.... •
························1 ········1
S20T20 S20T85 S60T20 S60T85 Compound No.
Fig. 5.49 (b) Influence of mixing conditions on the abrasion resistance (DIN) of filled (20 phr, N660)
single-stage blends
The Schallamach abrasion pattern(42) of the S20T20 and S60T20 blends (Sections
4.2.2-1,4.5.1 and 4.5.2) obtained from the scanning electron microscope is shown in
Fig. 5.50 (A) and (B) respectively. In both the blends ridges were perpendicular to the
direction of abrasion, which indicates that the mechanism of abrasion is the frictional
mechanism. It can be seen from these micrographs that the intensity of the abrasion
pattern is greater in the S60T20 blend in comparison to the S20T20 blend. Hence, the
micrographs indicate that the abrasion resistance of the former is lower than that of the
latter as the abrasion pattern is generally very shallow in long wearing compounds. It is
also observed that the spacing between the ridges is greater in the S60T20 blend than
in the S20T20 blend. This also implies that the abradability of the former is higher than
185

that of the latter. Thus, the abrasion patterns corresponding to the S20T20 and
S60T20 blends are in agreement with the abrasion results obtained from DIN and
Akron abrasion tests.
Fig. 5.50 (A) Scanning electron micrograph showing the abrasion pattern of the filled
(20 phr, N660) S20T20 single-stage blend, Magnification 18.5 times
Fig. 5.50 (B) Scanning electron micrograph showing the abrasion pattern of the filled
(20 phr, N660) S60T20 single-stage blend, Magnification 18.5 times
186
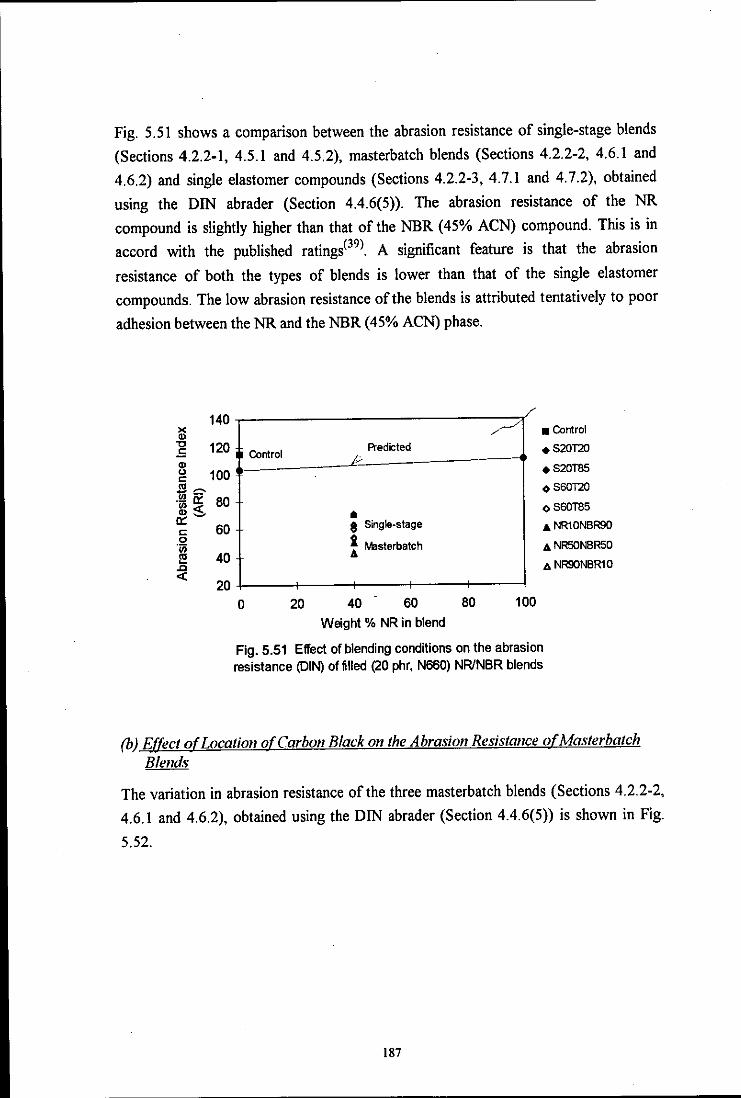
Fig. 5.51 shows a comparison between the abrasion resistance of single-stage blends
(Sections 4.2.2-1,4.5.1 and 4.5.2), masterbatch blends (Sections 4.2.2-2,4.6.1 and
4.6.2) and single elastomer compounds (Sections 4.2.2-3, 4.7.1 and 4.7.2), obtained
using the DIN abrader (Section 4.4.6(5». The abrasion resistance of the NR
compound is slightly higher than that of the NBR (45% ACN) compound. This is in
accord with the published ratings(39). A significant feature is that the abrasion
resistance of both the types of blends is lower than that of the single elastomer
compounds. The low abrasion resistance of the blends is attributed tentatively to poor
adhesion between the NR and the NBR (45% ACN) phase.
140 >< " "C 120 .5 Cl> <.) 100 c: "'~ ~a: 60 "'« ~~
60 c: .~
'" 40 ~
.0 « 20
Control
0 20
A'edicted k
III 8 Single-stage
~ Mlsterbatch
40 60 Weight % NR in blend
60 100
• Control
.5201'20
• 520T85
<) 560120
<> 560T85
~NR10NBR90
ANRSONBRSO
ANR90NBR10
Fig.5.51 Effect of blending conditions on the abrasion resistance (DIN) of filled (20 phr, N660) NRlNBR blends
(b) Effect of Location of Carbon Black on the Abrasion Resistance of Master batch Blends
The variation in abrasion resistance of the three masterbatch blends (Sections 4.2.2-2,
4.6.1 and 4.6.2), obtained using the DIN abrader (Section 4.4.6(5» is shown in Fig.
5.52.
187
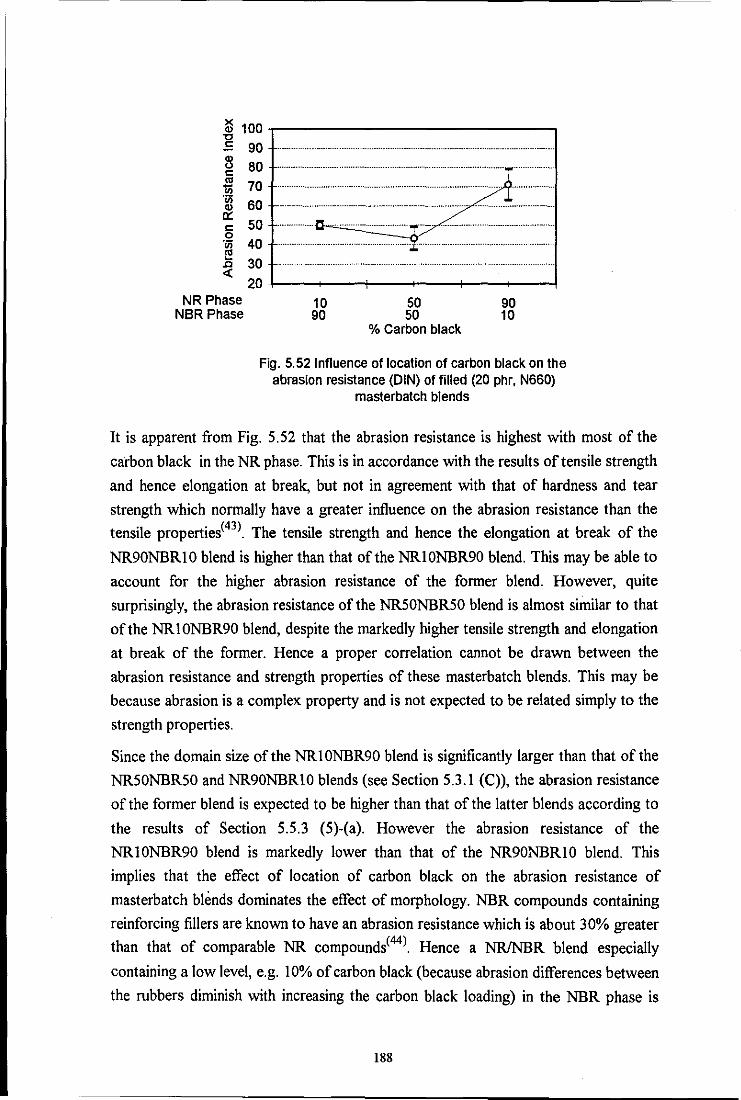
x 100 Q) "C .5 Q) C,) c: '" ii) 'ii) Q)
a: c: 0 'ii)
~ ~ «
NR Phase NBR Phase
90
80
70
60
50
40
30
20
10 90
50 50
% Carbon black
90 10
Fig. 5.52 Influence of location of carbon black on the abrasion resistance (DIN) of filled (20 phr, N660)
masterbatch blends
It is apparent from Fig. 5.52 that the abrasion resistance is highest with most of the
carbon black in the NR phase. This is in accordance with the results of tensile strength
and hence elongation at break, but not in agreement with that of hardness and tear
strength which normally have a greater influence on the abrasion resistance than the
tensile properties(43) The tensile strength and hence the elongation at break of the
NR90NBRI0 blend is higher than that of the NRI0NBR90 blend. This may be able to
account for the higher abrasion resistance of the former blend. However, quite
surprisingly. the abrasion resistance of the NR50NBR50 blend is almost similar to that
of the NR 1 ONBR90 blend, despite the markedly higher tensile strength and elongation
at break of the former. Hence a proper correlation cannot be drawn between the
abrasion resistance and strength properties of these masterbatch blends. This may be
because abrasion is a complex property and is not expected to be related simply to the
strength properties.
Since the domain size of the NRI0NBR90 blend is significantly larger than that of the
NR50NBR50 and NR90NBRI0 blends (see Section 5.3.1 (C», the abrasion resistance
of the former blend is expected to be higher than that of the latter blends according to
the results of Section 5.5.3 (5)-(a). However the abrasion resistance of the
NRI0NBR90 blend is markedly lower than that of the NR90NBRI0 blend. This
implies that the effect of location of carbon black on the abrasion resistance of
masterbatch blends dominates the effect of morphology. NBR compounds containing
reinforcing fillers are known to have an abrasion resistance which is about 30% greater
than that of comparable NR compounds(44). Hence a NRlNBR blend especially
containing a low level, e.g. 10% of carbon black (because abrasion differences between
the rubbers diminish with increasing the carbon black loading) in the NBR phase is
188

expected to have a higher abrasion resistance than a blend containing the same amount
of carbon black in the NR phase, which agrees with the results.
(6) COMPRESSION SET
(aJ Effect of Mixing Conditions on the Compression Set of Single-stage Blends
Elasticity is an important property for the majority of rubber products, especially in
fluid sealing applications. Compression set is still the most widely used test to measure
this property. In many oil seal applications, low compression set is equal in importance
to swelling resistance. Compression set measures the ability of a rubber vulcanisate to
accomodate the displacement of seal faces. Thus it is necessary to aim at minimising
compression set of NRlNBR blend compounds, so that they can be used in the
manufacture of sealing products.
Fig. 5.53 shows the variation in compression set of the four single-stage blends
(Sections 4.2.2-1, 4.5.1 and 4.5.2), obtained using the compression set apparatus
(Section 4.4.6(4» at room temperature.
14 13
~ 0 12 - 11 Q)
en 10 c: 0 9 'ill 8 I!! a. 7 E 6 0 0 5
4
................... ! ··l
S20T20 S20T85 S60T20 S60T85 Compound No.
Fig. 5.53 Influence of mixing conditions on the compression set of filled (20 phr. N660) single-stage
blends at room temperature
It is difficult to conclude from Fig. 5.53, whether the rotor speed, which significantly
influences morphology (as reported in Section 5.3.1 (8» and initial NBR temperature
have any influence on the compression set. However, the results of elevated
temperature (70°C) measurements clearly indicate that the rotor speed exerts a
marked effect on the compression set of single-stage blends, whereas the effect due to
the initial NBR temperature is negligible (Fig. 5.54). It is known that at elevated
temperatures, compression set measurements can be used as an indication of the
cross-link density(45) However, EV systems have a good resistance to heat ageing due
to the presence of more monosulphide cross-links. The results of the elevated
189

temperature measurements indicate that the elasticity of the S60T20 and S60T85
blends is higher than that of the S20T20 and S20T85 blends. This is probably due to
the difference in morphology, since results of moduli and cure analysis showed that
there is no significant difference between the overall cross-link density of the four
single-stage blends.
~ 0 -Q) Cl)
c: 0 ·in Cl)
~ c. E 0 t)
35r---------------------------~
30
25
20
15
10
···········1
............................................ I .................. -...................................................... _ .... -. -_ ... _._._ .... _ .... . I .··········-1
S20T20 S20T85 S60T20 S60T85 Compound No.
Fig. 5.54 Influence of mixing conditions on the compression set of filled (20 phr. N660)
single-stage blends at 70°C
Baker et al.(38) reported that filled, sulphur cured 40/60 NRlNBR blends with low
hardness give poorer compression set at 70°C than those with high hardness. The
results in Fig. 5.54 are in general agreement with the hardness results in Fig. 5.46.
However Baker et al. did not assign any reason for this effect.
Figures 5.55 and 5.56 show a comparison between the compression set of single-stage
blends (Sections 4.2.2-1, 4.5.1 and 4.5.2), masterbatch blends (Sections 4.2.2-2,4.6.1
and 4.6.2) and single elastomer compounds (Sections 4.2.2-3, 4.7.1 and 4.7.2),
obtained using the compression set apparatus (Section 4.4.6(4)) at room temperature
and 70·C respectively. Although literature indicates that the compression set of NBR
vulcanisates is generally good, the results of this current work show that the
compression set of the NBR (45% ACN) compound is greater than that of the NR
compound. This may be associated with the presence of a greater proportion of
acrylonitrile in NBR, since the compression set generally deteriorates with increasing
the proportion of acrylonitrile in NBR. The improvement in compression set of the
NBR (45% ACN) compound over that of the control NBR compound may be due to
the higher curing temperature(46) and/or higher hardness (or 100% modulus).
190

25 • Control
~ 0 - 20 .520120 ID Cl> .520T85 c: 15 Control 0 .560120 .~
6 ,i? A'edicted <> 560185 l!! 10 a. <> 5ingle-slage ~ NR10NBR90 E A Maslerbatch 0 5 ~ NR50NBR50 U
b. NR9ONBR10
0 0 10 20 30 40 50 60 70 80 90 10c..
Weight % NR in blend
Fig. 5.55 Effect of blending conditions on the compression set of filled (20 phr, N660) NRlNBR blends at room temperature
30,---------------------------,
25 Control
*' ]i 20 • Single-slage
<> c: o .~ 15 --------~
A'edicted % a Masterbatch ----
~ 10 o u 5
O+---~-----r----~----~--~ o 20 40 60 80 100
Weight % NR in blend
• Control
.5201'20
.520T85
.560120
<> 560185
~ NR10NBR90
... NR50NBR50
b. NR9ONBR10
Fig. 5.56 Effect of blending conditions on the compression set of filled (20 phr, N660) NRlNBR blends at 70"C
An interesting feature is that the compression set of both the types of blends at room
temperature is significantly lower than that of the control NBR (26.6% ACN)
compound. This is also apparent at 70°C, but less pronounced. The masterbatch blends
show a lower compression set than the single-stage blends, at room and at elevated
temperature. This is most probably a result of an improved carbon black dispersion in
the former blends due to the longer mixing time, as reported by Boonstra and Medalia(26).
Overall, the results suggest that the compression set of both the types of NRlNBR
blends is better than that of NBR compounds formulated specifically for applications
requiring good compression set characteristics such as oil seals, at normal as well as
elevated temperatures.
191

(b) E(fect ofLocation of Carbon Black on the Compression Set of Master batch Blends
Figures 5.57 and 5.58 show the variation in compression set of inasterbatch blends
(Sections 4.2.2-2, 4.6.1 and 4.6.2), obtained at room temperature and 70°C
respectively.
9~----------------------~ cf!. 8 _ .. , ...................... ~ ..... .
................. * ••.. - ................. _ ....... -•• -•• -._ ........ .
1;)
'" 7 c: o 'iJj 6 Q)
a 5 E
~~ 8 4
3-1------+----+-------l NR Phase
NBR Phase 10 90
50 50
90 10
% Carbon black
Fig. 5.57 Influence of location of carbon black on the compression set % of filled (20 phr, N660) masterbatch blends at room temperature
22~------------~
20 ':f!. o 18 1;)
~ 16 o 14 .~ 12 c. E 10 o () 8
6 -1-----+----+--------4 NR Phase 10
NBR Phase 90 50 50
% Carbon black
90 10
Fig. 5.58 Influence of location of carbon black on the compression set % of filled (20 phr, N660)
masterbatch blends at 70°C
It is apparent from both these figures that the compression set of the NR 1 ONBR90
blend is higher than that of the other two blends. At room temperature, the
compression set of the NR50NBR50 blend is significantly lower than that of the
NR90NBR 1 0 blend, whereas at 70°C, this difference in compression set is not so
significant. The lowest compression set shown by the NR50NBR50 blend suggests that
192

carbon black should be equally distributed between the phases in order to improve
compression set. This supports one of the requirements for minimising compression set
in single elastomer compounds proposed by Farid(45), i.e. a minimum amount of fillers.
It was reported in Section 5.3.2 that the morphological pattern of the NRSONBR50
blend is somewhat similar to that of the NR90NBRI0 blend, whilst the NRI0NBR90
blend shows a markedly different morphology. However, this trend cannot be clearly
seen from the compression set results and hence it is difficult to determine from these
results whether morphology has an effect on compression set.
5.5.4 SWELLING RESISTANCE IN ASTM OIL NO.2 AND TOLUENE
(a) Effect of Mixing Conditions on the Swelling Resistance of Single-stage Blends
Figures 5.59 and 5.60 show the variation in percentage swell (Section 4.4.7) of single
stage blends (Sections 4.2.2-1, 4.5.1 and 4.5.2) in ASTM oil No.2 and toluene
respectively. The former is a standard oil, whilst the latter is a standard fuel, used
generally in the assessment of oil and fuel resistance of a rubber compound
respectively. No significant difference is observed between the percentage oil swell of
the four single-stage blends in ASTM oil No.2. This implies that the overall crosslink
density of all the four single-stage blends (with similar carbon black distributions) is the
same, since degree of swelling mainly depends on the crosslink density. The results
also indicate that the morphology does not exert a significant effect on oil swelling.
5,---------------------------, #. 4.5 ~ 4 ~ 'Ui' 3.5 '0 gJ 3 NE ci >- 2.5 ze 2 :::; t- 1.5 ~ 1
·········1········· ........... -.. - . " .... .
.............. ,,' ... .
············ .. ···· .. ·1-· .................... -.* ...... " .. .
.. ··.·......................1·
0.5 +------+------+------+-------1 S20T20 S20T85 S60T20 S60T85
Compound No.
Fig. 5.59 Influence of mixing conditions on the percentage swell of filled (20 phr, N660) single
stage blends in ASTM Oil No.2 at 20°C
193

165,-------------------------~
160
155
~ 'Bj'150
~ E 145
~ ,e: 140
~ 135
1=-...... !_ ..........11 .. ·.m_ ...... .... ......... ................... ....._
········ •• ···· •• · ••• ·1
130
125+-----~------~------r-----~
S20T20 S20T85 S60T20 S60T85
Compound No.
Fig. 5.60 Influence of mixing conditions on the percentage swell of filled (20 phr, N660) single
stage blends in toluene at 20°C
As in the case of ASTM oil No.2, no significant difference in percentage toluene swell
is observed with differences in initial NBR temperature. The percentage toluene swell
of S20T20 blend is slightly lower than that of the S60T20 blend, whereas there is no
significant difference between the percentage toluene swell of S20T85 and S60T85
blends. Hence it is difficult to suggest whether rotor speed via its effect on morphology
exerts an effect on fuel swelling.
A comparison of ASTM oil and toluene swell (Section 4.4.7) between the single-stage
blends (Sections 4.2.2-1,4.5.1 and 4.5.2), masterbatch blends (Sections 4.2.2-2,4.6.1
and 4.6.2) and single elastomer compounds (Sections 4.2.2-3, 4.7.1 and 4.7.2) is
shown in Figures 5.61 and 5.62 respectively.
~
:oR ~
;; ~ ~~ - ~ '0 gj
<'j E o >. :ze
::E !-Vl ..:
25,---------------------------,
//-~ • Control
20 .520120 /
// • 520T85 15 //
0560120 /0-
~e~ o 560T85 10
& NR10NBR90
5 A NR50NBR50
/" 1\ Wasterbatch A NROONBR10 Contfol • Single-stage
O~----r---~-----+----_+----~
o 20 40 60 80 100 Weight % NR in blend
Fig. 5.61 Effect of blending conditions on the percentage oil swell of filled (20 phr, N660) NRlNBR blends
194

~
;!. ~
-~ '" ~ ~ ~ ~ E " ;.., "'-'" .a~
~
250
200
150
100
50
0 0 20 40 60
Weight % NR in blend
80 100
• Control
• 520T20
.520T85
o 560T20
o 560T85
• NR10NBR90
A NRSONBRSO
A NR90NBR10
Fig. 5.62 Effect of blending conditions on the percentage toluene swell of filled (20 phr, N660) NRlNBR blends
As expected both percentage oil and toluene swell of NBR is very much lower than
that of NR. An interesting observation is, percentage oil swell of both the types of
blends fall well below the additivity line and thus closer to that of the control NBR
(26.6% ACN) compound than expected. In the case of single-stage blends, it is about
5% lower than the predicted. However the percentage toluene swell of the blends is
much higher than that of the control NBR (26.6% ACN) compound. This is most
probably because the NBR swells quite a lot in toluene and hence the toluene can
penetrate to the NR phase easily. In the case of oil, it swells NBR only slightly and
thus it takes a much longer time for the oil to penetrate to the NR phase. Hence the
single-stage NRlNBR blends could be used in applications requiring oil resistance
where the 2-4 mass % oil swell is tolerable. The percentage toluene swell of both the
types of blends fall on the additivity line and hence the NBR compounds have a far
better fuel swelling resistance than either type of blend.
(b) Effect of Location of Carbon Black on the Swelling Resistance of Master batch Blend~
Apart from crosslinking restrictions, swelling also depends on compatibility of the
rubber and solvent on a molecular scale and on the type and amount of filler present in
the rubber. In the presence of carbon black, the swelling is generally reduced. The
higher the concentration, the lower the swelling.
Figures 5.63 and 5.64 show the variation in percentage swell (Section 4.4.7) of
masterbatch blends (Sections 4.2.2-2, 4.6.1 and 4.6.2) in ASTM oil No.2 and toluene
respectively.
195

7 'if!. Q;
6
~~ 5 == ill o .,
4 N E ci >. ze 3 :E ti 2 <{
1 NR Phase 10 50
50 90 10 NBR Phase 90
Weight % carbon black
Fig. 5.63 Influence of location of carbon black on the percentage swell of filled (20 phr, N660) masterbatch
blends in ASTM oil No.2
146,--------------, 144 142 140 138 136 134 132 130 128+--------+--------+-------~
NR Phase NBR Phase
10 90
50 50
Weight % carbon black
90 10
Fig. 5.64 Influence of location of carbon black on the percentage swell of filled (20 phr, N660) masterbatch
blends in toluene
It is clear that the oil uptake reduces with more carbon black premixed in the NR phase
and thus shows a similar behaviour to SBRlNBR blends studied by Lee(47,48)
Published ratings(36) indicate that NBR is far more resistant to ASTM oil No.2 than
NR. Lee (49) has also shown that the NBR phase of SBRlNBR masterbatch blends is
almost impenetrable by ASTM oil No.2 and the penetrability is unaffected by carbon
black loading. Thus the degree of swelling of NRlNBR masterbatch blends in ASTM
oil No.2 should be governed by the degree of swelling of the NR phase. As expected,
degree of swelling in oil decreases with increasing the amount of carbon black present
in the NR phase. Thus the observed variation in oil swelling resistance between the
masterbatch blends can be ascribed to the amount of carbon black present in the NR
phase.
196

Toluene resistance ofNBR is not substantially greater than that ofNR(36,39) and hence
the NBR phase is also penetrable by toluene. Unlike in the case of ASTM oil No.2,
there is no marked difference between the percentage toluene swell of NRSONBR 50
and NR90NBRIO blends. In toluene, the concentration of carbon black will affect the
swelling of both NR and NBR phases, since both these eIastomers swell considerably.
As a consequence, the carbon black distribution will not have such a great effect as in
the case of the oil, where concentration of carbon black only affects swelling of the NR
phase.
If there is a difference in the amount of carbon black present in the NR phase of the
single-stage blends then it will alter the degree of swelling, despite the same overall
crosslink density as in the case of masterbatch blends. Thus the swelling results confirm
that there is no significant difference between the carbon black distribution of the
single-stage blends.
197

REFERENCES
1. Roland, C.M. and Bohm, G.G.A., Macromolecules, 18 (1985) 1310
2. Bohn, L., Rubber Chem. Technol., 41 (1968) 495
3. Avgeropoulos, N., Weissert, F.C., Biddison, P.H. and Bohm, G.G.A., Rubber
Chem. Technol., 49 (1976) 93
4. Waiters, M.H. and Keyte, D.N., Rubber Chem. Technol., 38 (1965) 62
5. Tokita, N., Rubber Chem. Technol., 50 (1977) 292
6. Waiters, M.H. and Keyte, D.N., Trans. Inst. Rubber Ind., 38 (1962) 40
7. Kraus, G., Adv. Polym. Sci., 8 (1971) 155
8. Roland, c.M., Rubber Chem. Technol., 62 (1989) 456
9. Marsh, P.A., Voet, A, Price, L.D. and Mullens, TJ., Rubber Chem.
Technol., 41 (1968) 344
10. Hofmann, w., "Rubber Technology Handbook", Hanser Pub., Munich (1989)
Chap.2
11. Callan, J.E., Topcik, B. and Ford, F.P., Rubber World, 151(6) (1965) 60
12. Hess, w.M., Scott, C.E. and Callan, lE., Rubber Chem. Technol., 40 (1967)
371
13. Callan, J.E., Hess, WM. and Scott,. C.E., Rubber Chem. Technol., 44 (1971)
814
14. Scott, C.E., Callan, J.E. and Hess, W.M., l Rubber Res. Inst. Malaya, 22
(1969) 242
IS. Ahmad, Md. Aris bin and Wheelans, M.A., NR Technol., 151(4) (1984) 78
16. Gessler, AM., Hess, W.M. and Medalia, AI., Plast. Rubber Proc., June
(1978) 37
17. Hess, w.M., Herd, C.R. and Vegvari, P.C., Rubber Chem. Technol., 66
(1993)329
18. Marsh, P.A., Voet, A and Price, L.D., Rubber Chem. Technol., 40 (1967)
359
198
19. Boonstra, B.B. and Dannenberg, E.M., Rubber Chem. Technol., 32 (1959)
825
20. Lee, B.L. and Singleton, C.J., I. Appl. Polym. Sci., 24 (1979) 2169
21. Lee, B.L., Polym. Eng. Sci., 21(5) (1981) 294
22. Sircar, AK and Lamond, T.G., Rubber Chem. Technol., 46 (1973) 178
23.. Sircar, AK., Lamond, T.G. and Pinter, P.E., Rubber Chem. Technol., 47
(1974) 48
24. Massie, I.M., Hirst, R.C. and Halasa, AF., Rubber Chem. Technol., 66
(1993) 276
25. Cudby Paul E.F. and Gilbey Barry A, Rubber Chem. Technol., 68 (1995) 342
26. Boonstra, B.B. and Medalia, AI., Rubber Chem. Technol., 36 (1963) 115
27. Hess, W.M., Vegvari, P.C. and Swor, R.A, Rubber Chem. Technol., 58
(1985) 350
28. Dogadkin, B., Lukin, B., Tarzova, Z., Skorodumova, Z., Tutorskii, I. :
Kolloidn.Zh., 18 (1956) 413
29. Cotten, G.R., Kautsch. Gummi Kunstst., 22 (1969) 477
30. Gessler, AM., Hess, W.M. and Medalia, AI., Plast. Rubber Proc., March
(1978) 1
31. Porter, M., Rubber Chem. Technol., 40 (1967) 866
32. Kraus, G., I. Appl. Polym. Sci., 7 (1963) 861
33. Kraus, G., Rubber World, Qct (1956) 67
34. Tinker, AI., Personal Communication
35. Nelson, C. I., Avgeropoulos, G.N., Weissert, F.C. and Bohm, G. G. A,
Angew. Makromol. Chem., 60/61 (1977) 49
36. Khairi Nagdi in "Rubber as an Engineering Material": Guideline for Users,
Munich: Hanser (1993)
37. Hamed, G., Rubber Chem. Technol. 55 (1982) 151
38. Baker, C.S.L., Hallam, w.G. and Smith, I.F., NR Technol., 5(2) (1984) 78
39. Iacques, I. E. "Rubber Technology and Manufacture", Blow, C. M. Ed"
Butterworth and Co. Ltd., London (1971) Chap.9
199

40. Hess, W. M. and Chirico, V. E., Rubber Chem. Technol., 50 (1977) 301
41. Grosch, K.A "Fractography of Rubbery Materials" Bhowmick, AK. and De,
SK, Ed., EIsevier Science, Pub., London (1991)
42. Schallamach, A, Trans. Ins!. Rubber Ind., 28 (1952) 256
43. Mahdi, H. H., Ph.D. Thesis, Loughborough Univ. ofTech. (1990)
44. Zhang, S. W., Rubber Chem. Technol., 57 (1984) 769
45. Farid, AS., Rubber World, September (1993) p.25
46. Bohumil Meissner, Miroslav Schatz and Vladimir Brajko "Elastomers and
Rubber Compounding Materials", Franta I., Ed., Elsevier Pub.(1989) Chap.4
47. Lee, B. L., Polym. Eng. Sci., 22 (1982) 902
48. Lee, B. L., 1. Appl. Polym. Sci., 27 (1982) 3379
49. Lee, B. L., Polym. Eng. Sci., 25 (1985) 729
200

CONCLUSIONS
1. RHEOLOGY OF COMPONENT ELASTOMERS
(a) NR is more strongly non-Newtonian than NBR, but its viscosity is less strongly
dependent on temperature at typical processing temperatures. The strong
dependence of viscosity of NBR on temperature is because it contains
thermoplastic regions (78% of the butadiene units are in the trans 1,4
configuration), which are sensitive to heat.
(b) At high shear rates (> 40 S·l) corresponding to high mixer rotor speeds, the
difference in viscosity between the pairs of masterbatches decreases as more
carbon black is mixed into the NR masterbatch, a consequence of the greater
increase in viscosity of NR with increasing loading of carbon black in comparison
withNBR.
( c) The shear rate at which the viscosities of NR and NBR become equal (cross-over
shear rate) moves towards higher shear rates with increasing temperature.
2. EFFECT OF VISCOSITlES OF COMPONENT ELASTOMERS ON BLEND
MORPHOLOGY
(a) At high mixer rotor speeds resulting in high shear rates and a rapid rise in batch
temperature, the viscosities of the component e1astomers NR and NBR become
closer to each other and hence the domain size of the blend decreases. In the case
of 40/60 NRlNBR ( 45% acrylonitrile) blends produced at high mixer rotor speeds,
a fine morphology is obtained.
(b) Domain sizes of filled NRlNBR (45% acrylonitrile) blends are markedly smaller
than those of comparable NRlNBR gum blends, since addition of carbon black into
a blend of NR and NBR tends to equalise the viscosities of the two elastomers by
raising the viscosity of the least viscous e1astomer by preferential incorporation into
this elastomer.
3. EFFECT OF BLEND MORPHOLOGY ON PROPERTIES
(a) The viscosity ofNRINBR blends is not significantly affected by morphology.
(b) Moduli of NRlNBR single-stage blends are not significantly affected by
morphology
(c) Tensile strength of filled NRlNBR blends is dominated by morphology. Tensile
strengths of the fine textured NRlNBR single-stage blends are higher than those of
201

coarse textured blends. Also, the fine textured single-stage blends show a positive
synergism of tensile strength. Physical properties improve greatly with more
carbon black in the NBR phase (see conclusion 4-(c», but for tensile strength
domain size has a dominant effect over carbon black distribution.
(d) Tear strength of NRlNBR single-stage blends is not significantly affected by
morphology.
(e) At elevated temperatures fine textured NRlNBR single-stage blends show
improved compression set over those of coarse textured blends.
(t) Percentage oil swell ofNRINBR single-stage blends is not significantly affected by
morphology.
4. EFFECT OF LOCATION OF CARBON BLACK ON PROPERTIES
(a) The location of carbon black in the individual rubber phases of NRlNBR
masterbatch blends has a little effect on the viscosity. Viscosity increases with
more carbon black mixed into the NR phase.
(b) Cure characteristics of NRlNBR masterbatch blends are not significantly affected
by the location of carbon black in the individual rubber phases.
(c) Moduli and tear strength of NRlNBR masterbatch blends is highest with most of
the carbon black in the NBR phase. The increase in 300% modulus and tear
strength on increasing the amount of carbon black in the NBR phase is in
agreement with the recognised need for carbon black reinforcement to develop
optimum modulus and tear strength of NBR and the ability of NR to exhibit an
alternate mechanism of reinforcement by strain crystallisation.
(d) Abrasion resistance of NRlNBR masterbatch blends is highest with most of the
carbon black in the NR phase.
(e) Percentage compression set of NRlNBR masterbatch blends at ambient as well as
elevated temperature is lowest with carbon black equally distributed between the
phases. This conclusion is consistent with the work of previous researchers on
single e1astomer compounds that increasing filler loading increases compression set.
(t) ASTM oil uptake of NRlNBR masterbatch blends decreases on increasing the
amount of carbon black in the NR phase. The resistance of the NBR phase to
swelling by ASTM oil No.2 is unaffected by carbon black loading and hence the
degree of swelling of these blends in ASTM oil No.2 is governed by the degree of
swelling of the NR phase, which decreases on increasing the carbon black loading.
202

Toluene (or fuel) uptake also decreases on increasing the amount of carbon black in
the NR phase, but to a lesser extent than with the oil. This is because the carbon
black loading affects both NR and NBR phases, since toluene causes substantial
swelling of both these elastomers.
5. The filled NRlNBR single-stage blends could be used as replacements for the
control NBR (26.6% acrylonitrile) compound (prepared according to the same
number of rotor revolutions) with regard to physical properties such as moduli,
hardness, tear strength and compression set in applications, where the 2-4% (by
mass) oil swell is tolerable. Oil swell of the single-stage blends is about 5% (by
mass) lower than the predicted.
203

RECOMMENDATIONS FOR FURTHER WORK
1. Estimation of the degree of crosslinking in the individual phases of the NRlNBR
blends, using the newly developed techniques would be useful for interpretation of
the properties of these blends.
2. One method to promote interfacial connectivity in two-phase rubber blends is to
introduce a block or graft copolymer that contains two segments identical or
miscible with each phase, which is generally known as a polymeric compatibilizer.
Hence it would be interesting to investigate the effect of newly synthesised diblock
copolymers of (i) isoprene and butadiene (ii) isoprene and acrylonitrile as
compatibilizers in NRlNBR blends.
3. Crosslinking between the phases or in other words covulcanisation is important for
good physical properties. Lack of covulcanisation generally results from diffusion
of accelerators from one phase into the other. Hence it is suggested to substitute
the primary accelerator TMTD with an equimolar quantity of a higher alkyl thiuram
disulphide which has a solubility parameter midway between that of NR and NBR
(45% ACN) and at the same time giving almost similar cure rates for the two
elastomers, so that an even distribution of crosslinks between the phases (a
necessity for covulcanisation) can be achieved.
4. More conclusive evidence for the preferential location of carbon black in the NBR
phase of the single-stage blends would have been obtained from a comparison of
the physical properties of the single-stage blends with that of the masterbatch
blends, if the total mixing time employed in the preparation of these two types of
blends (at equal rotor speed) was the same. Hence it is suggested to prepare the
masterbatch blends with a total mixing time equivalent to that of the single-stage
blends (at equal rotor speed), so that location of carbon black in the single-stage
blends can be investigated via comparison of physical properties of the two types
of blends.
5. It would be interesting to study the variation of internal mixer torque curves of the
three masterbatch blends with mixing time to determine if it is possible to relate
them to the different morphological features of these blends.
204

6. In electron microscopy, slight thickness differences give rise to the mechanism of
contrast between phases. Hence thickness variations due to cutting action must be
virtually eliminated. It is recommended to use diamond knives instead of glass
knives especially for carbon black loaded vulcanisates in order to minimise thickness
variations due to the cutting action and hence to produce thin, uniform ribbons of
sections regardless of the number cut. It is also recommended to cut thin sections
under a nitrogen atmosphere using an ultramicrotome in order to avoid formation of
holes due to degradation when exposed to air, which greatly obscures phase
identification.
205

Appendix
Mixing step
! 1. Mixing of polymer
2. First cooling cycle for mixing polymer and carbon black
3. First heating cycle for mixing polymer and carbon black
4. Second cooling cycle for mixing polymer and carbon black
5. Second heating cycle for mixing polymer and carbon black
6. Low temperature mixing of oil and curatives with the
e1astomers
t Time • period • (min.)
2
4
4
3
3
1
Temperature
("C)
30
10
100
10
100
30
Table 1: The cyclic mixing procedure of Lee (Ref 76 of Chap.2)
206

Group F
-CH 147.3 3
-CH - 131.5 2
>CH- 85.99
>C< 32.03
CH = 126.54 2
-CH= 121. 53
>C= 84.51
-CH= aromatlc 117.12
-C= aromatic 98.12 .
-0- (ether, acetal) 114.98
-0- (epoxide) 176.20
-COO- 326.58
>C=O 262.96
-CHO 292.64
(CO) 0 567.29 2
-OH 225.84
-H acidic dimer _50.47
OH aromatic 170.99
NH - 226.56 . 2 180.03 -NH-
-N- 61.08
C=N 354.56
NCO 358.66
-s - 209.42
CI2
342.67
Cl primary 205.06
Cl . secondary 208.27
Cl aromatic 161. 0
Br 257.88
Br aromatic 205.60
F 41.33
Table 2: Tabulated values of group molar attraction constants (cal.cm3)'12 mort
according to Hoy (Ref. 13 of Chap.4)
207

589,...-------------------,
450
350
309
250
zee
lsa f-
100
I I I I I
79 146 Z1B ZOO 3Se 4ZO , ,
4'lfJ S60 ,
63B
Extension (%)
Fig. I : Force vs % extension curve showing the tensile behaviour of the filled NR
compound
208

500r-------------------------------~
459
4fl~ .vQ
300
250
208
100
I I I I I , , , , 79 149 219 200 359 429 499 56G 63(j 700
Extension (%)
Fig. 2 : Force vs % extension curve showing the tensile behaviour of the filled NBR
compound
209

506.------------------,
459
350
300
258
200
150
100
50
A I i
! i /! ,
;
Extension (%)
Fig. 3 : Force vs % extension curve showing the tensile behaviour of the S60T20
single-stage blend
210

100
H3
128
- "
88 1\ / i
/' 1
/ !
/. I
29 .
1/ i I
se 100 175 I
ZOO 75 125 I
159 I
2ZS
Extension (mm)
Fig. 4 : Force vs extension curve showing the tearing behaviour of the filled NR
compound
211
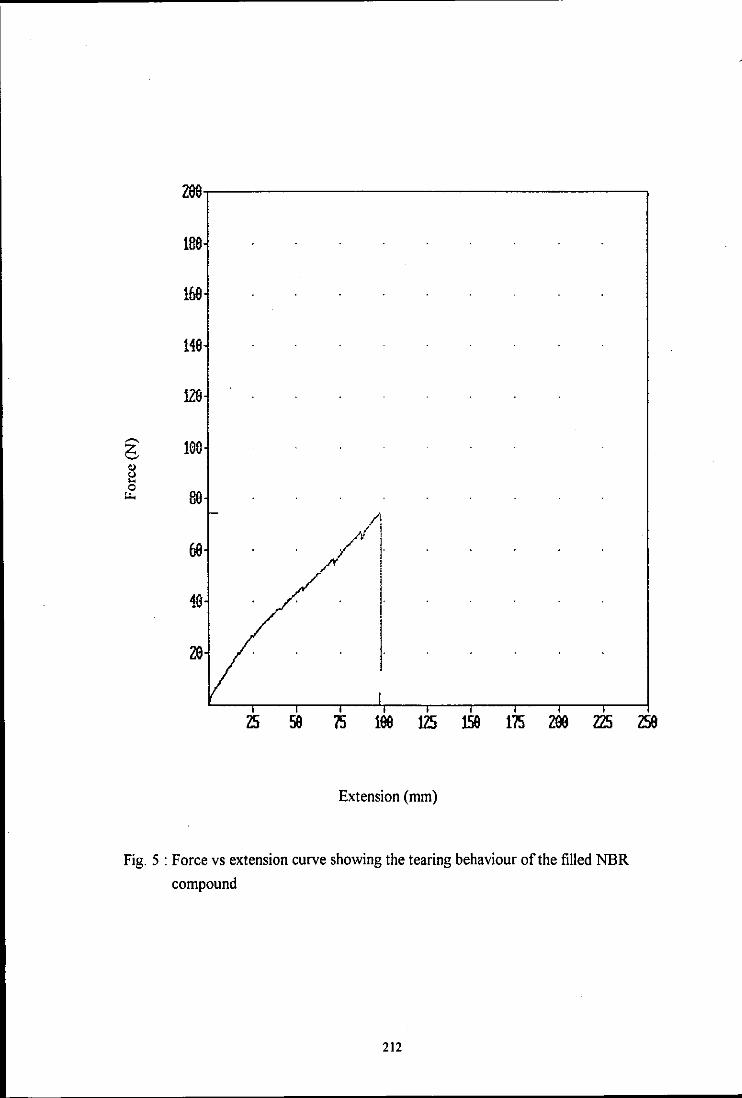
188
169
149
--. 100 b
0)
~ 0 ....
/' . I /1 ' . I . /" i
48 I
I
zs 59 75 100 125 159 175 ZOO 2ZS zse
Extension (mm)
Fig. 5 : Force vs extension curve showing the tearing behaviour of the filled NBR
compound
212

wu~------------------------~----------~
188·
160
14B
120
2a
12 24 36 48 68 72 84 9& le8 lZ8
Extension (mm)
Fig. 6 : Force vs extension curve showing the tearing behaviour of the S20T20
single-stage blend
213
