the influence of natural radiation damage on helium...
TRANSCRIPT
tters 249 (2006) 148–161www.elsevier.com/locate/epsl
Earth and Planetary Science Le
The influence of natural radiation damage on heliumdiffusion kinetics in apatite
David L. Shuster ⁎, Rebecca M. Flowers, Kenneth A. Farley
Division of Geological and Planetary Science, MC 100–25, California Institute of Technology, Pasadena, CA 91125, USA
Received 4 May 2006; received in revised form 11 July 2006; accepted 12 July 2006Available online 21 August 2006
Editor: R.W. Carlson
Abstract
Stepwise degassing diffusion experiments on 39 different apatite samples using radiogenic 4He and proton-induced 3He reveal arange in closure temperature (Tc) from ∼ 50 to 115 °C, for a cooling rate of 10 °C/Myr. There is no correlation between heliumdiffusion and apatite chemistry including F/Cl ratio, but the closure temperature is positively correlated with the radiogenic 4Heconcentration ([4He]) in each sample. We argue that [4He] is a proxy for a sample's natural exposure to actinide radioactivity belowthe closure temperature, and that helium diffusion in apatite is impeded by radiation-induced damage to the apatite structure. Thekinetics must therefore be an evolving function of time; measured diffusivities thus reflect a snapshot in time and cannot alone beapplied to the thermochronometric interpretation of a given sample. The effect of radiation damage on helium diffusion appears tofar exceed other known controls on helium diffusivity, including grain size.
Our diffusion data are well described by a previously proposed, quantitative model that consists of two Arrhenius relations, onefor volume diffusion through undamaged mineral structure and one for release of helium from radiation damage “traps.” Theunknown parameters in this “trapping model” were determined from the diffusion experiments, and allow us to develop a tentativemathematical function that relates diffusivity to temperature and [4He]. By inserting this function into a 4He production-diffusionmodel we have explored how these results affect the interpretation of apatite (U–Th)/He thermochronometry. The model predictsthat the effective 4He closure temperature of apatite will vary with cooling rate and effective U concentration (eU) and may differfrom the commonly assumed Tc of 70 °C by up to ±15 °C. The 4He partial retention zone will look similar to previousexpectations, but its depth will depend on accumulation time and on eU. Most notably, samples subjected to reheating afteraccumulation of substantial radiation damage will be more retentive than previously expected. These predictions are consistent withrecent observations of unexpected apatite (U–Th)/He ages in some settings.© 2006 Elsevier B.V. All rights reserved.
Keywords: Diffusion kinetics; (U–Th)/He; Thermochronometry; Radiation damage; Apatite; Helium
⁎ Corresponding author. Now at: Berkeley Geochronology Center,2455 Ridge Road, Berkeley, CA 94709, USA. Tel.: +1 510 644 9891;fax: +1 510 644 9201.
E-mail addresses: [email protected] (D.L. Shuster),[email protected] (R.M. Flowers), [email protected](K.A. Farley).
0012-821X/$ - see front matter © 2006 Elsevier B.V. All rights reserved.doi:10.1016/j.epsl.2006.07.028
1. Introduction
One of the fundamental assumptions of noble gasthermochronometry is that diffusion kinetics of theradiogenic daughter measured in the laboratory can be

149D.L. Shuster et al. / Earth and Planetary Science Letters 249 (2006) 148–161
extrapolated to the lower temperatures and longer time-scales relevant in nature. This relies on the assertion thatthe physical mechanisms responsible for laboratoryobservations are exactly the same as those which occurredin nature throughout a sample's daughter accumulationhistory. Noble gas diffusivity is also commonly assumed tobe solely a function of temperature. Due to the timescalesof interest in geological problems, these are remarkablydifficult assertions to evaluate. For instance, almost nogeological context is known a priori with sufficientprecision to rigorously validate the low-temperatureextrapolations of laboratory-based diffusion kinetics. Analternative approach is to identify the chemical or physicalvariables which influence diffusion to ultimately develop acomplete kinetic model of the diffusion process. Despiteadvances in quantifying diffusion kinetics with highprecision, our physical understanding of noble gasdiffusion remains relatively poor.
Over the last 10 yr, apatite (U–Th)/He chronometryhas been increasingly applied for thermochronometry[1,2]. The abundance and spatial distribution ofradiogenic 4He within apatite is sensitive to coolingthrough temperatures found in the uppermost fewkilometers of the Earth's crust. This makes the apatite(U–Th)/He chronometer useful for studying manyproblems in the Earth and planetary sciences, forinstance involving tectonically driven crustal deforma-tion and topographic evolution due to long-term erosion.With few exceptions, the diffusion kinetics of Durangoapatite [3] has been used to interpret apatite (U–Th)/Heages: i.e., that the (U–Th)/He age represents time sincethe sample cooled through a closure temperature (Tc) of∼ 70 °C. This closure temperature was well constrainedfor Durango apatite and a few other samples in severalearly studies of helium diffusion [4–6].
Naturally occurring radioactivity can alter a mineral'sstructure by introducing isolated defects and vacancies[7,8]. Themechanism and rates atwhich radiation damageaccumulates in crystals have been extensively studied innatural and 238Pu-doped synthetic zircons and apatites toassess their potential as host phases for radioactive wastedisposal [7,9–12]. In addition to ionizing elementsthrough α- β- and γ-decays, actinide series decay alsocauses thousands of permanently displaced atomsprimarily by direct impacts within cascades caused byheavy recoiled atoms during each alpha decay [10,13] andthrough atomic stopping of α particles and at a muchlower frequency spontaneous U fission fragments (e.g.,localized atomic displacements caused by 238U fission inapatite create the measurable “fission tracks” commonlyused for thermochronometry [14]). The rate at which α-decay induced damage accumulates in apatite and zircon
is also a strong negative function of temperature; forapatite, damage accumulation rates are rapidly reduced attemperatures above 150 °C [12].
Previous work has recognized a role for radiationdamage in controlling 4He diffusion from minerals. Forexample, measured (U–Th)/He ages of very old zircon[15–17] and titanite crystals [15] indicate that 4He lossis greatly accelerated at high degrees of radiationdamage. Presumably the transformation of the crystal-line matrix into an amorphous phase reduces impedi-ments to helium mobility. In contrast, recentexperiments demonstrate that synthetic radiation dam-age introduced by proton irradiation can impede heliumdiffusion in quartz [18]. Recent applications ofpercolation theory to study the radiation-inducedtransition of a crystal into an aperiodic state mayprovide insight to this apparent threshold behavior,where the overlapping of damaged regions occurs at thefirst percolation point [10,13]. However we areunaware of any systematic study of how heliumdiffusion kinetics responds to radiation damage, thegoal of the present work.
Here, we present results that we hope will lead to amore complete physical model of helium diffusion in themineral apatite (Ca5(PO4)3F), and thus will aid in moreaccurate interpretation of (U–Th)/He thermochrono-metric data. Until the advent of 4He/3He thermochrono-metry [19], diffusion experiments relied on naturalradiogenic 4He in a sample. However this isotope willnot generally have an initially uniform concentrationdistribution, an essential assumption for calculatingdiffusion coefficients [20]. In addition, many sampleshave insufficient 4He to make accurate diffusioncoefficients measurements, especially those with lowdegrees of integrated α-decay and hence radiationdamage. By irradiating samples with high energy protons,it is possible to generate high concentrations of uniformlydistributed 3He for measuring diffusion coefficients withthis isotope [21].
2. Methods
2.1. Samples
The samples investigated in this study come frommany different localities and settings and were origi-nally selected for 4He/3He thermochronometry ratherthan a systematic study of helium diffusion. Neverthe-less, they span a wide range in cooling rate, (U–Th)/Heage, lithology, and radioelement content. Specificsample designations and references are given in thecaption to Table 1.

Table 1Summary of helium diffusion kinetics in apatite
3He Sample Locality Reference Ea (+/−) ln(Do /a2) (+/−) Tc (+/−) [4He] He age [U] [Th] F/Cl (+/−)
(kJ/mol) (ln(s−1)) (°C) (nmol/g) (Ma) (ppm) (ppm) (wt.%/wt.%)
MC01-14 Tibet [40] 119.5 2.0 10.2 0.5 46.8 8.6 1.1 7.5 28 32 514 10800MR-18 Southern Coast Mtns UP 148.9 2.7 21.4 0.7 47.2 9.6 0.04 1.5 6 7 n.d. n.d.CJ17 Cajon Pass, CA [47] 122.3 2.9 11.1 0.6 47.9 11.5 0.2 6.0 6 9 69 501MR59 Southern Coast Mtns [23] 121.2 1.5 10.5 0.4 49.2 6.6 0.5 1.7 64 19 5 0.1CJ50 Cajon Pass, CA [47] 120.5 0.9 10.2 0.2 49.4 3.7 0.0 0.0 33 38 108 6DYJS5 San Bernardino Mtns, CA [46] 121.5 1.2 10.5 0.3 49.9 5.1 0.3 1.4 34 105 27 2.303SS17 Sierra Nevada, CA [41] 136.4 1.9 15.5 0.5 54.1 7.6 6.0 15.4 39 61 1043 385TEKI-38 Southern Coast Mtns [23] 124.0 1.0 10.7 0.2 55.1 3.9 0.1 2.5 10 9 n.d. n.d.TEKI-30 Southern Coast Mtns [23] 123.2 1.0 10.2 0.3 56.5 4.7 0.4 4.7 18 16 n.d. n.d.MC01-11 Tibet [40] 125.4 1.6 10.9 0.4 57.3 6.9 1.1 8.2 28 15 711 91MC01-15 Tibet [40] 127.7 1.6 11.4 0.6 59.7 8.3 2.7 6.2 70 33 35 10KC-1 Sierra Nevada, CA [44]V 129.5 3.8 12.0 0.9 60.2 15.8 5.8 31.0 47 32 n.d. n.d.KC-9 Sierra Nevada [44]V 126.2 4.0 10.6 0.9 61.5 16.8 1.8 22.0 41 46 n.d. n.d.0309GT Sierra Nevada, CA [41] 130.7 3.6 12.2 0.8 61.8 14.5 6.0 14.0 35 56 525 132L1 Bolivia UPIII 125.9 1.3 10.4 0.3 62.1 5.5 0.5 7.5 7 41 8 0.6TEKI-34 Southern Coast Mtns [23] 130.9 3.0 12.1 0.7 63.0 12.4 0.2 3.7 15 6 n.d. n.d.95MR17 Central Coast Mtns, Canada [42] 129.4 1.8 11.4 0.4 64.1 7.4 1.4 9.5 26 19 18 198MR-86 Central Coast Mtns, Canada [42] 133.1 2.3 12.6 0.5 65.1 9.1 1.7 20.0 16 28 48 6SNLP Sierra Nevada, CA [41] 136.4 2.0 13.5 0.5 67.1 8.3 3.3 10.7 49 93 n.d. n.d.MH96-14 Sierra Nevada, CA [43] 133.3 1.3 12.2 0.3 68.3 5.3 10.8 56.6 34 22 129 22KC-10 Sierra Nevada, CA [44]V 134.0 3.4 12.1 0.8 70.8 14.2 5.7 23.0 36 41 n.d. n.d.0316GT Sierra Nevada, CA [41] 129.6 2.1 10.4 0.5 71.7 9.1 8.2 22.0 60 53 59 892TD118 Sierra Nevada, CA UPV 134.1 1.1 12.0 0.3 71.8 4.9 3.2 n.d. n.d. n.d. n.d. n.d.92TD108 Sierra Nevada, CA UPV 133.9 1.8 11.7 0.4 73.4 7.4 3.0 n.d. n.d. n.d. n.d. n.d.CJ12 Cajon Pass, CA [47] 140.2 10.3 13.8 2.3 74.5 42.1 3.0 n.d. n.d. n.d. n.d. n.d.MH96-17 Sierra Nevada, CA [43] 142.4 3.3 13.7 0.8 80.3 13.7 15.5 58.0 41 65 31 5
4He Sample Locality Reference Ea (+/−) ln(Do /a2) (+/−) Tc (+/−) [4He] He age [U] [Th] F/Cl (+/−)
96MR56 Central Coast Mtns, Canada [42] 109.2 0.8 6.6 0.2 44.1 3.7 0.4 5.6 17 1 n.d. n.d.SG-7 San Gabriel Mtns, CA [39] 132.4 0.8 12.3 0.2 65.4 3.7 1.3 7.6 27 65 n.d. n.d.95MR17 Central Coast Mtns, Canada [42] 125.4 2.1 9.5 0.5 67.3 9.2 1.4 9.5 26 19 n.d. n.d.DYJS2 San Bernardino Mtns, CA [46] 123.0 0.6 8.6 0.2 67.5 3.0 0.5 1.6 40 91 n.d. n.d.96MR47 Central Coast Mtns, Canada [42] 126.4 1.8 9.8 0.5 67.7 9.0 0.4 9.2 8 9 n.d. n.d.TAM-1 Dry Valleys, Antarctica UP 138.1 1.3 13.9 0.3 68.5 5.1 7.3 n.d. n.d. n.d. n.d. n.d.97MR48 Central Coast Mtns, Canada [42] 129.3 0.7 10.5 0.2 70.2 3.5 0.7 9.5 14 9 n.d. n.d.Durango Mexico [3] 139.7 0.5 14.0 0.1 71.7 1.9 8.2 31.0 8 180 13 0.8PRBH17 Big Horn Mtns, WY [45] 125.1 3.8 8.0 0.9 77.8 17.5 26.2 107.0 24 137 n.d. n.d.Tioga Appalachians, PA UPII 136.4 2.1 11.6 0.5 80.4 9.0 33.7 280.0 20 7 n.d. n.d.WY1 Wind River Mtns, WY UPIV 138.9 1.3 11.5 0.4 87.5 6.3 15.0 n.d. n.d. n.d. n.d. n.d.SZ00-196b Snowbird, Canada UP 139.7 1.3 9.3 0.3 106.8 5.9 30.0 850.0 10 5 n.d. n.d.02-123a Snowbird, Canada UP 158.6 1.7 14.5 0.4 113.6 7.0 120.0 650.0 40 12 n.d. n.d.Lake Mtn Australia UPI 140.6 3.8 8.5 0.9 116.0 18.1 236.0 329.0 146 3 n.d. n.d.
Table references: [3,23,38–47].All errors are reported as 1σ.UP refers to a previously unpublished sample.n.d. is not determined, nmol is 10−9 mol, wt.% is weight percent.These designated samples were provided by: IPaul Green, IIRay Donelick, IIIJulie Libarkin, IVPete Reiners, VTrevor Dumitru.
150D.L.Shuster
etal.
/Earth
andPlanetary
ScienceLetters
249(2006)
148–161

151D.L. Shuster et al. / Earth and Planetary Science Letters 249 (2006) 148–161
2.2. Experimental procedures
In this study, we conducted helium diffusion experi-ments following previously described procedures [5,21,22]using either proton-induced 3He [21] or natural radiogenic4He as the diffusant. Artificial 3He was created byirradiating sampleswith a 220MeVproton beamgeneratedby isochronous cyclotron acceleration and a fluence of 1015
protons/cm2. Aliquots of single or multiple like-sizedapatite crystals (average grain cross section was 120 μm)were held at a controlled temperature for a known time in avolume of ∼ 300 cm3 under static vacuum [22]. Thethermally released helium was purified and cryogenicallyseparated from other noble gases using activated charcoalheld at 32 K and analyzed using either a sector-field massspectrometer (3He) or a quadrupole mass spectrometer(4He). Using the fraction of 3He or 4He released and theduration of each step, we calculated the diffusioncoefficient (D) normalized to the characteristic diffusivelength scale a, (i.e., D /a2) using published equations andthe assumptions therein [20]. The estimated uncertainty ontemperatures was better than ±2 °C and on diffusioncoefficients better than ±0.2 natural log units (ln(s−1)).
We also determined major element chemistry for asubset of 14 samples using the Caltech JEOL 8200electron microprobe (Supplementary table ST1). Apa-tites in polished grain mounts were analyzed using a10 m spot size at 15 kV and 25 nA.
2.3. Arrhenius regression models
We quantified the temperature dependence of thediffusion coefficient from linear regression models of ln(D /a2) against 1 /T assuming the Arrhenius relationshipD(T) /a2=Do /a
2exp(−Ea /RT), where Ea is the activationenergy, and R is the gas constant. Our goal was toquantify the function D(T) /a2 for each sample. Forreasons discussed below, it was often not appropriate touse all experimental data for each linear regression. Wetherefore used data subsets to quantify diffusion kinetics.
2.3.1. Criteria for 3He based experimentsWe used the following criteria to establish data
subsets for Arrhenius regression models for each 3Hebased experiment: (i) we used the entire set of measured3He release fractions to calculate D /a2 values; (ii) weexcluded D /a2 values from regression models for stepswhen ΣF3He≤0.5%, and (iii) excluded values fortemperatures ≥325 °C. Each experiment also yieldedreproducible D /a2 values at multiple, isothermal steps.
Diffusion coefficients calculated for the earliest stepsin an experiment are sensitive to the influence of small
fragments of apatite or other mineral dust adhered to thesurface of an analyzed crystal. For instance, adheredmaterial may have a very small diffusive length-scale, yeta proton-induced 3He concentration equivalent to muchlarger grains. An adhered fragment would rapidly lose itsgas at the beginning of an experiment and result in highervalues of D /a2 than appropriate for the analyzed crystal.Initially elevated values have previously been reportedand typically represented less than 0.5% of the total 3Heabundances [18,21,23]. Fortunately, once the adheredfragments completely lose their gas, the calculateddiffusivities rapidly converge upon appropriate valuesfor a sample [21,24]. The previously observed ∼ 0.5%threshold is consistent with the observations presented inthis study. To avoid introducing bias towards higherdiffusivity at low temperatures, we excluded these stepsfrom each linear regression model.
In nearly every experiment, we observed an irrevers-ible transition occurring ∼ 325 °C towards shallowerslopes on plots of ln(D /a2) versus 1/T. This transitionhas been well-documented in other apatites, and wasinterpreted as a change in diffusive mechanism beginningat ∼ 325 °C [3]. We assumed that this behavior does notapply to lower temperatures, and excluded steps attemperatures ≥325 °C from each regression model. Tominimize bias between samples, we used this thresholdeven if linearity persisted at temperatures above 325 °C.
Reproduced values of D /a2 at a given temperatureduring sequential heating steps that (i) increased, (ii)decreased or (iii) remained constant in temperatureverify that the assumed initial condition (i.e., a uniformspatial helium distribution within each crystal) waseither accurate, or its inaccuracy had negligible in-fluence on our results [3,21]. If calculated D /a2 valuesaccurately represent diffusion kinetics of a sample that ishomogeneous with respect to D and a, they should beinsensitive to a specific heating schedule. Due to dif-ferences in the expected spatial distributions of proton-induced 3He and radiogenic 4He, our specific criteria forselecting which steps we used in each linear regressionmodel were somewhat different for each isotope. Forinstance, whereas we a priori expected the initial spatialdistribution of proton-induced 3He to be uniform, wecould not reliably assume the same for natural 4He sincethe spatial distributions of radiogenic 4He weremodified by direct α-particle emission and diffusionover geologic time [19].
2.3.2. Constraining diffusion kinetics from 4He basedexperiments
Diffusion data using proton-induced 3He were supple-mentedwith 4He diffusion data obtained on about a dozen

152 D.L. Shuster et al. / Earth and Planetary Science Letters 249 (2006) 148–161
additional samples. Here our approach to determining thediffusion parameters was more subjective than for 3Hebecause (i) the initial 4He profile is unknown, so we canexpect varying degrees of curvature in the early steps; and(ii) the experiments were performed over many years fordifferent purposes and using varying heating schedules.As a consequencewewere forced to choose a subset of thedata from each experiment that maximized the number ofsteps included in the regression and gave the maximumlinearity, again sensitive to the onset of curvature seen inthe higher temperature steps. In some cases, particularlywhen helium retentivity was high, this required the use ofsteps above 325 °C. The results we obtained using 4He areconsistent with those obtained from 3He (Fig. 1).
Previous results indicate that proton-induced 3He andradiogenic 4He yield nearly equivalent diffusion kineticsin Durango apatite despite the 25% fractional massdifference between these two isotopes [21]. If present inother samples, an isotopic difference in D of ∼ 15%(i.e., predicted by the inverse root mass relationship)would superimpose a negligible bias to the result
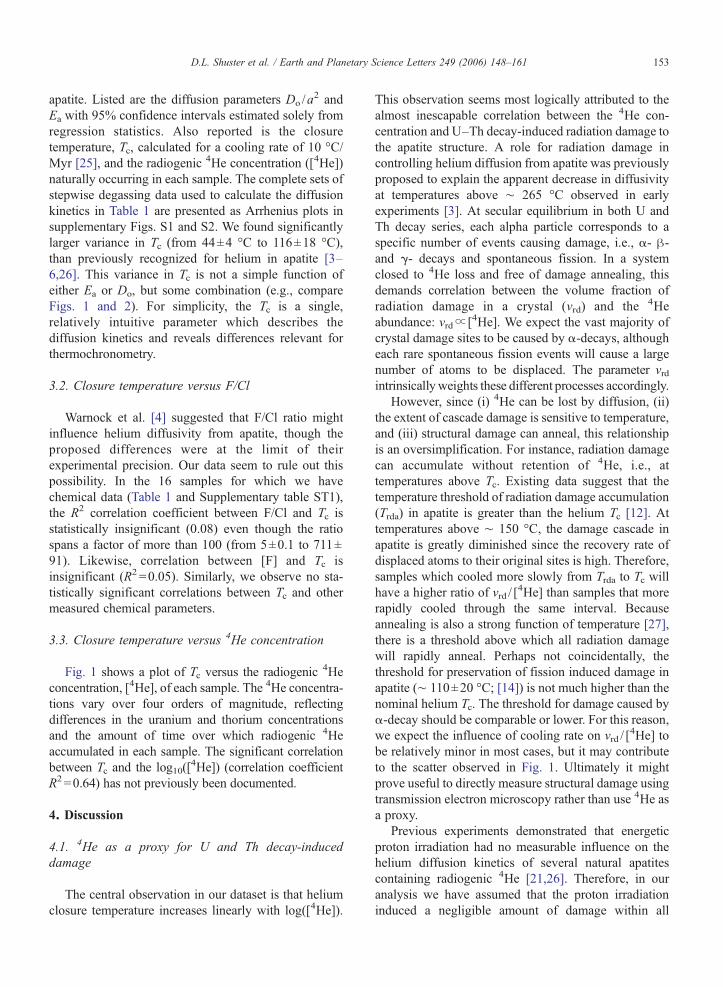
Fig. 1. Helium closure temperature (Tc) versus the log of the 4Heconcentration (log10([
4He]). Values of Tc were calculated for a coolingrate of 10 °C/Myr using the formulation of [25] for diffusion kineticsdetermined from stepwise release fractions of proton-induced 3He (greypoints) and natural radiogenic 4He (black points). Complete datasets andthe Arrhenius plots for each point are shown in the on-lineSupplementary file. We estimated error bars on Tc (1σ; shown arevertical lines) solely from the linear regression statistics from theArrhenius plots. The dotted line is the result of a multiple linearregression model of D /a2 against both 1/T and log10([
4He]) using theentire dataset (see Fig. 3). The solid curve is the calibrated “trapping”model discussed in Section 4.2.3 for best fit parameters:Ea=120 kJ/mol,Et=29 kJ/mol, Do /a
2=1.58×10⁴ s−1, and ψ =1.26×10⁻⁴ gm/nmol.
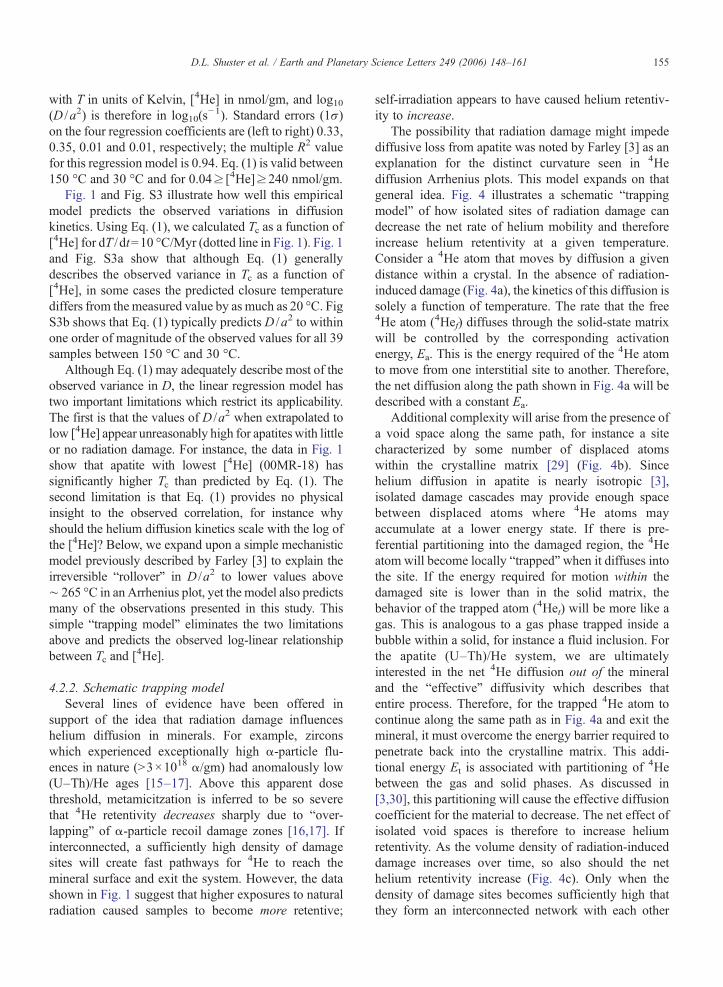
Fig. 2. Diffusion parameters. (a) The experimentally determinedactivation energy (Ea) and (b) the frequency factor (ln(D /a2)) versusthe log of the 4He concentration (log10([
4He]). We estimated error barson each parameter (1σ; shown are vertical lines) solely from the linearregression statistics from the Arrhenius plots. The trapping model usesthe best fit parameters listed in Fig. 1.
presented below. For instance a 15% difference indiffusivity would correspond to a difference in Tc ofb1.5 °C (10 °C/Myr) in apatite.
3. Results
3.1. Variance in the helium closure temperature Tc.
Table 1 summarizes the results of 40 helium diffusionexperiments conducted on 39 different samples of
153D.L. Shuster et al. / Earth and Planetary Science Letters 249 (2006) 148–161
apatite. Listed are the diffusion parameters Do /a2 and
Ea with 95% confidence intervals estimated solely fromregression statistics. Also reported is the closuretemperature, Tc, calculated for a cooling rate of 10 °C/Myr [25], and the radiogenic 4He concentration ([4He])naturally occurring in each sample. The complete sets ofstepwise degassing data used to calculate the diffusionkinetics in Table 1 are presented as Arrhenius plots insupplementary Figs. S1 and S2. We found significantlylarger variance in Tc (from 44±4 °C to 116±18 °C),than previously recognized for helium in apatite [3–6,26]. This variance in Tc is not a simple function ofeither Ea or Do, but some combination (e.g., compareFigs. 1 and 2). For simplicity, the Tc is a single,relatively intuitive parameter which describes thediffusion kinetics and reveals differences relevant forthermochronometry.
3.2. Closure temperature versus F/Cl
Warnock et al. [4] suggested that F/Cl ratio mightinfluence helium diffusivity from apatite, though theproposed differences were at the limit of theirexperimental precision. Our data seem to rule out thispossibility. In the 16 samples for which we havechemical data (Table 1 and Supplementary table ST1),the R2 correlation coefficient between F/Cl and Tc isstatistically insignificant (0.08) even though the ratiospans a factor of more than 100 (from 5±0.1 to 711±91). Likewise, correlation between [F] and Tc isinsignificant (R2 =0.05). Similarly, we observe no sta-tistically significant correlations between Tc and othermeasured chemical parameters.
3.3. Closure temperature versus 4He concentration
Fig. 1 shows a plot of Tc versus the radiogenic 4Heconcentration, [4He], of each sample. The 4He concentra-tions vary over four orders of magnitude, reflectingdifferences in the uranium and thorium concentrationsand the amount of time over which radiogenic 4Heaccumulated in each sample. The significant correlationbetween Tc and the log10([
4He]) (correlation coefficientR2=0.64) has not previously been documented.
4. Discussion
4.1. 4He as a proxy for U and Th decay-induceddamage
The central observation in our dataset is that heliumclosure temperature increases linearly with log([4He]).
This observation seems most logically attributed to thealmost inescapable correlation between the 4He con-centration and U–Th decay-induced radiation damage tothe apatite structure. A role for radiation damage incontrolling helium diffusion from apatite was previouslyproposed to explain the apparent decrease in diffusivityat temperatures above ∼ 265 °C observed in earlyexperiments [3]. At secular equilibrium in both U andTh decay series, each alpha particle corresponds to aspecific number of events causing damage, i.e., α- β-and γ- decays and spontaneous fission. In a systemclosed to 4He loss and free of damage annealing, thisdemands correlation between the volume fraction ofradiation damage in a crystal (vrd) and the 4Heabundance: vrd∝ [4He]. We expect the vast majority ofcrystal damage sites to be caused by α-decays, althougheach rare spontaneous fission events will cause a largenumber of atoms to be displaced. The parameter vrdintrinsicallyweights these different processes accordingly.
However, since (i) 4He can be lost by diffusion, (ii)the extent of cascade damage is sensitive to temperature,and (iii) structural damage can anneal, this relationshipis an oversimplification. For instance, radiation damagecan accumulate without retention of 4He, i.e., attemperatures above Tc. Existing data suggest that thetemperature threshold of radiation damage accumulation(Trda) in apatite is greater than the helium Tc [12]. Attemperatures above ∼ 150 °C, the damage cascade inapatite is greatly diminished since the recovery rate ofdisplaced atoms to their original sites is high. Therefore,samples which cooled more slowly from Trda to Tc willhave a higher ratio of vrd / [
4He] than samples that morerapidly cooled through the same interval. Becauseannealing is also a strong function of temperature [27],there is a threshold above which all radiation damagewill rapidly anneal. Perhaps not coincidentally, thethreshold for preservation of fission induced damage inapatite (∼ 110±20 °C; [14]) is not much higher than thenominal helium Tc. The threshold for damage caused byα-decay should be comparable or lower. For this reason,we expect the influence of cooling rate on vrd / [
4He] tobe relatively minor in most cases, but it may contributeto the scatter observed in Fig. 1. Ultimately it mightprove useful to directly measure structural damage usingtransmission electron microscopy rather than use 4He asa proxy.
Previous experiments demonstrated that energeticproton irradiation had no measurable influence on thehelium diffusion kinetics of several natural apatitescontaining radiogenic 4He [21,26]. Therefore, in ouranalysis we have assumed that the proton irradiationinduced a negligible amount of damage within all

Fig. 3. Values of log10(D /a2) extrapolated to temperatures between150 °C and 30 °C from the diffusion kinetics summarized in Table 1plotted against the log of the 4He concentration (log10([
4He]). Eachpoint corresponds to the diffusion kinetics of a different sampleextrapolated to 110 °C (triangles) and 50 °C (circles) as two examples.The dotted lines are the results of a multiple linear regression model ofD /a2 against both 1 /T and log10([
4He]) using the entire dataset. Thesolid curves are the predictions of the quantitative “trapping model”(Eq. (3)) for the parameters used in Fig. 1.
154 D.L. Shuster et al. / Earth and Planetary Science Letters 249 (2006) 148–161
samples. However, future experiments are required tofully evaluate this assumption, because the nucleartransmutations induced via energetic proton irradiationmust cause additional damage to the crystal structure[28]. In samples with little or no natural radiationdamage, the possibility remains that the energetic protonirradiation may have caused most or all of the radiationdamage in the sample. This would cause the density ofradiation damage to be higher than it would be if solelyinferred from the measured radiogenic [4He]. Indeed,we observe “elevated” Tc for the two samples with [4He]b0.1 nmol/gm (Fig. 1). However, as we discuss below,the samples with “elevated” Tc at low [4He] (i.e., anupper bound on the diffusion kinetics) are predicted by asimple mechanistic model.
4.2. Helium diffusion kinetics as an evolving function
The data shown in Fig. 1 imply that helium diffusionkinetics in apatite is an evolving property; the diffusionkinetics that we measure in the laboratory may notdirectly apply over all timescales. Thus, the heliumdiffusion kinetics quantified in an apatite today wouldunderestimate its low-temperature diffusivity in the
past. This means that at the time of interest (i.e., near theage of cooling), the effective 4He closure temperature(Tec) may in fact have been lower than what we observetoday. If radiation-induced damage controls Tec, then theaccumulation of damage over time should causediffusion kinetics to evolve at a predictable rate.
To explore how sensitive the apatite (U–Th)/Hesystem is to this effect, we need a quantitativedescription of how the diffusion coefficient, D (i.e.,rather than Tc), varies as a function of [4He]. Fig. 2shows how the Arrhenius diffusion parameters (Ea andDo /a
2) each vary with log10([4He]). Although correla-
tion between Ea and [4He] may be seen in some of thedata (note center cluster of data in Fig. 2a), both Ea andDo show significantly poorer correlation with log10([4He]) (correlation coefficient R2 =0.30 and 0.0001,respectively) than with Tc. This may partly arise fromthe fact that we can better quantify diffusion coefficientsand Ea at and closer to experimental temperatures thanwe can quantify Do through extrapolation to infinitetemperature. We first develop an empirical relationshipbetween D and [4He] using extrapolated values of D /a2. We then adopt a mechanistic model, which webelieve more accurately describes the physical phenom-enon. We present each relationship below.
4.2.1. Multiple linear regression modelThe temperature range most relevant for apatite (U–
Th)/He thermochronometry is between 130 °C andEarth's surface temperatures. By extrapolating theArrhenius relationships summarized in Table 1 (andshown in supplementary Figs. S1 and S2), we calculatedvalues of D /a2 for each sample between 150 °C and30 °C at 20 °C intervals. Fig. 3 shows the extrapolatedvalues at two of these temperatures plotted against thelog10([
4He]) for all 39 samples, and clearly illustratesthe covariance of D with both temperature and [4He]:The diffusion coefficient is positively correlated withtemperature and negatively correlated with [4He]. At agiven temperature, samples with higher [4He] havelower diffusivity. To obtain an empirical description ofthis variability, we constructed a multiple linearregression model of log10(D /a2) against both 104 /Tand log10([
4He]). The results are plotted as dotted linesin Fig. 3 and given by the following relationship:
log10DðT ; ½4He �Þ
a2
� �
¼ 5:025−0:026ðlog10ð½4He �ÞÞ−½0:675þ 0:030ðlog10ð½4H e�ÞÞ�d 104
T
� �; ð1Þ
155D.L. Shuster et al. / Earth and Planetary Science Letters 249 (2006) 148–161
with T in units of Kelvin, [4He] in nmol/gm, and log10(D /a2) is therefore in log10(s
−1). Standard errors (1σ)on the four regression coefficients are (left to right) 0.33,0.35, 0.01 and 0.01, respectively; the multiple R2 valuefor this regression model is 0.94. Eq. (1) is valid between150 °C and 30 °C and for 0.04≥ [4He]≥240 nmol/gm.
Fig. 1 and Fig. S3 illustrate how well this empiricalmodel predicts the observed variations in diffusionkinetics. Using Eq. (1), we calculated Tc as a function of[4He] for dT / dt=10 °C/Myr (dotted line in Fig. 1). Fig. 1and Fig. S3a show that although Eq. (1) generallydescribes the observed variance in Tc as a function of[4He], in some cases the predicted closure temperaturediffers from the measured value by as much as 20 °C. FigS3b shows that Eq. (1) typically predicts D /a2 to withinone order of magnitude of the observed values for all 39samples between 150 °C and 30 °C.
Although Eq. (1) may adequately describe most of theobserved variance in D, the linear regression model hastwo important limitations which restrict its applicability.The first is that the values of D /a2 when extrapolated tolow [4He] appear unreasonably high for apatites with littleor no radiation damage. For instance, the data in Fig. 1show that apatite with lowest [4He] (00MR-18) hassignificantly higher Tc than predicted by Eq. (1). Thesecond limitation is that Eq. (1) provides no physicalinsight to the observed correlation, for instance whyshould the helium diffusion kinetics scale with the log ofthe [4He]? Below, we expand upon a simple mechanisticmodel previously described by Farley [3] to explain theirreversible “rollover” in D /a2 to lower values above∼ 265 °C in an Arrhenius plot, yet the model also predictsmany of the observations presented in this study. Thissimple “trapping model” eliminates the two limitationsabove and predicts the observed log-linear relationshipbetween Tc and [4He].
4.2.2. Schematic trapping modelSeveral lines of evidence have been offered in
support of the idea that radiation damage influenceshelium diffusion in minerals. For example, zirconswhich experienced exceptionally high α-particle flu-ences in nature (N3×1018 α/gm) had anomalously low(U–Th)/He ages [15–17]. Above this apparent dosethreshold, metamicitzation is inferred to be so severethat 4He retentivity decreases sharply due to “over-lapping” of α-particle recoil damage zones [16,17]. Ifinterconnected, a sufficiently high density of damagesites will create fast pathways for 4He to reach themineral surface and exit the system. However, the datashown in Fig. 1 suggest that higher exposures to naturalradiation caused samples to become more retentive;
self-irradiation appears to have caused helium retentiv-ity to increase.
The possibility that radiation damage might impedediffusive loss from apatite was noted by Farley [3] as anexplanation for the distinct curvature seen in 4Hediffusion Arrhenius plots. This model expands on thatgeneral idea. Fig. 4 illustrates a schematic “trappingmodel” of how isolated sites of radiation damage candecrease the net rate of helium mobility and thereforeincrease helium retentivity at a given temperature.Consider a 4He atom that moves by diffusion a givendistance within a crystal. In the absence of radiation-induced damage (Fig. 4a), the kinetics of this diffusion issolely a function of temperature. The rate that the free4He atom (4Hef) diffuses through the solid-state matrixwill be controlled by the corresponding activationenergy, Ea. This is the energy required of the 4He atomto move from one interstitial site to another. Therefore,the net diffusion along the path shown in Fig. 4a will bedescribed with a constant Ea.
Additional complexity will arise from the presence ofa void space along the same path, for instance a sitecharacterized by some number of displaced atomswithin the crystalline matrix [29] (Fig. 4b). Sincehelium diffusion in apatite is nearly isotropic [3],isolated damage cascades may provide enough spacebetween displaced atoms where 4He atoms mayaccumulate at a lower energy state. If there is pre-ferential partitioning into the damaged region, the 4Heatom will become locally “trapped”when it diffuses intothe site. If the energy required for motion within thedamaged site is lower than in the solid matrix, thebehavior of the trapped atom (4Het) will be more like agas. This is analogous to a gas phase trapped inside abubble within a solid, for instance a fluid inclusion. Forthe apatite (U–Th)/He system, we are ultimatelyinterested in the net 4He diffusion out of the mineraland the “effective” diffusivity which describes thatentire process. Therefore, for the trapped 4He atom tocontinue along the same path as in Fig. 4a and exit themineral, it must overcome the energy barrier required topenetrate back into the crystalline matrix. This addi-tional energy Et is associated with partitioning of 4Hebetween the gas and solid phases. As discussed in[3,30], this partitioning will cause the effective diffusioncoefficient for the material to decrease. The net effect ofisolated void spaces is therefore to increase heliumretentivity. As the volume density of radiation-induceddamage increases over time, so also should the nethelium retentivity increase (Fig. 4c). Only when thedensity of damage sites becomes sufficiently high thatthey form an interconnected network with each other
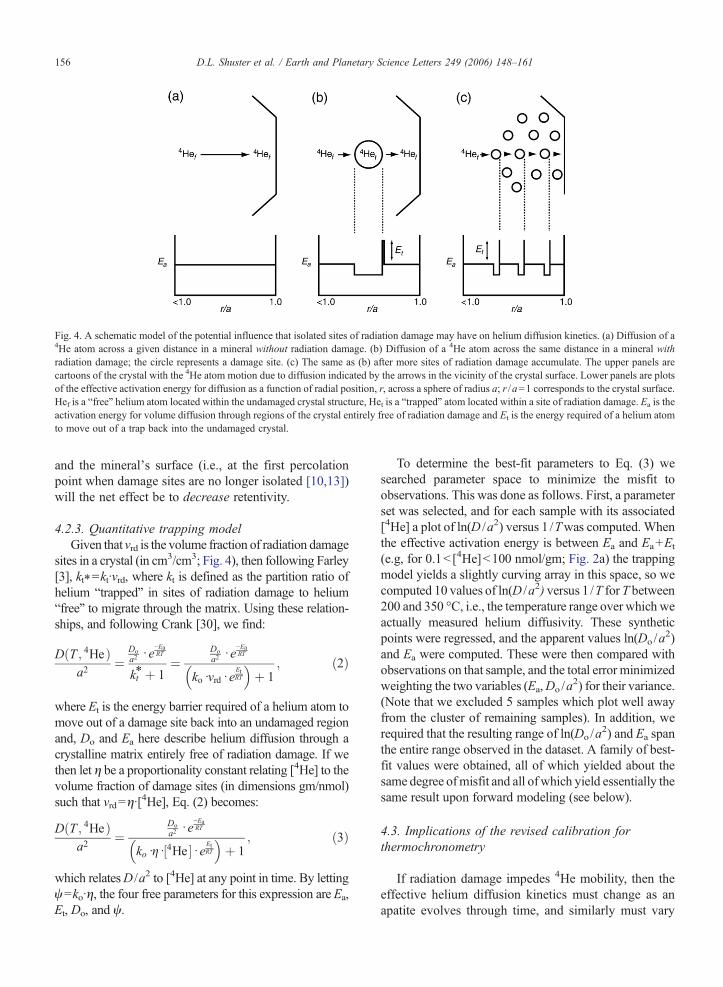
Fig. 4. A schematic model of the potential influence that isolated sites of radiation damage may have on helium diffusion kinetics. (a) Diffusion of a4He atom across a given distance in a mineral without radiation damage. (b) Diffusion of a 4He atom across the same distance in a mineral withradiation damage; the circle represents a damage site. (c) The same as (b) after more sites of radiation damage accumulate. The upper panels arecartoons of the crystal with the 4He atom motion due to diffusion indicated by the arrows in the vicinity of the crystal surface. Lower panels are plotsof the effective activation energy for diffusion as a function of radial position, r, across a sphere of radius a; r /a=1 corresponds to the crystal surface.Hef is a “free” helium atom located within the undamaged crystal structure, Het is a “trapped” atom located within a site of radiation damage. Ea is theactivation energy for volume diffusion through regions of the crystal entirely free of radiation damage and Et is the energy required of a helium atomto move out of a trap back into the undamaged crystal.
156 D.L. Shuster et al. / Earth and Planetary Science Letters 249 (2006) 148–161
and the mineral's surface (i.e., at the first percolationpoint when damage sites are no longer isolated [10,13])will the net effect be to decrease retentivity.
4.2.3. Quantitative trapping modelGiven that vrd is the volume fraction of radiation damage
sites in a crystal (in cm3/cm3; Fig. 4), then following Farley[3], kt⁎=kt·vrd, where kt is defined as the partition ratio ofhelium “trapped” in sites of radiation damage to helium“free” to migrate through the matrix. Using these relation-ships, and following Crank [30], we find:
DðT ; 4HeÞa2
¼Doa2 d e
−EaRT
kt4þ 1¼
Doa2 d e
−EaRT
kodvrdd eEtRT
� �þ 1
; ð2Þ
where Et is the energy barrier required of a helium atom tomove out of a damage site back into an undamaged regionand, Do and Ea here describe helium diffusion through acrystalline matrix entirely free of radiation damage. If wethen let η be a proportionality constant relating [4He] to thevolume fraction of damage sites (in dimensions gm/nmol)such that vrd=η·[
4He], Eq. (2) becomes:
DðT ; 4HeÞa2
¼Doa2 d e
−EaRT
kodgd½4He �d eEtRT
� �þ 1
; ð3Þ
which relatesD /a2 to [4He] at any point in time. By lettingψ=ko·η, the four free parameters for this expression are Ea,Et, Do, and ψ.
To determine the best-fit parameters to Eq. (3) wesearched parameter space to minimize the misfit toobservations. This was done as follows. First, a parameterset was selected, and for each sample with its associated[4He] a plot of ln(D /a2) versus 1 /Twas computed. Whenthe effective activation energy is between Ea and Ea+Et
(e.g, for 0.1b [4He]b100 nmol/gm; Fig. 2a) the trappingmodel yields a slightly curving array in this space, so wecomputed 10 values of ln(D /a2) versus 1/T for T between200 and 350 °C, i.e., the temperature range over which weactually measured helium diffusivity. These syntheticpoints were regressed, and the apparent values ln(Do /a
2)and Ea were computed. These were then compared withobservations on that sample, and the total error minimizedweighting the two variables (Ea,Do /a
2) for their variance.(Note that we excluded 5 samples which plot well awayfrom the cluster of remaining samples). In addition, werequired that the resulting range of ln(Do /a
2) and Ea spanthe entire range observed in the dataset. A family of best-fit values were obtained, all of which yielded about thesame degree ofmisfit and all of which yield essentially thesame result upon forward modeling (see below).
4.3. Implications of the revised calibration forthermochronometry
If radiation damage impedes 4He mobility, then theeffective helium diffusion kinetics must change as anapatite evolves through time, and similarly must vary

Fig. 5. Effective closure temperature as a function of cooling rate andeU (labeled in ppm) computed from the trapping diffusion modelembedded in a 4He production-diffusion model. Results for conven-tional Durango apatite kinetics are also shown. Simulated coolingpaths began at 100 °C at various times selected to yield the reportedcooling rates.
157D.L. Shuster et al. / Earth and Planetary Science Letters 249 (2006) 148–161
from apatite to apatite depending on the concentration ofU and Th. As a result, neither the Dodson formulationfor closure temperature [25] nor previous 4He produc-tion-diffusion models which predict (U–Th)/He ages onarbitrary time-temperature paths [31] will yield accurateresults. We can accommodate the radiation damageeffect using a numerical model in which heliumdiffusivity obeys Eq. (3). Here we compare results ofsuch a model with those obtained using the familiarArrhenius diffusion parameters Ea and Do whenignoring the radiation damage effect. The numericalmodel is based on one previously described [19,31].
In addition to Eq. (3), we must specify the grain sizein the numerical model. This parameter is not explicit inEq. (3) because all grains studied for diffusion wereabout the same size, roughly a=60 μm. This is also thetypical size of dated crystals. Thus grain size does notdirectly enter the diffusivity calculation, but it must beincluded to appropriately compute the effects of α-ejection-rounding on the 4He concentration distribution[19,32]. We assumed a=60 μm for this part of ourmodeling. For comparison, we also computed resultsusing the standard Durango apatite kinetics [3], for thesame grain size and including the effects of α ejection.As we show below, the effects of radiation damage onclosure temperature far exceed the effects of grain size,at least for the range in grain size common to apatite.
To make the modeling quantitative we assumed sixdifferent effective uranium concentrations (eU=U+0.235Th). Over the last several years we analyzed (U–Th)/He ages on ∼ 3500 apatites from many differentrock types and localities, and these results guide ourchoice of eU values. In this population, the median eU is28 ppm, and 95% of the apatites lie between 3.5 and172 ppm.We therefore chose eU values of 4, 15, 28, 60,100 and 150 ppm for illustration.
4.3.1. Monotonic coolingThe simplest time–temperature path to consider is
monotonic cooling at a constant rate from an initialtemperature well above that of 4He retention. Bycomparing the modeled (U–Th)/He age with thetemperature associated with that time in the past, it ispossible to compute an “effective closure temperature”,Tec. In the case of a simple Arrhenius-type kineticsmodel, this procedure yields values identical toDodson's equation [25]. We computed Tec as a functionof cooling rate and eU, as shown in Fig. 5. At rapidcooling rates the new model yields Tec values lower thanthe Durango model. For example, at 10 °C/Myr the newmodel yields Tec between 57 °C for the lowest eUapatite and 65 °C for the highest, compared with 72 °C
for the Durango model. As cooling rate decreases, Tecvalues for the different eU apatites become increasinglydivergent, reflecting the greater time for radiationdamage to build up and influence helium diffusion.For the same reason the Tec values are less steeplysloped with cooling rate than the Durango model; as aresult for all but the lowest eU apatite the Tec valuesexceed those of the Durango model at a cooling rate of0.1 °C/Myr.
The major point of Fig. 5 is that apatite (U–Th)/Heages of monotonically cooled apatites are associatedwith effective closure temperatures that bracket theDurango model, but which may differ from that modelby up to ∼ 15 degrees. Under fast cooling conditions,apatites transit the zone of partial 4He retention fastenough that they acquire less radiation damage thanoccurs in the Durango sample, and hence their Tecvalues are lower than for the standard Durango model.At lower cooling rates, as radiation damage accumulatesand significantly retards diffusivity, the apatites yieldhigher Tec values than the Durango model. The effect ofradiation damage that we infer exceeds the only otherknown control on apatite helium diffusion: Grain size(i.e., a) influence on the quantity Do /a
2 [3]. Forexample, at a cooling rate of 1 °C/Myr the modeledspan of eU values is predicted to induce a total range inTec of about 17 °C; this is about twice as large as the Tec

Fig. 6. The helium partial retention zone computed by assumingapatites of varying eU are held isothermally at the indicatedtemperatures for 75 Myr for the trapping diffusion model andconventional Durango apatite diffusion kinetics. Two curves arelabeled with associated eU values (4, 150 ppm). Unlabelled curves arefor 15, 28, 60, and 100 ppm eU from top to bottom.
158 D.L. Shuster et al. / Earth and Planetary Science Letters 249 (2006) 148–161
difference associated with a factor of two variation ingrain size alone.
Many apatite (U–Th)/He datasets reveal linear age-elevation profiles. The slope of these arrays iscommonly equated with exhumation rate, and thisinterpretation is unchanged by the proposed newdiffusion model provided eU does not correlate withelevation. However variations in eU in the apatitescomprising an age-elevation profile may cause scatter inthe age-elevation relationships especially at low coolingrate, and this may provide a direct test of the newdiffusion model. In addition, absolute amounts ofexhumation are often estimated from the depth of theassumed closure isotherm. As shown in Fig. 5, thatisotherm may be different than the ∼ 70 °C usuallyassumed. The results also indicate that an evolvingdiffusion kinetics given by Eq. (3) will influence thesensitivity of 4He/3He thermochronometry, which wewill explore in future studies.
4.3.2. The helium partial retention zone (HePRZ)Fig. 6 illustrates a He partial retention zone (HePRZ
[31]) calculated using Eq. (3). Results are shown forapatites held isothermally at a range of temperaturesfrom 0 to 95 °C for 75 Myr. In general, the shape of theHePRZ is similar to and brackets that for the Durangomodel. At higher temperatures, ages tend to be lowerthan the Durango model, again reflecting the lowerretentivity of less radiation-damaged apatite. Similarly,at lower temperatures the radiation damage builds upand hence the retentivity approaches and even exceedsthat of Durango apatite, leading to an overall flatteningof the HePRZ. For the median eU apatite, the HePRZdefined as the 10% and 90% points [31] ranges from 38to 54 °C compared with 34 to 65 °C for Durangokinetics. The span in eU produces a spread of about20 °C in the temperature at which He ages change mostrapidly with temperature.
Fig. 6 thus predicts a HePRZ that looks similar toprevious expectations and at a similar temperaturerange. The HePRZ model is most commonly invoked toexplain a “break-in-slope” in an age elevation profile,commonly used to constrain the timing of a transitionfrom slow to fast exhumation. This interpretation isunaffected by the new diffusion model. However theamount of exhumation, derived from the temperature forthe lower temperature bound on the HePRZ and apresumed paleogeothermal gradient, will be lower withthe radiation damage model than with the Durangomodel. For example, for a median eU apatite and ageothermal gradient of 20 °C/km, Fig. 6 implies about500 m less exhumation to reveal the break in slope for
the radiation model than for the Durango model. Thiseffect is probably smaller than the errors associated withassuming a paleogeothermal gradient.
A borehole that has been isothermal (with no priorchance to accumulate radiation damage) and presently atknown temperature could be used to test the radiationdamage model, in particular to assess the slope of theage-depth trend (flatter in the radiation damage model)and the presence of eU correlated age variability.However, previous work on boreholes [4,33], orexhumed normal fault blocks that are thought topreserve a fossil HePRZ [34] lack sufficient sensitivityto apply such a test.
4.3.3. Reheating during burialThe previous two examples reveal that the radiation
damage model yields ages that differ fairly modestlyfrom those of the Durango model for isothermal andmonotonically cooling conditions. However, the con-sequences of radiation-damage related changes indiffusivity can become extremely large for time–temperature paths that involve reheating, in whichradiation damage first accumulates, and then 4He is onlypartially lost. To illustrate this effect we considered anapatite that resides at 0 °C from 300 Myr to 200 Myr,during which radiation damage builds up, followed byheating to a maximum temperature (Tpk) between 0 and

159D.L. Shuster et al. / Earth and Planetary Science Letters 249 (2006) 148–161
100 °C at 100 Myr, followed by monotonic cooling to0 °C at 0 Myr. This is a simplified example of what isexpected to happen to detrital apatites subjected to burialheating.
As shown in Fig. 7, the consequences are profoundand strongly correlated with eU. At low Tpk, all grainsretain all of their helium, and hence all record an age of300 Myr. Similarly, for Tpk values in excess of about90 °C, all grains are “reset” and the difference in agesimply reflects the difference in Tec for the range of eUvalues at 1 °C/Myr, as shown in Fig. 5. However, atintermediate peak temperatures there is an enormousspan in predicted (U–Th)/He age correlated with eU. Atits most extreme at about 60 °C, the low eU grains arealmost completely reset while the high eU grains arealmost completely unaffected by diffusive loss. In thisexample, results of the Durango model plot through themiddle of the swath, reflecting the fact that the model4He concentrations (and hence diffusivities) lie on eitherside of that measured on Durango apatite.
The key message of this figure is that burial reheatingcan be expected to yield extremely large degrees of agescatter, strongly correlated with eU. This is a verysensitive test of the role of radiation damage on helium
Fig. 7. The effects of reheating on (U–Th)/He ages using the trappingmodel as a function of eU and peak temperature achieved, comparedwith ages calculated assuming conventional Durango kinetics andapatite fission track ages computed from two annealing models in“HeFTy” program [48,49]. The model assumes samples are held at0 °C from 300 to 200 Myr, followed by monotonic heating to peaktemperature (Tpk) at 100 Myr, followed by monotonic cooling to 0 °Cat 0 Myr (schematic cooling path shown in inset). Open symbols arecomputed points for various eU values (4, 15, 28, 60, 100, and150 ppm from left to right on the figure).
diffusion and indeed the expected effect has beenobserved in several cases [35–38]. Importantly, thismodel predicts that apatite (U–Th)/He ages will not besignificantly older than apatite fission track ages (Fig. 7)and thus does not offer an obvious explanation for casesin which “age reversal” is observed. However, resultsfrom this type of time–temperature path will beextremely sensitive to the kinetics of annealing ofradiation damage and how 4He mobility responds toannealing. Our model uses 4He concentration as a proxyfor damage, but clearly this is an oversimplification.Further study of annealing as it affects helium diffusionis required to accurately evaluate (U–Th)/He ages ofapatites cooled on such paths.
5. Conclusions
Experimentally determined diffusion coefficients dem-onstrate that the closure temperature (Tc) for heliumretention in apatite spans a wider range than previouslyrecognized: From 44±4 °C to 116±18 °C and correlateswith the radiogenic 4He abundance in a given sample. Weargue that the radiogenic 4He concentration ([4He]) is ameasurable proxy for the U- and Th-decay series radiationdamage that accumulatedwithin each crystal over geologictime. As the volume density of structural damageincreases, apatite becomes more helium retentive. Thisimplies that helium retentivity, and hence the effectivehelium diffusion kinetics, is an evolving function of time.Calibrated with diffusion kinetics of 39 different apatitesamples, we present a simple, quantitative “trappingmodel” which relates diffusivity to both temperature and[4He]. Here [4He] is an indirect but only approximateindicator of the volume fraction of radiation damage. Thesimple model predicts the observed log-linear correlationbetweenTc and [
4He]. By inserting this function into a 4Heproduction-diffusion calculation, the “trapping model” fordiffusion kinetics predicts: (i) that the effective 4He closuretemperature of apatite will vary with cooling rate andeffective U concentration (eU) and may differ from 70 °Cby up to ±15 °C, (ii) the depth of the 4He partial retentionzonewill depend on accumulation time and on eU, and (iii)samples subjected to reheating after accumulation ofsubstantial radiation damage will be more retentive thanpreviously expected.
Acknowledgement
We thank the many people who (inadvertently)provided samples for this study and those whoparticipated in the field work to collect them. Wethank Anne Blythe, Marin Clark, Todd Ehlers, Martha

160 D.L. Shuster et al. / Earth and Planetary Science Letters 249 (2006) 148–161
House, Margi Rusmore, Jim Spotila, Rich Wolf and inparticular Ray Donelick, Trevor Dumitru, Paul Green,Julie Libarkin and Pete Reiners who provided sampleswhere the (U–Th)/He results have not been publishedelsewhere. We also thank Lindsey Hedges for the helpwith sample preparation. We appreciate two very helpfulreviews by an anonymous referee and Peter Zeitler. Thiswork was supported by NSF grant 0408526 to KAF.
Appendix A. Supplementary data
Supplementary data associated with this article can befound, in the online version, at doi:10.1016/j.epsl.2006.07.028.
References
[1] K.A. Farley, (U–Th)/He dating: techniques, calibrations, andapplications, Noble Gases in Geochemistry and Cosmochemis-try, 2002, pp. 819–844.
[2] P.W. Reiners, T.A. Ehlers, P.K. Zeitler, Past, present, and futureof thermochronology, Low-Temperature Thermochronology:Techniques, Interpretations, and Applications, 2005, pp. 1–18.
[3] K.A. Farley, Helium diffusion from apatite: general behavior asillustrated by Durango fluorapatite, J. Geophys. Res. 105 (2000)2903–2914.
[4] A.C. Warnock, et al., An evaluation of low-temperature apatiteU–Th/He thermochronometry, Geochim. Cosmochim. Acta 61(24) (1997) 5371–5377.
[5] R.A. Wolf, K.A. Farley, L.T. Silver, Helium diffusion and low-temperature thermochronometry of apatite, Geochim. Cosmo-chim. Acta 60 (21) (1996) 4231–4240.
[6] P.K. Zeitler, et al., U–Th-He dating of apatite: a potential thermo-chronometer, Geochim. Cosmochim. Acta 51 (1987) 2865–2868.
[7] R.C. Ewing, W.J. Weber, J.F.W. Clinard, Radiation effects innuclear waste forms for high-level radioactive waste, Prog. Nucl.Energy 29 (2) (1995) 63–127.
[8] W.J. Weber, et al., Radiation effects in crystalline ceramics for theimmobilization of high-level nuclear waste and plutonium, J. Mater.Res. 13 (6) (1998) 1434–1484.
[9] W.J. Weber, R.C. Ewing, L.M. Wang, The radiation-inducedcrystalline-to-amorphous transition in zircon, J. Mater. Res. 9 (3)(1994) 688–698.
[10] S. Rios, et al., Amorphization in zircon: evidence for direct impactdamage, J. Phys., Condens. Matter 12 (11) (2000) 2401–2412.
[11] R.C. Ewing, et al., Radiation effects in zircon, Zircon, 2003,pp. 387–425.
[12] W.J. Weber, R.C. Ewing, A. Meldrum, The kinetics of alpha-decay-induced amorphization in zircon and apatite containingweapons-grade plutonium or other actinides, J. Nucl. Mater. 250(2–3) (1997) 147–155.
[13] K. Trachenko, M.T. Dove, E.K.H. Salje, Structural changes inzircon under alpha-decay irradiation, Phys. Rev., B 65 (18) (2002).
[14] R.A. Donelick, P.B. O'Sullivan, R.A. Ketcham, Apatite fission-track analysis, Low-Temperature Thermochronology: Techni-ques, Interpretations, and Applications, 2005, pp. 49–94.
[15] Hurley, P.M., The helium age method and the distribution andmigration of helium in rocks, i.F. Hurley PM (1954) The helium
age method and the distribution and migration of helium inrocks, H., ed., Nuclear Geology: New York, John Wiley andSons, p. 301–329., Editor. 1954.
[16] L. Nasdala, et al., Incomplete retention of radiation damage inzircon from Sri Lanka, Am. Mineral. 89 (1) (2004) 219–231.
[17] P.W. Reiners, et al., (U–Th)/(He–Pb) double dating of detritalzircons, Am. J. Sci. 305 (4) (2005) 259–311.
[18] D.L. Shuster, K.A. Farley, Diffusion kinetics of proton-induced21Ne, 3He, and 4He in quartz, Geochim. Cosmochim. Acta 69 (9)(2005) 2349–2359.
[19] D.L. Shuster, K.A. Farley, 4He/3He thermochronometry, EarthPlanet. Sci. Lett. 217 (1–2) (2004) 1–17.
[20] H. Fechtig, S. Kalbitzer, The diffusion of argon in potassiumbearing solids, in: O.A. Schaeffer, J. Zahringer (Eds.), Potassi-um–Argon Dating, Heidelberg, Springer, 1966, pp. 68–106.
[21] D.L. Shuster, et al., Quantifying the diffusion kinetics and spatialdistributions of radiogenic 4He in minerals containing proton-induced 3He, Earth Planet. Sci. Lett. 217 (1–2) (2004) 19–32.
[22] K. Farley, P. Reiners, V. Nenow, An apparatus for high-precisionhelium diffusion measurements from minerals, Anal. Chem. 71(1999) 2059–2061.
[23] D.L. Shuster, T.A. Ehlers, M.E. Rusmore, K.A. Farley, Rapidglacial erosion at 1.8 Ma revealed by 4He/3He thermochrono-metry, Science 310 (5754) (2005) 1668–1670.
[24] P.W. Reiners, K.A. Farley, Helium diffusion and (U–Th)/Hethermochronometry of titanite, Geochim. Cosmochim. Acta 63(1999) 3845–3859.
[25] M.H. Dodson, Closure temperatures in cooling geological andpetrological systems, Contrib. Mineral. Petrol. 40 (1973) 259–274.
[26] D.L. Shuster, K.A. Farley, 4He/3He Thermochronometry: theory,practice and potential complications, in: P.W. Reiners, T.A.Ehlers (Eds.), Low-temperature thermochronology: techniques,interpretations, and applications, Mineralogical Society ofAmerica, Washington, D.C., 2005, pp. 181–202.
[27] P. Green, et al., Thermal annealing of fission tracks in apatite: 1.A qualitative description, Chem. Geol. 59 (1986) 237–253.
[28] B.X. Gu, et al., The effect of H+ irradiation on the Cs-ion exchangecapacity of zeolite–NaY, J.Mater. Chem. 10 (11) (2000) 2610–2616.
[29] A. Meldrum, L.M. Wang, R.C. Ewing, Electron-irradiation-induced phase segregation in crystalline and amorphous apatite: aTEM study, Am. Mineral. 82 (9–10) (1997) 858–869.
[30] J. Crank, The Mathematics of Diffusion, 2nd ed. OxfordUniversity Press, New York, 1975 414.
[31] R.A. Wolf, K.A. Farley, D.M. Kass, Modeling of the temperaturesensitivity of the apatite (U–Th)/He thermochronometer, Chem.Geol. 148 (1998) 105–114.
[32] K.A. Farley, R.A. Wolf, L.T. Silver, The effects of long alpha-stopping distances on (U–Th)/He ages, Geochim. Cosmochim.Acta 60 (1996) 4223–4229.
[33] M.A. House, et al., Evaluating thermal history models for theOtway Basin, southeastern Australia, using (U–Th)/He andfission-track data from borehole apatites, Tectonophysics 349(1–4) (2002) 277–295.
[34] D.F. Stockli, K.A. Farley, T.A. Dumitru, Calibration of the apatite(U–Th)/He thermochronometer on an exhumed fault block,White Mountains, California, Geology 28 (11) (2000) 983–986.
[35] P.D. Crowley, et al., Laramide exhumation of the BighornMountains, Wyoming: an apatite (U–Th)/He thermochronologystudy, Geology 30 (1) (2002) 27–30.
[36] R.M. Flowers, et al., Radiation damage control on apatite (U–Th)/He dates from the Grand Canyon region, Colorado Plateau.Geology, 2006. In Review.
161D.L. Shuster et al. / Earth and Planetary Science Letters 249 (2006) 148–161
[37] P.F. Green, I.R. Duddy, Interpretation of apatite (U-Th)/He agesand fission track ages from cratons, Earth Planet. Sci. Lett. 244(2006) 541–547.
[38] J.A. Spotila, et al., Origin of the Blue Ridge escarpment along thepassive margin of Eastern North America, Basin Res. 16 (1)(2004) 41–63.
[39] A.E. Blythe, et al., Structural and topographic evolution of thecentral Transverse Ranges, California, from apatite fission-track,(U–Th)/He and digital elevation model analyses, Basin Res. 12(2) (2000) 97–114.
[40] M.K. Clark, et al., Late Cenozoic uplift of southeastern Tibet,Geology 33 (6) (2005) 525–528.
[41] M.K. Clark, et al., The non-equilibrium landscape of the southernSierra Nevada, California, GSA Today 15 (9) (2005) 4–10.
[42] K.A. Farley, M.E. Rusmore, S.W. Bogue, Post-10 Ma uplift andexhumation of the northern coast mountains, British Columbia,Geology 29 (2) (2001) 99–102.
[43] M.A. House, B.P. Wernicke, K.A. Farley, Paleo-geomorphologyof the Sierra Nevada, California, from (U–Th)/He ages in apatite,Am. J. Sci. 301 (2) (2001) 77–102.
[44] M.A. House, et al., Cenozoic thermal evolution of the centralSierra Nevada from (U–Th)/He thermochronometry, EarthPlanet. Sci. Lett. 151 (1997) 167–179.
[45] P.W.Reiners,K.A. Farley, Influence of crystal size on apatite (U–Th)/He thermochronology: an example from the Bighorn mountains,Wyoming, Earth Planet. Sci. Lett. 188 (2001) 413–420.
[46] J.A. Spotila, et al., Near-field transpressive deformation along theSan Andreas fault zone in southern California, based onexhumation constrained by (U–Th)/He dating, J. Geophys.Res., [Solid Earth] 106 (B12) (2001) 30909–30922.
[47] R.A. Wolf, Development of the (U–Th)/He thermochronometer,Division of Geological and Planetary Sciences, CaliforniaInstitute of Technology, Pasadena, CA, 1996, p. 212.
[48] T.A. Ehlers, et al., Computational tools for low-temperaturethermochronometer interpretation, Low-Temperature Thermo-chronology: Techniques, Interpretations, and Applications, 2005,pp. 589–622.
[49] R.A Ketcham, Forward and inverse modeling of low-temperaturethermochronometry data, Low-Temperature Thermochronology:Techniques, Interpretations, and Applications, 2005, pp. 275–314.

Supplementary file for: “The influence of natural radiation damage on helium diffusion kinetics in apatite.” by David L. Shuster1,2,*, Rebecca M. Flowers1, Kenneth A. Farley1
1Division of Geological and Planetary Science, MC 100-25, California Institute of Technology, Pasadena, CA 91125, USA 2Now at: Berkeley Geochronology Center, 2455 Ridge Road, Berkeley, CA 94709, USA *Corresponding author. Tel.: +1-510-644-9891; Fax: +1-510-644-9201 E-mail addresses: [email protected] (D.L. Shuster), [email protected] (R.M. Flowers), [email protected] (K.A. Farley) This 44 page file contains the following:
page
1. Supplementary figure captions 2 2. References in figure captions 2 3. Table ST1: Electron microprobe data 3 4. Figure S1: Arrhenius plots for proton-induced 3He based experiments (1-26) 4-29 5. Figure S2: Arrhenius plots for radiogenic 4He based experiments (1-13) 30-42 6. Figure S3: Predicted values for the multiple linear regression (MLR) model 43 7. Figure S4: Predicted values for the “trapping” model 44
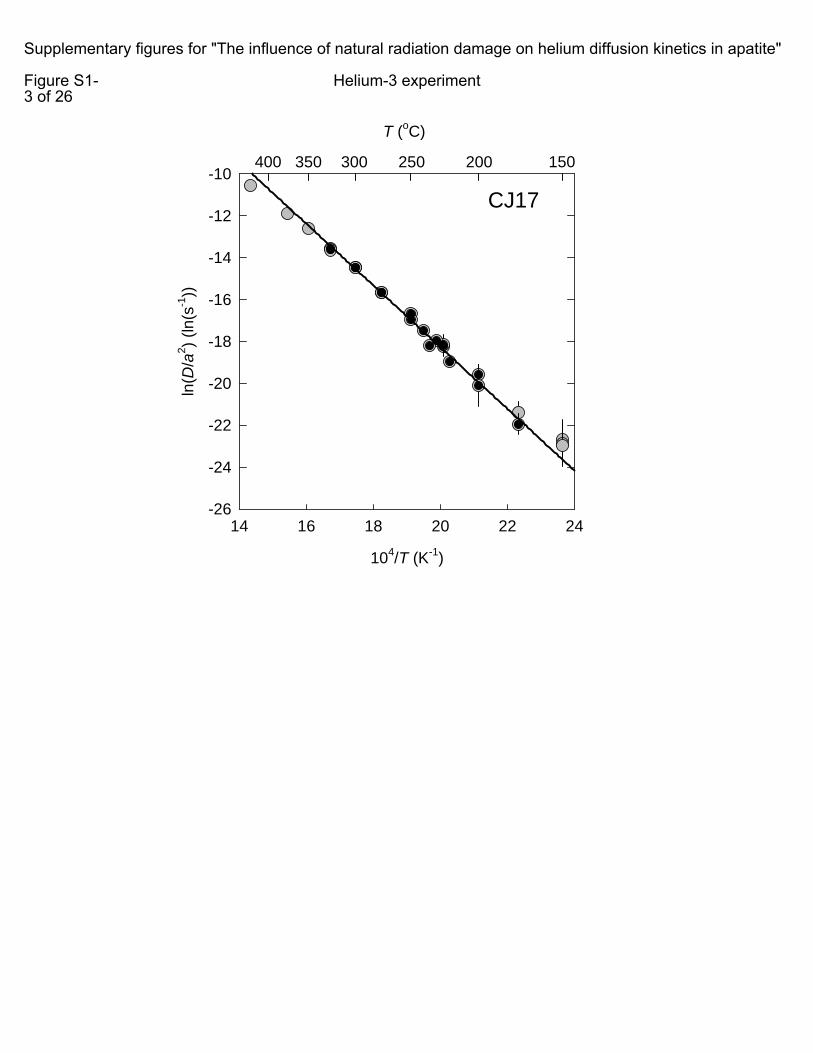
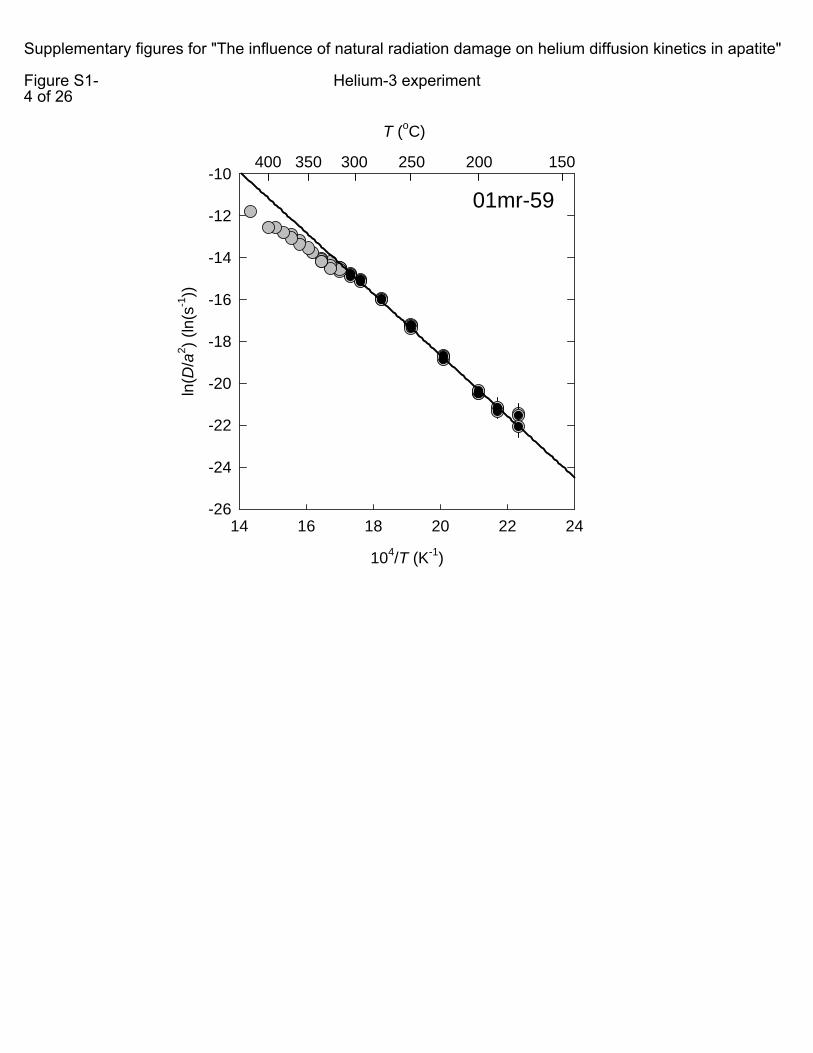
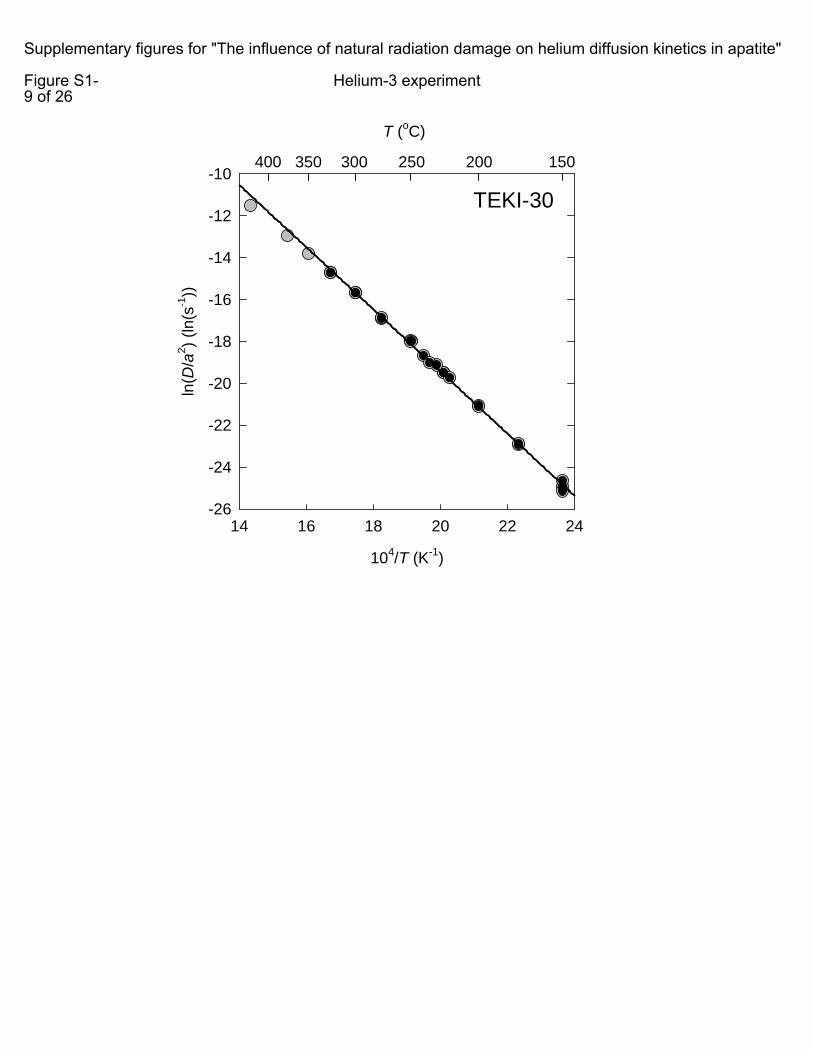
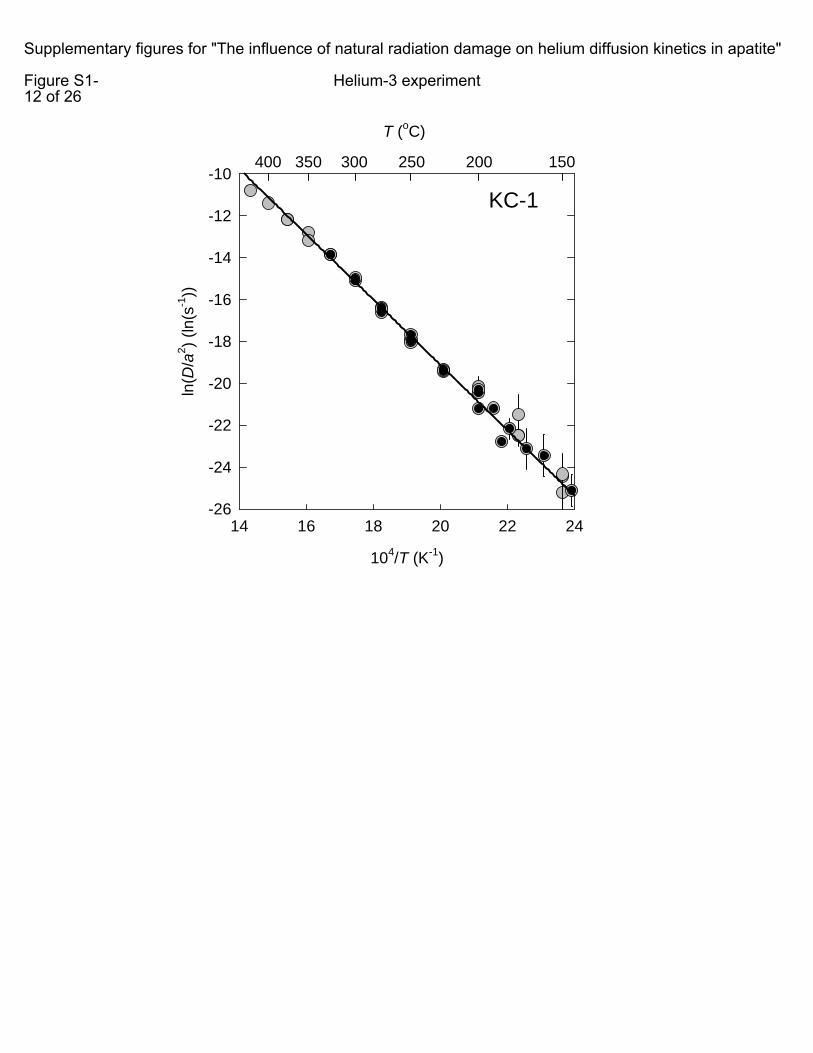
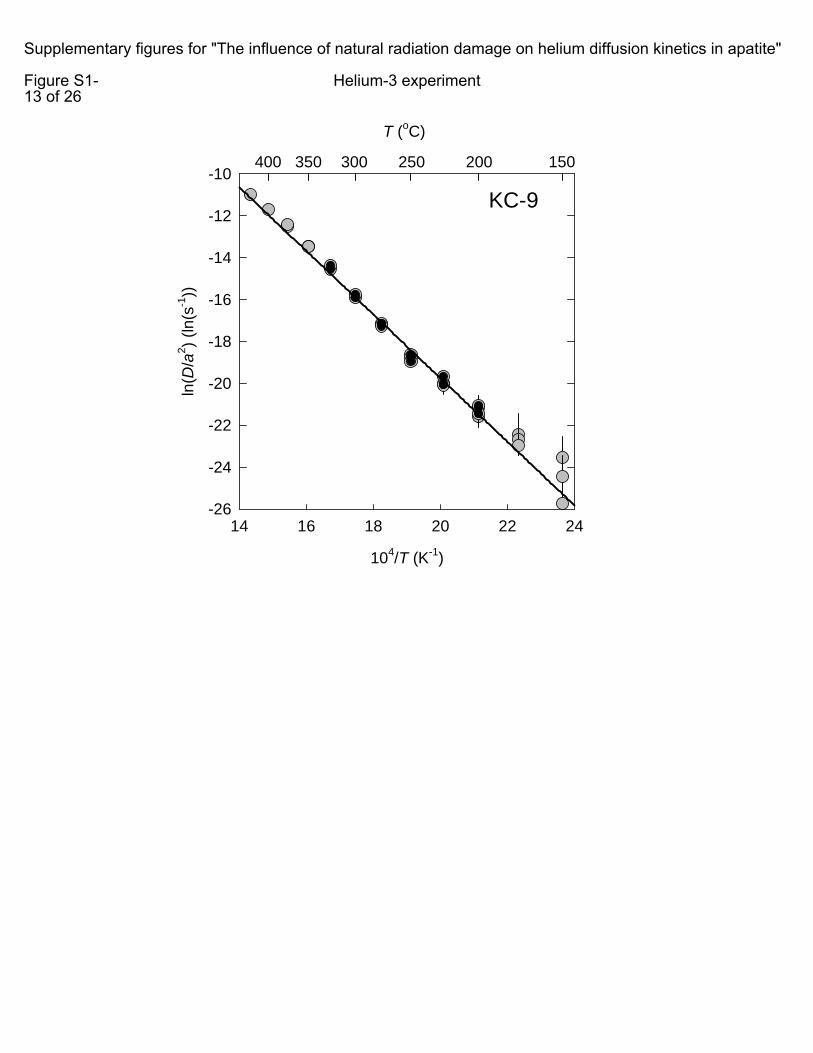
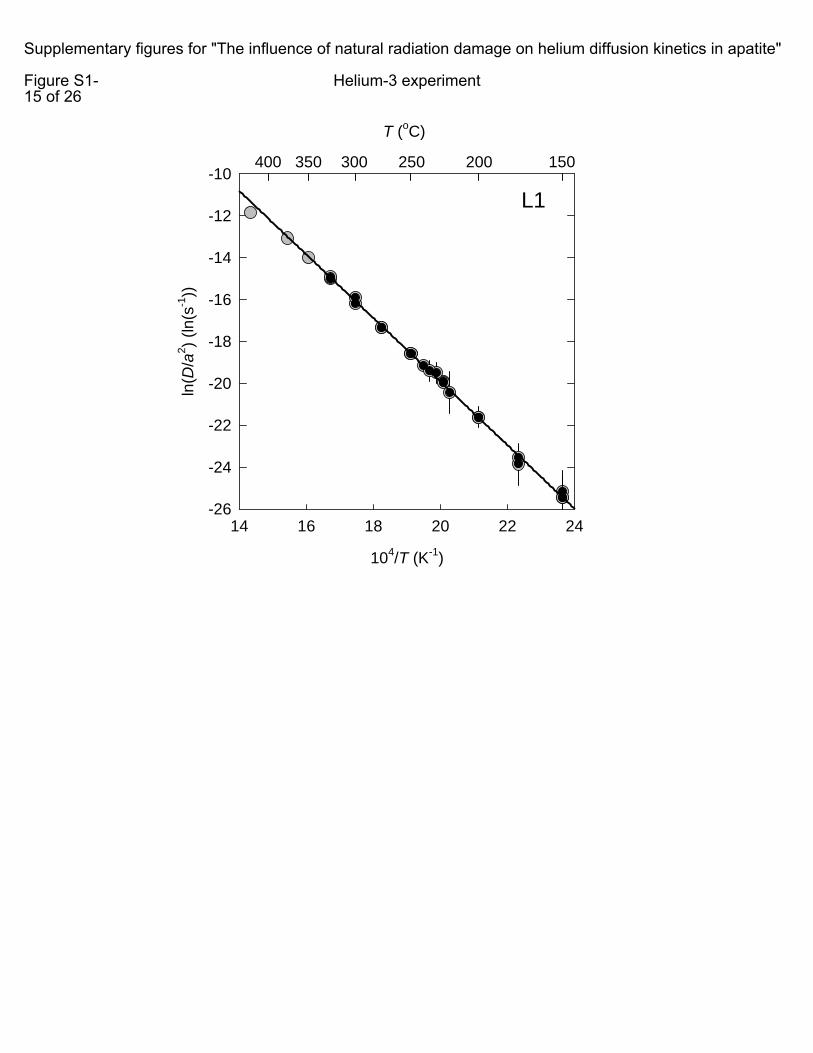
Supplementary Figure Captions Fig. S1 Arrhenius plots for the 26 experiments using proton-induced 3He as the diffusant.
Open circles are the diffusion coefficients, D, normalized to the diffusive length scale, a, calculated [1] from release fractions of proton-induced 3He [2]. Solid black line is the inferred helium diffusion kinetics determined by linear regression to a subset array (indicated as black circles) selected using the criteria discussed in the main text.
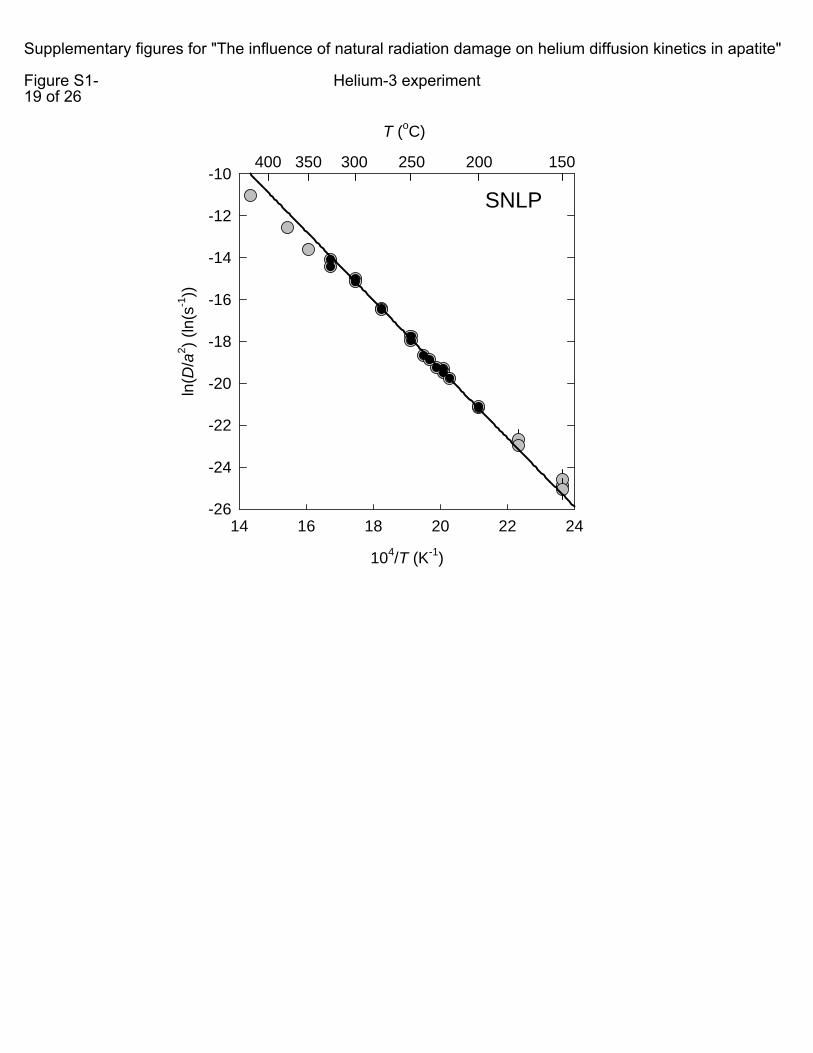
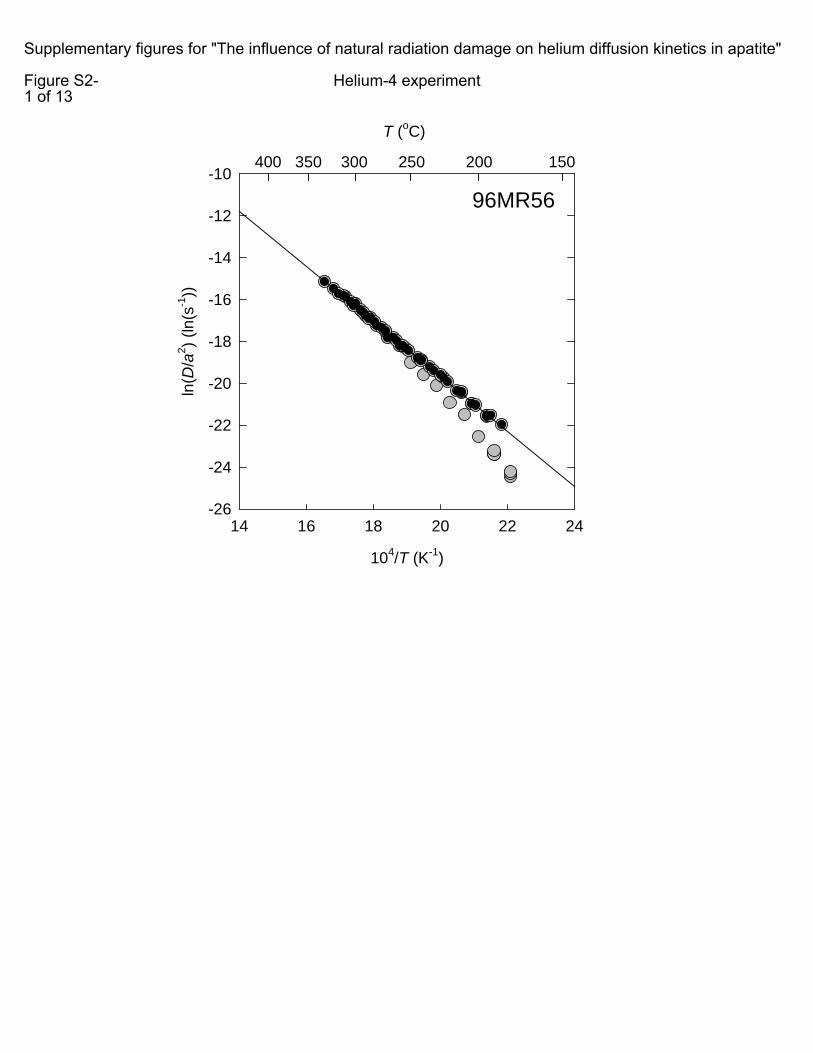
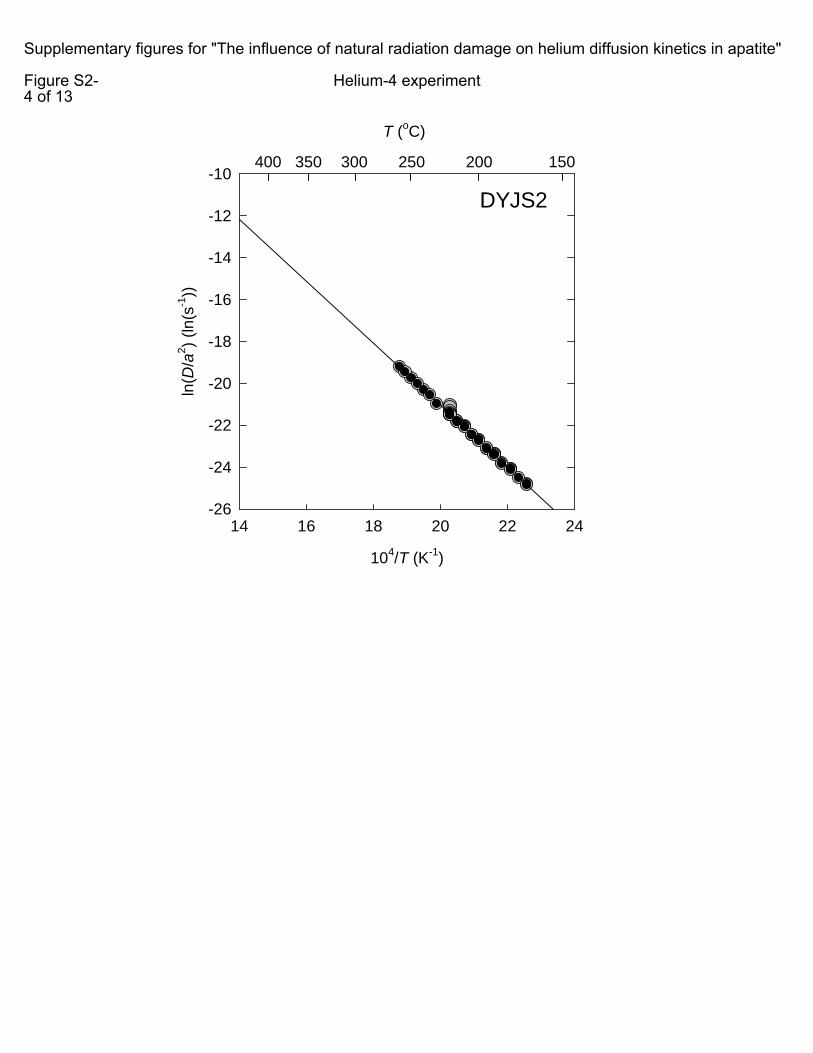
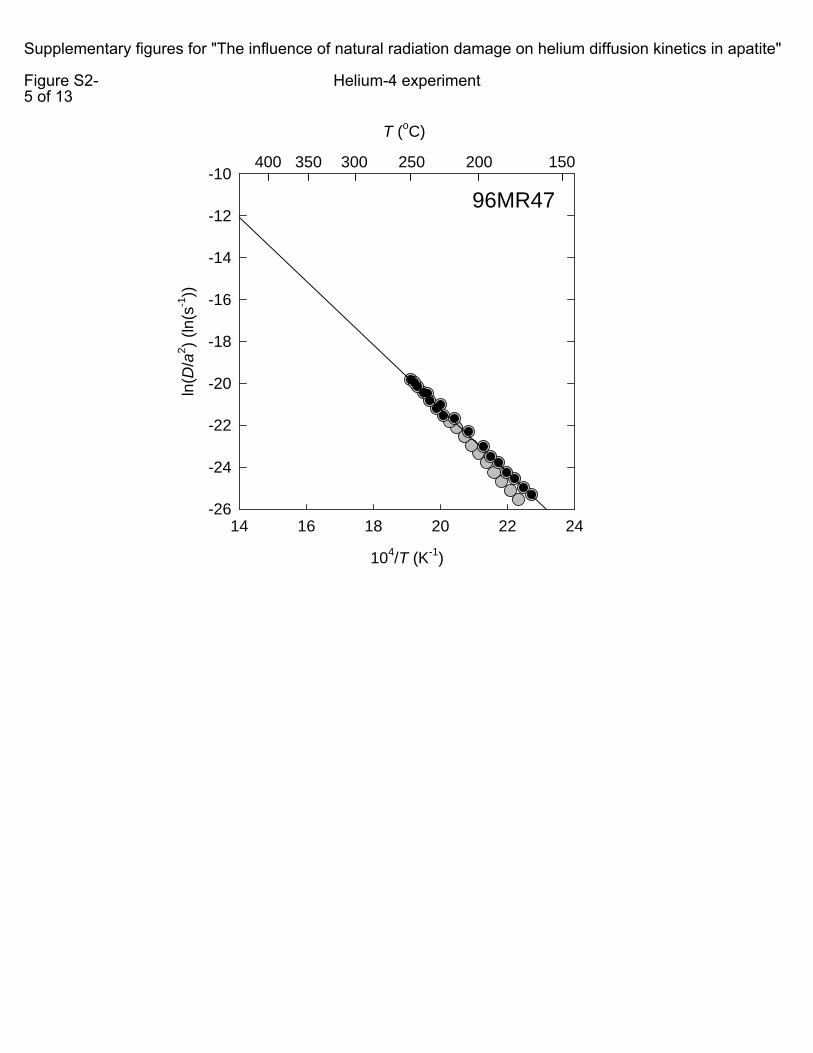
Fig. S2 Arrhenius plots for 13 experiments using radiogenic 4He as the diffusant. Open
circles are the diffusion coefficients, D, normalized to the diffusive length scale, a, calculated [1] from release fractions of 4He. Solid black line is the inferred helium diffusion kinetics determined by linear regression to a subset array (indicated as black circles) selected using the criteria discussed in the main text.
Fig. S3 A comparison of the experimentally determined values for each sample with the
predicted values calculated from the multiple linear regression model shown in Eq. 1 (i.e., D/a2 = f(T, [4He]). (a) The closure temperature (Tc). (b) Values of log10(D/a2) extrapolated to and calculated for temperatures between 150 oC and 30 oC at 20 oC intervals. Lines are slope 1.
Fig. S4 A comparison of the experimentally determined values for each sample with the
predicted values calculated from the quantitative “trapping model” shown in Eq. 3 for best fit parameters: Ea = 120 kJ/mol, Et = 29 kJ/mol, Do = 1.58×10⁴ s-1, and ψ = 1.26×10⁻⁴ gm/nmol.. (a) The closure temperature (Tc). (b) Values of log10(D/a2) extrapolated to and calculated for temperatures between 150 oC and 30 oC at 20 oC intervals. Lines are slope 1.
References: 1. Fechtig, H. and S. Kalbitzer, The diffusion of argon in potassium bearing solids,
in Potassium-Argon Dating, O.A. Schaeffer and J. Zahringer, Editors. 1966, Springer: Heidelberg. p. 68-106.
2. Shuster, D.L., et al., Quantifying the diffusion kinetics and spatial distributions of radiogenic 4He in minerals containing proton-induced 3He. Earth and Planetary Science Letters, 2004. 217(1-2): p. 19-32.

Table ST1: Electron probe data.Sample CaO (+/-) P2O5 (+/-) FeO (+/-) MnO (+/-) F (+/-) Cl (+/-) T c (oC) (+/-)01MR-59 53.92 0.05 40.53 0.10 0.09 0.00 0.07 0.00 4.17 0.05 0.77 0.01 49.2 6.6L1 53.68 0.12 40.34 0.19 0.10 0.01 0.12 0.00 4.35 0.27 0.52 0.01 62.1 5.5Durango 53.34 0.11 40.10 0.16 0.03 0.01 0.00 0.00 5.51 0.36 0.43 0.00 71.7 1.995MR-17 54.54 0.14 40.85 0.14 0.02 0.00 0.06 0.02 4.09 0.20 0.23 0.01 67.3 9.2DYJS-5 54.33 0.08 41.01 0.11 0.02 0.01 0.06 0.00 5.03 0.27 0.19 0.01 49.9 5.1MH96-17 54.37 0.27 40.79 0.54 0.14 0.12 0.08 0.01 4.54 0.05 0.15 0.02 80.3 13.7MC01-15 54.54 0.08 40.58 0.18 0.02 0.00 0.06 0.02 4.70 0.15 0.13 0.04 59.7 8.398mr-86 54.15 0.19 40.32 0.09 0.03 0.01 0.07 0.01 4.59 0.10 0.10 0.01 65.1 9.10316GT 54.23 0.12 40.55 0.15 0.04 0.01 0.09 0.01 4.62 0.16 0.08 0.01 71.7 9.1cj17 54.47 0.14 40.72 0.22 0.05 0.02 0.06 0.01 4.96 0.26 0.07 0.00 47.9 11.5cj50 54.46 0.09 40.72 0.05 0.02 0.02 0.05 0.00 5.22 0.28 0.05 0.00 49.4 3.7MH96-14 54.49 0.02 41.01 0.05 0.01 0.00 0.09 0.02 5.26 0.14 0.04 0.01 68.3 5.3MC01-14 54.83 0.15 41.13 0.15 0.02 0.01 0.07 0.01 5.33 0.03 0.01 0.00 46.8 8.60309GT 54.42 0.02 40.73 0.04 0.01 0.01 0.09 0.01 5.52 0.36 0.01 0.00 61.8 14.5MC01-11 54.50 0.13 41.30 0.11 0.01 0.01 0.10 0.03 5.61 0.23 0.01 0.00 57.3 6.903SS17 54.41 0.08 40.77 0.16 0.03 0.00 0.07 0.01 5.42 0.16 0.01 0.00 54.1 7.6All chemical data is reported as weight percent with 1σ analytical uncertainties.

MC01-14
104/T (K-1)
14 16 18 20 22 24
ln(D
/a2 ) (
ln(s
-1))
-26
-24
-22
-20
-18
-16
-14
-12
-10
T (oC)
150200300350400 250
Supplementary figures for "The influence of natural radiation damage on helium diffusion kinetics in apatite"
Figure S1-1 of 26
Helium-3 experiment

00mr-18
104/T (K-1)
14 16 18 20 22 24
ln(D
/a2 ) (
ln(s
-1))
-26
-24
-22
-20
-18
-16
-14
-12
-10
T (oC)
150200300350400 250
Supplementary figures for "The influence of natural radiation damage on helium diffusion kinetics in apatite"
Figure S1-2 of 26
Helium-3 experiment
CJ17
104/T (K-1)
14 16 18 20 22 24
ln(D
/a2 ) (
ln(s
-1))
-26
-24
-22
-20
-18
-16
-14
-12
-10
T (oC)
150200300350400 250
Supplementary figures for "The influence of natural radiation damage on helium diffusion kinetics in apatite"
Figure S1-3 of 26
Helium-3 experiment
01mr-59
104/T (K-1)
14 16 18 20 22 24
ln(D
/a2 ) (
ln(s
-1))
-26
-24
-22
-20
-18
-16
-14
-12
-10
T (oC)
150200300350400 250
Supplementary figures for "The influence of natural radiation damage on helium diffusion kinetics in apatite"
Figure S1-4 of 26
Helium-3 experiment

CJ50
104/T (K-1)
14 16 18 20 22 24
ln(D
/a2 ) (
ln(s
-1))
-26
-24
-22
-20
-18
-16
-14
-12
-10
T (oC)
150200300350400 250
Supplementary figures for "The influence of natural radiation damage on helium diffusion kinetics in apatite"
Figure S1-5 of 26
Helium-3 experiment

dyjs-5
104/T (K-1)
14 16 18 20 22 24
ln(D
/a2 ) (
ln(s
-1))
-26
-24
-22
-20
-18
-16
-14
-12
-10
T (oC)
150200300350400 250
Supplementary figures for "The influence of natural radiation damage on helium diffusion kinetics in apatite"
Figure S1-6 of 26
Helium-3 experiment

03SS-17
104/T (K-1)
14 16 18 20 22 24
ln(D
/a2 ) (
ln(s
-1))
-26
-24
-22
-20
-18
-16
-14
-12
-10
T (oC)
150200300350400 250
Supplementary figures for "The influence of natural radiation damage on helium diffusion kinetics in apatite"
Figure S1-7 of 26
Helium-3 experiment

TEKI-38
104/T (K-1)
14 16 18 20 22 24
ln(D
/a2 ) (
ln(s
-1))
-26
-24
-22
-20
-18
-16
-14
-12
-10
T (oC)
150200300350400 250
Supplementary figures for "The influence of natural radiation damage on helium diffusion kinetics in apatite"
Figure S1-8 of 26
Helium-3 experiment
TEKI-30
104/T (K-1)
14 16 18 20 22 24
ln(D
/a2 ) (
ln(s
-1))
-26
-24
-22
-20
-18
-16
-14
-12
-10
T (oC)
150200300350400 250
Supplementary figures for "The influence of natural radiation damage on helium diffusion kinetics in apatite"
Figure S1-9 of 26
Helium-3 experiment

MC01-11
104/T (K-1)
14 16 18 20 22 24
ln(D
/a2 ) (
ln(s
-1))
-26
-24
-22
-20
-18
-16
-14
-12
-10
T (oC)
150200300350400 250
Supplementary figures for "The influence of natural radiation damage on helium diffusion kinetics in apatite"
Figure S1-10 of 26
Helium-3 experiment

MC01-15
104/T (K-1)
14 16 18 20 22 24
ln(D
/a2 ) (
ln(s
-1))
-26
-24
-22
-20
-18
-16
-14
-12
-10
T (oC)
150200300350400 250
Supplementary figures for "The influence of natural radiation damage on helium diffusion kinetics in apatite"
Figure S1-11 of 26
Helium-3 experiment
KC-1
104/T (K-1)
14 16 18 20 22 24
ln(D
/a2 ) (
ln(s
-1))
-26
-24
-22
-20
-18
-16
-14
-12
-10
T (oC)
150200300350400 250
Supplementary figures for "The influence of natural radiation damage on helium diffusion kinetics in apatite"
Figure S1-12 of 26
Helium-3 experiment
KC-9
104/T (K-1)
14 16 18 20 22 24
ln(D
/a2 ) (
ln(s
-1))
-26
-24
-22
-20
-18
-16
-14
-12
-10
T (oC)
150200300350400 250
Supplementary figures for "The influence of natural radiation damage on helium diffusion kinetics in apatite"
Figure S1-13 of 26
Helium-3 experiment

03GT09
104/T (K-1)
14 16 18 20 22 24
ln(D
/a2 ) (
ln(s
-1))
-26
-24
-22
-20
-18
-16
-14
-12
-10
T (oC)
150200300350400 250
Supplementary figures for "The influence of natural radiation damage on helium diffusion kinetics in apatite"
Figure S1-14 of 26
Helium-3 experiment
L1
104/T (K-1)
14 16 18 20 22 24
ln(D
/a2 ) (
ln(s
-1))
-26
-24
-22
-20
-18
-16
-14
-12
-10
T (oC)
150200300350400 250
Supplementary figures for "The influence of natural radiation damage on helium diffusion kinetics in apatite"
Figure S1-15 of 26
Helium-3 experiment

TEKI-34
104/T (K-1)
14 16 18 20 22 24
ln(D
/a2 ) (
ln(s
-1))
-26
-24
-22
-20
-18
-16
-14
-12
-10
T (oC)
150200300350400 250
Supplementary figures for "The influence of natural radiation damage on helium diffusion kinetics in apatite"
Figure S1-16 of 26
Helium-3 experiment

95mr-17
104/T (K-1)
14 16 18 20 22 24
ln(D
/a2 ) (
ln(s
-1))
-26
-24
-22
-20
-18
-16
-14
-12
-10
T (oC)
150200300350400 250
Supplementary figures for "The influence of natural radiation damage on helium diffusion kinetics in apatite"
Figure S1-17 of 26
Helium-3 experiment

T (oC)
150200300350400 250
98mr-86
104/T (K-1)
14 16 18 20 22 24
ln(D
/a2 ) (
ln(s
-1))
-26
-24
-22
-20
-18
-16
-14
-12
-10
Supplementary figures for "The influence of natural radiation damage on helium diffusion kinetics in apatite"
Figure S1-18 of 26
Helium-3 experiment
SNLP
104/T (K-1)
14 16 18 20 22 24
ln(D
/a2 ) (
ln(s
-1))
-26
-24
-22
-20
-18
-16
-14
-12
-10
T (oC)
150200300350400 250
Supplementary figures for "The influence of natural radiation damage on helium diffusion kinetics in apatite"
Figure S1-19 of 26
Helium-3 experiment

MH96-14
104/T (K-1)
14 16 18 20 22 24
ln(D
/a2 ) (
ln(s
-1))
-26
-24
-22
-20
-18
-16
-14
-12
-10
T (oC)
150200300350400 250
Supplementary figures for "The influence of natural radiation damage on helium diffusion kinetics in apatite"
Figure S1-20 of 26
Helium-3 experiment

KC-10
104/T (K-1)
14 16 18 20 22 24
ln(D
/a2 ) (
ln(s
-1))
-26
-24
-22
-20
-18
-16
-14
-12
-10
T (oC)
150200300350400 250
Supplementary figures for "The influence of natural radiation damage on helium diffusion kinetics in apatite"
Figure S1-21 of 26
Helium-3 experiment

03GT16
104/T (K-1)
14 16 18 20 22 24
ln(D
/a2 ) (
ln(s
-1))
-26
-24
-22
-20
-18
-16
-14
-12
-10
T (oC)
150200300350400 250
Supplementary figures for "The influence of natural radiation damage on helium diffusion kinetics in apatite"
Figure S1-22 of 26
Helium-3 experiment

92TD-118
104/T (K-1)
14 16 18 20 22 24
ln(D
/a2 ) (
ln(s
-1))
-26
-24
-22
-20
-18
-16
-14
-12
-10
T (oC)
150200300350400 250
Supplementary figures for "The influence of natural radiation damage on helium diffusion kinetics in apatite"
Figure S1-23 of 26
Helium-3 experiment

92TD-108
104/T (K-1)
14 16 18 20 22 24
ln(D
/a2 ) (
ln(s
-1))
-26
-24
-22
-20
-18
-16
-14
-12
-10
T (oC)
150200300350400 250
Supplementary figures for "The influence of natural radiation damage on helium diffusion kinetics in apatite"
Figure S1-24 of 26
Helium-3 experiment

CJ-12
104/T (K-1)
14 16 18 20 22 24
ln(D
/a2 ) (
ln(s
-1))
-26
-24
-22
-20
-18
-16
-14
-12
-10
T (oC)
150200300350400 250
Supplementary figures for "The influence of natural radiation damage on helium diffusion kinetics in apatite"
Figure S1-25 of 26
Helium-3 experiment

MH96-17
104/T (K-1)
14 16 18 20 22 24
ln(D
/a2 ) (
ln(s
-1))
-26
-24
-22
-20
-18
-16
-14
-12
-10
T (oC)
150200300350400 250
Supplementary figures for "The influence of natural radiation damage on helium diffusion kinetics in apatite"
Figure S1-26 of 26
Helium-3 experiment
96MR56
104/T (K-1)
14 16 18 20 22 24
ln(D
/a2 ) (
ln(s
-1))
-26
-24
-22
-20
-18
-16
-14
-12
-10
T (oC)
150200300350400 250
Supplementary figures for "The influence of natural radiation damage on helium diffusion kinetics in apatite"
Figure S2-1 of 13
Helium-4 experiment

SG-7
104/T (K-1)
14 16 18 20 22 24
ln(D
/a2 ) (
ln(s
-1))
-26
-24
-22
-20
-18
-16
-14
-12
-10
T (oC)
150200300350400 250
Supplementary figures for "The influence of natural radiation damage on helium diffusion kinetics in apatite"
Figure S2-2 of 13
Helium-4 experiment

95MR17
104/T (K-1)
14 16 18 20 22 24
ln(D
/a2 ) (
ln(s
-1))
-26
-24
-22
-20
-18
-16
-14
-12
-10
T (oC)
150200300350400 250
Supplementary figures for "The influence of natural radiation damage on helium diffusion kinetics in apatite"
Figure S2-3 of 13
Helium-4 experiment
DYJS2
104/T (K-1)
14 16 18 20 22 24
ln(D
/a2 ) (
ln(s
-1))
-26
-24
-22
-20
-18
-16
-14
-12
-10
T (oC)
150200300350400 250
Supplementary figures for "The influence of natural radiation damage on helium diffusion kinetics in apatite"
Figure S2-4 of 13
Helium-4 experiment
96MR47
104/T (K-1)
14 16 18 20 22 24
ln(D
/a2 ) (
ln(s
-1))
-26
-24
-22
-20
-18
-16
-14
-12
-10
T (oC)
150200300350400 250
Supplementary figures for "The influence of natural radiation damage on helium diffusion kinetics in apatite"
Figure S2-5 of 13
Helium-4 experiment

TAM-1
104/T (K-1)
14 16 18 20 22 24
ln(D
/a2 ) (
ln(s
-1))
-26
-24
-22
-20
-18
-16
-14
-12
-10
T (oC)
150200300350400 250
Supplementary figures for "The influence of natural radiation damage on helium diffusion kinetics in apatite"
Figure S2-6 of 13
Helium-4 experiment

97MR48
104/T (K-1)
14 16 18 20 22 24
ln(D
/a2 ) (
ln(s
-1))
-26
-24
-22
-20
-18
-16
-14
-12
-10
T (oC)
150200300350400 250
Supplementary figures for "The influence of natural radiation damage on helium diffusion kinetics in apatite"
Figure S2-7 of 13
Helium-4 experiment

PRBH1
104/T (K-1)
14 16 18 20 22 24
ln(D
/a2 ) (
ln(s
-1))
-26
-24
-22
-20
-18
-16
-14
-12
-10
T (oC)
150200300350400 250
Supplementary figures for "The influence of natural radiation damage on helium diffusion kinetics in apatite"
Figure S2-8 of 13
Helium-4 experiment

Tioga
104/T (K-1)
14 16 18 20 22 24
ln(D
/a2 ) (
ln(s
-1))
-26
-24
-22
-20
-18
-16
-14
-12
-10
T (oC)
150200300350400 250
Supplementary figures for "The influence of natural radiation damage on helium diffusion kinetics in apatite"
Figure S2-9 of 13
Helium-4 experiment
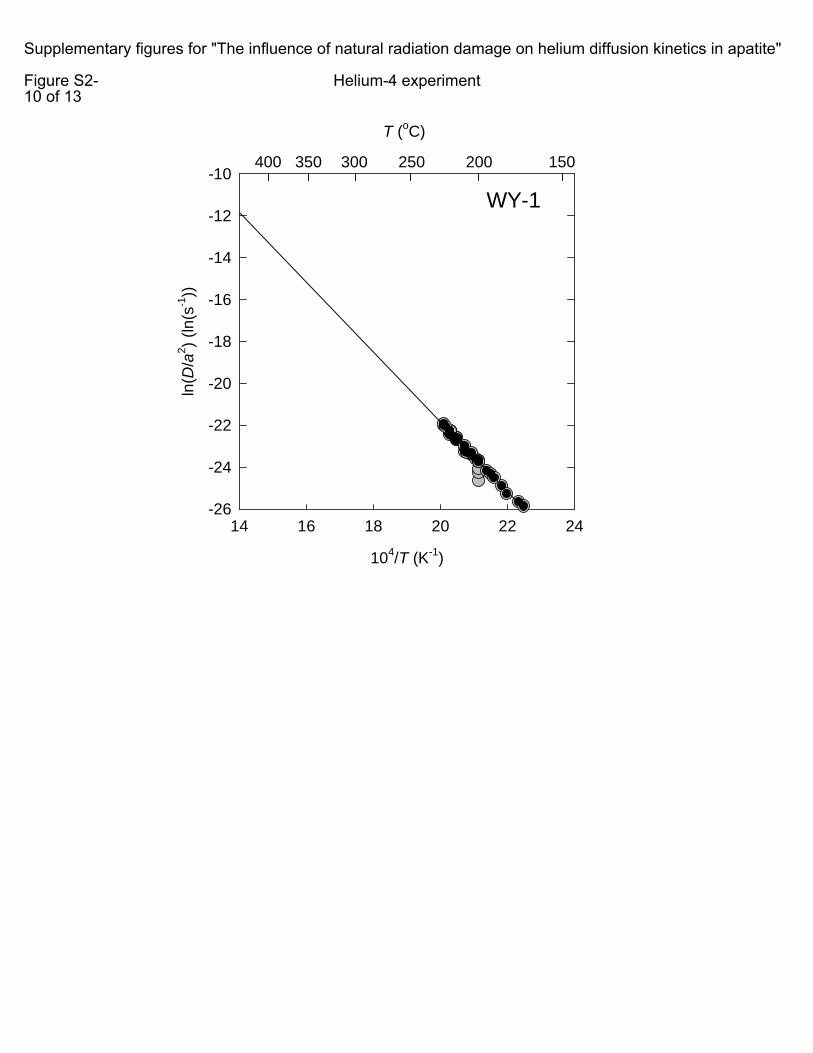
WY-1
104/T (K-1)
14 16 18 20 22 24
ln(D
/a2 ) (
ln(s
-1))
-26
-24
-22
-20
-18
-16
-14
-12
-10
T (oC)
150200300350400 250
Supplementary figures for "The influence of natural radiation damage on helium diffusion kinetics in apatite"
Figure S2-10 of 13
Helium-4 experiment
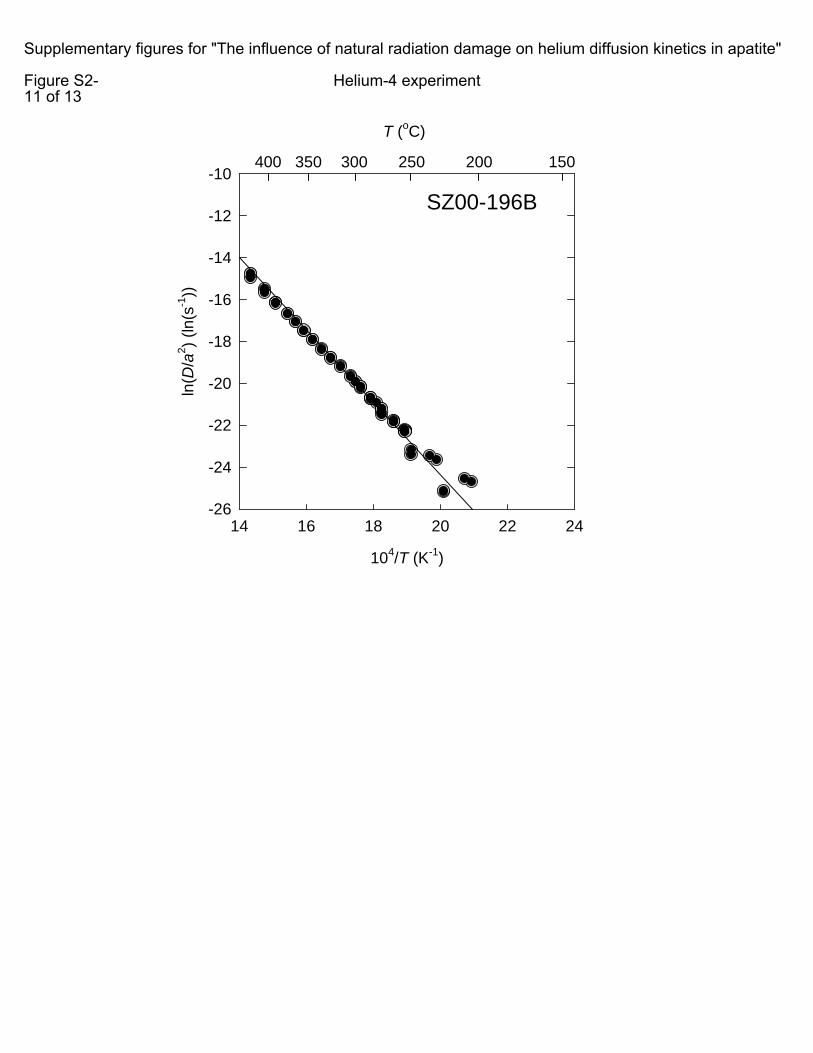
SZ00-196B
104/T (K-1)
14 16 18 20 22 24
ln(D
/a2 ) (
ln(s
-1))
-26
-24
-22
-20
-18
-16
-14
-12
-10
T (oC)
150200300350400 250
Supplementary figures for "The influence of natural radiation damage on helium diffusion kinetics in apatite"
Figure S2-11 of 13
Helium-4 experiment

02-123A
104/T (K-1)
14 16 18 20 22 24
ln(D
/a2 ) (
ln(s
-1))
-26
-24
-22
-20
-18
-16
-14
-12
-10
T (oC)
150200300350400 250
Supplementary figures for "The influence of natural radiation damage on helium diffusion kinetics in apatite"
Figure S2-12 of 13
Helium-4 experiment

Lake Mountain
104/T (K-1)
14 16 18 20 22 24
ln(D
/a2 ) (
ln(s
-1))
-26
-24
-22
-20
-18
-16
-14
-12
-10
T (oC)
150200300350400 250
Supplementary figures for "The influence of natural radiation damage on helium diffusion kinetics in apatite"
Figure S2-13 of 13
Helium-4 experiment

(a)
Predicted TC (oC)
40 60 80 100 120
T C (o C
)
40
60
80
100
120
All results1:1
(b)
Predicted log10(D/a2) (log(s-1))
-20 -18 -16 -14 -12 -10
Ext
rapo
late
d lo
g 10(D
/a2 ) (
log(
s-1))
-20
-18
-16
-14
-12
-10
All results1:1
Figure S3 - MLR model predictions

(a)
Predicted TC (oC)
40 60 80 100 120
T C (o C
)
40
60
80
100
120
All results1:1
(b)
Predicted log10(D/a2) (log(s-1))
-20 -18 -16 -14 -12 -10
Ext
rapo
late
d lo
g 10(D
/a2 ) (
log(
s-1))
-20
-18
-16
-14
-12
-10
All results1:1
Figure S4- "trapping" model predictions