the influence of penalties on taxpayers’ compliance: …
TRANSCRIPT

IIUM Journal of Economics and Management 12, no.1 (2004):© 2004 by The International Islamic University Malaysia
ABSTRACT
The use of penalties and detection is a common approach used by taxadministrators to combat tax evasion and avoidance in order to enhance efficientrevenue collection. The government’s traditional reliance (including theMalaysian Inland Revenue Board (IRB)) on penalties is analogous to theevolution of economic models of tax evasion. The increased reliance onpenalties has been based on the relationships specified in the deterrencetheory. The theory assumes that there is a perceived likelihood of apprehensionand a severe but fair penalty for the offence. Since then many researchershave modified the traditional model(s). Recently, researchers have begun toadd the non-economic factors (factors that cannot be quantified such asperceived equity and fairness, and tax education, etc.).
This paper investigates why taxpayers evade taxes and in what way thetax authorities can influence their behavior. This include a discussion of thetheoretical models of taxpayers’ compliance, which are influenced by factorssuch as perceived equity and fairness, public expenditure, public income andthe substitution effect on audit rate and penalty rate, and the effect ofcorruption and labor supply. Besides the above factors, we also believe thatthe delivery mechanism that ought to deliver the work effectively, efficiently,with accurate and reliable information seems to address the need for fullautomation in management and administration. A good briefing for both thetax advisors and taxpayers on tax procedures and its law making may alsocontribute to a climate of professional cooperation and voluntary compliance.
The findings show that both the theoretical model of the tax complianceand the empirical evidence on penalty rate and detection rate do have asignificant effect on the tax evasion (i.e., increased taxpayers’ compliance) buttheir effectiveness may be greatly reduced in an economy which is perceived
THE INFLUENCE OF PENALTIES ON TAXPAYERS’COMPLIANCE: A COMPARISON OF THE
THEORETICAL MODELS
Siti Normala Sheikh Obid
Associate Professor, Department of Accounting, Kulliyyah of Economics andManagement Sciences, International Islamic University Malaysia, JalanGombak, 53100 Kuala Lumpur (email: [email protected])
IIUM Journal of Economics & Management 12, no.1 (2004)2
to have an unfair tax administration and tax system. We also notice that adecrease in marginal tax rate is likely to increase the compliance level due tosubstitution effect. However, the income effect is still subject to question.Although the labor supply factor may seem inappropriate in the study ofefficiency, in essence, switching from legal to illegal work and taxpayers’effort in concealing part of their income proved to be appropriate to apply inthe case of evasion and compliance.
JEL classification:
Key words: Evasion, Detection, Penalty
1. INTRODUCTION
This paper compares the theoretical models of the influence of penaltieson tax compliance. The paper further investigates why taxpayers evadetaxes and in what way the tax authorities can influence their behavior.The use of penalties and detection is a common approach used by taxadministrator to combat tax evasion to enhance efficient revenuecollection. The increased reliance on penalties has been based on therelationships specified in the deterrence theory. The theory assumesthat there is a perceived likelihood of being apprehended and that thereis a severe but fair penalty for the offence (Rossi and Grasmick, 1985).The government’s traditional reliance on penalties is analogous to theevolution of economic models of tax evasion.
The original work of Allingham and Sandmo (1972) illustrates howpenalties are perceived as a cost in a purely economic decision to comply.Since then, many researchers have modified the traditional model, andonly recently have researchers begun to add non-economic factors(factors that cannot be quantified such as perceived equity and fairness,and tax education). Baldry (1987) argues that the presence of a faireconomic gamble does not necessarily lead to tax evasion becausethere are ‘moral costs’ to be considered. Falkinger (1988) theoreticallyanalyzed the social psychology argument that an inequitable government-taxpayer exchange increases non-compliance.
In fact, studies on cause, effect and solution to taxpayers’compliance have been carried out by researchers in many countries.Each researcher has identified the association of their finding variableswith taxpayers’ compliance such as perceived equity (Kirchler, et al.,

The Influence of Penalties on Taxpayers’ Compliance: A Comparison 3
2001; S. Normala, 1994; Vogel, 1974), public expenditure (Crane andNourzad, 1990), the effect of corruption (Chu, 1990; Shu, 1992) andlabor supply (Pancavel, 1979; Cowell, 1985a). The empirical works onthe effects of the penalty rate on taxpayers’ compliance found that alarge fine was a more effective deterrent to tax evasion than a highprobability of detection (Friedland et al., 1978; Crane and Nourzad,1986; Christiansen, 1980). Other factors that are also found to contributeto reduction in tax evasion include public income and the substitutioneffect on marginal tax rate (Allingham and Sandmo, 1972). Theempirical findings by Wittie and Woodbury (1983b), Dubin and Wilde(1988) and Dubin et al. (1990) support the claim that an increase inaudit rate will decrease evasion. An increase in marginal tax ratesleads to an increase in the amount of unreported income, hence anincrease in tax evasion, but an increase in audit rate will decrease taxevasion.
Section two discusses the theoretical models that explain theproblems of evasion under the assumption that income is exogenouslygiven and fixed. Based on this basic model we extend its application toself-employed taxpayers (who are capable of varying their efforts andalso concealing part of their income). This is followed by a discussionof why taxpayers are switching from legal to illegal work practices inorder to evade taxes. The switch may actually be prompted in responseto the change in the degree of difficulty in evading tax, as presented byPencavel (1979) and Cowel (1985a and 1985b).
The factor of corruption in tax evasion is described in Section Four.Corruption is seen to be a solution to the ‘unfair’ treatment thattaxpayers get from taxation system and tax administration. Socio-economic factors such as gender, perceived fairness and perceivedequity are summarised in Section Five. Section Six concludes that botheconomic and socio-economic factors do contribute to the evasion oftaxes in these models.
2. INCOME AND SUBSTITUTION EFFECT WITH PENALTYAND TAX RATE
Beginning with Allingham and Sandmo (1972), the focus of mosteconomists’ studies of tax evasion has been the utility-maximizing

IIUM Journal of Economics & Management 12, no.1 (2004)4
behavior of taxpayers who are subject to detection and penaltyparameters.1 This is in contrast to the approach of emphasizing theminimization of administrative and compliance costs to encouragecompliance and ease of revenue collection.2 Thus, it is said thatindividuals ‘demand’ the level of evasion given the ‘prices’ set by thegovernment. In this context of a supply and demand model, individualstake the structure, enforcement effort, and the punishments of the taxcode as given, and determine their most preferred level of work effortand evasion.
Allingham and Sandmo (1972) were the first to construct a modelof tax evasion on the concept of decision-making (i.e., based on incomeand substitution effects). They divided economic sectors in two; namely,sector 1 which represents governmental-controlled sectors (certainty)and sector 2 as nongovernmental-controlled (uncertainty). Theassumptions are as follows:
a. Taxpayers will choose an amount of tax to evade so as to maximizeexpected utility after taxes and penalties (represented as E(U));
b. Taxpayers’ behavior conforms to the Von Neumann-Morgensternaxioms for behavior under uncertainty;
c. Marginal utility of a taxpayer is everywhere positive and strictlydecreasing, i.e., the taxpayer is risk averse;
d. Amount earned by each individual under certainty, w, in sector 1;e. Actual income under uncertainty condition, W, is exogenously given
and is known by the taxpayer but not by the tax office in sector 2;f. Tax is levied at a constant rate, t, on the taxpayer’s declared income;g. Taxpayers will be subject to audit by the tax authorities with some
probability, and the tax authorities will then be assumed to knowthe exact amount of taxpayers’ incomes if audited;
h. Taxpayers will have to pay tax on the under-declared income, (X),therefore, W-X, at a penalty rate of π if audited, where π is supposedto be greater than t.
The above argument, developing the relationship between riskaversion and the penalty rate and audit rate, is exemplified indiagrammatic form in Figure 1 and Figure 2, respectively. Figure 1suggests that an increase in the penalty rate will always increase the
The Influence of Penalties on Taxpayers’ Compliance: A Comparison 5
fraction of actual income declared. Thus the penalty rate is regardedas a tool to combat tax evasion. The figure shows that an individualdoes not evade tax if s(he) has a disposable income of (1 - t)W in bothsectors. However, if s(he) evades tax s(he) has a usable income of win state 1 and (1 - π)W in sector 2. The line PR thus describes trade-offs between honest reporting and evasion, and has a slope of (π-t)/t.As the penalty rate, π, increases, the line PR will become steeper andthe amount of evasion will thus be reduced.
FIGURE 1
FIGURE 2
In the second case, the audit rate is also seen as a tool to combatevasion, where an increase in the rate of detection is believed to reducethe amount of evasion. In other words, it will increase the fraction ofactual income declared. The relationship between risk aversion andaudit rate is shown in Figure 2. The figure shows that an increase in theprobability of detection will not affect the slope of the trade-off line butwill increase the curvature of the indifference curve and shift theequilibrium point from Q to Q1 and thus reduce the amount of evasion.
In a combination of ideas centering on the audit rate and the penaltyrate, Allingham and Sandmo (1972) show that where the probability ofdetection is not exogenously given but varies with the level of declaredincome, an increase in the penalty rate will again lead to an increase indeclared income. (Here it is assumed that a person reporting an incomebelow the average of his/her profession increases the probability ofinvestigation and, therefore, of detection.)
The above analysis suggests that an important aspect of the InlandRevenue Board’s (IRB) task will centre on effective audit and theemployment of penalty rates to counter, to some extent, those otherforces driving individuals towards evasion. However, in this utility-basedanalysis it becomes less clear how we can explicitly incorporate thewider issues perceived equity, psychic costs of evasion, etc., other than

IIUM Journal of Economics & Management 12, no.1 (2004)6
to simply say that these force will operate differently for each individualtaxpayer and will mean that the utility that they each derive from theirpost-tax income will reflect their perceptions of the ‘justice’ of thetaxation system. In practice, the utility based analysis of aversion tendsto characterize taxpayers in the narrow terms of their risk aversion asit relates to levels of wealth. The other forces that may be shaping thesubjective utility function are effectively taken as being constant.
FIGURE 3Relationship between Risk Adversion and Income Declared
Figure 3 summarizes the relationship between risk aversion andincome declared. The figure shows that when actual income varies,the fraction of the income declared increases, stays constant, ordecreases according to whether relative risk aversion is an increasing,constant or decreasing function of income. Therefore, we can see thatas income increases then, other things being equal, both the before andafter-tax income increases. This shifts the whole trade-off line outwards.The final equilibrium point will shift from Q to A or B or C, dependingon the relative risk aversion of the individual. If the relative risk aversionis an increasing function of income, then the final equilibrium point willbe at A where the fraction of income declared increases. If relativerisk aversion is decreasing function of income, the final equilibriumpoint will be at B where the fraction of income declared remainsconstant. If relative risk aversion is decreasing function of income, thefinal equilibrium point will be at C where the fraction of income declareddecreases.
Thus, the result shows that an increase in average tax rate makestaxpayers less wealthy, and together with the assumption of decreasingabsolute risk aversion, the taxpayer will then reduce evasion accordingly(i.e., income effect). However, an increase in the marginal tax ratemakes it more profitable to evade taxes at the margin and, therefore,declared income decreases as the marginal tax rate increases, whichmeans evasion will increase (i.e., substitution effect). Therefore, withan increase in the average tax rate as a result of an increase in marginaltax rates, it becomes impossible to determine a priori whether an

The Influence of Penalties on Taxpayers’ Compliance: A Comparison 7
individual taxpayer will increase or decrease his/her level of evasion.Using a similar approach of exploring income and substitution
effects as laid down by Allingham and Sandmo, but this time employingdifferent assumptions, Srinivasan (1973) came to a more definite resultwith regard to the relationship between evasion and changes in income.His assumptions are as follows:
a. Taxpayers will choose an amount of tax to evade so as to maximizeexpected utility after taxes and penalties;
b. The probability of being detected depends on the income level;c. Tax paid is a function of income;d. Tax on income is positive, increasing, convex function of income;e. The marginal tax rate is strictly less than unity;f. The marginal rate of tax is zero at zero income;g. The penalty multiplier, i.e., the penalty rate charged on the
understated income, is a positive, increasing and convex functionof the proportion of income being understated;
h. The penalty multiplier equals zero when there is no understatementof income.
Srinivasan’s work is shown in Figure 4. We can see from the figurethat it produces the same result as Allingham and Sandmo with regardto the effect of the audit rate, i.e., an increase in the probability ofdetection always leads to an increase in declared income. In addition,his model also give two corollaries: (i) the richer a person, the larger isthe optimal proportion by which s(he) will understate income given aprogressive tax function and a probability of detection independent ofincome, as shown in Figure 4a. (ii) If the marginal rate of tax is constantand the probability of detection is an increasing function of income,then the optimal proportion of understatement of income decreases asincome increases as shown in Figure 4b.
Figure 4Income and Substitution Effect: Penalty Rate and Audit Rate

IIUM Journal of Economics & Management 12, no.1 (2004)8
Figure 4aTax Function and Probability of Detection (for higher income)
Figure 4bTax Function and Probability Detection (when MR is constant)
However, Yatzhaki (1974) argues that contrary to the substitutioneffect as propounded by Allingham and Sandmo, an increase in themarginal tax rate can actually lead to a reduction in evasion. His findingsshow that if fines are imposed on the evaded tax rather than on theundeclared income as in the Allingham and Sandmo case, then anincrease in the tax rate will reduce tax evasion.
Figure 5Trade-off Line between Detection Rate and Penalty Rate
Christiansen (1980) explored the relationship between fines anddetection and questioned whether a large fine with small probability ofdetection is a more powerful deterrent to tax evasion than a highprobability of detection with a small penalty (see Figure 5). The followingresults were obtained from his analysis:
(i) If the penalty rate is increased and at the same time efforts todetect tax evaders are adjusted so as to keep the expected gains fromtax evasion unaltered, i.e., a decrease in the detection rate, risk averterswill always reduce their tax evasion. The figure shows that an increasein the penalty rate will shift the trade-off line downwards. Were theprobability of detection to have been held constant, the amount ofevasion would be reduced, as shown by the dotted indifference curves.However, if probability of detection is reduced to an extent that theexpected gain from tax evasion is unaltered, the curvature of theindifference curve will become more vertical (illustrated by continuousline of indifference curve). The final equilibrium point, Q1, shows thatthe amount of evasion is more than that at point Q2 but less than at theoriginal equilibrium point Q. This suggests that a large fine is always a

The Influence of Penalties on Taxpayers’ Compliance: A Comparison 9
more effective deterrent to tax evasion than a high probability ofdetection.
(ii) If the initial penalty rate is small enough, an increase in the penaltyrate will give an incentive to extended tax evasion when the probabilityof detection is adjusted to keep the expected fines unchanged. Theintuitive explanation for this position is that for the initial low penaltyrate to have had any meaningful impact on evasion behavior wouldimplicitly require a high audit or detection rate. Therefore, if the expectedfines are to remain unchanged after an increase in the penalty rate,then there must be a fairly dramatic reduction in the audit or detectionrate. This means a sharp vertical increase in the individual’s preferencecurve and a move to increased evasion. This is illustrated in the movementbetween the lowest and the intermediate penalty rates in the figure.
On the other hand, if the initial penalty rate is already large enough(e.g., actually starts at the level of the intermediate penalty rate in thefigure), an increase in the penalty rate will discourage tax evasion whenthe detection probability is adjusted to keep the expected fine unchanged.This conclusion is, of course, consistent with his analysis as reportedearlier in Figure 5.
If the initial penalty rate is very small, an increase will move theequilibrium point from Q to Q1 where the amount of evasion is increased.However, further increases in the penalty rate will shift the equilibriumpoint inwards, for example, at point Q2, where the amount of evasion isless than both points Q1 and Q. The indifference curves in this diagramhave already taken into account the adjustments in probability ofdetection. In this latter example, Christiansen makes an additionalassumption that relative risk aversion is of the order of unity. Figure 6illustrates both these points:
Figure 6Relationship between Risk Aversion and Trade-off Line of Audit
Rate and Penalty Rate

IIUM Journal of Economics & Management 12, no.1 (2004)10
A study conducted by Friedland et al. (1978) also shows that alarge fine was a more effective deterrent to tax evasion than a highprobability of detection. Their work was later tested by Christiansenand Crane and Nourzad (1986). Both sets of results show in favor ofFriedland’s argument. However, Christiansen has some reservationsabout the issue of a raised penalty. His proposal shows that it is notpossible to raise a penalty indefinitely as it should bear a reasonablerelationship to the crime committed. A study made by Witte andWoodbury (1983a) shows that taxpayers’ attitude has significant effectson tax compliance, but the type of action likely to be most effectivemay vary according to the type of taxpayer. For example, audits usuallyhave relatively large effects on the compliance behavior of smallproprietors but only very small, although significant effects on thecompliance of middle income wage and salary workers.
The effects of the penalty rate on taxpayer compliance is alsosupported by Crane and Nourzad (1986), Witte and Woodbury (1983a)and Graetz and Wilde (1985). The empirical findings by Witte andWoodbury (1983b), Crane and Nourzad (1990), Dubin and Wilde (1988)and Dubin et al. (1990) support the claim that an increase in audit ratewill decrease evasion.
The prediction made by Allingham and Sandmo (1972) that highmarginal tax rates lead to an increase in the amount of unreportedincome is supported by the empirical findings of Clolfelter (1983),Slemrod (1984), Crane and Nourzad (1986, 1990), and Baldry (1987).Another study of factors that affect compliance conducted by Aaronand Harvey (1985), found that high marginal tax rates and complexitymade tax evasion and avoidance increasingly more profitable.
However, Graetz and Wild (1985) found that lowering tax rateshas no effect on compliance either theoretically or from empiricalevidence. Instead, they state that to improve tax compliance requiresfurther legislative or administrative action.
3. FACTOR OF LABOR SUPPLY
Although the labor supply factor seems inappropriate in the study ofefficiency, the type of taxpayer that we are addressing, the self-employed, are capable of varying their efforts and also of concealingpart of their income3 (Musgrave, 1981) and S. Normala (1994). Wehave singled out this group as being one which both presents major

The Influence of Penalties on Taxpayers’ Compliance: A Comparison 11
problems for tax administrators but which also has the opportunity ofobtaining real revenue gains from successfully tackling their evasion.
All the models concerned in section 2 are based on the assumptionthat income is exogenously given and is fixed. However, this may notbe the case since an individual taxpayer such as a self-employedtaxpayer, may be able to change number of hours worked or even beable to switch from legal to illegal work practices, and this switch mayactually be prompted in response to the change in the degree of difficultyin evading tax (Pencavel, 1979; Cowell, 1985).
Pencavel (1979) extended the theoretical analysis of tax evasionby treating the individual’s income as endogenous and variable ratherthan as exogenous and fixed. Moreover, he also tried to relax theassumption of a linear income tax schedule.
The following assumptions are made in Pencavel’s model:
i. The taxpayer’s behavior satisfies the axioms permitting theconstruction of a von Neumann-Morgenstern utility function whichis defined over total income (Y) and hours of worked (h):
(1) ),( hYUU =
ii. The marginal utility of income is positive and strictly decreasing asthe individual is risk averse.
iii. The marginal utility of hours of work is negative and strictlydecreasing.
iv. The absolute risk aversion function,
(2)
[ ] 0)(/)()( 12 >−= YUYUYR
where R is a decreasing function of income.
v. The utility function is strongly separable in income and hours ofwork.
The income tax system is as follows:
(3) σtySX +−=where;
σyySt /)(0 +≤<
10 << σ or
1>σ
IIUM Journal of Economics & Management 12, no.1 (2004)12
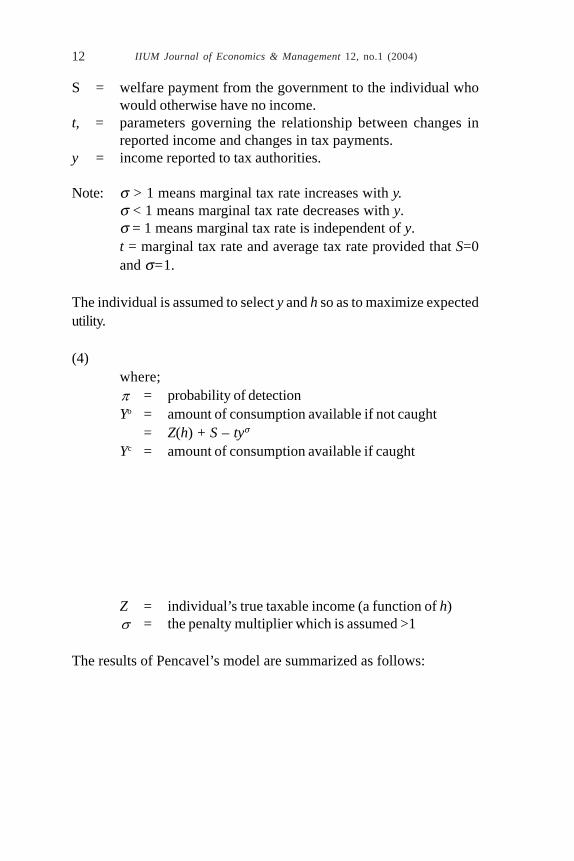
S = welfare payment from the government to the individual whowould otherwise have no income.
t, = parameters governing the relationship between changes inreported income and changes in tax payments.
y = income reported to tax authorities.
Note: σ > 1 means marginal tax rate increases with y.σ < 1 means marginal tax rate decreases with y.σ = 1 means marginal tax rate is independent of y.t = marginal tax rate and average tax rate provided that S=0and σ=1.
The individual is assumed to select y and h so as to maximize expectedutility.
(4)where;π = probability of detectionYo = amount of consumption available if not caught
= Z(h) + S – tyσ
Yc = amount of consumption available if caught
Z = individual’s true taxable income (a function of h)σ = the penalty multiplier which is assumed >1
The results of Pencavel’s model are summarized as follows:

The Influence of Penalties on Taxpayers’ Compliance: A Comparison 13
TABLE 1 Qualitative Effects on Difference Between True Taxable
Income and Reported Income
Increases in Parameters
1<σ 1=σ 1>σ
π ambiguous <0 ambiguous
λ ambiguous <0 ambiguous
σ ambiguous ambiguous t ambiguous <0 ambiguous S ambiguous >0 >0
In contrast to the outcomes of the models in section 2, there is no clear-cut relationship between each of the above parameters, π,σ, t and theamount of income declared in this model (except in the case of σ = 1,where the difference between true taxable income and reported incomedecreases as π increases, i.e., less evasion). Pencavel explained suchambiguities may be due to the fact that the change of these parameterswill change the taxpayer’s hours of work which, in turn, induces changein true taxable income. For example, an increase in the penalty rate (π)may decrease hours of work which causes a decline in true incomewhich inclines the taxpayer to reduce reported income. Therefore, thefinal results in response to the change of any of the above parameterswill be indeterminate.
Cowell (1985a) on the other hand, supposed that taxpayers areable to switch some legal work to illegal work. The income from theformer is assumed to be properly reported to the tax authorities whereasthe income from the latter is assumed to be not reported to the authorities,i.e., the evasion portion.
Cowell’s model first assumes that the taxpayer is an immoralexpected utility maximizer whose utility function has disposable incomeand leisure as components. In other words, the taxpayer seeks tomaximize:
(5) )1,( HcEUV −=
subject to:

IIUM Journal of Economics & Management 12, no.1 (2004)14
(6) H = h0 + h1
(7) with probability⎩⎨⎧ −
pp1
where,(8) [ ] ,1 iii Wtw −= 1,0=i
The meanings of the parameters are as follows:h 0 = proportion of time spent in legal workh 1 = proportion of time spent in illegal work1 – H = proportion of time spent in leisure
ac = disposable income of the taxpayerβc = disposable income where evasion is successful
W0 = wage rate of legal workW1 = wage rate of illegal workt0 = tax rate imposed on the taxable incomet1 = penalty rate on evaded incomeB = lump sum grant from the government, where (B/t0) will be
the exemption level
A linear progressive tax system is assumed in this model which isgiven by:
(9) T= toyo – B
where,T = tax received by the governmentyo = Woh0
y1 = W1h1
Up to this point the expected return on illegal activities and thevariances of such a return can be obtained from equation (7). They areas follows:
(10) Expected return = (1- pt1 ) W1

The Influence of Penalties on Taxpayers’ Compliance: A Comparison 15
(11) Variance of return = 21
21)1( Wtpp −
Equation (10) shows that an increase in t1 (penalty rate) or p(probability of detection) will reduce the expected returns on illegalactivities. However, the variance of such returns increases with t1 andincreases or decreases according to whether p is > ½ or < ½. With thehelp of an analogy with portfolio theory, it can be seen that a change ineither parameter is sufficiently complex to preclude any clear-cutcomparative static result. Such a result is consistent with the findingsof Pencavel noted above.
However, the Cowell model does not end here. Instead of leavingthe argument at the point of the ambiguous results given above, Cowelltried to use a graphical approach to investigate comparative static resultsgiven any change in particular parameters.
In order to do so, one more assumption has to be made. Thisassumption is that the utility function can be structured in such a waythat the decision about how much labor to supply overall is effectivelyseparated from that of how to divide the labor between legal and evasionactivities. This assumption will be subsequently referred to as the‘separability assumption’. The structure of Figure 7 is as follows:
FIGURE 7Separability Assumption
Quadrant IThe −),( βα cc space is the same as that in which the Allingham-
Sandmo analysis occurs. The taxpayer is able to consume an amountP1P2 if totally honest. By switching entirely from honesty to evasion(s)he is able to consume 0R2 if s(he) does not get caught cheating, butonly R1R2 if the authorities are nimble enough to catch him or her. Theslope of the trade-off line P1R1 is 1-t1/t0. The position of this line isdetermined by the height P1P2 which depends on optimum labor supply.
Quadrant II
IIUM Journal of Economics & Management 12, no.1 (2004)16
There are ‘honesty equivalent’ indifference curves in the (c,H)-space. These are sets of points which yield the same value of V givenp=1 as obtained by maximizing (5) subject to constraints that actuallyexist. Where the separability assumption holds, these curves areinvariant, and so optimal H is determined in the usual way from thebudget line in that quadrant with intercept B and slope w0.
Quadrant IIIThis reflects the ‘work’ axis onto the ‘allocation of labor time’
axis.
Quadrant IVThe total working hours are divided into legal and evasion activities
by drawing the line P2K with slope -1/t0. Legal work is represented byX1X2 and evasion by OX1.
The effects arising from changes in the parameters are discussedbelow:
i. Penalty Rate, t1
An increase in t1 will rotate the trading line in quadrant 1 to P1R3,as shown in the diagram. The optimum thus shifts from Q1 to Q3, andevasion is reduced and is now shown as OX3 in Figure 8.
ii. Probability of Detection, p
An increase in p increases the curvature of the indifference curvesin quadrant 1, thereby shifting the optimum Q1 to the left along P1R1,thus evasion is also reduced. This is illustrated in Figure 9.
iii. Tax Rate, t0
An increase in t0 will shift P1P2 towards the origin and the slope ofP1R3 in quadrant II becomes flatter and the slope of P2K in quadrantIV also becomes stagger. The overall effect on evasion will depend onthe relative strength of the income and substitution effects as discussedby Allingham and Sandmo. Figure 10 illustrates this point.

The Influence of Penalties on Taxpayers’ Compliance: A Comparison 17
However, if the penalty rate is based on the tax evaded rather thanon the undeclared income, the slope of P1R1 will be as follows: slope =-[Ft0 – t0]/t0 = -[F-1], where F = the fine rate on evaded tax, and isassumed as > 1.
Thus, the slope will not change as the tax rate increases. Therefore,in this case only the income effect prevails, as described by Yitzhaki,and as a result, an increase in the tax rate will always reduce evasion.
FIGURE 8The Effect of Increasing Penalty Rate
FIGURE 9The Effect of Increasing Audit Rate
FIGURE 10The Effect of Tax Rate
Figure 8 works only as far as the separability assumption holds,otherwise, the analysis becomes much more complicated. For example,an increase in π will not always rotate the line P1R1 but also affects themarginal rate of substitution between leisure and consumption so thatthe indifference curves in quadrant II are shifted, total work hourschange and the length and position of AB in quadrant I also changes.Thus, the comparative static result is not clear.
Perhaps the best that can be said is that the interrelated effects ofthe penalty rate, the audit/detection rate and the tax rate are such thatimprovements resulting from changes in one area can be swamped bychanges elsewhere, particularly changes in the tax rate. In thesecircumstances it is difficult to isolate and gauge the benefits to be derivedfrom, say, improved audit, nevertheless it is certainly safe to concludethat the absence of an audit, or a largely ineffective audit will completelyunderminethe role of the penalty rate and the IRD’s ability to raiserevenue whatever the tax rate. Based on the above models, we believethat the role of audit and detection in reducing the rate of evasion, i.e.,improved taxpayer compliance, could be improved by considering otherfactors such as increasing the level of audit frequency and ‘field audit’.
IIUM Journal of Economics & Management 12, no.1 (2004)18
4. FACTOR OF CORRUPTION
Corruption of tax administration can manifest itself in a number ofways, e.g., there may be an attempt by an official to directly benefitfrom coming to illegal arrangements with a taxpayer. However, at theother end of a continuum defining corruption there could be an‘unfairness’ in the handling of taxpayers’ affairs from which a tax officialdoes not directly benefit. The sources of corruption in both the abovecases arise from the complexity of the tax system and the inadequacyof resources applied to its administration. Where tax officials are poorlypaid and their morale is low, then they may well have an incentive toengage in corrupting the tax system that directly improves their personalwelfare.
All forms of corruption lead us to question the degree of fairness inimplementing the tax legislation, and more importantly, corruption is aproblem that is found in many developing countries (Virmani, 1987;Gray, 1987). The act of corruption inevitably undermines both the equityof the tax system and the efficiency of the tax administration. Theincidence and effects resulting from corruption are largely dependenton tax administration and will, in turn, determine tax yield.
Hendricks et al. (1991), in their paper claimed that corruption,evasion and abuse of power are not only pervasive in economic activitybut also a prominent instance in tax collection. To them, the optimalcompensation scheme must take into account the strategic interactionbetween taxpayers and tax inspectors. This includes “Pure TaxFarming”, which means that paying tax inspectors a share of their taxcollections is optimal only when all tax inspectors are corruptible. Wherethere are both honest and corruptible inspectors, the optimalcompensation scheme lies between tax farming and a pure wagescheme. Paradoxically, when inspectors are hired beforehand, it maybe optimal to offer contracts that attract corruptible inspectors but notthe honest ones.
Chu (1990) and Shu (1992) proposed theoretical models of taxevasion which take into account the problem of corruption. Bothresearchers believed that the problem needs to be addressedappropriately in order to obtain real revenue gains.

The Influence of Penalties on Taxpayers’ Compliance: A Comparison 19
Shu’s model assumes that the taxpayer is a risk-averse utilitymaximizer, as in the Allingham-Sandmo model, and seeks to maximizethe following expected utility function:
(12) E(U) = [1 - p(X, B, D)]U(Y) + p(X, B, D)]U(Z)
where
(13) ,BtXWY −−= and;
(14)
)( XWfBtXWZ −−−−=
Parameters are explained as follows:
Y = disposable income if not caughtZ = disposable income if caughtU = utility function, where the usual concavity assumption appliesp = probability of detectionX = amount of income declared to the tax officeB = amount of briberyD = government level of discipline when the officers fail to do the
job wellW = actual exogenous income received by the individual, which is
known by the taxpayers but not by the tax office.t = constant tax ratef = the penalty that tax invaders have to pay on the undeclared
income
Further explicit assumptions are made with respect to thedeterminants of the probability of investigation:
(i) px < 0
A person with a profession who reports a lower income is morelikely to be investigated than one reporting higher income. This is thesame assumption as Allingham and Sandmo made when they treatedthe probability is endogenous.

IIUM Journal of Economics & Management 12, no.1 (2004)20
(ii) pxx > 0
When declared income increases, the probability of investigationfurther declines but at a decreasing speed.
(iii) pB < 0
When bribery, B, increases, the probability of and audit, p, is lower.
(iv) pD > 0
An increase in the discipline level makes the tax collector workharder.
(v) pXD < 0
When declared income increases, the probability of investigationwill be reduced, more so if disciplinary action is taken against unfitofficials than if there were no disciplinary measures taken.
(vi) pBD > 0
For a given amount of bribery, the probability of detection cannotbe lowered as much as before when there is such a discipline
The comparative static results, Shu reported are as follows:
is ambiguous.tB ∂∂ / is ambiguous
The results show that there is no clear-cut effect on declared incomeas a result of changing the tax rate (for the same reason noted in theAllingham-Sandmo model; income and substitution effects). As theamount of corruption is assumed to be related to evasion, the effect ofa change in t on the amount of corruption is also ambiguous.
;0>∂∂
fB
when ,pp
A B< and ,0<∂∂
fB
when pp
A B−>

The Influence of Penalties on Taxpayers’ Compliance: A Comparison 21
where A = absolute risk aversion
Under normal circumstances, the individual is assumed to be riskaverse, therefore, the effect of an increase in the penalty rate leads tomore income being declared. However, the effect on corruption inresponse to an increase in the penalty rate is ambiguous. On the onehand, the taxpayer may no longer find it necessary to corrupt the taxofficial in order to reduce the probability by the same proportion asbefore because the income now declared is increased. On the otherhand, if the individual still declares less income and has to face a higherpenalty for evasion, then the risk adverse taxpayer has an incentive tofurther reduce the probability of detection. Thus the total effects areambiguous and depend on absolute risk aversion. In general, the lessrisk averse the taxpayer is, the more likely it is that they will corrupt tofurther reduce the probability, p, in order to offset the effects of higherfines, f.
0/ >∂∂ DX
0/ >∂∂ DB
For the above case, the reported income X will be higher if there ismore severe D, since the tax collector will work harder and as a resultthe probability of investigation will be higher.
Corruption is minimized when severe discipline is imposed amongstthe tax officials. Working under this condition, the corrupt officials mayask for more from the individual in order to reduce the probability ofinvestigation. However, taxpayers may find it less tempting to evadetax now, as it is not worthwhile to pay more or even the same amountof corruption to reduce the probability of detection, p, by the sameproportion as before.
The results suggest that in cases where the practice of corruptionprevails, increasing the level of discipline may be a viable option tocombat those aspects of evasion which are dependent on the corruptionof tax officers arising from the self-interested behavior of the tax officers.
Chu offered the same conclusion as Shu with regard to corruption.The point of difference is that Chu’s model assumes that the probability

IIUM Journal of Economics & Management 12, no.1 (2004)22
of detection, p, is exogenously determined. Thus, an additional result inrelation to p is produced: pX ∂∂ / is ambiguous.
This is because when p is increased, on the one hand, it decreasesthe marginal expected utility arising from evasion. On the other hand,when the tax system is corrupt, an increase in p will further encouragethe taxpayer to corrupt the tax officials and after more funds havebeen invested to establish closer ‘friendship’ with tax officials, taxpayerswill want to hide more of their real income from the authorities. Thus,there are two conflicting forces at work and the final net effect isunpredictable.
At the start of this section, we suggested that the concept ofcorruption could be broadened to encompass the notion of corruption intax administration that does not necessarily directly benefit individualtax officials, i.e., the delivery of the tax legislation should be done in amanner that is fair to all taxpayers, if not it is corrupt. We could, forexample, hypothesize a case where corporation managers felt theirbusinesses were more sharply exposed to scrutiny than unincorporatedbusinesses, or where recipients of wages felt more closely observedby the Inland Revenue Board than were the self-employed.
Such a hypothesis may be very pertinent in any study of the taxadministration of a developing country. However, much of the analysisconducted in this section has centred on the more usual concept ofcorruption that of self-interested tax officials behaving in an opportunisticmanner. In concluding this section, we would like to briefly reconsiderthe first of these two forms of corruption and argue that, in fact,whatever the form of corruption the steps to be taken to remove it are(insofar as they are clear at all) the same. So, what may be appropriatefor opportunistic corruption will also apply for general bias in the deliveryof the tax legislation.
It can be seen that two factors under the direct control of the taxadministrationhave featured prominently in the discussion. These arethe probability of detection, p, and the discipline imposed within the taxadministration, D. Just as these have been shown to have an importantbearing on opportunistic corruption, so will they also have an impact onthe way a systematically biased delivery of tax legislation might becorrected. Taxpayers will perceive a level of fairness in the tax systemwhere both p and D are high. However, to achieve this is a resourcingissue and part of that discussion must focus on the appropriate technology

The Influence of Penalties on Taxpayers’ Compliance: A Comparison 23
for delivering a complete tax system.
5. SOCIO-ECONOMIC FACTORS
Taxpayers’ incentives to evade taxes may be due to other factors butmany of these are out of the direct control of the tax authorities (e.g.,inflation, unemployment, gender, and others). Table 2 presents a briefsummary of how these socio-economic factors impact on evasiongenerally. However, although these factors are beyond the direct controlof the authorities, consideration of them may enhance the effectivenessand efficiency of audits (e.g., more frequent audits on young taxpayersthan old taxpayers may result in more evaders being spotted as thelatter have been found to be more ‘honest’.)
Dubin et al. (1990) concluded in their study that a state with a highunemployment rate may have an unsound ceremony and thus yieldlower reported taxes per return. The effect is reinforced ifunemployment is associated with the underground economy and thusproduces non compliance. On the other hand, if most unemployedtaxpayers have a relatively low income, then reported tax per returnwill rise as a portion of the lower tail of the distribution of income iseliminated. To them changes in real income per capita also haveconfounding effects on reported tax return where higher incometaxpayers have increased opportunities to evade, but there is a strongdirect relationship between real income per capita and reported taxesper return.
Finally a significant finding on the farm variable was also noted. Intheir study, farms measured through farms per capita, and known tohave low levels of voluntary compliance are found to be negativelyrelated with reported tax returns.
Konishi (1991) reported that high tax evasion in Indonesia andThailand was due to factors such as the inefficiency of the taxadministration and unwillingness of taxpayers to pay taxes. The taxcodes of both countries are seen as too simple and detailed rules andregulations are not officially announced. The tax burden is often decidedthrough negotiations between tax officers and taxpayers. At the sametime, tax administrators are seen to be unfair and knowledge about taxis not prevalent (Konishi, 1993).
Krichler et al. (2001) hypothesized a correlation between tax

IIUM Journal of Economics & Management 12, no.1 (2004)24
TABLE 2 Socio-Economic Factors which Influence Compliance Level
Socio–Economic
Factors Effects on
Compliance Level Researchers
Age Positive Vogel (1974), Spicer and Lundstedt (1976), Friendland et al. (1978), Clotfleter (1983), Slemrod (1984)
Education Positive Witte and Woodbury (1983a), S. Normala (1994)
Gender More males evade than females
Dubin et al, (1990), Friendland et al. (1978), Spicer and Becker (1980)
Income Positive Crane and Nourzad (1986), Dubin et al. (1990)
Inflation Rate Negative Crane and Nourzad (1986 and (1990)
Marital Status Married couples evade and ignore than singles
Friendland et al. (1978), Clotfleter (1983), Crane and Nourzad (1990)
Moral Commitment to Society
Positive Mason and Calvin (1984), Kaplan and Reckers (1985)
Tax Withholding Positive Witte and Woodbury (1983b), Dubin and Wilde (1988)
Unemployment Negative Dubin and Wilde (1988), Dubin et al. (1990)
Attitude and Behavior
Positive S. Normala (1994)
Tax Knowledge Positive Kirchler et al. (2001), Kasipillai (1999), Singh and Renuka (2002), Mei and Chin (2000)
Tax Administration Positive Konishi, S. (1991, 1993)
knowledge with tax compliance. They found that taxpayers with taxknowledge positively correlated with attitudes towards legal taxavoidance and at the same time negatively correlated with the attitudes

The Influence of Penalties on Taxpayers’ Compliance: A Comparison 25
towards illegal tax evasion. Thus, profound tax knowledge is found tolead one’s perceived tax avoidance more positively than tax evasion,whereas little tax knowledge is found to imply the opposite, namely toperceive tax evasion more positively than tax avoidance.
Evidence in Japan shows that recognizing those who had donetheir best in complying with tax law (as the Japanese governmentpractised in their “Blue Tax Reform System”) could also improvetaxpayers’ compliance.4 For example, the Japanese taxation systemrecognizes the contribution of responsible taxpayers and that contributionentitles them to such privileges as protection against arbitraryreassessment.
In the USA, it was estimated that approximately one third of thetax revenue could be recovered by using existing enforcement sources,but the remaining revenue could be collected with the cost effectprograms (American Bar Association Commission, 1987). Thus, thegroup suggested that public education and moral persuasion beconsidered.
Also, developing good public relation and dispersing informationcould improve taxpayers’ morals and hence bring about social changethat adds to the confidence of the public (Tanzi, 1991). Long queues atthe tax office and endless red tape increase the hardship on the taxpayersat the moment that they are burden conscious. As for public relations,briefing both the tax advisors and taxpayers on the tax procedures andits law making may help to create a climate of professional cooperationand voluntary compliance.
Working towards improving taxpayers’ compliance through variousapproaches, as mentioned above the work cannot be implemented in avacuum. Thus, we believed that the delivery mechanism that ought todeliver the work effectively, efficiently, with accuracy and reliableinformation seems to address the need of computerisation within thetax office.
Also, voluntary compliance on the part of the public will be facilitatedas tax administration will be equipped with better and faster machinesto process tax payments. Thus, the priority change in tax administrationshould address full computerization along with other administrativechange. For example, the application of the automatic data processingsystem (ADP) and electronic filing system (E-filing) in many tax

IIUM Journal of Economics & Management 12, no.1 (2004)26
administrations (in both developed and developing countries) has showna tremendous help in both assessment and collection, as well as otherrelated tasks. This mechanism not only helps by reducing the paperwork involved but, most importantly, it helped to speed up the actiontaken by the department while improving accuracy.
6. CONCLUSION
The discussion on the theoretical model of tax compliance and theempirical evidence shows that the penalty rate and detection rate dohave a significant effect on tax evasion (i.e., increased taxpayers’compliance) but the question remains is what resources should the taxdepartment put into audit. In this instance, they believed that the influenceof audit rate and its detection and lowering tax rates do not work inisolation. Instead, the ‘vacuum in relationship’ that exists betweentaxpayers and the tax office needs to be filled. Hence, further taxlegislative, tax administration, tax system and acknowledgement on theimportance of taxpayers should take place in tandem.
We believe that the use of audit and detection can be furtherimproved by taking into consideration other factors such as ‘auditfrequency’ and ‘field audit’. The former refers to the degree ofrigorousness of the audit conducted by the tax office and the latter isthe visit to taxpayers’ premises. From the researcher’s experienceworking with the IRB, Malaysia, frequent visits to taxpayers’ premisescould improve taxpayer compliance, perhaps due to a psychologicaleffect, namely ‘fear factors’. These fear factors would presumablycreate both a positive and negative impact on taxpayers. The positiveimpact would be that taxpayers are kept up-to-date with the taxationsystem, hence an increase in tax literacy. While the negative impactcreates pressure on taxpayers for true and honest disclosure. Perhapsthis could be an area that needs to be explored in the future by both thecompliance researchers and tax administrators.
We also noticed that a decrease in marginal tax rate is likely toincrease the compliance level due to the substitution effect. However,the income effect is still subject to question. Although the labor supplyfactor may seem inappropriate in the study of efficiency, in essence,switching from legal to illegal work and the taxpayers’ effort in
The Influence of Penalties on Taxpayers’ Compliance: A Comparison 27
concealing part of their income proved to be applicable in the case ofevasion and compliance.
Therefore, due to the limited effectiveness of these theoreticalmodels in building up taxpayers’ voluntary compliance, complianceresearchers and tax administrators are beginning to recognize theinfluence of non-economic factors such as services offered to taxpayersand shaping taxpayers attitude through tax education.
ENDNOTES
1. Their works were further developed by researchers such as Srinivasan(1973, 1976), Sandmo (1980), Yitzhaki (1984), and Witte and Woodbury (1983a).
2. Unpublished data of “Administrative/Compliance Efficiency” (S. Normala,1994).
3. Referred to by Musgrave (1981) as the ‘hard-to-tax’ groups, an appellantwhich is now widely used.
4. See report of Shoup Mission on Japanese Taxation (Tokyo, 1950), Vol. 11,p. 213, and Vol. IV, App., p. D56.
REFERENCES
Aaron, H., and Harvey. Assessing Tax Reform. Washington, DC:Brooking Institute, 1985.
Allingham, M. G., and A. Sandmo. “Income Tax Evasion: A TheoreticalAnalysis.” Journal of Public Economics, November (1972).
American Bar Association Commission. American Bar AssociationCommission Taxpayers Compliance, Report andRecommendation. Chicago: American Bar Foundation, 1987.
Baldry, J. C. “Income Tax Evasion and the Tax Schedule: SomeExperimental Results.” Public Finance 42, no. 3 (1987).
Christiansen, V. “Two Comments on Tax Evasion.” Journal of PublicEconomics 14 (1980).
Chu, C. Y. C. “A Model of Income Tax Evasion with Venal Tax Officials:The Case of Taiwan.” Public Finance 45, no. 3 (1990).
Clotfelter, C. T. “Tax Evasion and Tax Rates: An Analysis of Individual

IIUM Journal of Economics & Management 12, no.1 (2004)28
Returns.” Review of Economics and Statistics 65 (1983).Cowell, F. A. “Tax Evasion with Labour Income.” Journal of Public
Economics 26, no. 1 (1985a).⎯⎯⎯. “The Economic Analysis of Tax Evasion.” Bulletin of
Economic Research 37 (1985b).Crane, S. E., and F. Nourzad. “Inflation and Tax Evasion: An Empirical
Analysis.” Review of Economics and Statistics, 68 (1986).⎯⎯⎯. “Tax Rate and Tax Evasion: Evidence from California
Amnesty Data.” National Tax Journal 43 (1990).Dubin, J. A., and L. L. Wilde. “An Empirical Analysis of Federal Income
Tax Auditing and Compliance.” National Tax Journal 41 (1988).Dubin, J. A., M. J. Graetz, and L. L. Wilde. “The Effect of Audit Rates
on the Federal Individual Income Tax, 1977-86.” National TaxJournal 43 (1990).
Falkinger, J. “Tax Evasion and Equity: A Theoretical Analysis.” PublicFinance 43, no. 3 (1988).
Friedland, N., S. Maital, and A. Rutenberg. “A Simulation Study of TaxEvasion.” Journal of Public Economics 8 (1978).
Graetz, M. J., and L. L. Wilde. “The Economics of Tax Compliance:Fact and Fantasy.” National Tax Journal 38 (1985).
Gray, C. W. “The Importance of Legal Process to EconomicDevelopment: The Case of Tax Reform in Indonesia.” Unpublishedpaper. Washington, D.C: World Bank: 1987.
Hendricks, J., M. Keen, and A. Mathoo. “Corruption, Extortion andEvasion.” Journal of Public Economics 74 (1999).
Kaplan, S. E., and P. M. J. Reckers. “A Study of Tax EvasionJudgments.” National Tax Journal 38 (1985).
Kasipillai, J. “Malaysian Self-Assessment Tax System.” MIT Seminarof Current Year Basis of Assessment and Self-AssessmentSystem, 1999.
Kirchler, E., M. Boris, and S. Friedrich. “Everyday Representation ofTax Avoidance, Tax Evasion and Tax Flight: Do Legal DifferencesMatter?” http://www.economics.uni-linz.ac.at/Schneider/Maciejovsky.PDF.2001
Konishi, S. “Tax Administration and Tax Evasion in Thailand andIndonesia – An Empirical Approach.” Kwansei Gakun AnnualStudies 40 (1991). http://www.stylebuilt.co.yp/konishi/asia/p8-

The Influence of Penalties on Taxpayers’ Compliance: A Comparison 29
13.htm⎯⎯⎯. “An Empirical Analysis of Tax Evasion and Tax Administration
of ASEAN Countries.” Kwansei Gakun Annual Studies 42 (1993).http://www.stylebuilt.co.yp/konishi/asia/p8-13.htm
Manson, R., and L. D. Calvin. “Public Confidence and Admitted TaxEvasion.” National Tax Journal 37 (1984).
Mei, T., and F. Chin. “The Impact of Tax Knowledge on the Perceptionsof Tax Fairness and Attitudes Towards Compliance.” Asian Reviewof Accounting 8, no. 1 (2001).
Musgrave, R. A. Fiscal Reform in Bolivia. Cambridge: Harvard LawSchool International Tax Programme, USA, 1981.
Pencavel, J. H. “A Note on Income Tax Evasion, Labour Supply andNonlinear Tax Schedules.” Journal of Public Economics 12, no.1 (1979).
Rossi, P. H., and H. G. Grasmick. “Appeals within Our Social Structurethat can Enhance Voluntary Compliance.” In Conference on TaxAdministration Research. Washington, D.C.: Internal RevenueService, 1985.
Sandmo, A. “Income Tax Evasion, Labour Supply and the Equity-Efficiency Trade-Off.” Journal of Public Economics, 16 (1981).
Shu, W. “Income Tax Evasion and Enforcement: A Purely TheoreticalAnalysis of Chinese Income Tax System.” Public Finance 47 no.2 (1992).
Singh, V., and B. Renuka. “The Malaysia Self-Assessment System ofTaxation: Issues and Challenges.” Akauntan Nasional, Jan/Feb(2002).
S. Normala, Administrative/Compliance Efficiency in IRD, Malaysia.Unpublished Thesis, 1994.
Slemrod, J., and N. Sorum. “The Compliance Cost of the IndividualIncome Tax System.” National Tax Journal 37 (1984).
Spicer, M., and L. Becker. “Fiscal Inequity and Tax Evasion: AnExperimental Approach.” National Tax Journal 33 (1980).
Spicer, M. W., and S. B. Lundstedt. “Understanding Tax Evasion.”Public Finance 31 (1976).
Srivinasan, T. N. “Tax Evasion: A Model.” Journal of PublicEconomics 2 (1973).
Tanzi, V. “Stabilisation and Growth.” In Public Finance in Developing

IIUM Journal of Economics & Management 12, no.1 (2004)30
Countries. Worcester, England: Billing and Sons Ltd, 1991.Virmani, A. “Tax Evasion, Corruption, and Administration: Monitoring
the People’s Agents under Symmetric Dishonest.” World BankDevelopment Research Department Discussion Paper no. DRD271. Washington, D.C.: World Bank, 1987.
Vogel, J. “Taxation and Public Opinion in Sweden: An Interpretation ofRecent Survey Data.” National Tax Journal 27 (1974).
Witte, A. D., and F. Woodbury. “The Effect of Tax Laws and TaxAdministration on Tax Compliance.” Working Paper 83-1,Department of Economics, University of North Carolina, ChapelHill, North Carolina, USA, 1983a.
⎯⎯⎯. “What We Know about the Factors Affecting Compliancewith the Tax Laws.” In Income Tax Compliance: A Report ofthe ABA Section of Taxation Invitation Conference on IncomeTax Compliance, edited by Phillips Sawicki, Washington, D.C.:American Bar Association, 1983b.
Yitzhaki, S. “A Note on Income Tax Evasion: A Theoretical Analysis.”Journal of Public Economics 3 (1974).
⎯⎯⎯. “On the Excess Burden of Taxation.” National Bureau ofEconomic Research Working Paper, Cambridge, USA, 1982.

The Influence of Penalties on Taxpayers’ Compliance: A Comparison 31