the influence of reward on early information processing
TRANSCRIPT

The influence of reward on early information processing along the
“visual perception-overt behaviour” continuum
Angela Vavassis
A Thesis
In the Department
of
Psychology
Presented in Partial Fulfillment of the Requirements
For the Degree of
Doctor of Philosophy (Psychology) at
Concordia University
Montreal, Quebec, Canada
February 2012
Angela Vavassis, 2012

CONCORDIA UNIVERSITY
SCHOOL OF GRADUATE STUDIES
This is to certify that the thesis prepared
By: Angela Vavassis
Entitled: The influence of reward on early information processing along the
“visual perception-overt behaviour” continuum
and submitted in partial fulfillment of the requirements for the degree of
Doctor of Philosophy (Psychology)
complies with the regulations of the University and meets the accepted standards with
respect to originality and quality.
Signed by the final examining committee:
Dr. Louis Cuccia (Chemistry & Biochemistry), Chair
Dr. Olga Overbury (École d’Optométrie, Université de Montreal), External Examiner
Dr. David Howes (Sociology & Anthropology), External to Program
Dr. Roberto de Almeida (Psychology), Examiner
Dr. Virginia Penhune (Psychology), Examiner
Dr. Aaron Johnson (Psychology), Administrative Thesis Supervisor
Approved by
_________________________________________
Chair of Department or Graduate Program Director
__________ ___________________________________
Dean of Faculty

iii
ABSTRACT
The influence of reward on early information processing along the
“visual perception-overt behaviour” continuum
Angela Vavassis, Ph.D.
Concordia University, 2012
Past research has reliably established that rewards exert an influence on
overt/observable behaviours (e.g., explicit choices, limb/body movements, eye-
movements). Oftentimes, a reward may be acquired by performing a specific behaviour
in response to a visual target. Under such circumstances, research has demonstrated that
the reward covertly influences the late neural stages of information processing along the
“visual perception-overt behaviour” continuum (e.g., the motor processing immediately
preceding the performance of the overt behaviour needed to acquire the reward associated
with the perceived visual target).
Only recently has research also begun to investigate whether reward
covertly influences the earlier neural stages of information processing along the “visual
perception-overt behaviour” continuum (i.e., the visual perception of the target stimulus).
Such research has suggested that reward does indeed influence even the earliest form of
visual perception (i.e., feature perception). This conclusion has been drawn form the
handful of documented effects of reward on certain behavioural measures of performance
during feature singleton visual search (e.g. the observation of slower key-press responses
for targets associated with low than with high monetary reward). However, since the key-
press response is a motor response, such results may entirely or partially reflect reward
influences on the motor (i.e, late) as opposed to the perceptual (i.e, early) information
processing stage. Other evidence, suggestive of the effects of reward on feature visual
perception, stems from the documented effect of reward on attention (i.e., the N2pc, a
reliable marker of attentional selection of visual targets, appears later and is weaker for
low than for high reward targets), given attention’s independently documented effects on
feature visual perception.
The aim of the current study was to provide a more thorough behavioural
assessment of reward influences on visual perception in feature singleton visual search
(within the magnitude and probability dimensions). A measure of sensitivity (d’),
reflective of perceptual rather than motor processing, was added to the behavioural
measures used in past studies and was shown to be poorer for low than high reward
targets. This finding suggested that low reward targets are visually perceived later than
high reward targets are. Sensitivity was correlated with accuracy and inverse efficiency,
suggesting that the observed variations in those measures as a function of target reward
value reflected the same or similar underlying process as sensitivity did. Furthermore,
shortening display duration across visual search trials was more detrimental to such
behavioural performance for low than high reward targets, further suggesting that low
reward targets are visually perceived later than high reward targets are (either via direct
channels, via attention or both). In summary, this more thorough behavioural assessment
of reward influences on visual feature perception corroborated the conclusions drawn in
the existing literature.

iv
ACKNOWLEGEMENTS
I would like to thank my late supervisor, Dr. Michael von Grünau, for his
encouragement and feedback throughout the course of this research. I sincerely
appreciated his flexibility in allowing me to explore some of my own research interests. I
would also like to thank my administrative supervisor, Dr. Aaron Johnson, as well as the
other members of my thesis committee who provided their individual input. Last, but not
least, I would like to express gratitude to my 64 participants from the Concordia
University Participant Pool, without whom these experiments would not have been
possible. The Natural Sciences and Engineering Research Council of Canada (NSERC)
supported this research.

v
Table of Contents
Page
List of Figures……………………………………………………………………..... xii
List of Tables…………………………………………………………………….….. xvi
General Introduction……………………………………………………………….... 1
The late stage: Reward and motor processing................................................... 3
Reward and the motor system…………………………………….......... 3
Reward and visual targets: General………………………………........... 3
Reward and visual targets: Eye-movements………………………......... 4
Motor processing and reward: A possible explanation…………............ 6
The early stage: Reward and visual perception..................……………............ 7
Visual search…………………………………………………………...... 8
Top-down knowledge and feature visual search: Cold cognition…........... 8
Top-down knowledge and feature visual search: Hot cognition….............. 9
Summary ……………………………………………………………………... 14
Current study…………………………………………………………………... 15
Experiment 1………………………………………………………………………..... 17
Methodology…………………………………………………………………... 19
Participant sample…………………………………………….................. 19
Apparatus and laboratory space………………………………................. 19
Stimuli………………………………....................................................... 19

vi
Procedure………………………………................................................... 20
Reward manipulation………………………………................................ 22
Results…………………………………………………………………........... 24
Paired samples t-tests: Magnitude and probability dimensions................ 24
Magnitude dimension....................................................................... 25
Probability dimension....................................................................... 27
Paired samples t-tests summary........................................................ 27
Independent samples t-tests: Magnitude versus probability dimensions... 31
Response time………………………………................................... 32
Accuracy……………………………….......................................... 32
Inverse efficiency………………………………............................ 32
Sensitivity………………………………......................................... 33
Range and variance.................................................................................... 33
Range................................................................................................ 33
Variance............................................................................................. 39
Intercorrelations between measures........................................................... 40
Magnitude dimension...................................................................... 41
Probability dimension...................................................................... 41
Discussion…………………………………………………………………...... 49
Summary of findings................................................................................... 49
Paired samples t-tests: Magnitude and probability dimensions......... 49
Independent samples t-tests: Magnitude versus probability
dimensions.............................................................................................51
vii
Range and variance............................................................................ 51
Intercorrelations between measures................................................... 52
Conclusion........................................................................................ 54
Experiment 2………………………………………………………………………..... 57
Methodology………………………………………………………………..….. 58
Participant sample……………………………………………................... 58
Task and procedure..................................................................................... 58
Reward manipulation.................................................................................. 59
Results………………………………………………………………...….......... 61
Discussion............................................................................................................ 63
Summary of findings……………………………………….....…….......... 63
Conclusion................................................................................................... 64
Experiment 3……………………………………………………………...………..…. 66
Experiment 3A………………………………..……………………...…………. 68
Methodology……………………………………….................................... 69
Participant sample…………………………………….....…............ 69
Apparatus and laboratory space………………………........…..…... 69
Stimuli……………………………………….................................. 69
Procedure………………………………………............................... 69
Reward manipulation………………………………….....……........ 71
Results………………………………………............................................. 72

viii
Repeated measures ANOVAs…………………………......…….... 72
Response time……………………………….....……..…....... 72
Accuracy……………………………………....….................. 73
Inverse efficiency……………………………....…………... 75
Sensitivity……………………………………....…............... 77
ANOVA summary.................................................................. 79
Experiment 3B……………………………………………………....………... 81
Methodology………………………………………................................ 82
Participant sample…………………………………….....…......... 82
Apparatus and laboratory space………………………........…….. 82
Stimuli………………………………………................................ 82
Procedure………………………………………........................... 82
Reward manipulation……………………………….....……….... 82
Results……………………………………….......................................... 83
Repeated measures ANOVAs……………………….......……..... 83
Response time………………………………….....……...... 84
Accuracy……………………………………....…................ 86
Inverse efficiency……………………………....…………... 88
Sensitivity……………………………………....…............... 91
ANOVA summary.................................................................. 93
Independent samples t-tests (Experiments 3A and 3B)…................ 93
Response time……………………………….....………....... 94
Accuracy……………………………………….................... 94

ix
Inverse efficiency……………………………....…………... 94
Sensitivity………………………………………................... 94
Discussion (Experiments 3A and 3B)……………………….......………. 99
Summary of findings………............................................................ 99
Repeated measures ANOVAs................................................. 99
Independent samples t-tests................................................... 109
Conclusion...................................................................................... 109
Experiment 4……………………………………………………………...………… 111
Experiment 4A……………………………………………………...………… 114
Methodology………………………………………................................. 115
Participant sample………………………………………............... 115
Apparatus and laboratory space……………………........……….. 115
Stimuli………………………………………................................ 115
Procedure………………………………………............................ 115
Reward manipulation………………………………….....……..... 115
Results……………………………………….......................................... 117
Repeated measures ANOVAs………………………......……….. 117
Response time………………………………….....……...... 117
Accuracy……………………………………....…............... 118
Inverse efficiency……………………………....………….. 120
Sensitivity……………………………………….................. 122
ANOVA summary.................................................................. 124

x
Experiment 4B……………………………………………………………...… 127
Methodology………………………………………................................. 128
Participant sample……………………………………….............. 128
Apparatus and laboratory space……………………………........... 128
Stimuli………………………………………................................ 128
Procedure: Visual search task…………………………….......….. 128
Reward manipulation: Visual search task………………........…... 128
Procedure: Discounting task……………...................................... 129
Results……………………………………….......................................... 130
Repeated measures ANOVAs…………………......…………….. 130
Response time…………………………….....…………...... 131
Accuracy……………………………………....…............... 131
Inverse efficiency…………………………....…………….. 133
Sensitivity…………………………………....…….............. 135
ANOVA summary.................................................................. 137
Independent samples t-tests (Experiments 4A and 4B)…….......... 139
Response time………………………………….....……...... 139
Accuracy………………………………………................... 140
Inverse efficiency………………………………....……….. 140
Sensitivity………………………………………................. 140
Discussion (Experiments 4A and 4B)……………………….......…….. 144
Summary of findings………......................................................... 144
Repeated measures ANOVAs.............................................. 144

xi
Independent samples t-tests................................................. 147
Conclusion.................................................................................... 147
General Discussion………………………………………………………….....……. 149
Past research……………………………………………………….....……… 149
Current study…………………………………………………………...……. 151
The reward-attention relationship………………………………….................. 154
Future directions……………………………………………………....……... 155
Other behavioural measures of visual (early) processing……............... 155
Individual differences………………………………….......................... 158
Conclusion…………………………………………………………...………. 158
References………………………………………………………………….....…….. 160
Appendix A……………………………………………………………………...….. 171
Appendix B………………………………………………………………….…....... 199
Appendix C……………………………………………………………………........ 233

xii
List of Figures
Figure Page
1. Sample stimulus and trial sequence used in Experiment 1............................... 21
2. Mean sensitivity (d’) (+SE) for the Low-Reward-Magnitude
target (LRm) and High-Reward-Magnitude target (HRm),
in Experiment 1A, p = 0.05............................................................................... 26
3. Mean accuracy (+SE) for the Low-Reward-Probability
target (LRp) and High-Reward-Probability target (HRp),
in Experiment 1, p = 0.04................................................................................. 28
4. Mean sensitivity (d’) (+SE) for the Low-Reward-Probability
target (LRp) and High-Reward-Probability target (HRp),
in Experiment 1, p = 0.01................................................................................. 29
5. Response time scatter plots for the LRm (top left),
HRm (top right), LRp (bottom left) and HRp (bottom right)
targets in Experiment 1. Each point represents the data
of one participant.............................................................................................. 35
6. Accuracy scatter plots for the LRm (top left), HRm (top right),
LRp (bottom left) and HRp (bottom right) targets in
Experiment 1. Each point represents the data of one
participant......................................................................................................... 36
7. Inverse efficiency scatter plots for the LRm (top left),
HRm (top right), LRp (bottom left) and HRp (bottom right)
targets in Experiment 1. Each point represents the data
of one participant.............................................................................................. 37
8. Sensitivity scatter plots for the LRm (top left), HRm (top right),
LRp (bottom left) and HRp (bottom right) targets in
Experiment 1. Each point represents the data of one
participant.......................................................................................................... 38
9. Significant positive correlation between the response time
and inverse efficiency measures in the magnitude component
of Experiment 1, r(8) = 0 .943; p = 0.00. Each point represents
the data of one
participant.......................................................................................................... 42
10. Significant positive correlation between the accuracy and
sensitivity measures in the magnitude component of

xiii
Experiment 1, r(8) = 0.712; p = 0.00. Each point represents
the data of one participant.................................................................................. 43
11. Significant negative correlation between the inverse efficiency
and sensitivity measures in the magnitude component of
Experiment 1, r(8) = -0.719; p = 0.00. Each point represents
the data of one participant.................................................................................. 44
12. Significant positive correlation between the response time
and inverse efficiency measures in the probability component
of Experiment 1, r(8) = 0 .855; p = 0.00. Each point represents
the data of one participant.................................................................................. 45
13. Significant positive correlation between the accuracy and
sensitivity measures in the probability component of
Experiment 1, r(8) = 0.878; p = 0.00. Each point represents
the data of one participant.................................................................................. 46
14. Significant negative correlation between the inverse efficiency
and sensitivity measures in the magnitude component of
Experiment 1, r(8) = -0.538; p = 0.03. Each point represents
the data of one participant.................................................................................. 47
15. Mean subjective reward value for the LRm ($1.00),
LRp ($5.09) and HRm/HRp ($10.00) targets in Experiment 1....................... 62
16. Sample stimulus and trial sequence used in Experiment 3 and 4...................... 70
17. Mean response time (+SE) for the significant main effect of
Display Duration in Experiment 3A, p = 0.01................................................... 74
18. Mean accuracy (+SE) for the significant Target Reward
Magnitude x Display Duration interaction in Experiment
3A, p = 0.03...................................................................................................... 76
19. Mean inverse efficiency (+SE) for the significant Target
Reward Magnitude x Display Duration interaction in
Experiment 3A, p = 0.05.................................................................................... 78
20. Mean sensitivity (+SE) for the significant Target Reward
Magnitude x Display Duration interaction in Experiment
3A, p = 0.02....................................................................................................... 80
21. Mean response time (+SE) for the significant main effect of
Display Duration in Experiment 3B, p = 0.02................................................... 85

xiv
22. Mean accuracy (+SE) for the significant main effect of Display
Duration in Experiment 3B, p = 0.00................................................................. 87
23. Mean inverse efficiency (+SE) for the significant main effect
of Target Reward Probability in Experiment 3B, p = 0.02................................ 89
24. Mean inverse efficiency (+SE) for the significant main effect
of Display Duration in Experiment 3B, p = 0.00................................................ 90
25. Mean sensitivity (+SE) for the significant main effect of
Display Duration in Experiment 3B, p = 0.04.................................................... 92
26. Mean difference (+SE) in accuracy between the HR and LR
target in the m and p dimension, in Experiment 3, p = 0.01............................. 95
27. Mean difference (+SE) in inverse efficiency between the HR
and LR target in the m and p dimension, in Experiment 3,
p = 0.03.............................................................................................................. 96
28. Mean difference (+SE) in sensitivity between the HR and LR
target in the m and p dimension, in Experiment 3, p = 0.05............................. 97
29. Mean response time (+SE) for the significant main effect of
Display Duration in Experiment 4A, p = 0.03................................................. 119
30. Mean accuracy (+SE) for the significant main effect of Display
Duration in Experiment 4A, p = 0.00............................................................... 121
31. Mean inverse efficiency (+SE) for the significant main effect
of Display Duration in Experiment 4A, p = 0.00............................................. 123
32. Mean sensitivity (+SE) for the significant main effect of
Display Duration in Experiment 4A, p = 0.04................................................. 125
33. Mean response time (+SE) for the significant main effect of Display Duration in Experiment 4B, p = 0.01......................................................... 132
34. Mean accuracy (+SE) for the significant Target Reward
Probability x Display Duration interaction in Experiment 4B,
p = 0.00............................................................................................................. 134
35. Mean inverse efficiency (+SE) for the significant Target
Reward Probability x Display Duration interaction in
Experiment 4B, p = 0.02.................................................................................. 136

xv
36. Mean sensitivity (+SE) for the significant Target Reward
Probability x Display Duration interaction in Experiment 4B,
p = 0.02........................................................................................................... 138
37. Mean difference (+SE) in accuracy between HR and LR target in
the m and p dimension, in Experiment 4, p = 0.00.......................................... 141
38. Mean difference (+SE) in inverse efficiency between HR and
LR target in the m and p dimension, in Experiment 4, p = 0.00.................... 142
39. Mean difference (+SE) in sensitivity between HR and LR target in
the m and p dimension, in Experiment 4, p = 0.04.......................................... 143

xvi
List of Tables
Table Page
B1. Paired Samples t-tests for the Magnitude Dimension of
Reward in Experiment 1................................................................................... 200
B2. Paired Samples t-tests for the Probability Dimension of
Reward in Experiment 1................................................................................... 201
B3. One-way ANOVAs for non-significant differences between
Blocks in Experiment 1..................................................................................... 202
B4. Paired Samples t-tests in Experiment 1: Mean Differences
Between the Low-Reward (LR) and High-Reward (HR)
Targets in the Magnitude (m) and Probability (p)
Dimensions of Reward...................................................................................... 203
B5. Range and Variance scores in Experiment 1.................................................... 204
B6. Pearson Product-Moment Correlations Between
Behavioural Measures of Performance for the Magnitude
Dimension of Reward in Experiment 1............................................................ 205
B7. Pearson Product-Moment Correlations Between Behavioural
Measures of Performance for the Probability Dimension of
Reward in Experiment 1.................................................................................. 206
B8. One-Way Analysis of Variance in Experiment 2.............................................. 207
B9. Bonferroni Pairwise Comparisons in Experiment 2.......................................... 208
B10. Repeated Measures Analysis of Variance for Response
Time in Experiment 3A.................................................................................... 209
B11. Repeated Measures Analysis of Variance for Accuracy
in Experiment 3A.............................................................................................. 210
B12. Bonferroni Pairwise Comparisons for Accuracy on the
Significant Target Reward Magnitude x Display Duration

xvii
Interaction in Experiment 3A............................................................................ 211
B13. Repeated Measures Analysis of Variance for Inverse
Efficiency in Experiment 3A........................................................................... 212
B14. Bonferroni Pairwise Comparisons for Inverse Efficiency
on the Significant Target Reward Magnitude x Display
Duration Interaction in Experiment 3A............................................................ 213
B15. Repeated Measures Analysis of Variance for Sensitivity
in Experiment 3A.............................................................................................. 214
B16. Bonferroni Pairwise Comparisons for Sensitivity on the
Significant Target Reward Magnitude x Display Duration
Interaction in Experiment 3A............................................................................ 215
B17. Repeated Measures Analysis of Variance for Response
Time in Experiment 3B..................................................................................... 216
B18. Repeated Measures Analysis of Variance for Accuracy
in Experiment 3B.............................................................................................. 217
B19. Repeated Measures Analysis of Variance for Inverse
Efficiency in Experiment 3B............................................................................ 218
B20. Repeated Measures Analysis of Variance for Sensitivity
in Experiment 3B............................................................................................. 219
B21. Independent Samples t-tests in Experiment 3.................................................. 220
B22. Repeated Measures Analysis of Variance for Response
Time in Experiment 4A.................................................................................... 221
B23. Repeated Measures Analysis of Variance for Accuracy
in Experiment 4A.............................................................................................. 222
B24. Repeated Measures Analysis of Variance for Inverse
Efficiency in Experiment 4A............................................................................ 223
B25. Repeated Measures Analysis of Variance for Sensitivity

xviii
in Experiment 4A............................................................................................. 224
B26. Repeated Measures Analysis of Variance for Response
Time in Experiment 4B.................................................................................... 225
B27. Repeated Measures Analysis of Variance for Accuracy
in Experiment 4B............................................................................................ 226
B27. Bonferroni Pairwise Comparisons for Accuracy on the
Significant Target Reward Probability x Display Duration
Interaction in Experiment 4B........................................................................... 227
B29. Repeated Measures Analysis of Variance for Inverse
Efficiency in Experiment 4B............................................................................ 228
B30. Bonferroni Pairwise Comparisons for Inverse Efficiency
on the Significant Target Reward Probability x Display
Duration Interaction in Experiment 4B............................................................. 229
B31. Repeated Measures Analysis of Variance for Sensitivity
in Experiment 4B............................................................................................ 230
B32. Bonferroni Pairwise Comparisons for Sensitivity on the
Significant Target Reward Probability x Display Duration
Interaction in Experiment 4B.......................................................................... 231
B33. Independent Samples t-tests in Experiment 4................................................ 232

1
General Introduction
A significant portion of human and non-human animal behaviour is goal-
directed. By definition, goal-directed behaviour is mediated by its outcome (e.g., Adams
& Dickinson, 1981; Balleine & Dickinson, 1998; Colwill & Rescorla, 1985; de Wit,
Kosaki, Balleine, & Dickinson, 2006). In other words, when the outcome of performing a
given behaviour is a current goal, the thought of the outcome typically activates the
behaviour needed to obtain it. Motivational outcomes known to shape behaviour include
consumable rewards (e.g., food and drink for human and non-human animals) and non-
consumable (e.g., money for humans) rewards (e.g., Estle, Green, Myerson, & Holt,
2007).
The strong influence of reward on overt/observable behaviour can most
unambiguously be witnessed in simple human explicit choice experiments. When
individuals are asked to make an explicit choice between two monetary rewards, their
choice is relatively predictable when the reward alternatives differ in the magnitude
dimension (e.g., Green & Myerson, 2004). For instance, if an individual is required to
choose between a $10 monetary reward and a $1 monetary reward, he/she will almost
certainly choose the $10 reward because of its higher subjective value. Similarly, given
two monetary reward alternatives equal in magnitude (e.g., $10), but differing in the
probability dimension, the individual will choose the reward with the higher (e.g., 100%)
rather than the lower (e.g., 10%) probability. This occurs because the subjective value of
the $10 reward is increasingly discounted as its likelihood progressively decreases (e.g.,
Green & Myerson, 2004). Also, given two monetary reward alternatives equal in
magnitude (e.g., $10), but differing in the delay dimension, the individual will choose the

2
reward with the shorter (e.g., 1 day from now) rather than the longer (e.g., 10 days from
now) delay. This occurs because the subjective value of the $10 reward is increasingly
discounted as its delay progressively increases (e.g., Green & Myerson, 2004).
Probability and delay discounting have both been empirically demonstrated (e.g.,
Myerson & Green, 1995).
A rewarding outcome may also be acquired by performing a specific
behaviour in response to a visual target. Under such circumstances, researchers have
predominantly investigated and found that reward covertly influences the late neural
stages of information processing along the “visual perception-overt behaviour”
continuum (e.g., Behrens, Woolrich, Walton, & Rushworth, 2007; Glimcher & Rustichini,
2004; Hampton & O’doherty, 2007; Schultz, Tremblay, & Hollerman, 2000). Among
others, these late stages include the motor processing immediately preceding the
performance of the overt/observable behaviour needed to acquire the reward associated
with the perceived visual target.
Only recently have researchers also begun to investigate whether reward
covertly influences the earlier neural stages of information processing along the “visual
perception-overt behaviour” continuum (i.e., the visual perception of the target stimulus).
Such research, although very limited, has suggested that reward does indeed influence
even the earliest form of visual perception (i.e., feature perception) (e.g., Kiss, Driver, &
Eimer, 2009; Kristjansson, Sigurjonsdottir, & Driver, 2010). Therefore, the general goal
of the current thesis was to investigate the influences of reward on the visual perception
stage of information processing along the “visual perception-overt behaviour” continuum

3
in feature visual search, in an attempt to corroborate, and supplement the conclusions
drawn in the existing literature.
The late stage: Reward and motor processing
Reward and the motor system. Researchers have suggested that
movement planning occurs via a neuronal network including the fronto-parietal cortex
(e.g., Romo, Scarnati, & Schultz, 1992; Sugrue, Corrado, & Newsome, 2004), and basal
ganglia, including the striatum (e.g., Romo, Scarnati, & Schultz, 1992). These areas are
believed to be involved in the preparation and initiation of sensory-guided and self-
initiated behaviour (e.g., Churchland, Santhanam, & Shenoy, 2006a; Gardiner & Nelson
1992; Lee & Assad 2003; Romo et al., 1992; Tsujimoto, Genovesio, & Wise, 2010;
Turner & Anderson, 1997). Importantly, these areas have also been suggested to
modulate the coordination of goal-directed motor behaviour as a function of reward.
Specifically, the basal ganglia, together with motor areas of the brain, are believed to
translate reward contingencies into the “vigor” of movement (e.g., Hayden, Nair, McCoy,
& Platt, 2008; Turner & Desmurget, 2010). Movement “vigor” is overtly represented by
the response time required to initiate a movement toward a stimulus and/or the speed with
which the movement towards the stimulus is executed.
Reward and visual targets: Limb movements. A study conducted by
Opris, Lebedev, and Nelson (2011) on monkeys and wrist movements provides an
illustrative example of the influence of reward on the motor system. In their study, two
monkeys were trained on a response time task requiring them to execute wrist
movements for reward in response to vibro-tactile and visual stimuli. Behavioural
findings from this study revealed that monkeys made earlier and faster wrist movements

4
(i.e., more “vigourous” movements) in trials were they knew that they would be rewarded.
Furthermore, single-unit recordings were consistent with the behavioural findings. More
specifically, trials in which the monkeys knew that they would be rewarded resulted in
earlier and greater neuronal firing rates in the dorsal striatum prior to the movement.
Reward and visual targets: Eye movements. Bottom-up factors known
to influence eye-movements, such as the luminance and contrast of visual stimuli, can be
measured with relative precision. As such, they are very simple to manipulate in a
laboratory setting. Although top-down factors, such as reward contingencies, are more
difficult to measure and manipulate, making their influence less well understood (e.g.,
Maunsell, 2004; Schall, 2004; Sparks, 1999), they have also been shown to influence
eye-movements (e.g., Fecteau & Munoz, 2006; Thompson & Bichot, 2005). In addition,
Campos, Breznen, Bernheim, and Andersen (2005) have demonstrated that
supplementary motor area (SMA) neurons, neurons involved with body and limb
movements, also carry a reward expectancy signal in the post-saccadic period of
oculomotor tasks.
Several experiments have been conducted in which reward magnitude
effects on saccadic behaviour have been reported while holding probability constant (e.g.,
Ding and Hikosaka, 2006; Lauwereyns, Watanabe, Coe, & Hikosaka, 2002; Leon &
Shadlen, 1999; Platt & Glimcher, 1999; Takikawa, Kawagoe, Itoh, Nakahara, &
Hikosaka, 2002). In addition, several experiments have been conducted in which
probability effects on saccadic behaviour have been reported while keeping magnitude
constant (e.g., Basso & Wurtz, 1998; Dorris & Munoz, 1998; Platt & Glimcher, 1999).
These two independent sets of experiments have isolated the effects of reward magnitude

5
and the effects of reward probability, respectively, on saccadic behaviour. Furthermore,
Milstein and Dorris (2007) conducted a study in which both magnitude and probability
were concurrently varied; resulting in a number of different expected reward values
(magnitude x probability). In their study, the human subjects directed a saccadic eye-
movement to a red dot presented to the left or right of fixation in a series of trials.
Expected value was manipulated from one block to the next by adjusting the magnitude
of the reward associated with the left versus the right target, and the probability of the
target appearing in either location. The authors found that saccadic reaction times were
negatively correlated with the expected value of the targets (i.e., longer saccadic reaction
times with lower expected values). Thus, they determined that the advanced preparation
of saccades reflected the expected value of the potential outcomes.
Takikawa, Kawagoe, Nakahara, and Hikosaka (2002) also assessed
reward-oriented eye movements by devising a memory-guided saccade task in monkeys.
In their study, the monkey was seated in a primate chair in a head-fixed position in front
of a screen. Small red spots of light were back-projected onto the screen. One of the
projectors was used for a fixation point and the other for an instructional cue. They began
by training the monkey on a simple memory-guided saccade task referred to as the all-
directions-rewarded task (Hikosaka & Wurtz, 1983). Each trial began with the onset of a
central fixation point on which the monkey needed to fixate. This fixation point was
followed by a cue stimulus that was 100 milliseconds (ms) in duration. The target was
subsequently presented in the cued location for 150ms. The monkey needed to remember
the location of the cue because it was required to make a rapid saccade to the target
location for reward (i.e., drop of water). Since the target presentation itself was only

6
150ms in duration the eyes could not otherwise reach the target location. The monkey
was then trained on a memory-guided saccade task referred to as a one-direction-
rewarded task (Kawagoe, Takikawa, & Hikosaka, 1998). In this particular task, only one
out of the four possible saccade directions was optimally rewarded. The three remaining
saccade directions were either not rewarded or rewarded with a smaller amount (for one
monkey). The rewarded direction was changed in each block. Importantly, the monkey
needed to make a saccade even in the non-rewarded direction or less-rewarded direction,
otherwise the same trial was continually repeated. The researchers found that several
saccade parameters were changed depending upon whether or not the saccade was
followed by reward. Among other differences, the mean saccade peak velocity was
higher and the mean saccade latency was shorter in the rewarded condition than in the
non-rewarded and less rewarded conditions. Also, the variability in saccade velocity,
latency and amplitude was smaller in the rewarded condition than in the non-rewarded
and less rewarded conditions.
Motor processing and reward: A possible explanation. Research by
Shadmehr and colleagues (Shadmehr, 2010; Shadmehr, de Xivry, Xu-Wilson, & Shih,
2010) provides a possible account of why motor movements are influenced by reward.
The researchers hypothesized that there is a connection between the delay discounting of
reward and the control of movements. They focused on the control of saccades, given that
this type of movement has been studied in numerous populations and conditions. As
previously mentioned, delay discounting studies have demonstrated that reward loses
value (i.e., is discounted) hyperbolically with increased delay (Myerson & Green, 1995).
Through a series of computational analyses, Shadmehr et al. (2010) determined that the

7
duration of a saccade is equivalent to the delay of reward, with longer saccade durations
discounting the value of the reward more than shorter saccade durations. This is because
the longer saccade durations delay the acquisition of reward to a greater extent than the
shorter saccade durations. Additionally, they demonstrated that this relationship is
adequately described by a hyperbolic function similar to the delay discounting function
found in explicit choice studies.
As suggested by Shadmehr et al. (2010), the hyperbolic cost of delayed
saccades on reward is also descriptive of the faster saccades found in children, who are
known to discount reward more steeply. The computational account also explains why
there is an increase in saccade velocity with higher rewards and why saccades are
impaired in disorders that affect the encoding of reward (e.g., Parkinson’s disease).
Furthermore, the movement of the eyes is typically coordinated with the movement of the
head (Guitton & Volle, 1987), and the hyperbolic function also accounts for the timing,
velocity and task-dependent variability in these coordinated movements (Epelboim,
Steinman, Kowler, Pizlo, Erkelens, & Collewijn, 1997). Such findings further support the
theory put forth by Shadmehr et al. (2010), suggesting that the duration of a saccade
represents the delay of reward acquisition, thus potentially accounting for the influence of
reward on motor (i.e., late) processing.
The early stage: Reward and visual perception
Rewards have convincingly been shown to modulate overt/observable
behaviour (e.g., limb movements and eye movements) towards visual targets, as
summarized in the above-mentioned studies. The neural correlates of motor (i.e., late)
processing as a function of reward have been suggested to exert an important influence

8
on these overt behaviours. However, the effects of reward on visual perception (i.e., the
early information processing stage along the “visual perception-overt behaviour”
continuum) have yet to be well documented (Kristjansson, Sigurjonsdottir & Driver,
2010). Findings, form a handful of studies, have nonetheless suggested that reward does
indeed influence even the earliest form of visual perception (i.e., feature perception).
Such studies have used the feature singleton visual search task as a tool.
Visual search. On a daily basis, we visually scan our surroundings
attempting to locate items of interest. The visual search task was developed as a
laboratory paradigm to mimic the real-world phenomenon of locating an item of interest
among a cluttered visual scene (e.g., Kristjansson, 2006; Kristjansson & Campana, 2010;
Müller & Krummenacher, 2006; Wolfe & Horowitz, 2004).
Visual search can be broadly subdivided into 2 categories: feature and
conjunction. Feature visual search consists of searching for a target that differs from its
surrounding distractors by a unique feature, such as colour or shape. For instance,
searching for a red square among green squares and green circles of the same size and
luminance (Trick & Enns, 1998). In contrast, conjunction visual search consists of
searching for a target that differs from its surrounding distractors by a combination of at
least two features. For instance, searching for a red square among green squares and red
circles.
Top-down knowledge and feature visual search: “Cold” cognition.
Although top-down knowledge regarding the task-relevance of a target seems intuitively
necessary to guide conjunction visual search, it is not as obvious whether it is also
required to guide feature visual search. This is because the greater dissimilarity of the

9
target relative to its surrounding distractors in the feature than in the conjunction visual
search implies greater activation for the target relative to its surrounding distractors in the
feature than in the conjunction visual search (e.g., Cave & Wolfe, 1990; Theeuwes, 1992,
1994; Wolfe, 1994). Thus, it is important to address whether top-down influences can
further boost the already high bottom-up activity generated by the feature singleton target.
Subsequent studies have shown that bottom-up saliency in feature visual
search can indeed be modulated by the behavioural importance of stimuli (e.g., Ivry &
Cohen, 1990; Müller, Heller, & Ziegler, 1995; Wang, Cavanagh, & Green, 1994; Wang,
Kristjánsson, & Nakayama, 2005; Wolfe, Cave, & Franzel, 1989). For instance, some
early evidence was found showing that response time to locate a feature singleton target
is faster when top-down knowledge is involved (i.e, knowing whether the target will be a
unique shape versus a unique colour) (Treisman, 1988). More recent studies have
corroborated these findings (e.g., Found & Müller, 1996; Müller, Heller, & Ziegler, 1995;
Müller, Reimann & Krummenacher, 2003). Importantly, top-down effects have not only
been demonstrated in regards to the task-relevance of stimuli (i.e., “cold” cognition”) but
also in terms of the emotional significance and reward contingencies of stimuli (i.e., “hot”
cognition) (Vuillermier & Driver, 2007).
Top-down knowledge and feature visual search: “Hot” cognition.
Kristjansson et al. (2010) investigated whether the reward level associated with two
different feature singleton targets affects visual search and repetition effects from trial-to-
trial. Participants in this study were asked to search for a red target diamond among green
distractor diamonds or vice versa. They were asked to report whether the target had a
notch at its top or bottom by pressing a corresponding key on a computer keyboard.

10
Correct responses led to reward, and the reward varied according to the target colour. For
half of the participants, the red target led to higher reward than the green target, and for
the other half of the participants, the green target led to higher reward than the red target.
Search performance was measured in inverse efficiency, calculated by dividing the
response time by proportion correct. The researchers found better inverse efficiency (i.e.,
more efficient search) for the target associated with the higher reward than for the target
associated with the lower reward. Furthermore they found increased trial-to-trial priming
for the high reward colour target when the priming was repeated from trial-to-trial.
Della Libera and Chelazzi (2006) reported potentially related effects of
reward on distractor rejection. In their study, variable monetary rewards were given to
participants who performed a series of prime-probe sequences, based on their
performance on the task. The results showed evidence that the distractor was ignored
more effectively in highly rewarded selections.
Findings from such studies suggest that the reward value associated with a
feature singleton target may affect the visual perception (i.e., early) stage of information
processing along the “visual perception-overt behaviour” continuum. However, it is
important to note that the key-press response used in all of these studies is a motor
response (i.e., late stage processing). Consequently, the results obtained in such studies
may entirely or partially reflect reward influences on the motor (i.e., late) as opposed to
the perceptual (i.e., early) information processing stage, depending upon the ability of the
employed behavioural measure (i.e., response time to make the key press response,
accuracy in making the key-press response, efficiency in making the key-press response,
etc.) to reflect one underlying process relative to the other.

11
Other evidence, suggestive of the effects of reward on feature visual
perception, stems from the documented effect of reward on attention (Kiss et al., 2009),
given attention’s independently documented effects on feature visual perception (e.g.,
Fang, Boyaci, & Kersten, 2009; Ghose & Maunsell, 2008; Kamitani & Tong, 2006;
McAdams & Maunsell, 1999; McAlonan, Cavanaugh, & Wurtz, 2008; McAlonan,
Cavanaugh, & Wurtz, 2006; Reynolds, Chelazzi, & Desimone, 1999; Reynolds et al.,
1999).
For instance, a study conducted by Kiss et al. (2009) assessed the effects
of reward on feature visual perception using a paradigm similar to that used by
Kristjansson et al. (2010). More specifically, participants in this study were asked to
search for a red or green target diamond among grey distractor diamonds, all of which
had a notch either at their top or their bottom. The participants reported the position of
the notch on the target diamond on each trial by pressing the corresponding key on a
computer keyboard. Reward was manipulated by informing participants that they could
earn a bonus payment through the accumulation of sufficient bonus points from fast and
correct responses. For half of the participants more bonus points were rewarded for fast
and correct responses to the red target stimulus and for the other half of the participants,
more bonus points were rewarded for fast and correct responses to the green target
stimulus. As would be predicted by reward influences on feature visual perception, the
researchers found faster response time and better inverse efficiency for high reward
targets.
What sets this study apart from others is that the researchers acquired
electroencephalography (EEG) data in addition to behavioural data (i.e., response time

12
accuracy and inverse efficiency). This allowed them to assess whether event-related
potential (ERP) signatures vary as a function of reward. ERP literature on feature
singleton visual search already exists (e.g., Eimer & Kiss, 2008; Hickey, McDonald, &
Theeuwes, 2006; Schubö, Schröger, Meinecke, & Müller, 2007). Such work has
uncovered an important correlate of visual target selection, the N2pc component. The
N2pc is an enhanced negativity at posterior electrodes contralateral to the target,
emerging 180-220ms following display onset. It is believed that this N2pc signal reflects
attentional selection of the target among the distractors in the display as a task-relevant
item that needs to be judged and reported on (Eimer, 1996; Girelli & Luck, 1997;
Woodman & Luck, 1999). Magnetoencephalography (MEG) recordings have implicated
the extrastriate visual cortex and the posterior parietal cortex in the N2pc (Hopf et al.,
2000). Importantly, however, it is considered a reliable marker of attentional selection in
visual search.
Given that both the red and green targets were equally salient in terms of
their physical characteristics and both needed to be selected, judged and responded to in
the Kiss et al. (2009) study, both were expected to elicit an N2pc. Thus, they were
perfectly equated in terms of “cold” cognition. They differed only in whether they were
associated with higher versus lower reward (i.e., “hot” cognition). The researchers
hypothesized that, if reward affects attentional selection, a later and weaker N2pc would
be found for the low rather than the high reward targets. This was indeed their finding,
suggesting that low reward targets are attended to later than are high reward targets. The
researchers conducted correlation analyses to investigate whether the obtained
differences between high and low reward targets in inverse efficiency were related to the

13
obtained differences in N2pc between high and low reward targets. They found a positive
correlation between the N2pc and inverse efficiency, suggesting that inverse efficiency
reflects a related underlying process.
In turn, a substantial amount of research has investigated and found the
neural correlates of attention in visual areas important for feature visual perception. For
example, in a study by Somers and colleagues (1999), functional magnetic resonance
imaging (fMRI) was used to study humans during attentionally demanding visual
discriminations. The results indicated similar robust attentional modulations in both
striate and extrastriate cortical areas. These data suggest that neural processing in V1 is
not governed simply by sensory stimulation, but, like extrastriate regions, V1 can be
strongly and specifically influenced by attention. For example, attention has been shown
to affect spatial resolution within the primary visual cortex. In a study by Wörgötter et al.
(1998), performed on anesthetized cats, the shape of receptive fields in V1 underwent
significant modifications that were correlated with the general state of the brain as
assessed by EEG. More specifically, receptive fields were wider during synchronized
states (drowsiness) and smaller during non-synchronized states (attentive perception).
This shrinking of the receptive field allows the cells in the visual cortex to become more
highly sensitized to receiving detailed information regarding visual stimuli, improving
performance. Therefore, the effect of target reward value on the N2pc in the Kiss et al.
(2009) study may suggest an indirect effect of reward on visual perception (i.e., via
attention).

14
Summary
In summary, numerous studies have reliably shown that overt/observable
behaviour in response to visual targets can be modulated by reward. Most studies have
investigated and implicated the behavioural differences between responses to low and
high reward visual targets to reward-contingent neural modulations during the motor (i.e,
late) stage of information processing along the “visual perception-overt behaviour”
continuum. More recent studies have also begun to show evidence that these behavioural
differences may reflect reward-contingent neural modulations during the visual
perception (i.e., early) stage of information processing along the “visual perception-overt
behaviour” continuum.
The study conducted by Kiss et al. (2009) showed that low-reward targets
are not simply associated with poorer behavioural responses than are high-reward targets,
which may reflect later visual perception (i.e., early processing stage) and/or later motor
processing (i.e., late processing stage) for low-reward targets than for high-reward targets.
The researchers also showed that low-reward targets are associated with a later and
weaker N2pc than are high-reward targets, which reflects later attentional selection for
low-reward targets than for high-reward targets. In turn, the effects of reward on the
N2pc (i.e., attentional selection) suggest that reward influences the visual perception (i.e.,
early) stage of information processing along the “visual perception-overt behaviour”
continuum. Kiss et al. (2009) also found that responses on the behavioural measure of
inverse efficiency were correlated with N2pc recordings, suggesting that inverse
efficiency reflects a similarly early underlying processing stage as does the N2pc. Thus,
findings from the Kiss et al. (2009) study are noteworthy because they are one of the first

15
kinds of evidence demonstrating that reward influences feature visual perception
(indirectly, via attention) and that inverse efficiency is a behavioural measure that can
alternatively be used to assess the influence exerted by reward on this early underlying
process in the absence of EEG recordings.
Current thesis
The aim of the current thesis was to provide a more thorough behavioural
assessment of reward influences on visual perception in feature singleton visual search
and, thus, on the earliest stage of information processing along the “visual perception-
overt behaviour” continuum. This assessment was conducted not only within the
magnitude dimension, but also within the probability dimension of reward. The
probability dimension of reward was integrated into this study as a preliminary attempt to
determine whether the influence of reward on visual processing within the magnitude and
probability dimensions follows the same overall principles.
In the current series of experiments, the paradigm used was similar to that
used by Kiss et al. (2009). This paradigm was designed to assess only reward-related
influences on feature visual perception (i.e., “hot” cognition), given that bottom-up
influences and top-down influences that are not related to reward (i.e., “cold” cognition)
are controlled for. Some minor adjustments were made to the original paradigm in terms
of reward manipulation (discussed in detail later), in order to prevent or reduce the
intentional use of go-fast and go-slow motor strategies that were a reported concern in the
Kiss et al. (2009) study.
A measure of sensitivity (d’) was added to the behavioural measures used
in previous experiments of this nature (i.e., response time, accuracy and inverse

16
efficiency). Sensitivity (d’) is a statistic used in Signal Detection Theory (Green & Swets,
1966). It quantifies the degree of difficulty with which a target stimulus (i.e., a signal)
can be detected amongst background stimuli and random activity generated by the brain
(i.e., noise). As such, d’ reflects perceptual processing (rather than motor processing). In
addition, thresholds for detecting a target (i.e., a signal) are known to vary according to
factors such as experience, expectations and psychological state. However, detection
thresholds have yet to be assessed in terms of reward contingencies. Therefore, if in the
current thesis sensitivity (d’) were lower for low-reward targets than for high-reward
targets, two important interrelated inferences could be drawn. First, that detection
thresholds can vary according to reward contingencies. Second, that perceptual (i.e.,
early) processing is slower for low-reward targets than for high-reward targets.
Correlations were also performed between all behavioural measures in
order to determine whether any observed differences in response time, accuracy and
inverse efficiency between low-reward targets and high-reward targets reflected the same
or similar underlying process as sensitivity did, namely feature visual perception (i.e.,
early processing).
Furthermore, in Experiment 3, the display duration across visual search
trials was manipulated. It was expected that shortening the display duration would be
more detrimental to behavioural measures reflecting early processing, such as sensitivity,
for low-reward targets than for high-reward targets. This would further suggest that low-
reward targets are visually perceived later than are high-reward targets (either via direct
channels, via attention or a combination of both).

17
Experiment 1
Behavioural assessment of monetary reward magnitude and monetary reward
probability influences on feature visual perception
Experiment 1 assessed the overt/observable effects of independently
varying a target’s reward magnitude (i.e., low reward magnitude versus high reward
magnitude), and a target’s reward probability (i.e., low reward probability versus high
reward probability) on feature visual search. This assessment was conducted on 4
behavioural measures of performance, namely response time, accuracy, inverse efficiency
and sensitivity (d’). The experiment concurrently investigated the extent to which each
behavioural measure can reflect visual (i.e., early) processing of target features as
opposed to motor (i.e., late) processing along the “visual perception-overt behaviour”
continuum.
The feature visual search paradigm used was similar to that used by Kiss et
al. (2009). However, it was modified in the current experiment in 5 ways. First, Kiss et al.
(2009) varied target reward value only within the magnitude dimension. The current
study also did so within the probability dimension, while keeping magnitude constant.
The probability dimension of reward was integrated into this study as a preliminary
attempt to determine whether the influence of reward on visual processing within the
magnitude and probability dimensions follows the same principles. Second, the reward
manipulation methodology was altered in the current study so as to reduce the possibility
that participants employ a conscious go-slow motor strategy for targets low in reward
value or go-fast motor strategy for targets high in reward value, which was one of the
reported concerns in the Kiss et al. (2009) study. Third, a measure of sensitivity (d’) was
18
added to the data analysis in addition to the response time, accuracy and inverse
efficiency measures reported in the Kiss et al. (2009) study. Sensitivity was added due to
its known reflection of perceptual (i.e., early) rather than motor (i.e., late) processing.
Fourth, the association between the four behavioural measures was assessed in an attempt
to determine whether differences in measures of response time, accuracy and inverse
efficiency reflected the same underlying process as did sensitivity, namely feature visual
perception (i.e., early processing). Fifth, a static noise mask was presented immediately
following each stimulus presentation so as to reduce afterimages.
Regardless of the reward dimension (i.e., magnitude/m or probability/p), it
was expected that target identification response times would be slower, error rates would
be higher, efficiency would be poorer and sensitivity would be lower for targets low in
reward value (LR) than for targets high in reward value (HR). However, given the more
stringent control placed on go-slow/go-fast motor strategies in the current experiment as
compared to the Kiss et al. (2009) experiment, behavioural measures entirely or primarily
reflecting visual (i.e., early) processing, such as sensitivity, were expected to be
influenced by reward more than behavioural measures reflecting motor (i.e., late)
processing. It was also expected that sensitivity - which reflects early processing - would
be correlated with inverse efficiency. This correlation was expected given the Kiss et al.
(2009) findings showing inverse efficiency to be positively correlated with the N2pc,
suggesting that inverse efficiency is a behavioural measure that reflects a similarly early
processing stage as does the N2pc. No expectations were formulated as to additional
correlations.

19
Methodology
Participant sample
Two independent groups of participants were used in this experiment.
Participants in the magnitude component of this experiment consisted of 5 female and 3
male (mean age = 25) Concordia University undergraduate psychology students.
Participants in the probability component of this experiment consisted of 7 female and 1
male (mean age = 21) Concordia University undergraduate psychology students. All
participants had self-reported normal vision. They were drawn from the Psychology
Department’s Participant Pool and treated in accordance with the guidelines set by the
“Concordia University Human Research Ethics Committee”.
Apparatus and laboratory space
Stimuli were created using VPixx software (v.2.32) running on a Mac Pro
computer and presented on a 24-inch colour LCD Apple Cinema HD display at a 57cm
viewing distance. The resolution of the screen was 1920 x 1200 pixels and its refresh rate
was 60 Hz. A chin-rest was used so as to avoid head movements. Each participant was
tested individually and was seated alone in a dimly lit and quiet room.
Stimuli
On each trial, a circular stimulus array of 12 diamonds was presented
against a black background (see Figure 1). The stimulus array on each trial consisted of
11 gray distractor diamonds and 1 red or green target diamond. The gray, red and green
diamonds were adjusted to be physically equiluminant (14.1 cd/m2). Each diamond had a
notch randomly positioned either at the top or bottom and subtended 1° x 1° of visual
angle (disregarding the 0.35° notch). A central gray fixation dot (0.3° x 0.3° of visual

20
angle) was presented throughout each trial. All diamonds were 4° of visual angle away
from the fixation dot. At the end of each trial, the stimulus array region was masked by a
static noise pattern so as to minimize afterimages.
Procedure
Testing for each participant consisted of 2 blocks of 240 trials, in which a
covert visual search was performed to identify the position (top or bottom) of the notch
on the red or green target diamond among the grey distractor diamonds. The total length
of testing for each participant was approximately 60 minutes, with a short break between
the two blocks. All participants gave informed consent prior to the onset of their first
testing block (see Appendix A) and were debriefed as to the rationale of the study
following completion of their last testing block.
To initiate each trial, the participant pressed the space bar (see Figure 1).
Once the space bar was pressed, the fixation dot was presented for 1.5 seconds (s). When
the 1.5s had elapsed, the stimulus array also appeared on the screen and remained there
for 150ms (9 frames), which was too brief for the participant to make saccades. Prior to
the onset of testing, the participant was explicitly instructed to maintain fixation on the
central fixation dot at all times. The participant was also informed that there was an equal
likelihood of either the red or green target appearing on each trial and that either target
was equally likely to appear in any location within the stimulus array. This information
was provided because the probability of a given target appearing in a given location has
been suggested to influence the reward value of that target/location (Milstein & Dorris,
2007). The stimulus array was masked by the static noise pattern following its 150ms (9
frames) presentation.

21
(150ms = 9 frames)
Time
Response
0s 1.500s 1.650s 3.000s
Fixation onset Stimulus onset Mask onset Beep
(following space (end of trial)
bar press)
Figure 1. Sample stimulus and trial sequence used in Experiment 1.

22
The participant reported whether the target stimulus had a notch at the top
or the bottom, using the up and down keys on the computer keyboard, as quickly and as
accurately as possible. The participant was aware that the response had to be made before
a beep sounded 3s following fixation onset, which indicated trial termination.
Reward manipulation
All participants received 2 course credits simply for participating in the
study. In addition, at the end of each participant’s testing session, a random-number
generator was used to select one of the trials therein.
In the magnitude component of the experiment, if the randomly selected
trial contained a Low-Reward-Magnitude target (LRm), a $1 monetary reward was given.
If it contained a High-Reward-Magnitude target (HRm), a $10 monetary reward was
given. However, if an incorrect or late response (after the 3s) was made in the trial that
was randomly selected, no monetary reward was given. For half of the participants, the
LRm target was red and the HRm target was green. For the other half of the participants,
the LRm target was green and the HRm target was red. Participants were informed of
these reward contingencies prior to the start of the experiment.
In the probability component of the experiment, if the randomly selected
trial contained a Low-Reward-Probability target (LRp), a $10 monetary reward was
given with 10% probability (A random number generator with numbers 1 through 10 was
used. If the number 1 was drawn, the $10 reward was given; if any of the other numbers
were drawn, it wasn’t). If it contained a High-Reward-Probability target (HRp), a $10
monetary reward was given with 100% probability. However, if an incorrect or late
response (after the 3s) was made in the trial that was randomly selected, no monetary

23
reward was given. For half of the participants, the LRp target was red and the HRp target
was green. For the other half of the participants, the LRp target was green and the HRp
target was red. Participants were informed of these reward contingencies prior to the start
of the experiment.
It was to the participant’s benefit to get as many correct and on-time
responses as possible regardless of reward value in order to get a monetary reward of
some kind. Therefore, every trial was worth something if it was responded to accurately
and on time, making both accuracy and speed relevant. In the Kiss et al. (2009) study,
bonus points were awarded to any correct trial that exceeded the mean response time of
all trials in the block, regardless of reward size. Thus, going slower on LR trials and
faster on HR trials may have served as a conscious strategy to optimize reward. And,
making errors on the LR trials did not lead to $0 monetary payment as it did in the
current experiment.

24
Results
The raw data generated by each participant were automatically exported
from VPixx (v.2.32) to Excel (v.12.3.0). Excel was used to summarize each participant’s
raw data into “LRm target” and “HRm target” means for participants in the magnitude
group and into “LRp target” and “HRp target” means for participants in the probability
group. This was dome for each of the 4 behavioural measures, namely, response time,
accuracy, inverse efficiency, and sensitivity (d’), resulting in a total of 16 means.
Paired samples t-tests: Magnitude and probability dimensions
SPSS software (v.19) was used to conduct a separate paired samples t-test
on each of the four behavioural measures in the magnitude (m) component of the
experiment and a separate paired samples t-test on each of the four behavioural measures
in the probability (p) component of the experiment. For each of the four analyses in the
m dimension, the mean for the LRm target was compared to the mean for the HRm
target. And, for each of the four analyses in the p dimension, the mean for the LRp target
was compared to the mean for the HRp target (see Appendix B for complete proofs).
These paired samples t-tests were conducted to assess the overt/observable
effects of independently varying a target’s reward magnitude (i.e., low reward magnitude
versus high reward magnitude), and a target’s reward probability (i.e., low reward
probability versus high reward probability) on feature visual search. Regardless of the
reward dimension (i.e., magnitude/m or probability/p), it was expected that target
identification response times would be slower, error rates would be higher, efficiency
would be poorer and sensitivity would be lower for targets low in reward value (LR) than
for targets high in reward value (HR).

25
These paired samples t-tests were also conducted to assess the extent to
which different behavioural measures can reflect visual (i.e., early) processing of target
features as opposed to motor (i.e., late) processing along the “visual perception-overt
behaviour” continuum. Given the more stringent control placed on go-slow/go-fast
motor strategies in the current experiment as compared to the Kiss et al. (2009)
experiment, behavioural measures entirely or primarily reflecting visual (i.e., early)
processing, such as sensitivity, were expected to be influenced by reward more than
behavioural measures reflecting motor (i.e, late) processing.
Magnitude dimension. Contrary to expectations, the mean response time
for the LRm target (M = 0.630s, SE = 0.030s) did not differ significantly from the mean
response time for the HRm target (M = 0.627s, SE = 0.030s), t(7) = 0.509, p = 0.63, g =
0.03 (see Table B1).
Contrary to expectations, the mean accuracy for the LRm target (M =
92.5%, SE = 2.7%) did not differ significantly from the mean accuracy for the HRm
target (M = 97.3%, SE = 1.1%), t(7) = 2.190, p = 0.07, g = 0.77 (see Table B1).
Contrary to expectations, the mean inverse efficiency for the LRm target
(M = 0.661s, SE = 0.042s) did not differ significantly from the mean inverse efficiency
for the HRm target (M = 0.643s, SE = 0.035s), t(7) = 1.408, p = 0.20, g = 0.15 (see Table
B1).
As expected, the mean sensitivity for the LRm target (M = 2.812, SE =
0.258) was significantly lower than the mean sensitivity for the HRm target (M = 3.212,
SE = 0.223), t(7) = 2.309, p = 0.05, g = 0.55 (see Figure 2 and Table B1).

26
Figure 2. Mean sensitivity (d’) (+SE) for the Low-Reward-Magnitude target (LRm) and
High-Reward-Magnitude target (HRm) in Experiment 1, p = 0.05.

27
Probability dimension. Contrary to expectations, the mean response time
for the LRp target (M = 0.627s, SE = 0.016s) did not differ significantly from the mean
response time for the HRp target (M = 0.622s, SE = 0.016s), t(7) = 0.791, p = 0.46, g =
0.11 (see Table B2).
As expected, the mean accuracy for the LRp target (M = 96.5%, SE =
1.3%) was significantly lower than the mean accuracy for the HRp target (M = 97.5%,
SE = 1.3%), t(7) = 2.506, p = 0.04, g = 0.24 (see Figure 3 and Table B2).
Contrary to expectations, the mean inverse efficiency for the LRp target
(M = 0.650s, SE = 0.016s) did not differ significantly from the mean inverse efficiency
for the HRp target (M = 0.638s, SE = 0.015s), t(7) = 1.448, p = 0.19, g = 0.25 (see Table
B2).
As expected, the paired samples t-test conducted on the sensitivity (d’)
data in the p dimension of reward revealed that the mean sensitivity for the LRp target
(M = 2.882, SE = 0.154) was significantly lower than the mean sensitivity for the HRp
target (M = 3.154, SE = 0.148), t(7) = 3.761, p = 0.01, g = 0.60 (see Figure 4 and Table
B2).
Paired samples t-tests summary. As expected, sensitivity (d’) was
significantly lower for LR targets than for HR targets in both the m and p dimensions.
Thus, two important interrelated inferences could be drawn for both dimensions of
reward. First, detection thresholds can vary according to reward contingencies. Second,
perceptual (i.e., early) processing is slower for low-reward targets than for high-reward
targets.

28
Figure 3. Mean accuracy (+SE) for the Low-Reward-Probability target (LRp) and High-
Reward-Probability target (HRp) in Experiment 1, p = 0.04.

29
Figure 4. Mean sensitivity (d’) (+SE) for the Low-Reward-Probability target (LRp) and
High-Reward-Probability target (HRp) in Experiment 1, p = 0.01.

30
Also, as expected, accuracy was significantly lower for LR targets than for
HR targets in the p dimension. A trend in the same direction was obtained in the m
dimension. This finding on its own did not allow for a disambiguation between accuracy
being a reflection of early and/or late processing. Therefore, accuracy’s relationship with
sensitivity (i.e., reflection of early processing) was subsequently investigated in the
“Intercorrelations between measures” results section (p. 43). A significant positive
accuracy-sensitivity correlation would suggest that, accuracy, like sensitivity, is a likely
reflection of perceptual (i.e., early) processing.
Contrary to expectations, response time was not significantly slower and
inverse efficiency was not significantly poorer for LR targets than for HR targets in both
the m and p dimensions. Nonetheless, the direction of findings was in the expected
direction. The non-significant findings for response time were somewhat expected given
the more stringent control placed on go-slow/go-fast motor strategies (i.e., late processing
stage) in the current experiment as compared to the Kiss et al. (2009) experiment. In
contrast, the non-significant inverse efficiency findings were surprising given inverse
efficiency’s correlation with the N2pc (i.e., early processing stage) in the Kiss et al.
(2009) study. The non-significant inverse efficiency findings may therefore be due to the
response time component involved in the calculation of inverse efficiency (inverse
efficiency = response time/proportion correct). Furthermore, the possibility that the use of
a training block in the Kiss et al. (2009) study but not in the current study lead to the
statistical discrepancies for response time and inverse efficiency between their study and
the current study was reliably ruled out. This was accomplished by re-analyzing the data
within Experiment 1. More specifically, the 480 trials were divided into 4 blocks of 120

31
trials. Differences in response time and inverse efficiency between LR targets and HR
targets did not differ significantly across blocks in either dimension (see Table B3). In
other words, a significant perceptual learning effect was not observed for response time
(m dimension: F(3, 21) = 0.399, p = 0.76; 2 = 0.05; p dimension: F(3, 21) = 0.257, p =
0.86, 2 = 0.04) or inverse efficiency (m dimension: F(3, 21) = 2.099, p = 0.13, 2 =
0.23; p dimension: F(3, 21) = 2.560, p = 0.08, 2 = 0.27) between bocks, possibly due to
the inherent simplicity of the task.
Independent samples t-tests: Magnitude versus probability dimensions
Findings from the paired samples t-tests reported in the previous section
were similar within the magnitude (m) and probability (p) dimensions of reward. This
observation suggested that reward manipulations in both dimensions had similar effects
on behavioural performance. However, it was considered noteworthy that the paired
samples t-tests in the m component of the experiment showed somewhat weaker
statistical results than those in the p component of the experiment. More specifically, for
all 4 measures of performance, the p-values were larger and t-scores were smaller in the
m dimension as compared to the p dimension. Furthermore, statistical significance was
obtained only for the sensitivity (d’) measure of performance in the m dimension,
whereas statistical significance was obtained for both the accuracy and sensitivity (d’)
measures of performance in the p dimension.
The larger p-values and smaller t-scores in the m dimension as compared
to the p dimension were somewhat contradictory to the observation that the mean
difference between the LRm and HRm targets seemed larger than the mean difference
between the LRp and HRp targets, for the accuracy, inverse efficiency and sensitivity

32
measures of performance (opposite, but negligible for response time). Similarly
contradictory to the p-value and t-score observations, but in line with the mean
differences observations, was the larger effect size for accuracy in the m dimension as
compared to the p dimension.
It must be emphasized that these observed inconsistencies would normally
not be investigated further. However, given that Experiments 3 and 4 address m and p
dimensions of reward, such subtleties were important to understand in order to allow an
informed interpretation of the findings in each dimension. Therefore, SPSS software
(v.19) was used to conduct a separate independent samples t-test on each of the 4
behavioural measures of performance. For each of the 4 analyses, the mean difference
between the LRm and HRm targets was compared to the mean difference between the
LRp and HRp targets (see Appendix B for complete proofs).
Response time. The mean difference in response time between the LR
target and HR target in the m dimension (M = 0.003s, SE = 0.005s) did not differ
significantly from the mean difference in response time between the LR target and HR
target in the p dimension (M = 0.005s, SE = 0.007s), t(7) = -0.512 , p = 0.62 (see Table
B4).
Accuracy (% correct). The mean difference in accuracy between the LR
target and HR target in the m dimension (M = -4.8%, SE = 2.2%) did not differ
significantly from the mean difference in accuracy between the LR target and HR target
in the p dimension (M = -1.0%, SE = 0.4%), t(7) = -1.719, p = 0.13 (see Table B4).
Inverse efficiency. The mean difference between in inverse efficiency
between the LR target and HR target in the m dimension (M = 0.018s, SE = 0.013s) did

33
not differ significantly from the mean difference in inverse efficiency between the LR
target and HR target in the p dimension (M = 0.012s, SE = 0.008s), t(7) = 0.648, p = 0.54
(see Table B4).
Sensitivity (d’). The mean difference in sensitivity between the LR target
and HR target in the m dimension (M = -0.400, SE = 0.173) did not differ significantly
from the mean difference in sensitivity between the LR target and HR target in the p
dimension (M = -0.272, SE = 0.072) , t(7) = -0.831, p = 0.43 (see Table B4).
Range and Variance
In the independent samples t-tests section above, the mean difference
between the LRm and HRm targets was not shown to be significantly larger than the
mean difference between the LRp and HRp targets for any behavioural measure of
performance. This finding solidified the earlier conclusion that reward manipulations in
both dimensions had similar effects on behavioural performance.
However, even the non-significant larger mean differences in the m
dimension for the accuracy, inverse efficiency and sensitivity measures, combined with
larger effect size for accuracy in the m dimension, remained contradictory with the larger
p-values and smaller t-scores in the m dimension. Thus, the standard errors of means
were compared in each dimension. This comparison revealed that they were larger in the
m dimension than in the p dimension for the accuracy, inverse efficiency and sensitivity
measures. Thus, it was hypothesized that the surprisingly weaker p-value and t-score
findings in the m dimension were simply due to a greater range and variance between
participant responses in that dimension (see Table B5 for complete proofs).

34
Range. As expected, for all behavioural measures of performance, the
range of responses was larger in the m dimension than in the p dimension (averaged over
Target Reward Value). More specifically, for the response time measure, the m
dimension had a 0.263s range and the p dimension had a 0.135s range. For the accuracy
measure, the m dimension had a 13.5% range and the p dimension had an 11.5% range.
For the inverse efficiency measure, the m dimension had a 0.298s range and the p
dimension had a 0.146s range. For the sensitivity measure, the m dimension had a 2.172
range and the p dimension had a 1.344 range.
Also, the larger range found in the m dimension as compared to the p
dimension applied to both the LR and HR targets for the response time, inverse
efficiency and sensitivity measures of performance (but only for the LR target for the
accuracy measure of performance). More specifically, for the response time measure, the
LRm target had a range of 0.255s and the LRp target had a range of 0.141s; the HRm
target had a range of 0.270s and the HRp target had a range of 0.128s (see Figure 5). For
the accuracy measure, the LRm target had a range of 16.8% and the LRp target had a
range of 11.3%; the HRm target had a range of 10.1% and the HRp target had a range of
11.6% (see Figure 6). For the inverse efficiency measure, the LRm target had a range of
0.314s and the LRp target had a range of 0.156s; the HRm target had a range of 0.282s
and the HRp target had a range of 0.136s (see Figure 7). For the sensitivity measure, the
LRm target had a range of 2.407 and the LRp target had a range of 1.254; the HRm
target had a range of 1.936 and the HRp target had a range of 1.433 (see Figure 8).
Also potentially noteworthy is that the difference in range between the
LRm and HRm targets was larger than the LRp and HRp targets for the response time

35
Figure 5. Response time scatter plots for the LRm (top left), HRm (top right), LRp
(bottom left) and HRp (bottom right) targets in Experiment 1. Each point represents the
data of one participant.

36
Figure 6. Accuracy scatter plots for the LRm (top left), HRm (top right), LRp (bottom
left) and HRp (bottom right) targets in Experiment 1. Each point represents the data of
one participant.

37
Figure 7. Inverse efficiency scatter plots for the LRm (top left), HRm (top right), LRp
(bottom left) and HRp (bottom right) targets in Experiment 1. Each point represents the
data of one participant.

38
Figure 8. Sensitivity scatter plots for the LRm (top left), HRm (top right), LRp (bottom
left) and HRp (bottom right) targets in Experiment 1. Each point represents the data of
one participant.
measure (LRm - HRm = -0.015s; LRp - HRp = 0.013s), accuracy measure (LRm -
HRm = 6.7%; LRp - HRp = -0.3%), inverse efficiency measure (LRm - HRm = 0.032s;

39
LRp - HRp = 0.020s) and sensitivity measure (LRm - HRm = 0.471; LRp - HRp = -
0.179).
Variance. Also, as expected, for all behavioural measures of performance,
the variance was larger in the m dimension than in the p dimension (averaged over
Target Reward Value). More specifically, for the response time measure, the m
dimension had a 0.008s variance and the p dimension had a 0.002s variance. For the
accuracy measure, the m dimension had a 0.4% variance and the p dimension had a 0.1%
variance. For the inverse efficiency measure, the m dimension had a 0.012s variance and
the p dimension had a 0.002s variance. For the sensitivity measure, the m dimension had
a 0.467
Also, the larger variance found in the m dimension as compared to the p
dimension applied to both the LR and HR targets for the response time, inverse
efficiency and sensitivity measures of performance, but only for the LR target for the
accuracy measure of performance. More specifically, for the response time measure, the
LRm target had a variance of 0.008s and the LRp target had a variance of 0.002s; the
HRm target had a variance of 0.007s and the HRp target had a variance of 0.002s (see
Figure 5). For the accuracy measure, the LRm target had a variance of 0.6% and the LRp
target had a variance of 0.1%; the HRm target had a variance of 0.1% and the HRp
target had a variance of 0.1% (see Figure 6). For the inverse efficiency measure, the
LRm target had a variance of 0.014s and the LRp target had a variance of 0.002s; the
HRm target had a variance of 0.010s and the HRp target had a variance of 0.002s (see
Figure 7). For the sensitivity measure, the LRm target had a variance of 0.533 and the

40
LRp target had a variance of 0.191; the HRm target had a variance of 0.400 and the
HRp target had a variance of 0.176 (see Figure 8).
Also potentially noteworthy is that there is a difference in variance
between the LRm and HRm targets but not between the LRp and HRp targets for the
response time measure (LRm - HRm = 0.001s; LRp - HRp = 0.000s), accuracy measure
(LRm - HRm = 0.5%; LRp - HRp = 0.0%) and inverse efficiency measure (LRm -
HRm = 0.004s; LRp - HRp = 0.000s). And, that the difference in variance between the
LRm and HRm targets is larger than the difference in range between the LRp and HRp
targets for the sensitivity measure (LRm - HRm = 0.133; LRp - HRp = 0.015).
Intercorrelations between measures
Finally, it was clearly noticeable that the paired samples t-test results from
the 4 different behavioural measures are were not identical. More specifically, the
response time measure seemed not to be greatly affected by target reward manipulation in
either dimension of reward (m or p), as evidenced by it having the lowest effect sizes of
all measures in the paired samples t-tests. In contrast, the accuracy and sensitivity
measures seemed to respond to target reward manipulation the most (measures with the
highest effect sizes). Inverse efficiency was somewhere in between (moderate effect
sizes). Thus, it was deemed important to investigate the relationships among the 4
behavioural measures of performance, as they may reflect somewhat different underlying
processes.
SPSS software was used to compute Pearson product-moment correlation
coefficients among the 4 measures, separately for the m dimension of reward (see Table
B6) and the p dimension of reward (see Table B7) (see Appendix B for complete proofs).

41
As outlined bellow, similar results were obtained for both dimensions of reward, again
suggesting that reward magnitude and reward probability manipulations affected visual
search similarly.
Magnitude dimension. For the m dimension, there was a positive
correlation between the response time and inverse efficiency measures (r(8) = 0 .943, p =
0.00) and between the accuracy and sensitivity measures (r(8) = 0.712, p = 0.00).
Therefore, increases in response time were correlated with increases in inverse efficiency
(see Figure 9) and increases in accuracy were correlated with increases in sensitivity (see
Figure 10). There was a negative correlation between the inverse efficiency and
sensitivity measures (r(8) = -0.719, p = 0.00). Therefore, increases in inverse efficiency
were correlated with decreases in sensitivity (see Figure 11). No significant correlations
were found between the response time and accuracy measures (r(8) = -0.019, p = 0.95),
between the response time and sensitivity measures (r(8) = -0.494, p = 0.06), or between
the accuracy and inverse efficiency measures (r(8) = -0.244, p = 0.36).
Probability dimension. For the p dimension, there was a positive
correlation between the response time and inverse efficiency measures (r(8) = 0.855, p =
0.00) and between the accuracy and sensitivity measures (r(8) = 0.878, p = 0.00).
Therefore, increases in response time were correlated with increases in inverse efficiency
(see Figure 12) and increases in accuracy were correlated with increases in sensitivity
(see Figure 13). Also, there was a negative correlation between the inverse efficiency and
sensitivity measures (r(8) = -0.538, p = 0.03). Therefore, increases in inverse efficiency
were correlated with decreases in sensitivity (see Figure 14). No significant correlations

42
Figure 9. Significant positive correlation between the response time and inverse
efficiency measures in the magnitude component of Experiment 1, (r(8) = 0.943, p =
0.00). Each point represents the data of one participant.

43
Figure 10. Significant positive correlation between the accuracy and sensitivity measures
in the magnitude component of Experiment 1, (r(8) = 0.712, p = 0.00). Each point
represents the data of one participant.

44
Figure 11. Significant negative correlation between the inverse efficiency and sensitivity
measures in the magnitude component of Experiment 1, (r(8) = -0.719, p = 0.00). Each
point represents the data of one participant.

45
Figure 12. Significant positive correlation between the response time and inverse
efficiency measures in the probability component of Experiment 1, (r(8) = 0.855, p =
0.00). Each point represents the data of one participant.

46
Figure 13. Significant positive correlation between the accuracy and sensitivity measures
in the probability component of Experiment 1, (r(8) = 0.878, p = 0.00). Each point
represents the data of one participant.

47
Figure 14. Significant negative correlation between the inverse efficiency and sensitivity
measures in the probability component of Experiment 1, (r(8) = -0.538, p = 0.03). Each
point represents the data of one participant.

48
were found between the response time and accuracy measures (r(8) = 0.297, p = 0.26),
between the response time and sensitivity measures (r(8) = -0.060, p = 0.83), or between
the accuracy and inverse efficiency measures (r(8) = -0.241, p = 0.37).
Discussion

49
Summary of Findings
Paired samples t-tests: Magnitude and probability dimensions. The
paired samples t-tests conducted on the sensitivity (d’) measure resulted in statistical
significance for the m and p dimensions of reward. As expected, the LRm target was
responded to with significantly less sensitivity than the HRm target and the LRp target
was responded to with significantly less sensitivity than the HRp target. Thus, two
important interrelated inferences could be drawn for both dimensions of reward. First,
detection thresholds can vary according to reward contingencies. Second, perceptual (i.e.,
early) processing is slower for low-reward targets than for high-reward targets.
The paired samples t-tests conducted on the accuracy measure resulted in
statistical significance for the p dimension of reward. As expected, the LRp target was
responded to with significantly less accuracy than the HRp target. A strong trend in the
same direction was observed for the m dimension of reward. Accuracy’s close
relationship with sensitivity was demonstarted by a significant accuracy-sensitivity
correlation (discussed further in the “Intercorrelations between measures” discussion
section). Thus, accuracy, like sensitivity, is a likely reflection of perceptual (i.e., early)
processing.
In contrast, contrary to expectations and to the Kiss et al. (2009) findings,
response time was not significantly slower and inverse efficiency was not significantly
poorer for LR targets than for HR targets in both the m and p dimensions. Nonetheless,
the direction of findings was in the expected direction.
The discrepancy in the statistical significance of response time findings
between the Kiss et al. (2009) study and the current study may be due to the differences

50
in reward manipulation between the two studies. More specifically, research has shown
less movement “vigor” (i.e., slower response time) towards LR than HR targets (e.g.,
Opris et al., 2011). This effect of reward on motor (i.e., late) processing may be part of
the cause for the statistically significant slower response time for LR targets in the Kiss
et al. (2009) study (aside from the potential of slower visual perception consequently
affecting motor processing). However, the current study placed more stringent control
over conscious go-slow/go-fast motor response strategies by having every response
associated with the potential of leading to some level of reward and by making the time
limit to respond more lenient than in the Kiss et al. (2009) study. Therefore, the current
study may not have entirely masked the effect of reward on motor (i.e., late) processing,
but may have diminished it, leading to the non-significant response time results.
The discrepancy in the statistical significance of inverse efficiency
findings between the Kiss et al. (2009) study and the current study were somewhat
surprising given inverse efficiency’s correlation with the N2pc (i.e., early processing
stage) in the Kiss et al. (2009) study. The non-significant inverse efficiency findings were
also surprising given inverse efficiency’s significant correlation with sensitivity (i.e.,
early processing stage) in the current experiment (discussed further in the
“Intercorrelations between measures” discussion section). Therefore, this discrepancy,
like the discrepancy observed for response time, may be due to the differences in reward
manipulation between the two studies. This is believed to be the case because of the
response time component involved in the calculation of inverse efficiency (inverse
efficiency = response time/proportion correct). This conclusion was further supported by

51
a significant response time-inverse efficiency correlation (discussed further in the
“Intercorrelations between measures” discussion section).
Independent samples t-tests: Magnitude versus probability dimensions.
The similarity in findings between the m and p dimensions suggested that the reward
manipulations in both dimensions affected behaviour similarly. However, because there
have been no direct comparisons of reward magnitude and reward probability
manipulations on the same visual search task in the past, the data in each dimension were
more closely examined in order to determine if there were any patterns that would merit
further analysis.
Larger mean differences were observed between the LRm and HRm
targets than between the LRp and HRp targets for all behavioural measures of
performance apart from response time, where the direction of findings was opposite yet
negligible. (And, a larger effect size was obtained for accuracy in the m dimension as
compared to the p dimension.) Therefore, independent samples t-tests were conducted to
statistically compare these mean differences. However, statistical significance was not
reached, further confirming that the reward manipulations in both dimensions affected
behaviour similarly.
Range and Variance. Even though the mean differences between the
LRm and HRm targets were not significantly larger than the mean differences between
the LRp and HRp targets for accuracy, inverse efficiency and sensitivity, the larger p-
values and smaller t-scores in the m dimension remained contradictory. Thus, the
standard errors of means between the m and p dimensions were compared. Apart from
the response time measure, the standard errors of means were larger in the m than in the

52
p dimension. Therefore, a closer look at the range and variability between participant
responses was deemed necessary. This closer examination led to the conclusion that the
surprisingly larger p-values and smaller t-scores in the m dimension were due to a greater
range and variability in participant responses.
Intercorrelations between measures. Relationships among the 4
measures of performance were also assessed, independently for the m and p dimensions
and similar findings were obtained in both dimensions. Once again, this finding
confirmed that the reward manipulations in both dimensions affected behaviour similarly.
More specifically, the response time measure was positively correlated
with the inverse efficiency measure and the accuracy measure was positively correlated
with the sensitivity measure. The positive nature of both correlations was expected. More
specifically, a longer response time should be associated with a higher inverse efficiency
score because both indicate poorer performance than a faster response time and lower
inverse efficiency score. Similarly, a lower accuracy should be associated with a lower
sensitivity because both indicate poorer performance than a higher accuracy and a higher
sensitivity. Also, in general, these correlations are not surprising given that response time
and inverse efficiency led to the smallest effect sizes whereas accuracy and sensitivity led
to the largest effect sizes.
Combined with the smaller effect sizes for response time and inverse
efficiency, the correlation between these two measures may suggest that the response
time measure (an established reflection of movement vigor) and response time
component of the inverse efficiency measure are more closely, though not necessarily
exclusively, tied to the motor (i.e., late) processing stage rather than to the visual

53
perception (i.e., early) stage of information processing along the “visual perception-overt
behaviour” continuum. As previously mentioned, the current study placed even more
stringent control over conscious go-slow/go-fast motor strategies than the Kiss et al.
(2009) study, perhaps somewhat masking the effect of reward on the late stage of
processing.
Although slower visual perception (i.e., early stage of information
processing) of a target may also be reflected by a slower response time and worse inverse
efficiency, the difference in the associated covert visual processing speed between LR
and HR targets may not be large enough to be detected by the response time measure and
response time component of the inverse efficiency measure. This hypothesis is consistent
with the Kiss et al. (2009) N2pc findings. More specifically, although the Npc
(attentional selection) for LR targets appeared significantly later than the N2pc for HR
targets, the difference was a subtle one.
In contrast, combined with the larger effect sizes for accuracy and
sensitivity, the correlation between these two measures may suggest that the sensitivity
measure (an established reflection of perceptual rather than motor processing) and
accuracy measure are more closely, though not necessarily exclusively, tied to the visual
perception (i.e., early) stage rather than to the motor (i.e., late) stage of information
processing along the “visual perception-overt behaviour” continuum.
Furthermore, the anticipated negative correlation between inverse
efficiency and sensitivity was obtained. This correlation was expected given that both
inverse efficiency (shown to be correlated with the N2pc by Kiss et al., 2009) and
sensitivity are likely similar reflections of the visual perception (i.e., early) stage of

54
information processing. Also, in all other statistical analyses conducted, inverse
efficiency effect sizes were not as low as response time effect sizes (which were
moderate). Additionally, given that the calculation of both inverse efficiency and
sensitivity includes accuracy data and that accuracy was positively correlated with
sensitivity, the inverse efficiency-sensitivity correlation becomes further intuitive. The
negative nature of the inverse efficiency-sensitivity relationship was also predictable.
More specifically, a higher inverse efficiency score should be associated with a lower
sensitivity because both indicate poorer performance than a lower inverse efficiency
score and higher sensitivity.
Finally, the potential for a speed-accuracy tradeoff (i.e., sacrificing
response speed for accuracy) was reliably ruled out given that no positive correlation was
found between response time and accuracy. Furthermore, the fact that a negative
correlation between response time and accuracy was also not found corroborated the
speculation discussed earlier that the two measures might, at least in part, reflect two
different underlying stages of processing along the “visual perception-overt behaviour”
continuum (motor processing versus visual perception, respectively).
Conclusion
In summary, it was concluded that low-reward targets are visually
perceived later than are high-reward targets. Furthermore, certain behavioural measures
have a greater ability to reflect covert reward influences on the visual perception (i.e.,
early) stage of information processing as opposed to the motor (i.e., late) stage of
information processing along the “visual perception-overt behaviour” continuum. More
specifically, for both dimensions of reward (m and p), differences in feature visual

55
perception between LR and HR targets in the current experiments seem to be mostly
reflected by sensitivity and accuracy, moderately reflected by inverse efficiency (perhaps
because inverse efficiency is composed of both an early/accuracy and late/response time
component) and least reflected by response time.
Given the Kiss et al. (2009) findings showing a later N2pc and, thus,
potentially later attentional selection of LR than HR targets, the 150ms display duration
in their study and in the current study may not have provided a sufficiently large window
of time for the participant to attend to, and consequently visually perceive, the LR targets
as well as they did the HR targets. For example, this would intuitively lead to the
significantly poorer sensitivity obtained for LR than HR targets in the current study. In
order to further investigate this possibility, display duration was manipulated across
visual search trials in Experiment 3. The rationale behind this manipulation was that
shortening the display duration would be more detrimental to behavioural measures of
feature visual perception (i.e., early processing) for low-reward targets than for high-
reward targets, further suggesting that low-reward targets are visually perceived later than
are high-reward targets. More specifically, behavioural measures of accuracy, inverse
efficiency and sensitivity (and, perhaps to a lesser extent, response time) were expected
to reflect poorer performance for LR targets than for HR targets.
However, prior to further investigating this early stage of visual processing,
it was deemed important to assess the cause of the non-significant subtle differences
between the m and p dimensions in order to allow an informed comparison of results
between dimensions in the subsequent experiments. The non-significant larger
differences between LRm and HRm targets than between LRp and HRp targets
56
(opposite but negligible for response time) may imply that the subjective difference in
reward value between the former was larger than between the latter. Research has shown
that decreasing the probability of a reward of a given magnitude also decreases its
subjective value (e.g., Myerson & Green, 1995). The HR targets in the m ($10) and p
(100% for $10) dimensions had an equivalent subjective value ($10) because their
magnitude was identical and neither was probabilistic. In contrast, although the
subjective value of the LRm target was known ($1) because it was not probabilistic, it
was not possible to conclude that it was or wasn’t equivalent to the probabilistic
subjective value of the LRp target (10% chance for $10). In light of the non-significant
trend for larger differences between LRm and HRm means than between LRp and HRp
means, it was assumed that the subjective value of the LRm target was somewhat lower
than that of the LRp target. Although not significant, the lower accuracy, inverse
efficiency and sensitivity in the m dimension was also consistent with the combined
subjective value of the HR and LR targets in the m dimension being less than that in the
p dimension. In order to address this speculation empirically, a simple discounting
procedure was conducted in Experiment 2.
Experiment 2

57
Empirically determining the subjective reward value of the LRp target
The purpose of Experiment 2 was to empirically determine the subjective
reward value of the LRp target in Experiment 1. Although not significant, there were
larger mean differences in most behavioural measures of performance between the LR
and HR targets in the m dimension than in the p dimension. Therefore, the subjective
difference in reward value between LR and HR targets in the m dimension may have
been larger than the subjective difference in reward value between LR and HR targets in
the p dimension. More specifically, it was expected that the LRm target ($1) had a lower
subjective value than the LRp target ($10 with a 10% chance). Although not significant,
the overall worse behavioural performance in the m dimension was also consistent with
the combined subjective value of the LR and HR targets being less in the m dimension
(LRm + HRm = $1 + $10 = $11) than in the p dimension (LRp + HRp = >$1 + $10 =
>$11).
Methodology

58
Participant sample
The 12 female and 4 male (mean age = 23) participants from Experiment 1
were contacted approximately 3 months after having completed the visual experiment.
They were treated in accordance with the guidelines set by the “Concordia University
Human Research Ethics Committee”.
Task and procedure
All participants gave informed consent prior to the onset of testing (see
Appendix A) and were debriefed as to the rationale of the study following completion of
testing. The total length of the lab visit for each participant was approximately 15
minutes.
Testing for each participant consisted of completing a simple paper-based
probability-discounting questionnaire, adapted from the procedures of Myerson & Green
(1995; see Appendix C). The questionnaire was divided into 2 parts, each composed of a
series of 10 questions. On each question, the participants were asked to circle their choice
between a low-magnitude certain reward and a high-magnitude probabilistic reward. The
first question in PART 1 of the questionnaire contained a choice between “$1 for sure”
and “$10 with a 10% chance” (note: the second option corresponds to the value of the
LRp target in Experiment 1). Assuming that the participant chose the probabilistic
reward (e.g., “$10 with a 10% chance”), he/she moved on to the second question, where
the magnitude of the certain reward was raised to $2, and was asked to choose again. The
procedure continued until the point at which the participant switched over to the certain
reward (e.g., Question 5: selecting “$5 for sure” when asked to chose between “$5 for
sure” or “$10 with a 10% chance”).

59
The procedure was repeated in reverse order in PART 2 of the
questionnaire, in an attempt to control for order effects. This time, the first question
contained a choice between a certain reward equal in magnitude to the probabilistic one
(e.g., “$10 for sure” or “$10 with a 10% chance”). Assuming the participant chose the
certain reward, he/she moved on to the second question, where the magnitude of the
certain reward was decreased to $9, and was asked to choose again. The procedure
continued until the point at which the participant switched over to the probabilistic
reward (e.g., Question 7: selecting “$10 with a 10% chance” when asked to chose
between “$4 for sure” or “$10 with a 10% chance”).
Reward manipulation
The participant was told that one of the questions responded-to in PART 1
or PART 2 of the questionnaire would be randomly chosen at the end of the experiment,
using a random number generator. And, that he/she would receive the associated certain
reward or have a 10% chance of receiving the associated probabilistic reward, depending
on the choice he/she had made on that question. The reason for employing this particular
reward strategy, as compared to a strategy where reward outcomes were determined
following each individual question, was three-fold. First, it kept the budget of the
experiment within a reasonable limit. Second, it prevented the participant from
purposefully choosing the certain reward throughout the questionnaire without it being a
true reflection of preference, because doing so would earn him/her $110. Third, since
there was no reward outcome for each individual choice, reward outcome did not
influence the subsequent choice(s). This was important to control for because it was also
controlled for in the visual experiment.

60
Results

61
For each participant, the magnitude of the certain reward was noted at the
points when the switch in PART 1 (e.g., $5) and the switch in PART 2 (e.g., $4) of the
questionnaire occurred. The average of these two points was computed (e.g., ($4+ $5)/2 =
$4.50) in order to determine each participant’s point of indifference (Myerson & Green,
1995). The point of indifference is considered to reflect the subjective value of the
probabilistic reward (i.e., the subjective value of the LRp target in Experiment 1). SPSS
software (v.19) was then used to conduct a 1-way ANOVA, comparing the subjective
values of the LRm, LRp, and HRm/HRp targets (see Appendix B for complete proofs).
As seen in Figure 15, a significant main effect of Target was obtained, F(2,
45) = 3171.712, p < 0.001 (see Table B8). Bonferroni pairwise comparisons were also
conducted (see Table B9). As expected, the subjective value of the LRm target (M =
$1.00, SE = $0.00) was significantly lower than the subjective value of the LRp target (M
= $5.09, SE = $0.14), p < 0.001. Also, the subjective value of both the LRm (p < 0.001)
and LRp (p < 0.001) targets was significantly lower than the subjective value of the
HRm/HRp targets (M = $10.00, SE = $0.00).

62
Figure 15. Mean subjective reward value for the LRm ($1.00), LRp ($5.09) and
HRm/HRp ($10.00) targets in Experiment 1.
Discussion

63
Summary of findings
The results from this experiment empirically confirmed that, in
Experiment 1, the subjective reward value of the LRp target ($5.09) was indeed higher
than the subjective reward value of the LRm ($1.00) target. Therefore, the difference in
subjective reward value between the LRm and HRm targets ($1.00 - $10.00 = -$9.00)
was larger than the difference in subjective reward value between the LRp and HRp
targets ($5.09 - $10.00 = -$4.91). This finding is in accord with the subtly larger, yet non-
significant, differences in accuracy, inverse efficiency and sensitivity detected in
Experiment 1 between the LRm and HRm targets than between the LRp and HRp
targets. Importantly, however, the discounting procedure showed a significant difference
in subjective reward value between the LR and HR targets in both the m and p
dimensions. This occurred despite the fact that the subjective reward value of the LRp
target was considerably closer to that of the HRp target than was the subjective reward
value of the LRm target to that of the HRm target. This explains the fact that a similar
pattern of findings was observed between both dimensions in Experiment 1. In addition,
the lower combined subjective reward value of the LR and HR targets in the m
dimension ($1.00 + $10.00 = $11.00) as compared to the p dimension ($5.09 + $10.00 =
$15.09) is consistent with the subtle, yet non-significant, generally worse behavioural
performance in the m dimension than in the p dimension reported in Experiment 1.
More specifically, the p dimension component of this finding is in accord
with the significant paired samples t-test differences in accuracy and sensitivity measures
found between LRp and HRp targets in Experiment 1 (i.e., lower accuracy and lower

64
sensitivity for LRp targets than HRp targets). It is also in accord with the non-significant
trend for inverse efficiency to be worse for LRp than HRp targets.
Similarly, the m dimension component of this finding is in accord with the
significant paired samples t-test differences in the sensitivity measure found between
LRm and HRm targets in Experiment 1 (i.e., lower sensitivity for LRm targets than
HRm targets). It is also in accord with the non-significant trend for accuracy and inverse
efficiency to be worse for LRm than HRm targets. The later is further in accord with the
subtle, yet non-significant, larger differences in accuracy and inverse efficiency found
between LR and HR targets in the m dimension having simply been masked by higher
variability between participant responses, given the contradictory weaker statistical
findings in the m dimension than in the p dimension. This higher variability between
participant responses in the m dimension is assumed to be the result of the larger
differences in subjective value. However, this conclusion remains speculative.
Conclusion
In summary, the subjective reward value of the LRm target in Experiment
1 was shown to be higher than that of the LRp target. And, thus, the difference in
subjective reward value between the LRm and HRm targets was larger than that between
the LRp and HRp targets. In turn, this may have led to the somewhat discrepant findings
between the m and p dimensions. By the same token, this discrepancy suggested that
some caution must be exercised when comparing results between the m and p dimensions
in Experiment 3 as well. Nonetheless, because a significant difference in subjective
reward value between the LR and HR targets was found in both the m and p dimensions,
the target reward values used in Experiment 1 were maintained in Experiment 3.

65
An important cautionary note must nonetheless be made in terms of
determining the subjective reward value of visual targets. To date, discounting
procedures have been used to determine the subjective value of probabilistic monetary
rewards using explicit choices only (e.g. Myerson & Green, 1995). For instance, “Do you
prefer $1 for sure or $10 with a 10% chance?”. No attempt has been made to
subsequently determine the subjective reward value of visual targets using these explicit
discounting results. Determining how reliable the translation from explicit choice to
visual perception is would require a much longer and more elaborate procedure than that
encompassed by the current experimental protocol. This procedure would include several
different magnitudes of the probabilistic reward to allow the plotting of a discounting
curve that would afterward be compared to the hyperbolic discounting curve in an
explicit choice experiment. Given this would exceed the scope of the current thesis, the
goal of the current experiment was simply to provide an estimate of a visual target’s
subjective reward value in order to aid in the interpretation of findings.

66
Experiment 3
Further behavioural assessment of monetary reward magnitude and monetary
reward probability influences on feature visual perception
The purpose of Experiment 3 was to provide a further behavioural
assessment than Experiment 1 of reward influences on the visual perception (i.e, early)
stage of information processing along the “visual perception-overt behaviour” continuum.
The Kiss et al. (2009) N2pc findings demonstrated that LR targets are selected for
attention later than are HR targets. Coupled with the independently documented effects
of attention on feature visual perception, these findings suggest that LR targets are
visually perceived later than HR targets. In line with this reasoning, the 150ms display
duration in the Kiss et al. (2009) study and in Experiment 1 of the current study may not
have provided a sufficiently large window of time for the participant to visually perceive
the LR targets as well as the HR targets. This possibly led to the significantly poorer
sensitivity and tendency for poorer accuracy and inverse efficiency for LR than HR
targets in the m dimension and to the significantly poorer accuracy and sensitivity and
tendency for poorer inverse efficiency for LR than HR targets in the p dimension,
obtained in Experiment 1.
The same paradigm used in Experiment 1 was used in the current
experiment, except that display duration was manipulated in the current experiment. The
rationale behind this manipulation was that shortening the display duration from 150ms
(9 frames) to 33.33ms (2 frames) would be more detrimental to accuracy, inverse
efficiency and sensitivity (and, perhaps to a lesser extent, to response time) for LR targets
than for HR targets if, in fact, LR targets are visually perceived later than are HR targets.

67
If, in contrast, LR and HR targets differ only in terms of their associated motor
processing speed (i.e., movement vigor), no differences should be observed between LR
and HR targets on these 3 behavioural measures of performance. This alternative would,
however, produce more pronounced differences in response time.
Importantly, since Experiment 1 showed somewhat discrepant findings
between the m and p dimensions, and since Experiment 2 demonstrated that these
discrepancies may be due to larger differences in subjective reward value between the
LR and HR targets in the m dimension than in the p dimension, Experiment 3 was
divided into 2 subcategories: Experiment 3A (Magnitude Dimension) and Experiment 3B
(Probability Dimension). For both reward dimensions, the same pattern of findings was
expected. However, assuming equal variances in the m and p dimensions, the possibility
that the findings in the m dimension would be more pronounced than those in the p
dimension was acknowledged, due to the larger difference in subjective reward value
between the LR and HR targets in the m dimension than in the p dimension.

68
Experiment 3A: Reward Magnitude Dimension
In the magnitude component of Experiment 3, it was expected that target
identification response times would be slower, error rates would be higher, inverse
efficiency would be poorer and sensitivity would be lower for Low-Reward-Magnitude
targets (LRm) than for High-Reward-Magnitude targets (HRm) and for 33.33ms display
durations than for 150ms display durations. It was also expected that the effect of
decreasing display duration would be more detrimental to target identification
performance for the LRm target than for the HRm target, suggesting that the LRm target
requires a longer processing time to be visually perceived than the HRm target. Based on
the findings in Experiment 1, the accuracy, inverse efficiency and sensitivity measures
were expected to show stronger statistical findings than the response time measure.
Significant findings for accuracy, inverse efficiency and sensitivity in the presence or
absence of significant findings in response time would suggest reward influences on the
visual perception (i.e., early) stage of information processing along the “visual
perception-overt behaviour” continuum. However, significant differences in response
time in the absence of differences in accuracy, inverse efficiency and sensitivity would
suggest a lack of reward influences on the visual perception (i.e., early) stage and
evidence for differences in the motor (i.e., late) stage of information processing along the
“visual perception-overt behaviour” continuum.

69
Methodology
Participant sample
Participants in this experiment consisted of 5 female and 3 male (mean age
= 23) Concordia University undergraduate psychology students with self-reported normal
vision, drawn from the Psychology Department’s Participant Pool. They were treated in
accordance with the guidelines set by the “Concordia University Human Research Ethics
Committee”.
Apparatus and laboratory space
The apparatus and laboratory space used in this experiment were the same
as those used in Experiment 1.
Stimuli
The stimuli used in this experiment were the same as those used in
Experiment 1.
Procedure
Testing for each participant consisted of 2 blocks of 360 trials, in which a
covert visual search was performed to identify the position (top or bottom) of the notch
on the red or green target diamond among the grey distractor diamonds. The total length
of testing for each participant was approximately 90 minutes, with a short break between
the two sessions. All participants gave informed consent prior to the onset of their first
testing block (see Appendix A) and were debriefed as to the rationale of study following
completion of their last testing block.
To initiate each trial, the participant pressed the space bar (see Figure 16).
Once the space bar was pressed, the fixation dot was presented for 1.5s. When

70
(150ms = 9 frames) or
(33.33ms = 2 frames)
Time
Response
0s 1.500s (1.533 or 3.000s
1.650 )
Fixation onset Stimulus onset Mask onset Beep
(following space (end of trial)
bar press)
Figure 16. Sample stimulus and trial sequence used in Experiment 3 and 4.

71
the 1.5s had elapsed, the stimulus array also appeared on the screen and remained there
for 150ms or 33.33ms, both of which were too brief for the participant to make saccades.
Prior to the onset of testing, the participant was explicitly instructed to maintain fixation
on the central fixation dot at all times. The participant was also informed that there was
an equal likelihood of either the red or green target appearing in any position within the
stimulus array on each trial. The stimulus array was masked by the static noise pattern
following its 150ms or 33.33ms presentation.
The participant reported whether the target stimulus had a notch at the top
or bottom, using the up and down keys on the computer keyboard, as quickly and as
accurately as possible. The participant was aware that the response had to be made before
a beep sounded 3s following fixation onset, which indicated trial termination.
Reward manipulation
The target reward magnitude manipulation used was the same as that used
in the magnitude component of Experiment 1.

72
Results
The raw data generated by each participant were automatically exported
from VPixx (v.2.32) to Excel (v.12.3.0). Excel was used to summarize each participant’s
raw data into “LRm target in 150ms display”, “LRm target in 33.33ms display”, “HRm
target in 150ms display”and “HRm target in 33.33ms display” means for the response
time, accuracy, inverse efficiency and sensitivity (d’) behavioural measures. This resulted
in a total of 16 means.
Repeated Measures ANOVAs
SPSS software (v.19) was used to conduct a separate 2 x 2 repeated
measures analysis of variance on the response time, accuracy, inverse efficiency and
sensitivity (d’) behavioural measures (see Appendix B for complete proofs). For each of
the 4 analyses, Target Reward Value had 2 levels (LRm, HRm) and Display Duration
had 2 levels (150ms, 33.33ms ).
Significant interactions between Target Reward Magnitude and Display
Duration were expected for all behavioural measures predominantly reflecting early
processing, as suggested by the findings from Experiment 1 (i.e., for accuracy, inverse
efficiency and sensitivity; not for response time). These interactions were expected to
show larger mean differences between display durations for the LRm target than for the
HRm target, suggesting that the LRm target requires a longer processing time to be
visually perceived than the HRm target.
Response time. The 2 x 2 repeated measures ANOVA conducted on the
response time data resulted in a non-significant main effect of Target Reward Magnitude,
F(1, 7) = 5.123, p = 0.06, 2 = 0.42, a significant main effect of Display Duration, F(1, 7)

73
= 14.619, p = 0.01, 2 = 0.68, and a non-significant interaction between Target Reward
Magnitude and Display Duration, F(1, 7) = 0.001, p = 0.97, 2 = 0.00 (see Table B10).
The non-significant main effect of Target Reward Magnitude showed that,
regardless of the display duration manipulation (150ms versus 33.33ms), the mean
response time for the LRm target (M = 0.439s, SE = 0.010s) did not differ significantly
from the mean response time for the HRm target (M = 0.422s, SE = 0.006s).
The significant main effect of Display Duration showed that, regardless of
the target reward magnitude manipulation (LRm versus HRm), the mean response time
for the 150ms display duration (M = 0.407s, SE = 0.005s) was significantly faster than
the mean response time for the 33.33ms display duration (M = 0.455s, SE = 0.013s) (see
Figure 17).
As expected, the non-significant interaction between Target Reward
Magnitude and Display Duration showed that the mean difference in response time
between the 150ms display duration and 33.33ms display duration for the LRm target (M
= 0.225s, SE = 0.030s) was not larger than the mean difference in response time between
the 150ms and 33.33ms display duration for the HRm target (M = 0.096s, SE = 0.030s).
Accuracy (% correct). The 2 x 2 repeated measures ANOVA conducted
on the accuracy data resulted in a significant main effect of Target Reward Magnitude,
F(1, 7) = 11.092, p = 0.01, 2 = 0.61, a significant main effect of Display Duration, F(1,
7) = 64.582, p = 0.00, 2 = 0.90, and a significant interaction between Target Reward
Magnitude and Display Duration, F(1, 7) = 8.052, p = 0.03, 2 = 0.54 (see Table B11).
The significant main effect of Target Reward Magnitude showed that,
regardless of the display duration manipulation (150ms versus 33.33ms), the mean

74
Figure 17. Mean response time (+SE) for the significant main effect of Display Duration
in Experiment 3A, p = 0.01.

75
accuracy for the LRm target (M = 83.6%, SE = 0.9%) was significantly lower than the
mean accuracy for the HRm target (M = 90.1%, SE = 1.5%).
The significant main effect of Display Duration showed that, regardless of
the target reward magnitude manipulation (LRm versus HRm), the mean accuracy for
the 150ms display duration (M = 94.9%, SE = 0.8%) was significantly higher than the
mean accuracy for the 33.33ms display duration (M = 78.8%, SE = 1.6%).
As expected, the significant interaction between Target Reward Magnitude
and Display Duration showed that the mean difference in accuracy between the 150ms
display duration and 33.33ms display duration for the LRm target (M = 0.225%, SE =
0.030%) was larger than the mean difference in accuracy between the 150ms and
33.33ms display duration for the HRm target (M = 0.096%, SE = 0.030%) (see Figure 18
and Table B12).
Inverse efficiency. The 2 x 2 repeated measures ANOVA conducted on
the inverse efficiency data resulted in a significant main effect of Target Reward
Magnitude, F(1, 7) = 13.970, p = 0.01, 2 = 0.67, a significant main effect of Display
Duration, F(1, 7) = 59.023, p = 0.00, 2 = 0.89, and a significant interaction between
Target Reward Magnitude and Display Duration, F(1, 7) = 5.417, p = 0.05, 2 = 0.44
(see Table B13).
The significant main effect of Target Reward Magnitude showed that,
regardless of the display duration manipulation (150ms versus 33.33ms), the mean
inverse efficiency for the LRm target (M = 0.541s, SE = 0.016s) was significantly worse
than the mean inverse efficiency for the HRm target (M = 0.474s, SE = 0.007s).

76
Figure 18. Mean accuracy (+SE) for the significant Target Reward Magnitude x Display
Duration interaction in Experiment 3A, p = 0.03.

77
The significant main effect of Display Duration showed that, regardless of
the target reward magnitude manipulation (LRm versus HRm), the mean inverse
efficiency for the 150ms display duration (M = 0.429s, SE = 0.007s) was significantly
better than the mean inverse efficiency for the 33.33ms display duration (M = 0.585s, SE
= 0.017s).
As expected, the significant interaction between Target Reward Magnitude
and Display Duration showed that the mean difference in inverse efficiency between the
150ms and 33.33ms display durations for the LRm target (M = -0.205s, SE = 0.034s)
was larger than the mean difference in inverse efficiency between the 150ms and
33.33ms display durations for the HRm target (M = -0.107s, SE = 0.024s) (see Figure 19
and Table B14).
Sensitivity (d’). The 2 x 2 repeated measures ANOVA conducted on the
sensitivity data resulted in a significant main effect of Target Reward Magnitude, F(1, 7)
= 5.424, p = 0.05, 2 = 0.44, a significant main effect of Display Duration, F(1, 7) =
8.836, p = 0.02, 2 = 0.56, and a significant interaction between Target Reward
Magnitude and Display Duration, F(1, 7) = 8.732, p = 0.02, 2 = 0.56 (see Table B15).
The significant main effect of Target Reward Magnitude showed that,
regardless of the display duration manipulation (150ms versus 33.33ms), the mean
sensitivity for the LRm target (M = 1.733, SE = 0.054) was significantly lower than the
mean sensitivity for the HRm target (M = 2.298, SE = 0.217).
The significant main effect of Display Duration showed that, regardless of
the target reward magnitude manipulation (LRm versus HRm), the mean sensitivity for

78
Figure 19. Mean inverse efficiency (+SE) for the significant Target Reward Magnitude x
Display Duration interaction in Experiment 3A, p = 0.05.

79
the 150ms display duration (M = 2.451, SE = 0.117) was significantly higher than the
mean sensitivity for the 33.33ms display duration (M = 1.579, SE = 0.223).
As expected, the significant interaction between Target Reward Magnitude
and Display Duration showed that the mean difference in sensitivity
between the 150ms and 33.33ms display duration for the LRm target (M = 0.992, SE =
0.291) was larger than the mean difference in sensitivity between the 150ms and 33.33ms
display duration for the HRm target (M = 0.750, SE = 0.301) (see Figure 20 and Table
B16).
ANOVA summary. As reported in the repeated measures ANOVAs
section above, significant interactions between Target Reward Magnitude and Display
Duration were obtained for all behavioural measures predominantly reflecting early
processing, as suggested by the findings from Experiment 1 (i.e., for accuracy, inverse
efficiency and sensitivity; not for response time). As expected, these interactions showed
larger mean differences between display durations for the LRm target than for the HRm
target, suggesting that the LRm target requires a longer processing time to be visually
perceived than the HRm target.

80
Figure 20. Mean sensitivity (+SE) for the significant Target Reward Magnitude x Display
Duration interaction in Experiment 3A, p = 0.02.

81
Experiment 3B: Reward Probability Dimension
In the probability component of Experiment 3, as in the magnitude
component of Experiment 3, it was expected that target identification response times
would be slower, error rates would be higher, inverse efficiency would be poorer and
sensitivity would be lower for Low-Reward-Probability targets (LRp) than for High-
Reward-Probability targets (HRp) and for 33.33ms display durations than for 150ms
display durations. It was also expected that the effect of decreasing display duration
would be more detrimental to target identification performance for the LRp target than
for the HRp target, suggesting that the LRp target requires a longer processing time to be
visually perceived than the HRp target. Based on the findings in Experiment 1 and 3A,
the accuracy, inverse efficiency and sensitivity measures were expected to show stronger
statistical findings than the response time measure. Significant findings for accuracy,
inverse efficiency and sensitivity in the presence or absence of significant findings in
response time would suggest reward influences on the visual perception (i.e., early) stage
of information processing along the “visual perception-overt behaviour” continuum.
However, significant differences in response time in the absence of differences in
accuracy, inverse efficiency and sensitivity would suggest a lack of reward influences on
the visual perception (i.e., early) stage and evidence for differences in the motor (i.e.,
late) stage of information processing along the “visual perception-overt behaviour”
continuum. Given the smaller subjective difference between the LR and HR targets in
the p dimension than in the m dimension, as reported in Experiment 2, the strength of
statistical findings was expected to be weaker in Experiment 3B (p dimension) than in
Experiment 3A (m dimension).

82
Methodology
Participant sample
Participants in this experiment consisted of 6 female and 2 male (mean age
= 26) Concordia University undergraduate psychology students with self-reported normal
vision, drawn from the Psychology Department’s Participant Pool. They were treated in
accordance with the guidelines set by the “Concordia University Human Research Ethics
Committee”.
Apparatus and laboratory space
The apparatus and laboratory space used in this experiment were the same
as those used in Experiment 1 and 3A.
Stimuli
The stimuli used in this experiment were the same as those used in
Experiment 1 and 3A.
Procedure
The procedure used in this experiment was the same as that used in
Experiment 3A.
Reward manipulation
The target reward probability manipulation used was the same as that used
in the probability component of Experiment 1.

83
Results
The raw data generated by each participant were automatically exported
from VPixx (v.2.32) to Excel (v.12.3.0). Excel was used to summarize each participant’s
raw data into “LRp target in 150ms display”, “LRp target in 33.33ms display”, “HRp
target in 150ms display”and “HRp target in 33.33ms display” means for the response
time, accuracy, inverse efficiency and sensitivity (d’) behavioural measures. This resulted
in a total of 16 means.
Repeated Measures ANOVAs
SPSS software (v.19) was used to conduct a separate 2 x 2 repeated
measures analysis of variance on the response time, accuracy, inverse efficiency and
sensitivity (d’) behavioural measures (see Appendix B for complete proofs). For each of
the 4 analyses, Target Reward Value had 2 levels (LRp, HRp) and Display Duration had
2 levels (150ms, 33.33ms ).
As in Experiment 3A, significant interactions between Target Reward
Magnitude and Display Duration were expected for all behavioural measures
predominantly reflecting early processing, as suggested by the findings from Experiment
1 (i.e., for accuracy, inverse efficiency and sensitivity; not for response time). These
interactions were expected to show larger mean differences between display durations for
the LRp target than for the HRp target, suggesting that the LRp target requires a longer
processing time to be visually perceived than the HRp target. However, given the smaller
subjective difference between the LR and HR targets in the p dimension than in the m
dimension, as reported in Experiment 2, the strength of statistical findings was expected
to be weaker here (p dimension) than in Experiment 3A (m dimension).

84
Response time. The 2 x 2 repeated measures ANOVA conducted on the
response time data resulted in a non-significant main effect of Target Reward Probability,
F(1, 7) = 2.620, p = 0.15, 2 = 0.27, a significant main effect of Display Duration, F(1, 7)
= 10.377, p = 0.02, 2 = 0.60, and a non-significant interaction between Target Reward
Probability and Display Duration, F(1, 7) = 0.065, p = 0.81, 2 = 0.01 (see Table B17).
The non-significant main effect of Target Reward Probability showed that,
regardless of the display duration manipulation (150ms versus 33.33ms), the mean
response time for the LRp target (M = 0.441s, SE = 0.009s) did not differ significantly
from the mean response time for the HRp target (M = 0.428s, SE = 0.007s).
The significant main effect of Display Duration showed that, regardless of
the target reward probability manipulation (LRp versus HRp), the mean response time
for the 150ms display duration (M = 0.413s, SE = 0.005s) was significantly faster than
the mean response time for the 33.33ms display duration (M = 0.456s, SE = 0.013s) (see
Figure 21).
As expected, the non-significant interaction between Target Reward
Probability and Display Duration showed that the mean difference in response time
between the 150ms display duration and 33.33ms display duration for the LRp target (M
= -0.046s, SE = 0.021s) was not larger (or smaller) than the mean difference in response
time between the 150ms and 33.33ms display duration for the HRp target (M = -0.040s,
SE = 0.013s).

85
Figure 21. Mean response time (+SE) for the significant main effect of Display Duration
in Experiment 3B, p = 0.02.

86
Accuracy (% correct). The 2 x 2 repeated measures ANOVA conducted
on the accuracy data resulted in a non-significant main effect of Target Reward
Probability, F(1, 7) = 4.125, p = 0.08, 2 = 0.37, a significant main effect of Display
Duration, F(1, 7) = 82.867, p = 0.00, 2 = 0.92, and a non-significant interaction between
Target Reward Probability and Display Duration, F(1, 7) = 3.736, p = 0.10, 2 = 0.35
(see Table B18).
The non-significant main effect of Target Reward Probability showed that,
regardless of the display duration manipulation (150ms versus 33.33ms), the mean
accuracy for the LRp target (M = 84.7%, SE = 1.2%) did not differ significantly from the
mean accuracy for the HRp target (M = 89.1%, SE = 1.3%), although it was marginally
worse for the LRp target.
The significant main effect of Display Duration showed that, regardless of
the target reward probability manipulation (LRp versus HRp), the mean accuracy for the
150ms display duration (M = 94.9%, SE = 0.8%) was significantly better than the mean
accuracy for the 33.33ms display duration (M = 78.9%, SE = 1.3%) (see Figure 22).
Contrary to expectations, the non-significant interaction between Target
Reward Probability and Display Duration showed that the mean difference in accuracy
between the 150ms display duration and 33.33ms display duration for the LRp target (M
= 0.204%, SE = 0.030%) was not larger (or smaller) than the mean difference in accuracy
between the 150ms and 33.33ms display duration for the HRp target (M = 0.116%, SE =
0.027%).

87
Figure 22. Mean accuracy (+SE) for the significant main effect of Display Duration in
Experiment 3B, p = 0.00.

88
Inverse efficiency. The 2 x 2 repeated measures ANOVA conducted on
the inverse efficiency data resulted in a significant main effect of Target Reward
Probability, F(1, 7) = 9.926, p = 0.02, 2 = 0.59, a significant main effect of Display
Duration, F(1, 7) = 40.459, p = 0.00, 2 = 0.85, and a non-significant interaction between
Target Reward Probability and Display Duration, F(1, 7) = 3.105, p = 0.12, 2 = 0.31
(see Table B19).
The significant main effect of Target Reward Probability showed that,
regardless of the display duration manipulation (150ms versus 33.33ms), the mean
inverse efficiency for the LRp target (M = 0.534s, SE = 0.015s) was significantly worse
than the mean inverse efficiency for the HRp target (M = 0.485s, SE = 0.008s) (see
Figure 23).
The significant main effect of Display Duration showed that, regardless of
the target reward probability manipulation (LRp versus HRp), the mean inverse
efficiency for the 150ms display duration (M = 0.436s, SE = 0.006s) was significantly
better than the mean inverse efficiency for the 33.33ms display duration (M = 0.584s, SE
= 0.020s) (see Figure 24).
Contrary to expectations, the non-significant interaction between Target
Reward Probability and Display Duration showed that the mean difference in inverse
efficiency between the 150ms and 33.33ms display durations for the LRp target (M = -
0.186s, SE = 0.039s) was not larger (or smaller) than the mean difference in inverse
efficiency between the 150ms and 33.33ms display durations for the HRp target (M = -
0.110s, SE = 0.022s).

89
Figure 23. Mean inverse efficiency (+SE) for the significant main effect of Target
Reward Probability in Experiment 3B, p = 0.02.

90
Figure 24. Mean inverse efficiency (+SE) for the significant main effect of Display
Duration in Experiment 3B, p = 0.00.

91
Sensitivity (d’). The 2 x 2 repeated measures ANOVA conducted on the
sensitivity data resulted in a non-significant main effect of Target Reward Probability,
F(1, 7) = 2.316, p = 0.17, 2 = 0.25, a significant main effect of Display Duration, F(1, 7)
= 6.725., p = 0.04, 2 = 0.49, and a non-significant interaction between Target Reward
Probability and Display Duration, F(1, 7) = 0.023, p = 0.88, 2 = 0.00 (see Table B20).
The non-significant main effect of Target Reward Probability showed that,
regardless of the display duration manipulation (150ms versus 33.33ms), the mean
sensitivity for the LRp target (M = 1.956, SE = 0.096) did not differ significantly from
the mean sensitivity for the HRp target (M = 2.313, SE = 0.211), although it was
marginally lower for the LRp target.
The significant main effect of Display Duration showed that, regardless of
the target reward probability manipulation (LRp versus HRp), the mean sensitivity for
the 150ms display duration (M = 2.501, SE = 0.117) was significantly better than the
mean sensitivity for the 33.33ms display duration (M = 1.768, SE = 0.229) (see Figure
25).
Contrary to expectations, the non-significant interaction between Target
Reward Probability and Display Duration showed that the mean difference in sensitivity
between the 150ms and 33.33ms display duration for the LRp target (M = 0.745, SE =
0.296) was not larger (or smaller) than the mean difference in sensitivity between the
150ms and 33.33ms display duration for the HRp target (M = 0.720, SE = 0.293).

92
Figure 25. Mean sensitivity (+SE) for the significant main effect of Display Duration in
Experiment 3B, p = 0.04.

93
ANOVA summary. As reported in the repeated measures ANOVAs
section above, contrary to Experiment 3A (m dimension) significant interactions between
Target Reward Magnitude and Display Duration were not obtained in this experiment (p
dimension) for any of the behavioural measures predominantly reflecting early
processing, as suggested by the findings from Experiment 1 (i.e., for accuracy, inverse
efficiency and sensitivity; not for response time). However the non-significant findings
were in the expected direction: non-significant larger mean differences between display
durations for the LRp target than for the HRp target. Given the smaller subjective
difference between the LR and HR targets in the p dimension than in the m dimension,
as reported in Experiment 2, the strength of statistical findings was expected to be weaker
here (p dimension) than in Experiment 3A (m dimension). Therefore, the non-significant
findings may still suggest that the LRp target requires a longer processing time to be
visually perceived than the HRp target.
Independent samples t-tests (Experiments 3A and 3B)
As evidenced by the repeated measures ANOVAs conducted in
Experiments 3A (m dimension) and 3B (p dimension), there were some inconsistencies
between the m and p dimensions of reward. More specifically, as expected, although a
similar pattern of findings emerged in both dimensions, stronger statistical findings were
found in the m dimension than in the p dimension. These observed inconsistencies were
speculated to be due to a larger subjective difference between the LR and HR target in
the m dimension than in the p dimension, as suggested by Experiment 2. Statistical
comparisons were conducted to confirm the observation that the mean difference for all

94
behavioural measures of performance was larger between the LRm and HRm targets
than between the LRp and HRp targets.
SPSS software (v.19) was used to conduct a series of independent samples
t-tests, comparing the m dimension mean difference between LR and HR targets to the p
dimension mean difference between LR and HR targets. A separate t-test was conducted
for each behavioural measure of performance (see Appendix B for complete proofs).
Response time. The mean difference in response time between LR and
HR targets in the m dimension (M = 0.017s, SE = 0.007s) did not differ significantly
from the mean difference in response time between LR and HR targets in the p
dimension (M = 0.012, SE = 0.008), t(14) = 0.579, p = 0.58, g = .20 (see Table B21).
Accuracy (% correct). As seen in Figure 26, the mean difference in
accuracy between LR and HR targets in the m dimension (M = -6.4%, SE = 1.9%) was
significantly larger than the mean difference in accuracy between LR and HR targets in
the p dimension (M = -4.4%, SE = 2.2%), t(14) = -3.433, p = 0.01, g = .34 (see Table
B21).
Inverse efficiency. As seen in Figure 27, the mean difference in inverse
efficiency between LR and HR targets in the m dimension (M = 0.068s, SE = 0.018s)
was significantly larger than the mean difference in inverse efficiency between LR and
HR targets in the p dimension (M = 0.049s, SE = 0.015s), t(14) = 2.673, p = 0.03, g = .37
(see Table B21).
Sensitivity (d’). As seen in Figure 28, the mean difference in sensitivity
between LR and HR targets in the m dimension (M = -0.565, SE = 0.243) was
marginally significantly larger than the mean difference in sensitivity between LR and

95
Figure 26. Mean difference (+SE) in accuracy between the HR and LR target in the m
and p dimension, in Experiment 3, p = 0.01.

96
Figure 27. Mean difference (+SE) in inverse efficiency between the HR and LR target in
the m and p dimension, in Experiment 3, p = 0.03.

97
Figure 28. Mean difference (+SE) in sensitivity between the HR and LR target in the m
and p dimension, in Experiment 3, p = 0.05.

98
HR targets in the p dimension (M = -0.356, SE = 0.234), t(14) = -2.294, p = 0.05, g = .29
(see Table B21).

99
Discussion (Experiments 3A and 3B)
Summary of findings
Repeated Measures ANOVAs. The repeated measures ANOVAs
conducted on the m dimension of reward (Experiment 3A) and p dimension of reward
(Experiment 3B) led to a somewhat comparable pattern of findings, as expected. This
similarity between dimensions suggested that reward influences the m and p dimensions
similarly. However, findings were notably stronger in the m dimension than in the p
dimension, also as expected. This discrepancy was anticipated due to the possibly larger
subjective difference in reward value between the LR and HR targets in the m than in the
p dimension, as suggested by Experiment 2.
Furthermore, as expected, findings for the response time measure were
weaker than those for the accuracy, inverse efficiency and sensitivity measures (similar
findings in Experiment 1). This discrepancy between response time findings and findings
from the other behavioural measures was anticipated because of the reward manipulation
adjustments implemented in the current series of experiments. More specifically, the
reward manipulation in the current series of experiments relative to the reward
manipulation in the Kiss et al. (2009) study, was designed to reduce the conscious use of
go-slow (for the LR) or go-fast (for the HR target) motor strategies. This was
accomplished by making correct responses to both target types associated with some
amount of reward and giving participants an equivalent and lenient amount of time (3s) in
which to respond following display presentation for both LR and HR trials.
The specific findings as well as their potential reflection of reward
influences on the visual perception (i.e., early) stage of information processing or motor

100
(i.e., late) stage of information processing along the “visual perception-overt behaviour”
continuum are outlined below.
A statistically significant main effect of Target Reward Value (LR versus
HR) was not obtained in either dimension (m or p) for the response time measure.
Nonetheless, the expected direction of findings was obtained: response time was non-
significantly longer for the LR than HR target in both dimensions. As evidenced by the
lower p-values and higher effect sizes, the non-significant direction of findings was
stronger in the m than in the p dimension, also as expected.
The non-significantly longer response time for the LR than HR target is in
line with the existing body of research suggesting an effect of reward value on the “vigor”
of movement/motor processing (e.g., Opris et al., 2011). As mentioned above, the lack of
statistically significant findings for response time in the current thesis is therefore likely
due to the control implemented on go-fast/go-slow strategies. Furthermore, the non-
significantly longer response time for the LR than HR target is in line with the theory put
forth by Shadmehr and colleagues, which holds that reward value is progressively
discounted as the time taken to make the response increases, thus accounting for the
effect of reward on movement vigor (Shadmehr et al. 2010; Shadmehr, 2010). According
to this theory, a faster response would inevitably be required for the HR than LR target
in order to maintain the HR target’s larger subjective value relative to the smaller
subjective value of the LR target. Once again, however, the lack of statistically
significant findings for response time in the current thesis is believed to be due to the
control implemented on go-fast/go-slow strategies.

101
Nonetheless, the non-significantly longer response time for the LR than
HR target is equally in line with more recent research suggesting an effect of reward on
feature visual perception (e.g., Kiss et al. 2009). In other words, since motor processing
and responding logically follow visual perception of the given visual target, the trend for
a more delayed motor response for the LR than HR target may, in part, be due to the
longer amount of time needed to visually perceive the LR than HR target.
However, given that the differences in response time between the LR and
HR target were not significant and given that they may reflect either motor processing,
visual perception or both, an examination of the response time data alone did not allow
for reliable disambiguation between the effects of reward on the early and late stages of
information processing along the “visual perception-overt behaviour” continuum.
Therefore, accuracy, inverse efficiency and sensitivity measures were also examined.
As expected, a statistically significant main effect of Target Reward Value
(LR versus HR) was obtained in the m dimension for the accuracy, inverse efficiency
and sensitivity measures, indicating lower accuracy, worse inverse efficiency and lower
sensitivity for the LRm than HRm target. A statistically significant main effect of Target
Reward Value (LR versus HR) was also obtained in the p dimension for the inverse
efficiency measure, indicating worse inverse efficiency for the LRp than HRp target.
Although this main effect did not reach statistical significance in the p dimension for the
accuracy and sensitivity measures, the expected direction of findings was obtained: non-
significantly lower accuracy and sensitivity for the LRp than HRp target. As evidenced
by the lower p-values and higher effect sizes, the statistically significant findings and
trends were stronger in the m than in the p dimension, as expected.

102
The significantly worse inverse efficiency for the LR than HR target,
found in both dimensions of reward (m and p), is also in line with the existing body of
research suggesting an effect of reward on movement “vigor”/motor processing (i.e., late
processing). This is the case because inverse efficiency is composed of a response time
component (inverse efficieny = response time/accuracy) and response time is speculated
to partly be a reflection of movement vigor/motor processing, as discussed previously.
Furthermore, Experiment 1 showed that inverse efficiency was positively correlated with
response time in both reward dimensions, suggesting that they both reflect the same (or
part of the same) underlying process. Therefore, regardless of accuracy, the non-
significantly slower response time (i.e., less movement vigor) for the LR than HR target
could, at least in part, lead to the significantly higher (worse) inverse efficiency score
observed for the LR than HR target. However, since the response time results did not
reach statistical significance in either dimension of reward (m or p), perhaps due to the
implemented control on go-fast/go-slow response strategies, it is unlikely to be the main
or only cause of the significant differences in inverse efficiency between LR and HR
targets in either dimension. Therefore, the differences in inverse efficiency scores
between the LR and HR targets are unlikely to primarily reflect the effect of reward on
motor (i.e., late) processing.
In contrast, the significantly lower accuracy found in the m dimension for
the LR than HR target may provide a better explanation or complement the response
time explanation for the significantly higher (worse) inverse efficiency score for the
LRm than HRm target. Decreases in accuracy have the same effect on inverse efficiency
as increases in response time do, because inverse efficiency is not only composed of a

103
response time component, but also of an accuracy component (inverse efficiency =
response time/accuracy). In other words, regardless of the non-significantly longer
response time for the LRm than HRm target, the significantly lower accuracy for the
LRm than HRm target caould, at least in part, lead to the significantly higher (worse)
inverse efficiency score in that dimension. And, since the accuracy findings reached
significance in the m dimension of reward whereas the response time findings did not,
accuracy as opposed to response time is likely to be the main or most important cause of
the significant differences in inverse efficiency observed in that dimension. Similarly,
although the lower accuracy found in the p dimension for the LR than HR target did not
reach statistical significance, Experiment 2 suggests that the lack of statistical
significance was likely simply due to the smaller subjective difference between the LR
and HR targets in that dimension. Furthermore, the strength or the non-significant
accuracy finding was larger than the strength of the non-significant response time finding
in the p dimension as well.
Therefore, the significantly worse inverse efficiency for the LR than HR
target in both reward dimensions (m and p) is also in line with recent research suggesting
an effect of reward on feature visual perception (i.e., early processing). This is speculated
to be the case because the differences in accuracy between the LR and HR targets were
stronger than the differences in response time, as mentioned above, and because the
differences in accuracy may reflect differences in visual perception more so than
differences in motor processing, as previously discussed (Experiment 1: positive
accuracy-sensitivity correlation). Furthermore, if differences in accuracy between the LR
and HR targets reflected differences in motor processing alone and reflected no

104
differences in visual perception, a speed-accuracy tradeoff would be expected. In other
words, the non-significantly slower response time (i.e., less movement vigor) associated
with the LR target would likely lead to fewer errors for LR targets than HR targets if LR
targets were not visually perceived later than HR targets. By the same token, the non-
significantly faster response time (i.e., more movement vigor) associated with the HR
target would likely lead to more errors for HR targets than LR targets if HR targets were
not visually perceived earlier than LR targets. This speed-accuracy tradeoff would be
evidenced by both a non-significant main effect of inverse efficiency and a significant
main effect of accuracy in the opposite direction to that observed. However, the lack of
such outcomes demonstrates a lack of evidence for a speed-accuracy trade-off and, hence,
a lack of compelling evidence that differences in accuracy reflect differences in motor
processing. Instead, the findings lend support for the postulated assumption that the lower
accuracy observed for the LR than HR target reflects the later visual perception of the
LR than HR target. Thus, following the same line of reasoning, the worse inverse
efficiency observed for the LR than HR target primarily reflects the same underlying
process.
Given that a significant correlation between accuracy and inverse
efficiency was not found in Experiment 1 for either dimension of reward, the assumption
that accuracy and inverse efficiency primarily reflect the same underlying process,
namely visual perception, seems somewhat counterintuitive at first glance. However, it is
important to note that the non-significant relationship in both reward dimensions was
nonetheless negative (i.e., as accuracy increased, inverse efficiency tended to
decrease/improve), suggesting that they may nonetheless partly reflect the same

105
underlying process. As mentioned previously, inverse efficiency is determined via a
combination of response time and accuracy measures. And, even though differences in
accuracy may reflect differences in visual perception between LR and HR targets,
differences in response time may partly reflect both differences in motor processing and
visual perception, as discussed previously. Consequently, the correlation between
accuracy and inverse efficiency likely did not reach statistical significance due to the
influence of the observed non-significant response time findings on the inverse efficiency
score. The significant correlation between response time and inverse efficiency
mentioned earlier, suggesting that response time reflects the same (or part of the same)
underlying process as inverse efficiency, is also in support of this conclusion.
Finally, the significantly lower sensitivity found in the m dimension for
the LR than HR target primarily lends support to the theory that reward influences visual
perception as well. This was speculated to be the case because sensitivity is a known
reflection of perceptual rather than motor processing. Also, there was no evidence of a
speed-sensitivity trade-off. Similarly, although the lower sensitivity found in the p
dimension for the LR than HR target did not reach statistical significance. Experiment 2
suggests that the lack of statistical significance was likely simply due to the smaller
subjective difference between the LR and HR targets in that dimension. As a side note,
sensitivity was also correlated with inverse efficiency, supporting the earlier conclusion
that inverse efficiency partly reflects visual perception.
As expected, a main effect of Display Duration (150ms versus 33.33ms)
was obtained for all behavioural measures in the m and p dimensions. In both reward
dimensions, response time was significantly slower, accuracy was significantly lower,

106
inverse efficiency was significantly worse and sensitivity was significantly lower for the
33.33ms than 150ms display duration. As evidenced by the lower p-values and higher
effect sizes, the statistically significant findings were stronger in the m than in the p
dimension.
Since the accuracy and sensitivity measures may reflect differences in
visual perception as opposed to differences in motor processing between the LR and HR
targets, as previously discussed, the main effect of Display Duration was likely observed
for those two behavioural measures of performance due to the drop from a 150ms to a
33.33ms display duration substantially cutting into the covert processing time for both the
LR and HR targets. Accuracy and sensitivity for both targets likely deteriorated with this
drop in display duration because, although small, the difference in the timing of the N2pc
(i.e., attentional selection) found between the LR and HR targets in the Kiss et al. (2009)
study was nonetheless significant. Similarly, since the accuracy component of the inverse
efficiency score may also partly reflect differences in visual perception between the LR
and HR targets, as previously discussed, the main effect of Display Duration was likely
observed for inverse efficiency partly for the same reason as it was observed for accuracy
and sensitivity. Consequently, the same main effect of Display Duration for the response
time measure may have been caused by greater uncertainty in responding following the
33.33ms than 150ms display duration, due to the decrease in covert processing time made
available to the participant in the 33.33ms display. By the same token, since inverse
efficiency is also made up of a response time component, as previously discussed, the
main effect of Display Duration was also likely observed for inverse efficiency partly for
the same reason as it was observed for the response time main effect.

107
A significant interaction between Target Reward Value (LR versus HR)
and Display Duration (150ms versus 33.33ms) was not obtained in either dimension (m
or p) for the response time measure. However, the expected direction of findings was
obtained: non-significantly larger effect of decreases in display duration on the LR than
on the HR target in the p dimension (opposite but negligible in the m dimension).
The non-significant interaction for the response time measure is not
surprising since the main effect of Target Reward Value for response time also did not
reach statistical significance. As discussed previously, response time may be influenced
by visual perception and/or motor processing, and is more likely due to motor proceesing.
Thus, the lack of significant findings for the response time measure may be due to the
control implemented on go-fast/go-slow motor strategies in the current study.
In contrast, a significant interaction between Target Reward Value (LR
versus HR) and Display Duration (150ms versus 33.33ms) was obtained in the m
dimension for the accuracy, inverse efficiency and sensitivity measures, suggesting a
larger effect of decreases in display duration on the LRm than on the HRm target.
However, although this interaction did not reach significance in the p dimension for the
accuracy, inverse efficiency and sensitivity measures, the expected direction of findings
was obtained: non-significantly larger effect of decreases in display duration on the LRp
than on the HRp target. As evidenced by the significant p-values and higher effect sizes
in the m dimension and the similar yet non-significant direction of findings in the p
dimension, the findings were stronger in the m than in the p dimension.
The significant Target Reward Value x Display Duration interactions for
the accuracy, inverse efficiency and sensitivity measures in the m dimension are not

108
surprising since the main effects of Target Reward Value for accuracy, inverse efficiency
and sensitivity also reached statistical significance in that dimension. Since the accuracy
and sensitivity measures may reflect differences in visual perception as opposed to
differences in motor processing between the LR and HR targets, as previously discussed,
the interactions for these two behavioural measures of performance were likely observed
due to the drop from a 150ms to a 33.33ms display duration cutting into the visual
processing time for the LR target slightly more than into the visual processing time for
the HR target. This subtle difference between the LR and HR targets was observed even
though a main effect of Display Duration was also found suggesting that a drop in display
duration cuts substantially into the covert processing time for both targets. Accuracy and
sensitivity for both targets likely deteriorated more for the LR than HR target with this
drop in display duration because the small difference in the timing of the N2pc (i.e.,
covert processing) that was found between the LR and HR targets in the Kiss et al.
(2009) study was nonetheless significant. Similarly, since the accuracy component of the
inverse efficiency score may also partly reflect differences in visual perception between
the LR and HR targets, as previously discussed, the significant Target Reward Value x
Display Duration interaction was likely observed for inverse efficiency partly for the
same reason as it was observed for accuracy and sensitivity. Although the larger accuracy,
inverse efficiency and sensitivity effects of decreasing display duration for the LR than
HR target did not reach statistical significance in the p dimension, Experiment 2 suggests
that the lack of statistical significance was likely simply due to the smaller subjective
difference between the LR and HR targets in that dimension.

109
It may be important to note that the 33.33ms display duration in the
current experiment was by no means randomly determined. Preceding experiments were
conducted separately for the m dimension and p dimension, in which the lowest display
duration was 0.050s (rather than 0.035s). This pilot experiment led to the same pattern of
results as the current experiment. However, most findings were simply trends that did not
reach statistical significance. Therefore, the lowest display duration in the current
experiment was decreased to 33.33ms in order to offer a greater perceptual challenge.
Independent samples t-tests. Independent sample t-tests were conducted
to shed light on the inconsistencies between the m and p dimensions of reward. More
specifically, throughout this paper, the difference in subjective reward value between the
LR and HR target in the m dimension was speculated to be larger than the difference in
subjective reward value between the LR and HR target in the p dimension. The
discounting procedure used in Experiment 2 supported this conclusion. As expected,
these t-tests demonstrated that the mean difference between the LRm and HRm target
was significantly larger than the mean difference between the LRp and HRp target for
the accuracy, inverse efficiency and sensitivity measures.
Conclusion
In summary, the behavioural measures and display-duration paradigm
used in the current experiment lend support to the theory that reward influences the visual
perception (i.e., early) stage of information processing along the “visual pereption-overt
behaviour” continuum. Furthermore, the current experiment demonstrated that
differences in visual perception of targets differing in reward value seem to be most

110
obviously reflected by observed differences in accuracy, inverse efficiency and
sensitivity between those targets.
Moreover, the data suggest that, not only is the reward value of visual
targets and their consequent visual perception determined by the magnitude of reward
associated with them but also by the subjective value they represent for the observer. This
hypothesis is further assessed in Experiment 4.
111
Experiment 4
Determining the cause of the differences between the magnitude and probability
dimensions in Experiment 3
The purpose of Experiment 4 was to determine whether the greater
statistical strength of findings observed in Experiment 3 for the m than the p dimension
of reward was due to the potentially larger difference in subjective reward value between
the LR and HR target in the m than in the p dimension, as suggested by Experiment 2.
In the current experiment, the reward value for the HR target in both
dimensions (m and p) was maintained at $10, as in Experiment 3. If the greater statistical
strength of findings observed in Experiment 3 for the m than the p dimension of reward
was due to a larger difference in subjective reward value between the LRm and HRm
targets than between the LRp and HRp targets, then reducing the size of the difference in
subjective reward value between the LR and HR targets in the m dimension in the
current experiment would lead to findings of a similarly weak statistical strength as those
found in the p dimension in Experiment 3. In order to accomplish this, the subjective
reward value of the LRm target was increased from $1 in Experiment 3 to $5 in the
current experiment. (The $5 reward value for the LRm target in the current experiment
was chosen to approximate the subjective reward value of the LRp target in Experiment
3, as determined by Experiment 2.) Therefore, the difference in subjective reward value
between the LRm and HRm targets was decreased from a $9 difference in Experiment 3
to a $5 difference in the current experiment.
Likewise, if the weaker statistical strength of findings observed in
Experiment 3 for the p than the m dimension of reward was due to a smaller difference in

112
subjective reward value between the LRp and HRp targets than between the LRm and
HRm targets, then increasing the size of the difference in subjective reward value
between the LR and HR target in the p dimension, would lead to findings of a similarly
strong statistical strength as those found in the m dimension in Experiment 3. This was
accomplished by reducing the subjective reward value of the LRp target from a 10%
chance for $10 in Experiment 3 (subjective reward value of approximately $5, as
determined by Experiment 2) to a 1% chance for $10 in the current experiment
(subjective reward value of approximately $1, as determined by the discounting
procedure described later). Therefore, the difference in subjective reward value between
the LRp and HRp target was increased from a $5 difference in Experiment 3 to an
approximately $9 difference in the current experiment. The 1% probability for the LRp
target in the current experiment was chosen to approximate the subjective reward value
of the LRm target in Experiment 3 ($1).
In summary, if the greater statistical strength of findings observed in
Experiment 3 for the m than the p dimension of reward was due to the potentially larger
difference in subjective reward value between the LR and HR targets in the m than in the
p dimension, this experiment would lead to a reversal in the statistical strength of
findings between dimensions. More specifically, whereas stronger statistical findings
were obtained in the m than p dimension in Experiment 3, stronger statistical findings
were expected in the p than in the m dimension in the current experiment. If, in contrast,
the differences in statistical strength between dimensions in Experiment 3 were due to
inherent characteristics of the reward dimensions, this reversal of findings should not be
obtained. As was Experiment 3, the current experiment was also divided into 2

113
components: Experiment 4A (Magnitude dimension) and Experiment 4B (Probability
dimension).

114
Experiment 4A: Reward Magnitude Dimension
In the magnitude component of Experiment 4, it was expected that target
identification response times would be slower, error rates would be higher, inverse
efficiency would be poorer and sensitivity would be lower for Low-Reward-Magnitude
targets (LRm) than for High-Reward-Magnitude targets (HRm) and for 0.035s display
durations than for 0.150s display durations. It was also expected that the effect of
decreasing display duration would be more detrimental to target identification
performance for the LRm target than for the HRm target, suggesting that the LRm target
requires a longer processing time to be visually perceived than the HRm target. Based on
the findings in Experiment 1 and 3, the accuracy, inverse efficiency and sensitivity
measures were expected to show stronger statistical findings than the response time
measure. Significant findings for accuracy, inverse efficiency and sensitivity in the
presence or absence of significant findings in response time would suggest reward
influences on the visual perception (i.e, early) stage of information processing along the
“visual perception-overt behaviour” continuum. However, significant differences in
response time in the absence of differences in accuracy, inverse efficiency and sensitivity
would suggest a lack of reward influences on the visual perception (i.e., early) stage and
evidence for differences in the motor (i.e, late) stage of information processing along the
“visual perception-overt behaviour” continuum.
Also, compared to Experiment 3, the statistical findings from the m
dimension in the current experiment were expected to be weaker (more closely
resembling the statistical strength of findings in the p than m dimension of Experiment 3).

115
Methodology
Participant sample
Participants in this experiment consisted of 4 female and 4 male (mean age
= 24) Concordia University undergraduate psychology students with self-reported normal
vision, drawn from the Psychology Department’s Participant Pool. They were treated in
accordance with the guidelines set by the “Concordia University Human Research Ethics
Committee”.
Apparatus and laboratory space
The apparatus and laboratory space used in this experiment were the same
as those used in Experiment 1 and 3.
Stimuli
The stimuli used in this experiment were the same as those used in
Experiment 1 and 3.
Procedure
The procedure used in the current experiment was the same as that used in
Experiment 3.
Reward manipulation
All participants received 2 course credits simply for participating in the
study. In addition, at the end of each participant’s testing session, a random-number
generator was used to select one of the trials therein.
If the randomly selected trial contained a Low-Reward-Magnitude target
(LRm), a $5 monetary reward was given. If it contained a High-Reward-Magnitude
target (HRm), a $10 monetary reward was given. However, if an incorrect or late

116
response (after the 3.000s) was made in the trial that was randomly selected, no monetary
reward was given. For half of the participants, the LRm was red and the HRm was green.
For the other half of the participants, the LRm was green and the HRm was red.
Participants were informed of these reward contingencies prior to the start of the
experiment.

117
Results
The raw data generated by each participant were automatically exported
from VPixx (v.2.32) to Excel (v.12.3.0). Excel was used to summarize each participant’s
raw data into “LRm target in 150ms display”, “LRm target in 33.33ms display”, “HRm
target in 150ms display”and “HRm target in 33.33ms display” means for the response
time, accuracy, inverse efficiency and sensitivity (d’) behavioural measures. This resulted
in a total of 16 means.
Repeated Measures ANOVAs
SPSS software (v.19) was used to conduct a separate 2 x 2 repeated
measures analysis of variance on the response time, accuracy, inverse efficiency and
sensitivity (d’) behavioural measures (see Appendix B for complete proofs). For each of
the 4 analyses, Target Reward Value had 2 levels (LRm, HRm) and Display Duration
had 2 levels (150ms, 33.33ms ).
Given that the subjective difference in reward value between the LRm and
HRm targets was decreased in the current experiment as compared to Experiment 3A (m
dimension), significant interactions between Target Reward Magnitude and Display
Duration were not expected for any behavioural measure. In other words, the findings
were expected to be similarly weak as those of Experiment 3B (p dimension).
Response time. The 2 x 3 repeated measures ANOVA conducted on the
response time data resulted in a non-significant main effect of Target Reward Magnitude,
F(1, 7) = 2.628, p = 0.15, 2 = 0.27, a significant main effect of Display Duration, F(1, 7)
= 7.682, p = 0.03, 2 = 0.52, and a non-significant interaction between Target Reward
Magnitude and Display Duration, F(1, 7) = 0.028, p = 0.87, 2 = 0.00 (see Table B22).

118
The non-significant main effect of Target Reward Magnitude showed that,
regardless of the display duration manipulation (150ms versus 33.33ms), the mean
response time for the LRm target (M = 0.462s, SE = 0.008s) did not differ significantly
from the mean response time for the HRm target (M = 0.450s, SE = 0.008s).
The significant main effect of Display Duration showed that, regardless of
the target reward magnitude manipulation (LRm versus HRm), the mean response time
for the 150ms display duration (M = 0.436s, SE = 0.005s) was significantly faster than
the mean response time for the 33.33ms display duration (M = 0.476s, SE = 0.014s) (see
Figure 29).
As expected, the non-significant interaction between Target Reward
Magnitude and Display Duration showed that the mean difference in response time
between the 150ms display duration and 33.33ms display duration for the LRm target (M
= -0.043s, SE = 0.024s) was not larger (or smaller) than the mean difference in response
time between the 150ms and 33.33ms display duration for the HRm target (M = -0.038s,
SE = 0.013s).
Accuracy (% correct). The 2 x 2 repeated measures ANOVA conducted
on the accuracy data resulted in a non-significant main effect of Target Reward
Magnitude, F(1, 7) = 1.656, p = 0.24, 2 = 0.19, a significant main effect of Display
Duration, F(1, 7) = 159.609, p = 0.00, 2 = 0.96, and a non-significant interaction
between Target Reward Magnitude and Display Duration, F(1, 7) = 2.655, p = 0.15, 2 =
0.28 (see Table B23).
The non-significant main effect of Target Reward Magnitude showed that,
regardless of the display duration manipulation (150ms versus 33.33ms), the mean

119
Figure 29. Mean response time (+SE) for the significant main effect of Display Duration
in Experiment 4A, p = 0.03.

120
accuracy for the LRm target (M = 84.4%, SE = 1.2%) was not significantly different
from the mean accuracy for the HRm target (M = 87.3%, SE = 1.3%).
The significant main effect of Display Duration showed that, regardless of
the target reward magnitude manipulation (LRm versus HRm), the mean accuracy for
the 150ms display duration (M = 94.6%, SE = 0.8%) was significantly better than the
mean accuracy for the 33.33ms display duration (M = 77.1%, SE = 1.0%) (see Figure 30).
As expected, the non-significant interaction between Target Reward
Magnitude and Display Duration showed that the mean difference in accuracy between
the 150ms display duration and 33.33ms display duration for the LRm target (M =
21.0%, SE = 2.6%) was not larger (or smaller) than the mean difference in accuracy
between the 150ms and 33.33ms display duration for the HRm target (M = 14.1%, SE =
2.4%).
Inverse efficiency. The 2 x 2 repeated measures ANOVA conducted on
the inverse efficiency data resulted in a non-significant main effect of Target Reward
Magnitude, F(1, 7) = 5.029, p = 0.06, 2 = 0.42, a significant main effect of Display
Duration, F(1, 7) = 48.181, p = 0.00, 2 = 0.87, and a non-significant interaction between
Target Reward Magnitude and Display Duration, F(1, 7) = 2.246, p = 0.18, 2 = 0.24
(see Table B24).
The non-significant main effect of Target Reward Magnitude showed that,
regardless of the display duration manipulation (150ms versus 33.33ms), the mean
inverse efficiency for the LRm target (M = 0.562s, SE = 0.015s) did not differ

121
Figure 30. Mean accuracy (+SE) for the significant main effect of Display Duration in
Experiment 4A, p = 0.00.

122
significantly from the mean inverse efficiency for the HRm target (M = 0.522s, SE =
0.010s).
The significant main effect of Display Duration showed that, regardless of
the target reward magnitude manipulation (LRm versus HRm), the mean inverse
efficiency for the 150ms display duration (M = 0.461s, SE = 0.006s) was significantly
better than the mean inverse efficiency for the 33.33ms display duration (M = 0.623s, SE
= 0.020s) (see Figure 31).
As expected, the non-significant interaction between Target Reward
Magnitude and Display Duration showed that the mean difference in inverse efficiency
between the 150ms and 33.33ms display durations for the LRm target (M = -0.193s, SE
= 0.040s) was not larger (or smaller) than the mean difference in inverse efficiency
between the 150ms and 33.33ms display durations for the HRm target (M = -0.131s, SE
= 0.019s).
Sensitivity (d’). The 2 x 2 repeated measures ANOVA conducted on the
sensitivity data resulted in a non-significant main effect of Target Reward Magnitude,
F(1, 7) = 2.202, p = 0.18, 2 = 0.24, a significant main effect of Display Duration, F(1, 7)
= 6.691, p = 0.04, 2 = 0.49, and a non-significant interaction between Target Reward
Magnitude and Display Duration, F(1, 7) = 0.006, p = 0.94, 2 = 0.00 (see Table B25).
The non-significant main effect of Target Reward Magnitude showed that,
regardless of the display duration manipulation (150ms versus 33.33ms), the mean
sensitivity for the LRm target (M = 1.993, SE = 0.096) did not differ significantly from
the mean sensitivity for the HRm target (M = 2.343, SE = 0.211).

123
Figure 31. Mean inverse efficiency (+SE) for the significant main effect of Display
Duration in Experiment 4A, p = 0.00.

124
The significant main effect of Display Duration showed that, regardless of
the target reward magnitude manipulation (LRm versus HRm), the mean sensitivity for
the 150ms display duration (M = 2.531, SE = 0.117) was significantly higher than the
mean sensitivity for the 33.33ms display duration (M = 1.804, SE = 0.227) (see Figure
32).
As expected, the non-significant interaction between Target Reward
Magnitude and Display Duration showed that the mean difference in sensitivity between
the 150ms and 33.33ms display duration for the LRm target (M = 0.733, SE = 0.292)
was not larger (or smaller) than the mean difference in sensitivity between the 150ms and
33.33ms display duration for the HRm target (M = 0.720, SE = 0.293).
ANOVA summary. As expected, contrary to Experiment 3A (m
dimension), significant interactions between Target Reward Magnitude and Display
Duration were not obtained in this experiment (m dimension) for any of the behavioural
measures. However the non-significant findings were in the expected direction: non-
significant larger mean differences between display durations for the LRm target than for
the HRm target, for measures predominantly reflecting early processing (i.e., accuracy,
inverse efficiency and sensitivity).
The fact that these interactions were not significant in the current
experiment (m dimension), but were in Experiment 3A (m dimension) suggests that the
m dimension is not inherently different from the p dimension. Rather, given that the
subjective difference in reward value between the LRm and HRm targets was decreased
in the current experiment (m dimension) as compared to Experiment 3A (m dimension),
the non-significant interactions in the current experiment suggest that the difference in

125
Figure 32. Mean sensitivity (+SE) for the significant main effect of Display Duration in
Experiment 4A, p = 0.04.

126
subjective reward value between the LRm and HRm target needs to be sufficiently large
for statistical significance to be obtained.

127
Experiment 4B: Reward Probability Dimension
In the probability component of Experiment 4, it was expected that target
identification response times would be slower, error rates would be higher, inverse
efficiency would be poorer and sensitivity would be lower for Low-Reward-Probability
targets (LRp) than for High-Reward-Probability targets (HRp) and for 33.33ms display
durations than for 150ms display durations. It was also expected that the effect of
decreasing display duration would be more detrimental to target identification
performance for the LRp target than for the HRp target, suggesting that the LRp target
requires a longer processing time to be visually perceived than the HRp target. Based on
the findings in Experiment 1 and 3, the accuracy, inverse efficiency and sensitivity
measures were expected to show stronger statistical findings than the response time
measure. Significant findings for accuracy, inverse efficiency and sensitivity in the
presence or absence of significant findings in response time would suggest reward
influences on the visual perception (i.e, early) stage of information processing along the
“visual perception-overt behaviour” continuum. However, significant differences in
response time in the absence of differences in accuracy, inverse efficiency and sensitivity
would suggest a lack of reward influences on the visual perception (i.e, early) stage and
evidence for differences in the motor (i.e., late) stage of information processing along the
“visual perception-overt behaviour” continuum.
Also, as compared to Experiment 3, the statistical findings from the p
dimension in the current experiment were expected to be stronger (more closely
resembling the statistical strength of findings in the m than p dimension of Experiment 3).

128
Methodology
Participant sample
Participants in this experiment consisted of 6 female and 2 male (mean age
= 22) Concordia University undergraduate psychology students with self-reported normal
vision, drawn from the Psychology Department’s Participant Pool. They were treated in
accordance with the guidelines set by the “Concordia University Human Research Ethics
Committee”.
Apparatus and laboratory space
The apparatus and laboratory space used in this experiment were the same
as those used in Experiment 1 and 3.
Stimuli
The stimuli used in this experiment were the same as those used in
Experiment 1 and 3.
Procedure: Visual search task
The visual search procedure used in the current experiment was the same
as that used in Experiment 3.
Reward manipulation: Visual search task
All participants received 2 course credits simply for participating in the
study. In addition, at the end of each participant’s testing session, a random-number
generator was used to select one of the trials therein.
If the randomly selected trial contained a Low-Reward-Probability target
(LRp), a $10 monetary reward was given with 1% probability (A random number
generator with numbers 1 through 100 was used. If the number 1 was drawn, the $10

129
reward was given; if any of the other numbers were drawn, it wasn’t). If it contained a
High-Reward-Probability target (HRp), a $10 monetary reward was given with 100%
probability. However, if an incorrect or late response (after the 3s) was made in the trial
that was randomly selected, no monetary reward was given. For half of the participants,
the LRp was red and the HRp was green. For the other half of the participants, the LRp
was green and the HRp was red. Participants were informed of these reward
contingencies prior to the start of the experiment.
Procedure: Discounting task
The same participants from the visual component of this experiment
subsequently performed the discounting task. They were treated in accordance with the
guidelines set by the “Concordia University Human Research Ethics Committee”. The
discounting task used in the current experiment was similar to that used in Experiment 2,
except with a different probabilistic reward (see Appendix C). The subjective reward
value of the LRp target in the current experiment was determined to be approximately $1
(M = $1.30, SE = $0.06) and, thus as expected was approximately equal to the subjective
value of the LRm target in Experiment 3.

130
Results
The raw data generated by each participant were automatically exported
from VPixx (v.2.32) to Excel (v.12.3.0). Excel was used to summarize each participant’s
raw data into “LRp target in 150ms display”, “LRp target in 33.33ms display”, “HRp
target in 150ms display”and “HRp target in 33.33ms display” means for the response
time, accuracy, inverse efficiency and sensitivity (d’) behavioural measures. This resulted
in a total of 16 means.
Repeated Measures ANOVAs
SPSS software (v.19) was used to conduct a separate 2 x 2 repeated
measures analysis of variance on the response time, accuracy, inverse efficiency and
sensitivity (d’) behavioural measures (see Appendix B for complete proofs). For each of
the 4 analyses, Target Reward Value had 2 levels (LRp, HRp) and Display Duration had
2 levels (150ms, 33.33ms ).
Given that the subjective difference in reward value between the LRp and
HRp targets was increased in the current experiment as compared to Experiment 3B (p
dimension), significant interactions between Target Reward Probability and Display
Duration were expected for all behavioural measures predominantly reflecting early
processing, as suggested by the findings from Experiment 1 (i.e., for accuracy, inverse
efficiency and sensitivity; not for response time). These interactions were expected to
show larger mean differences between display durations for the LRp target than for the
HRp target, suggesting that the LRp target requires a longer processing time to be
visually perceived than the HRp target. In other words, the findings were expected to be
similarly strong as those of Experiment 3A (m dimension).

131
Response time. The 2 x 2 repeated measures ANOVA conducted on the
response time data resulted in non-significant main effect of Target Reward Probability,
F(1, 7) = 5.098, p = 0.06, 2 = 0.42, a significant main effect of Display Duration, F(1, 7)
= 14.225, p = 0.01, 2 = 0.67, and a non-significant interaction between Target Reward
Probability and Display Duration, F(1, 7) = 0.004, p = 0.95, 2 = 0.00 (see Table B26).
The non-significant main effect of Target Reward Probability showed that,
regardless of the display duration manipulation (150ms versus 33.33ms), the mean
response time for the LRp target (M = 0.470s, SE = 0.010s) did not differ significantly
from the mean response time for the HRp target (M = 0.452s, SE = 0.006s).
The significant main effect of Display Duration showed that, regardless of
the target reward probability manipulation (LRp versus HRp), the mean response time
for the 150ms display duration (M = 0.437s, SE = 0.004s) was significantly faster than
the mean response time for the 33.33ms display duration (M = 0.485s, SE = 0.013s) (see
Figure 33).
As expected, the non-significant interaction between Target Reward
Probability and Display Duration showed that the mean difference in response time
between the 150ms display duration and 33.33ms display duration for the LRp target (M
= 0.225s, SE = 0.030s) was not larger (or smaller) than the mean difference in response
time between the 150ms and 33.33ms display duration for the HRp target (M = 0.096s,
SE = 0.030s).
Accuracy (% correct). The 2 x 2 repeated measures ANOVA conducted
on the accuracy data resulted in a significant main effect of Target Reward Probability,
F(1, 7) = 23.038, p = 0.00, 2 = 0.77, a significant main effect of Display Duration,

132
Figure 33. Mean response time (+SE) for the significant main effect of Display Duration
in Experiment 4B, p = 0.01.

133
F(1, 7) = 68.332, p = 0.00, 2 = 0.91, and a significant interaction between Target
Reward Probability and Display Duration, F(1, 7) = 19.785, p = 0.00, 2 = 0.74 (see
Table B27).
The significant main effect of Target Reward Probability showed that,
regardless of the display duration manipulation (150ms versus 33.33ms), the mean
accuracy for the LRp target (M = 82.6%, SE = 0.8%) was significantly lower than the
mean accuracy for the HRp target (M = 90.3%, SE = 1.4%).
The significant main effect of Display Duration showed that, regardless of
the target reward probability manipulation (LRp versus HRp), the mean accuracy for the
150ms display duration (M = 94.9%, SE = 0.8%) was significantly higher than the mean
accuracy for the 33.33ms display duration (M = 78.0%, SE = 1.6%).
As expected, the significant interaction between Target Reward
Probability and Display Duration showed that the mean difference in accuracy between
the 0.150s and 0.035s display duration for the LRp target (M = 24.6%, SE = 2.4%) was
larger than the mean difference in accuracy between the 0.150s and 0.035s display
duration for the HRp target (M = 9.1%, SE = 2.9%) (see Figure 34 and Table 28).
Inverse efficiency. The 2 x 2 repeated measures ANOVA conducted on
the inverse efficiency data resulted in a significant main effect of Target Reward
Probability, F(1, 7) = 25.492, p = 0.00, 2 = 0.79, a significant main effect of Display
Duration, F(1, 7) = 58.178, p = 0.00, 2 = 0.89, and a significant interaction between
Target Reward Probability and Display Duration, F(1, 7) = 10.370, p = 0.02, 2 = 0.60
(see Table B29).

134
Figure 34. Mean accuracy (+SE) for the significant Target Reward Probability x Display
Duration interaction in Experiment 4B, p = 0.00.

135
The significant main effect of Target Reward Probability showed that,
regardless of the display duration manipulation (150ms versus 33.33ms), the mean
inverse efficiency for the LRp target (M = 0.588s, SE = 0.015s) was significantly worse
than the mean inverse efficiency for the HRp target (M = 0.505s, SE = 0.008s).
The significant main effect of Display Duration showed that, regardless of
the target reward probability manipulation (LRp versus HRp), the mean inverse
efficiency for the 150ms display duration (M = 0.462s, SE = 0.007s) was significantly
better than the mean inverse efficiency for the 33.33ms display duration (M = 0.631s, SE
= 0.019s).
As expected, the significant interaction between Target Reward
Probability and Display Duration showed that the mean difference in inverse efficiency
between the 150ms and 33.33ms display duration for the LRp target (M = -0.233s, SE =
0.033s) was larger than the mean difference in inverse efficiency between the 150ms and
33.33ms display duration for the HRp target (M = -0.106s, SE = 0.025s) (see Figure 35
and Table 30).
Sensitivity (d’). The 2 x 2 repeated measures ANOVA conducted on the
sensitivity data resulted in a significant main effect of Target Reward Probability, F(1, 7)
= 5.852, p = 0.05, 2 = 0.46, a significant main effect of Display Duration, F(1, 7) =
9.102, p = 0.02, 2 = 0.57, and a significant interaction between Target Reward
Probability and Display Duration, F(1, 7) = 10.141, p = 0.02, 2 = 0.59 (see Table B31).
The significant main effect of Target Reward Probability showed that,
regardless of the display duration manipulation (150ms versus 33.33ms), the mean

136
Figure 35. Mean inverse efficiency (+SE) for the significant Target Reward Probability x
Display Duration interaction in Experiment 4B, p = 0.02.

137
sensitivity for the LRp target (M = 1.760, SE = 0.054) was significantly lower than the
mean sensitivity for the HRp target (M = 2.338, SE = 0.217).
The significant main effect of Display Duration showed that, regardless of
the target reward probability manipulation (LRp versus HRp), the mean sensitivity for
the 150ms display duration (M = 2.491, SE = 0.117) was significantly higher than the
mean sensitivity for the 33.33ms display duration (M = 1.607, SE = 0.225).
As expected, the significant interaction between Target Reward
Probability and Display Duration showed that the mean difference between the 0.150s
and 0.035s display duration for the LRp target (M = 1.017, SE = 0.291) was larger than
the mean difference in sensitivity between the 150ms and 33.33ms display duration for
the HRp target (M = 0.750, SE = 0.301) (see Figure 36 and Table 32).
ANOVA summary. As expected, contrary to Experiment 3B (p
dimension), significant interactions between Target Reward Probability and Display
Duration were obtained in this experiment (p dimension) for all behavioural measures
predominantly reflecting early processing, as suggested by the findings from Experiment
1 (i.e., for accuracy, inverse efficiency and sensitivity; not for response time). As
expected, these interactions showed larger mean differences between display durations
for the LRp target than for the HRp target, suggesting that the LRp target requires a
longer processing time to be visually perceived than the HRp target.
The fact that these interactions were significant in the current experiment
(p dimension), but were not significant in Experiment 3B (p dimension) suggests that the
p dimension is not inherently different from the m dimension. Rather, given that the
subjective difference in reward value between the LRp and HRp targets was increased in

138
Figure 36. Mean sensitivity (+SE) for the significant Target Reward Probability x
Display Duration interaction in Experiment 4B, p = 0.02.

139
the current experiment (p dimension) as compared to Experiment 3B (p dimension), the
significant interactions in the current experiment suggest that the difference in subjective
reward value between the LRp and HRp target needs to be sufficiently large forstatistical
significance to be obtained.
Independent samples t-tests (Experiments 4A and 4B)
As evidenced by the repeated measures ANOVAs conducted in
Experiments 4A (m dimension) and 4B (p dimension), there were some inconsistencies
between the m and p dimensions of reward. More specifically, as expected, although a
similar pattern of findings emerged in both dimensions, weaker statistical findings were
found in the m dimension than in the p dimension. These observed inconsistencies were
speculated to be due to a smaller subjective difference in reward value between the LR
and HR target in the m dimension than in the p dimension, as suggested by Experiment 2.
Statistical comparisons were conducted to confirm the observation that the mean
difference for all behavioural measures of performance was smaller between the LRm
and HRm targets than between the LRp and HRp targets.
SPSS software (v.19) was used to conduct a series of independent samples
t-tests, comparing the m dimension mean difference between LR and HR targets to the p
dimension mean difference between LR and HR targets. A separate t-test was conducted
for each behavioural measure of performance (see Appendix B for complete proofs).
Response time. The mean difference in response time between LR and
HR targets in the m dimension (M = 0.012s, SE = 0.007s) did not differ significantly
from the mean difference in response time between LR and HR targets in the p
dimension (M = 0.018s, SE = 0.008s), t(14) = -0.742, p = 0.48, g = .24 (see Table B33).

140
Accuracy (% correct). As seen in Figure 37, the mean difference in
accuracy between LR and HR targets in the m dimension (M = -2.9%, SE = 6.5%) was
significantly smaller than the mean difference in accuracy between, g = .50 LR and HR
targets in the p dimension (M = 15.5%, SE = 9.1%), t(14) = 8.469, p = 0.00 (see Table
B33).
Inverse efficiency. As seen in Figure 38, the mean difference in inverse
efficiency between LR and HR targets in the m dimension (M = 0.040s, SE = 0.018s)
was significantly smaller than the mean difference in inverse efficiency between LR and
HR targets in the p dimension (M = 0.083s, SE = 0.016s), t(14) = -4.560, p = 0.00, g
= .84 (see Table B33).
Sensitivity (d’). As seen in Figure 39, the mean difference in sensitivity
between LR and HR targets in the m dimension (M = -0.350, SE = 0.236) was
significantly smaller than the mean difference in sensitivity between LR and HR targets
in the p dimension (M = -0.578, SE = 0.239), t(14) = 2.599, p = 0.04, g = .30 (see Table
B33).

141
Figure 37. Mean difference (+SE) in accuracy between HR and LR target in the m and p
dimension, in Experiment 4, p = 0.00.

142
Figure 38. Mean difference (+SE) in inverse efficiency between HR and LR target in the
m and p dimension, in Experiment 4, p = 0.00.

143
Figure 39. Mean difference (+SE) in sensitivity between HR and LR target in the m and
p dimension, in Experiment 4, p = 0.04.

144
Discussion (Experiments 4A and 4B)
Summary of findings
Repeated Measures ANOVAs. The repeated measures ANOVAs
conducted on the m dimension of reward (Experiment 4A) and p dimension of reward
(Experiment 4B) led to a somewhat comparable pattern of findings, as expected. They
were also similar to those in Experiment 3. However, findings in the current experiment
were notably stronger in the p dimension than in the m dimension (rather than being
stronger in the m dimension than in the p dimension, as in Experiment 3), also as
expected. This discrepancy was anticipated due to the possibly larger difference in
subjective reward value between the LR and HR targets in the p than in the m dimension
in the current experiment (as opposed to the possibly larger difference in subjective
reward value between the LR and HR targets in the m than in the p dimension in
Experiment 3). Furthermore, as expected, findings for the response time measure were
weaker than those for the accuracy, inverse efficiency and sensitivity measures (similar
findings in Experiment 1 and Experiment 3). The specific findings from the current
experiment relative to those in Experiment 3 are outlined below.
A statistically significant main effect of Target Reward Value (LR versus
HR) was not obtained in either dimension (m or p) for the response time measure.
However, the expected direction of findings was obtained: non-significantly longer
response time for the LR than HR target in both dimensions. As evidenced by the lower
p-values and higher effect sizes, the non-significant findings were stronger in the p than
in the m dimension, also as expected. The same pattern of findings was obtained in

145
Experiment 3, apart from their statistical strength being reversed between the m and p
dimensions in the current experiment, as expected.
As expected, a statistically significant main effect of Target Reward Value
(LR versus HR) was obtained in the p dimension for the accuracy, inverse efficiency and
sensitivity measures, indicating lower accuracy, worse inverse efficiency and lower
sensitivity for the LRp than HRp target. However, although this main effect did not
reach statistical significance in the m dimension for the accuracy, inverse efficiency and
sensitivity measures, the same direction of findings was obtained. As evidenced by the
lower p-values and higher effect sizes, the statistically significant findings and trends
were stronger in the p than in the m dimension, as expected. The same pattern of findings
was obtained in Experiment 3, apart from the statistical strength of findings being
reversed between the m and p dimensions, as expected. Also different was that inverse
efficiency reached statistical significance in Experiment 3 in both the m and p
dimensions, whereas it only reached statistical significance in the current experiment in
the p dimension. This discrepancy was not of major concern, however, because the
difference in statistical strength of findings between the m and p dimensions nonetheless
remained in the predictable direction in both Experiment 3 and in the current experiment
(i.e., smaller p-value and larger effect size for the m than p dimension in Experiment 3
and smaller p-value and larger effect size for the p than m dimension in the current
experiment).
As expected, a main effect of Display Duration (150ms versus 33.33ms)
was obtained for all behavioural measures of performance in the m and p dimensions. In
both reward dimensions, response time was significantly slower, accuracy was

146
significantly lower, inverse efficiency was significantly worse and sensitivity was
significantly lower for the 33.33ms than 150ms display duration. As evidenced by the
lower p-values and/or higher effect sizes for most measures (apart from accuracy), the
statistically significant findings were overall stronger in the p than in the m dimension.
The same pattern of findings was obtained in Experiment 3, apart from the statistical
strength of findings being reversed between the m and p dimensions, as expected.
A significant interaction between Target Reward Value (LR versus HR)
and Display Duration (150ms versus 33.33ms) was not obtained in either dimension for
the response time measure. However, the non-significant findings were in the expected
direction: a larger effect of decreases in display duration on the LR than on the HR target
in the m dimension (opposite but negligible in the p dimension). The same pattern of
findings was obtained in Experiment 3.
In contrast, a significant interaction between Target Reward Value (LR
versus HR) and Display Duration (150ms versus 33.33ms) was obtained in the p
dimension for the accuracy, inverse efficiency and sensitivity measures, suggesting a
larger effect of decreases in display duration on the LRp than on the HRp target.
Although this interaction did not reach significance in the m dimension for the accuracy,
inverse efficiency and sensitivity measures, the same direction of findings was obtained.
As evidenced by the significant p-values and higher effect sizes in the p dimension and
the non-significant trends and lower effect sizes in the m dimension, the findings were
stronger in the p than in the m dimension. The same pattern of findings was obtained in
Experiment 3, apart from the statistical strength of findings being reversed between the m
and p dimensions, as expected.

147
Independent samples t-tests. A set of independent sample t-tests were
conducted to shed light on the inconsistencies between the m and p dimensions of reward.
More specifically, in the current experiment, the difference in subjective reward value
between the LR and HR target in the p dimension was speculated to be larger than the
difference in subjective reward value between the LR and HR target in the m dimension.
As expected, these t-tests demonstrated that the mean difference between the LRp and
HRp target was significantly larger than the mean difference between the LRm and
HRm target for the accuracy, inverse efficiency and sensitivity measures. Although the
findings for the response time measure did not reach statistical significance, they were in
the same direction. The same pattern of findings was obtained in Experiment 3, apart
from the statistical strength of findings being reversed between the m and p dimensions,
as expected.
Conclusion
In summary, similarly to Experiment 3, the behavioural assessment
conducted in the current experiment lends support to the theory that reward influences the
visual perception (i.e, early) information processing stage along the “visual perception-
overt behaviour” continuum. Furthermore, as did Experiment 3, the current experiment
demonstrated that differences in visual perception between targets differing in reward
value seem to be most obviously reflected by differences in accuracy, inverse efficiency
and sensitivity between those targets.
Moreover, the data from the current experiment corroborate the conclusion
drawn in Experiment 3, namely that the differences in statistical strength between the m
an p dimensions of reward found in Experiment 3 were due to the larger difference in

148
subjective reward value between the LR and HR targets in the m than in the p dimension.
Preliminary evidence for this conclusion was provided in Experiment 2 and further
evidence was obtained in the current experiment by reversing the size of the difference in
subjective reward value between the two dimensions. Thus, the findings from Experiment
3 combined with those of the current experiment lend support to the conclusion that, not
only is the reward value of visual targets and their consequent visual perception
determined by the magnitude of reward associated with them, but also by the subjective
value they represent for the observer.

149
General Discussion
Past research
In summary, it is widely agreed upon that a significant portion of human
and non-human animal behaviour is goal-directed, and that goal-directed behaviours are
mediated by their associated outcomes (Adams & Dickinson, 1981; Balleine & Dickinson,
1998; Colwill & Rescorla, 1985; de Wit, Kosaki, Balleine, & Dickinson, 2006).
Consequently, it is not surprising that rewarding outcomes, such as money and
consumables (e.g., food, drink), have reliably been shown to shape overt goal-directed
behaviours. Such overt behaviours are reported to include explicit choices (e.g., Green &
Myerson, 2004; Myerson & Green, 1995) body/limb movements (e.g., Opris et al., 2011)
and eye movements (e.g. Milstein & Dorris, 2007).
Oftentimes, a reward may be acquired by performing a specific behaviour
in response to a visual target. Under such circumstances, research has demonstrated that
the reward covertly influences the late neural stages of information processing along the
“visual-perception-overt behaviour” continuum. These stages include the motor
processing immediately preceding the performance of the overt behaviour needed to
acquire the reward associated with the perceived visual target.
Although not as well documented, research has also more recently
implicated reward in covertly influencing even the earliest stage of information
processing along the “visual-perception-overt behaviour” continuum, namely feature
visual perception (e.g., Kiss et al., 2009; Kristjansson et al., 2010). However,
performance in these studies is typically assessed using either a single overt behavioural
measure (e.g., inverse efficiency in Kristjansson et al., 2010) or a combination of overt

150
behavioural measures (e.g., response time accuracy and inverse efficiency in Kiss et al.,
2009) following key-press responses by observers. Therefore, given the well-documented
effects of reward on motor (i.e, late) processing, key-press data from these studies may
not necessarily be reflecting the effects of reward on visual (i.e., early) processing, in
whole or in part.
In summary, behavioural evidence suggesting that monetary rewards
affect feature visual perception includes slower response time, lower accuracy and worse
inverse efficiency for LR than HR targets. As determined by the current study, it is
important to acknowledge that certain behavioural measures (e.g., inverse efficiency,
accuracy and sensitivity) may be more likely to reflect the influence of reward on visual
perception than are others (e.g., response time). Therefore, depending upon the
measure(s) chosen in the given study, the conclusions drawn as to the effects of monetary
reward on visual perception (as opposed to motor processing) may be more or less
reliable. By the same token, the use of multiple behavioural measures as opposed to a
single behavioural measure is obviously preferable.
The experiment conducted by Kiss et al. (2009) was the first to provide
more compelling evidence of reward influences on feature visual perception. In this study,
not only did the researchers acquire behavioural measures, as previously mentioned (i.e.,
response time, accuracy and inverse efficiency), but also EEG measures (i.e., N2pc and
SPCN). Kiss et al. (2009) found that these ERP signatures varied as a function of reward.
Most notably, the N2pc, reliably associated with attentional selection of visual targets for
judgment and report (e.g., Eimer, 1996; Girelli & Luck, 1997; Woodman & Luck, 1999),
appeared later and was of a lower amplitude for LR than HR targets. Therefore Kiss et al.

151
(2009) concluded that LR visual targets are attended-to later than are HR visual targets.
In turn, given the independently documented effects of attention on feature visual
perception, these results indirectly suggested that reward influences feature visual
perception. Kiss et al. (2009) also found a significant positive correlation between the
N2pc and inverse efficiency, suggesting that inverse efficiency is a behavioural measure
that reflects the same (or part of the same) underlying process as the N2pc, namely visual
perception.
Current study
One of the major aims of the current study was to provide a more thorough
behavioural assessment than that offered by previous experiments of the differences in
feature visual perception between LR and HR targets. More specifically, in order to
either corroborate or challenge the conclusions drawn from previous research, display
duration was manipulated between visual search task trials in the current experiment. The
rationale behind this manipulation was that shortening the display duration of a visual
search trial containing a LR target would lead to a greater deterioration of behavioural
performance than shortening the display duration of a visual search trial containing a HR
target if, in fact, LR targets are visually perceived later than are HR targets. Results from
Experiment 3 of the current study were in line with these expectations and, thus,
corroborated the conclusions drawn by previous researchers.
A related aim of the current study was to provide, for the first time, an
assessment of the degree to which different behavioural measures may reflect visual (i.e.,
early) processing as opposed to motor (i.e., late) processing along the “visual perception-
ovet behaviour” continuum. Prior to this study, only inverse efficiency had empirically

152
been demonstrated to (at least partly) reflect visual processing, due to the positive
correlation found between that behavioural measure of performance and the timing of the
N2pc (Kiss et al., 2009). Therefore, in addition to the behavioural measures used by
previous studies (i.e., response time, accuracy and inverse efficiency), a measure of
sensitivity (d’), known to vary as a function of perceptual processing rather than motor
processing, was added to the current study. Furthermore, correlation analyses were
performed in Experiment 1 between all behavioural measures used in the current study in
order to assess the nature of the relationship between them. Via a combination of the
results obtained from each of the behavioural measures and the correlations between
them, the strongest measures of differences in feature visual processing between LR and
HR targets were determined to be inverse efficiency, accuracy and sensitivity. This
finding is important in guiding the choice of behavioural measures in future experiments
of this nature and in guiding the conclusions that are subsequently drawn in such
experiments.
The third major aim of the current study was to expand our knowledge of
reward influences on feature visual perception, not only in the magnitude (m) dimension
of reward, but also in the probability (p) dimension of reward. In order to accomplish this,
the visual search experiments in the current study were divided into two components. The
same experimental protocols were employed in both the m and p components and the
findings from each component were compared. The pattern of results obtained was
similar for both dimensions of reward in the current study, suggesting that the influence
of reward on feature visual perception was similar between them. Nonetheless, some
subtle differences were observed.

153
In turn, these subtle differences between reward dimensions seemed
noteworthy and led to the fourth, yet unexpected, aim of the current study. Namely,
determining whether the extent of differences in subjective reward value between LR and
HR targets affects feature visual perception. Given the apparently larger difference
between LR and HR mean responses for the accuracy, inverse efficiency and sensitivity
measures in the m than p dimension of reward found in Experiment 1, the difference in
subjective reward value between the LRm and HRm targets was hypothesized to be
larger than the difference in subjective reward value between the LRp and HRp targets.
In Experiment 2, a simple discounting procedure was conducted, which confirmed this
speculation. In light of this finding, the lower statistical strength of findings in the m
dimension as compared to the p dimension obtained in Experiment 1 was surprising.
However, following a series of comparisons of the range and variance between
participant responses in each dimension, it was determined that it was simply a larger
range and variance in the m than in the p dimension that led to this surprising
discrepancy. In contrast, in Experiment 3, where display duration was manipulated, the
range and variability between participant responses seemed to be similar in both reward
dimensions, perhaps due to the greater task demands. Therefore, as expected, both the
mean differences between LRm and HRm targets were larger than the mean differences
between LRp and HRp targets, and the statistical findings were stronger in the m than in
the p dimension.
In Experiment 4, the difference in subjective reward value between the LR
and HR targets was decreased for the m dimension and increased for the p dimension, as
compared to Experiment 3. As expected, the mean differences and strength of statistical

154
findings were reversed between dimensions, confirming that the different size of
subjective differences between LR and HR targets, rather than inherent differences
between the m and p dimensions, were impacting behavioural measures of feature visual
perception.
The reward-attention relationship
Attention and reward are two of the most studied factors affecting
behaviour. However, they have largely been investigated independently. Attention has
traditionally been studied in light of its effects on early stages of visual information
processing, whereas reward has traditionally been studied in light of later stages of visual
information processing along the “visual perception-overt behaviour” continuum.
More specifically, a substantial amount of research has investigated and
found the neural correlates of attention in visual areas such as V4 (e.g., Ghose &
Maunsell, 2008; McAdams & Maunsell, 1999; Reynolds, Chelazzi, & Desimone, 1999),
V2 (e.g., Fang, Boyaci, & Kersten, 2009; Reynolds et al., 1999), V1 (Kamitani & Tong,
2006; Wörgötter et al., 1998) and as early as in the LGN (e.g., McAlonan, Cavanaugh, &
Wurtz, 2008; McAlonan, Cavanaugh, & Wurtz, 2006). Conversely, research has
predominantly investigated and found the neural correlates of reward on later stages of
visual information processing, closer to mechanisms related to visual-motor
transformations (e.g., Schultz, Tremblay, & Hollerman, 2000), decision-making (e.g.,
Glimcher & Rustichini, 2004; Hampton & O'doherty, 2007) and overt behavior (e.g.,
Behrens, Woolrich, Walton, & Rushworth, 2007).
More recent studies have, however, begun to suggest an effect of reward
on early neural processing as well (e.g., Serences, 2008; Shuler & Bear, 2006). However,

155
other research has suggested that reward may modulate perceptual performance, not
directly, buy instead via the influence of reward on attention (e.g., Della Libera &
Chelazzi, 2006; Kiss et al. 2009). Furthermore, it has been suggested that many of these
experimental paradigms may confound the effects of reward with those of attention (e.g.,
Maunsell, 2004), seeing as the outcome of responding correctly in attention experiments
is often a reward (extrinsic of intrinsic). Thus, it is important to note that the reward-
attention relationship is subject to some debate.
Given that the N2pc is a known reflection of attentional processing, the
EEG findings from the Kiss et al. (2009) study (i.e., later N2pc and, hence, later
attentional selection for LR than HR targets), combined with the behavioural findings of
the current study that confirmed the conclusions drawn in that study, lend some support
to the hypothesis that reward acts via attention to affect early feature visual processing, at
least in part. By the same token, however, these studies do not allow for the conclusion
that, in addition to acting via attention, reward doesn’t additionally act on early visual
processing through more direct channels. This should be the subject of future research
(and is re-examined in the following section).
Future directions
Other behavioural measures of visual (early) processing. In the current
study, a number of behavioural measures were suggested to be reflective of reward
influences on feature visual perception between targets differing in reward value, some to
a greater and some to a lesser extent. Future research could expand on this repertoire of
behavioural measures.

156
For instance, a digit retention task study conducted by Bijleveld et al.
(2009) has suggested that reward value influences pupil dilation. More specifically, the
researchers found that pupil dilation was greater in HR (0.31mm) than in LR (0.22mm)
conditions in a 5-digit retention task. To date, a study investigating pupil dilation as a
function of reward value has yet to be conducted within the context of the feature visual
search task used in the current study. By comparing pupil dilation to the current study’s
behavioural measures and to the N2pc, within the same feature visual search experiment,
conclusions can be drawn as to whether (and to what extent) pupil dilation reflects reward
influences on feature visual perception in such a task.
Interestingly, Bijleveld et al. (2009) also found that both supraliminal and
subliminal rewards affected pupil dilation in the same way. This finding suggests that
conscious awareness may not be necessary for this process. In turn, this finding implies
that, in addition to reward acting on early visual processing via attention, reward value
may also act on early visual processing through an independent channel.
In addition, the current study could be repeated while simultaneously
recording fixational eye-movements (i.e., microsaccades) and comparing them across LR
and HR visual search trials. During periods of fixation between saccades, the eye is not
entirely immobile. Involuntary eye movements smaller than voluntary saccades are
produced. Microsaccades are the largest and fastest of the fixational eye movements
(Martinez-Conde et al., 2009), occurring involuntarily once or twice per second (Rolfs,
2009). They have been demonstrated not only in humans but also in other vertebrate
animals with a fovea. Microsaccades have been shown to be linked to several perceptual
phenomena, which makes them an interesting area of study. Among other functions,

157
research has demonstrated that microsaccades play a valuable role in maintaining target
visibility via the prevention of visual fading caused by retinal fatigue when fixating on a
stimulus for a prolonged period of time. They have also been shown to improve visual
acuity beyond the spatial resolution allowable by photoreceptors in the stationary retina.
Microsaccades are also correlated to the perception of illusory motion, perhaps
accounting for its occurrence.
Another feature of microsaccades, which makes them an interesting area
of study in the context of reward influences on the visual perception (i.e., early) stage of
information processing along the “visual perception-overt behaviour” continuum, is that
they share physiological and behavioural characteristics with saccades. The existence of
these shared characteristics between eye movement types is important because they
suggest a common oculomotor origin (Martinez-Conde et al., 2009). In turn, the existence
of a shared oculomotor origin between saccades and microsaccades is important because
saccades have repeatedly and reliably been linked to phenomena beyond the perceptual
realm. Most importantly, saccadic eye movements have been shown to be related to
cognitive constructs such as attention (Corbetta et al., 1998). Shared neural mechanisms
between the two eye-movement types therefore suggest that attention may also play a key
role in generating microsaccades. This postulation has also been corroborated by
behavioural findings.
Thus, repeating the current study while simultaneously recording
microsaccades and comparing them across LR and HR visual search trials would be
worthwhile. Given their postulated connection to attention, microsaccades may provide a
behavioural measure similar to that provided by the N2pc in the Kiss et al. (2009) study.

158
Moreover, if microsaccades are shown to be affected by reward in such a study, it would
lend further support to the theory that the influence exerted by reward on feature visual
perception is at least partially accomplished via attentional mediation.
Individual differences. A recent study (Hickey, Chelazzi & Theeuwes,
2010) demonstrated that reward priming in a shape (orientation) singleton visual search
task was dependent upon the personality of the observer. More specifically, participants
with reward-seeking personalities showed a greater reward priming effect than
participants with non-reward-seeking personalities.
This effect of personality would also be interesting to assess in the context
of colour singleton visual search (as used in the current study), to determine whether
results from orientation feature visual search generalize to colour feature visual search.
Furthermore, the display duration experiment form the current study could be repeated,
this time by dividing participants into reward-seeking and non-reward seeking personality
groups. By also adding EEG recordings to determine the timing of the N2pc, such an
experiment would provide more information as to whether such personality traits
modulate the reward influences observed in feature visual perception.
Conclusion
In closing, this study lends support to the claim that reward affects feature
visual perception, in addition to motor processing along the “visual perception-overt
behaviour” continuum. Furthermore, this study has determined that certain behavioural
measures of performance may be better suited to reflect differences in visual perception
between targets differing in reward value (i.e., accuracy, inverse efficiency and
sensitivity/d’). Moreover, the difference in subjective reward value between LR and HR

159
visual targets was shown to play a valuable role in our ability to detect reward-related
effects on visual perception. Although this research cannot solve the debate regarding the
existence or nature of the reward-attention relationship, it does lend support to the
hypothesis that reward, at least partially, acts via attention to influence feature singleton
visual perception.

160
References
Adams, C. D., Dickinson, A. (1981). Instrumental responding following reinforcer
devaluation. Quarterly Journal of Experimental Psychology B, 33, 109-121.
Balleine, B. W., Dickinson, A. (1998). Goal-directed instrumental action: Contingency
and incentive learning and their cortical substrates. Neuropharmacology, 37,
407-419.
Basso, M. A., Wurtz, R. H. (1998). Modulation of neuronal activity in superior colliculus
by changes in target probability. Journal of Neuroscience, 15, 7519 -7534.
Behrens, T., Woolrich, M., Walton, M., & Rushworth, M. (2007). Learning the value of
information in an uncertain world. Nature Neuroscience, 10, 1214-1221.
Bijleveld, E., Custers, R., & Aarts, H. (2009). The unconscious eye opener: Pupil dilation
reveals strategic recruitment of resources upon presentation of subliminal reward
cues. Psychological Science (Short Report), 3(2), 1-3.
Campos, M., Breznen, B., Bernheim, K., & Andersen, R. A. (2005). Supplementary
motor area encodes reward expectancy in eye-movement tasks. Journal of
Neurophysiology, 94, 1325-1335.
Cave, K. R., & Wolfe, J. M. (1990). Modeling the role of parallel processing in visual
search. Cognitive Psychology, 22, 225-271.
Churchland, M. M., Santhanam, G., & Shenoy, K. V. (2006a). Preparatory activity in
premotor and motor cortex reflects the speed of the upcoming reach. Journal of
Neurophysiology, 96, 3130-3146.

161
Colwill, R. M., Rescorla, R. A. (1985). Postconditioning devaluation of a reinforcer
affects instrumental responding. Journal of Experimental Psychology: Animal
Behavior Processes, 11, 120-132.
Corbetta, M., Akbudak, E., Conturo, T. E., Snyder, A. Z., Ollinger, J. M., Drury, H. A.,
Linenweber, M. R., Petersen, S. E., Raichle, M. E., Van Essen, D. C., and
Shulman, G. L. (1998). A common network of functional areas for attention and
eye movements. Neuron, 21, 761-773.
Dell'Acqua, R., Sessa, P., Jolicœur, P., & Robitaille, N. (2006). Spatial attention freezes
during the attentional blink. Psychophysiology, 43, 394-400.
Della Libera, C., & Chelazzi, L. (2006). Visual selective attention and the effects of
monetary rewards. Psychological Science, 17, 222-227.
Dickinson, A., de Wit, S. (2003). The interaction between discriminative stimuli and
outcomes during instrumental learning. Quarterly Journal of Experimental
Psychology B, 56, 127-139.
Ding, L., & Hikosaka, O. (2006). Temporal development of asymmetric reward-induced
bias in macaques. Journal of Neurophysiology, 97, 57-61.
Dorris, M. C., Munoz, D. P. (1998). Saccadic probability influences motor preparation
signals and time to saccadic initiation. Journal of Neuroscience, 18, 7015-7026.
Eimer, M. (1996). The N2pc component as an indicator of attentional selectivity.
Electroencephalography and Clinical Neurophysiology, 99, 225-234.
Eimer, M., & Kiss, M. (2008). Involuntary attentional capture is determined by task set:
Evidence from event-related brain potentials. Journal of Cognitive Neuroscience,
20, 1423-1433.

162
Epelboim, J., Steinman, R. M., Kowler, E., Pizlo, Z., Erkelens, C. J., & Collewijn, H.
(1997). Gaze-shift dynamics in two kinds of sequential looking tasks. Vision
Research, 37, 2597-2607.
Estle, S. J., Green, L., Myerson, J., & Holt, D. D. (2007). Discounting of monetary and
directly consumable rewards. Psychological Science, 18(1), 58-63.
Fang, F., Boyaci, H., & Kersten, D. (2009). Border ownership selectivity in human early
visual cortex and its modulation by attention. Journal of Neuroscience, 29, 460-
465.
Fecteau, J. H., Munoz, D. P. (2006). Salience, relevance, and firing: A priority map for
target selection. Trends Cognitive Science, 10, 382-390.
Found, A., & Müller, H. J. (1996). Searching for unknown feature targets on more than
one dimension: Investigating a “dimension-weighting” account. Perception &
Psychophysics, 58, 88-101.
Gardiner, T. W., and Nelson, R. J. (1992). Striatal neuronal activity during the initiation
of hand movements made in response to visual and vibratory cues. Experimental
Brain Research, 92, 15-26.
Ghose, G., & Maunsell, J. (2008). Spatial summation can explain the attentional
modulation of neuronal responses to multiple stimuli in area V4. Journal of
Neuroscience, 28, 5115-5126.
Girelli, M., & Luck, S. J. (1997). Are the same attentional mechanisms used to detect
visual search targets defined by color, orientation, and motion? Journal of
Cognitive Neuroscience, 9, 238-253.

163
Glimcher, P., & Rustichini, A. (2004). Neuroeconomics: The consilience of brain and
decision. Science, 306, 447-452.
Green, D. M., & Swets J. A. (1966). Signal Detection Theory and Psychophysics. New
York: Wiley.
Green, L., & Myerson, J. (2004). A discounting framework for choice with delayed and
probabilistic rewards. Psychological Bulletin,130(5), 769-792.
Guitton, D., Volle, M. (1987). Gaze control in humans: Eye-head coordination during
orienting movements to targets within and beyond the oculomotor range.
Journal of Neurophysiology, 58, 427-459.
Hampton, A., & O'doherty, J. (2007). Decoding the neural substrates of reward-related
decision making with functional MRI. Proclamations of the National Academy of
Sciences: USA, 104, 1377-1382.
Hayden, B. Y., Nair, A., McCoy, A. N., & Platt, M. L. (2008). Posterior cingulate cortex
mediates outcome-contingent allocation of behavior. Neuron, 60, 19-25.
Hickey, C., Chelazzi, L. & Theeuwes, J. (2010). Reward guides vision when it’s your
thing: Trait reward-seeking in reward-mediated visual priming. PLoS ONE,
5(11), e14087.
Hickey, C., McDonald, J. J., & Theeuwes, J. (2006). Electrophysiological evidence of the
capture of visual attention. Journal of Cognitive Neuroscience, 18, 604-613.
Hikosaka, O., Wurtz, R. H. (1983). Visual and oculomotor functions of monkey
substantia nigra pars reticulata III. Memory-contingent visual and saccade
responses. Journal of Neurophysiology, 49, 1268-1284.

164
Hopf, J. M., Luck, S. J., Girelli, M., Hagner, T., Mangun, G. R., & Scheich, H. (2000).
Neural sources of focused attention in visual search. Cerebral Cortex, 10, 1233-
1241.
Ivry, R. B., & Cohen, A. (1990). Discrimination of short and long range apparent motion
in visual search. Journal of Experimental Psychology: Human Perception &
Performance, 16, 317-331.
Julesz, B. (1984). A brief outline of the texton theory of human vision. Trends in
Neurosciences, 7, 41-45.
Kamitani, Y., & Tong, F. (2006). Decoding seen and attended motion directions from
activity in the human visual cortex. Current Biology, 16, 1096-1102.
Kawagoe, R., Takikawa, Y., & Hikosaka, O. (1998). Expectation of reward modulates
cognitive signals in the basal ganglia. Nature Neuroscience, 1, 411-416.
Kiss, M., Driver, J., & Eimer, M. (2009). Reward priority of visual target singletons
modulates ERP signatures of attentional selection. Psychological Science, 20(2),
245-251.
Kristjansson, A. (2006). Rapid learning in attention shifts: A review. Visual Cognition,
13, 324-362.
Kristjansson, A., & Campana, G. (2010). Where perception meets memory: A review of
repetition priming in visual search tasks. Attention, Perception, & Psychophysics,
72, 5-18.
Kristjansson, A., Sigurjonsdottir, O., & Driver, J. (2010). Fortune and reversals of fortune
in visual search: Reward contingencies for pop-out targets affect search

165
efficiency and target repetition effects. Attention, Perception, & Psychophysics,
72(5), 1229-1236.
Lauwereyns, J., Watanabe, K., Coe, B., & Hikosaka, O. (2002). A neural correlate of
response bias in monkey caudate nucleus. Nature, 418, 413-417.
Lee, H., & Assad, J. (2003). Putaminal activity for simple reactions or self- timed
movements. Journal of Neurophysiology, 89, 2528-2537.
Leon, M. I., & Shadlen, M. N. (1999). Effect of expected reward magnitude on the
response of neurons in the dorsolateral prefrontal cortex of the macaque. Neuron,
24, 290-291.
Martinez-Conde, S., Macknik, S. L., Troncoso, X. G., and Hubel, D. H. (2009).
Microsaccades: A neurophysiological analysis. Trends in Neurosciences,32(9),
463-475.
Maunsell, J. H. (2004). Neuronal representations of cognitive state: Reward or attention?
Trends in Cognitive Science, 8, 261-265.
Mazza, V., Turatto, M., Umilta, C., & Eimer, M. (2007). Attentional selection and
identification of visual objects are reflected by distinct electrophysiological
responses. Experimental Brain Research, 181, 531-536.
McAdams, C., & Maunsell, J. (1999). Effects of attention on orientation-tuning functions
of single neurons in macaque cortical area V4. Journal of Neuroscience, 19, 431-
441.
McAlonan, K., Cavanaugh, J., & Wurtz, R. H. (2008). Guarding the gateway to cortex
with attention in visual thalamus. Nature, 456, 391-394.

166
McAlonan, K., Cavanaugh, J., & Wurtz, R. H. (2006). Attentional modulation of
thalamic reticular neurons. Journal of Neuroscience, 26, 4444-4450.
McCollough, A. W., Machizawa, M. G., & Vogel, E. K. (2007). Electrophysiological
measures of maintaining representations in visual working memory. Cortex, 43,
77-90.
Milstein, D. M., & Dorris, M. C. (2007). The influence of expected value on saccadic
preparation. The Journal of Neuroscience, 27(18), 4810-4818.
Müller, H. J., Heller, D., & Ziegler, J. (1995). Visual search for singleton targets within
and across feature dimensions. Perception & Psychophysics, 57, 1-17.
Müller, H. J., & Krummenacher, J. (2006). Visual search and selective attention. Visual
Cognition, 14, 389-410.
Müller, H. J., Reimann, B., & Krummenacher, J. (2003). Visual search for singleton
feature targets across dimensions: Stimulus and expectancy driven effects in
dimensional weighting. Journal of Experimental Psychology: Human Perception
and Performance, 29(5), 1021-1035.
Myerson, J., & Green, L. (1995). Discounting of delayed rewards: Models of individual
choice. Journal of the Experimental Analysis of Behavior, 64, 263-276.
Opris, I., Lebedev, M., & Nelson, R. J. (2011). Motor planning under unpredictable
reward: Modulations of movement vigor and primate striatum activity. Frontiers
in Neuroscience: Decision Neuroscience, 5(61), 1-12.
Platt, M. L., & Glimcher, P. W. (1999). Neural correlates of decision variables in parietal
cortex. Nature, 400, 233-238.

167
Reynolds, J., Chelazzi, L. & Desimone, R. (1999). Competitive mechanisms subserve
attention in macaque areas V2 and V4. Journal of Neuroscience, 19, 1736-1753.
Rolfs, M. (2009). Microsaccades: Small steps on a long way. Vision Research (2009),
doi: 10.1016/j.visres.2009.08.010.
Romo, R., Scarnati, E., and Schultz, W. (1992). Role of primate basal ganglia and frontal
cortex in the internal generation of movements. Experimental Brain Research,
91, 385–395.
Schall, J. D. (2004). On building a bridge between brain and behavior. Annual Review of
Psychology, 55, 23-50.
Schubo, A., Schroger, E., Meinecke, C., & Müller, H. J. (2007). Attentional resources
and popout detection in search displays. Neuro Report, 18,1589-1593.
Schultz, W., Tremblay, L. & Hollerman, J. (2000). Reward processing in primate
orbitofrontal cortex and basal ganglia. Cerebral Cortex, 10, 272-284.
Serences, J. T. (2008). Value-based modulations in human visual cortex. Neuron, 60,
1169-1181.
Shadmehr, R., de Xivry, J. J. O., Xu-Wilson, M., & Shih, T-Y. (2010). Temporal
discounting of reward and the cost of time in motor control. The Journal of
Neuroscience, 30(31):10507-10516.
Shadmehr, R. (2010). Control of movements and temporal discounting of reward.
Current Opinion in Neurobiology, 20, 726–730.
Shuler, M., & Bear, M. (2006). Reward timing in the primary visual cortex. Science, 311,
1606-1609.

168
Somers, D. C., Dale, A. M., Seiffert, A. E., & Tootell, R. B. H. (1999). Functional MRI
reveals spatially specific attentional modulation in human primary visual cortex.
Proclamations of the National Academy of Sciences: USA, 96, 1663-1668.
Sparks, D. L. (1999). Conceptual issues related to the role of the superior colliculus in the
control of gaze. Current Opinion in Neurobiology, 9, 698-707.
Sugrue, L. P., Corrado, G. S., and Newsome, W. T. (2004). Matching behavior and the
representation of value in the parietal cortex. Science, 304, 1782–1787.
Takikawa, Y., Kawagoe, R., Nakahara, H. I. H., & Hikosaka, O. (2002). Modulation of
saccadic eye movements by predicted reward outcome. Experimental Brain
Research, 142, 284-291.
Takikawa, Y., Kawagoe, R., Itoh, H., Nakahara, H., & Hikosaka, O. (2002). Modulation
of saccadic eye movements by predicted reward outcome. Experimental Brain
Research, 142, 284-291.
Theeuwes, J. (1994). Bottom-up capture and attentional set: Selective search for colour
and visual abrupt onsets. Journal of Experimental Psychology: Human
Perception and Performance, 20, 799-806.
Theeuwes, J. (1992). Perceptual selectivity for colour and form. Perception &
Psychophysics, 51, 599-606.
Thompson, K. G., Bichot, N. P. (2005). A visual salience map in the primate frontal eye
field. Progress in Brain Research, 147, 251-262.
Treisman, A. (1988). Features and Objects: The fourteenth Bartlett memorial lecture.
Quarterly Journal of Experimental Psychology, 40A, 201-237.

169
Treisman, A. M., & Gelade, G. (1980). A feature-integration theory of attention.
Cognitive Psychology, 12, 97-136.
Trick, L. M., & Enns, J. T. (1998). Life-span changes in attention: The visual search task.
Cognitive Development, 13(3), 369-386.
Tsujimoto, S., Genovesio, A., & Wise, S. P. (2010). Evaluating self-generated decisions
in frontal pole cortex of monkeys. Nature Neuroscience, 13, 120-126.
Turner, R. S., & Anderson, M. E. (1997). Pallidal discharge related to the kinematics of
reaching movements in two dimensions. Journal of Neurophysiology, 77, 1051-
1074.
Turner, R. S., & Desmurget, M. (2010). Basal ganglia contributions to motor control: A
vigorous tutor. Current Opinion in Neurobiology, 20, 704-716.
Vogel, E. K., & Machizawa, M. G. (2004). Neural activity predicts individual differences
in visual working memory capacity. Nature, 428, 784-751.
Vuillermier, P., & Driver, J. (2007). Modulation of visual processing by attention and
emotion: Windows on causal interactions between human brain regions.
Philosophical Transactions of the Royal Society B, 362, 837–855.
Wang, Q., Cavanagh, P., & Green, M. (1994). Familiarity and pop-out in visual search.
Perception & Psychophysics, 56, 495-500.
Wang, D., Kristjansson, A., & Nakayama, K. (2005). Efficient visual search without top-
down or bottom-up guidance. Perception & Psychophysics, 67, 239-253.
de Wit, S., Kosaki, Y., Balleine, B. W., & Dickinson, A. (2006). Dorsomedial prefrontal
cortex resolves response conflict in rats. The Journal of Neuroscience, 26(19),
5224-5229.

170
Wolfe, J. M. (1994). Guided search 2.0: A revised model of visual search. Psychonomic
Bulletin & Review, 1(2), 202-238.
Wolfe, J. M., Cave, K. R., & Franzel, S. L. (1989). Guided search: An alternative to the
feature integration model for visual search. Journal of Experimental Psychology:
Human Perception & Performance, 15, 419-433.
Wolfe, J., & Horowitz, T. S. (2004). What attributes guide the deployment of visual
attention and how do they do it? Nature Reviews Neuroscience, 5, 1-7.
Woodman, G. F., & Luck, S. J. (1999). Electrophysiological measurement of rapid shifts
of attention during visual search. Nature, 400, 867-869.
Wörgötter, F., Suder, K., Yongqiang, Z., Kerscher, N., Eysel, U. T., & Funke, K. (1998).
State-dependent receptive-field restructuring in the visual cortex. Nature, 396,
165-168.

171
Appendix A
Consent Forms
(All Experiments)

172
Consent form used in Experiment 1 (Magnitude component):
Red target = HRm; Green target = LRm
________________________________________________________________
CONSENT FORM
FOR PARTICIPATION IN PSYCHOPHYSICAL RESEARCH I hereby state my agreement to participate in a Ph.D. thesis study being conducted by Angela Vavassis, under the supervision of Dr. Michael von Grünau, in the Concordia Vision Laboratory (Department of Psychology, Concordia University).
A. PURPOSE I have been informed that the purpose of this study is to assess visual search performance under different conditions.
B. PROCEDURES I have been made aware of the following methodological proceedings: I will be seated alone in front of a computer monitor in a dimly lit room.
I will perform a visual search for a target stimulus in a series of computer-
generated displays, for approximately 90 minutes. The target stimulus on each trial will randomly be either a red or a green diamond among grey distractor diamonds. There is an equal likelihood that the red or green target will appear on each trial. My task on each trial is to report whether the notch on the target is on the top or bottom, as accurately and as quickly as possible, using the pre-assigned keys.
- 1 -

173
In order to prevent eyestrain, I will be initiating all trials at my own pace by
pressing the space bar on the computer keyboard.
My head will be held in a stable position by a chin rest, but I will be able to move my head freely at any time between trials in the event that I experience any postural discomfort.
At the end of the experiment, I will receive 2 course credits simply for participating. In addition, one of the trials will be randomly selected and, if I responded accurately and before the beep on that trial, I will receive a monetary bonus: $10 for a red-target trial or $1 for a green-target trial.
C. CONDITIONS OF PARTICIPATION I understand the following:
My participation is purely voluntary and I can decline to participate without negative consequences.
I can withdraw my consent and discontinue my participation at any time during testing without negative consequences.
The data collected from this study may be published.
My participation in this study will be kept confidential
There is no hidden motive of which I have not been informed. I will be debriefed as to the research question and expected results after completing the experiment.
If I have any additional questions regarding my rights as a participant, I can contact the Psychology Department’s Human Ethics Committee at 848-2424 x 2202.
- 2 -

174
I HAVE CAREFULLY READ AND UNDERSTOOD ALL OF THE ABOVE AND I
FREELY CONSENT TO PARTICIPATE IN THIS RESEARCH.
NAME (please print): _______________________________________
SIGNATURE: ________________________________________
EXPERIMENTER’S SIGNATURE: ________________________________
DATE: ________________________________________
- 3 -

175
Consent form used in Experiment 1 (Magnitude component):
Green target = HRm; Red target = LRm
________________________________________________________________
CONSENT FORM
FOR PARTICIPATION IN PSYCHOPHYSICAL RESEARCH I hereby state my agreement to participate in a Ph.D. thesis study being conducted by Angela Vavassis, under the supervision of Dr. Michael von Grünau, in the Concordia Vision Laboratory (Department of Psychology, Concordia University).
A. PURPOSE I have been informed that the purpose of this study is to assess visual search performance under different conditions.
B. PROCEDURES I have been made aware of the following methodological proceedings: I will be seated alone in front of a computer monitor in a dimly lit room.
I will perform a visual search for a target stimulus in a series of computer-
generated displays, for approximately 90 minutes. The target stimulus on each trial will randomly be either a red or a green diamond among grey distractor diamonds. There is an equal likelihood that the red or green target will appear on each trial. My task on each trial is to report whether the notch on the target is on the top or bottom, as accurately and as quickly as possible, using the pre-assigned keys.
- 1 -

176
In order to prevent eyestrain, I will be initiating all trials at my own pace by pressing the space bar on the computer keyboard.
My head will be held in a stable position by a chin rest, but I will be able to move my head freely at any time between trials in the event that I experience any postural discomfort.
At the end of the experiment, I will receive 2 course credits simply for participating. In addition, one of the trials will be randomly selected and, if I responded accurately and before the beep on that trial, I will receive a monetary bonus: $10 for a green-target trial or $1 for a red-target trial.
C. CONDITIONS OF PARTICIPATION I understand the following:
My participation is purely voluntary and I can decline to participate without negative consequences.
I can withdraw my consent and discontinue my participation at any time during testing without negative consequences.
The data collected from this study may be published.
My participation in this study will be kept confidential
There is no hidden motive of which I have not been informed. I will be debriefed as to the research question and expected results after completing the experiment.
If I have any additional questions regarding my rights as a participant, I can contact the Psychology Department’s Human Ethics Committee at 848-2424 x 2202.
- 2 -

177
I HAVE CAREFULLY READ AND UNDERSTOOD ALL OF THE ABOVE AND I
FREELY CONSENT TO PARTICIPATE IN THIS RESEARCH.
NAME (please print): _______________________________________
SIGNATURE: ________________________________________
EXPERIMENTER’S SIGNATURE: ________________________________
DATE: ________________________________________
- 3 -

178
Consent form used in Experiment 1 (Probability component):
Red target = HRp; Green target = LRp
________________________________________________________________
CONSENT FORM
FOR PARTICIPATION IN PSYCHOPHYSICAL RESEARCH I hereby state my agreement to participate in a Ph.D. thesis study being conducted by Angela Vavassis, under the supervision of Dr. Michael von Grünau, in the Concordia Vision Laboratory (Department of Psychology, Concordia University).
A. PURPOSE I have been informed that the purpose of this study is to assess visual search performance under different conditions.
B. PROCEDURES I have been made aware of the following methodological proceedings: I will be seated alone in front of a computer monitor in a dimly lit room.
I will perform a visual search for a target stimulus in a series of computer-
generated displays, for approximately 90 minutes. The target stimulus on each trial will randomly be either a red or a green diamond among grey distractor diamonds. There is an equal likelihood that the red or green target will appear on each trial. My task on each trial is to report whether the notch on the target is on the top or bottom, as accurately and as quickly as possible, using the pre-assigned keys.
- 1 -

179
In order to prevent eyestrain, I will be initiating all trials at my own pace by pressing the space bar on the computer keyboard.
My head will be held in a stable position by a chin rest, but I will be able to move my head freely at any time between trials in the event that I experience any postural discomfort.
At the end of the experiment, I will receive 2 course credits simply for participating. In addition, one of the trials will be randomly selected and, if I responded accurately and before the beep on that trial, I will receive a monetary bonus: $10 for sure for a red-target trial or $10 with a 10% chance for a green-target trial.
C. CONDITIONS OF PARTICIPATION I understand the following:
My participation is purely voluntary and I can decline to participate without negative consequences.
I can withdraw my consent and discontinue my participation at any time during testing without negative consequences.
The data collected from this study may be published.
My participation in this study will be kept confidential
There is no hidden motive of which I have not been informed. I will be debriefed as to the research question and expected results after completing the experiment.
If I have any additional questions regarding my rights as a participant, I can contact the Psychology Department’s Human Ethics Committee at 848-2424 x 2202.
- 2 -

180
I HAVE CAREFULLY READ AND UNDERSTOOD ALL OF THE ABOVE AND I
FREELY CONSENT TO PARTICIPATE IN THIS RESEARCH.
NAME (please print): _______________________________________
SIGNATURE: ________________________________________
EXPERIMENTER’S SIGNATURE: ________________________________
DATE: ________________________________________
- 3 -

181
Consent form used in Experiment 1 (Probability component):
Green target = HRp; Red target = LRp
________________________________________________________________
CONSENT FORM
FOR PARTICIPATION IN PSYCHOPHYSICAL RESEARCH I hereby state my agreement to participate in a Ph.D. thesis study being conducted by Angela Vavassis, under the supervision of Dr. Michael von Grünau, in the Concordia Vision Laboratory (Department of Psychology, Concordia University).
A. PURPOSE I have been informed that the purpose of this study is to assess visual search performance under different conditions.
B. PROCEDURES I have been made aware of the following methodological proceedings: I will be seated alone in front of a computer monitor in a dimly lit room.
I will perform a visual search for a target stimulus in a series of computer-
generated displays, for approximately 90 minutes. The target stimulus on each trial will randomly be either a red or a green diamond among grey distractor diamonds. There is an equal likelihood that the red or green target will appear on each trial. My task on each trial is to report whether the notch on the target is on the top or bottom, as accurately and as quickly as possible, using the pre-assigned keys.
- 1 -

182
In order to prevent eyestrain, I will be initiating all trials at my own pace by pressing the space bar on the computer keyboard.
My head will be held in a stable position by a chin rest, but I will be able to move my head freely at any time between trials in the event that I experience any postural discomfort.
At the end of the experiment, I will receive 2 course credits simply for participating. In addition, one of the trials will be randomly selected and, if I responded accurately and before the beep on that trial, I will receive a monetary bonus: $10 for sure for a green-target trial or $10 with a 10% chance for a red-target trial.
C. CONDITIONS OF PARTICIPATION I understand the following:
My participation is purely voluntary and I can decline to participate without negative consequences.
I can withdraw my consent and discontinue my participation at any time during testing without negative consequences.
The data collected from this study may be published.
My participation in this study will be kept confidential
There is no hidden motive of which I have not been informed. I will be debriefed as to the research question and expected results after completing the experiment.
If I have any additional questions regarding my rights as a participant, I can contact the Psychology Department’s Human Ethics Committee at 848-2424 x 2202.
- 2 -

183
I HAVE CAREFULLY READ AND UNDERSTOOD ALL OF THE ABOVE AND I
FREELY CONSENT TO PARTICIPATE IN THIS RESEARCH.
NAME (please print): _______________________________________
SIGNATURE: ________________________________________
EXPERIMENTER’S SIGNATURE: ________________________________
DATE: ________________________________________
- 3 -

184
Consent form used in Experiment 2 and Experiment 4B (discounting task component)
________________________________________________________________
CONSENT FORM
FOR PARTICIPATION IN PSYCHOPHYSICAL RESEARCH I hereby state my agreement to participate in a Ph.D. thesis study being conducted by Angela Vavassis, under the supervision of Dr. Michael von Grünau, in the Concordia Vision Laboratory (Department of Psychology, Concordia University).
A. PURPOSE I have been informed that the purpose of this study is to assess some properties of decision-making with monetary rewards.
B. PROCEDURES I have been made aware of the following methodological proceedings: I will complete a brief questionnaire in the presence and under the instruction
of the experimenter.
The questionnaire will be composed of a series of questions containing choices between 2 monetary amounts. My task is to circle the monetary amount that I prefer on each question the experiment asks me to read silently.
At the end of the experiment, one of the questions I responded to will be randomly selected. I will then receive the associated certain reward or have a 10% chance of receiving the associated probabilistic reward (depending on the choice I made on that question).
- 1 -

185
C. CONDITIONS OF PARTICIPATION I understand the following:
My participation is purely voluntary and I can decline to participate without negative consequences.
I can withdraw my consent and discontinue my participation at any time during testing without negative consequences.
The data collected from this study may be published.
My participation in this study will be kept confidential
There is no hidden motive of which I have not been informed. I will be debriefed as to the research question and expected results after completing the experiment.
If I have any additional questions regarding my rights as a participant, I can contact the Psychology Department’s Human Ethics Committee at 848-2424 x 2202.
- 2 -

186
I HAVE CAREFULLY READ AND UNDERSTOOD ALL OF THE ABOVE AND I
FREELY CONSENT TO PARTICIPATE IN THIS RESEARCH.
NAME (please print): _______________________________________
SIGNATURE: ________________________________________
EXPERIMENTER’S SIGNATURE: ________________________________
DATE: ________________________________________
- 3 -

187
Consent form used in Experiments 3A and 4A (Magnitude):
Red target = HRm; Green target = LRm
________________________________________________________________
CONSENT FORM
FOR PARTICIPATION IN PSYCHOPHYSICAL RESEARCH
I hereby state my agreement to participate in a Ph.D. thesis study being conducted by Angela Vavassis, under the supervision of Dr. Michael von Grünau, in the Concordia Vision Laboratory (Department of Psychology, Concordia University).
A. PURPOSE I have been informed that the purpose of this study is to assess visual search performance under different conditions.
B. PROCEDURES I have been made aware of the following methodological proceedings: I will be seated alone in front of a computer monitor in a dimly lit room.
I will perform a visual search for a target stimulus in a series of computer-
generated displays, for approximately 90 minutes. The presentation duration of the display will vary randomly from trial to trial. The target stimulus on each trial will randomly be either a red or a green diamond among grey distractor diamonds. There is an equal likelihood that the red or green target will appear on each trial. My task on each trial is to report whether the notch on the target is on the top or bottom, as accurately and as quickly as possible, using the pre-assigned keys.
- 1 -

188
In order to prevent eyestrain, I will be initiating all trials at my own pace by pressing the space bar on the computer keyboard.
My head will be held in a stable position by a chin rest, but I will be able to
move my head freely at any time between trials in the event that I experience any postural discomfort.
At the end of the experiment, I will receive 2 course credits simply for participating. In addition, one of the trials will be randomly selected and, if I responded accurately and before the beep on that trial, I will receive a monetary bonus: $10 for a red-target trial or $1 for a green-target trial.
C. CONDITIONS OF PARTICIPATION I understand the following:
My participation is purely voluntary and I can decline to participate without negative consequences.
I can withdraw my consent and discontinue my participation at any time during testing without negative consequences.
The data collected from this study may be published.
My participation in this study will be kept confidential
There is no hidden motive of which I have not been informed. I will be debriefed as to the research question and expected results after completing the experiment.
If I have any additional questions regarding my rights as a participant, I can contact the Psychology Department’s Human Ethics Committee at 848-2424 x 2202.
- 2 -

189
I HAVE CAREFULLY READ AND UNDERSTOOD ALL OF THE ABOVE AND I
FREELY CONSENT TO PARTICIPATE IN THIS RESEARCH.
NAME (please print): _______________________________________
SIGNATURE: ________________________________________
EXPERIMENTER’S SIGNATURE: ________________________________
DATE: ________________________________________
- 3 -

190
Consent form used in Experiments 3A and 4A (Magnitude):
Green target = HRm; Red target = LRm
________________________________________________________________
CONSENT FORM
FOR PARTICIPATION IN PSYCHOPHYSICAL RESEARCH
I hereby state my agreement to participate in a Ph.D. thesis study being conducted by Angela Vavassis, under the supervision of Dr. Michael von Grünau, in the Concordia Vision Laboratory (Department of Psychology, Concordia University).
A. PURPOSE I have been informed that the purpose of this study is to assess visual search performance under different conditions.
B. PROCEDURES I have been made aware of the following methodological proceedings: I will be seated alone in front of a computer monitor in a dimly lit room.
I will perform a visual search for a target stimulus in a series of computer-
generated displays, for approximately 90 minutes. The presentation duration of the display will vary randomly from trial to trial. The target stimulus on each trial will randomly be either a red or a green diamond among grey distractor diamonds. There is an equal likelihood that the red or green target will appear on each trial. My task on each trial is to report whether the notch on the target is on the top or bottom, as accurately and as quickly as possible, using the pre-assigned keys.
- 1 -

191
In order to prevent eyestrain, I will be initiating all trials at my own pace by pressing the space bar on the computer keyboard.
My head will be held in a stable position by a chin rest, but I will be able to
move my head freely at any time between trials in the event that I experience any postural discomfort.
At the end of the experiment, I will receive 2 course credits simply for participating. In addition, one of the trials will be randomly selected and, if I responded accurately and before the beep on that trial, I will receive a monetary bonus: $10 for a green-target trial or $1 for a red-target trial.
C. CONDITIONS OF PARTICIPATION I understand the following:
My participation is purely voluntary and I can decline to participate without negative consequences.
I can withdraw my consent and discontinue my participation at any time during testing without negative consequences.
The data collected from this study may be published.
My participation in this study will be kept confidential
There is no hidden motive of which I have not been informed. I will be debriefed as to the research question and expected results after completing the experiment.
If I have any additional questions regarding my rights as a participant, I can contact the Psychology Department’s Human Ethics Committee at 848-2424 x 2202.
- 2 -

192
I HAVE CAREFULLY READ AND UNDERSTOOD ALL OF THE ABOVE AND I
FREELY CONSENT TO PARTICIPATE IN THIS RESEARCH.
NAME (please print): _______________________________________
SIGNATURE: ________________________________________
EXPERIMENTER’S SIGNATURE: ________________________________
DATE: ________________________________________
- 3 -

193
Consent form used in Experiments 3B and 4B (Probability):
Red target = HRp; Green target = LRp
________________________________________________________________
CONSENT FORM
FOR PARTICIPATION IN PSYCHOPHYSICAL RESEARCH
I hereby state my agreement to participate in a Ph.D. thesis study being conducted by Angela Vavassis, under the supervision of Dr. Michael von Grünau, in the Concordia Vision Laboratory (Department of Psychology, Concordia University).
A. PURPOSE I have been informed that the purpose of this study is to assess visual search performance under different conditions.
B. PROCEDURES I have been made aware of the following methodological proceedings: I will be seated alone in front of a computer monitor in a dimly lit room.
I will perform a visual search for a target stimulus in a series of computer-
generated displays, for approximately 90 minutes. The presentation duration of the display will vary randomly from trial to trial. The target stimulus on each trial will randomly be either a red or a green diamond among grey distractor diamonds. There is an equal likelihood that the red or green target will appear on each trial. My task on each trial is to report whether the notch on the target is on the top or bottom, as accurately and as quickly as possible, using the pre-assigned keys.
- 1 -

194
In order to prevent eyestrain, I will be initiating all trials at my own pace by pressing the space bar on the computer keyboard.
My head will be held in a stable position by a chin rest, but I will be able to
move my head freely at any time between trials in the event that I experience any postural discomfort.
At the end of the experiment, I will receive 2 course credits simply for participating. In addition, one of the trials will be randomly selected and, if I responded accurately and before the beep on that trial, I will receive a monetary bonus: $10 for sure for a red-target trial or $10 with a 10% chance for a green-target trial.
C. CONDITIONS OF PARTICIPATION I understand the following:
My participation is purely voluntary and I can decline to participate without negative consequences.
I can withdraw my consent and discontinue my participation at any time during testing without negative consequences.
The data collected from this study may be published.
My participation in this study will be kept confidential
There is no hidden motive of which I have not been informed. I will be debriefed as to the research question and expected results after completing the experiment.
If I have any additional questions regarding my rights as a participant, I can contact the Psychology Department’s Human Ethics Committee at 848-2424 x 2202.
- 2 -

195
I HAVE CAREFULLY READ AND UNDERSTOOD ALL OF THE ABOVE AND I
FREELY CONSENT TO PARTICIPATE IN THIS RESEARCH.
NAME (please print): _______________________________________
SIGNATURE: ________________________________________
EXPERIMENTER’S SIGNATURE: ________________________________
DATE: ________________________________________
- 3 -

196
Consent form used in Experiments 3B and 4B (Probability):
Green target = HRp; Red target = LRp
________________________________________________________________
CONSENT FORM FOR PARTICIPATION IN PSYCHOPHYSICAL RESEARCH
I hereby state my agreement to participate in a Ph.D. thesis study being conducted by Angela Vavassis, under the supervision of Dr. Michael von Grünau, in the Concordia Vision Laboratory (Department of Psychology, Concordia University).
A. PURPOSE I have been informed that the purpose of this study is to assess visual search performance under different conditions.
B. PROCEDURES I have been made aware of the following methodological proceedings: I will be seated alone in front of a computer monitor in a dimly lit room.
I will perform a visual search for a target stimulus in a series of computer-
generated displays, for approximately 90 minutes. The presentation duration of the display will vary randomly from trial to trial. The target stimulus on each trial will randomly be either a red or a green diamond among grey distractor diamonds. There is an equal likelihood that the red or green target will appear on each trial. My task on each trial is to report whether the notch on the target is on the top or bottom, as accurately and as quickly as possible, using the pre-assigned keys.
- 1 -

197
In order to prevent eyestrain, I will be initiating all trials at my own pace by pressing the space bar on the computer keyboard.
My head will be held in a stable position by a chin rest, but I will be able to
move my head freely at any time between trials in the event that I experience any postural discomfort.
At the end of the experiment, I will receive 2 course credits simply for participating. In addition, one of the trials will be randomly selected and, if I responded accurately and before the beep on that trial, I will receive a monetary bonus: $10 for sure for a green-target trial or $10 with a 10% chance for a red-target trial.
C. CONDITIONS OF PARTICIPATION I understand the following:
My participation is purely voluntary and I can decline to participate without negative consequences.
I can withdraw my consent and discontinue my participation at any time during testing without negative consequences.
The data collected from this study may be published.
My participation in this study will be kept confidential
There is no hidden motive of which I have not been informed. I will be debriefed as to the research question and expected results after completing the experiment.
If I have any additional questions regarding my rights as a participant, I can contact the Psychology Department’s Human Ethics Committee at 848-2424 x 2202.
- 2 -

198
I HAVE CAREFULLY READ AND UNDERSTOOD ALL OF THE ABOVE AND I
FREELY CONSENT TO PARTICIPATE IN THIS RESEARCH.
NAME (please print): _______________________________________
SIGNATURE: ________________________________________
EXPERIMENTER’S SIGNATURE: ________________________________
DATE: ________________________________________
- 3 -

199
Appendix B
Source Tables
(All Experiments)

200
Table B1
Paired Samples t-tests for the Magnitude Dimension of Reward in Experiment 1
________________________________________________________________ Target Reward Magnitude _______________________ LRm HRm t df p ________________________________________________________________ (n = 8) Response Time 0.630 0.627 0.509 7 0.626 (0.030) (0.030) Accuracy 92.5 97.3 2.190 7 0.065 (2.7) (1.1) Inverse Efficiency 0.661 0.643 1.408 7 0.202 (0.042) (0.035) Sensitivity (d’) 2.812 3.212 2.309* 7 0.054 (0.258) (0.223) ________________________________________________________________ Note. Standard Errors appear in parentheses below means. * p < .05
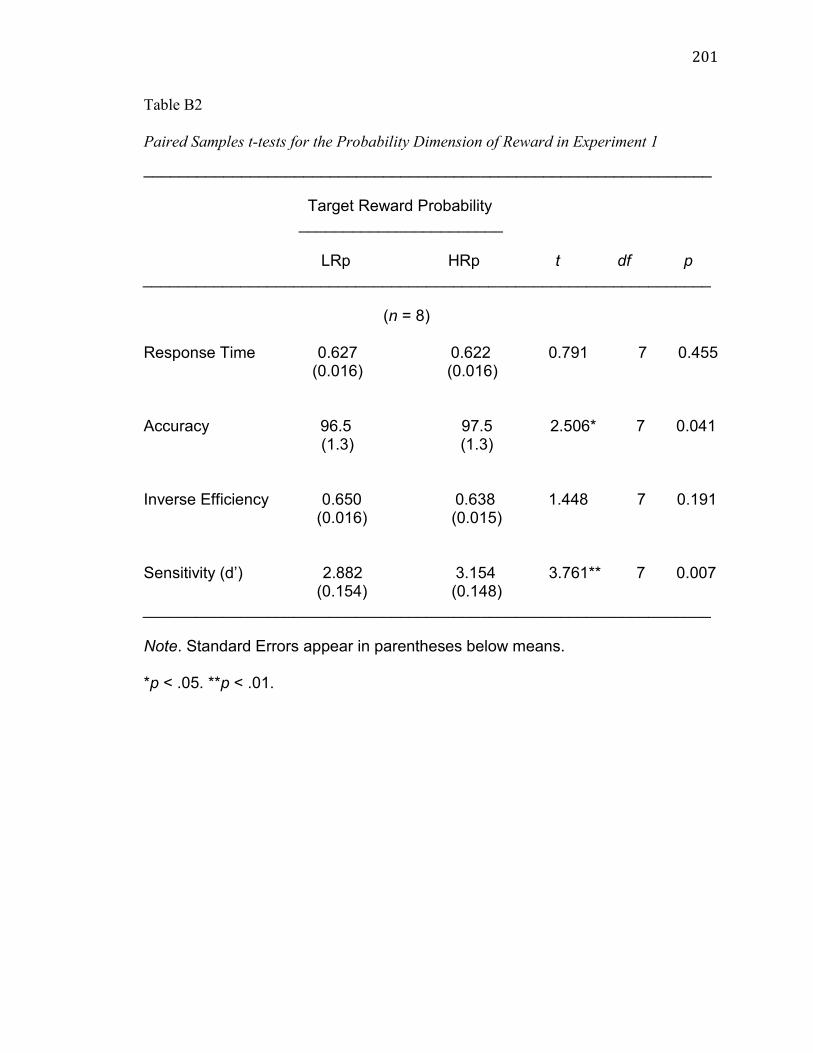
201
Table B2
Paired Samples t-tests for the Probability Dimension of Reward in Experiment 1
________________________________________________________________ Target Reward Probability _______________________ LRp HRp t df p ________________________________________________________________ (n = 8) Response Time 0.627 0.622 0.791 7 0.455 (0.016) (0.016) Accuracy 96.5 97.5 2.506* 7 0.041 (1.3) (1.3) Inverse Efficiency 0.650 0.638 1.448 7 0.191 (0.016) (0.015) Sensitivity (d’) 2.882 3.154 3.761** 7 0.007 (0.154) (0.148) ________________________________________________________________ Note. Standard Errors appear in parentheses below means. *p < .05. **p < .01.

202
Table B3
One-way ANOVAs for non-significant differences between blocks in Experiment 1
________________________________________________________________
Measure F df p 2
________________________________________________________________
Magnitude Dimension
Response Time 0.399 3 0.755 0.054 (0.003) 21 Inverse Efficiency 2.099 3 0.131 0.231 (0.004) 21
Probability Dimension
Response Time 0.257 3 0.855 0.035 (0.003) 21 Inverse Efficiency 2.560 3 0.082 0.268 (0.003) 21 ________________________________________________________________ Note. Standard Errors appear in parentheses below means.

203
Table B4
Independent Samples t-tests in Experiment 1: Mean Differences Between the Low-
Reward (LR) and High-Reward (HR) Targets in the Magnitude (m) and Probability (p)
Dimensions of Reward
________________________________________________________________ m p t df p ________________________________________________________________ (n = 8) Response Time 0.003 0.005 -0.512 7 0.624 (0.005) (0.007) Accuracy -4.8 -1.0 -1.719 7 0.129 (2.2) (0.4) Inverse Efficiency 0.018 0.012 0.648 7 0.538 (0.013) (0.008) Sensitivity (d’) -0.400 -0.272 -0.831 7 0.433 (0.173) (0.072) ________________________________________________________________ Note. Standard Errors appear in parentheses below means.

204
Table B5
Range and Variance scores in Experiment 1
________________________________________________________________ Magnitude Dimension Probability Dimension ____________________ ____________________ LRm HRm LRp HRp ________________________________________________________________
Response time Range 0.255 0.270 0.141 0.128 Variance 0.008 0.007 0.002 0.002 ________________________________________________________________
Accuracy Range 16.8 10.1 11.3 11.6 Variance 0.6 0.1 0.1 0.1 ________________________________________________________________
Inverse Efficiency
Range 0.314 0.282 0.156 0.136 Variance 0.014 0.010 0.002 0.002 ________________________________________________________________
Sensitivity (d’) Range 2.407 1.936 1.254 1.433 Variance 0.533 0.400 0.191 0.176 ________________________________________________________________

205
Table B6
Pearson Product-Moment Correlations Between Behavioural Measures of Performance
for the Magnitude Dimension of Reward in Experiment 1
________________________________________________________________ Measure 1 2 3 4 ________________________________________________________________ (n = 8) 1. Response Time ___ -0.019 0 .943** -0.494 2. Accuracy ___ -0.244 0.712** 3. Inverse Efficiency ___ -0.719** 4. Sensitivity (d’) ___ ________________________________________________________________ ** p < 0.01.

206
Table B7
Pearson Product-Moment Correlations Between Behavioural Measures of Performance
for the Probability Dimension of Reward in Experiment 1
________________________________________________________________ Measure 1 2 3 4 ________________________________________________________________ (n = 8) 1. Response Time ___ 0.297 0.855** -0.060 2. Accuracy ___ -0.241 0.878** 3. Inverse Efficiency ___ -0.538* 4. Sensitivity (d’) ___ ________________________________________________________________ * p < 0.05. ** p < 0.01.

207
Table B8
One-Way Analysis of Variance in Experiment 2
________________________________________________________________ Source df F p ________________________________________________________________
Between Subjects
Target 2 3171.712*** 0.000 45 (0.102) ________________________________________________________________ Note. Values enclosed in parentheses represent mean square errors. ***p < 0.001.

208
Table B9
Bonferroni Pairwise Comparisons in Experiment 2
________________________________________________________________
Comparison Mean Difference(i-j) p
________________________________________________________________
LRmi versus LRpj -4.09*** 0.000 (0.113) LRmi versus HRm/HRpj -9.00*** 0.000 (0.113)
LRpi versus HRm/HRpj -4.91*** 0.000 (0.113) ________________________________________________________________
Note. Standard Errors appear in parentheses below means.
*** p < 0.001

209
Table B10
Repeated Measures Analysis of Variance for Response Time in Experiment 3A
________________________________________________________________
Source df F 2 p ________________________________________________________________ Within Subjects Reward Magnitude 1 5.123 0.423 0.058 Error 7 (0.000) Display Duration 1 14.619** 0.676 0.007 Error 7 (0.001) Reward Magnitude x Display Duration 1 0.001 0.000 0.973 Error 7 (0.001) ________________________________________________________________ Note. Mean Square Errors appear in parentheses below means. **p < 0.01.

210
Table B11
Repeated Measures Analysis of Variance for Accuracy in Experiment 3A
________________________________________________________________
Source df F 2 p ________________________________________________________________ Within Subjects Reward Magnitude 1 11.092* 0.613 0.013 Error 7 (0.003) Display Duration 1 64.582** 0.902 0.000 Error 7 (0.004) Reward Magnitude x Display Duration 1 8.052* 0.535 0.025 Error 7 (0.003) ________________________________________________________________ Note. Mean Square Errors appear in parentheses below means. *p < 0.05. **p < 0.01.

211
Table B12
Bonferroni Pairwise Comparisons for Accuracy on the Significant Target Reward
Magnitude x Display Duration Interaction in Experiment 3A
________________________________________________________________
Target Reward Magnitude _____________________________________________ LRm HRm
Comparison Mean Difference(i-j) p Mean Difference(i-j) p
________________________________________________________________
0.150si versus 0.035sj 22.5** 0.000 9.6* 0.016 (3.0) (3.0) ________________________________________________________________
Note. Standard Errors appear in parentheses below means.
*p < 0.05. **p < 0.01.

212
Table B13
Repeated Measures Analysis of Variance for Inverse Efficiency in Experiment 3A
________________________________________________________________
Source df F 2 p ________________________________________________________________ Within Subjects Reward Magnitude 1 13.970** 0.666 0.007 Error 7 (0.003) Display Duration 1 59.023** 0.894 0.000 Error 7 (0.003) Reward Magnitude x Display Duration 1 5.417* 0.436 0.053 Error 7 (0.004) ________________________________________________________________ Note. Mean Square Errors appear in parentheses below means. *p < 0.05. **p < 0.01.

213
Table B14
Bonferroni Pairwise Comparisons for Inverse Efficiency on the Significant Target
Reward Magnitude x Display Duration Interaction in Experiment 3A
________________________________________________________________
Target Reward Magnitude _____________________________________________ LRm HRm
Comparison Mean Difference(i-j) p Mean Difference(i-j) p
________________________________________________________________
0.150si versus 0.035sj -0.205** 0.001 -0.107** 0.003 (0.034) (0.024) ________________________________________________________________
Note. Standard Errors appear in parentheses below means.
**p < 0.01.

214
Table B15
Repeated Measures Analysis of Variance for Sensitivity in Experiment 3A
________________________________________________________________
Source df F 2 p ________________________________________________________________ Within Subjects Reward Magnitude 1 5.424* 0.437 0.053 Error 7 (0.471) Display Duration 1 8.836* 0.558 0.021 Error 7 (0.687) Reward Magnitude x Display Duration 1 8.732* 0.555 0.021 Error 7 (0.013) ________________________________________________________________ Note. Mean Square Errors appear in parentheses below means. *p < 0.05.

215
Table B16
Bonferroni Pairwise Comparisons for Sensitivity on the Significant Target Reward
Magnitude x Display Duration Interaction in Experiment 3A
________________________________________________________________
Target Reward Magnitude _____________________________________________ LRm HRm
Comparison Mean Difference(i-j) p Mean Difference(i-j) p
________________________________________________________________
0.150si versus 0.035sj 0.992** 0.011 0.750* 0.041 (0.291) (0.301) ________________________________________________________________
Note. Standard Errors appear in parentheses below means.
*p < 0.05. **p < 0.01.
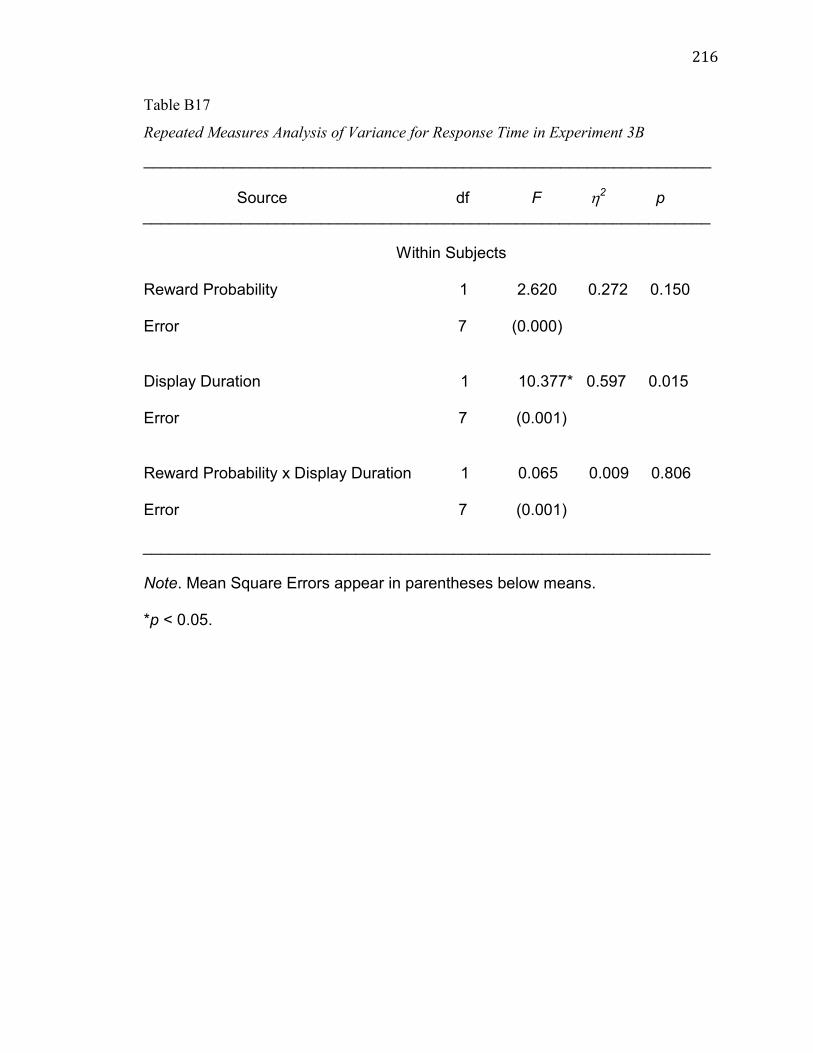
216
Table B17
Repeated Measures Analysis of Variance for Response Time in Experiment 3B
________________________________________________________________
Source df F 2 p ________________________________________________________________ Within Subjects Reward Probability 1 2.620 0.272 0.150 Error 7 (0.000) Display Duration 1 10.377* 0.597 0.015 Error 7 (0.001) Reward Probability x Display Duration 1 0.065 0.009 0.806 Error 7 (0.001) ________________________________________________________________ Note. Mean Square Errors appear in parentheses below means. *p < 0.05.

217
Table B18
Repeated Measures Analysis of Variance for Accuracy in Experiment 3B
________________________________________________________________
Source df F 2 p ________________________________________________________________ Within Subjects Reward Probability 1 4.125 0.371 0.082 Error 7 (0.004) Display Duration 1 82.867** 0.922 0.000 Error 7 (0.002) Reward Probability x Display Duration 1 3.736 0.348 0.095 Error 7 (0.004) ________________________________________________________________ Note. Mean Square Errors appear in parentheses below means. **p < 0.01.

218
Table B19
Repeated Measures Analysis of Variance for Inverse Efficiency in Experiment 3B
________________________________________________________________
Source df F 2 p ________________________________________________________________ Within Subjects Reward Probability 1 9.926* 0.586 0.016 Error 7 (0.003) Display Duration 1 40.459** 0.853 0.000 Error 7 (0.003) Reward Probability x Display Duration 1 3.105 0.307 0.121 Error 7 (0.004) ________________________________________________________________ Note. Mean Square Errors appear in parentheses below means. *p < 0.05. **p < 0.01.

219
Table B20
Repeated Measures Analysis of Variance for Sensitivity in Experiment 3B
________________________________________________________________
Source df F 2 p ________________________________________________________________ Within Subjects Reward Probability 1 2.316 0.249 0.172 Error 7 (0.438) Display Duration 1 6.725* 0.490 0.036 Error 7 (0.638) Reward Probability x Display Duration 1 0.023 0.003 0.884 Error 7 (0.054) ________________________________________________________________ Note. Mean Square Errors appear in parentheses below means. *p < 0.05.

220
Table B21
Independent Samples t-tests in Experiment 3
________________________________________________________________ Reward Dimension _______________________ m p t df p ________________________________________________________________ (n = 8) Response Time 0.017 0.012 0.579 14 0.581 (0.007) (0.008) Accuracy -6.4 -4.4 -3.433* 14 0.011 (1.9) (2.2) Inverse Efficiency 0.068 0.049 2.673* 14 0.032 (0.018) (0.015) Sensitivity (d’) -0.565 -0.356 -2.294* 14 0.056 (0.243) (0.234) ________________________________________________________________ Note. Standard Errors appear in parentheses below means. *p < 0.05.

221
Table B22
Repeated Measures Analysis of Variance for Response Time in Experiment 4A
________________________________________________________________
Source df F 2 p ________________________________________________________________ Within Subjects Reward Magnitude 1 2.628 0.273 0.149 Error 7 (0.000) Display Duration 1 7.682* 0.523 0.028 Error 7 (0.002) Reward Magnitude x Display Duration 1 0.028 0.004 0.873 Error 7 (0.001) ________________________________________________________________ Note. Mean Square Errors appear in parentheses below means. **p < 0.05.

222
Table B23
Repeated Measures Analysis of Variance for Accuracy in Experiment 4A
________________________________________________________________
Source df F 2 p ________________________________________________________________ Within Subjects Reward Magnitude 1 1.656 0.191 0.239 Error 7 (0.004) Display Duration 1 159.609** 0.958 0.000 Error 7 (0.002) Reward Magnitude x Display Duration 1 2.655 0.275 0.147 Error 7 (0.004) ________________________________________________________________ Note. Mean Square Errors appear in parentheses below means. **p < 0.01.

223
Table B24
Repeated Measures Analysis of Variance for Inverse Efficiency in Experiment 4A
________________________________________________________________
Source df F 2 p ________________________________________________________________ Within Subjects Reward Magnitude 1 5.029 0.418 0.060 Error 7 (0.003) Display Duration 1 48.181** 0.873 0.000 Error 7 (0.004) Reward Magnitude x Display Duration 1 2.246 0.243 0.178 Error 7 (0.003) ________________________________________________________________ Note. Mean Square Errors appear in parentheses below means. **p < 0.01.

224
Table B25
Repeated Measures Analysis of Variance for Sensitivity in Experiment 4A
________________________________________________________________
Source df F 2 p ________________________________________________________________ Within Subjects Reward Magnitude 1 2.202 0.239 0.181 Error 7 (0.445) Display Duration 1 6.691* 0.489 0.036 Error 7 (0.631) Reward Magnitude x Display Duration 1 0.006 0.001 0.941 Error 7 (0.053) ________________________________________________________________ Note. Mean Square Errors appear in parentheses below means. *p < 0.05.

225
Table B26
Repeated Measures Analysis of Variance for Response Time in Experiment 4B
________________________________________________________________
Source df F 2 p ________________________________________________________________ Within Subjects Reward Probability 1 5.098 0.421 0.059 Error 7 (0.001) Display Duration 1 14.225** 0.670 0.007 Error 7 (0.001) Reward Probability x Display Duration 1 0.004 0.001 0.951 Error 7 (0.001) ________________________________________________________________ Note. Mean Square Errors appear in parentheses below means. **p < 0.01.

226
Table B27
Repeated Measures Analysis of Variance for Accuracy in Experiment 4B
________________________________________________________________
Source df F 2 p ________________________________________________________________ Within Subjects Reward Probability 1 23.038** 0.767 0.002 Error 7 (0.002) Display Duration 1 68.332** 0.907 0.000 Error 7 (0.003) Reward Probability x Display Duration 1 19.785** 0.739 0.003 Error 7 (0.002) ________________________________________________________________ Note. Mean Square Errors appear in parentheses below means. **p < 0.01.

227
Table B28
Bonferroni Pairwise Comparisons for Accuracy on the Significant Target Reward
Probability x Display Duration Interaction in Experiment 4B
________________________________________________________________
Target Reward Probability _____________________________________________ LRp HRp
Comparison Mean Difference(i-j) p Mean Difference(i-j) p
________________________________________________________________
0.150si versus 0.035sj 24.6** 0.000 9.1* 0.016 (2.4) (2.9) ________________________________________________________________
Note. Standard Errors appear in parentheses below means.
*p < 0.05. **p < 0.01.

228
Table B29
Repeated Measures Analysis of Variance for Inverse Efficiency in Experiment 4B
________________________________________________________________
Source df F 2 p ________________________________________________________________ Within Subjects Reward Probability 1 25.492** 0.785 0.001 Error 7 (0.002) Display Duration 1 58.178** 0.893 0.000 Error 7 (0.004) Reward Probability x Display Duration 1 10.370* 0.597 0.015 Error 7 (0.003) ________________________________________________________________ Note. Mean Square Errors appear in parentheses below means. *p < 0.05. **p < 0.01.

229
Table B30
Bonferroni Pairwise Comparisons for Inverse Efficiency on the Significant Target
Reward Probability x Display Duration Interaction in Experiment 4B
________________________________________________________________
Target Reward Probability _____________________________________________ LRp HRp
Comparison Mean Difference(i-j) p Mean Difference(i-j) p
________________________________________________________________
0.150si versus 0.035sj -0.233** 0.000 -0.106** 0.004 (0.033) (0.025) ________________________________________________________________
Note. Standard Errors appear in parentheses below means.
**p < 0.01.

230
Table B31
Repeated Measures Analysis of Variance for Sensitivity in Experiment 4B
________________________________________________________________
Source df F 2 p ________________________________________________________________ Within Subjects Reward Probability 1 5.852* 0.455 0.046 Error 7 (0.456) Display Duration 1 9.102* 0.565 0.019 Error 7 (0.686) Reward Probability x Display Duration 1 10.141* 0.592 0.015 Error 7 (0.014) ________________________________________________________________ Note. Mean Square Errors appear in parentheses below means. *p < 0.05.

231
Table B32
Bonferroni Pairwise Comparisons for Sensitivity on the Significant Target Reward
Probability x Display Duration Interaction in Experiment 4B
________________________________________________________________
Target Reward Probability _____________________________________________ LRp HRp
Comparison Mean Difference(i-j) p Mean Difference(i-j) p
________________________________________________________________
0.150si versus 0.035sj 1.017* 0.010 0.750* 0.041 (0.291) (0.301) ________________________________________________________________
Note. Standard Errors appear in parentheses below means.
*p < 0.05.

232
Table B33
Independent Samples t-tests in Experiment 4
________________________________________________________________ Reward Dimension _______________________ m p t df p ________________________________________________________________ (n = 8) Response Time 0.012 0.018 -0.742 14 0.482 (0.007) (0.008) Accuracy -2.9 -15.5 8.469** 14 0.000 (2.3) (3.2) Inverse Efficiency 0.040 0.083 -4.560** 14 0.003 (0.018) (0.016) Sensitivity (d’) -0.350 -0.578 2.599* 14 0.035 (0.236) (0.239) ________________________________________________________________ Note. Standard Errors appear in parentheses below means. *p < 0.05. **p < 0.01.

233
Appendix C
Probability Discounting Questionnaires
(Experiment 2 and Experiment 4B-discounting procedure component)

234
Discounting task used in Experiment 2
Questionnaire: Part 1
________________________________________________________________
Question 1: Do you prefer $1 for sure or $10 with a 10% chance ?
________________________________________________________________
Question 2: Do you prefer $2 for sure or $10 with a 10% chance ?
________________________________________________________________
Question 3: Do you prefer $3 for sure or $10 with a 10% chance ?
________________________________________________________________
Question 4: Do you prefer $4 for sure or $10 with a 10% chance ?
________________________________________________________________
Question 5: Do you prefer $5 for sure or $10 with a 10% chance ?
________________________________________________________________
Question 6: Do you prefer $6 for sure or $10 with a 10% chance ?
________________________________________________________________
Question 7: Do you prefer $7 for sure or $10 with a 10% chance ?
________________________________________________________________
Question 8: Do you prefer $8 for sure or $10 with a 10% chance ?
________________________________________________________________
Question 9: Do you prefer $9 for sure or $10 with a 10% chance ?
________________________________________________________________
Question 10: Do you prefer $10 for sure or $10 with a 10% chance ?
________________________________________________________________

235
Questionnaire: Part 2 ________________________________________________________________
Question 1: Do you prefer $10 for sure or $10 with a 10% chance ?
________________________________________________________________
Question 2: Do you prefer $9 for sure or $10 with a 10% chance ?
________________________________________________________________
Question 3: Do you prefer $8 for sure or $10 with a 10% chance ?
________________________________________________________________
Question 4: Do you prefer $7 for sure or $10 with a 10% chance ?
________________________________________________________________
Question 5: Do you prefer $6 for sure or $10 with a 10% chance ?
________________________________________________________________
Question 6: Do you prefer $5 for sure or $10 with a 10% chance ?
________________________________________________________________
Question 7: Do you prefer $4 for sure or $10 with a 10% chance ?
________________________________________________________________
Question 8: Do you prefer $3 for sure or $10 with a 10% chance ?
________________________________________________________________
Question 9: Do you prefer $2 for sure or $10 with a 10% chance ?
________________________________________________________________
Question 10: Do you prefer $1 for sure or $10 with a 10% chance ?
________________________________________________________________

236
Discounting task used in Experiment 4B
Questionnaire: Part 1
________________________________________________________________
Question 1: Do you prefer $1 for sure or $10 with a 1% chance ?
________________________________________________________________
Question 2: Do you prefer $2 for sure or $10 with a 1% chance ?
________________________________________________________________
Question 3: Do you prefer $3 for sure or $10 with a 1% chance ?
________________________________________________________________
Question 4: Do you prefer $4 for sure or $10 with a 1% chance ?
________________________________________________________________
Question 5: Do you prefer $5 for sure or $10 with a 1% chance ?
________________________________________________________________
Question 6: Do you prefer $6 for sure or $10 with a 1% chance ?
________________________________________________________________
Question 7: Do you prefer $7 for sure or $10 with a 1% chance ?
________________________________________________________________
Question 8: Do you prefer $8 for sure or $10 with a 1% chance ?
________________________________________________________________
Question 9: Do you prefer $9 for sure or $10 with a 1% chance ?
________________________________________________________________
Question 10: Do you prefer $10 for sure or $10 with a 1% chance ?
________________________________________________________________

237
Questionnaire: Part 2 ________________________________________________________________
Question 1: Do you prefer $10 for sure or $10 with a 1% chance ?
________________________________________________________________
Question 2: Do you prefer $9 for sure or $10 with a 1% chance ?
________________________________________________________________
Question 3: Do you prefer $8 for sure or $10 with a 1% chance ?
________________________________________________________________
Question 4: Do you prefer $7 for sure or $10 with a 1% chance ?
________________________________________________________________
Question 5: Do you prefer $6 for sure or $10 with a 1% chance ?
________________________________________________________________
Question 6: Do you prefer $5 for sure or $10 with a 1% chance ?
________________________________________________________________
Question 7: Do you prefer $4 for sure or $10 with a 1% chance ?
________________________________________________________________
Question 8: Do you prefer $3 for sure or $10 with a 1% chance ?
________________________________________________________________
Question 9: Do you prefer $2 for sure or $10 with a 1% chance ?
________________________________________________________________
Question 10: Do you prefer $1 for sure or $10 with a 1% chance ?
________________________________________________________________