the influence of self-efficacy, interest, and stereotype...
TRANSCRIPT
i
THE INFLUENCE OF SELF-EFFICACY, INTEREST, AND STEREOTYPE THREAT ON
CAREER INTENTION AND CHOICES RELATED TO MATH AND SCIENCE
by
Elizabeth Wong, B.A. Ryerson University, 2010
A thesis
presented to Ryerson University
in partial fulfillment of the
requirements for the degree of
Master of Arts
in the Program of
Psychology
Toronto, Ontario, Canada, 2013
© Elizabeth Wong 2013
ii
AUTHOR'S DECLARATION FOR ELECTRONIC SUBMISSION OF A THESIS
I hereby declare that I am the sole author of this thesis. This is a true copy of the thesis, including
any required final revisions, as accepted by my examiners.
I authorize Ryerson University to lend this thesis to other institutions or individuals for the
purpose of scholarly research
I further authorize Ryerson University to reproduce this thesis by photocopying or by other
means, in total or in part, at the request of other institutions or individuals for the purpose of
scholarly research.
I understand that my thesis may be made electronically available to the public
iii
The influence of self-efficacy, interest, and stereotype threat on career intentions and
choices related to math and science.
Master of Arts, 2013
Elizabeth Wong
Psychology
Ryerson University
Abstract
Women continue to be underrepresented in Science, Technology, Engineering and
Mathematics (STEM) careers/sectors. Concurrently, negative stereotypes about women’s
abilities to perform in STEM persists. This research examined whether gender stereotypes
influence women’s STEM-related intentions and choices and the mediating influence of
cognitive predictors based on the Social Cognitive Career Theory (SCCT; Lent, Brown, &
Hackett, 1994). In total, 194 women from Ryerson University were randomly assigned to a
stereotype threat (n =65), stereotype nullification (n = 65), or control condition (n = 64).
Participants completed questionnaires assessing math self-efficacy, math and science interests
and intentions, and a math/verbal choice task. In support of SCCT, math self-efficacy and
math/science interests predicted math/science intentions and choice on the math/verbal test.
Furthermore, “math identified” participants in the stereotype threat condition reported lower
math/science intentions. This research has implications for current interventions designed to
increase women’s participation and retention in STEM.
iv
Table of Contents
Author Declaration............................................................................................................... ii
Abstract................................................................................................................................. iii
Table of Contents.................................................................................................................. iv
List of Figures....................................................................................................................... vi
List of Tables........................................................................................................................ vii
Appendices........................................................................................................................... viii
1. Introduction
A. Women’s underrepresentation in STEM............................................................. 1
B. The Social Cognitive Career Theory Model for predicting career choice........... 5
i. Math self-efficacy...................................................................................... 7
ii. Math interest............................................................................................. 10
C. Stereotype threat.................................................................................................. 12
i. Influence of stereotypes on cognitive predictors of career choice............ 14
ii. Effect of stereotype threat on career choice............................................. 17
iii. Stereotype threat and perception of barriers........................................... 19
D. The present study................................................................................................ 21
2. Method
Participants.............................................................................................................. 23
Measures.................................................................................................................. 25
Math identification...................................................................................... 25
Math self-efficacy....................................................................................... 25
Math interest............................................................................................... 26
Math and science intentions....................................................................... 26
STEM-related task choice.......................................................................... 26
Perceived career barriers............................................................................ 28
Manipulation check.................................................................................... 28
Procedure............................................................................................................... 29
Data analysis........................................................................................................... 31
3. Results
Manipulation check................................................................................................ 34
Stereotype threat and performance on the STEM-related choice task................... 34
Effect of stereotype threat on math and science intentions.................................... 35
Effect of stereotype threat on math and science intentions for math-identified participants.............................................................................................................
36
Mediation of math and science intentions through math self-efficacy.................. 37
Mediation of math and science intentions through math and science interests..... 38
Mediation of math and science intentions by math self-efficacy and interests
(math identified students).......................................................................................
39
v
Table of Contents continued
Mediation of math and science intentions by perceptions of career barriers.........
40
Effect of stereotypes on choice to engage in a STEM-related task....................... 41
Effect of stereotypes on choice to engage in a STEM-related task for math
identified students..................................................................................................
42
Mediation of STEM-related choice through math self-efficacy............................ 43
Mediation of STEM-related choice through math and science interests............... 44
Mediation of STEM-related choice through perception on career barriers........... 45
4. Discussion
Major findings........................................................................................................ 47
Unsupported hypotheses and future directions...................................................... 49
Limitations............................................................................................................. 53
Implications............................................................................................................ 54
5. References.................................................................................................................... 57
6. Appendices................................................................................................................... xi
vi
List of Figures
Figure 1. Social Cognitive Career Theory Model of predictors of career choice and intentions
(adapted from Lent, Brown & Hackett, 1994)…………………………………………………... 5
Figure 2. Participants’ average math and verbal percentage accuracy by condition...…………. 35
Figure 3. Average math and science intentions by condition and math identification...…….…. 36
Figure 4. Mediation of condition on math and science intentions by math self-efficacy………. 38
Figure 5. Mediation of condition on math and science intentions by math and science interests.39
Figure 6. Mediation of condition on math and science intentions by perceptions of career barriers.......................................................................................................................................... 41
Figure 7. Average percentage of math and verbal items attempted for math identified and non-
identified participants.…………………………………………………………………..…........ 43
Figure 8. Mediation of condition on STEM-related task choices by math self-efficacy……..… 44
Figure 9. Mediation of condition on STEM-related choices by math and science interests…… 45
Figure 10. Mediation of condition on STEM-related choices by perceptions of career barriers.. 46

vii
List of Tables
Table 1: Participant demographics…………………………………………………………... 24
Table 2: Mediation of condition on intentions coefficients for math identified students by math
self-efficacy and math and science interests…………………………………………………... 40

viii
Appendices
Appendix A: STEM-related math/verbal choice task questions………………………………. ix
1
1. INTRODUCTION
In 2006, during a speech at a conference addressing women’s underrepresentation in
STEM, Lawrence Summers, former president of Harvard University, attributed the lack of
women in STEM to “issues of intrinsic aptitude and particularity of the variability of aptitude”
(cited in the Harvard Crimson, 2005). In his speech, Summers implied that women choose to
avoid STEM fields/areas because of an innate gender difference in ability. He also argued that
socialization and continuing discrimination had little to do with the underrepresentation of
women in STEM. While Summers later apologized, these controversial statements sparked an
important debate over why women are not choosing to pursue STEM-related fields. This present
study sought to examine the influence of the social and cognitive factors on women’s
underrepresentation within the STEM fields.
A. Women’s underrepresentation in STEM.
Although women account for nearly 50% of the workforce in Canada and the United
States, they continue to be underrepresented in Science, Technology, Engineering and Math
(STEM) areas (Economics and Statistics Administration [ESA], 2011; McKenzie, 2007;
Statistics Canada, 2011b). Women are consistently choosing to not pursue careers in STEM and
this is apparent starting with trends in post-secondary education. In Canada, there are 40% more
women than men enrolled in undergraduate degree programs, and the gender gap in the number
of PhD’s obtained has been declining since 1995 (Natural Science and Engineering Research
Council of Canada [NSERC], 2010). Yet, analysis of enrollment in specific programs reveals
that women are overrepresented in Arts while being underrepresented in STEM-related degree
programs (McKenzie, 2007). Women outnumber men in the education and health science fields
and are two times more likely than men to pursue a PhD in arts-related programs, such as
2
education and the health science (e.g., biology and nursing) (Lindsay & Almey, 2006). The
overrepresentation of women in arts is the most likely explanation for the narrowing gap between
men and women in obtained PhD`s (Lindsay & Almey, 2006; McKenzie, 2007; NSERC, 2010).
However, in the STEM-related degrees, the number of women still lags behind. In 2001, men
outnumbered women in obtained science and engineering PhDs four to one (McKenzie, 2007).
Lindsay and Almey (2006) found that in the pursuit of PhDs in physical science, computer
science, and engineering, women account for only 20-30% of students, and of those pursuing
undergraduate degrees in mathematics and physical sciences only 30% are women.
Not surprisingly, as the degree that one obtains often predicts subsequent careers, similar
gender differences transfer into the labour force. A Historical Review of the Labour Force from
1976 to 2006 (Statistics Canada, 2011b) found that mirroring specific degrees obtained, women
are overrepresented in arts-related areas, but underrepresented in STEM careers. In the Health-
Care and Social Assistance, and Educational Services, women make up 80 and 65% of the
workforce respectively. Concurrently, in the Professional, Scientific and Technical Services,
which encompass some STEM careers, women account for less than 50% of the workforce. In
the central STEM areas, The Natural Science and Engineering Research Council of Canada
(2010) found that men were three times more likely than women to have an occupation in the
natural sciences and engineering. In 2000, women made up only 22% of the workforce in the
natural sciences and engineering (NSERC, 2010).
Similar gender representations are found in the United States workforce. A recent report
from the National Science Foundation (NSF; 2011) found that in the US, women account for
only 26% of scientists and engineers. Furthermore, in 2009, 75-90% of nurses, dieticians, non-
postsecondary teachers and therapists were women, but only 10% of engineers, 25% of the
3
mathematical/computer scientists, and 30% of the physical scientists. Moreover, women’s
underrepresentation in STEM careers is further supported by evidence that even when they hold
a degree in STEM, women are more likely than men to have occupations outside of STEM in
Canada and the US (NSERC, 2010; NSF, 2011).
Women’s choice to not pursue STEM careers has economic implications as the gender
wage gap can be partially attributed to gender differences in career choice. For example, in
Canada, for every dollar men make, women earned about 80% (Statistics Canada, 2011a). This
can be partly attributed to women working in the Healthcare and Social Assistance and
Education Services and earning $700-900 on average a week (Statistics Canada, 2011a).
Comparatively, in the Professional, Scientific and Technical Services where there are less
women, earnings averaged $1100 a week. Furthermore, the gender wage gap favouring men
within STEM fields is smaller. McKenzie (2007) found that in 2001, women earned 77 cents for
every dollar men made in science and technology fields. This is a smaller gap compared to the 71
cents women earn for every dollar men make in the general labour force. Additionally, earnings
in STEM are increasing dramatically more than non-STEM careers in general. Statistics Canada
(2003) reported that from 1995-2000, there was an 8.6% increase in average earnings in
computer and information systems careers, in contrast to the 0.1% increase in the average
earnings of elementary school teachers. More women in STEM fields, where the gender wage
gap is smaller, earnings are higher and increasing faster may reduce the gender wage gap.
However, this is not the only benefit of more women pursuing careers in STEM.
Women’s inclusion in the workplace promotes a diversity of knowledge and viewpoints
being shared which may in turn increase creativity and innovation (Bear & Wholley, 2011).
Fenwick and Neal (2001) found that in the MARKSTRAT 2 simulation task, which is a complex
4
business marketing task, groups that were comprised of more women than men compared to
groups comprised of mostly males, performed better on the MARKSTRAT 2 simulation task
through reported profits. Moreover, persistence is a major issue in women’s underrepresentation
in STEM. Women are more likely than men to leave STEM careers early (McKenzie, 2007;
NSERC, 2010). The common belief is that women leave the workplace due to family-related
responsibilities, such as childcare (Xu, 2008). However, Heilbronner (2011) found that one of
the main reasons women left their careers in STEM was because they felt socially isolated from
male colleagues. Therefore, more women in the workplace may help to alleviate women’s
concerns by reducing hostility and feelings of isolation and this in turn may increase persistence.
The advantages of including more women in the workplace highlights the importance of
further examining why women are not choosing to enter STEM. It is apparent that women are
less likely to choose to pursue degrees and careers in STEM compared to men, but very little is
known about why this difference exists. It may be argued from a job preference point of view
(Bentley & Adamson, 2003; Xu, 2008) that women simply do not want to pursue a career in
STEM and prefer other careers because women prefer working with people rather than objects
(Webb, Lubinski, & Benbow, 2002), or they choose jobs which can accommodate multiple roles
related to family and employment (Hakim, 2006). However, research indicates that women and
men equally idealize STEM careers (Chalk, Meara, Day, & Davis, 2005). At the same time,
Chalk et al. (2005) found that women also fear jobs in STEM and are less likely to expect them.
This questions the job preference perspective that women are freely choosing to not pursue
STEM and suggests that there may be other issues affecting career choice.
As mentioned previously, one proposed explanation is that inherent gender differences
exists between men and women in math and science abilities. If women’s underrepresentation in
5
STEM careers was a result of gender differences in innate abilities, there would be differences in
performance in STEM areas. The STEM careers have often been referred to as the math
domains. Research examining performance in math provides insight into this “biological”
explanation. However, rather than gender differences, performance in mathematics is more
reflective of the Gender Similarities Hypothesis (Hyde, 2005). Meta-analyses examining gender
differences in math performance have found that few gender differences exist, except in spatial
abilities and difficult problem solving (Carr, Steiner, Kyser, & Biddlecomb, 2008; Else-Quest,
Hyde, & Linn, 2010; Hyde, Fennema, & Lamon, 1990). In a recent meta-analysis, Else-Quest et
al. (2010) found that in general math, geometry, data, and measurement, the genders are equal
and sometimes females show an advantage, e.g. algebra. Where statistical differences do exist,
the size of the difference is insignificant (d = .07 in measurement to d = .15 in space/shape).
Furthermore, across countries the effect sizes of gender differences varies from d = -.41 showing
a female advantage to d = .40, indicating a male advantage (Else-Quest et al., 2010). If there was
an innate difference between men and women, there would be little variation across countries in
effect sizes. The lack of evidence for gender differences in math performance and inconsistencies
in math achievement between countries suggests that the women’s underrepresentation in STEM
careers is not a result of innate differences in ability. Therefore, social and cognitive factors may
explain women’s choice to not pursue careers in STEM.
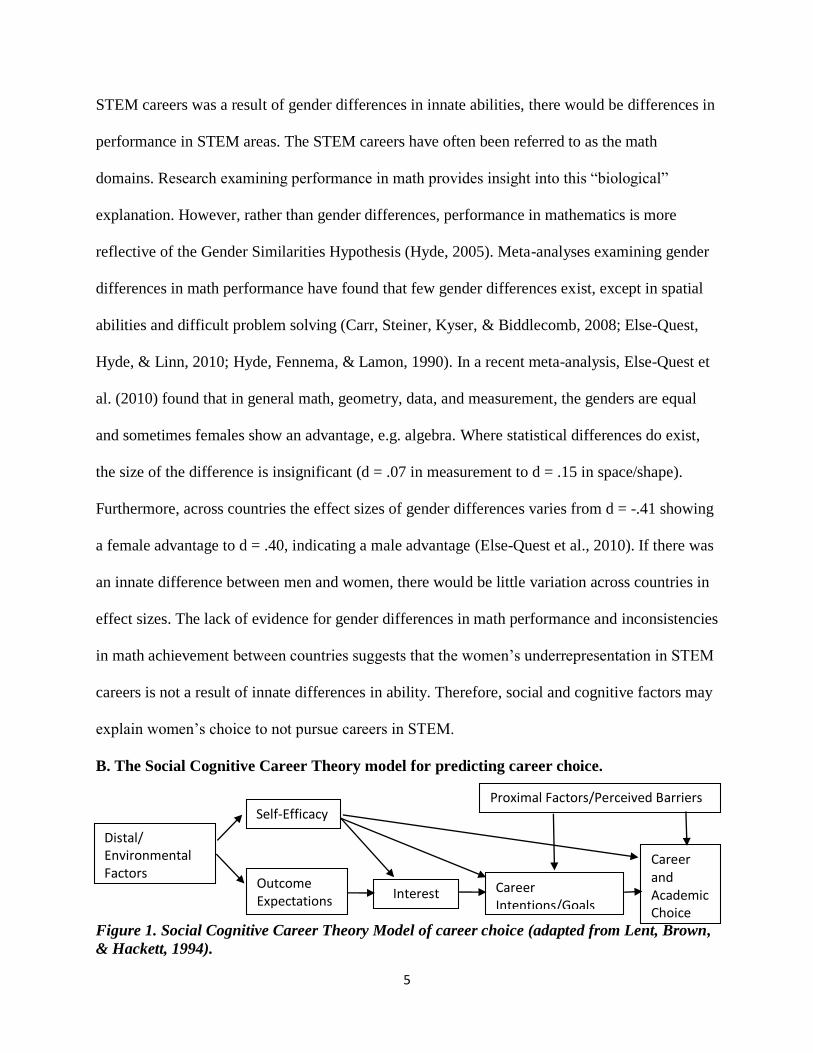
B. The Social Cognitive Career Theory model for predicting career choice.
Figure 1. Social Cognitive Career Theory Model of career choice (adapted from Lent, Brown,
& Hackett, 1994).
Interest
Self-Efficacy
Career Intentions/Goals
Career and Academic Choice
Outcome Expectations
Distal/ Environmental Factors
Proximal Factors/Perceived Barriers
6
The Social Cognitive Career Theory (SCCT; Lent, Brown, & Hackett, 1994) was
proposed to explain how career and academic choices are made and developed, and is based on
Albert Bandura’s (1986) Social Cognitive Theory. SCCT argues that the development of a career
choice is a dynamic, reciprocal process between the environment, cognition, and behaviour.
According to the model, there are cognitive variables that are crucial to career choice: self-
efficacy, interest, outcome expectations, career goals or intentions. Originally, Lent et al. (1994)
argued that career and academic choices result from the cognitive variables of self-efficacy and
outcome expectations (expectations about the awards and consequences of choosing to pursue
that career or activity) affecting interests which then shape career-related goals and intentions
and subsequently, behavioural choices (see Figure 1).
Research indicates that this is a reliable model for predicting a variety of career-related
decisions, including choosing a psychology major (Diegelman & Subich, 2001). More important,
research in SCCT has largely focused on providing support for SCCT in STEM-related
outcomes, including persistence in computing (Lent, Lopez, Lopez, & Sheu, 2008) and
engineering (Lent, Brown, Schmidt, Brenner, Lyons, & Treistman, 2000b; Lent et al., 2005;
Lent, Sheu., Singley, Schmidt, Schmidt, & Gloster, 2008) majors; women’s choice to pursue
non-traditional majors after high school (Nauta & Epperson, 2003); women’s intention towards
higher level activities within math, science and engineering majors (Nauta, Epperson, & Kahn,
1998); and choice to pursue math or science related courses and careers for engineering students
(Lent, Lopez, & Biescke,1993), undergraduate students (Lent, Brown, Brenner, Chopra, Davis,
Talleyrand, & Suthakaran, 2001; Lent, Lopez & Biescke, 1991; Byars-Winston & Fouad, 2008).
Despite general support for the SCCT model, there is conflicting research on the
importance of outcome expectations in predicting STEM career intention and choice. Lent et al.
7
(2008) found that outcome expectations did not predict career goals or interest in choosing to
major in computing. Similar findings have consistently been found for engineering majors (Lent
et al., 2000b). On the other hand, Nauta and Epperson (2001) found that while outcome
expectations were predictive of female choice to pursue a non-traditional major after high school,
math self-efficacy was a better predictor, likewise for persistence in engineering majors (Lent et
al., 2005). In fact, Lent et al. (1994) and Bandura (1986) emphasize the importance of self-
efficacy as a larger determinant of career choices compared to outcome expectations. One can
have high expectations about rewards but choose to pursue another career. For example, women
can expect higher pay if they choose to pursue a career in STEM. However, if they lack
confidence in their ability to succeed within the career, they will choose to not follow that career
path. It is important to continue examining outcome expectations to clarify the influence on
STEM choices, and intentions and recent research has attempted to examine outcome
expectations specifically (Diegelman & Subich, 2001). Nonetheless, because of the general
agreement on the importance of self-efficacy over outcome expectations in the STEM career
decision making process, the present study focused primarily on self-efficacy in predicting
women’s choices and intention related to STEM. As STEM careers have been referred to as the
math domains (Betz & Hackett, 1983) and the importance of math self-efficacy on STEM career
intentions and interest has been noted by many researchers (Lent et al., 1993; 2001; Mau, 2003),
this thesis was particularly focused on math-related outcomes.
i. Math self-efficacy.
Originally defined by Bandura (1986), self-efficacy is a person’s task-specific, rather
than general, perception, belief and expectation about one’s ability to succeed in a particular
area. According to Bandura (1986), self-efficacy is important in determining a person’s effort,
8
persistence, and choices. SCCT proposes that there are several pathways including self-efficacy
affecting both career intentions and choice directly.
There is a plethora of research indicating that math self-efficacy can predict STEM career
intentions in adolescents (Crombie, Sinclair, Silverthorn, Byrne, Dubois, & Trinneer, 2005;
Fouad & Smith, 1996; Navarro, Flores, & Worthington, 2007) and in adults (Betz & Hackett,
1983; Nauta & Epperson., 1998). Crombie et al. (2005) found that adolescents’ beliefs about
their competence in math predicted their intentions to enrol in math courses. Fouad and Smith
(1996) examining the SCCT model, found that math self-efficacy predicted middle school
students’ intentions to pursue both math and science careers and courses in high-school. In
adults, Nauta et al. (1998) found that high math, science, and engineering self-efficacy can
predict higher level intentions, such as wanting to pursue a leadership role for women already in
STEM fields. Furthermore, math self-efficacy is not only related to goals and intentions to
pursue STEM but self-efficacy often predicts the selection of STEM majors and persistence
within STEM domains. Lefevre and Heyman (1992) examined math self-efficacy as a predictor
of undergraduate STEM majors and found that high self-efficacy in math was related to
subsequent pursuit of math-intensive STEM majors, including computer science, engineering
and physics. For women intending to pursue degrees in engineering and math, high math self-
efficacy was related to middle school student’s (Mau, 2003) and adult’s (Marra, Rodgers, Shen,
& Bogue, 2009) persistence in STEM.
It is imperative to examine self-efficacy because research suggests that despite equal and,
in several studies, better performance (Crombie et al., 2005) than males in math, females will
nonetheless report lower math self-efficacy (Carr et al, 2008; Codero, Porter, Israel, & Brown,
2010; Correll, 2001; Else-Quest et al., 2010; Jacobs, Lanza, Osgood, Eccles, & Wigfield, 2002;
9
Wigfield et al., 1997). In a recent meta-analysis comparing gender difference in math outcomes,
Else-Quest et al. (2010) found that in approximately 97% of the countries examined, gender
difference in math self-efficacy favoured males (d = 0.08 - 0.65).
Due to the importance of self-efficacy, and specifically math self-efficacy in STEM
career decision making, interventions have been designed to improve women’s math self-
efficacy. Bandura (1986) emphasized the importance of performance accomplishments on
improving self-efficacy, and indeed research indicates that successful performance is a strong
predictor of self-efficacy (Williams & Subich, 2006; Lent et al., 2001). Luzzo, Hasper, Albert,
Bibby and Martinelli (1999) proposed the use of performance accomplishment based
interventions to increase math and science self-efficacy. Luzzo et al. (1999) randomly assigned
to participants into a performance accomplishment (PA), vicarious learning or no treatment
conditions. Participants completed simple questions and were informed of their passing grade on
the task in the PA condition, while those in the vicarious learning watch a video of two students
discussing their success in math/science related fields. Questionnaires were completed
immediately and four weeks after the interventions. Male and female participants who received
performance accomplishment treatment reported higher math/science self-efficacy and were also
more likely to self-report intention to enroll in science and math courses and select a science or
math major four weeks after treatment.
Highlighting the importance of performance accomplishments in self-efficacy, in an
effort to create long lasting changes in self-efficacy, Codero et al. (2010) combined belief
preservations techniques with Luzzo et al.’s, (1999) performance accomplishment intervention
by asking participants to explain why they could succeed in math and science courses. Men who
received the combination intervention reported long lasting effects, reporting higher math self-
10
efficacy six weeks after completing the intervention. Although women did not benefit due to low
power, the creation of successful interventions specific to improving math self-efficacy
accentuates the importance of self-efficacy in STEM intentions and choices.
Since math self-efficacy is important in predicting STEM career choice and intentions,
and women consistently reporting lower math self-efficacy compared to men, it is necessary to
examine why, in spite of little difference in performance, gender disparity in self-efficacy
persists. Moreover, according to the SCCT model, self-efficacy is not the only determinant of
career choice. In addition to directly affecting career intentions and activity choices, SCCT
proposes that the relationship between self-efficacy and STEM career intentions and choice is
also mediated by interests.
ii. Math interest.
Lent et al. (1994) defined interest as a liking for relevant activities and careers and
suggest that interest has a direct effect on career choice and intentions. While research suggests
that before middle school there are very few gender differences in math interests (Wigfield et al.,
1997), as children reach adolescence, gender difference becomes more prominent and girls begin
to report less interest in STEM related activities (Hyde et al., 1990). Similar to self-efficacy in
math, women have been found to report less interest in math and science compared to men
regardless of actual performance (Crumb, Moore, & Wada, 2010; Else-Quest et al., 2010).
Linver and Davis-Kean (2005) found that girls’ interest in math decreases faster than that of
boys, yet their grades dropped less compared to boys. Furthermore, interest has also been
commonly examined in the literature as a strong predictor of STEM activity choice (Heilbronner,
2011) and career choice (Lubinski & Benbow, 2006). Heilbronner (2011) found the most
common reason women reported choosing to participate in a math and science competition was
11
their interest in the topic. In adolescents, interests in math can predict persistence in STEM.
Lubinski and Benbow (2006) found in a longitudinal study of gifted math students that interest in
STEM was one of the strongest predictors of whether the children ended up pursuing and
completing a degree in science and math amongst other variables such as experiences and
accomplishments within STEM. Similarly, Simpkins, Davies-Kean, and Eccles, (2006) found
that interest in math and science was related to taking advanced math and physical science
courses in high-school and intentions to pursue careers in science in ninth graders.
In addition to the direct effects, SCCT proposes that the effect of self-efficacy on career
intentions and choice is mediated by interests (Lent et al, 1994). Widespread support has been
garnered for the meditational model in the effect of math self-efficacy on intentions to pursue
science and math careers and courses in college students (Byars-Winston et a., 2008; Lent et al.,
1993; 2001). For example, Lent et al. (1991) examined math self-efficacy and interests of
students enrolled in an introductory psychology course and asked participants to report their
career choices. The researchers found that math self-efficacy predicted whether reported career
choices were related to science; however this effect was indirect through the influence of math
interests. In other words, higher math self-efficacy predicted higher interest in math, which
predicted greater science-related career intention. Lent et al. (2001) found similar effects on
another group of students enrolled in an introductory psychology course and found that higher
math self-efficacy predicted higher math interests and that predicted higher intention towards
pursuing a math and science related career and enrolling in math and science related courses.
Luzzo et al. (1999) also found the performance accomplishment and vicarious learning
combination of treatment improved math/science interests four week after treatment. It is clear
that math self-efficacy and interest play a role in predicting career choice in STEM, however, in
12
addition to the cognitive variables, SCCT acknowledges that environmental factors play an
important role in career decision making process and can also shape cognitive components of
careers decision making.
The SCCT model makes the distinction between distal and proximal influences upon the
model. According to Lent, Brown, & Hackett (2000a) distal environmental factors are those that
affect choices and intentions by changing self-efficacy and interests. Proximal factors on the
other hand are those that directly affect one’s career choice and intentions. This research
investigated the threat of gender stereotypes as a social distal factor that affects cognitive
variables related to career choice and intentions.
C. Stereotype threat
Lent et al. (1994; 2000a) emphasized the importance of examining environmental and
contextual factors that interact with cognitive variables to affect choice. As mentioned
previously, proposed in the model are two types of environmental factors, distal and proximal.
Distal factors refer to the environmental influences such as cultural socialization and are said to
affect the career decision making process (Lent et al., 2000a). Peer, teacher and parental support
have all been determined to impact children’s socialization and their attitudes towards math and
science (Beilock, Gunderson, Ramirez, & Levine, 2010; Crowley, Callanan, Tenenbaum, &
Allen, 2001; Midgley, Geldlaufer, & Eccles, 1989; Ryan & Patrick, 2001; Turner, Steward, &
Lapan, 2004.) Stereotypes held by others also play a large role in the socialization process
(Myers, Jahn, Gaillard, & Stoltzfus, 2011) and stereotypes about women’s ability to perform in
STEM-related domains persist in conjunction with women’s underrepresentation in these
domains. The consequences of these stereotypes have been examined and in a phenomenon
termed stereotype threat, researchers have highlighted the detrimental influences that stereotypes
13
have on performance.
Stereotype threat theory posits that individuals who belong to negatively stereotyped
domains fear confirming adverse stereotypes about their group and this can undermine
performance. In a classic study, Steele and Aronson (1995) found Blacks performed worse than
Whites on a verbal test when they were told that the test was a measure of verbal ability.
Meanwhile, no performance differences were found between races when the task was framed as
a test measuring psychological factors. Since this study, research has supported stereotype threat
with various groups, in other domains including women and math. Spencer, Steele, and Quinn
(1999) activated stereotype threat in women on a math test by informing them that gender
differences existed in performance. These women subsequently performed worse on a math test
compared to men and women who were told that no gender difference existed in performance.
Ensuing research has supported these findings from groups of children (Keller & Dauenheimer,
2003; Neuville & Croizet, 2007) and adults (Good, Aronson, & Harder, 2008; Strangor, Carr, &
Kiang, 1998). Although math has been the most examined STEM-related area in stereotype
threat research also indicates that stereotype threat can affect performance in other STEM
domains including engineering (Bell, Spencer, Iserman, & Logel, 2003) and note taking in
STEM related activities for women (Appel, Kronberger, & Aronson, 2011).
Underscoring the concern regarding the negative effect of math-related stereotypes on
women, research also shows that performance decrements can occur even in situations where
women are simply made aware of their gender by indicating their name on a demographics form
prior to a math test (Spencer et al., 1999), or being in a room predominately made up of males
(Inzlicht & Ben-Zev, 2000). This is especially relevant to women who may initially attempt to
pursue an area in STEM. If women often feel isolated in the STEM workplace (Heilbronner,

14
2011) being the only female in a room with all males may remind women of their identity,
activating stereotype threat.
On the other hand, research indicates that not all people are vulnerable to the effects of
stereotype threat. According to Steele and Aronson (1995) and Steele (1997), identification with
the stereotyped domain plays an important role in stereotype threat effects. If one does not care
about the domain at all or consider it important to themselves, it would not be expected that they
would care about stereotypes that exists about their performance. However, the evidence is
slightly mixed as a meta-analysis (Nguyen & Ryan, 2008) found that while domain identification
matters, moderate, rather than high identification is a better predictor of stereotype threat effects.
In addition to domain identification, stereotype endorsement has been shown to be a moderator
of stereotypes on performance. Schmader, Johns, and Barquissau (2004) found that women who
endorsed gender stereotypes about women’s performance in math were more likely to show
decrements in performance than those who did not endorse the stereotypes. Nonetheless,
stereotype threat has been deemed a reliable phenomenon.
i. Influence of stereotypes on cognitive predictors of career choice.
In line with stereotypes about women abilities, research indicates that women’s self-
efficacy corresponds to common stereotypes about women’s performance in the math and verbal
domains. That is, while women tend to report lower self-efficacy towards math, they also have
an inclination to report higher self-confidence in their abilities to perform in arts and verbal
domains, which reflect the collective stereotypes about women’s abilities in arts (Correll, 2001;
Bonitz, Larson, & Armstrong, 2010). Jacobs et al. (2002) found that from grades 1-12 there is a
general decline in math self-efficacy for both boys and girls, however, girls’ self-efficacy in the
arts domains remained high.
15
Further suggesting effects of stereotypes on self-efficacy, research indicates that girls
who have parents who hold negative attitudes about girls’ abilities in math not only perform
worse on a math test under stereotype threat conditions (Tomasetto, Alparone, & Cadinu, 2011),
but they also report lower self-efficacy and confidence in their abilities to perform in math-
related activities (Bleeker & Jacobs, 2004). This lower self-efficacy towards abilities in math led
to a lower likelihood of academically pursuing areas related to physical science and computers.
In addition to parents’ endorsement of gender stereotypes related to women’s
performance in math affecting their children’s self-efficacy, women’s own endorsement of
stereotypes can also be detrimental to their self-efficacy. Schmader et al. (2004) found that
women who were more likely to endorse the stereotype that women perform poorly in math
compared to men also reported lower math self-efficacy. Ji, Lapan, and Tate (2004) found that
girls in grade 8 showed lower self-efficacy in occupations they had rated as “male” occupations.
While endorsing negative stereotypes can decrease self-efficacy, rejecting negative stereotypes
about math as a male domain is related to increased math self-efficacy (Turner et al., 2004).
Turner et al. (2004) found that sixth grade students who did not gender-type math as a male
domain reported higher math self-efficacy and higher interest in math and science. However,
endorsement of stereotypes is not necessary for stereotypes to have a negative influence on self-
efficacy and interests. Further research has found that activating stereotypes can influence female
perception of their abilities to perform in STEM related activities. Cadinu, Maass, Rosabianca,
and Kiesner (2005) found that when stereotypes were activated, women were more likely to
report that a math exercise was too hard and that they were not good in math, and this mediated
effects on performance.
In fact, stereotype vulnerability which is related to greater expectation to be stereotyped
16
and higher likelihood of being influence by negative stereotypes related to social categories can
also lead to unstable beliefs about self-efficacy (Aronson & Inzlicht, 2004). Blacks who reported
a tendency to expect to be stereotyped and affected by stereotypes experienced more extreme
fluctuation in academic self-efficacy than participants who were not vulnerable to stereotypes.
Aronson and Inzlicht (2004) argued that these fluctuations in self-efficacy will affect one’s
ability to trust positive self-performance feedback from others. Strangor et al. (1998) provided a
group of female participants positive feedback on their performance in an initial task (informed
that they had scored in the 80th to 90th percentile). These women reported higher expectations
about their abilities to perform on a related spatial abilities task compared to women who were
provided ambiguous feedback (told that they scored in the 60th to 70th percentile). However,
when female participants were placed under stereotype threat conditions where they were told
that men performed better than women on the task or when they were placed in a situation where
their gender was salient, such as a group comprised of all males, stereotype activation
undermined the benefits of positive feedback. The fact that stereotypes can undermine self-
efficacy even in the presence of positive feedback (Strangor et al., 1998) may be extremely
damaging considering that accomplishment and successful task completion has been found to be
the strongest source of positive self-efficacy (Lent et al., 2001; Williams & Subich, 2006).
In addition to self-efficacy, there is evidence to suggest that stereotypes can also
negatively affect women’s interest in STEM. Women who hold negative stereotypes about math
tend to report lower interest in math (Nosek, Banaji, & Greenwald, 2002; Schmader et al., 2004).
Nosek et al. (2002) found that women who implicitly associated math with males also reported
liking math less. Schmader et al. (2004) also found that increased stereotype endorsement
decreased self-efficacy and consequently predicted lower interest in their STEM major and
17
greater interest in changing majors. Similarly, activating female stereotypes has also been found
to reduce women’s interest in male occupations (Rudman & Phelan, 2010). Rudman and Phelan
(2010) primed female participants with pictures of men and women described as working in
either traditionally male or female jobs (e.g., female nurse or male surgeon) or non-traditional
jobs (a male nurse). They found that women primed with gender traditional roles reported less
interest in occupations that had been rated as masculine than participants in the atypical jobs and
control condition who viewed pictures of animals. Additionally, Davies, Spencer, Quinn, and
Gerhardstein (2002) found that when women watched stereotypically feminine women in
commercials (e.g., women baking brownies) supposedly to test long term memory, they reported
less interest in quantitative occupations such as engineering, computer science, math and
statistics compared to verbal occupations (author, journalist, editor) compared to women who
watched neutral commercials. Despite this evidence that stereotype threat can detrimentally
affect cognitive variables crucial to predicting STEM career intentions and choices, little
research has examined how stereotype threat may actually affect STEM related choices.
ii. Effect of stereotype threat on career choice.
Researchers have often alluded to the influence of stereotypes on career choices. Steele
and Aronson (1995) and Davies et al. (2002) argued that in order to avoid confirming negative
stereotypes about women’s performance in math, women choose careers that are more positively
related to their gender such as arts and nursing (Bonitz et al., 2010; Correll, 2001). This is
reflective of the evidence the women are overrepresented in the labour force as nurses and in arts
related areas (Lindsay & Almey, 2006). Additionally, while women consistently report lower
self-efficacy in math, they also report higher abilities and interest in arts (Nosek et al., 2002)
which corresponds to stereotypes about women’s abilities in math and arts. However, despite

18
this evidence that women’s choice often reflects gender stereotypes about women’s abilities,
there is a dearth of research examining the role stereotype threat may have in women’s actual
choices related to STEM.
There is evidence that when women are under stereotype threat conditions, they will
attempt fewer math questions in a math test (Oswald & Harvey, 2000; Schmader et al., 2004).
However, whether women will, as Steele and Aronson (1995) proposed, choose to complete
items that are more positively related to their gender and avoid math items in an effort to avoid
confirming negative stereotypes is still unclear. In the only study to examine stereotype threat
and choice, Davies et al. (2002) examined the effect of activating stereotypes on women’s
subsequent behaviour and self-reported choices related to STEM. In order to elicit stereotype
threat, women watched stereotypical commercials of women, for example, one commercial
included a woman exuberantly anticipating brownies baking in the oven. Women in the control
condition watched neutral commercials that did not include human characters. Participants were
given a test involving both math and verbal questions and asked to complete as many questions
as possible within a 20 minute time limit. Davies et al. (2002) found that women who watched
the stereotypical commercials performed worse on the math items of the test. Furthermore, the
researchers found that women in the stereotype threat condition attempted more verbal items
than math items. Therefore, it is possible that stereotype threat does lead women to avoid STEM-
relate activities, but little is understood about the underlying of self-efficacy and interest.
In the only research to test the meditation of stereotype threat effects of self-efficacy on
intention to pursue math and science careers (Whiton, 2008), the researchers found contradictory
results. Female participants who were told that they would be completing a study to determine
gender difference in career intentions and choice and record their gender before completing the
19
study did not report lower self-efficacy than those who did not receive instructions highlighting
gender difference or have to enter their gender. However, this research has several limitations.
First, participants’ interest in math and science was not measured despite the importance of
interest in STEM career decision making (Lent et al., 1994). Second, as the researcher also
concludes, stereotype threat may be more influential on behavioural choice rather than self-
reported intentions. Stereotype threat is a fear that one’s behaviour will confirm a negative
stereotype about one’s group (Steele & Aronson, 1995). As such, a behavioural task may be
more likely to evoke this fear than a self-report questionnaire measuring major intentions. It is
important to note that although stereotype threat may be more likely to show an effect on
behaviour, this research also only examined participants’ intention to major in STEM areas.
Since participants were already in their first year of university, many had already decided on
their major. Therefore, perhaps examining a variable such as career intention which is still
uncertain and malleable for students in first year may be a better measure of intentions.
Consequently, this present study intends to expand on this previous research by including
measures of math interest and examining behavioural choice in addition to intentions.
iii. Stereotype threat and perception of barriers.
Another reason that this present study seeks to examine the effects of stereotypes from
the SCCT model is that the theory acknowledges and incorporates the presence of barriers in
determining career choice (see Figure 1). Lent et al (2000a) proposed that proximal
environmental factors such as structural barriers and differences in treatment directly affect
career choice and intentions rather than affecting cognitive variables which in turn affects choice
and intentions. Swanson, Daniels, and Tokar (1996) defined barriers as environmental conditions
that hinder career progress. Notably, an emphasis has been placed on examining perceived

20
barriers rather than actual barriers as crucial to career choice and intentions. It is proposed that
people are less likely to take their interests and put their goals into actions when they think that
barriers and lack of support will impede their advancement.
There is evidence that barriers may prevent women from pursuing careers in STEM.
Generally, women tend to perceive more career barriers in STEM compared to men (Byars-
Winston & Fouad, 2008; Lindley, 2005). Furthermore, reasons women report leaving careers in
STEM often relate to workplace barriers (Xu, 2008). Xu (2008) examined predictors of
intentions to change areas (turnover intentions) for university faculty members in STEM. The
lack of opportunities and research support were the strongest predictors of turnover intention for
women. Meanwhile, men’s intention to turnover was related to salary and satisfaction with the
faculty leadership. Additionally, turnover was not related to family responsibility for men or
women. These results suggest that perceived structural barriers such as opportunities for
advancement may play a large role in why women do not choose to pursue or persist in STEM.
Since research on stereotype threat on career choice is in its infancy, very little is
understood about how stereotypes may affect choices related to STEM. Stereotype threat posits
that people fear confirming negative stereotypes about their performance and so choose to avoid
domains that place them in a situation that allows for this confirmation (Steele & Aronson,
1995). However, in addition to affecting self-efficacy, interests, and career intention and goals,
stereotypes may increase perceptions of barriers in the workplace and this prevents women from
choosing to enter into STEM. There is evidence that other distal contextual influences such as
parental involvement can affect perceptions of barriers which can in turn affect academic self-
efficacy and interests (Byars-Winston & Fouad, 2008). Therefore, this thesis examined
stereotype threat as a distal influence and whether this affected women’s perceptions of barriers
21
in pursuing careers in STEM and if this predicted STEM intention and STEM-related choice.
D. The present study
This study sought to contribute to two fields of research. First, this study adds to the
SCCT literature and extended previous research by examining stereotypes as an environmental
influence affecting women’s actual STEM-related choices. Second, this research expands upon
the stereotype threat literature by specifically examining the mediating influence of self-
efficacy, interests and perceptions of career barriers on women’s STEM-related choices and
intentions. Of particular interest is the stereotype that males perform better than females in math.
Previous research has often used measures of math self-efficacy to examine the relationship
between interest, intention and choice in science (Betz & Hackett, 1983; Lent et al., 1993; 2001)
and engineering (Mau, 2003), underlining the general importance of math to STEM careers.
Therefore, priming math stereotypes was appropriate. It is important to note that SCCT proposes
a model for not only career choice, but also choice to engage in activities in a certain domain
(Lent et al., 1994). Furthermore, it may be argued that research pertaining to career choice in
STEM should examine women already in STEM. Even so, as this research is focused on how
stereotype threat can affect intentions and activity choices related to STEM rather than
persistence, it was less important to examine women already majoring in STEM. However,
measures of math identification were taken to account for participants’ involvement in STEM.
Additionally, there is precedence for using undergraduate psychology students to examine
stereotype threat on women (Davies et al., 2002; Strangor et al., 2008) and the SCCT model on
math/science outcomes (Betz & Hackett; 1983; Lent et al., 1993; 2001).
More specifically, the purpose of this study was to examine the effects of stereotype
threat on women’s intention and goals to pursue STEM-related activities and careers and
22
behavioural choice to engage in math-related activities. The following hypotheses and sub-
hypotheses were proposed:
Hypothesis 1. Women in the stereotype threat condition would report lower intentions to
pursue activities related to science and math compared to participants in the control and
stereotype nullification conditions.
Hypothesis 1a.The effect of stereotypes on math and science intentions is mediated
by math self-efficacy.
Hypothesis 1b. The effect of stereotypes on math and science intentions is mediated
by interests in math and science.
Hypothesis 1c. The effect of stereotypes on math and science intentions is mediated
by perceptions of career barriers.
Hypothesis 2. Women in the stereotype threat condition would also be less likely to engage
in math items compared to verbal items when given the choice compared to participants in
the control and stereotype nullification conditions.
Hypothesis 2a.The effect of stereotypes on choice to engage in math-related items
is mediated by math self-efficacy.
Hypothesis 2b. The effect of stereotypes on math-related items is mediated by
interests in math and science.
Hypothesis 2c. The effect of stereotypes on math-related items is mediated is
mediated by perceptions of career barriers.
23
2. METHOD
Participants
All but one of the female participants who participated in this study were recruited from
the Psychology Undergraduate Participant Pool (UPP) at Ryerson University in Toronto Ontario.
One participant, enrolled in a science and engineering program was recruited from posters placed
around the Ryerson University campus. Participants recruited from the URP received 1.5%
course credit compensation for their participation (90 minutes), while the participant recruited
from posters received $15. In total 201 participants participated in the study.
Several participants were excluded from analysis for various reasons. One participant
from the stereotype threat condition identified as gender queer. There is no research examining
the impact of gender stereotypes on individuals who do not directly identify with the traditional
dichotomization of sex into male or female. Consequently, the participant was removed from
analysis. Data from two more participants were removed as they correctly identified the true
purpose of the study. Another participant was excluded due to an error in instruction delivery.
Finally, as this research is related to future career intentions, three participants over the age of 45
were removed as they would be more likely to already have a career. Additionally, due to
missing data, the final sample included 191 participants.
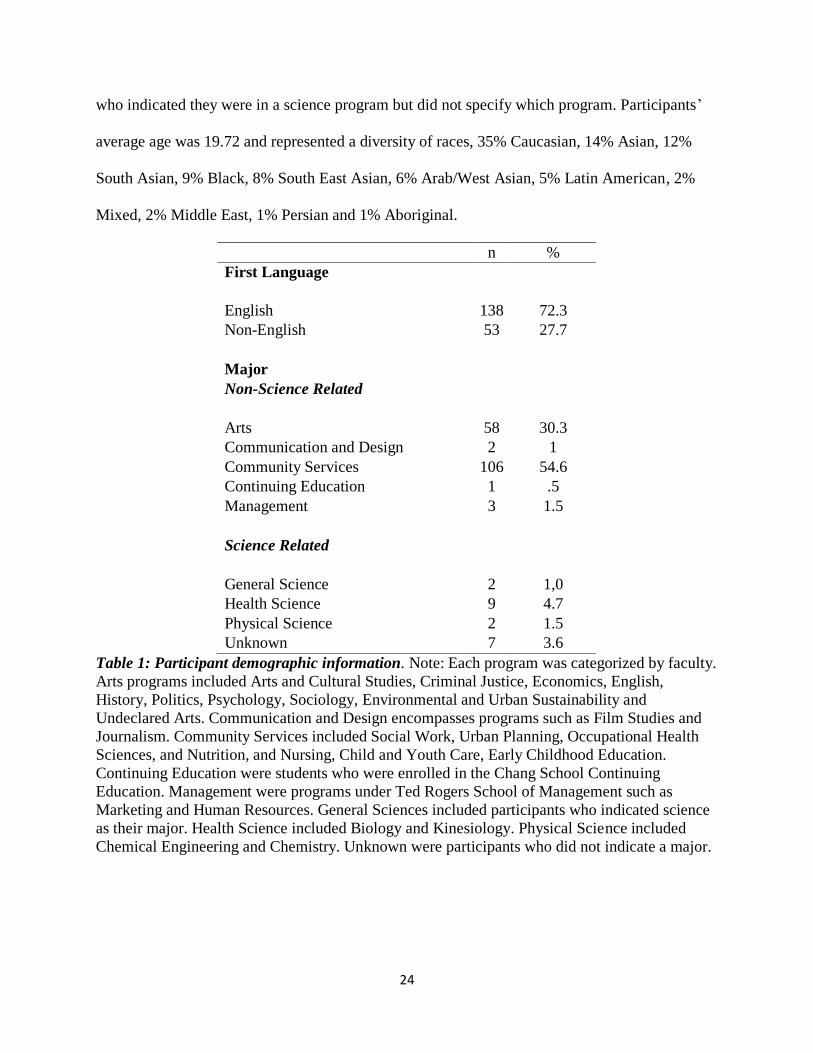
Demographic information are presented in Table 1, including participants’ first language,
year attending and major by faculty according to program categorization at Ryerson University.
Previous research indicates gender difference in STEM participation is not evident in health
sciences, for instance, biology, but rather tend to appear in physical science, i.e., chemistry and
physics (Lindsay & Almey, 2006). Therefore, science-related programs were further separated
into health, physical and general science. A general science category was created for participants
24
who indicated they were in a science program but did not specify which program. Participants’
average age was 19.72 and represented a diversity of races, 35% Caucasian, 14% Asian, 12%
South Asian, 9% Black, 8% South East Asian, 6% Arab/West Asian, 5% Latin American, 2%
Mixed, 2% Middle East, 1% Persian and 1% Aboriginal.
Table 1: Participant demographic information. Note: Each program was categorized by faculty.
Arts programs included Arts and Cultural Studies, Criminal Justice, Economics, English,
History, Politics, Psychology, Sociology, Environmental and Urban Sustainability and
Undeclared Arts. Communication and Design encompasses programs such as Film Studies and
Journalism. Community Services included Social Work, Urban Planning, Occupational Health
Sciences, and Nutrition, and Nursing, Child and Youth Care, Early Childhood Education.
Continuing Education were students who were enrolled in the Chang School Continuing
Education. Management were programs under Ted Rogers School of Management such as
Marketing and Human Resources. General Sciences included participants who indicated science
as their major. Health Science included Biology and Kinesiology. Physical Science included
Chemical Engineering and Chemistry. Unknown were participants who did not indicate a major.
n %
First Language
English 138 72.3
Non-English 53 27.7
Major
Non-Science Related
Arts 58 30.3
Communication and Design 2 1
Community Services 106 54.6
Continuing Education 1 .5
Management 3 1.5
Science Related
General Science 2 1,0
Health Science 9 4.7
Physical Science 2 1.5
Unknown 7 3.6
25
Measures
Math Identification: Upon initial sign-in to the undergraduate research pool, participants were
asked to complete a set of questionnaires. Within these surveys was a math identification
questionnaire specifically designed for this study. The questionnaire contained eight questions,
but only two were used to measure math identification based on previous research (Steele &
Aronson, 1995, Davies et al., 2002), “I am good at math” and “It is important to me that I am
good at math”. The other questions were used to mask the true purpose of the study to examine
STEM by including varying domains, e.g., “I am good at sports”, and “It is important to me that
I am good at sports”. Participants rated the items on a 7-point likert scale, 1(strongly disagree) to
7(strongly disagree). Similar to Steele and Aronson (1995), participants were considered math-
identified if they answered neither disagree nor agree, somewhat agree, agree or strongly agree to
both items. Steele and Aronson (1995) found stereotype threat effects utilizing this cut off and
previous research indicates that moderate math identification was more predictive of stereotype
threat than high identification (Nguyen & Ryan, 2008).
Math Self-Efficacy: Mathematics self-efficacy was measured with the 52-item Mathematics Self-
Efficacy Scale (MSES; Betz & Hackett, 1983). Participants were asked to rate on a ten-point
likert scale how confident they are in their abilities to successfully complete each math item (0 =
no confidence at all to 9 = complete confidence). For example, participants indicated their
confidence to figure out how much material to buy in order to make curtains, complete a calculus
course with a “B” grade, and perform problems such as “The average of three numbers is 30.
The fourth number is at least 10. What is the smallest average of the four numbers?” The
calculated reliability estimates in this study (α = .97) were similar to previous research (α = .96;
Betz & Hackett, 1983). Participant’s math self-efficacy score was calculated by using the mean
26
of all 52 items with higher scores indicating higher math self-efficacy.
Math Interest: Mathematics interests was measured exactly as previous studies examining
math/science interests of psychology undergraduates with a Math and Science Interests
Questionnaire (Byars-Winston & Fouad, 1998; Fouad & Smith, 1996). Participants were asked
to rate the degree to which they were interested in 17 science and math-related items (e.g.,
solving computer problems and taking math courses) on a seven-point likert scale from 1
(strongly dislike) to 7 (strongly like). Scores were calculated by taking the average of the 17
items. Similar to previous research (α = .90), this scale has shown good reliability (α = .91) in
previous studies involving undergraduate psychology students (Byars-Winston & Fouad, 1998).
Math and Science Intentions: In order to address issues in previous research (Whiton, 2008), this
study also asked participants to indicate their career intentions, in addition to their academic
intentions. The seven item Math and Science Intentions Goals (Byars-Winston & Fouad, 1998)
questionnaire was used to access intent to pursue STEM careers (e.g., “I intend to enter a career
that will use math”) and academics related to STEM (e.g., “If I was able to, I plan to take more
math classes in college/university than will be required of me). Participants were asked to rate
seven items on a seven-point likert scale, 1(strongly disagree) to 7(strongly agree). Participants’
scores were based on the average score. This scale has been previously used with a sample of
undergraduate psychology students with high internal consistency, α = .80 (Byars-Winston &
Fouad, 2008, Fouad & Smith, 1996) and was consistent with this study, α = .86.
STEM-Related Task Choice: Participants’ actual choice to engage in a STEM-related task was
measured analogous to Davies et al. (2002). Participants were asked to complete a set of 60
questions (30 verbal questions and 30 math questions) within 20 minutes (items are included in
Appendix A). The items were collected from previous Graduate Record Exam (GRE) tests from
27
2000-2013. Difficulty of the items was determined by the percentage of people who answered
the item correctly in past tests according to Educational Testing Services (ETS). The lower the
percentage, the more difficult the items was considered. Davies et al. (2002) adjusted the
difficulty of math and verbal questions as a precaution to control for the extra appeal of verbal
questions over math questions. Based on the ETS percentages, a similar adjustment was made so
that the average percentage of people who correctly answered the math items (52.24%) was
slightly higher compared to those who successfully completed the verbal items (46.73%).
Therefore, the verbal items were on average more difficult compared to the math items.
During the task, participants were informed they could choose to skip a question if they
did not wish to complete it. The items were counterbalanced (half the participants began the task
with a math question and the other half with verbal questions) and were presented in two rounds.
In Round 1 participants were presented all 60 items and in Round 2 they were able to attempt the
remaining items they had skipped. For example, if participants chose to complete all 30 math
items and all 30 verbal items before the 20 minutes elapsed, the task would end. However, if
participants chose to attempt 10 math questions and 10 verbal questions in Round 1, Round 2
would present the 20 math and 20 verbal questions skipped in Round 1. Participants score on the
task was based on total percentage of math items attempted, total percentage verbal items
attempted, total percentage math accuracy and total percentage verbal accuracy.
Perceived Career Barriers: The Career Barriers Inventory-Revised (CBI-R) was used to assess
differences in perceived employment barriers in the workplace. In response to SCCT’s emphasis
on perception of barriers in determining career actions and intentions, Swanson & Tokar (1991)
designed the original 102 item CBI, containing 18 subscales. However, due to the length of the
questionnaire and issues with wording and design, the questionnaire was shortened to 70 items
28
containing 13 subscales (Swanson et al., 1996). For this study, the questionnaire was slightly
modified to examine women’s perceptions of barriers in STEM careers rather than perceptions of
barriers in the general workplace.
Participants assessed how much they believe each item would keep them from achieving
future career goals if they pursued a career in STEM, on a 7-point likert scale from 1 (would not
hinder at all) to 7 (would completely hinder). In previous research, reliability measurements
indicate adequate to good internal consistency within each scale with Cronbach alphas ranging
from .64 to .86 for the various subscales from a sample of 100 college students (Swanson et al.,
1996). Participants’ perceptions of career barriers was calculated as the average of all 70 items.
Higher scores indicated a perception of greater career barriers within STEM. In this study the
calculated reliability was α = .97 for the entire measure.
Manipulation check: The Stigma Consciousness Questionnaire (SCQ; Pinel, 1999) was used to
determine whether the stereotype threat manipulation increases perceptions of stereotypes. The
questionnaire was developed to measure the extent to which people expect to be stereotyped by
others. Stigma consciousness is related to stereotype threat in that it measures one’s expectations
of being stereotyped rather than one’s own endorsement of stereotypes and therefore, only
requires awareness of stereotypes (Steele & Aronson, 1995) and can be affected by the situation.
Also participants who are high in stigma consciousness have been found to avoid stereotype-
relevant situations (Pinel, 1999). The SCQ for women consisted of ten items factor analyzed
from an original 16 items (e.g., “My being female does not influence how people act with me”).
Participants rated the ten items on a 7-point likert scale from 0 (strongly agree) to 6 (strongly
disagree). Eight of the ten items are reversed scored. Participants’ final score was an average of
the ten items, with higher scores representing higher stigma-consciousness. The questionnaire
29
has shown good reliability with α = .72 to .74 (Pinel, 1999), similar to calculated reliabilities in
this study α = .76.
Procedure
Data collection for the math identification questionnaire differed depending on the
method of recruitment. Upon initial registration onto the undergraduate research pool and prior
to signing up for any studies, all students enrolled in the two sections of Introduction to
Psychology at Ryerson University were given the option to voluntarily complete a set of
questionnaires. Within the questionnaires was the math identification questionnaire. If
participants chose to complete the questionnaire they would be able to view and sign up for the
current study. Participants recruited via posters placed around the Ryerson University campus
and who expressed interest to participate in the study contacted the researcher via email available
on the posters. The researcher then sent a Qualtrics link for the math identification questionnaire
to the potential participant. Upon completion, the researcher and participant scheduled an in-lab
session over email. It was important to have time elapse between completion of the math
identification and the study so participants would not be able to link the importance of math
identification to the study, keeping the hypotheses of the study undisclosed and to prevent
demand characteristics.
All female participants who completed the math identification questionnaire and
expressed interest in the study arrived in the lab under the pretense that the 90 minute study
considered predictors of career choice and intentions. Following informed consent, participants
were randomly assigned to one of three conditions (stereotype threat, stereotype nullification, or
control condition). Participants in the stereotype threat condition were presented the following
information: “Research has found that there are gender differences in math performance and
30
abilities, men tend to perform better than women. We are interested in how these gender
differences may affect predictors of career choice and intentions.” In order to further induce
stereotype threat, participants were asked to report their gender prior to completing the
questionnaire (Spencer et al., 1999; Schmader et al., 2004). In the stereotype nullification
condition, participants were informed, “Research has found that no gender differences exist in
math performance and abilities. We are interested in examining how other factors may predict
career choice and intentions.” Spencer et al. (1999) used these instructions and found that women
performed equal to men on the math test in this condition. Participants in the control condition
were simply told, “We are interested in examining predictors of career choice career intentions.”
Participants in the stereotype nullification and control condition were not asked to complete a
gender item.
Once participants were given the instructions, they were asked to complete measures of
math self-efficacy, math and science interests, math and science intentions, and perceptions of
career barriers on a desktop computer using Qualitrics. Following the completion of the
questionnaires, participants were told that the study would also measure performance as a
predictor of career intentions and intention through an aptitude test. Participants were informed
that they would have 20 minutes to complete as many of the 60 questions as possible. They were
told that they would be able to skip a question if they choose to do so; however, they must try to
complete as many questions until 20 minutes had passed. Participants completed the math/verbal
task after completing the questionnaires in order to prevent performance from affecting
responses on the questionnaire. After participants finished this task, they completed the SCQ as a
manipulation check, in addition to a demographics questionnaire, followed by debriefing.
31
Data Analysis
The Statistical Package for the Social Sciences (SPSS) v20 was used to statistically
analyze the data. Analyses involving intentions to pursue math and science (Hypothesis 1 and
sub hypotheses) were analyzed between-subjects, while within-subjects analyses were used to
analyze data from the math/verbal choice task (Hypothesis 2).
All sub-hypotheses examining the mediation of the effect of condition on intentions and
number of math items attempted by math self-efficacy, interests, and career barriers was
determined with INDIRECT syntax created by Preacher and Hayes (2004). Bootstrapping
method was used to test the significance of the indirect effect of mediators. The bootstrapping
method has been recommended over Baron and Kenny’s (1986) normal theory and Sobel’s
method for testing the mediational effect (Preacher & Hayes, 2004; Strout & Bolger, 2002; Zhao,
Lynch, & Chen, 2010). Although the mediational models present the regression coefficients for
the effects based on normal theory, the significance of the indirect effect will be determined
based on the recommendations of Preacher and Hayes (2004) due to the smaller sample size
required and greater power associated with the bootstrapping method.
The boot-strapping method for testing the significance of the indirect effect was set to
sample the data and create a sampling distribution of the indirect effect 5000 times, which is
standard in previous research (Zhao et al., 2010). Significance was determined with 95%
confidence intervals. If zero was not encompassed within the lower and upper limits, a
mediational effect was present.
Additionally, because of the lack of research specifically examining the social cognitive
factors that affect women’s STEM related choices, the primary purpose of this study was to
examine whether stereotypes influence women’s actual behavioural choices related to pursuing
32
STEM utilizing a STEM-related math/verbal choice task. To determine participants’ actual
choice on the math/verbal test, Round 1 and Round 2 math items were combined for a total
percentage of math items attempted and correctly answered. Meanwhile, Round 1 and Round 2
verbal questions were calculated together for a total percentage of verbal items attempted and
correctly answered. To confirm the combination of the two rounds was appropriate, paired
sample t-tests were used to determine whether grouping the rounds together affected the
percentage of items attempted and accuracy compared to percentage of items attempted and
correctly answered in Round 1. No significant difference indicated allowing participants to have
a second round did not greatly affect the number of items they attempted or their accuracy, so the
two rounds can be combined.
The repeated measure tests indicated that there was no significant difference between the
percentage of math items attempted, t(190) = .33, p > .05) or percentage of verbal items
attempted, t(190) = .15, p > .05); percentage of math items answered correctly, t(190) = .28, p
> .05); percentage of verbal items answered correctly, t(190) = .67, p > .05) between when the
two rounds were combined and Round 1. Therefore, all analyses of math and verbal items
represent total percentages of math and verbal items attempted and correctly answer in Round 1
and Round 2.
Several outliers were identified in the math/verbal test, with z-scores greater than 3.29
standard deviations from the mean. These outliers were replaced with the next case value with
the highest z-score + 1 (Field, 2009). This resolved the severe violations of normality
Kolmogoro-Sminov test of normality, p >.05 for percentage accuracy of math items, and reduced
the violation of normality for percentage accuracy of verbal questions p =.04. As ANOVA’s are
robust against violations of normality (Field, 2009), and the boot strapping method to analyze

33
mediation is a non-parametric test (Preacher & Hayes, 2004) the data were analyzed without
transformations.
34
3. RESULTS
Manipulation check
A one way-univariate analysis of variance was conducted to determine whether the
instructions activated gender stereotypes, with condition as the between subjects factor. The
results indicate that the manipulation did not significantly affect level of stereotype
consciousness between groups, F(2, 188) = .18, p > .05, ηp2 = .002. Participants in the stereotype
threat condition were not more conscious of gender stereotypes compared (M = 4.44, SD = .74)
participants in the control condition (M = 4.34, SD = .94) or stereotype nullification condition
(M = 4.40, SD = .93). Although there was a lack stereotype consciousness resulting from
manipulation, this may have been because of the explicit nature of the questions.
Stereotype threat and performance on the STEM-related task
The premise of this study was based on stereotype threat theory, which contends that
groups targeted by stereotypes predicting their lack of abilities will experience performance
decrements when they are placed in a relevant situation (Steele & Aronson, 1995). A mixed-
design ANOVA with type of question (math or verbal) as the within-subjects factor and
condition (stereotype threat, control, stereotype nullification) as the between-subjects factor was
used to determine the effect of stereotypes on accuracy percentage. A main effect of type of
question, F(1, 188) = 13.286, p < .001, ηp2 = .065 was found. Participants in all conditions
tended to correctly answer more verbal questions (M = 19.518, SD = 10.343) than math
questions (M = 16.064, SD = 9.797). However, this was also qualified by a significant
interaction between condition and type of question F(2, 188) = 3.809, p < .05, ηp2 = .039.
To further explore the interaction, one-sample paired t-test were conducted separately for
each condition with Holms-Bonferroni’s correction to control for Type 1 error since it is less
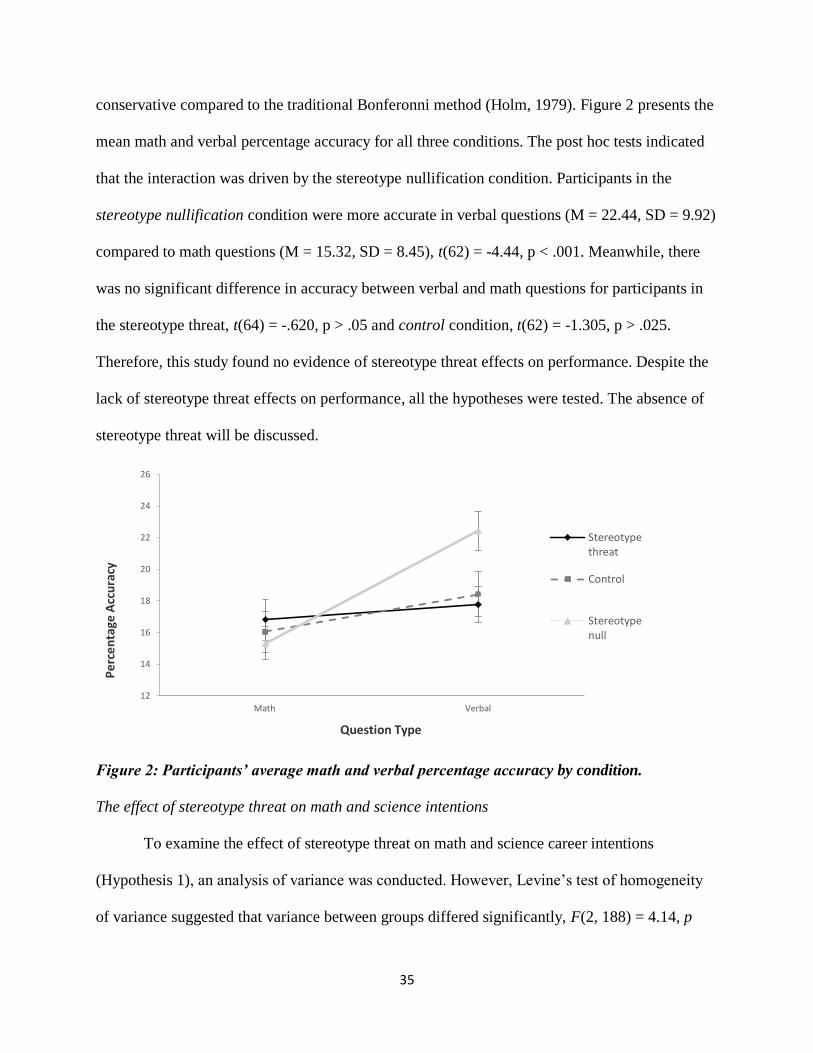
35
conservative compared to the traditional Bonferonni method (Holm, 1979). Figure 2 presents the
mean math and verbal percentage accuracy for all three conditions. The post hoc tests indicated
that the interaction was driven by the stereotype nullification condition. Participants in the
stereotype nullification condition were more accurate in verbal questions (M = 22.44, SD = 9.92)
compared to math questions (M = 15.32, SD = 8.45), t(62) = -4.44, p < .001. Meanwhile, there
was no significant difference in accuracy between verbal and math questions for participants in
the stereotype threat, t(64) = -.620, p > .05 and control condition, t(62) = -1.305, p > .025.
Therefore, this study found no evidence of stereotype threat effects on performance. Despite the
lack of stereotype threat effects on performance, all the hypotheses were tested. The absence of
stereotype threat will be discussed.
Figure 2: Participants’ average math and verbal percentage accuracy by condition.
The effect of stereotype threat on math and science intentions
To examine the effect of stereotype threat on math and science career intentions
(Hypothesis 1), an analysis of variance was conducted. However, Levine’s test of homogeneity
of variance suggested that variance between groups differed significantly, F(2, 188) = 4.14, p
12
14
16
18
20
22
24
26
Math Verbal
Pe
rce
nta
ge A
ccu
racy
Question Type
Stereotypethreat
Control
Stereotypenull
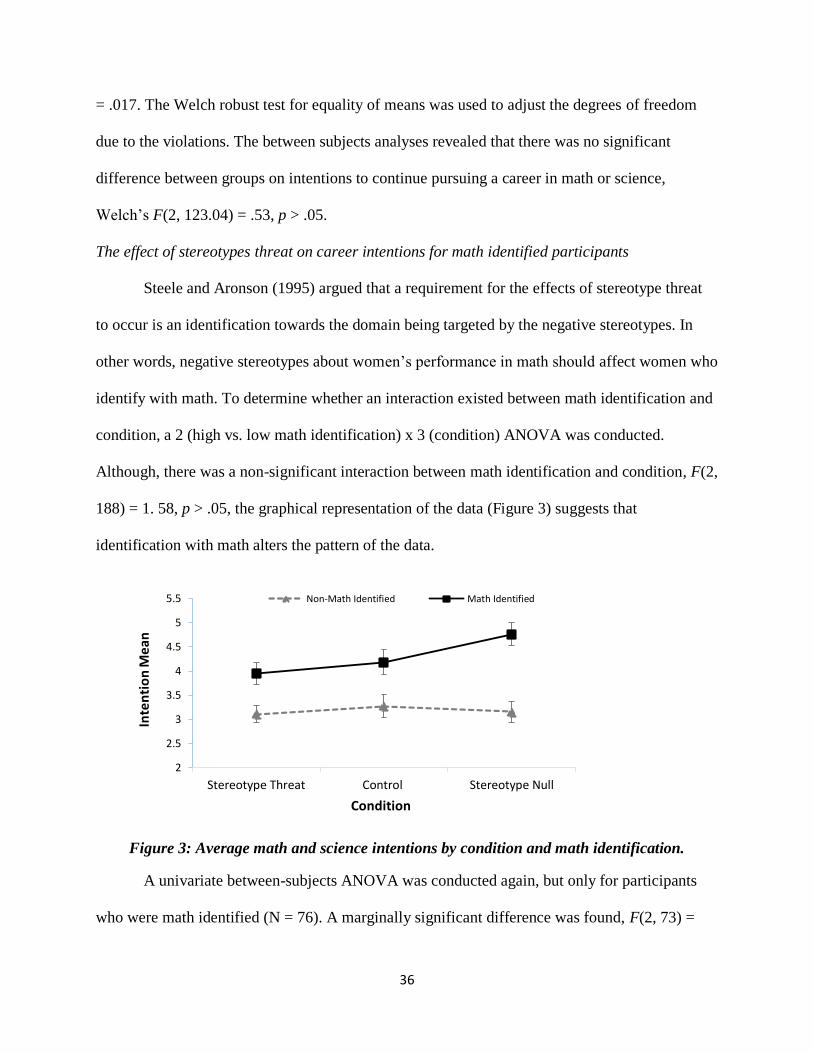
36
= .017. The Welch robust test for equality of means was used to adjust the degrees of freedom
due to the violations. The between subjects analyses revealed that there was no significant
difference between groups on intentions to continue pursuing a career in math or science,
Welch’s F(2, 123.04) = .53, p > .05.
The effect of stereotypes threat on career intentions for math identified participants
Steele and Aronson (1995) argued that a requirement for the effects of stereotype threat
to occur is an identification towards the domain being targeted by the negative stereotypes. In
other words, negative stereotypes about women’s performance in math should affect women who
identify with math. To determine whether an interaction existed between math identification and
condition, a 2 (high vs. low math identification) x 3 (condition) ANOVA was conducted.
Although, there was a non-significant interaction between math identification and condition, F(2,
188) = 1. 58, p > .05, the graphical representation of the data (Figure 3) suggests that
identification with math alters the pattern of the data.
Figure 3: Average math and science intentions by condition and math identification.
A univariate between-subjects ANOVA was conducted again, but only for participants
who were math identified (N = 76). A marginally significant difference was found, F(2, 73) =
2
2.5
3
3.5
4
4.5
5
5.5
Stereotype Threat Control Stereotype Null
Inte
nti
on
Me
an
Condition
Non-Math Identified Math Identified
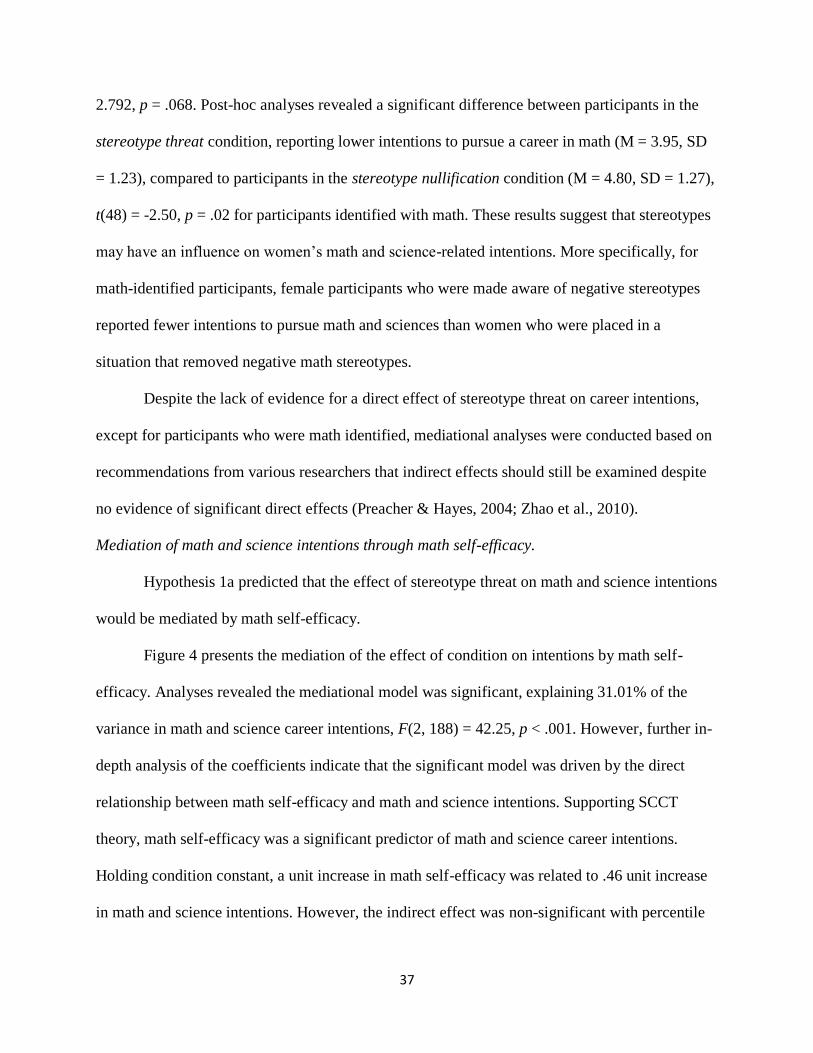
37
2.792, p = .068. Post-hoc analyses revealed a significant difference between participants in the
stereotype threat condition, reporting lower intentions to pursue a career in math (M = 3.95, SD
= 1.23), compared to participants in the stereotype nullification condition (M = 4.80, SD = 1.27),
t(48) = -2.50, p = .02 for participants identified with math. These results suggest that stereotypes
may have an influence on women’s math and science-related intentions. More specifically, for
math-identified participants, female participants who were made aware of negative stereotypes
reported fewer intentions to pursue math and sciences than women who were placed in a
situation that removed negative math stereotypes.
Despite the lack of evidence for a direct effect of stereotype threat on career intentions,
except for participants who were math identified, mediational analyses were conducted based on
recommendations from various researchers that indirect effects should still be examined despite
no evidence of significant direct effects (Preacher & Hayes, 2004; Zhao et al., 2010).
Mediation of math and science intentions through math self-efficacy.
Hypothesis 1a predicted that the effect of stereotype threat on math and science intentions
would be mediated by math self-efficacy.
Figure 4 presents the mediation of the effect of condition on intentions by math self-
efficacy. Analyses revealed the mediational model was significant, explaining 31.01% of the
variance in math and science career intentions, F(2, 188) = 42.25, p < .001. However, further in-
depth analysis of the coefficients indicate that the significant model was driven by the direct
relationship between math self-efficacy and math and science intentions. Supporting SCCT
theory, math self-efficacy was a significant predictor of math and science career intentions.
Holding condition constant, a unit increase in math self-efficacy was related to .46 unit increase
in math and science intentions. However, the indirect effect was non-significant with percentile
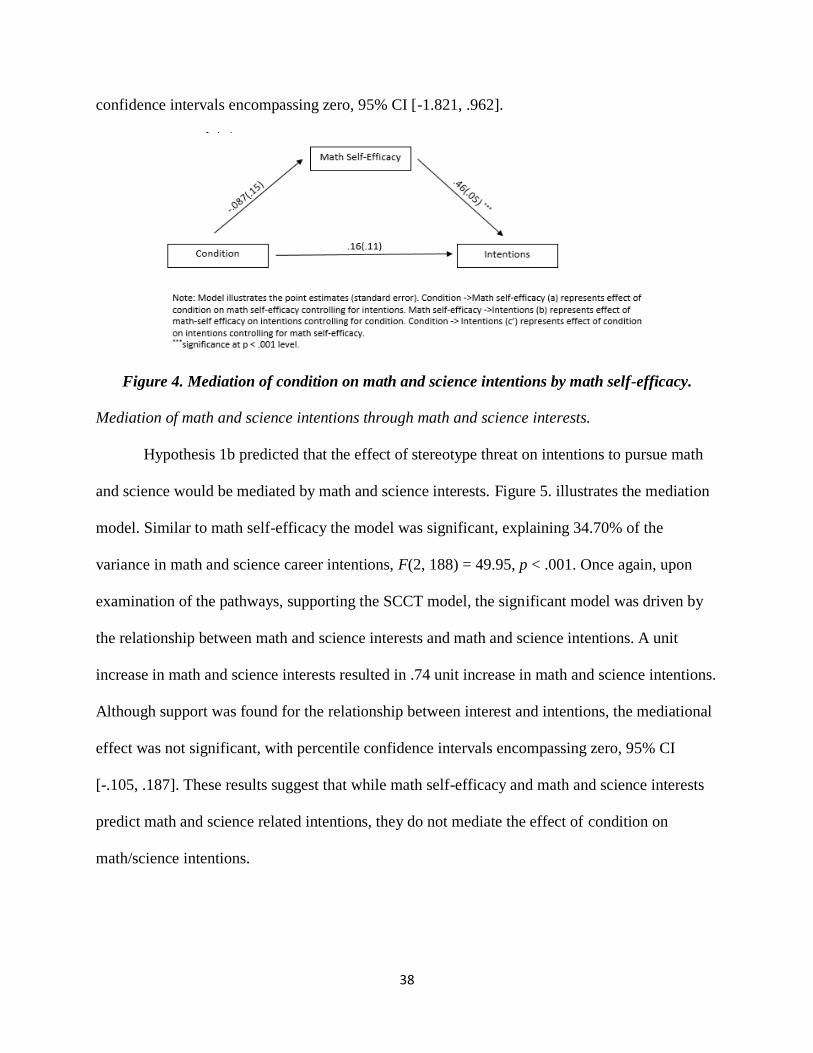
38
confidence intervals encompassing zero, 95% CI [-1.821, .962].
Figure 4. Mediation of condition on math and science intentions by math self-efficacy.
Mediation of math and science intentions through math and science interests.
Hypothesis 1b predicted that the effect of stereotype threat on intentions to pursue math
and science would be mediated by math and science interests. Figure 5. illustrates the mediation
model. Similar to math self-efficacy the model was significant, explaining 34.70% of the
variance in math and science career intentions, F(2, 188) = 49.95, p < .001. Once again, upon
examination of the pathways, supporting the SCCT model, the significant model was driven by
the relationship between math and science interests and math and science intentions. A unit
increase in math and science interests resulted in .74 unit increase in math and science intentions.
Although support was found for the relationship between interest and intentions, the mediational
effect was not significant, with percentile confidence intervals encompassing zero, 95% CI
[-.105, .187]. These results suggest that while math self-efficacy and math and science interests
predict math and science related intentions, they do not mediate the effect of condition on
math/science intentions.
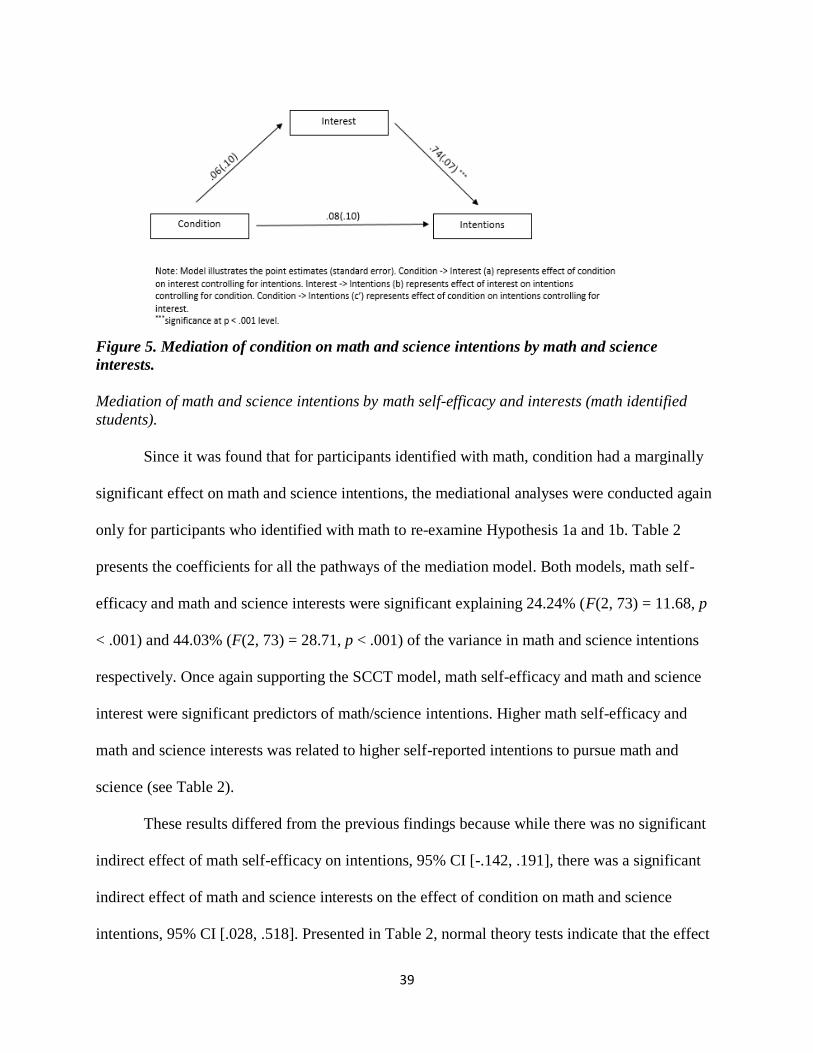
39
Figure 5. Mediation of condition on math and science intentions by math and science
interests.
Mediation of math and science intentions by math self-efficacy and interests (math identified
students).
Since it was found that for participants identified with math, condition had a marginally
significant effect on math and science intentions, the mediational analyses were conducted again
only for participants who identified with math to re-examine Hypothesis 1a and 1b. Table 2
presents the coefficients for all the pathways of the mediation model. Both models, math self-
efficacy and math and science interests were significant explaining 24.24% (F(2, 73) = 11.68, p
< .001) and 44.03% (F(2, 73) = 28.71, p < .001) of the variance in math and science intentions
respectively. Once again supporting the SCCT model, math self-efficacy and math and science
interest were significant predictors of math/science intentions. Higher math self-efficacy and
math and science interests was related to higher self-reported intentions to pursue math and
science (see Table 2).
These results differed from the previous findings because while there was no significant
indirect effect of math self-efficacy on intentions, 95% CI [-.142, .191], there was a significant
indirect effect of math and science interests on the effect of condition on math and science
intentions, 95% CI [.028, .518]. Presented in Table 2, normal theory tests indicate that the effect
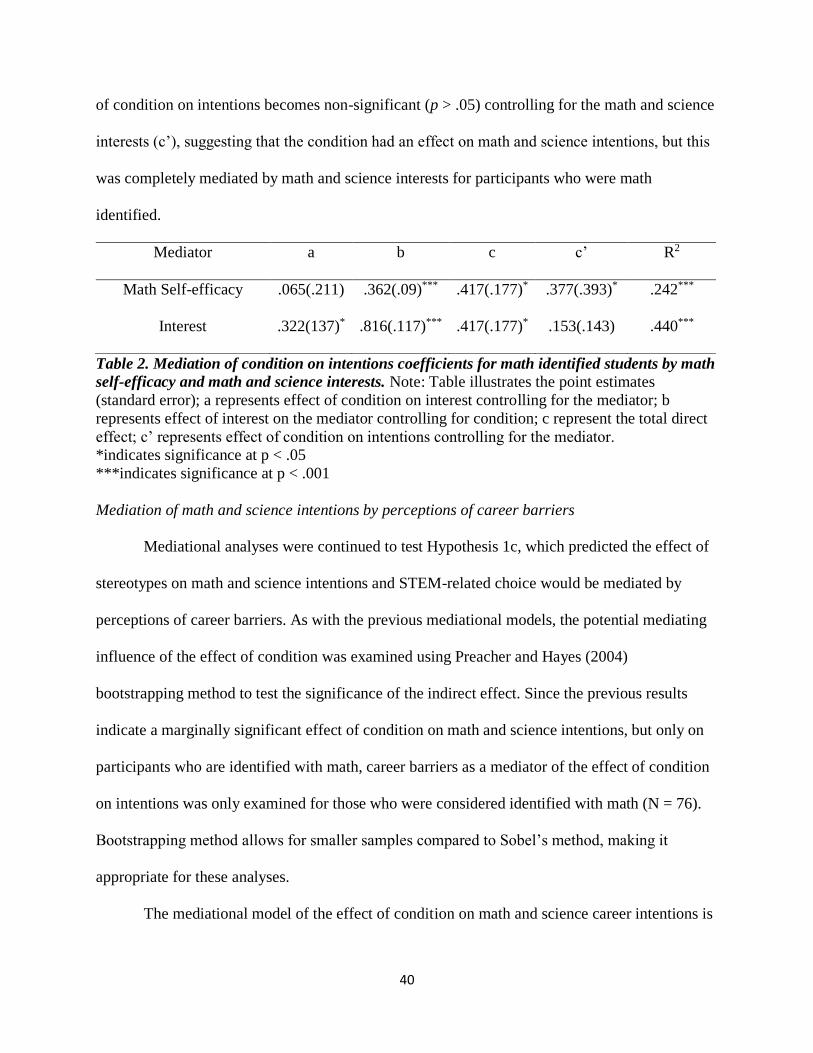
40
of condition on intentions becomes non-significant (p > .05) controlling for the math and science
interests (c’), suggesting that the condition had an effect on math and science intentions, but this
was completely mediated by math and science interests for participants who were math
identified.
Mediator a b c c’ R2
Math Self-efficacy .065(.211) .362(.09)*** .417(.177)* .377(.393)* .242***
Interest .322(137)* .816(.117)*** .417(.177)* .153(.143) .440***
Table 2. Mediation of condition on intentions coefficients for math identified students by math
self-efficacy and math and science interests. Note: Table illustrates the point estimates
(standard error); a represents effect of condition on interest controlling for the mediator; b
represents effect of interest on the mediator controlling for condition; c represent the total direct
effect; c’ represents effect of condition on intentions controlling for the mediator. *indicates significance at p < .05
***indicates significance at p < .001
Mediation of math and science intentions by perceptions of career barriers
Mediational analyses were continued to test Hypothesis 1c, which predicted the effect of
stereotypes on math and science intentions and STEM-related choice would be mediated by
perceptions of career barriers. As with the previous mediational models, the potential mediating
influence of the effect of condition was examined using Preacher and Hayes (2004)
bootstrapping method to test the significance of the indirect effect. Since the previous results
indicate a marginally significant effect of condition on math and science intentions, but only on
participants who are identified with math, career barriers as a mediator of the effect of condition
on intentions was only examined for those who were considered identified with math (N = 76).
Bootstrapping method allows for smaller samples compared to Sobel’s method, making it
appropriate for these analyses.
The mediational model of the effect of condition on math and science career intentions is
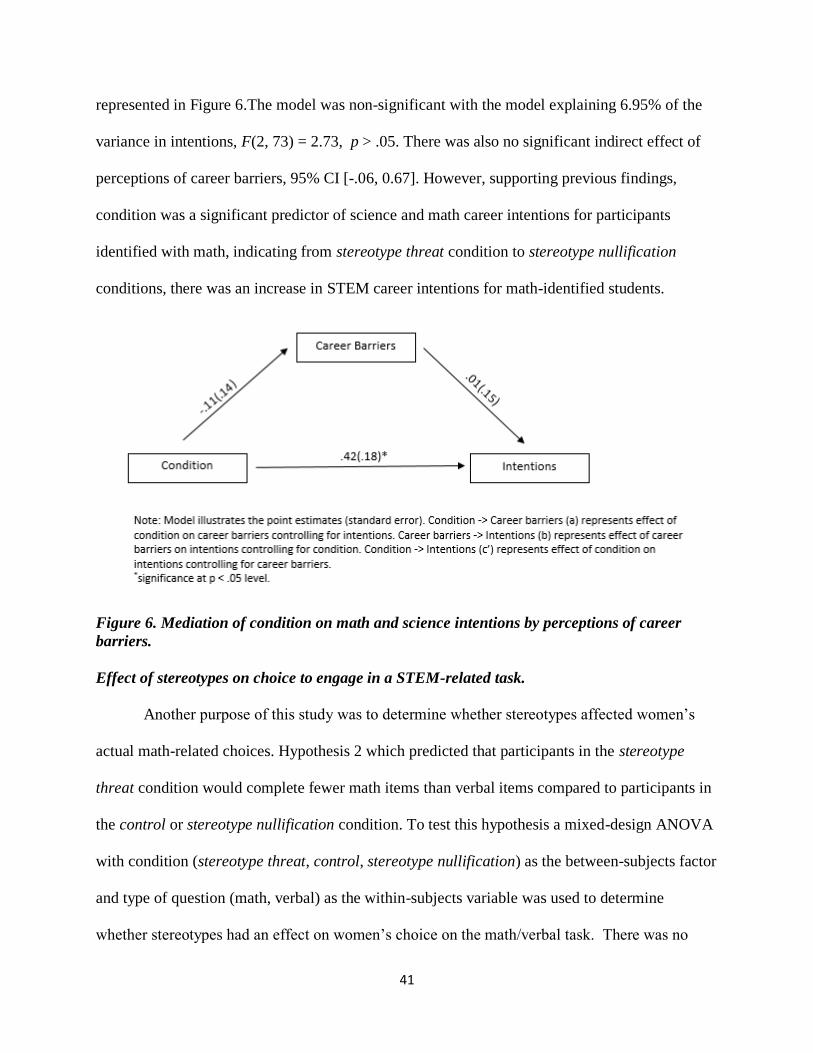
41
represented in Figure 6.The model was non-significant with the model explaining 6.95% of the
variance in intentions, F(2, 73) = 2.73, p > .05. There was also no significant indirect effect of
perceptions of career barriers, 95% CI [-.06, 0.67]. However, supporting previous findings,
condition was a significant predictor of science and math career intentions for participants
identified with math, indicating from stereotype threat condition to stereotype nullification
conditions, there was an increase in STEM career intentions for math-identified students.
Figure 6. Mediation of condition on math and science intentions by perceptions of career
barriers.
Effect of stereotypes on choice to engage in a STEM-related task.
Another purpose of this study was to determine whether stereotypes affected women’s
actual math-related choices. Hypothesis 2 which predicted that participants in the stereotype
threat condition would complete fewer math items than verbal items compared to participants in
the control or stereotype nullification condition. To test this hypothesis a mixed-design ANOVA
with condition (stereotype threat, control, stereotype nullification) as the between-subjects factor
and type of question (math, verbal) as the within-subjects variable was used to determine
whether stereotypes had an effect on women’s choice on the math/verbal task. There was no
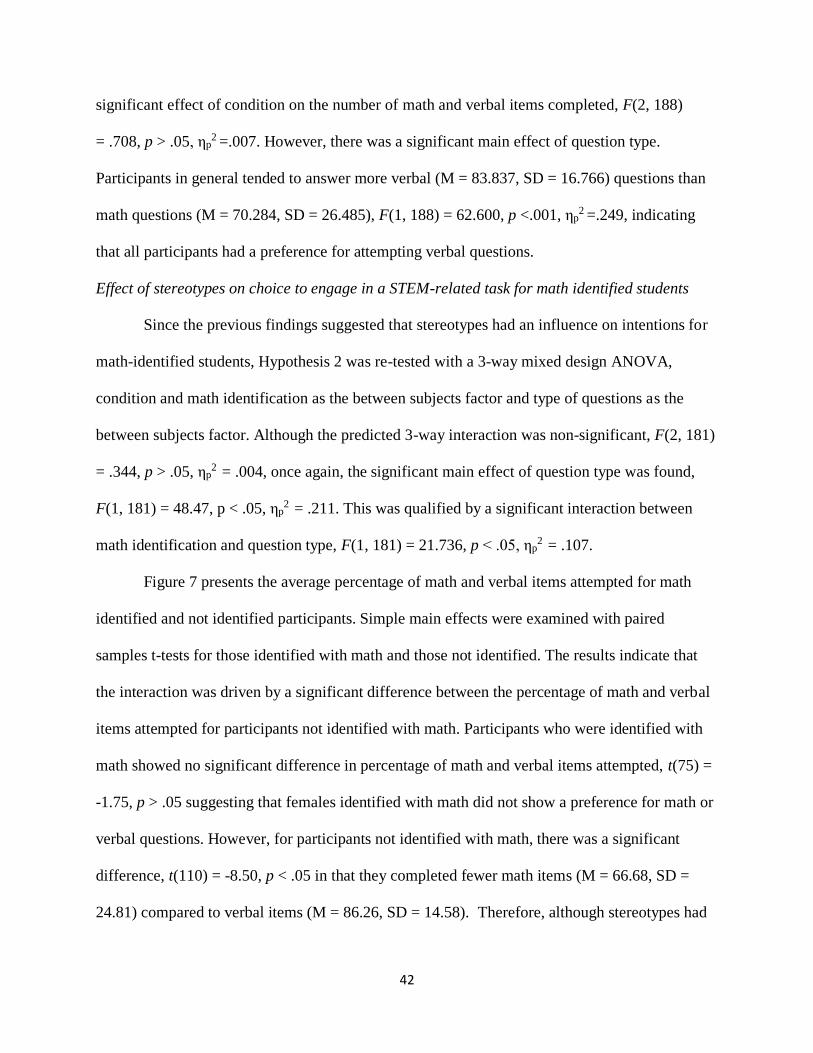
42
significant effect of condition on the number of math and verbal items completed, F(2, 188)
= .708, p > .05, ηp2 =.007. However, there was a significant main effect of question type.
Participants in general tended to answer more verbal (M = 83.837, SD = 16.766) questions than
math questions (M = 70.284, SD = 26.485), F(1, 188) = 62.600, p <.001, ηp2 =.249, indicating
that all participants had a preference for attempting verbal questions.
Effect of stereotypes on choice to engage in a STEM-related task for math identified students
Since the previous findings suggested that stereotypes had an influence on intentions for
math-identified students, Hypothesis 2 was re-tested with a 3-way mixed design ANOVA,
condition and math identification as the between subjects factor and type of questions as the
between subjects factor. Although the predicted 3-way interaction was non-significant, F(2, 181)
= .344, p > .05, ηp2 = .004, once again, the significant main effect of question type was found,
F(1, 181) = 48.47, p < .05, ηp2 = .211. This was qualified by a significant interaction between
math identification and question type, F(1, 181) = 21.736, p < .05, ηp2 = .107.
Figure 7 presents the average percentage of math and verbal items attempted for math
identified and not identified participants. Simple main effects were examined with paired
samples t-tests for those identified with math and those not identified. The results indicate that
the interaction was driven by a significant difference between the percentage of math and verbal
items attempted for participants not identified with math. Participants who were identified with
math showed no significant difference in percentage of math and verbal items attempted, t(75) =
-1.75, p > .05 suggesting that females identified with math did not show a preference for math or
verbal questions. However, for participants not identified with math, there was a significant
difference, t(110) = -8.50, p < .05 in that they completed fewer math items (M = 66.68, SD =
24.81) compared to verbal items (M = 86.26, SD = 14.58). Therefore, although stereotypes had
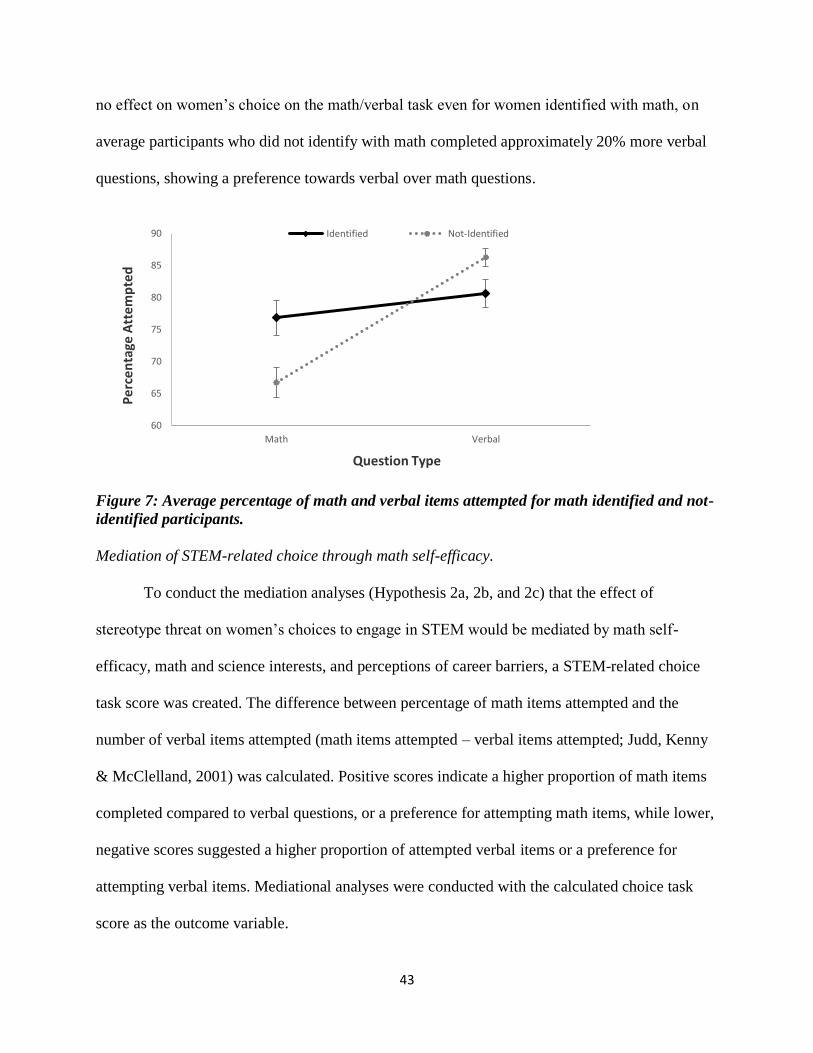
43
no effect on women’s choice on the math/verbal task even for women identified with math, on
average participants who did not identify with math completed approximately 20% more verbal
questions, showing a preference towards verbal over math questions.
Figure 7: Average percentage of math and verbal items attempted for math identified and not-
identified participants.
Mediation of STEM-related choice through math self-efficacy.
To conduct the mediation analyses (Hypothesis 2a, 2b, and 2c) that the effect of
stereotype threat on women’s choices to engage in STEM would be mediated by math self-
efficacy, math and science interests, and perceptions of career barriers, a STEM-related choice
task score was created. The difference between percentage of math items attempted and the
number of verbal items attempted (math items attempted – verbal items attempted; Judd, Kenny
& McClelland, 2001) was calculated. Positive scores indicate a higher proportion of math items
completed compared to verbal questions, or a preference for attempting math items, while lower,
negative scores suggested a higher proportion of attempted verbal items or a preference for
attempting verbal items. Mediational analyses were conducted with the calculated choice task
score as the outcome variable.
60
65
70
75
80
85
90
Math Verbal
Pe
rce
nta
ge A
tte
mp
ted
Question Type
Identified Not-Identified
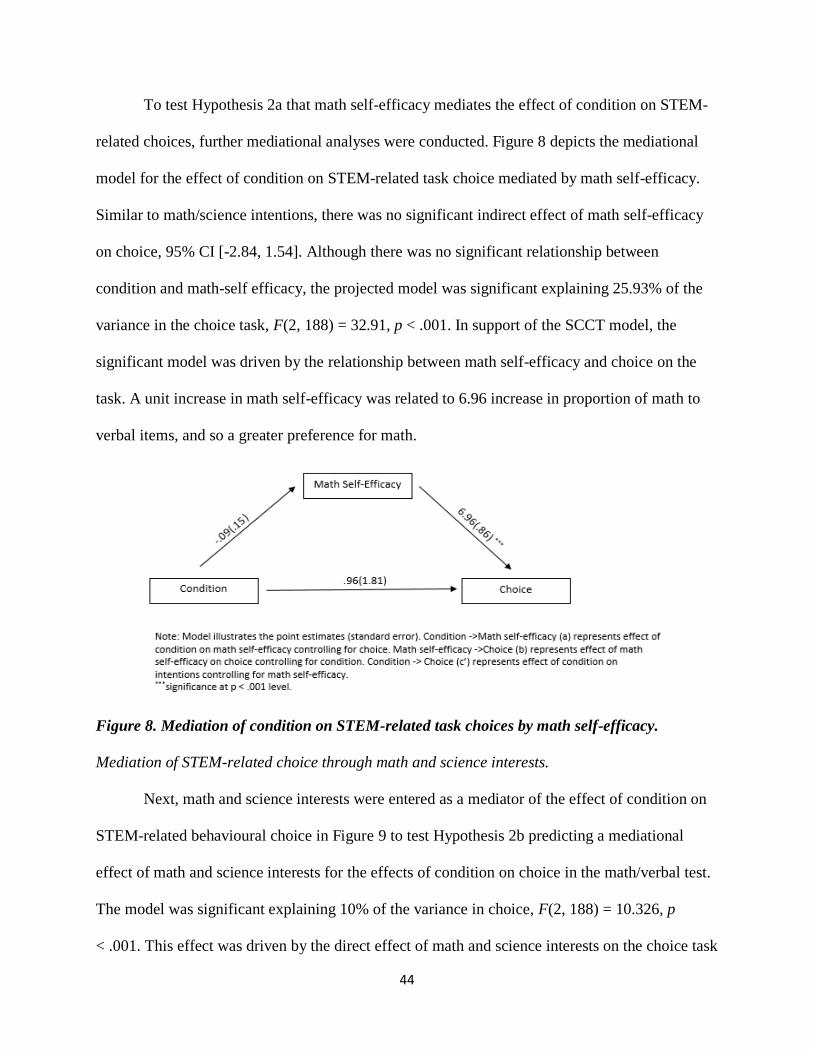
44
To test Hypothesis 2a that math self-efficacy mediates the effect of condition on STEM-
related choices, further mediational analyses were conducted. Figure 8 depicts the mediational
model for the effect of condition on STEM-related task choice mediated by math self-efficacy.
Similar to math/science intentions, there was no significant indirect effect of math self-efficacy
on choice, 95% CI [-2.84, 1.54]. Although there was no significant relationship between
condition and math-self efficacy, the projected model was significant explaining 25.93% of the
variance in the choice task, F(2, 188) = 32.91, p < .001. In support of the SCCT model, the
significant model was driven by the relationship between math self-efficacy and choice on the
task. A unit increase in math self-efficacy was related to 6.96 increase in proportion of math to
verbal items, and so a greater preference for math.
Figure 8. Mediation of condition on STEM-related task choices by math self-efficacy.
Mediation of STEM-related choice through math and science interests.
Next, math and science interests were entered as a mediator of the effect of condition on
STEM-related behavioural choice in Figure 9 to test Hypothesis 2b predicting a mediational
effect of math and science interests for the effects of condition on choice in the math/verbal test.
The model was significant explaining 10% of the variance in choice, F(2, 188) = 10.326, p
< .001. This effect was driven by the direct effect of math and science interests on the choice task
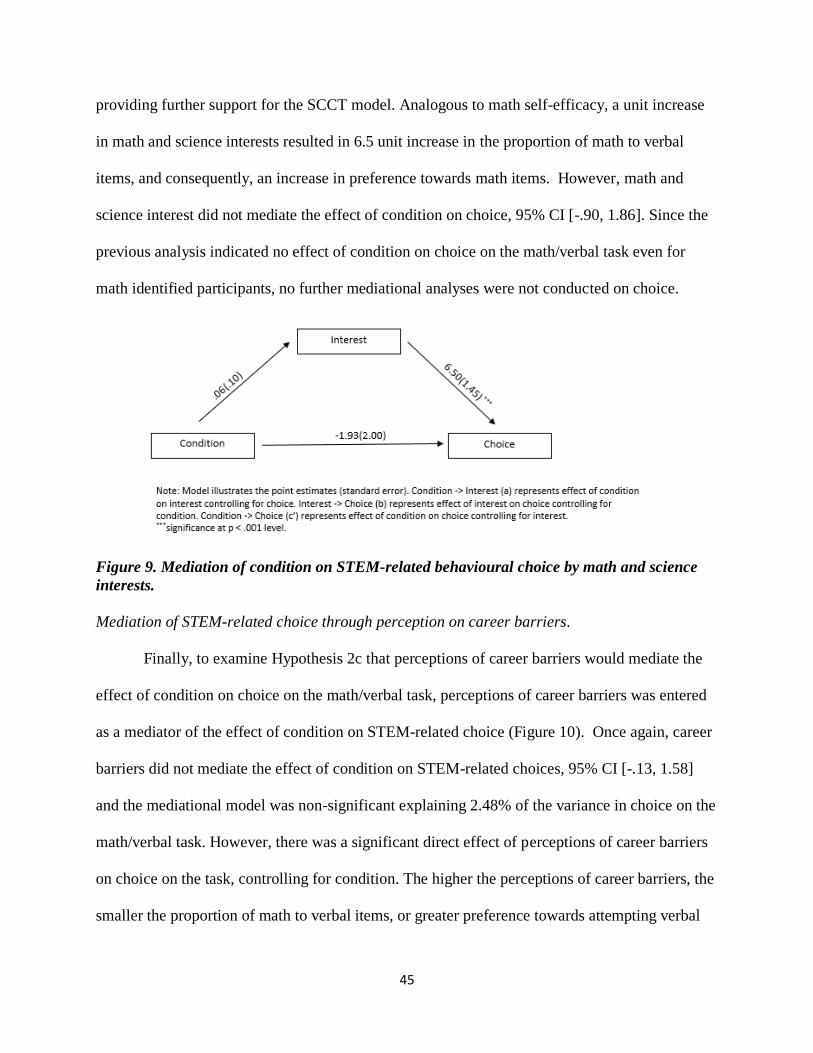
45
providing further support for the SCCT model. Analogous to math self-efficacy, a unit increase
in math and science interests resulted in 6.5 unit increase in the proportion of math to verbal
items, and consequently, an increase in preference towards math items. However, math and
science interest did not mediate the effect of condition on choice, 95% CI [-.90, 1.86]. Since the
previous analysis indicated no effect of condition on choice on the math/verbal task even for
math identified participants, no further mediational analyses were not conducted on choice.
Figure 9. Mediation of condition on STEM-related behavioural choice by math and science
interests.
Mediation of STEM-related choice through perception on career barriers.
Finally, to examine Hypothesis 2c that perceptions of career barriers would mediate the
effect of condition on choice on the math/verbal task, perceptions of career barriers was entered
as a mediator of the effect of condition on STEM-related choice (Figure 10). Once again, career
barriers did not mediate the effect of condition on STEM-related choices, 95% CI [-.13, 1.58]
and the mediational model was non-significant explaining 2.48% of the variance in choice on the
math/verbal task. However, there was a significant direct effect of perceptions of career barriers
on choice on the task, controlling for condition. The higher the perceptions of career barriers, the
smaller the proportion of math to verbal items, or greater preference towards attempting verbal
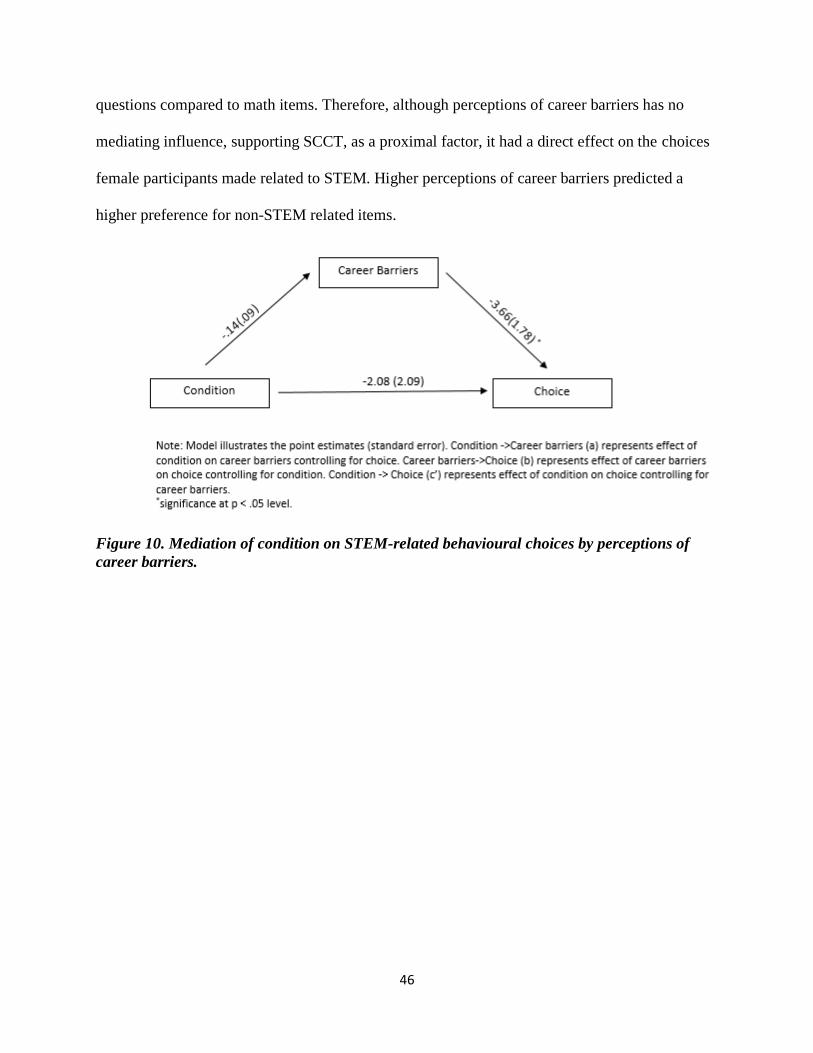
46
questions compared to math items. Therefore, although perceptions of career barriers has no
mediating influence, supporting SCCT, as a proximal factor, it had a direct effect on the choices
female participants made related to STEM. Higher perceptions of career barriers predicted a
higher preference for non-STEM related items.
Figure 10. Mediation of condition on STEM-related behavioural choices by perceptions of
career barriers.
47
4. DISCUSSION
Major Findings
In light of the ongoing underrepresentation of women in Science, Technology,
Engineering, and Math (STEM) fields, despite the accomplishments women have made in the
workplace (Lindsay & Almey, 2006; McKenzie, 2007, NSERC, 2010), this research aimed to
examine the social and cognitive factors that influence women’s intentions and actual STEM-
related choices. Of particular interest was the effect of reminding women of gender stereotypes
on women’s math and science intentions and choices to pursue STEM. The current study also
sought to utilize the Social Cognitive Career Theory model (Lent et al., 1994) to examine the
mediating influence of self-efficacy, interests, and perceptions of career barriers.
Similar to previous research (Byars-Winston & Fouad, 2008; Fouad & Smith, 1996; Lent,
Brown, Schmidt, Brenner, Lyons, & Treistman, 2000; Lent, Brown, Brenner, Chopra, Davis,
Talleyrand, & Suthakaran, 2001; Lent, Lopez, & Biescke, 1993; Lent, Lopez, Lopez, & Sheu,
2008; Nauta & Epperson, 2003; Nauta, Epperson, & Kahn, 1998; Lent, Lopez & Biechke,
1991;1993) this study found overwhelming support for several proposed pathways of the SCCT
model. For women, higher math self-efficacy and math/science interests predicted greater
intentions to pursue math and science and a greater likelihood of engaging in math-related items.
This research suggests that cognitive factors, such as women’s confidence in their abilities in
math and their liking of math and science activities play a major role in women’s
underrepresentation in STEM. Fortunately, research supporting the use of interventions to
increase self-efficacy and interests through performance accomplishment (Luzzo et al., 1999)
indicates self-efficacy and interests are malleable and should be targeted in order to increase
women’s participation within STEM. However, the findings also point to influences that may
48
hinder progress on closing the gender gap in STEM fields.
In addition to self-efficacy and interest as predictors of STEM related intentions and
choices, this research also found that as proposed by SCCT (Lent et al., 2000a), perceiving
career barriers may hinder women’s actual behaviour. Regardless of condition, perceiving more
career barriers within STEM was related to answering more verbal questions than math
questions, or an avoidance of math. This is not surprising considering that the high turnover for
women in STEM is related to career barriers including lack of opportunities and experiencing
hostile environments (Xu, 2008). This suggests that major structural, organizational and
environmental changes need to be made to increase women’s pursuit of STEM-related fields.
Another environmental change includes the influence of stereotypes.
A major purpose and contribution made by this study was to examine the effect of
stereotypes on women’s intentions and STEM-related choices and the mediating influence of
cognitive factors proposed by SCCT (Lent et al., 1994). Despite research suggesting that
stereotype threat may not only influence performance, but also womens choice to pursue STEM
(Steele, 1997), little research has explored these assumptions and the associated mediating
factors. Providing partial support for Hypothesis 1, there was a marginally significant effect of
condition on women’s intentions to pursue STEM. Women in the stereotype threat condition
reported lower intentions to pursue science and math related tasks compared to participants in the
stereotype nullification condition. However, this was only the case for math-identified
participants which supports stereotype threat research on performance (Schmader et al., 2004),
and does not support the findings from Whiton (2008). The inconsistency was probably due to
the fact that Whiton (2008) did not utilize math identification cut-offs, highlighting the
importance of math identification to examining stereotype threat effects on intentions and not
49
just performance. This suggests that stereotypes may influence women’s intentions to further
pursue math and science when they perceive math as an important part of their identity.
Furthermore, supporting Hypothesis 1b, this effect was mediated by math and science
interests. From the stereotype threat to the stereotype nullification condition, there was an
increase in math and science interests and this was related to higher math and science intentions.
Future experimental research needs to be examined to determine whether stereotype threat
decreases or removing stereotypes from the situation improves women’s math and science
interests and subsequently women’s math and science intentions. Past research does indicate that
women who endorse gender stereotypes report lower interest in math (Schmader et al., 2004).
Nevertheless, this research suggests that stereotypes are an environmental factor that contributes
to the ongoing gender disparity in STEM.
Unsupported hypotheses and future directions
Although, the study sought to examine stereotype threat, similar to Whiton (2008), this
research found no evidence of traditional stereotype threat effects on performance, contradicting
previous research (Davies et al., 2002; Schmader et al., 2004; Spencer et al., 1999; Steele &
Aronson, 1995). Female participants who were reminded of negative gender stereotypes did not
show detriments in performance on the math/verbal task. Participants performed equally well in
the stereotype threat, stereotype nullification and control condition on the math items. In fact,
female participants in the stereotype nullification condition actually performed better on the
verbal items than those in the stereotype threat condition. Rather than the manipulation, this may
be due to the general preference for verbal questions and that participants in the stereotype
nullification condition attempted significantly more questions compared to the other conditions.
Considering the relationship between self-efficacy, intentions and performance based on the
50
SCCT model (Lent et al., 2004), attempting more verbal questions may indicate that participants
in the stereotype nullification condition also had a preference for these questions because they
were more confident in their abilities to complete the verbal items. This study did not measure
verbal-related self-efficacy, but future research should incorporate these measures.
Further, the lack of stereotype threat effects on performance in the math/verbal task may
have been a result of the sample from which the participants were selected. Stereotype threat
researchers have often stressed the importance of domain identification on testing the effect of
stereotypes on performance (Davies et al., 2001; Spencer et al., 1999; Steele & Aronson, 1995).
In fact, Steele (1997) outlined domain identification as a requirement for stereotype threat
effects. In a recent meta-analysis on the moderating influence of domain identification, Nguyen
and colleagues (2008) found that moderate identification rather than high identification was a
better predictor for finding evidence of stereotype threat effect on performance. Although pre-
screen measures were taken to control for math identification, the majority of the sample was not
identified with math (n = 111). Approximately two thirds of the total sample were non-math
identified and excluded from analyses that involved math identification while already using a
generous categorization scheme similar to the one used by Steele & Aronson (1995).
Also, there was a general preference for completing verbal items evident even for
participants who self-reported as math identified. This contradicts previous findings that highly
math identified participants show a preference for math items (Davies et al., 2002). Yet this
finding was not surprising considering the majority of the female students who participated in
this study were majoring in arts programs, which focus on writing and verbal skills rather than
math. The majority of the student’s majors do not require a math class outside of an introduction
to statistics. As well, to retain more data, the standard used to determine whether participants
51
were math identified was lower compared to Davies et al. (2002) which only included
participants who answered strongly agree to both math identification questions. This suggests the
sample of undergraduate students from the Ryerson Psychology research pool may not have been
an ideal sample for testing stereotype threat effects as a result of the lower emphasis in math.
Indeed, Whiton (2008) used a recruitment method similar to the present study. Participants in
Whiton’s (2008) study were not math and science majors or highly math identified, contrasting
previous research supporting stereotype threat (Davies et al., 2002; Schmader et al., 2004;
Spencer et al., 1999). While attempts were made to recruit participants from math and science
related fields, this was less successful. Future research should be conducted on participants who
are already enrolled in a math or science-related major or students who are considering pursuing
a math or science major.
Additionally, analyses did not support Hypothesis 2; stereotypes had no influence on
women’s STEM-related behavioural choice. Unlike previous research (Davies et al., 2002;
Schmader et al., 2004) female participants who were made aware of gender math stereotypes
were not more likely to attempt verbal questions compared to math questions. This finding can
be attributed to various reasons. Firstly, there was a general preference for completing verbal
questions. Once again, this may have been that due to the demographics of the sample. There
was a general tendency to avoid math items, perhaps because of an already instilled fear of math
items. Indeed, several students voiced concerns regarding the aptitude test, including asking
specifically whether math items were present, expressing a fear math, and some participants
directly stated that they would skip all the math items prior to even viewing the questions. These
comments were not surprising considering research indicates that women in general tend to
report lower interests, self-efficacy and self-concept in math and sciences and that these effects
52
increase with age and gender difference in math and science self-efficacy and interests are most
evident in women after middle school (Else-Quest et al., 2010; Hyde et al., 1990). This pre-
existing aversion towards math may have masked the effect of stereotypes on actual behaviour.
Future research may include a questionnaire to determine fear of math as a pre-screen or prior to
completing the math/verbal test to control for initial math fear.
The results also indicate an inconsistency between intentions and actual choice. For math
identified participants, stereotypes appeared to influence math and science intentions, but not
actual choices. Although the fear of completing math questions may have contributed to the
discrepancy, it may also be due to the difficulty of the items and the nature of the choice task
which measured activity choice rather than career-related choices. Efforts were made to replicate
Davies et al. (2002) to account for the greater difficulty and time required to complete the math
items. However, the items may have still been a challenge for students not majoring in math or
science. This larger impediment may have overshadowed the more subtle effect of stereotype
threat. Steele (1997) argued that stereotype threat is most evident in complex tasks because
difficult items results in anxiety that may confirm the stereotype and in turn affect performance
on the complicated task. Indeed, working memory has been found to be affected under stereotype
threat conditions (Beilock, Rydell, & McConnell, 2007; Schmader & Johns, 2003). Tasks that
are easier are less likely to produce anxiety and do not require much thought to perform and so
decrease the chance of stereotype threat. Keller (2007) found that stereotype threat effects were
not evident on easy math items, but were found for participants that completed difficult math
items. This is consistent in stereotype threat research (Nguyen & Ryan, 2008). However, because
of the limited research examining the stereotype threat and actual behavioural choices, there is
no evidence that task difficulty moderates the effect of stereotypes on choice. It is plausible that
53
stereotype threat and task difficulty interact to suppress stereotype threat effects on STEM-
related choices. Future research should explore this possibility.
Despite the mediation of condition effect on math and science intentions by math and
science interests (Hypothesis 1b), a liking towards math and science did not mediate the effect of
condition on choice (Hypothesis 2b). Moreover, math self-efficacy (Hypothesis 1a and 2a
respectively) and perceptions of career barriers (Hypothesis 1c and 2c respectively) did not
mediate the effect of condition on math and science intentions or STEM-related choices.
There may be several reasons that math self-efficacy did not mediate the relationship
between condition and intentions to pursue math and science domains. In retrospect, the math
self-efficacy questionnaire was designed in 1983 by Betz and Hackett to measure one’s
confidence in their abilities to complete various types of math-related items. Meanwhile, the
intentions and interest measures were designed by Fouad and Smith (1996) together to measure
intentions and interests in the same domains, math and science. However, the Math Self-Efficacy
Scale was not designed to also measure self-efficacy in science. As such, the predictive validity
of the math and science interests’ questionnaire for the math and science career intentions may
have been higher. Future research should be conducted with measures of self-efficacy that also
measures self-efficacy in science related domains.
Limitations
There were several limitations to this study that affect the interpretation of the results.
Firstly, as mentioned previously, the majority of the students were majoring in arts-related or
community service programs which require at most an introduction class to statistics, rather than
math and science-related courses. Also, all of the participants were Ryerson University students
recruited from the undergraduate research pool or posters. Therefore the generalizability of this
54
research is limited and this may have played a major role in the non-significant findings in the
data since most students did not identify with math. Secondly, the ethnicity of participants was
varied and may have also contributed to the non-significant findings on the math/verbal choice
task. The majority of research on stereotype threat focuses on Caucasian females due to the
variation in stereotypes regarding women’s math abilities based on ethnicity (Davies et al., 2002,
Schmader, 2004). For example, for Asian students, positive stereotypes regarding their math
abilities may have conflicted with the manipulation, reducing the impact of negative stereotypes.
Shih, Pittinsky, and Ambady (1999) found that Asian female participants primed with their race
performed the best on a math test, meanwhile those primed with their gender performed the
worst. Research should examine a more homogenous group of participants based on race and
ethnicity and expand on this research with students outside of an undergraduate setting.
Additionally, participants experience with math was not measured prior to the study. This may
have affected the students’ feelings towards math. Future research should incorporate a
questionnaire asking participants for their most recent math experience. Despite the study’s
limitations, the findings may have implication on current practices within STEM.
Implications
Women’s choice to pursue STEM is not due to innate differences in ability and
preferences contrary to Summers’ statements. From this research, results supporting that self-
efficacy and interests positively predicts math and science intentions and STEM-related choices,
in addition to the detrimental influence of both perception of career barriers on women’s choices
and stereotypes on women’s intentions provides evidence that social and cognitive factors play a
major role in the continuing underrepresentation of women in STEM fields. The support for
social and cognitive factors instead of biological explanation for the women’s
55
underrepresentation in STEM implies changes can be made to increase women’s participation
within STEM fields. These changes can come from various sources. Peers (Ryan & Patrick,
2001) and teachers (Beilock et al. 2010; Midgley et al. 1989) can have an impact of children’s
motivation and attitudes in school, math and sciences. Parents also influence their daughters’
STEM self-efficacy and interests (Crowley et al., 2001; Turner et al., 2004). Current programs
such as Girl’s Inc. (2011) which encourage women into STEM by providing tips for parents on
how to support their daughters in STEM may be especially beneficial and should be considered
for other interventions to increase women’s self-efficacy and interests related to STEM.
This research also contributes to previous research as it suggests that for women who are
math identified, stereotypes might play an important role in their intentions and that stereotype
removal may be effective in increasing women’s interests in science and math. Yet, none of the
currently practiced interventions address women’s awareness of stereotypes or utilize specific
stereotype removal techniques. Research indicates teaching stereotype threat is a viable strategy
to remove stereotype threat effects on performance (Johns, Schmader, & Martens, 2006). This
makes it imperative to further examine the effects of stereotypes on women’s career choice and
intentions. Adversely, this research also suggests that women who are identified with math are
the ones most vulnerable to negative math stereotypes. This is important seeing as women’s
persistence in STEM is a major issue with women being more likely to drop out of STEM
related-fields than men (NSERC, 2010; McKenzie, 2007). It maybe be that stereotypes play a
role in this turnover process for women already in STEM and identified with math and science.
Pending further research to explore these findings, interventions need to be designed or revised
specifically for women already identified with math and the incorporation of stereotype reducing
strategies. These efforts will aid in the persisting issue of women’s underrepresentation in STEM

56
and help to reduce the gender gap in women’s participation in STEM.
57
5. REFERENCES
Appel, M., Kronberger, N., & Aronson, J. (2011). Stereotype threat impairs ability building:
Effects on test preparation among women in science and technology. European Journal
of Social Psychology, 41, 904-913. doi: 10.1002/ejsp.835
Aronson, J., & Inzlicht, M. (2004). The ups and downs of attributional ambiguity: Stereotype
vulnerability and the academic self-knowledge of African American college students.
Psychological Science, 15, 829-836. doi: 10.1111/j.0956-7976.2004.00763.x
Bandura, A. (1986). Social foundations of thought and action: A social cognitive theory.
Eaglewood Cliffs, NJ: Prentice-Hall.
Baron, R.M., & Kenny, D.A. (1986). The moderator-mediator variable distinction in social
psychology research: Conceptual, strategic, and statistical considerations. Journal of
Personality and Social Psychology, 51, 1173-1182. doi: 10.1037/0022-3514.51.6.1173
Bear, J.B., Wholley, A.W. (2011). The role of gender in team collaboration and performance.
Interdisciplinary Science Reviews, 37, 146-153. doi
10.1179/030801811X13013181961473
Beilock, S.L., Rydell, R.J., McConnell, A.R. (2007). Stereotype threat and working memory:
Mechanism, alleviation, and spillover. Journal of Experimental Psychology: General,
136, 256-276. doi:10.1073/pnas.0910967107.
Beilock, S.L., Gunderson, E.A., Ramirez, G., & Levine, S.C. (2010). Female teacher’s math
anxiety affects girls’ math achievement. Proceedings of the National Academy of
Sciences of the United States of America, 107, 1860-1863. doi:10.1073/pnas.0910967107
Bell, A.E., Spencer, S.J., Iserman, E., & Logel, C.E.R. (2003). Stereotype threat and women’s
performance in engineering. Journal of Engineering Education, 92, 307-312.
58
doi: 10.1002/j.2168-9830.2003.tb00774.x
Bentley, J.T., & Adamson, R. (2003). Gender difference in the careers of academic scientists
and engineers: A literature review. Retrieved April 10, 2012 from
http://www.nsf.gov/statistics/nsf03322/pdfstart.htm.
Betz, N.E., & Hackett, G. (1983). The relationship of mathematics self-efficacy expectation to
the selection of science-based college majors. Journal of Vocational Behaviour, 23, 329-
345. doi: 10.1016/0001-8791(83)90046-5
Bleeker, M. M., & Jacobs, J. E. (2004). Achievement in math and science: Do mothers’ beliefs
matter 12 years later? Journal of Educational Psychology, 96(1), 97-109.
doi:10.1037/0022-0663.96
Bonitz, V.S., Larson, L.M., & Armstrong, P.I. (2010). Interests, self-efficacy, and choice goals:
An experimental manipulation. Journal of Vocational Behaviour, 76, 223-233.
Bulletin, 29, 371–381. doi:10.1177/0146167202250218
Byars-Winston, A.M., & Fouad, N.A. (2008). Math and science social cognitive variables in
college students: Contributions of contextual factors in predicting goals. Journal of
Career Assessment, 16(4), 425-440. doi 10.1177/1069072708318901
Cadinu, M., Maass, A., Rosablanca, A., & Kiesner, J. (2005). Why do women underperform
under stereotype threat? Psychological Science, 16(7), 572-578. doi: 10.1111/j.0956-
7976.2005.01577.x
Carr, M., Steiner, H.H., Kyser, B., & Biddlecomb, B. (2008). A comparison of predictors of
early emerging gender difference in math competency. Learning and Individual
Difference, 18, 61-75. doi:10.1016/j.lindif.2007.04.005
Chalk, L.M., Meara, N.M., Day, J.D., & Davis, K.L. (2005). Occupational possible selves: Fears
59
and intention of college women. Journal of Career Assessment, 1(2), 188-203. doi:
10.1177/1069072704273127
Codero, E.D., Porter, S.H., Israel, T., Brown, M.T. (2010). Math and Science pursuits: A self-
efficacy intervention comparison study. Journal of Career Assessment, 18(4), 362-375.
doi: 10.1177/1069072710374572
Correll, S.J. (2001). Gender and the career choice process: The role of biased self-assessments.
American Journal of Sociology, 106(6), 1691-1730. doi; 10.1086/321299
Crombie, G., Sinclair, N., Silverthorn, N., Byne, B.M., Dubois, D.L., Trinneer, A. (2005).
Predictors of young adolescents’ math grades and course enrollment intentions: Gender
similarities and difference. Sex Roles, 52, 351-367. doi: 10.1007/s11199-005-2678-1
Crumb, C.R., Moore, C., & Wada, A.R. (2010). Who wants to have a career in science or math?
Exploring adolescents’ future aspirations by gender and race/ethnicity. Science
Education, 95(3), 458-476. doi: 10.1002/sce.20431
Crowley, K., Callanan, M.A., Tenenbaum, H.R., & Allen, E. (2001). Parents explain more often
to boys than girls during shared scientific thinking. Psychological Science, 12(3), 258-
261. doi: 10.1111/1467-9280.00347
Davies, P.G., Spencer, S.J., Quinn, D.M., & Gerhardstein, R. (2002). Consuming images: How
television commercials that elicit stereotype threat can restrain women academically and
professionally. Personality and Social Psychology Bulletin, 28(12), 1615-1628. doi:
10.1177/014616702237644
Diegelman, N.M., & Subich, L.M. (2001). Academic and vocational interests as a function of
outcome expectations in social cognitive career theory. Journal of Vocational Behaviour,
59, 394-405. doi:10.1006/jvbe.2001.1802
60
Economics and Statistics Administration (ESA). (2011). Women in STEM: A gender gap to
innovation. Retrieved April 12, 2012 from http://www.esa.doc.gov/Reports/women-stem-
gender-gap-innovation.
Else-Quest, N.M., Hyde, S.H., & Linn, M.C. (2010). Cross-national pattern of gender difference
in mathematics: A meta-analysis. Psychological Bulletin, 136, 103-127. doi:
10.1037/a0018053
Fenwick, G.D., & Neal, D.J. (2001). Effect of gender composition on group performance.
Gender, Work and Organization, 8, 205-225. doi: 10.1111/1468-0432.00129
Field, A. (2009). Discovering statistics using SPSS. London: SAGE
Fouad, N.A., & Smith, P.L. (1996). A test of a social cognitive model for middle school students:
Math and science. Journal of Counselling Psychology, 43(3), 338-346. doi:10.1037/0022-
0167.43.3.338
Girls’ Inc. (2013). http://www.girlsinc.org/.
Good, C., Aronson, J., & Harder, J. A. (2008). Problems in the pipeline: Stereotype threat and
women’s achievement in high-level math courses. Journal of Applied Developmental
Psychology, 19,17–28. doi:10.1016/j.appdev.2007.10.004
Hakim, C. (2006). Women, careers, and work-life preferences. British Journal of Guidance and
Counselling, 34, 279-274. doi: 10.1080/03069880600769118
Harvard Crimson. (2005). Full transcript: President Summers' remarks at the National Bureau
of Economic Research, Jan. 14 2005. Retrieved November 20, 2011 from
http://www.thecrimson.com/article/2005/2/18/full-transcript-president-summers-remarks-
at/
61
Heilbronner, N.N. (2011). Stepping onto the STEM pathway: Factors affecting talent students'
declaration of STEM majors in college. Journal for the Education of the Gifted, 34(6),
879-899. doi: 10.1177/0162353211425100
Holm, S. (1979). A simple sequentially rejective multiple test procedure. Scandinavian Journal
of Statistics, 6(2), 65–70.
Hyde, J.S. (2005). The genders similarities hypothesis. American Psychologist, 60(6), 581-592.
doi: 10.1037/0003-066X.60.6.581
Hyde, J.S., Fennema, E., Lamon, S. (1990). Gender differences in mathematics performance: a
meta-analysis. Psychological Bulletin, 107, 139-155. doi: 10.1037/0033-2909.107.2.139
Inzlicht, M., & Ben-Zev, T. (2000). A threatening intellectual environment: Why females are
susceptible to experiencing problem-deficits in presence of males. Psychological Science,
11, 365-371. doi: 10.1111/1467-9280.00272
Jacobs, J.E., Lanza, S., & Osgood, D.W., Eccles, J.S., & Wigfield, A. (2002). Changes in
children’s self-competence and values: Gender and domain differences across grades one
through twelve. Child Development, 73, 509-527. doi: 10.1111/1467-8624.00421
Ji, P.Y., Lapan, R.T., Tate, K. (2004). Vocational interests and career efficacy expectations in
relation to occupational sex-typing beliefs for eighth grade students. Journal of Career
Development, 31(2), 143-154. doi: 10.1177/089484530403100205
Johns, M., Schmader, T., & Martens, A. (2006). Knowing is half the battle: Teaching stereotype
threat as a means of improving women’s math performance. Psychological Science, 16,
175-180. doi: 10.1111/j.0956-7976.2005.00799.x
Judd, C.M., Kenny, D.A., & McClelland, G.H. (2001). Estimating and testing mediation and
moderation in within-subjects designs. Psychological Methods, 6, 115-134. doi:
62
10.1037/1082-989X.6.2.115
Keller, J. (2007). Stereotype threat in classroom settings: The interactive effect of domain
identification, task difficulty and stereotype threat on female students’ math performance.
British Journal of Educational Psychology, 77, 323-338. doi:
10.1348/000709906X113662
Keller, J., & Dauenheimer, D. (2003). Stereotype threat in the classroom: Dejection mediates the
disrupting threat effect on women’s performance. Personality and Social Psychology,
29(3), 371-381. doi: 10.1177/0146167202250218
Lefevre, J., Kulak, A., & Heymans, S.L. (1992). Factors influencing the selection of university
majors varying in mathematical content. Canadian Journal of Behavioural Science, 24,
276-289. doi: 10.1037/h0078742
Lent, R.W., Brown, S.D., Brenner, B., Chopra, S.B., Davis, T., Talleyrand, R., & Suthakaran, V.
(2001). The role of contextual supports and barriers in the choice of math/science
educational options: A test of social cognitive hypothesis. Journal of Counseling
Psychology, 46(4), 476-483. doi: 10.1037/0022-0167.48.4.474
Lent, R.B., Brown, S.D., & Hackett, G. (1994). Toward a unifying social cognitive theory of
career and academic interest, choice, and performance. Journal of Vocational Behaviour,
45, 79-122. doi: 10.1006/jvbe.1994.1027,
Lent, R.W., Brown, S.D., & Hackett, G. (2000a). Contextual supports and barriers to career
choice: A social cognitive analysis. Journal of Counselling Psychology, 47, 36-49. doi:
10.1037/0022-0167.47.1.36
Lent, R.W., Brown, S.D., Schmidt, J., Brenner, B., Lyons, H., & Treistman, D. (2000b). Relation
of contextual supports and barriers to choice behaviour in engineering majors: Test of
63
alternative social cognitive models. Journal of Counselling Psychology, 40(4), 458-465.
doi: 10.1037/0022-0167.50.4.458
Lent, R.W., Brown, S.D., Sheu, H-B., Schmidt, J., Brenner, B.R., Gloster, C.S., Gregory, W.,
Schmidt, L.C., & et al. (2005). Social cognitive predictors of academic interest and goals
in engineering Utility for women and students at historically black universities. Journal
of Counselling Psychology, 52 (1), 84-92. doi: 10.1037/0022-0167.52.1.84
Lent, R.W., Lopez, A.M., Lopez, F.G., & Sheu, H-B. (2008). Social cognitive career theory and
the prediction of interests and choice goals in the computing disciplines. Journal of
Vocational Behaviour, 73, 52-62. doi: 10.1016/j.jvb.2008.01.002
Lent, R.W., Lopez, F.G., & Biescke, K.J. (1993). Predicting math-related choice and success
behaviours: Test of an expanded social cognitive model. Journal of Vocational
Behaviour, 42, 223-236. doi: 10.1006/jvbe.1993.1016
Lent, R.W., Lopez, F.G., & Biescke, K.J. (1991). Math self-efficacy: Sources and relation to
science-based career choice. Journal of Counselling Psychology, 38(4), 424-438. doi:
10.1037/0022-0167.38.4.424
Lent, R.W., Sheu, H-B., Singley, D., Schmidt, J.A., Schmidt, L.C., & Gloster, C.S. (2008).
Longitudinal relation of self-efficacy to outcome expectations, interest, and major choice
goals in engineering students. Journal of Vocational Behaviour, 73, 328-335.
doi:10.1016/j.jvb.2008.07.005
Lindley, L.D. (2005). Perceived barriers to career development in the context of social
development career theory. Journal of Career Assessment, 13(3), 271-287. doi:
10.1177/1069072705274953
Lindsay, C. & Almey, M. (2006). Education in women in Canada: A gender-based statistical
64
report (5th ed.). Statistics Canada Catalogue no. 0010589-503-XIE.
Linver, M.R., & Davis-Kean, P.E. (2005). The slippery slope: What predicts math grades in
middle and high school? New Directions for Child and Adolescent Development, 110, 49-
64. doi: 10.1002/cd.149
Lubinski, D., & Benbow, C.P. (2006). Study of mathematically precocious youth after 35 years:
Uncovering antecedents for the development of math-science expertise. Perspectives on
Psychological Science, 1(4), 316-345. doi: 10.1111/j.1745-6916.2006.00019.x
Luzzo, D.A., Hasper, P., Albert, K.A., Bibby, M.A., & Martinelli Jr. E.A. (1999). Effects of self-
efficacy-enhancing interventions on the math and science self-efficacy and career
interest, goals, and actions of career undecided students. Journal of Counselling
Psychology, 46(2), 233-243. doi: 10.1037/0022-0167.46.2.233
Marra, R.M., Rodgers, K.A., Shen, D., & Bogue, B. (2009). Women engineering students and
self-efficacy: A multi-year, multi-institution study of women engineering student self-
efficacy. Journal of Engineering Education, 98, 27-38. doi: 10.1002/j.2168-
9830.2009.tb01003.x
Mau, W-C. (2003). Factors that influence persistence in science and engineering career
aspirations. The Career Development Quarterly, 51, 234-244.
McKenzie, M. (2007). Science and engineering PhDs: A Canadian portrait. Retrieve April 12,
2012 from http://www.statcan.gc.ca/pub/11-621-m/11-621-m2007063-eng.htm.
Midgley, C., Feldlaufer, H., & Eccles, J. S. (1989). Change in teacher efficacy and student self-
and task-related beliefs in mathematics during the transition to junior high school.
Journal of Educational Psychology, 81, 247–258. doi:10.1037/0022-0663.81.2.247.
Myers, K.K., Jahn, J.L.S., Gailliard, B.M., & Stoltzfus, K. (2011). Vocational anticipatory
65
socialization (VAS): A communicative model of adolescents’ interest in STEM.
Management Communication Quarterly, 25(1), 87-120. doi: 10.1177/0893318910377068
National Science Foundation (NSF). (2011).Women, minorities, and persons with disabilities in
science and engineering. NSF Catalogue no. 09-305.
Natural Science and Engineering Research Council of Canada (NSERC). (2010). Women in
Science and Engineering in Canada. Retrieved April 12, 2012 from http://www.nserc-
crsng.gc.ca/_doc/Reports-Rapports/Women_Science_Engineering_e.pdf.
Nauta, M.M., & Epperson, S.L. (2003). A longitudinal examination of the social-cognitive model
applied to high school girls’ choices of non-traditional college majors and intention.
Journal of Counselling Psychology, 50, 448-457. doi: 10.1037/0022-0167.50.4.448
Nauta, M.M., Epperson, D.L., & Kahn, J.H. (1998). A multiple-group analysis of predictors of
higher level career intention among women in mathematics, science and engineering
majors. Journal of Counselling Psychology, 45(4), 485-496. doi: 10.1037/0022-
0167.45.4.483
Navarro, R.L., Flores, L.Y., & Worthington, R.L. (2007). Mexican American middle school
students’ goal intentions in mathematics and science: A test of social cognitive career
theory. Journal of Counselling Psychology, 54(3), 320-335. doi: 10.1037/0022-
0167.54.3.320
Neuville, E., & Croizet, J-C. (2007). Can salience of gender identity impair math performance
among 7–8 years old girls? The moderating role of task difficulty. European Journal of
Psychology of Education, 22, 307–316. doi: 10.1007/BF03173428.
Nguyen, H.D., & Ryan, A.M. (2008). Does stereotype threat affect test performance of¸
minorities and women? A meta-analysis of experimental evidence. Journal of Applied
66
Psychology, 93(6),1314–1334. doi: 10.1037/a0012702
Nosek, B.A., Banaji, M.R., & Greenwald, A.G. (2002). Math = me, me = female, therefore math
<> me. Journal of Personality and Social Psychology, 83(1) 44-59. doi: 10.1037//0022-
3514.83.1.44
Oswald, D.L., & Harvey, R.D. (2000). Hostile environments, stereotype threat, and math
performance among undergraduate women. Current Psychology, 19(4), 338-356. doi:
10.1007/s12144-000-1025-5
Pinel, E.C. (1999). Stigma consciousness: The psychological legacy of social stereotypes.
Journal of Personality and Social Psychology, 76(1), 114-128. doi: 10.1037/0022-
3514.76.1.114
Preacher, K.J., & Hayes, A.F. (2004). SPSS and SAS procedures for estimating indirect effects
in simple mediation models. Behaviour Research Methods, Instruments and Computers,
36, 717-731. doi: 10.3758/BF03206553
Rudman, L.A., & Phelan, J.E. (2010). The effect of priming gender roles on women’s implicit
gender beliefs and career intention. Social Psychology, 44(2), 192-202. doi:
10.1027/1864-9335/a000027
Ryan, A. M., & Patrick, H. (2001). The classroom social environment and changes in
adolescents' motivation and engagement during middle school. American Educational
Research Journal, 38, 437–460. doi:10.3102/00028312038002437
Schmader, T., & Johns, M. (2003). Converging evidence that stereotype threat reduces working
memory capacity. Journal of Personality and Social Psychology, 85, 440-452. doi:
10.1037/0022-3514.85.3.440
Schmader, T., Johns, M., & Barquissau, M. (2004).The costs of accepting gender difference: The
67
role of stereotype endorsement in women’s experience in that math domain. Sex Roles,
50, 835-850. doi: 10.1023/B:SERS.0000029101.74557.a0
Shih, M., Pittinsky, T. L., & Ambady, N. (1999). Stereotype susceptibility: Identity salience and
shifts in quantitative performance. Psychological Science, 10, 80-83. doi: 10.1111/1467-
9280.00111
Simpkins, S.S., Davies-Kean, P.E., & Eccles, J.S. (2006). Math and science motivation: A
longitudinal examination of the links between choices and beliefs. Developmental
Psychology, 42(1), 70-83. doi: 10.1037/0012-1649.42.1.70
Spencer, S.J., Steele, C.M., & Quinn, D.M. (1999). Stereotype threat and women’s math
performance. Journal of Experimental Social Psychology, 35, 2-28. doi:
10.1006/jesp.1998.1373
Statistics Canada. (2011a). Average weekly earnings (including overtime) for all employees –
Seasonally adjusted. Retrieved from http://www.statcan.gc.ca/daily-
quotidien/111027/t111027a1-eng.htm.
Statistics Canada. (2011b). Labour force historical review. Statistics Canada Catalogue no.
71F0004XVB.
Statistics Canada (2003). Earnings of Canadians: Making a Living in the New Economy, 2001
Census. Catalogue no. 96F0030XIE2001013
Steele, C.M. (1997). A threat in the air: How stereotypes shape intellectual performance.
American Psychologist, 52(6), 613-629. doi:10.1037/0003-066X.52.6.613
Steele, C.M., & Aronson, J. (1995). Stereotype threat and the intellectual test performance of
African Americans. Journal of Personality and Social Psychology, 69(5), 797-981. doi:
10.1037/0022-3514.69.5.797
68
Strangor, C., Carr, C., & Kiang, L. (1998). Activating stereotypes undermines task performance
expectations. Journal of Personality and Social Psychology, 75, 1191-1197. doi:
10.1037/0022-3514.75.5.1191
Strout, P.E., & Bolger, N. (2002). Mediation in experimental and non-experimental studies: New
procedures and recommendations. Psychological Methods, 7, 422-445. doi:
10.1037/1082-989X.7.4.422
Swanson, J.L., Daniels, K.K., & Tokar, D.M. (1996). Assessing perceptions for career-related
carriers: The career barriers inventory. Journal of Career Assessment, 4(2), 219-244. doi:
10.1177/106907279600400207
Swanson, J.L., & Tokar, D.M. (1991). Development and initial validation of the career barriers
inventory. Journal of Career Assessment, 4(2), 219-244. doi: 10.1016/0001-
8791(91)90043-L
Tomasetto, C., Alparone, F.R., & Cadinu, M. (2011). Girls’ math performance under stereotype
threat: The moderating role of mothers’ gender stereotypes. Developmental Psychology,
47(4), 943-949. doi: 10.1037/a0024047
Turner, S.L., Steward, J.C., & Lapan, R.T. (2004). Family factors association with sixth-grade
adolescents’ math and science career interests. The Career Development Quarterly,
53(1), 41-52. doi: 10.1002/j.2161-0045.2004.tb00654.x
Webb, R.M., Lubinski, D., & Benbow, C.P. (2002). Mathematically facile adolescences with
math-science intention: New perspective on their educational and vocational
development. Journal of Educational Psychology, 94(4), 785-794. doi: 10.1037//0022-
0663.94.4.785
Whiton, M.L. (2008). The influence of stereotype threat on women’s self-efficacy, outcome
69
expectations and interest about math and science careers. (Doctoral Dissertation).
Colombia University, New York. Available from ProQuest Dissertations and Theses
database. (UMI No. 3333466)
Wigfield et al., (1997). Change in children’s competence beliefs and subjective task values
across the elementary school years: A 3-year study. Journal of Education Psychology,
89(3), 451-469. doi: 10.1037/0022-0663.89.3.451
Williams, C.M., Subich, L.M. (2006). The gendered nature of career related learning
experiences: A social cognitive career theory perspective. Journal of Vocational
Behaviour, 69, 262-275. doi:10.1016/j.jvb.2006.02.007
Xu, Y.J. (2008). Gender disparity in STEM disciplines: A study of faculty attrition and turnover.
Research in Higher Education, 49, 607-624. doi: 10.1007/s11162-008-9097-4.
Zhao, X., Lynch Jr, J.G., & Chen, Q. (2010). Reconsidering Baron and Kenny: Myths and truths
about mediation analysis. Journal of Consumer Research, 37, 197-206. doi:
10.1086/651257
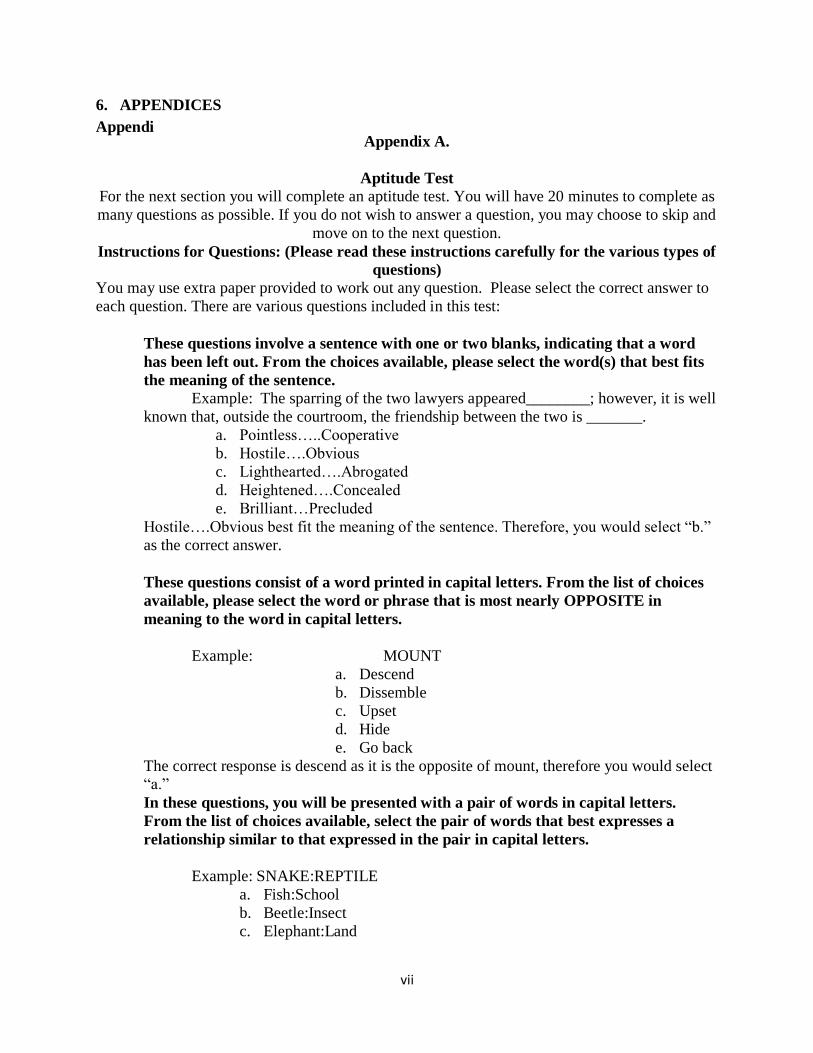
vii
6. APPENDICES
Appendix A. Appendi
Aptitude Test
For the next section you will complete an aptitude test. You will have 20 minutes to complete as
many questions as possible. If you do not wish to answer a question, you may choose to skip and
move on to the next question.
Instructions for Questions: (Please read these instructions carefully for the various types of
questions)
You may use extra paper provided to work out any question. Please select the correct answer to
each question. There are various questions included in this test:
These questions involve a sentence with one or two blanks, indicating that a word
has been left out. From the choices available, please select the word(s) that best fits
the meaning of the sentence.
Example: The sparring of the two lawyers appeared________; however, it is well
known that, outside the courtroom, the friendship between the two is _______.
a. Pointless…..Cooperative
b. Hostile….Obvious
c. Lighthearted….Abrogated
d. Heightened….Concealed
e. Brilliant…Precluded
Hostile….Obvious best fit the meaning of the sentence. Therefore, you would select “b.”
as the correct answer.
These questions consist of a word printed in capital letters. From the list of choices
available, please select the word or phrase that is most nearly OPPOSITE in
meaning to the word in capital letters.
Example: MOUNT
a. Descend
b. Dissemble
c. Upset
d. Hide
e. Go back
The correct response is descend as it is the opposite of mount, therefore you would select “a.”
In these questions, you will be presented with a pair of words in capital letters.
From the list of choices available, select the pair of words that best expresses a
relationship similar to that expressed in the pair in capital letters.
Example: SNAKE:REPTILE
a. Fish:School
b. Beetle:Insect
c. Elephant:Land
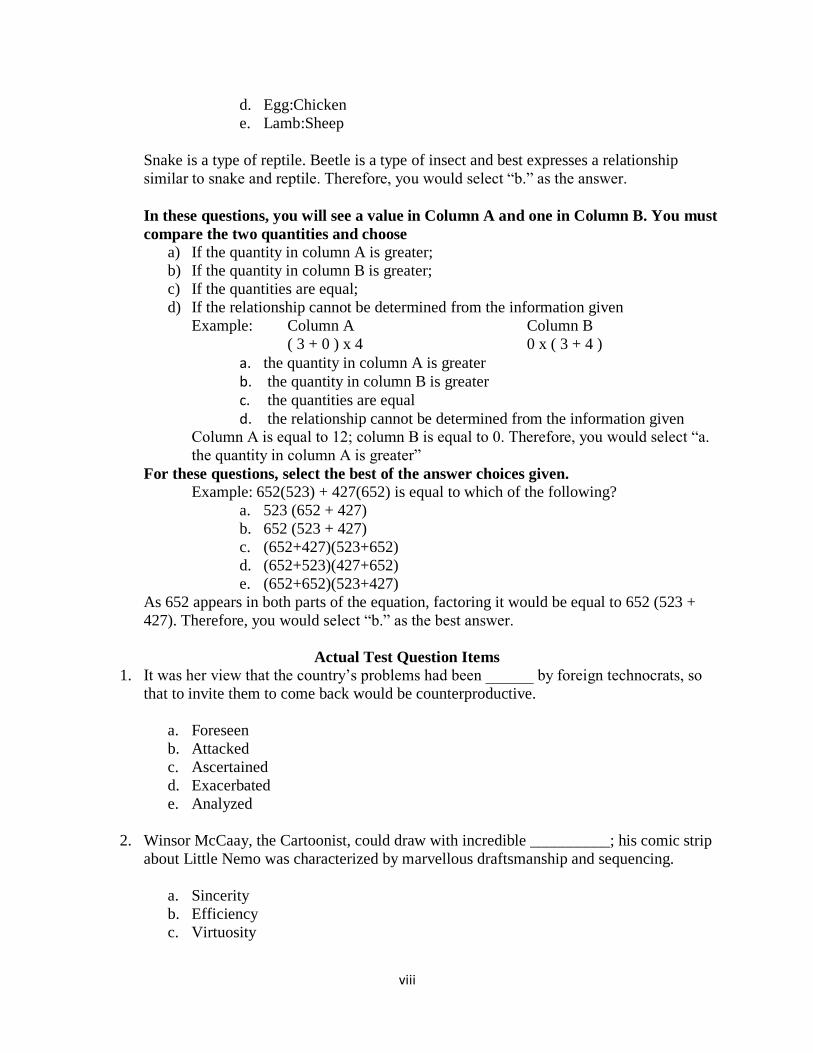
viii
d. Egg:Chicken
e. Lamb:Sheep
Snake is a type of reptile. Beetle is a type of insect and best expresses a relationship
similar to snake and reptile. Therefore, you would select “b.” as the answer.
In these questions, you will see a value in Column A and one in Column B. You must
compare the two quantities and choose
a) If the quantity in column A is greater;
b) If the quantity in column B is greater;
c) If the quantities are equal;
d) If the relationship cannot be determined from the information given
Example: Column A Column B
( 3 + 0 ) x 4 0 x ( 3 + 4 )
a. the quantity in column A is greater
b. the quantity in column B is greater
c. the quantities are equal
d. the relationship cannot be determined from the information given Column A is equal to 12; column B is equal to 0. Therefore, you would select “a.
the quantity in column A is greater”
For these questions, select the best of the answer choices given.
Example: 652(523) + 427(652) is equal to which of the following?
a. 523 (652 + 427)
b. 652 (523 + 427)
c. (652+427)(523+652)
d. (652+523)(427+652)
e. (652+652)(523+427)
As 652 appears in both parts of the equation, factoring it would be equal to 652 (523 +
427). Therefore, you would select “b.” as the best answer.
Actual Test Question Items
1. It was her view that the country’s problems had been ______ by foreign technocrats, so
that to invite them to come back would be counterproductive.
a. Foreseen
b. Attacked
c. Ascertained
d. Exacerbated
e. Analyzed
2. Winsor McCaay, the Cartoonist, could draw with incredible __________; his comic strip
about Little Nemo was characterized by marvellous draftsmanship and sequencing.
a. Sincerity
b. Efficiency
c. Virtuosity
ix
d. Rapidity
e. Energy
3. The theory of cosmic evolution states that the universe, having begun in a state of
simplicity and _________, has __________ into great variety.
a. Equilibrium…modulated
b. Homogeneity…Differentiated
c. Contrast…Metamorphosed
d. Proportion…Accelerated
e. Intelligibility…Developed
4. CURIOSITY: KNOW :
a. Temptation : Conquer
b. Starvation : Eat
c. Wanderlust : Travel
d. Humour : Laugh
e. Survival : Live
5. FRUGAL: MISERLY:
a. Confident : Arrogant
b. Courageous : Pugnacious
c. Famous : Aggressive
d. Rash : Foolhardy
e. Quiet : Timid
6. ANTIDOTE: POISON:
a. Care : Recovery
b. Narcotic : Sleep
c. Stimulant : Relapse
d. Tonic : Lethargy
e. Resuscitation : Breathing
7. STYGIAN: DARK:
a. Abysmal : Low
b. Cogent : Contentious
c. Fortuitous : Accidental
d. Reckless : Threatening
e. Cataclysmic : Doomed
8. WORSHIP: SACRAFICE:

x
a. Generation: Pyre
b. Burial : Mortuary
c. Weapon : Centurion
d. Massacre : Invasion
e. Prediction : Augury
9. EVANESCENT: DISAPPEAR:
a. Transparent : Penetrate
b. Onerous : Struggle
c. Reckless : Succeed
d. Illusory : Exist
e. Pliant : Yield
10. Many find it strange that her writing is thought to be tortuous; her recent essays, although
longer than most of her earlier essays are extremely _______.
a. Painstaking
b. Tedious
c. Insightful
d. Sophisticated
e. Clear
11. DEPOSITION
a. Process of congealing
b. Process of distilling
c. Process of eroding
d. Process of evolving
e. Process of condensing
12. ENERVATE
a. Recuperate
b. Resurrect
c. Renovate
d. Gather
e. Strengthen
13. LOQUACIOUS
a. Tranquil
b. Sceptical c. Morose
d. Taciturn
e. Witty
xi
14. REPINE
a. Intensify
b. Excuse
c. Express joy
d. Feel sure
e. Rush forward
15. The significance of the Magna Carta lies not in its ________ provisions, but in its broader
impact: it made the king subject to the law.
a. Specific
b. Revolutionary
c. Implicit
d. Controversial
e. Finite
16. Not wishing to appear ______ the junior member of the research group refrained from
______any critic of the senior members’ plan for dividing up responsibility for the entire
project.
a. Reluctant… Evaluating
b. Inquisitive…Offering
c. Presumptuous…Venturing
d. Censorious…Undercutting
e. Moralistic…Observing
17. FAULTFINDER: CRITISIZE:
a. Luminary : Recognize
b. Athlete : Cheer
c. Arbitrator : Mediate
d. Pharmacist : Prescribe
e. Dawdler : Toil
18. PEST: IRKSOME:
a. Salesclerk : Courteous
b. Expert : Proficient
c. Enigma : Unexpected
d. Leader : Nondescript
e. Accuser : Indicted
19. PROLOGUE: NOVEL:
xii
a. Preamble : Statute
b. Sketch : Drawing
c. Movement : Symphony
d. Index : Book
e. Blueprint : Building
20. EXPAND: VOLUME:
a. Ascend : Flight
b. Proliferate : Number
c. Bend : Flexibility
d. Cool : Temperature
e. Deflect : Heading
21. CONTIGUOUS: ABUT:
a. Possible : Occur
b. Simultaneous : Coincide
c. Comprehensive : Except
d. Synthetic : Create
e. Constant : Stabilize
22. This filmmaker is not outspoken on political matters: her films are known for their
aesthetic qualities rather than for their _______ones.
a. Polemical
b. Cinematic
c. Narrative
d. Commercial
e. Dramatic
23. PROHIBITIVE: PURCHASE:
a. Preventive : Heal
b. Laudatory : Praise
c. Admonitory : Fear
d. Peremptory : Dispute
e. Imperative : Comply
24. AMALGAMATE
a. Study
b. Circulate
c. Reduce
d. Endure
xiii
e. Separate
25. ARRHYTHMIC
a. Timely
b. Subordinate
c. Terminal
d. Lacking precision
e. Exhibiting regularity
26. BLITHE
a. Conceited
b. Dim
c. Sturdy
d. Laconic
e. Grace
27. POLEMICAL
a. Initiative
b. Lavish
c. Conciliatory
d. Attractive
e. Modest
28. Most spacecraft are still at little risk of collision with space debris during their
operational lifetimes, but given the numbers of new satellites launched each year, the
orbital environment in the future is likely to be less.
a. Crowded
b. Invulnerable
c. Protected
d. Polluted
e. Benign
29. DEFERENCE
a. Aversion
b. Resignation
c. Suspicion
d. Inattention
e. Contempt
30. The author presents the life of Zane Grey with _________unusual in a biographer: he is
not even convinced that Grey was a good writer.
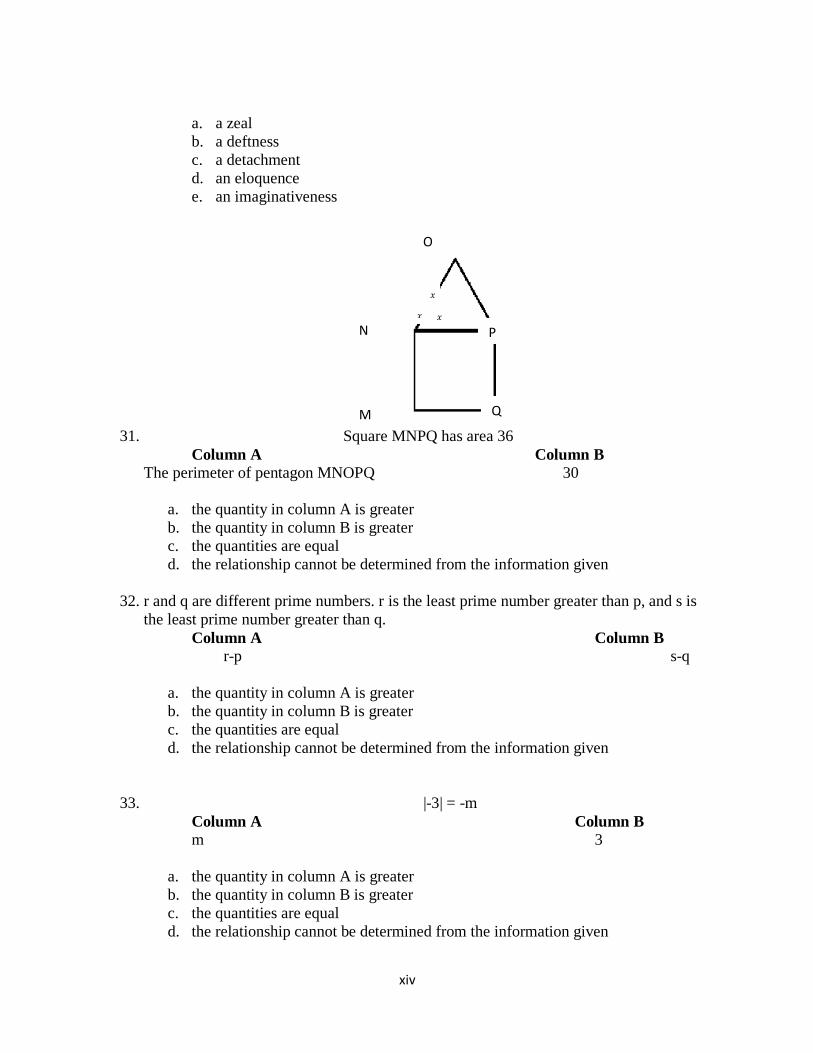
xiv
a. a zeal
b. a deftness
c. a detachment
d. an eloquence
e. an imaginativeness
31. Square MNPQ has area 36
Column A Column B
The perimeter of pentagon MNOPQ 30
a. the quantity in column A is greater
b. the quantity in column B is greater
c. the quantities are equal
d. the relationship cannot be determined from the information given
32. r and q are different prime numbers. r is the least prime number greater than p, and s is
the least prime number greater than q.
Column A Column B
r-p s-q
a. the quantity in column A is greater
b. the quantity in column B is greater
c. the quantities are equal
d. the relationship cannot be determined from the information given
33. |-3| = -m
Column A Column B
m 3
a. the quantity in column A is greater
b. the quantity in column B is greater
c. the quantities are equal
d. the relationship cannot be determined from the information given
O
P
M
N
Q
𝑥
x°
𝑥
x°
𝑥
x°
xv
34. n is an even integer and a multiple of 3.
Column A Column B
The remainder when n is divided by 12 6
a. the quantity in column A is greater
b. the quantity in column B is greater
c. the quantities are equal
d. the relationship cannot be determined from the information given
35. In the xy-plane, the point (1, 2) is on line J, and the point (2, 1) is on line k. Each of the
lines have a positive slope.
Column A Column B
The slope of line j The slope of line k
a. the quantity in column A is greater
b. the quantity in column B is greater
c. the quantities are equal
d. the relationship cannot be determined from the information given
36. In the xy-plane, the points (a, 0) and (0, b) are on the line whose equation is
𝑦 = 1
2𝑥 + 10
Column A Column B
a b
a. the quantity in column A is greater
b. the quantity in column B is greater
c. the quantities are equal
d. the relationship cannot be determined from the information given
37. ds≠ 0
Column A Column B
The time required to travel
d miles at s miles per hour.
The time required to
travel d/2 at 2s miles per
hour.
a. the quantity in column A is greater
b. the quantity in column B is greater
c. the quantities are equal
d. the relationship cannot be determined from the information given
38. 𝑥 > 1
Column A Column B
𝑥
𝑥+1
𝑥
1−𝑥
a. the quantity in column A is greater
b. the quantity in column B is greater
O
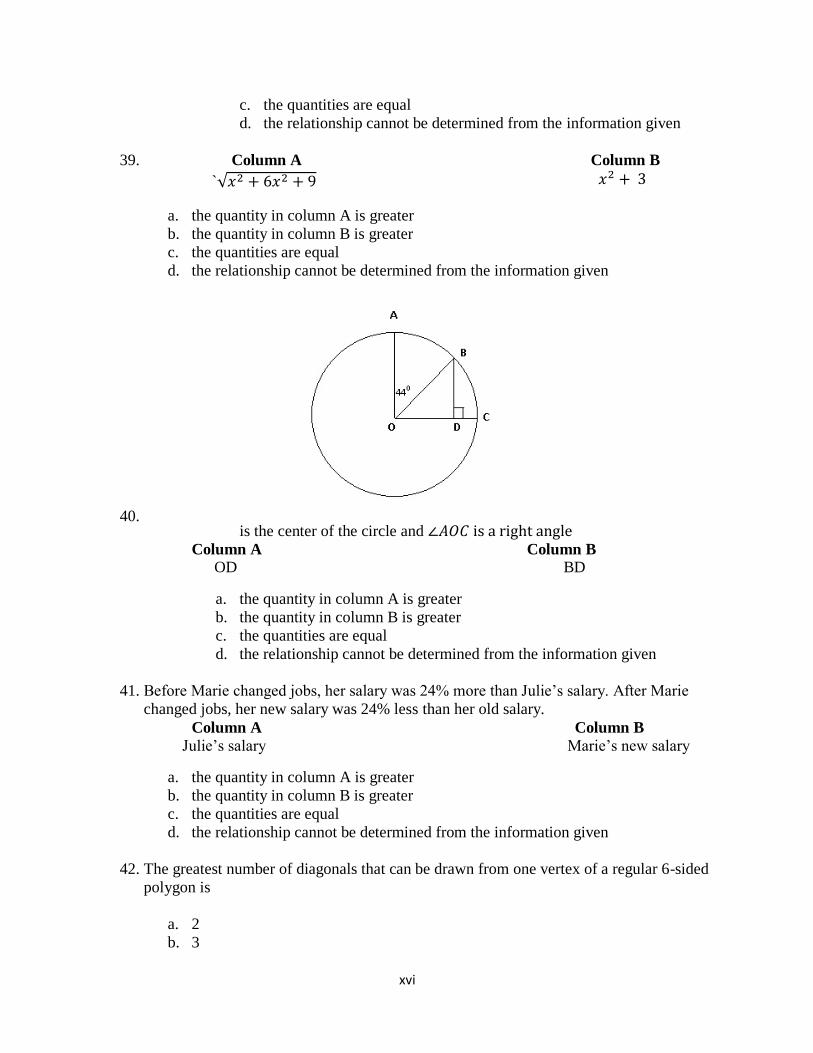
xvi
c. the quantities are equal
d. the relationship cannot be determined from the information given
39. Column A Column B
`√𝑥2 + 6𝑥2 + 9 𝑥2 + 3
a. the quantity in column A is greater
b. the quantity in column B is greater
c. the quantities are equal
d. the relationship cannot be determined from the information given
40. is the center of the circle and ∠𝐴𝑂𝐶 is a right angle
Column A Column B
OD BD
a. the quantity in column A is greater
b. the quantity in column B is greater
c. the quantities are equal
d. the relationship cannot be determined from the information given
41. Before Marie changed jobs, her salary was 24% more than Julie’s salary. After Marie
changed jobs, her new salary was 24% less than her old salary.
Column A Column B
Julie’s salary Marie’s new salary
a. the quantity in column A is greater
b. the quantity in column B is greater
c. the quantities are equal
d. the relationship cannot be determined from the information given
42. The greatest number of diagonals that can be drawn from one vertex of a regular 6-sided
polygon is
a. 2
b. 3
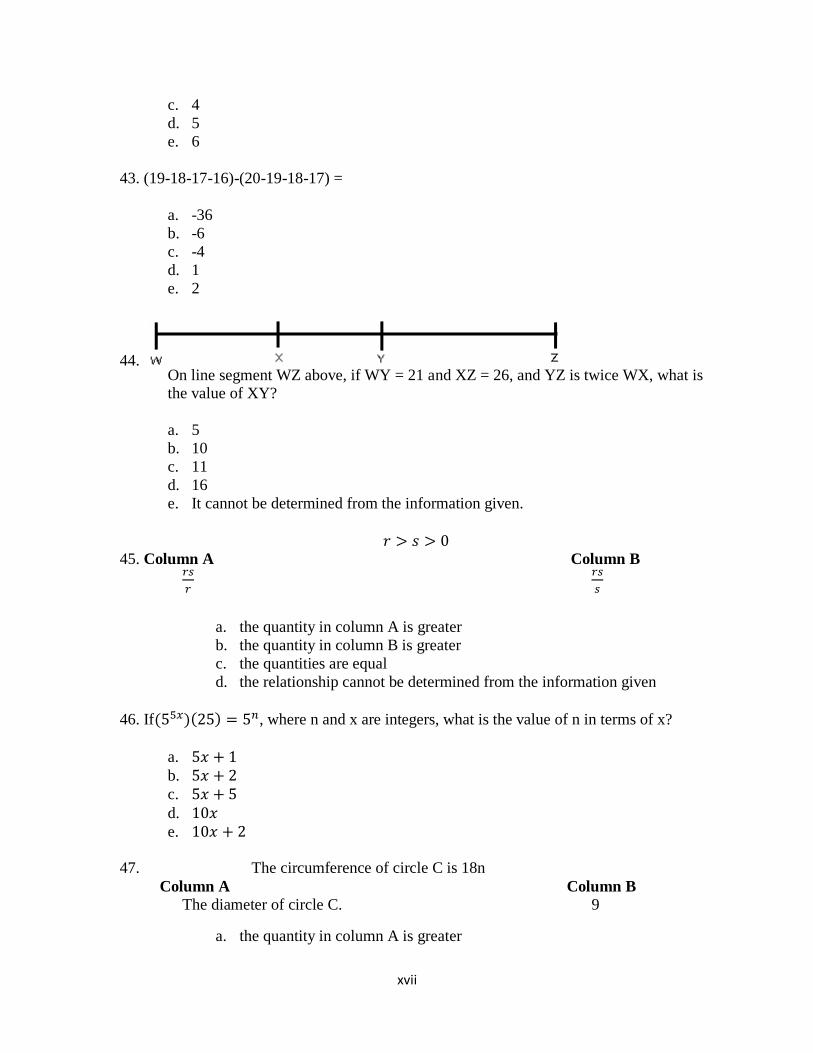
xvii
c. 4
d. 5
e. 6
43. (19-18-17-16)-(20-19-18-17) =
a. -36
b. -6
c. -4
d. 1
e. 2
44. On line segment WZ above, if WY = 21 and XZ = 26, and YZ is twice WX, what is the value of XY?
a. 5
b. 10
c. 11
d. 16
e. It cannot be determined from the information given.
𝑟 > 𝑠 > 0 45. Column A Column B
𝑟𝑠
𝑟
𝑟𝑠
𝑠
a. the quantity in column A is greater
b. the quantity in column B is greater
c. the quantities are equal
d. the relationship cannot be determined from the information given
46. If(55𝑥)(25) = 5𝑛, where n and x are integers, what is the value of n in terms of x?
a. 5𝑥 + 1
b. 5𝑥 + 2
c. 5𝑥 + 5
d. 10𝑥
e. 10𝑥 + 2
47. The circumference of circle C is 18n
Column A Column B
The diameter of circle C. 9
a. the quantity in column A is greater
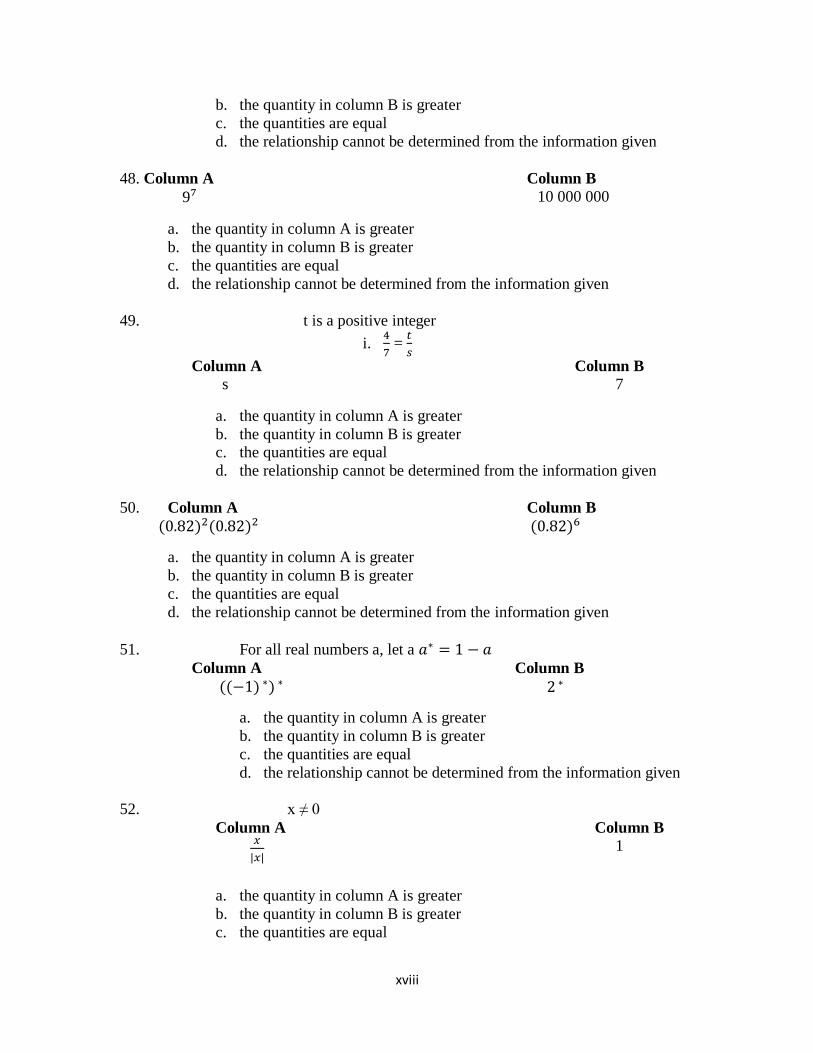
xviii
b. the quantity in column B is greater
c. the quantities are equal
d. the relationship cannot be determined from the information given
48. Column A Column B
9⁷ 10 000 000
a. the quantity in column A is greater
b. the quantity in column B is greater
c. the quantities are equal
d. the relationship cannot be determined from the information given
49. t is a positive integer
i. 4
7 =
𝑡
𝑠
Column A Column B
s 7
a. the quantity in column A is greater
b. the quantity in column B is greater c. the quantities are equal
d. the relationship cannot be determined from the information given
50. Column A Column B
(0.82)2(0.82)2 (0.82)6
a. the quantity in column A is greater
b. the quantity in column B is greater
c. the quantities are equal
d. the relationship cannot be determined from the information given
51. For all real numbers a, let a 𝑎∗ = 1 − 𝑎 Column A Column B
((−1) ∗) ∗ 2 ∗
a. the quantity in column A is greater
b. the quantity in column B is greater
c. the quantities are equal
d. the relationship cannot be determined from the information given
52. x ≠ 0
Column A Column B
𝑥
|𝑥| 1
a. the quantity in column A is greater
b. the quantity in column B is greater
c. the quantities are equal
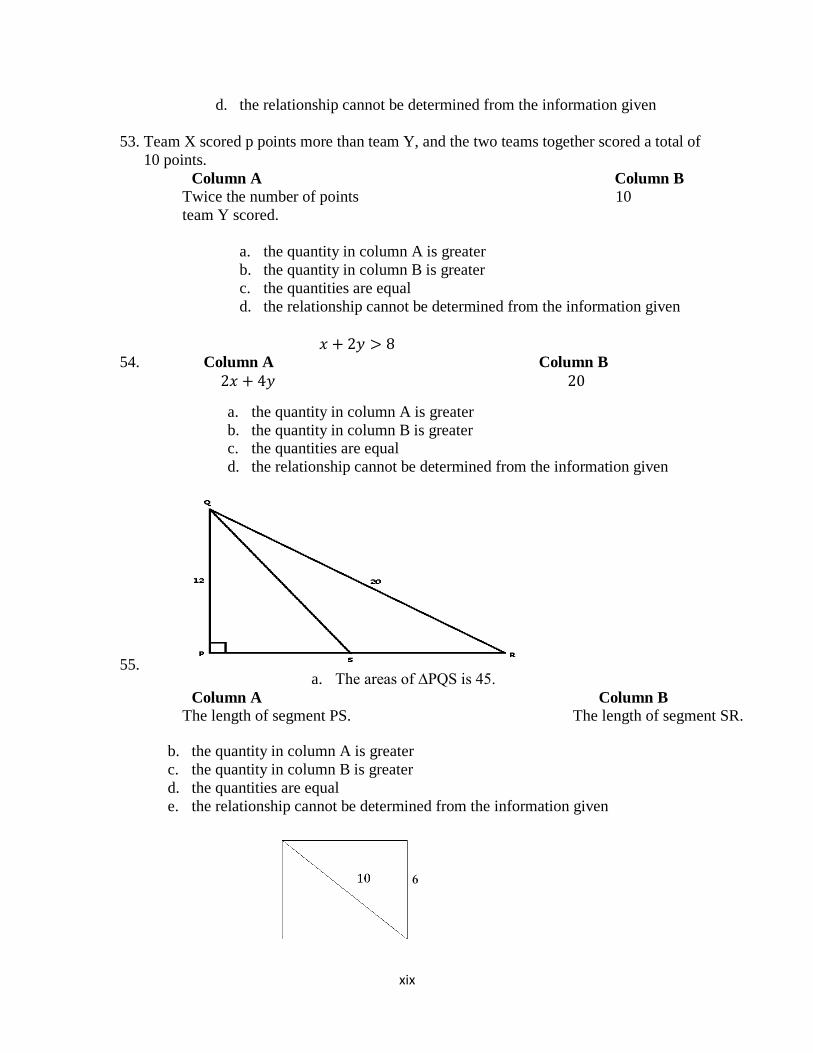
xix
d. the relationship cannot be determined from the information given
53. Team X scored p points more than team Y, and the two teams together scored a total of
10 points.
Column A Column B
Twice the number of points
team Y scored.
10
a. the quantity in column A is greater
b. the quantity in column B is greater
c. the quantities are equal
d. the relationship cannot be determined from the information given
𝑥 + 2𝑦 > 8 54. Column A Column B
2𝑥 + 4𝑦 20
a. the quantity in column A is greater
b. the quantity in column B is greater c. the quantities are equal
d. the relationship cannot be determined from the information given
55. a. The areas of ∆PQS is 45.
Column A Column B
The length of segment PS. The length of segment SR.
b. the quantity in column A is greater
c. the quantity in column B is greater
d. the quantities are equal
e. the relationship cannot be determined from the information given
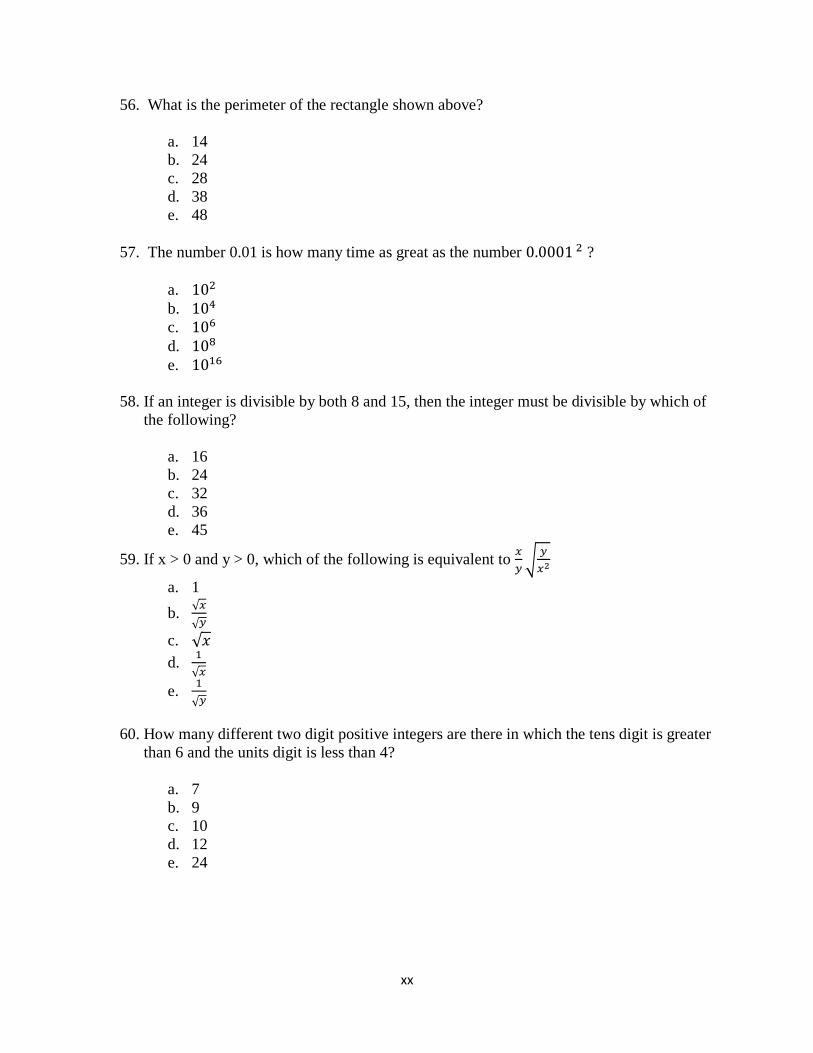
xx
56. What is the perimeter of the rectangle shown above?
a. 14
b. 24
c. 28
d. 38
e. 48
57. The number 0.01 is how many time as great as the number 0.0001 2 ?
a. 102
b. 104
c. 106
d. 108
e. 1016
58. If an integer is divisible by both 8 and 15, then the integer must be divisible by which of
the following?
a. 16
b. 24
c. 32
d. 36
e. 45
59. If x > 0 and y > 0, which of the following is equivalent to 𝑥
𝑦√
𝑦
𝑥2
a. 1
b. √𝑥
√𝑦
c. √𝑥
d. 1
√𝑥
e. 1
√𝑦
60. How many different two digit positive integers are there in which the tens digit is greater
than 6 and the units digit is less than 4?
a. 7
b. 9
c. 10
d. 12
e. 24