the influence of socio-demographic and financial knowledge ... · 34 the influence of...
TRANSCRIPT
International Journal of Business and Society, Vol. 18 No. 1, 2017, 33-50
THE INFLUENCE OF SOCIO-DEMOGRAPHIC AND FINANCIAL KNOWLEDGE FACTORS ON FINANCIAL
MANAGEMENT PRACTICES OF MALAYSIANS
Yiing-Jia Loke
Universiti Sains Malaysia
ABSTRACT
Using the pilot survey data on "Measuring financial literacy" in 2010 from OECD (International Network for Financial Education, INFE), this paper aims to investigate the influence of socio-demographic and financial knowledge factors on four selected financial management practices of Malaysians. The four types of financial management practices are: whether the individual plans a budget, lives within their means, is prepared for income shock and owns an insurance policy. These four financial management practices are used to measure individuals' overall financial management behaviour. The measurement of financial management behaviour is divided into three levels depending on the type of financial management practices carried out by individuals. Ordered probit is used to determine socio-economic factors that are significant in explaining the varying differences in the financial management behaviours among Malaysians. The paper also identifies the financial knowledge gaps and investigates the levels of financial knowledge of Malaysians. While the majority of Malaysians show an average level of financial knowledge and plan their budget, many are financially unprepared for income shock and unexpected circumstances. The findings show that ethnicity, income, gender, regularity of income, education, age and financial knowledge have significant effect on individuals’ financial management behaviour. The findings have implications for regulators, financial educators and consumer groups in their efforts to enhance individuals’ financial management behaviour. Keywords: Emergency Saving; Financial Capability; Financial Knowledge; Living within One's
Means; Personal Finance.
1. INTRODUCTION In recent years, there has been greater emphasis on empowering consumers with adequate financial knowledge and to enhance their financial capabilities as consumers are confronted with an increasing number of complicated financial decisions. This is due to several factors. Firstly, consumers are presented with a wider array of financial instruments and investments opportunities to manage their wealth. Secondly, the easier access to credit via credit cards and low interest rate pre-approved personal loans pose strong temptations for consumers to spend beyond their means. Thirdly, longer life expectancy and the erosion of the traditional family support mechanism require consumers to become increasingly responsible for their own financial security after
Corresponding author: School of Social Sciences, Universiti Sains Malaysia, 11800 Minden, Penang,
Malaysia. Email: [email protected]
34 The Influence of Socio-Demographic and Financial Knowledge Factors on Financial
Management Practices of Malaysians
retirement. All these demand skills in financial decisions and financial judgement (Lusardi and Mitchell, 2014; Lusardi, 2008). Adequate financial knowledge is required to provide consumers the skills needed to make sound financial decisions. Given the importance of financial knowledge, several financial literacy surveys have been carried out in various parts of the world to gauge consumers’ level of financial literacy. It is found that there exist variations in the average level of financial knowledge in different countries. Further, there is mounting evidence that financial knowledge play an effective role in shaping an individual’s financial decision making, such as retirement planning, stock market participation and investment (Mandell and Klein, 2007; Lusardi, 2008; van Rooij et al., 2007; Fox et al., 2005; Hilgert et al. 2003). In short, highe7r levels of financial knowledge contribute to asset building and better debt management. However, it is acknowledged that financial knowledge alone is not the sole contributory factor to poor financial decisions. Other factors such as consumers’ socio-demographic factors, behavioural attributes and financial attitudes play important roles too. In 2010, Malaysia together with 13 other countries participated in the Organisation for Economic Cooperation and Development (OECD) International Network on Financial Education (INFE) pilot study on Measuring Financial Literacy. The data obtained constitute one of the most comprehensive and recent collections of data on the status of financial literacy and financial management behaviour among Malaysians. So far, related studies on the financial well-being of Malaysians are focused on selected groups of individuals such as the old (Chan, 2012; Jariah et al., 2012; Chan et al., 2010) and the youth (Sabri et al., 2012a, 2012b, 2010; Dahlia et al., 2009) rather than examining Malaysians across all age groups. There is growing concern on the the lack of good financial management practices among Malaysians. For example, the sustainability of household debt is in question as almost half of a household’s disposable income goes to debt repayment. The debt service ratio (ratio of debt payments to disposable income) has risen from 39.1% in 2006 to 44.2% in 2014 (Bank Negara Malaysia, 2015) while the household debt to GDP ratio of 89.6% in 2015 is the highest among its neigbouring country in the region (Bank Negara Malaysia, 2016). In addition, Bernama (2016) reported that a total of 700,000 Malaysians from all walks of life approached the Credit Counselling and Management Agency (AKPK) since its establishment in 2006 and of which, 135,000 were enrolled in the debt management program (Bernama, 2016). Furthermore, Bernama (2016), also pointed out that among those who were enrolled in the debt management program, 23% are due to poor financial management and lack of discipline in spending, 16% due to business failures and 11% are due to poor credit card management. According to the Malaysian Department of Insolvency (2016), among the 19,575 bankruptcy cases reported in the year 2012, 20.9% (4,100) are those below 34 years old and those aged between 35 to 44 years old make up the highest percentage of total personal bankruptcy (36.6%; 7164). Despite the efforts by the government and especially Bank Negara Malaysia in conducting various financial education and outreach programmes such as DuitSaku and Power! and the establishment of a Credit Counselling and Debt Management Agency, the problems arising from poor financial management among individuals continue to escalate. Hence, the participation
Yiing-Jia Loke 35
of Malaysia in the OECD (INFE) pilot study of 2010 is timely and a study to examine individual’s financial management practices among Malaysians is warranted. In view of the aforementioned issues, this study aims to examine the level of financial knowledge among Malaysians, to identify specific knowledge gaps and to investigate the effects and magnitude of socio-economic determinants of financial management behaviour among Malaysians. A better understanding of the significance and magnitude of these factors may help financial educators and regulators to have a more effective grasp on ways to reach out to the various groups of individuals.
2. INSIGHTS FROM LITERATURE
There are several models of measuring good financial management practices. For example, based on the Financial Services Authority (FSA) of United Kingdom, the four different aspects of financial management behaviour assessed are ability to manage money, plan finances ahead, make informed choices and ability to seek help from the right sources (Kempson et al., 2005). Quite similar to the FSA’s model, The Financial Regulator of Ireland’s (2009) four key areas that defines good financial management practices are money management which includes making ends meet and keeping track of money, planning ahead, choosing products and staying informed. According to Kempson et al. (2013) on the World Bank Study in collaboration with the Russia Trust Fund of Financial Literacy and Education, The World Bank has identified ten components of financial behaviour and these components are comparable across countries. The ten behavioural components are budgeting, living within means, monitoring expenses, using information, not overspending, covering unexpected expenses, saving, attitude toward the future, not being impulsive and achievement orientation. Existing studies on good financial management behaviour tend to examine the effects of individual characteristics on selected key behaviour separately. For example, in a study by the Financial Regulator of Ireland (2009) where four key behaviours are selected to characterise good financial management, the analysis of the determinants is based on each behaviour rather than analysing the determinants for overall financial management behaviour. In that study, it is found that those under 40 years old are less capable of planning ahead and worse off in making ends meet than those over 40 years old while tertiary educated individuals tends to have a higher score in planning ahead than those with primary or secondary education only. In a separate study across low and middle income countries conducted by the World Bank (Holzmann et al., 2013), explanatory variables consisting of socio-economic factors are examined on the extent of their effects on each of the behavioural components. Among the significant findings is that women play a significant role in budgeting and saving decisions compared to men. However, there are heterogeneity effects of education and income groups across the various behavioural components. For example, those with tertiary education compared to those with secondary education are more likely to do budgeting and live within their means, while those with primary education are less likely to monitor their expenses and do not have enough funds to cover unexpected expenses compared to those with secondary education.
36 The Influence of Socio-Demographic and Financial Knowledge Factors on Financial
Management Practices of Malaysians
In the Malaysian context, studies on financial management behaviour and financial well beings are generally focused on selected groups of individuals. For example, in the study on older adults, Chan et al. (2010) found that while males and females have similar financial behaviour such as being weaker in investment and credit management but better in planning and cash management, men generally have higher mean score than female when computing the overall financial management behaviour among the two genders. Similarly, Jariah et al. (2012) who also studied the older population found that males score higher in good financial management practices. Furthermore, Jariah et al. (2012) found that more than half of their sample respondents budget their expenses but at the same time, more than half of them spend more than what they have. There were ethnic and education differences in the financial management behaviour among the older population whereby the Chinese were better in investing their savings and those who attained higher education have better financial management practices. Anthony and Sabri (2015) analysed financial management practices among medical practitioners in Malaysia. The financial management practices that were analysed were cash management practice, credit management practice, retirement and estate management practice, risk management practice and general financial management practice. It was found that only a small fraction of medical practitioners (35%) practice favourable financial management practice and only 45% of the medical practitioners practice positive cash management practice. Retirement and estate management practice are the most neglected aspect of financial management practice among the medical practitioners. A study of financial well being among public sector employees was conducted by Mokhtar et al. (2015). The study found that socio-demographic factors were not significant predictors of financial well being among the public sector employees. The financial well being in the study were measured based on several aspects including the ability to fulfil monthly financial commitments, having emergency funds and sufficient retirement savings, respondents' sentiments towards their current financial status and etc. However, in general, it was found that there is weak saving habit among the public sector employees and they were more inclined to spend beyond their means. In a study on the financial well being of young workers aged 40 years old and below, Sabri and Zakaria (2015) found that female, being married and those earning above RM3,500 are financially better off. Furthermore, the study highlights the significance of good financial management practice particular money management and planning ahead contributes positively to an individual financial well being. As mentioned, there is mounting evidence that financial literacy equips individuals with skills to manage their finances effectively and responsibly. Other existing financial capability and financial literacy survey studies aim to measure the relationship between selected financial behaviour and financial knowledge (van Rooij et al., 2012; Klapper et al., 2012; Huston, 2010) and to understand certain behaviours related to the use of financial products (Banco de Portugal, 2010; and Australia and New Zealand Banking Group, 2011). Financial literacy focuses on individual’s numeracy skills and financial knowledge. To differentiate the individuals’ level of financial knowledge, Lusardi and Mitchell (2009) and Lusardi (2008) have divided the the financial knowledge questions into basic and sophisticated literacy questions. Basic financial literacy questions relates to understanding of concepts such as inflation, interest compound and time value of money while sophisticated financial literacy questions refers to questions that assess individual’s knowledge on the functioning of stock market, the risk-return relationships and risk diversification. Overall, many of the financial knowledge questions used in the
Yiing-Jia Loke 37
financial literacy surveys are modified and adopted from Lusardi and Tufano (2009), Lusardi and Mitchell (2009) and Lusardi (2008). Measuring financial literacy is rather straight forward compared to measuring capable financial management practices. In a departure from the existing studies particularly in the case of Malaysian studies which focuses on the financial well being and financial management practices of selected groups of individuals, this paper will shed insights on the financial management behaviour of Malaysians from all walks of life. Furthermore, this paper also measures the overall financial management behaviour of an individual and not selected financial behaviour only unlike existing papers. This gives an overall picture of the financial management behaviour of Malaysians. Furthermore, the study utilise a nationwide financial literacy survey which is part of the OECD (INFE) pilot study on measuring financial literacy. Hence, the results can be compared and used by researchers from other participating countries of the OECD (INFE) survey. Based on the existing operational measurement for good and capable financial management behaviour and due to the availability of data, the analysis on good financial management behaviour among Malaysians in this paper focuses on four key financial management practices, namely budgeting, living within means, income sustainability (preparedness for income shock) and having an insurance policy (covering unexpected expenses).
3. METHODOLOGY AND DATA
3.1. Econometric specification The dependent variable in this study is the level of financial management behaviour measured by the number of positive financial management practices carried out by an individual. The strength of an individual’s financial management behaviour increases with the number of positive financial management practices carried out by an individual. Given that the level of financial management behaviour is categorical and ordinal with a clear ordering, ordered probit is an appropriate statistical model to explain the ordinal variations of the financial management behaviour levels (McCullaph, 1980; McKelvey and Zavoina, 1975). A total of four financial management practices are used to measure an individual's level of financial management behaviour (budgeting, living within means, income sustainability and having an insurance policy). The specific question asked for each of the financial management practices is:
For budgeting: Do you have a household budget?
For living within means: Sometimes people find their income does not quite cover their living costs. In the past 12 months, has this happened to you?
For sustainability of funds: If you lost your main source of income, how long could you continue to cover your living expenses for, without borrowing any money or moving house?
38 The Influence of Socio-Demographic and Financial Knowledge Factors on Financial
Management Practices of Malaysians
For having an insurance policy: Do you currently own insurance? A score of 1 is given to those who answer ‘yes’ for each of the financial management practice such as; having a budget, their income has been able to cover their living cost in the past 12 months, owning an insurance policy and are able to cover living expenses for three months and more if they lose their main source of income. In other words, if an individual does not practice any of the financial management behaviour, a score of “0” is given. Furthermore, as the importance of each of this financial management practice varies in terms of its demand on individual's discipline and capability, different weights are assigned. Funds sustainability is given the highest weight where its score is multiplied by the value 4, followed by living within means where its score is multiplied by the value 3, budget’s score is multiplied by 2 and finally, ownership of an insurance policy’s score is multiplied by 1. Therefore, if an individual practices all four financial behaviours, then a full score of 10 will be given while if an individual fails to practice any of the financial behaviour, then the individual would have a score of 0. In other words, the values of the financial management behaviour score range from 0 to 10 )100( C , where C refers to the financial management behaviour score. The dependent variable of the level of financial management behaviour in the ordered probit model is characterised as follows:
Poor: has a financial management behaviour score of 0 to 3 )30( C Moderate: has a financial management behaviour score of 4 to 6 )64( C Good: has a financial management behaviour score of above 7 )107( C
Financial management behaviour is given a value 1, 2 and 3 which indicates weak, moderate and good levels of financial management behaviour. The ordered probit (OP) model is usually justified on the basis of a latent variable, i.e. a variable that is not directly observed but rather inferred from other variables that are observed (directly measured). In general, the ordered probit model is written as:
xy '* (1)
where y* is the latent and continuous measure of financial management behaviour levels coded as 1, 2 and 3; ’ is the vector of estimated parameters and x is the vector of explanatory variables; is the error term )1,0(~ Nε with cumulative distribution denoted by )(Φ and density function denoted by )(φ . The observed and coded discrete financial management behaviour level, y, is derived from the model as follows:
y* = 1 (poor) if 1* y (2)
y* = 2 (moderate) if 21 * y (3)
Yiing-Jia Loke 39
y* = 3 (good) if 2* y (4)
1, 2 and 3 are threshold variables in the probit model. The threshold variables are unknown and determine the maximum likelihood estimation procedure for the ordered probit. Given the cumulative normal function, the probability for each level of financial management behaviour is derived from (2)-(4) respectively. For example, the probability of having a moderate financial management behaviour is:
)'()'()2Pr( 23 xxy (5)
Using the maximum likelihood estimates, the marginal effects of explanatory variables are derived by differentiating the category probabilities, such as (5). Hence, the marginal effects of factors on the probability of having a moderate financial management behaviour can be evaluated in the following way:
xxx
yob''
)2(Pr23
(6)
For discrete explanatory variables, the marginal effects of the explanatory factors on the probability of the levels of financial management behaviour is taken as the differences between the predicted probability when variable x takes the value 0 and the predicted probability when the variable x takes the value 11. 3.2. Data The data used is taken from the OECD (INFE) pilot survey on ‘Measuring Financial Literacy’ which was conducted in 2010. The data were obtained from the Central Bank of Malaysia. The survey was carried out nationwide, covering Peninsular Malaysia and East Malaysia. The sample was stratified according to age, gender, income group, state and ethnic group. Of the total sample size of 1,046, this study utilises information collected from 990 respondents only, as there was incomplete or missing information for the rest of the respondents. The survey comprises questions on financial knowledge, behaviour, and attitudes relating to various aspects of financial literacy including budgeting, money management, short- and long-term financial planning and financial product choice. Questions on the socio-demographic details of respondents are also included in the survey. 3.3. Variables The explanatory variables consist of the individual's socio-economic characteristics and the level of the individual's financial knowledge score. The socio-economic characteristics follow the typical variables in the existing literature such as gender, income group, ethnicity, marital status, age group, education and homeownership.
1 For example, the marginal effects for a dummy variable, such as Chinese on the probability that y=1, is the
difference between the predicted probability when Chinese = 0 and the predicted probability when Chinese = 1.
40 The Influence of Socio-Demographic and Financial Knowledge Factors on Financial
Management Practices of Malaysians
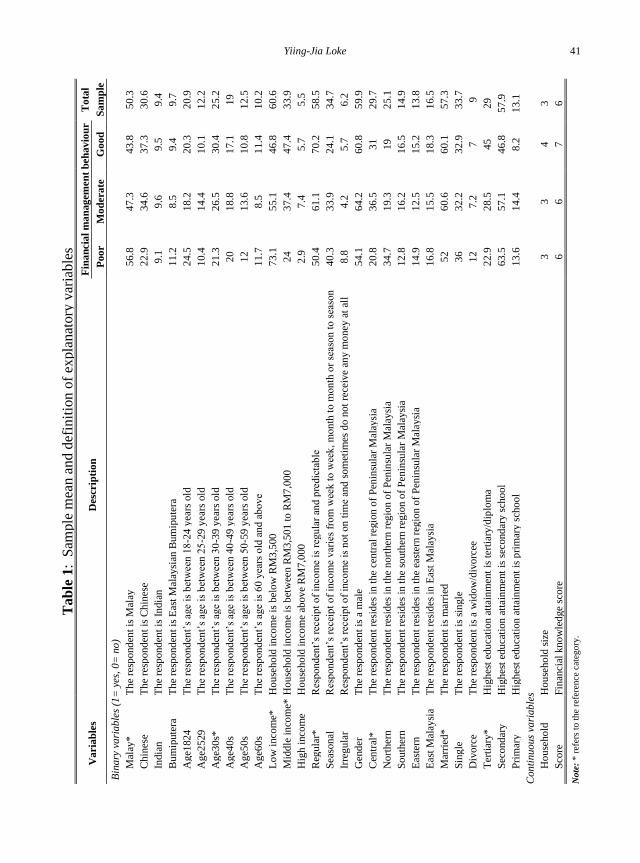
Ethnicity in this study includes the three main ethnic groups in Peninsular Malaysia, namely Malays, Chinese and Indians, as well as the various ethnic tribes in East Malaysia, categorised as East Malaysian Bumiputeras. As the reliability of income can have a significant impact on a household’s financial welfare, an additional variable on the reliability of income was added to the socio-economic and demographic variables and divided into three groups: regular income, seasonal income and irregular income. The description of this variable is defined in Table 1. Consumers’ financial knowledge is gauged using a set of ten questions that assess their numeracy skills (simple division) and knowledge of selected financial concepts (such as computation of interest and compound interest, time value of money, definition of inflation, relationship between risk and returns, and diversification). A full score implies that a respondent has successfully answered all ten questions correctly, while a zero score indicates that a respondent could not answer a single question correctly. The score obtained is used as a proxy for respondents’ financial knowledge. 3.4. Characteristics of survey respondents Sample statistics of variables are provided in Table 1. Of the sample of 990 respondents, 375 (37.8%) have poor financial management behaviour, 457 (46.2%) and 158 (15.9%) have moderate and good financial management behaviour respectively. The overall sample ethnic breakdown consists of 498 (50.3%) Malays, 303 (30.6%) Chinese, 93 (9.4%) Indians and 96 (9.7%) East Malaysian Bumiputeras. While the Malays make up 50.3% of the overall total sample, 56.8% of those who have poor financial management behaviour are Malays. On the other hand, while Chinese make up 30.6% of the total overall sample, 37% of them make up those who have good financial management behaviour. Income groups are divided into three categories which follows approximately the definition used by the 11th Malaysia Plan2. Low income group make up 60.6% of the total sample while only 5.5% of the sample falls into the high income group category. It is found that low income make up 70.3% of those with poor financial management behaviour and this is above the average total sample of low income earners (60.6%). On the other hand, 24% and 2.9% of those with poor financial management behaviour are middle income and high income earners respectively. Those whose income receipt is regular and predictable are more likely to have good financial management behaviour whereby, they make up 70.2% of those in that category. Furthermore, tertiary education promotes good financial management behaviour. Although those who have tertiary education make up only 29% of the total sample, 45% of those with good financial management behaviour have tertiary education. On the contrary, while those who have only secondary education make up 57.9% of the total sample, they account for 46.8% of those with good financial management behaviour. Lastly, it is observed that higher financial knowledge score contributes to better financial management behaviour.
2 The categorization used is an approximation of the income classification in 11th Malaysia Plan (Economic
Planning Unit, 2015: p3-22). In the 11th Malaysia Plan, low income refers to household with income below
RM3,855, middle income refers to household earning between RM3,855 to RM8,315 while high income
refers to household above RM8,315. However, the highest income classification in the survey data refers to
household earning above RM7,000. This category is referred to as the high income in this study.
Yiing-Jia Loke 41
Ta
ble
1:
Sam
ple
mea
n a
nd d
efin
itio
n o
f ex
pla
nat
ory
var
iable
s T
ota
l
Sa
mp
le
Bin
ary
va
riab
les
(1=
yes
, 0
= n
o)
50.3
30.6
9.4
9.7
20.9
12.2
25.2
19
12.5
10.2
60.6
33.9
5.5
58.5
34.7
6.2
59.9
29.7
25.1
14.9
13.8
16.5
57.3
33.7
9
29
57.9
13.1
Con
tinuo
us
vari
ab
les
3
6
Fin
an
cia
l m
an
ag
emen
t b
eh
av
iou
r
Go
od
43.8
37.3
9.5
9.4
20.3
10.1
30.4
17.1
10.8
11.4
46.8
47.4
5.7
70.2
24.1
5.7
60.8
31
19
16.5
15.2
18.3
60.1
32.9
7
45
46.8
8.2
4
7
Mo
dera
te
47.3
34.6
9.6
8.5
18.2
14.4
26.5
18.8
13.6
8.5
55.1
37.4
7.4
61.1
33.9
4.2
64.2
36.5
19.3
16.2
12.5
15.5
60.6
32.2
7.2
28.5
57.1
14.4
3
6
Poo
r
56.8
22.9
9.1
11.2
24.5
10.4
21.3
20
12
11.7
73.1
24
2.9
50.4
40.3
8.8
54.1
20.8
34.7
12.8
14.9
16.8
52
36
12
22.9
63.5
13.6
3
6
Desc
rip
tio
n
Th
e re
spond
ent
is M
alay
Th
e re
spond
ent
is C
hin
ese
Th
e re
spond
ent
is I
ndia
n
Th
e re
spond
ent
is E
ast
Mal
aysi
an B
um
ipu
tera
Th
e re
spond
ent’
s ag
e is
bet
wee
n 1
8-2
4 y
ears
old
Th
e re
spond
ent’
s ag
e is
bet
wee
n 2
5-2
9 y
ears
old
Th
e re
spond
ent’
s ag
e is
bet
wee
n 3
0-3
9 y
ears
old
Th
e re
spond
ent’
s ag
e is
bet
wee
n 4
0-4
9 y
ears
old
Th
e re
spond
ent’
s ag
e is
bet
wee
n 5
0-5
9 y
ears
old
Th
e re
spond
ent’
s ag
e is
60 y
ears
old
an
d a
bov
e
Ho
use
ho
ld i
nco
me
is b
elo
w R
M3
,500
Ho
use
ho
ld i
nco
me
is b
etw
een R
M3
,50
1 t
o R
M7
,00
0
Ho
use
ho
ld i
nco
me
abov
e R
M7
,000
Res
pond
ent’
s re
ceip
t o
f in
com
e is
reg
ula
r an
d p
redic
tab
le
Res
pond
ent’
s re
ceip
t o
f in
com
e v
arie
s fr
om
wee
k t
o w
eek
, m
on
th t
o m
onth
or
seas
on
to
sea
son
Res
pond
ent’
s re
ceip
t o
f in
com
e is
not
on
tim
e an
d s
om
etim
es d
o n
ot
rece
ive
any m
oney
at
all
Th
e re
spond
ent
is a
mal
e
Th
e re
spond
ent
resi
des
in
the
cen
tral
reg
ion
of
Pen
insu
lar
Mal
aysi
a
Th
e re
spond
ent
resi
des
in
the
no
rther
n r
egio
n o
f P
enin
sula
r M
alay
sia
Th
e re
spond
ent
resi
des
in
the
south
ern
reg
ion
of
Pen
insu
lar
Mal
aysi
a
Th
e re
spond
ent
resi
des
in
the
east
ern r
egio
n o
f P
enin
sula
r M
alay
sia
Th
e re
spond
ent
resi
des
in
Eas
t M
alay
sia
Th
e re
spond
ent
is m
arri
ed
Th
e re
spond
ent
is s
ingle
Th
e re
spond
ent
is a
wid
ow
/div
orc
ee
Hig
hes
t ed
uca
tion
att
ain
men
t is
ter
tiar
y/d
iplo
ma
Hig
hes
t ed
uca
tion
att
ain
men
t is
sec
ond
ary
sch
ool
Hig
hes
t ed
uca
tion
att
ain
men
t is
pri
mar
y s
cho
ol
Ho
use
ho
ld s
ize
Fin
anci
al k
no
wle
dge
sco
re
No
te:
* r
efer
s to
th
e re
fere
nce
cat
egory
.
Va
ria
ble
s
Mal
ay*
Chin
ese
India
n
Bu
mip
ute
ra
Ag
e1824
Ag
e2529
Ag
e30
s*
Ag
e40
s
Ag
e50
s
Ag
e60
s
Lo
w i
nco
me*
Mid
dle
in
com
e*
Hig
h i
nco
me
Reg
ula
r*
Sea
sonal
Irre
gula
r
Gen
der
Cen
tral
*
No
rther
n
So
uth
ern
Eas
tern
Eas
t M
alay
sia
Mar
ried
*
Sin
gle
Div
orc
e
Ter
tiar
y*
Sec
ond
ary
Pri
mar
y
Ho
use
ho
ld
Sco
re
42 The Influence of Socio-Demographic and Financial Knowledge Factors on Financial
Management Practices of Malaysians
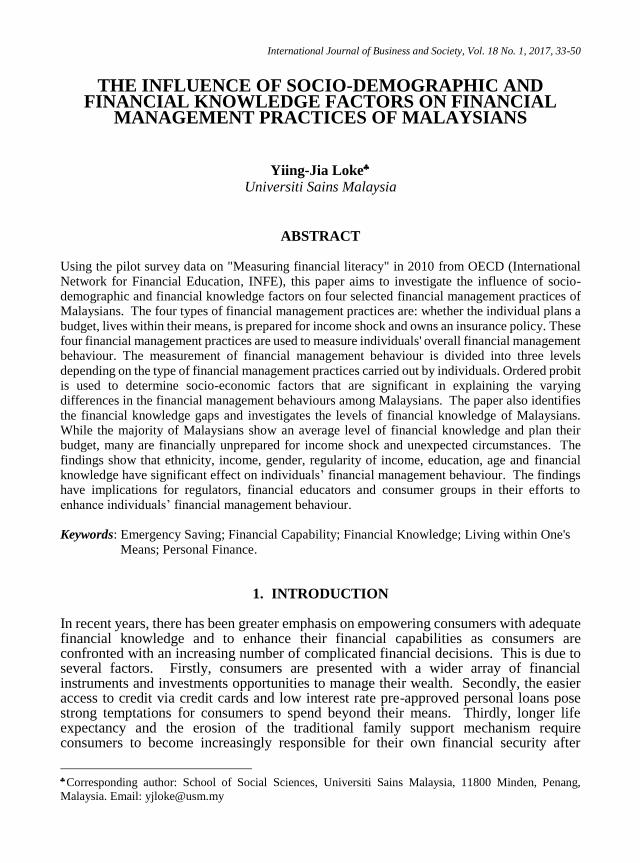
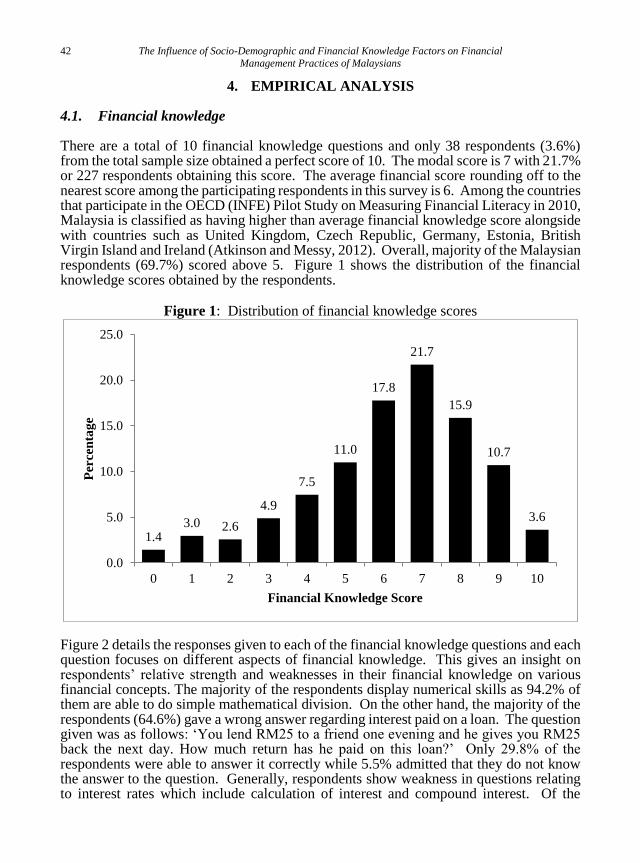
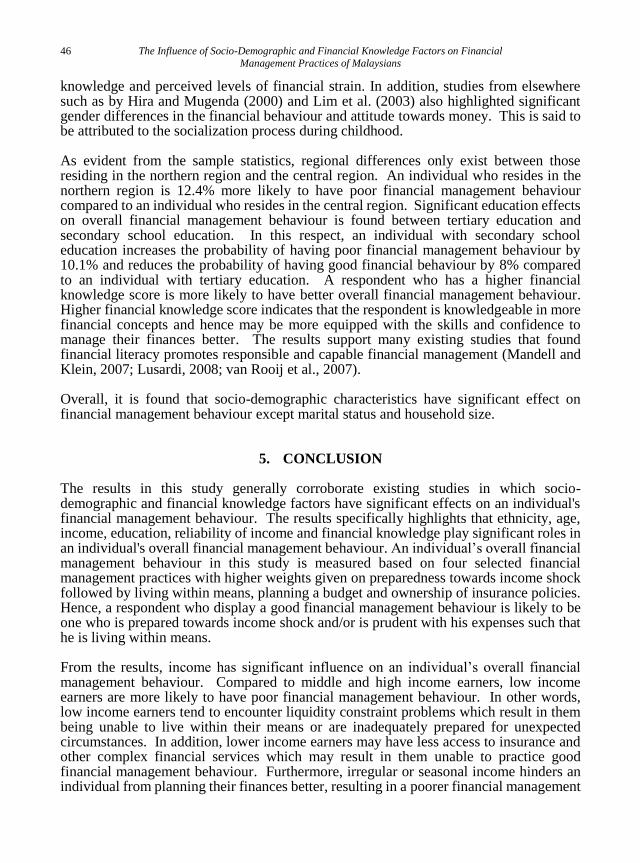
4. EMPIRICAL ANALYSIS 4.1. Financial knowledge There are a total of 10 financial knowledge questions and only 38 respondents (3.6%) from the total sample size obtained a perfect score of 10. The modal score is 7 with 21.7% or 227 respondents obtaining this score. The average financial score rounding off to the nearest score among the participating respondents in this survey is 6. Among the countries that participate in the OECD (INFE) Pilot Study on Measuring Financial Literacy in 2010, Malaysia is classified as having higher than average financial knowledge score alongside with countries such as United Kingdom, Czech Republic, Germany, Estonia, British Virgin Island and Ireland (Atkinson and Messy, 2012). Overall, majority of the Malaysian respondents (69.7%) scored above 5. Figure 1 shows the distribution of the financial knowledge scores obtained by the respondents.
Figure 1: Distribution of financial knowledge scores
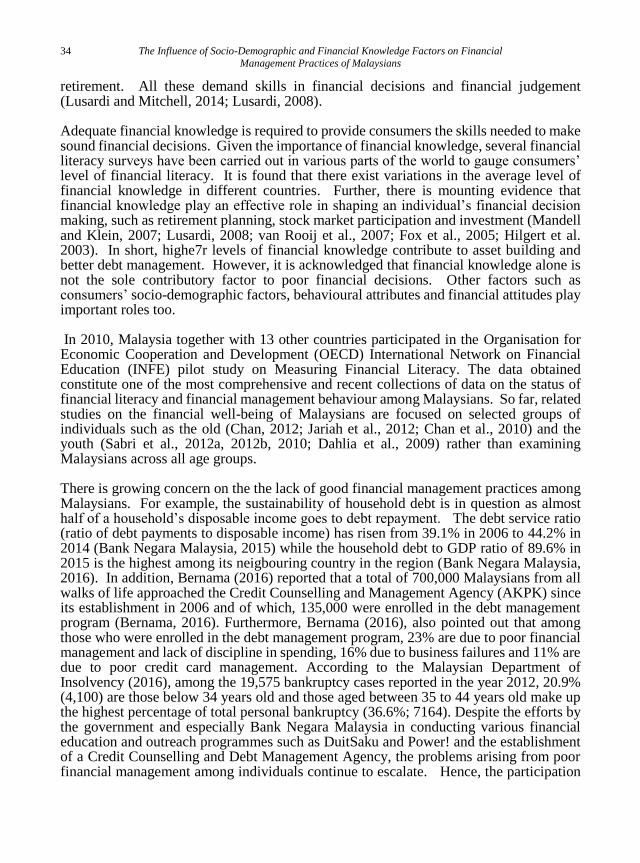
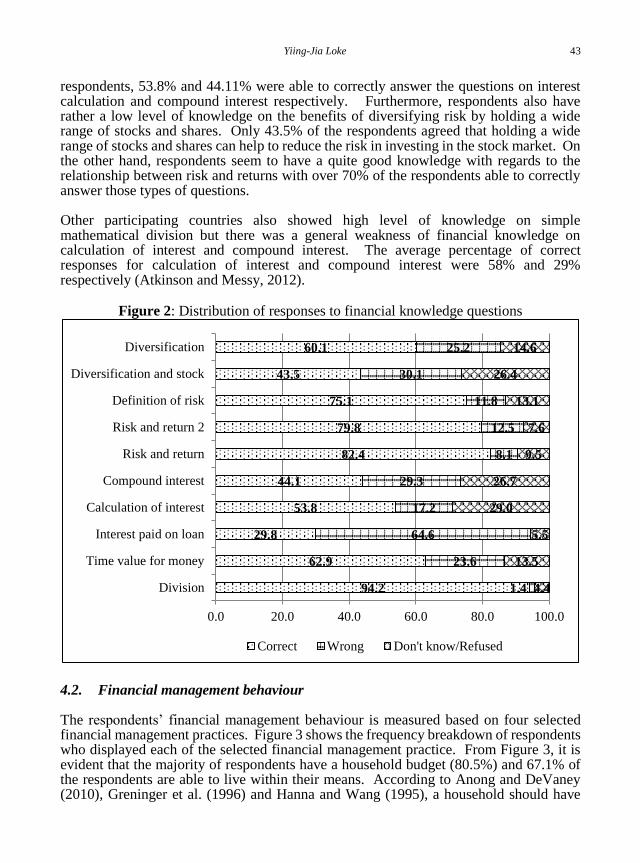
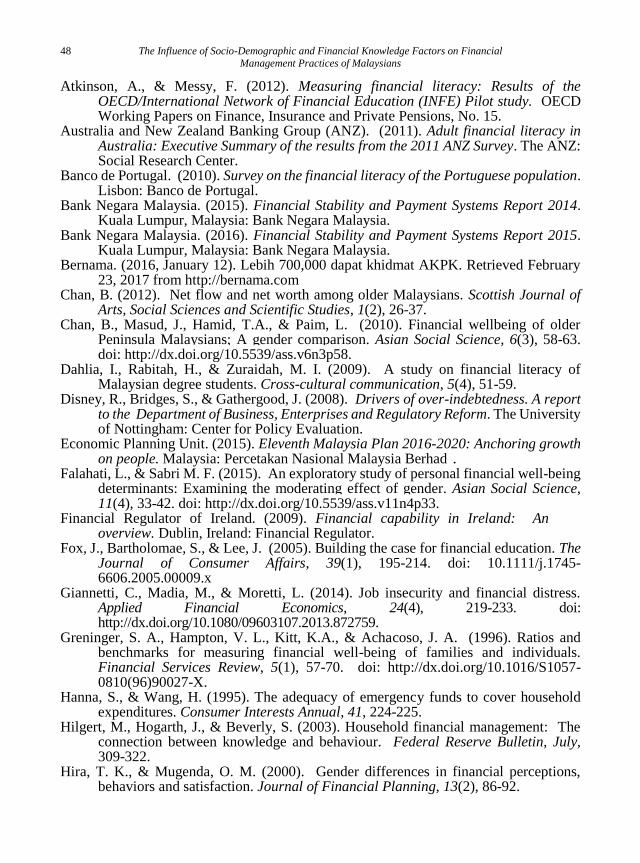
Figure 2 details the responses given to each of the financial knowledge questions and each question focuses on different aspects of financial knowledge. This gives an insight on respondents’ relative strength and weaknesses in their financial knowledge on various financial concepts. The majority of the respondents display numerical skills as 94.2% of them are able to do simple mathematical division. On the other hand, the majority of the respondents (64.6%) gave a wrong answer regarding interest paid on a loan. The question given was as follows: ‘You lend RM25 to a friend one evening and he gives you RM25 back the next day. How much return has he paid on this loan?’ Only 29.8% of the respondents were able to answer it correctly while 5.5% admitted that they do not know the answer to the question. Generally, respondents show weakness in questions relating to interest rates which include calculation of interest and compound interest. Of the
1.43.0 2.6
4.9
7.5
11.0
17.8
21.7
15.9
10.7
3.6
0.0
5.0
10.0
15.0
20.0
25.0
0 1 2 3 4 5 6 7 8 9 10
Per
cen
tag
e
Financial Knowledge Score
Yiing-Jia Loke 43
respondents, 53.8% and 44.11% were able to correctly answer the questions on interest calculation and compound interest respectively. Furthermore, respondents also have rather a low level of knowledge on the benefits of diversifying risk by holding a wide range of stocks and shares. Only 43.5% of the respondents agreed that holding a wide range of stocks and shares can help to reduce the risk in investing in the stock market. On the other hand, respondents seem to have a quite good knowledge with regards to the relationship between risk and returns with over 70% of the respondents able to correctly answer those types of questions. Other participating countries also showed high level of knowledge on simple mathematical division but there was a general weakness of financial knowledge on calculation of interest and compound interest. The average percentage of correct responses for calculation of interest and compound interest were 58% and 29% respectively (Atkinson and Messy, 2012).
Figure 2: Distribution of responses to financial knowledge questions
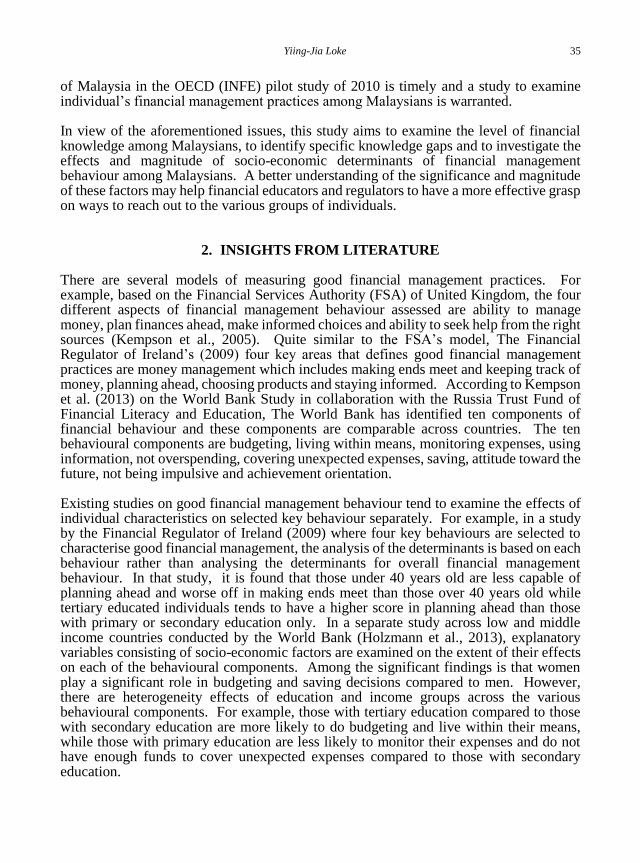
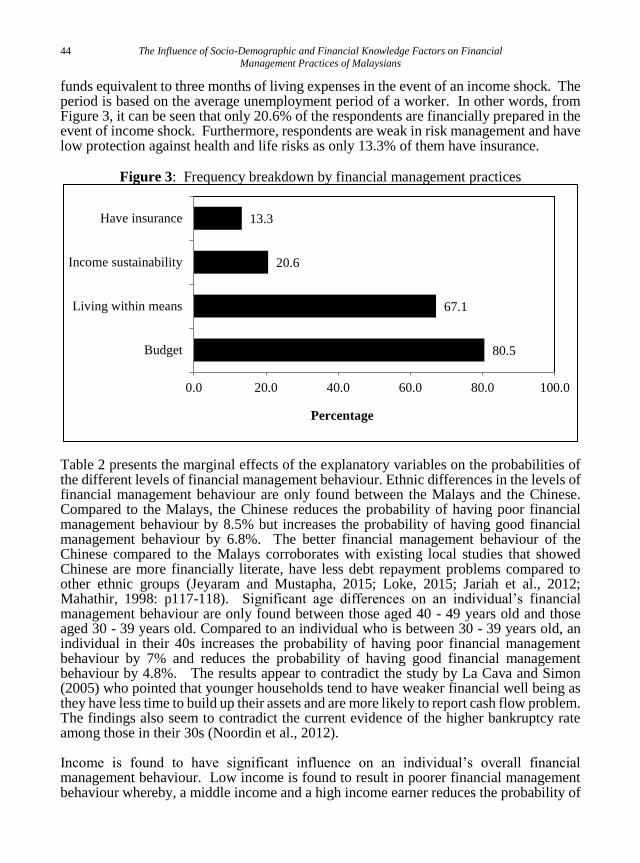
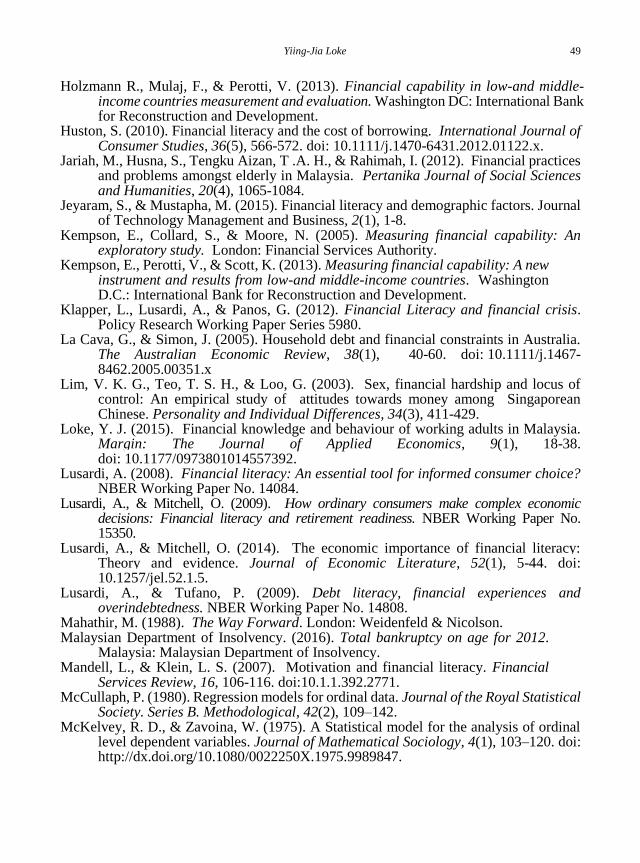
4.2. Financial management behaviour The respondents’ financial management behaviour is measured based on four selected financial management practices. Figure 3 shows the frequency breakdown of respondents who displayed each of the selected financial management practice. From Figure 3, it is evident that the majority of respondents have a household budget (80.5%) and 67.1% of the respondents are able to live within their means. According to Anong and DeVaney (2010), Greninger et al. (1996) and Hanna and Wang (1995), a household should have
94.2
62.9
29.8
53.8
44.1
82.4
79.8
75.1
43.5
60.1
1.4
23.6
64.6
17.2
29.3
8.1
12.5
11.8
30.1
25.2
4.4
13.5
5.5
29.0
26.7
9.5
7.6
13.1
26.4
14.6
0.0 20.0 40.0 60.0 80.0 100.0
Division
Time value for money
Interest paid on loan
Calculation of interest
Compound interest
Risk and return
Risk and return 2
Definition of risk
Diversification and stock
Diversification
Correct Wrong Don't know/Refused
44 The Influence of Socio-Demographic and Financial Knowledge Factors on Financial
Management Practices of Malaysians
funds equivalent to three months of living expenses in the event of an income shock. The period is based on the average unemployment period of a worker. In other words, from Figure 3, it can be seen that only 20.6% of the respondents are financially prepared in the event of income shock. Furthermore, respondents are weak in risk management and have low protection against health and life risks as only 13.3% of them have insurance.
Figure 3: Frequency breakdown by financial management practices
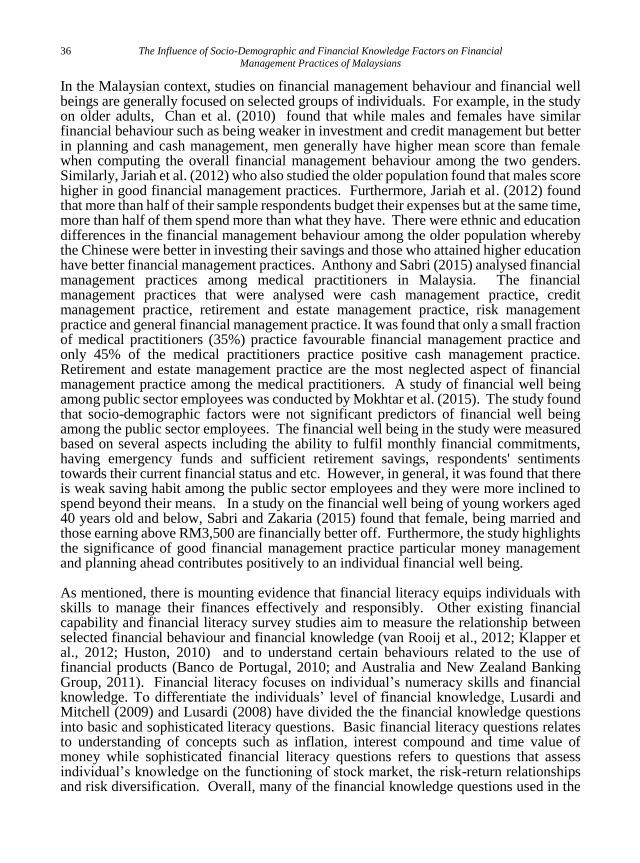
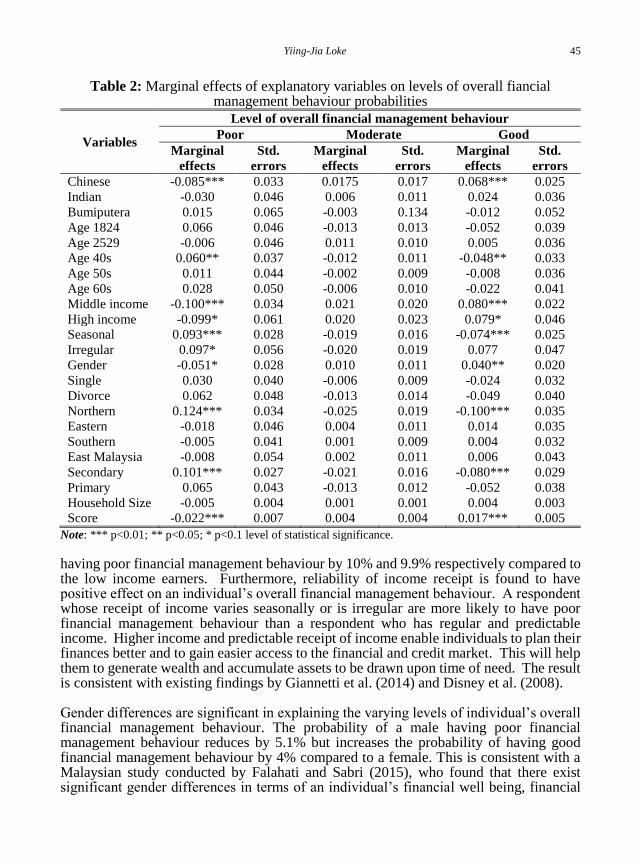
Table 2 presents the marginal effects of the explanatory variables on the probabilities of the different levels of financial management behaviour. Ethnic differences in the levels of financial management behaviour are only found between the Malays and the Chinese. Compared to the Malays, the Chinese reduces the probability of having poor financial management behaviour by 8.5% but increases the probability of having good financial management behaviour by 6.8%. The better financial management behaviour of the Chinese compared to the Malays corroborates with existing local studies that showed Chinese are more financially literate, have less debt repayment problems compared to other ethnic groups (Jeyaram and Mustapha, 2015; Loke, 2015; Jariah et al., 2012; Mahathir, 1998: p117-118). Significant age differences on an individual’s financial management behaviour are only found between those aged 40 - 49 years old and those aged 30 - 39 years old. Compared to an individual who is between 30 - 39 years old, an individual in their 40s increases the probability of having poor financial management behaviour by 7% and reduces the probability of having good financial management behaviour by 4.8%. The results appear to contradict the study by La Cava and Simon (2005) who pointed that younger households tend to have weaker financial well being as they have less time to build up their assets and are more likely to report cash flow problem. The findings also seem to contradict the current evidence of the higher bankruptcy rate among those in their 30s (Noordin et al., 2012). Income is found to have significant influence on an individual’s overall financial management behaviour. Low income is found to result in poorer financial management behaviour whereby, a middle income and a high income earner reduces the probability of
80.5
67.1
20.6
13.3
0.0 20.0 40.0 60.0 80.0 100.0
Budget
Living within means
Income sustainability
Have insurance
Percentage
Yiing-Jia Loke 45
Table 2: Marginal effects of explanatory variables on levels of overall fiancial management behaviour probabilities
Variables
Level of overall financial management behaviour
Poor Moderate Good
Marginal
effects
Std.
errors
Marginal
effects
Std.
errors
Marginal
effects
Std.
errors
Chinese -0.085*** 0.033 0.0175 0.017 0.068*** 0.025
Indian -0.030 0.046 0.006 0.011 0.024 0.036
Bumiputera 0.015 0.065 -0.003 0.134 -0.012 0.052
Age 1824 0.066 0.046 -0.013 0.013 -0.052 0.039
Age 2529 -0.006 0.046 0.011 0.010 0.005 0.036
Age 40s 0.060** 0.037 -0.012 0.011 -0.048** 0.033
Age 50s 0.011 0.044 -0.002 0.009 -0.008 0.036
Age 60s 0.028 0.050 -0.006 0.010 -0.022 0.041
Middle income -0.100*** 0.034 0.021 0.020 0.080*** 0.022
High income -0.099* 0.061 0.020 0.023 0.079* 0.046
Seasonal 0.093*** 0.028 -0.019 0.016 -0.074*** 0.025
Irregular 0.097* 0.056 -0.020 0.019 0.077 0.047
Gender -0.051* 0.028 0.010 0.011 0.040** 0.020
Single 0.030 0.040 -0.006 0.009 -0.024 0.032
Divorce 0.062 0.048 -0.013 0.014 -0.049 0.040
Northern 0.124*** 0.034 -0.025 0.019 -0.100*** 0.035
Eastern -0.018 0.046 0.004 0.011 0.014 0.035
Southern -0.005 0.041 0.001 0.009 0.004 0.032
East Malaysia -0.008 0.054 0.002 0.011 0.006 0.043
Secondary 0.101*** 0.027 -0.021 0.016 -0.080*** 0.029
Primary 0.065 0.043 -0.013 0.012 -0.052 0.038
Household Size -0.005 0.004 0.001 0.001 0.004 0.003
Score -0.022*** 0.007 0.004 0.004 0.017*** 0.005
Note: *** p<0.01; ** p<0.05; * p<0.1 level of statistical significance.
having poor financial management behaviour by 10% and 9.9% respectively compared to the low income earners. Furthermore, reliability of income receipt is found to have positive effect on an individual’s overall financial management behaviour. A respondent whose receipt of income varies seasonally or is irregular are more likely to have poor financial management behaviour than a respondent who has regular and predictable income. Higher income and predictable receipt of income enable individuals to plan their finances better and to gain easier access to the financial and credit market. This will help them to generate wealth and accumulate assets to be drawn upon time of need. The result is consistent with existing findings by Giannetti et al. (2014) and Disney et al. (2008). Gender differences are significant in explaining the varying levels of individual’s overall financial management behaviour. The probability of a male having poor financial management behaviour reduces by 5.1% but increases the probability of having good financial management behaviour by 4% compared to a female. This is consistent with a Malaysian study conducted by Falahati and Sabri (2015), who found that there exist significant gender differences in terms of an individual’s financial well being, financial
46 The Influence of Socio-Demographic and Financial Knowledge Factors on Financial
Management Practices of Malaysians
knowledge and perceived levels of financial strain. In addition, studies from elsewhere such as by Hira and Mugenda (2000) and Lim et al. (2003) also highlighted significant gender differences in the financial behaviour and attitude towards money. This is said to be attributed to the socialization process during childhood. As evident from the sample statistics, regional differences only exist between those residing in the northern region and the central region. An individual who resides in the northern region is 12.4% more likely to have poor financial management behaviour compared to an individual who resides in the central region. Significant education effects on overall financial management behaviour is found between tertiary education and secondary school education. In this respect, an individual with secondary school education increases the probability of having poor financial management behaviour by 10.1% and reduces the probability of having good financial behaviour by 8% compared to an individual with tertiary education. A respondent who has a higher financial knowledge score is more likely to have better overall financial management behaviour. Higher financial knowledge score indicates that the respondent is knowledgeable in more financial concepts and hence may be more equipped with the skills and confidence to manage their finances better. The results support many existing studies that found financial literacy promotes responsible and capable financial management (Mandell and Klein, 2007; Lusardi, 2008; van Rooij et al., 2007). Overall, it is found that socio-demographic characteristics have significant effect on financial management behaviour except marital status and household size.
5. CONCLUSION The results in this study generally corroborate existing studies in which socio-demographic and financial knowledge factors have significant effects on an individual's financial management behaviour. The results specifically highlights that ethnicity, age, income, education, reliability of income and financial knowledge play significant roles in an individual's overall financial management behaviour. An individual’s overall financial management behaviour in this study is measured based on four selected financial management practices with higher weights given on preparedness towards income shock followed by living within means, planning a budget and ownership of insurance policies. Hence, a respondent who display a good financial management behaviour is likely to be one who is prepared towards income shock and/or is prudent with his expenses such that he is living within means. From the results, income has significant influence on an individual’s overall financial management behaviour. Compared to middle and high income earners, low income earners are more likely to have poor financial management behaviour. In other words, low income earners tend to encounter liquidity constraint problems which result in them being unable to live within their means or are inadequately prepared for unexpected circumstances. In addition, lower income earners may have less access to insurance and other complex financial services which may result in them unable to practice good financial management behaviour. Furthermore, irregular or seasonal income hinders an individual from planning their finances better, resulting in a poorer financial management

Yiing-Jia Loke 47
behaviour. Given the significant role of income and the stability of income, continued attention should be given to the lower income groups such as of having a better understanding on their needs and constraints and to explore ways to customize financial services which can cater to their needs given the constraints that they experience. Although the existing statistics shows that individuals below 30 years old have higher incidence of bankruptcy and indebtedness, the findings here appears to show that age differences on financial management behaviour only exist between those aged between 30 and 39 years old and those aged between 40 and 49 years old. Given that these two age groups represents those in mid career or active employment, it is puzzling to find that those aged 40 and 49 years old fare worse in terms of financial capability than those aged between 30 and 39 years old. It is expected that with maturity, the older individuals would be more capable in managing finances especially in terms of living prudently and having better financial protection planning for unforeseen circumstances. The contradictory results obtained in this study needs to be explored further. The positive role of higher education and higher financial knowledge on overall financial management behaviour reinforces the importance of equipping individuals with the necessary knowledge to help them in managing their finances optimally. The various efforts in educating the public on financial management should be encouraged and expanded further. Given that the majority of the respondents have only secondary education (57.9%), it is essential that financial education be promoted as one of the life skills to be taught at school level so that individuals are empowered with basic financial knowledge even if they do not make it to tertiary education. The initiatives undertaken by Bank Negara Malaysia to incorporate financial education theme into the primary year 4 school curriculum beginning year 2015, is a step in the right direction. Subsequently, this initiative will be progressively introduced to all other primary school years. The findings from this paper underscore the significance of ethnicity, income, education and financial knowledge in determining individuals’ overall financial management behaviour.
ACKNOWLEDGEMENTS The author would like to thank Bank Negara Malaysia for the data used in the study. Opinions expressed are those of the author. Financial support from the Research University Grant of Universiti Sains Malaysia (1001/PSOSIAL/816213) is acknowledged.
REFERENCES
Anong, S., & DeVaney, S. A. (2010). Determinants of adequate emergency funds including the effects of seeking professional advice and industry affiliation. Family and Consumer Sciences Research Journal, 38(4), 405-419. doi. 10.1111/j.1552-3934.2010.00035.x
Anthony, R., & Sabri, M. F. (2015). Financial Management Practices of Medical Practitioners in the Private and Public Medical Service in Malaysia. International Review of Management and Business Research, 4(4), 1105-1117. doi: http://dx.doi.org/10.5539/ijbm.v6n8p105.
48 The Influence of Socio-Demographic and Financial Knowledge Factors on Financial
Management Practices of Malaysians
Atkinson, A., & Messy, F. (2012). Measuring financial literacy: Results of the OECD/International Network of Financial Education (INFE) Pilot study. OECD Working Papers on Finance, Insurance and Private Pensions, No. 15.
Australia and New Zealand Banking Group (ANZ). (2011). Adult financial literacy in Australia: Executive Summary of the results from the 2011 ANZ Survey. The ANZ: Social Research Center.
Banco de Portugal. (2010). Survey on the financial literacy of the Portuguese population. Lisbon: Banco de Portugal.
Bank Negara Malaysia. (2015). Financial Stability and Payment Systems Report 2014. Kuala Lumpur, Malaysia: Bank Negara Malaysia.
Bank Negara Malaysia. (2016). Financial Stability and Payment Systems Report 2015. Kuala Lumpur, Malaysia: Bank Negara Malaysia.
Bernama. (2016, January 12). Lebih 700,000 dapat khidmat AKPK. Retrieved February 23, 2017 from http://bernama.com
Chan, B. (2012). Net flow and net worth among older Malaysians. Scottish Journal of Arts, Social Sciences and Scientific Studies, 1(2), 26-37.
Chan, B., Masud, J., Hamid, T.A., & Paim, L. (2010). Financial wellbeing of older Peninsula Malaysians; A gender comparison. Asian Social Science, 6(3), 58-63. doi: http://dx.doi.org/10.5539/ass.v6n3p58.
Dahlia, I., Rabitah, H., & Zuraidah, M. I. (2009). A study on financial literacy of Malaysian degree students. Cross-cultural communication, 5(4), 51-59.
Disney, R., Bridges, S., & Gathergood, J. (2008). Drivers of over-indebtedness. A report to the Department of Business, Enterprises and Regulatory Reform. The University of Nottingham: Center for Policy Evaluation.
Economic Planning Unit. (2015). Eleventh Malaysia Plan 2016-2020: Anchoring growth on people. Malaysia: Percetakan Nasional Malaysia Berhad.
Falahati, L., & Sabri M. F. (2015). An exploratory study of personal financial well-being determinants: Examining the moderating effect of gender. Asian Social Science, 11(4), 33-42. doi: http://dx.doi.org/10.5539/ass.v11n4p33.
Financial Regulator of Ireland. (2009). Financial capability in Ireland: An overview. Dublin, Ireland: Financial Regulator.
Fox, J., Bartholomae, S., & Lee, J. (2005). Building the case for financial education. The Journal of Consumer Affairs, 39(1), 195-214. doi: 10.1111/j.1745-6606.2005.00009.x
Giannetti, C., Madia, M., & Moretti, L. (2014). Job insecurity and financial distress. Applied Financial Economics, 24(4), 219-233. doi: http://dx.doi.org/10.1080/09603107.2013.872759.
Greninger, S. A., Hampton, V. L., Kitt, K.A., & Achacoso, J. A. (1996). Ratios and benchmarks for measuring financial well-being of families and individuals. Financial Services Review, 5(1), 57-70. doi: http://dx.doi.org/10.1016/S1057-0810(96)90027-X.
Hanna, S., & Wang, H. (1995). The adequacy of emergency funds to cover household expenditures. Consumer Interests Annual, 41, 224-225.
Hilgert, M., Hogarth, J., & Beverly, S. (2003). Household financial management: The connection between knowledge and behaviour. Federal Reserve Bulletin, July, 309-322.
Hira, T. K., & Mugenda, O. M. (2000). Gender differences in financial perceptions, behaviors and satisfaction. Journal of Financial Planning, 13(2), 86-92.
Yiing-Jia Loke 49
Holzmann R., Mulaj, F., & Perotti, V. (2013). Financial capability in low-and middle-income countries measurement and evaluation. Washington DC: International Bank for Reconstruction and Development.
Huston, S. (2010). Financial literacy and the cost of borrowing. International Journal of Consumer Studies, 36(5), 566-572. doi: 10.1111/j.1470-6431.2012.01122.x.
Jariah, M., Husna, S., Tengku Aizan, T .A. H., & Rahimah, I. (2012). Financial practices and problems amongst elderly in Malaysia. Pertanika Journal of Social Sciences and Humanities, 20(4), 1065-1084.
Jeyaram, S., & Mustapha, M. (2015). Financial literacy and demographic factors. Journal of Technology Management and Business, 2(1), 1-8.
Kempson, E., Collard, S., & Moore, N. (2005). Measuring financial capability: An exploratory study. London: Financial Services Authority.
Kempson, E., Perotti, V., & Scott, K. (2013). Measuring financial capability: A new instrument and results from low-and middle-income countries. Washington D.C.: International Bank for Reconstruction and Development.
Klapper, L., Lusardi, A., & Panos, G. (2012). Financial Literacy and financial crisis. Policy Research Working Paper Series 5980.
La Cava, G., & Simon, J. (2005). Household debt and financial constraints in Australia. The Australian Economic Review, 38(1), 40-60. doi: 10.1111/j.1467-8462.2005.00351.x
Lim, V. K. G., Teo, T. S. H., & Loo, G. (2003). Sex, financial hardship and locus of control: An empirical study of attitudes towards money among Singaporean Chinese. Personality and Individual Differences, 34(3), 411-429.
Loke, Y. J. (2015). Financial knowledge and behaviour of working adults in Malaysia. Margin: The Journal of Applied Economics, 9(1), 18-38. doi: 10.1177/0973801014557392.
Lusardi, A. (2008). Financial literacy: An essential tool for informed consumer choice? NBER Working Paper No. 14084.
Lusardi, A., & Mitchell, O. (2009). How ordinary consumers make complex economic decisions: Financial literacy and retirement readiness. NBER Working Paper No. 15350.
Lusardi, A., & Mitchell, O. (2014). The economic importance of financial literacy: Theory and evidence. Journal of Economic Literature, 52(1), 5-44. doi: 10.1257/jel.52.1.5.
Lusardi, A., & Tufano, P. (2009). Debt literacy, financial experiences and overindebtedness. NBER Working Paper No. 14808.
Mahathir, M. (1988). The Way Forward. London: Weidenfeld & Nicolson. Malaysian Department of Insolvency. (2016). Total bankruptcy on age for 2012.
Malaysia: Malaysian Department of Insolvency. Mandell, L., & Klein, L. S. (2007). Motivation and financial literacy. Financial
Services Review, 16, 106-116. doi:10.1.1.392.2771. McCullaph, P. (1980). Regression models for ordinal data. Journal of the Royal Statistical
Society. Series B. Methodological, 42(2), 109–142. McKelvey, R. D., & Zavoina, W. (1975). A Statistical model for the analysis of ordinal
level dependent variables. Journal of Mathematical Sociology, 4(1), 103–120. doi: http://dx.doi.org/10.1080/0022250X.1975.9989847.
50 The Influence of Socio-Demographic and Financial Knowledge Factors on Financial
Management Practices of Malaysians
Mokhtar, N., Husniyah, A. R., Sabri, M. F., & Abu Talib, M. (2015). Financial well-being among public employees in Malaysia: A preliminary study. Asian Social Science, 11(18), 49-54. doi: http://dx.doi.org/10.5539/ass.v11n18p49.
Noordin, N., Zakaria, Z., Mohamed, S., Ngah, K., & Hussin, Z. (2012). Bankruptcy among young executives in Malaysia. IPEDR, 28, 132-136.
Sabri, M. F., & Zakaria, N. F. (2015). Financial well-being among young employees in Malaysia. In Z. Copur (Eds.), Handbook of Research on Behavioural Finance and Investment Strategies: Decision Making in the Financial Industry (pp. 221-235). Hersey, PA: IGI Global.
Sabri, M. F., Cook, C., & Gudmunson, C. (2012a). Financial well-being of Malaysian college students. Asian Education and Development Studies, 1(2), 153-179. doi: http://dx.doi.org/10.1108/20463161211240124
Sabri, M. F., MacDonald, M., & Masud, J. (2012b). Determinants of College Students’ Financial Behavior and Financial Problem. Archives Des Sciences Journal, 65(7), 268-277.
Sabri, M. F., MacDonald, M., Hira, T., & Masud, J. (2010). Childhood consumer experience and the financial literacy of college students in Malaysia. Family and Consumer Sciences Research Journal, 38(4), 455-467. doi: 10.1111/j.1552-3934.2010.00038.x
van Rooij, M., Lusardi, A., & Alessie, R. (2007). Financial literacy and stock market participation. National Bureau Economic Research Working Paper No. 13565.
van Rooij, M., Lusardi, A., & Alessie, R. (2012). Financial literacy, retirement planning and household wealth. The Economic Journal, 122(560), 449-478. doi: 10.1111/j.1468-0297.2012.02501.x