the influence of water composition on flavor and nutrient
TRANSCRIPT

nutrients
Article
The Influence of Water Composition on Flavor andNutrient Extraction in Green and Black Tea
Melanie Franks, Peter Lawrence, Alireza Abbaspourrad and Robin Dando *
Department of Food Science, Cornell University, Ithaca, NY 14850, USA; [email protected] (M.F.);[email protected] (P.L.); [email protected] (A.A.)* Correspondence: [email protected]
Received: 19 November 2018; Accepted: 18 December 2018; Published: 3 January 2019�����������������
Abstract: Tea is made from the processed leaves of the Camellia sinensis plant, which is a tropical andsubtropical evergreen plant native to Asia. Behind water, tea is the most consumed beverage in theworld. Factors that affect tea brewing include brewing temperature, vessel, and time, water-to-leafratio, and, in some reports, the composition of the water used. In this project, we tested if the waterused to brew tea was sufficient to influence perceived flavor to the everyday tea drinker. Black andgreen tea were brewed with bottled, tap, and deionized water, with brewing temperature, vessel, time,and the water-to-leaf ratio matched. The samples were analyzed with a human consumer sensorypanel, as well as instrumentally for color, turbidity, and Epigallocatechin Gallate (EGCG) content.Results showed that the type of water used to brew tea drastically affected sensory properties of greentea (and mildly also for black tea), which was likely driven by a much greater degree of extraction ofbitter catechins in teas brewed with more purified bottled or deionized water. For the everyday teadrinker who drinks green tea for health, the capability to double the EGCG content in tea by simplybrewing with bottled or deionized water represents a clear advantage. Conversely, those drinking teafor flavor may benefit from instead brewing tea with tap water.
Keywords: taste; sensory evaluation; tea; EGCG; hedonics
1. Introduction
1.1. Tea and Tea Processing
Tea is a beverage steeped in culture and history. Valued for its taste and caffeine content as wellas its numerous health properties [1], tea has been consumed for centuries [2]. Behind water, tea is themost consumed beverage in the world [3]. The botanical name for the plant producing tea is Camelliasinensis (L.) Kuntze. There are many other plants used for extraction such as rooibos and chamomile,however these are not strictly teas. Instead, they are classified under the category of tisanes or herbalinfusions. The main difference between various styles of tea is the level of oxidation of the leaf duringprocessing. Green and white teas are unoxidized, oolongs vary in the levels of oxidation, and black tealeaves are fully oxidized. A cup of tea is made from processed fresh tea leaves. Biochemical changesthat occur during processing help reduce the bitter taste of fresh tea leaves. Processing the tea leaveslowers water content to aid in shelf stability, deactivates enzymes, and adds sweetness and a myriadof colors to the cup. Physically the leaf transforms from a sturdy crisp leaf to limp and pliable duringwithering. Chemically, caffeine content increases, hydrolysis of hydrophobic carbohydrates begins,non-gallated catechins and aroma compounds form, and the levels of chlorophyll and various enzymesincrease [4]. For black teas, after withering, the leaves are purposefully crushed to speed oxidation.This step is what gives black tea its defining quality, whereby enzymatic oxidation converts catechinsinto theaflavins and thearubigins. Polyphenols give black tea its reddish-brown coloration [5].
Nutrients 2019, 11, 80; doi:10.3390/nu11010080 www.mdpi.com/journal/nutrients

Nutrients 2019, 11, 80 2 of 13
1.2. Tea Flavanols
The main polyphenols found in tea are flavonoids. Flavonoids are a group of bioactive compoundssynthesized during plant metabolism. Flavonoids are found in fruits and vegetables, prominently inspinach, apples, and blueberries, as well as in beverages like tea and wine. Previous health-relatedresearch on tea has largely focused on the flavonoid group. Flavonoids contain two six-carbon ringslinked by a three-carbon unit, which is also known as a chalcone structure [6]. Catechins (also referredto as flavanols) are bioactive compounds that are a subclass of flavonoids, and, in tea, are the mainsecondary metabolites. The main catechins in tea are: catechin, epicatechin, epicatechin gallate,epigallocatechin, epigallocatechin-3-gallate, and gallocatechin. Catechin content in tea differs by teatype or style. Catechins in green tea are relatively stable since they do not go through oxidation duringprocessing, and are what gives green tea its characteristic bitterness and astringency. In black tea,the catechins are largely oxidized to theaflavins and thearubigins [6], which reduces catechin contentby around 85% compared to green tea [7], leaving the tea darker and less bitter.
1.3. Tea and Water
After tea leaves are harvested and processed, the final product is ready to consume. However,unlike many other beverages, the final processing step is left to the consumer. A high-quality teathat has gone through many labor-intensive steps can be ruined in an instant by improper brewing.Factors that alter the taste of the brewed cup are brewing temperature, time, vessel, the water-to-leafratio, and the water composition [8,9]. This study focuses on the water used to brew tea, specificallyhow water quality influences the sensory and chemical qualities of black and green tea. Taste is a keyfactor in consumer acceptance of water [10], however water is often not a top priory when making tea,despite its critical role as the vehicle for the infusion. References to the importance of water content inbrewing tea can be found as early as 758AD, in The Classic of Tea by Lu Yu [11]. Lu Yu was an orphanduring the Tang Dynasty, raised by an abbot in the Dragon Cloud Monastery. He authored an efficient7000-character book detailing how to harvest, process, and brew tea, including what types of waterare suitable for tea, as well as the proper tools and utensils. Lu Yu felt that tea made from mountainsstreams was ideal, river water was sufficient, and well water was inferior [3]. In a more recent bookfrom Kuroda & Hara [12], tap water is recommended as the most suitable water for making tea,although specific recommendations are that water should be clear of odors and deficient in magnesiumand calcium.
Previous work suggests that tap water can influence the amount of tea flavanols extracted in greentea compared to brewing green tea with purified water [13]. Tap water has a differing (inconsistentbetween regions, and over time) mineral balance. “Hard” water is high in minerals such as calciumand magnesium. Tea infusions are particularly affected by calcium, with previous studies showing thatlevels of theaflavins and caffeine extracted decrease with high levels of calcium [14]. Magnesium andcalcium can also promote two undesirable outcomes of tea brewing: tea cream and scum formation.Tea cream is the precipitate matter that forms as the tea cools and is caused by the reaction betweencaffeine and tea flavanols, while tea scum is a surface film that forms on the tea infusion surface,which is composed of calcium, hydrogen carbonates, and other organic material. This film occurs dueto calcium carbonate triggering oxidation of organic compounds [9]. It has also been demonstratedthat catechin extraction can be increased in white tea by brewing with purified water [15].
1.4. Tea Flavor
Between 25% to 35% of the fresh tea leaf is composed of phenolic compounds with 80% of thesebeing flavanols [16]. Both phenolic compounds and alkaloids such as caffeine contribute to the bittertaste in tea, though the catechins are thought to be the main contributors to bitterness [17]. Glucose,fructose, sucrose, and arabinose in tea account for its sweet taste. Free amino acids make up about 1%to 3% of the dry leaf, and, in green tea, may yield an umami characteristic [16]. Astringency, albeit

Nutrients 2019, 11, 80 3 of 13
not a taste, is a common oral sensation in tea, thought to arise from its catechin content [18]. Despitetea being consumed for several thousand years, there are few consumer sensory studies of tea flavor,with researchers more often favoring evaluation by trained or expert panels. The goal of this projectwas to test if the water source used to brew tea (tap, bottled, or deionized) influenced flavor or likingfrom the everyday tea drinker, using both black and green tea. Tea samples were analyzed witha human consumer sensory panel as well as with a number of instrumental methods.
2. Materials and Methods
2.1. Mineral Analysis of Water Samples
Ithaca city tap water, Poland SpringTM bottled water (Nestle Waters, Paris, France), and deionizedwater used for the study were tested by the Community Science Institute, Inc (Ithaca, NY, USA),assaying calcium, iron, magnesium, sodium, and copper content. Methods followed thoserecommended by the Environmental Protection Agency (EPA). Briefly, Iron, Magnesium, and Sodiumwere measured spectrochemically (EPA protocol 200.2, Rv. 2.8) and with inductively coupledplasma-atomic emission spectrometry (EPA 200.7, Rv 4.4), while copper was measured usingInductively Coupled Plasma Mass Spectrometry (EPA 200.8/EPA200.8, Rv 5.4). Calcium and residualchlorine were measured colorimetrically, using an EDTA titration for calcium (SM 3500-Ca B),and a Lamotte test kit for chlorine (LaMotte DPD-1R, LaMotte Co., Maryland, USA).
2.2. Preparation of Tea Infusions
Two high-quality loose leaf teas known as Zhejiang green and Mao Feng black teas were purchasedfrom In Pursuit of Tea (New York, NY, USA). Both teas are from the Zhejiang Province in China, whichis a highly regarded tea region, with both produced on the same farm. Green teas were brewed intap (GT) water, bottled (GB) water, and deionized (GD) water, with black similarly denoted as blacktea in tap (BT), bottled (BB), and deionized (BD) water. For the green tea samples, 2.5 g of tea wasweighed out into pre-warmed Gaiwan tea brewing vessels (Figure S1), with 125 mL of water at 80 ◦Cadded to the vessel. The green tea infusion was brewed for three minutes and then strained througha fine mesh strainer. Black tea samples were brewed at 100 ◦C for 5 min (more typical for black teapreparation), and strained. Samples were then either cooled to room temperature for instrumentalanalysis or served fresh in pre-heated cups for sensory analysis (see 2.6 below).
2.3. Colorimetry
Analysis of tea color was performed with a Hunter Lab UltraScan VIS colorimeter(Reston, VA, USA). L (light vs dark), a (red vs green), and b (yellow vs blue) values were recorded foreach sample with each of the samples measured in triplicate.
2.4. Turbidity
The turbidity of each sample was measured in triplicate with use of a HACH 2100P portableTurbidity meter (Loveland, CO, USA), with measurements recorded in Nephelometric Turbidity Units(NTU). The samples were held at a 90◦ angle to the incident beam using single detection. Turbiditystandards used were 0.1 NTU, 20 NTU, and 100 NTU.
2.5. Analysis of EGCG
Epigallocatechin Gallate (EGCG) in the tea infusions was measured using high performance liquidchromatography (HPLC), following the methods of Wang and Helliwell [13]. Samples were run usingan Agilent 1100 HPLC system (Santa Clara, CA, USA) with a DAD detector. Separations were carriedout using a Waters Cortecs (Milford, MA, USA) C18 (4.6 mm × 100 mm) column using an isocraticsolvent system consisting of 90% 0.01% phosphoric acid in Millipore water (v/v) and 10% methanolwith a flow rate of 0.6 mL/min. The column was held at a constant temperature of 30 ◦C. The DAD

Nutrients 2019, 11, 80 4 of 13
detector was set to 210 nm. Sample injection volume was 10 µL. The total run time was 20 min.All samples were filtered just before being loaded onto the HPLC using a 0.22 µm PolyvinylideneFluoride (PVDF) filter from Celltreat (Pepperell, MA, USA). Quantification was performed by theuse of an external standard curve using purified EGCG purchased from Sigma Aldrich (St Louis,MO, USA). Identification of EGCG in tea samples was performed using retention time of the purestandards (10.26 min).
2.6. Sensory Evaluation
All human study procedures were approved by the Cornell University Institutional Review Boardfor Human Participants, with all methods performed in accordance with relevant guidelines andregulations. A total of 103 panelists were recruited from the local community, pre-screened for theirtea drinking behavior, and all gave informed consent. All the participants in the study drank teathree to five times a week or more, and were both green and black tea drinkers. The panelist eitherhabitually consumed tea with no milk or sugar added to it or stated no dislike of tea in this manner.Participants knew that the study involved tea but were unaware of the true objective of the research.The session took approximately 45 min, with panelists compensated for their time. The panelistsanswered questions about samples in individual booths, using Red Jade sensory evaluation software(Curion, Deerfield, IL, USA). The samples were delivered monadically, in a counterbalanced full-blockdesign, but panelists either received 3 green tea samples or 3 black tea samples first. Each tea samplewas evaluated for overall liking, appearance liking, and flavor liking with 9-point scales, and then usedthe generalized Labeled Magnitude Scale (gLMS) to test sweetness, bitterness, sourness, astringency,vegetal quality (for green tea only), and earthiness (for black tea only). All panelists were brieflytrained on how to use the gLMS before beginning the tasting [19]. The color of the tea was alsoevaluated by panelists with a color matching sheet (Figure S2) from which they chose the closest matchfor each tea sample. Teas were freshly brewed every 30 min. A total of 10 g of tea was brewed with500 mL of water, at 80 ◦C for green tea, and 100 ◦C for black tea. All infusions were kept warm inpre-heated, insulated carafes until the panelist was ready for the sample. Samples were served inpre-heated (80 ◦C) white ceramic Gung Fu cha teacups (see Figure 1 below) labeled with random3-digit codes. After each sample, panelists were instructed to cleanse their palette with water andnon-salted crackers to avoid fatigue as well as deter any lingering bitterness or astringency. At the endof the questionnaire, panelists were asked a series of demographic questions and for information ontheir tea drinking habits.
2.7. Statistical Analysis
Data were analyzed with repeated measure analyses of variance (ANOVA) and post-hoc Tukey’stests using Graphpad Prism 5.0 (Graphpad Software, La Jolla, CA, USA). Separate ANOVAs were usedfor green and black tea samples since such large differences in taste and chemical properties have beenshown previously. Statistical significance was inferred at p < 0.05. Multivariate analysis was performedusing XLSTAT (Addinsoft, Paris, France) whereby two separate Principal Components Analyseswere run on sensory and instrumental data as well as these two datasets combined in a MultipleFactor Analysis.
Nutrients 2019, 11, 80 5 of 13
Nutrients 2018, 10, x FOR PEER REVIEW 5 of 13
Iron 0.050 0.050 0.050 Magnesium 1.370 9.460 0.100
Sodium 10.600 20.900 0.100 Copper 0.002 0.176 0.002
Residual Chlorine 0.200 0.200 0.200
3.2. Turbidity and Color
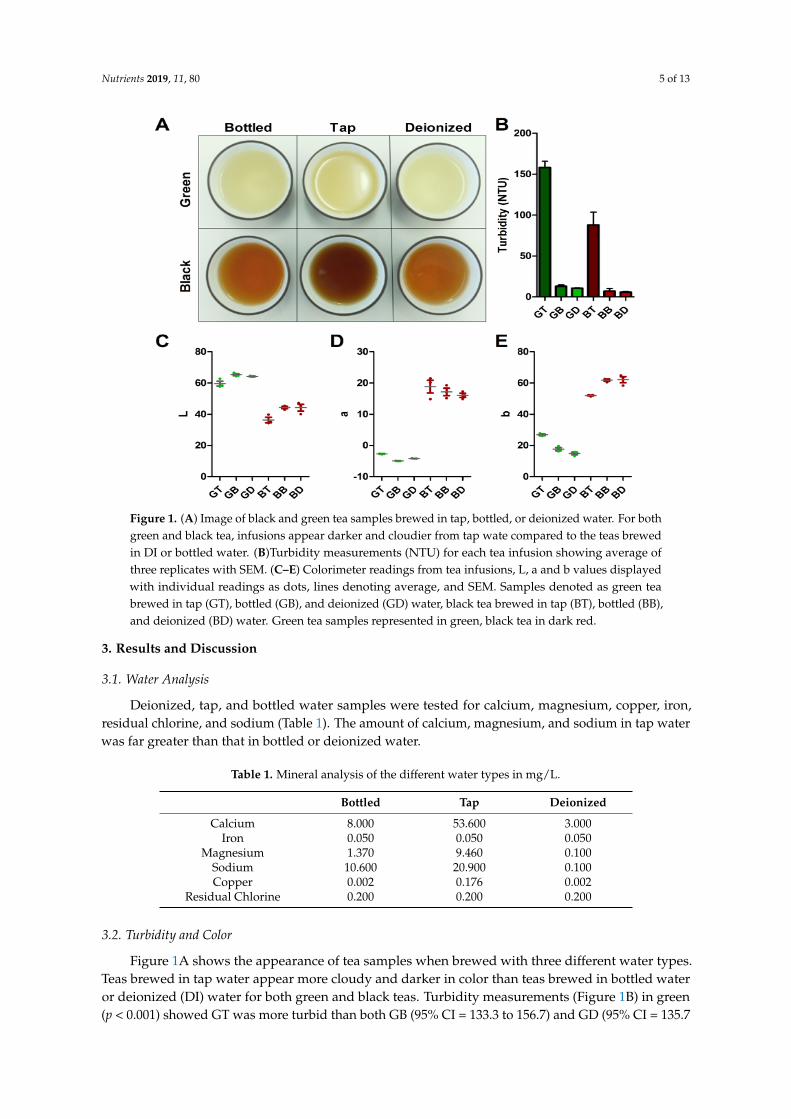
Figure 1A shows the appearance of tea samples when brewed with three different water types. Teas brewed in tap water appear more cloudy and darker in color than teas brewed in bottled water or deionized (DI) water for both green and black teas. Turbidity measurements (Figure 1B) in green (p < 0.001) showed GT was more turbid than both GB (95% CI = 133.3 to 156.7) and GD (95% CI = 135.7 to 159.1), with no difference between GB and GD. In black tea, the turbidity of BT was also higher (p < 0.001) than both BB (95% CI = 57.66 to 103.9) and BD (95% CI = 58.81 to 105.1), with no difference between BB and BD. Adding high concentrations of calcium or magnesium in water can cause cloudiness and tea scum in tea infusion as well as possibly influencing tea’s sensory properties [9,18] since both calcium and magnesium were higher in tap water used in this project. This was likely the cause of the observed turbidity increase.
Figure 1. (A) Image of black and green tea samples brewed in tap, bottled, or deionized water. For both green and black tea, infusions appear darker and cloudier from tap wate compared to the teas brewed in DI or bottled water. (B)Turbidity measurements (NTU) for each tea infusion showing average of three replicates with SEM. (C–E) Colorimeter readings from tea infusions, L, a and b values displayed with individual readings as dots, lines denoting average, and SEM. Samples denoted as green tea brewed in tap (GT), bottled (GB), and deionized (GD) water, black tea brewed in tap (BT), bottled (BB), and deionized (BD) water. Green tea samples represented in green, black tea in dark red.
Both green (p = 0.016) and black (p = 0.023) tea infusions significantly differ in lightness. Green tea brewed in tap water exhibited lower L values compared to the same tea brewed in bottled (95% CI = −9.992 to −1.288) or DI (95% CI = −8.952 to −0.2476) water, with BT similarly lower than BB (95%
Figure 1. (A) Image of black and green tea samples brewed in tap, bottled, or deionized water. For bothgreen and black tea, infusions appear darker and cloudier from tap wate compared to the teas brewedin DI or bottled water. (B)Turbidity measurements (NTU) for each tea infusion showing average ofthree replicates with SEM. (C–E) Colorimeter readings from tea infusions, L, a and b values displayedwith individual readings as dots, lines denoting average, and SEM. Samples denoted as green teabrewed in tap (GT), bottled (GB), and deionized (GD) water, black tea brewed in tap (BT), bottled (BB),and deionized (BD) water. Green tea samples represented in green, black tea in dark red.
3. Results and Discussion
3.1. Water Analysis
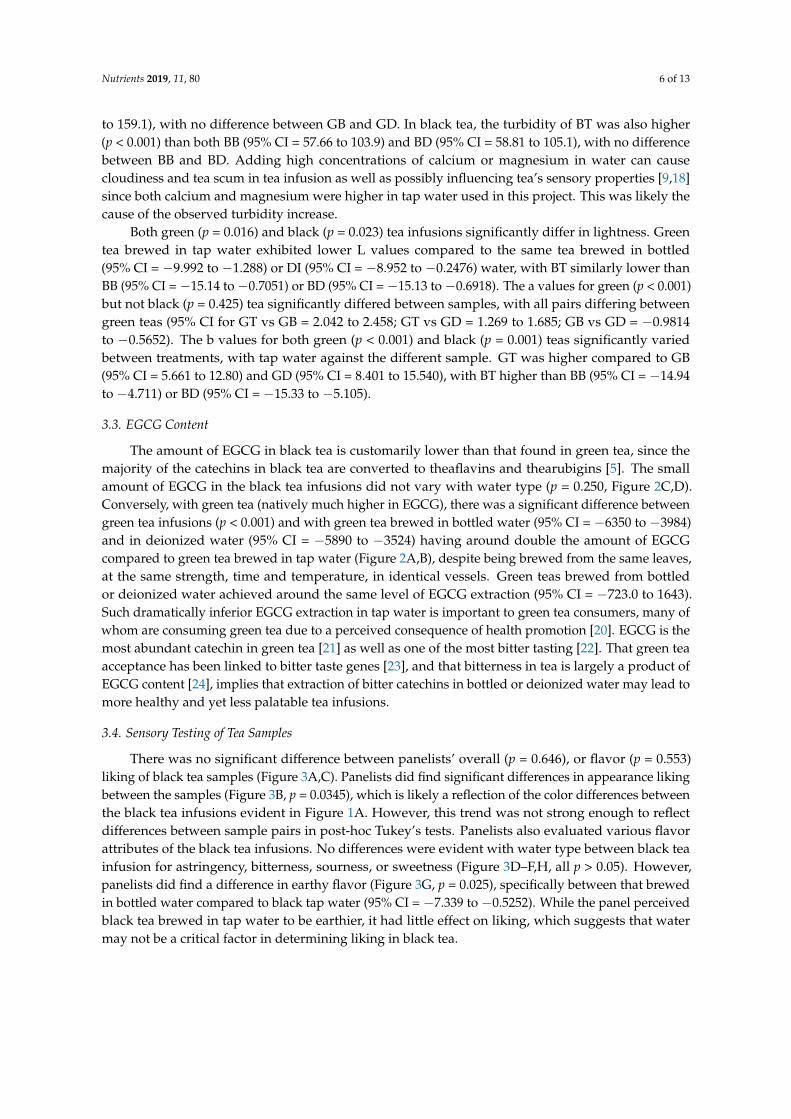
Deionized, tap, and bottled water samples were tested for calcium, magnesium, copper, iron,residual chlorine, and sodium (Table 1). The amount of calcium, magnesium, and sodium in tap waterwas far greater than that in bottled or deionized water.
Table 1. Mineral analysis of the different water types in mg/L.
Bottled Tap Deionized
Calcium 8.000 53.600 3.000Iron 0.050 0.050 0.050
Magnesium 1.370 9.460 0.100Sodium 10.600 20.900 0.100Copper 0.002 0.176 0.002
Residual Chlorine 0.200 0.200 0.200
3.2. Turbidity and Color
Figure 1A shows the appearance of tea samples when brewed with three different water types.Teas brewed in tap water appear more cloudy and darker in color than teas brewed in bottled wateror deionized (DI) water for both green and black teas. Turbidity measurements (Figure 1B) in green(p < 0.001) showed GT was more turbid than both GB (95% CI = 133.3 to 156.7) and GD (95% CI = 135.7
Nutrients 2019, 11, 80 6 of 13
to 159.1), with no difference between GB and GD. In black tea, the turbidity of BT was also higher(p < 0.001) than both BB (95% CI = 57.66 to 103.9) and BD (95% CI = 58.81 to 105.1), with no differencebetween BB and BD. Adding high concentrations of calcium or magnesium in water can causecloudiness and tea scum in tea infusion as well as possibly influencing tea’s sensory properties [9,18]since both calcium and magnesium were higher in tap water used in this project. This was likely thecause of the observed turbidity increase.
Both green (p = 0.016) and black (p = 0.023) tea infusions significantly differ in lightness. Greentea brewed in tap water exhibited lower L values compared to the same tea brewed in bottled(95% CI = −9.992 to −1.288) or DI (95% CI = −8.952 to −0.2476) water, with BT similarly lower thanBB (95% CI = −15.14 to −0.7051) or BD (95% CI = −15.13 to −0.6918). The a values for green (p < 0.001)but not black (p = 0.425) tea significantly differed between samples, with all pairs differing betweengreen teas (95% CI for GT vs GB = 2.042 to 2.458; GT vs GD = 1.269 to 1.685; GB vs GD = −0.9814to −0.5652). The b values for both green (p < 0.001) and black (p = 0.001) teas significantly variedbetween treatments, with tap water against the different sample. GT was higher compared to GB(95% CI = 5.661 to 12.80) and GD (95% CI = 8.401 to 15.540), with BT higher than BB (95% CI = −14.94to −4.711) or BD (95% CI = −15.33 to −5.105).
3.3. EGCG Content
The amount of EGCG in black tea is customarily lower than that found in green tea, since themajority of the catechins in black tea are converted to theaflavins and thearubigins [5]. The smallamount of EGCG in the black tea infusions did not vary with water type (p = 0.250, Figure 2C,D).Conversely, with green tea (natively much higher in EGCG), there was a significant difference betweengreen tea infusions (p < 0.001) and with green tea brewed in bottled water (95% CI = −6350 to −3984)and in deionized water (95% CI = −5890 to −3524) having around double the amount of EGCGcompared to green tea brewed in tap water (Figure 2A,B), despite being brewed from the same leaves,at the same strength, time and temperature, in identical vessels. Green teas brewed from bottledor deionized water achieved around the same level of EGCG extraction (95% CI = −723.0 to 1643).Such dramatically inferior EGCG extraction in tap water is important to green tea consumers, many ofwhom are consuming green tea due to a perceived consequence of health promotion [20]. EGCG is themost abundant catechin in green tea [21] as well as one of the most bitter tasting [22]. That green teaacceptance has been linked to bitter taste genes [23], and that bitterness in tea is largely a product ofEGCG content [24], implies that extraction of bitter catechins in bottled or deionized water may lead tomore healthy and yet less palatable tea infusions.
3.4. Sensory Testing of Tea Samples
There was no significant difference between panelists’ overall (p = 0.646), or flavor (p = 0.553)liking of black tea samples (Figure 3A,C). Panelists did find significant differences in appearance likingbetween the samples (Figure 3B, p = 0.0345), which is likely a reflection of the color differences betweenthe black tea infusions evident in Figure 1A. However, this trend was not strong enough to reflectdifferences between sample pairs in post-hoc Tukey’s tests. Panelists also evaluated various flavorattributes of the black tea infusions. No differences were evident with water type between black teainfusion for astringency, bitterness, sourness, or sweetness (Figure 3D–F,H, all p > 0.05). However,panelists did find a difference in earthy flavor (Figure 3G, p = 0.025), specifically between that brewedin bottled water compared to black tap water (95% CI = −7.339 to −0.5252). While the panel perceivedblack tea brewed in tap water to be earthier, it had little effect on liking, which suggests that watermay not be a critical factor in determining liking in black tea.

Nutrients 2019, 11, 80 7 of 13
Nutrients 2018, 10, x FOR PEER REVIEW 6 of 13
CI = −15.14 to −0.7051) or BD (95% CI = −15.13 to −0.6918). The a values for green (p < 0.001) but not black (p = 0.425) tea significantly differed between samples, with all pairs differing between green teas (95% CI for GT vs GB = 2.042 to 2.458; GT vs GD = 1.269 to 1.685; GB vs GD = −0.9814 to −0.5652). The b values for both green (p < 0.001) and black (p = 0.001) teas significantly varied between treatments, with tap water against the different sample. GT was higher compared to GB (95% CI = 5.661 to 12.80) and GD (95% CI = 8.401 to 15.540), with BT higher than BB (95% CI = −14.94 to −4.711) or BD (95% CI = −15.33 to −5.105).
3.3. EGCG Content
The amount of EGCG in black tea is customarily lower than that found in green tea, since the majority of the catechins in black tea are converted to theaflavins and thearubigins [5]. The small amount of EGCG in the black tea infusions did not vary with water type (p = 0.250, Figure 2C,D). Conversely, with green tea (natively much higher in EGCG), there was a significant difference between green tea infusions (p < 0.001) and with green tea brewed in bottled water (95% CI = −6350 to −3984) and in deionized water (95% CI = −5890 to −3524) having around double the amount of EGCG compared to green tea brewed in tap water (Figure 2A,B), despite being brewed from the same leaves, at the same strength, time and temperature, in identical vessels. Green teas brewed from bottled or deionized water achieved around the same level of EGCG extraction (95% CI = −723.0 to 1643). Such dramatically inferior EGCG extraction in tap water is important to green tea consumers, many of whom are consuming green tea due to a perceived consequence of health promotion [20]. EGCG is the most abundant catechin in green tea [21] as well as one of the most bitter tasting [22]. That green tea acceptance has been linked to bitter taste genes [23], and that bitterness in tea is largely a product of EGCG content [24], implies that extraction of bitter catechins in bottled or deionized water may lead to more healthy and yet less palatable tea infusions.
Figure 2. (A) Chromatogram illustrative of HPLC spectrum from green tea. EGCG peak at arrow. Y axis in milli-Absorbance Units. (B) Total EGCG content for green tea in ppm, brewed in tap (GT), bottled (GB), and deionized (GD water. Display shows mean of three readings plus SEM. (C) Chromatogram illustrative of HPLC spectrum from black tea. EGCG peak at arrow. (D) Total EGCG content for black tea in ppm. Samples denoted as black tea brewed in tap (BT), bottled (BB), and deionized (BD) water.
3.4. Sensory Testing of Tea Samples
There was no significant difference between panelists’ overall (p = 0.646), or flavor (p = 0.553) liking of black tea samples (Figure 3A,C). Panelists did find significant differences in appearance liking between the samples (Figure 3B, p = 0.0345), which is likely a reflection of the color differences between the black tea infusions evident in Figure 1A. However, this trend was not strong enough to
Figure 2. (A) Chromatogram illustrative of HPLC spectrum from green tea. EGCG peak at arrow.Y axis in milli-Absorbance Units. (B) Total EGCG content for green tea in ppm, brewed in tap(GT), bottled (GB), and deionized (GD water. Display shows mean of three readings plus SEM.(C) Chromatogram illustrative of HPLC spectrum from black tea. EGCG peak at arrow. (D) TotalEGCG content for black tea in ppm. Samples denoted as black tea brewed in tap (BT), bottled (BB),and deionized (BD) water.
Nutrients 2018, 10, x FOR PEER REVIEW 7 of 13
reflect differences between sample pairs in post-hoc Tukey’s tests. Panelists also evaluated various flavor attributes of the black tea infusions. No differences were evident with water type between black tea infusion for astringency, bitterness, sourness, or sweetness (Figures 3D–F,H, all p > 0.05). However, panelists did find a difference in earthy flavor (Figure 3G, p = 0.025), specifically between that brewed in bottled water compared to black tap water (95% CI = −7.339 to −0.5252). While the panel perceived black tea brewed in tap water to be earthier, it had little effect on liking, which suggests that water may not be a critical factor in determining liking in black tea.
Figure 3. Consumer perception of black tea brewed in tap (BT), bottled (BB), and deionized (BD) water. (A) Overall liking of samples, from dislike extremely (1) to like extremely (9). (B) Appearance liking of samples, from dislike extremely (1) to like extremely (9). (C) Flavor liking of samples, from dislike extremely (1) to like extremely (9). (D) Perceived sweetness of samples, rated on gLMS, scale descriptors no sensation (0.0), barely detectable (1.4), weak (6.0), moderate (17.0), strong (34.7), very strong (52.5), and strongest imaginable sensation of any kind (100.0). (E) Bitterness, scale as in D. (F) Sourness, scale as in D. (G) Earthy flavor, scale as in D. (H) Astringency, scale as in D. Bars display mean rating of panel (n = 103) plus SEM. * indicates p < 0.05.
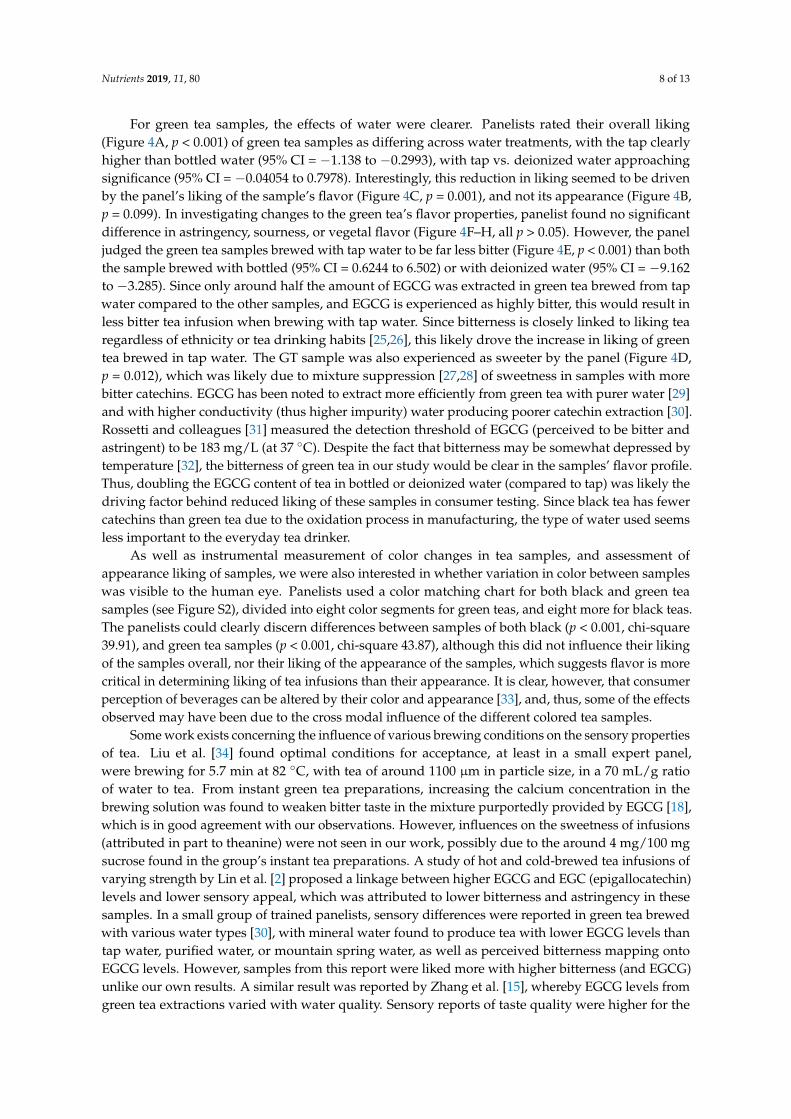
For green tea samples, the effects of water were clearer. Panelists rated their overall liking (Figure 4A, p < 0.001) of green tea samples as differing across water treatments, with the tap clearly higher than bottled water (95% CI = −1.138 to −0.2993), with tap vs. deionized water approaching significance (95% CI = −0.04054 to 0.7978). Interestingly, this reduction in liking seemed to be driven by the panel’s liking of the sample’s flavor (Figure 4C, p = 0.001), and not its appearance (Figure 4B, p = 0.099). In investigating changes to the green tea’s flavor properties, panelist found no significant difference in astringency, sourness, or vegetal flavor (Figure 4F–H, all p > 0.05). However, the panel judged the green tea samples brewed with tap water to be far less bitter (Figure 4E, p < 0.001) than both the sample brewed with bottled (95% CI = 0.6244 to 6.502) or with deionized water (95% CI =
Figure 3. Consumer perception of black tea brewed in tap (BT), bottled (BB), and deionized (BD) water.(A) Overall liking of samples, from dislike extremely (1) to like extremely (9). (B) Appearance likingof samples, from dislike extremely (1) to like extremely (9). (C) Flavor liking of samples, from dislikeextremely (1) to like extremely (9). (D) Perceived sweetness of samples, rated on gLMS, scale descriptorsno sensation (0.0), barely detectable (1.4), weak (6.0), moderate (17.0), strong (34.7), very strong (52.5),and strongest imaginable sensation of any kind (100.0). (E) Bitterness, scale as in D. (F) Sourness,scale as in D. (G) Earthy flavor, scale as in D. (H) Astringency, scale as in D. Bars display mean ratingof panel (n = 103) plus SEM. * indicates p < 0.05.
Nutrients 2019, 11, 80 8 of 13
For green tea samples, the effects of water were clearer. Panelists rated their overall liking(Figure 4A, p < 0.001) of green tea samples as differing across water treatments, with the tap clearlyhigher than bottled water (95% CI = −1.138 to −0.2993), with tap vs. deionized water approachingsignificance (95% CI = −0.04054 to 0.7978). Interestingly, this reduction in liking seemed to be drivenby the panel’s liking of the sample’s flavor (Figure 4C, p = 0.001), and not its appearance (Figure 4B,p = 0.099). In investigating changes to the green tea’s flavor properties, panelist found no significantdifference in astringency, sourness, or vegetal flavor (Figure 4F–H, all p > 0.05). However, the paneljudged the green tea samples brewed with tap water to be far less bitter (Figure 4E, p < 0.001) than boththe sample brewed with bottled (95% CI = 0.6244 to 6.502) or with deionized water (95% CI = −9.162to −3.285). Since only around half the amount of EGCG was extracted in green tea brewed from tapwater compared to the other samples, and EGCG is experienced as highly bitter, this would result inless bitter tea infusion when brewing with tap water. Since bitterness is closely linked to liking tearegardless of ethnicity or tea drinking habits [25,26], this likely drove the increase in liking of greentea brewed in tap water. The GT sample was also experienced as sweeter by the panel (Figure 4D,p = 0.012), which was likely due to mixture suppression [27,28] of sweetness in samples with morebitter catechins. EGCG has been noted to extract more efficiently from green tea with purer water [29]and with higher conductivity (thus higher impurity) water producing poorer catechin extraction [30].Rossetti and colleagues [31] measured the detection threshold of EGCG (perceived to be bitter andastringent) to be 183 mg/L (at 37 ◦C). Despite the fact that bitterness may be somewhat depressed bytemperature [32], the bitterness of green tea in our study would be clear in the samples’ flavor profile.Thus, doubling the EGCG content of tea in bottled or deionized water (compared to tap) was likely thedriving factor behind reduced liking of these samples in consumer testing. Since black tea has fewercatechins than green tea due to the oxidation process in manufacturing, the type of water used seemsless important to the everyday tea drinker.
As well as instrumental measurement of color changes in tea samples, and assessment ofappearance liking of samples, we were also interested in whether variation in color between sampleswas visible to the human eye. Panelists used a color matching chart for both black and green teasamples (see Figure S2), divided into eight color segments for green teas, and eight more for black teas.The panelists could clearly discern differences between samples of both black (p < 0.001, chi-square39.91), and green tea samples (p < 0.001, chi-square 43.87), although this did not influence their likingof the samples overall, nor their liking of the appearance of the samples, which suggests flavor is morecritical in determining liking of tea infusions than their appearance. It is clear, however, that consumerperception of beverages can be altered by their color and appearance [33], and, thus, some of the effectsobserved may have been due to the cross modal influence of the different colored tea samples.
Some work exists concerning the influence of various brewing conditions on the sensory propertiesof tea. Liu et al. [34] found optimal conditions for acceptance, at least in a small expert panel,were brewing for 5.7 min at 82 ◦C, with tea of around 1100 µm in particle size, in a 70 mL/g ratioof water to tea. From instant green tea preparations, increasing the calcium concentration in thebrewing solution was found to weaken bitter taste in the mixture purportedly provided by EGCG [18],which is in good agreement with our observations. However, influences on the sweetness of infusions(attributed in part to theanine) were not seen in our work, possibly due to the around 4 mg/100 mgsucrose found in the group’s instant tea preparations. A study of hot and cold-brewed tea infusions ofvarying strength by Lin et al. [2] proposed a linkage between higher EGCG and EGC (epigallocatechin)levels and lower sensory appeal, which was attributed to lower bitterness and astringency in thesesamples. In a small group of trained panelists, sensory differences were reported in green tea brewedwith various water types [30], with mineral water found to produce tea with lower EGCG levels thantap water, purified water, or mountain spring water, as well as perceived bitterness mapping ontoEGCG levels. However, samples from this report were liked more with higher bitterness (and EGCG)unlike our own results. A similar result was reported by Zhang et al. [15], whereby EGCG levels fromgreen tea extractions varied with water quality. Sensory reports of taste quality were higher for the
Nutrients 2019, 11, 80 9 of 13
high EGCG samples, though no report was made of panel size or makeup. Such differences are likelyattributed to the difference in palate of a small group of experts from China versus a large panel oftea consumers in the US. Alternatively, those regularly consuming diets high in salty [35], sweet [36],or umami [37] stimuli have shown some reduced ability to perceive these stimuli possibly due toreceptor regulation in taste [38]. Thus, it is possible that regular consumers of very bitter tea experiencehow they taste in a fundamentally different manner.
Nutrients 2018, 10, x FOR PEER REVIEW 9 of 13
cited its health benefits, with 67% for taste or flavor, and again a small number citing other reasons. This suggests the ability to almost double the EGCG content of green tea would be of great interest to many green tea consumers.
Figure 4. Consumer perception of green tea brewed in tap (GT), bottled (GB), and deionized (GD) water. (A) Overall liking of samples, from dislike extremely (1) to like extremely (9). (B) Appearance liking of samples, from dislike extremely (1) to like extremely (9). (C) Flavor liking of samples, from dislike extremely (1) to like extremely (9). (D) Perceived sweetness of samples, rated on gLMS, scale descriptors no sensation (0.0), barely detectable (1.4), weak (6.0), moderate (17.0), strong (34.7), very strong (52.5), and strongest imaginable sensation of any kind (100.0). (E) Bitterness, scale as in D. (F) Sourness, scale as in D. (G) Earthy flavor, scale as in D. (H) Astringency, scale as in D. Bars display mean rating of panel (n = 103) plus SEM. * indicates p < 0.05. ** indicates p < 0.01. *** indicates p < 0.001.
3.5. Multivariate Analysis
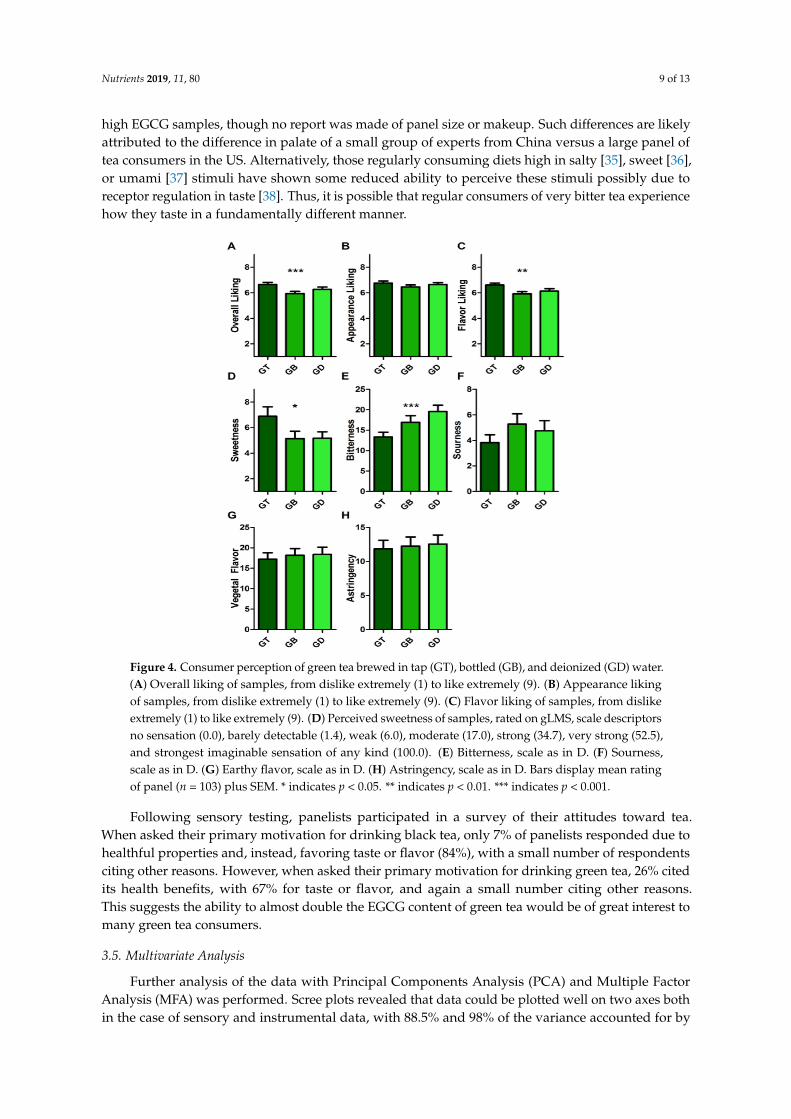
Further analysis of the data with Principal Components Analysis (PCA) and Multiple Factor Analysis (MFA) was performed. Scree plots revealed that data could be plotted well on two axes both in the case of sensory and instrumental data, with 88.5% and 98% of the variance accounted for by the first two factors in the analysis, respectively. The sample of green tea brewed with tap water was located close to both dimensions of overall and flavor liking, which, in turn, were negatively correlated with bitterness (Figure 5A). In plots of instrumental results, samples pairs GD and GB as well as BD and BB plotted almost exactly on top of one another (Figure 5B). In the case of both black and green tea, the tap-brewed sample was the clear outlier. Samples GD and GB plotted closely to the axes represent phenolics, EGCG, and colorimetric L-value. MFA plots combining both sensory and instrumental data showed similar patterns (Figure 5C), with sample GT lying in the directions of overall and flavor liking, and anti-parallel to that of bitterness.
Figure 4. Consumer perception of green tea brewed in tap (GT), bottled (GB), and deionized (GD) water.(A) Overall liking of samples, from dislike extremely (1) to like extremely (9). (B) Appearance likingof samples, from dislike extremely (1) to like extremely (9). (C) Flavor liking of samples, from dislikeextremely (1) to like extremely (9). (D) Perceived sweetness of samples, rated on gLMS, scale descriptorsno sensation (0.0), barely detectable (1.4), weak (6.0), moderate (17.0), strong (34.7), very strong (52.5),and strongest imaginable sensation of any kind (100.0). (E) Bitterness, scale as in D. (F) Sourness,scale as in D. (G) Earthy flavor, scale as in D. (H) Astringency, scale as in D. Bars display mean ratingof panel (n = 103) plus SEM. * indicates p < 0.05. ** indicates p < 0.01. *** indicates p < 0.001.
Following sensory testing, panelists participated in a survey of their attitudes toward tea.When asked their primary motivation for drinking black tea, only 7% of panelists responded due tohealthful properties and, instead, favoring taste or flavor (84%), with a small number of respondentsciting other reasons. However, when asked their primary motivation for drinking green tea, 26% citedits health benefits, with 67% for taste or flavor, and again a small number citing other reasons.This suggests the ability to almost double the EGCG content of green tea would be of great interest tomany green tea consumers.
3.5. Multivariate Analysis
Further analysis of the data with Principal Components Analysis (PCA) and Multiple FactorAnalysis (MFA) was performed. Scree plots revealed that data could be plotted well on two axes bothin the case of sensory and instrumental data, with 88.5% and 98% of the variance accounted for by

Nutrients 2019, 11, 80 10 of 13
the first two factors in the analysis, respectively. The sample of green tea brewed with tap water waslocated close to both dimensions of overall and flavor liking, which, in turn, were negatively correlatedwith bitterness (Figure 5A). In plots of instrumental results, samples pairs GD and GB as well as BDand BB plotted almost exactly on top of one another (Figure 5B). In the case of both black and green tea,the tap-brewed sample was the clear outlier. Samples GD and GB plotted closely to the axes representphenolics, EGCG, and colorimetric L-value. MFA plots combining both sensory and instrumentaldata showed similar patterns (Figure 5C), with sample GT lying in the directions of overall and flavorliking, and anti-parallel to that of bitterness.
Nutrients 2018, 10, x FOR PEER REVIEW 10 of 12
(A)
(B)
(C)
Figure 5. Multivariate analysis of tea samples. (A) Principal components analysis of sensory data. Samples shown in black, original axes in red, variance from new factors in parentheses. (B) Principal components analysis of instrumental data. Samples shown in black, original axes in blue, variance from new factors in parentheses. (C) Multiple factor analysis of sensory and instrumental data. Samples shown in black, sensory axes in red, instrumental axes in blue, variance from new factors in parentheses. Samples denoted as green tea brewed in tap (GT), bottled (GB), and deionized (GD) water, black tea brewed in tap (BT), bottled (BB), and deionized (BD) water.
4. Conclusions
Tea is the most consumed beverage besides water in the world. This project sought to get a better understanding of whether the type of water used to brew tea is of importance to the everyday tea
Formatted: Space Before: 0 pt
Formatted Table
Formatted: Space Before: 0 pt
Formatted: Space Before: 0 pt
Formatted: Space After: 0 pt
Figure 5. Multivariate analysis of tea samples. (A) Principal components analysis of sensory data.Samples shown in black, original axes in red, variance from new factors in parentheses. (B) Principalcomponents analysis of instrumental data. Samples shown in black, original axes in blue, variance fromnew factors in parentheses. (C) Multiple factor analysis of sensory and instrumental data. Samplesshown in black, sensory axes in red, instrumental axes in blue, variance from new factors in parentheses.Samples denoted as green tea brewed in tap (GT), bottled (GB), and deionized (GD) water, black teabrewed in tap (BT), bottled (BB), and deionized (BD) water.

Nutrients 2019, 11, 80 11 of 13
4. Conclusions
Tea is the most consumed beverage besides water in the world. This project sought to get a betterunderstanding of whether the type of water used to brew tea is of importance to the everyday teadrinker. Through the instrumental analysis of green and black tea brewed in tap, bottled, and deionizedwater, we demonstrated a difference in color, turbidity, and the amount of EGCG extracted from tealeaves depending on the water type. The high mineral content of the tap water used in this study led toinferior extraction of catechins in green tea, and thus, produced an infusion that was less bitter, and alsoperceived as sweeter than the same tea brewed in bottled or deionized water, with an accompanyinghigher degree of liking for green tea when brewed in this manner. For tea drinkers consuming greentea for either flavor or its health benefits, our results highlight that the type of water used to brew teais clearly important, and suggests that those seeking greater health benefits should use a more purifiedwater source to brew green tea, while those more concerned with flavor may prefer to use water fromthe tap.
Supplementary Materials: The following are available online at http://www.mdpi.com/2072-6643/11/1/80/s1, Figure S1: Traditional Gaiwan brewing vessel, Figure S2: 8-option color matching diagram provided toconsumer panel.
Author Contributions: Conceptualization, M.F. and R.D.; formal analysis, M.F., P.L., A.A., and R.D.; investigation,M.F. and P.L.; writing—original draft preparation, M.F. and R.D.; writing—review and editing, M.F., P.L., A.A.,and R.D.; project administration, R.D.
Funding: This research received no external funding
Acknowledgments: Thanks to Alina Stelick and members of the Dando lab for support in consumer testing,and In Pursuit of Tea for initial consultation.
Conflicts of Interest: The authors declare no competing interests.
References
1. Dufresne, C.J.; Farnworth, E.R. A review of latest research findings on the health promotion properties of tea.J. Nutr. Biochem. 2001, 12, 404–421. [CrossRef]
2. Lin, S.-D.; Yang, J.-H.; Hsieh, Y.-J.; Liu, E.-H.; Mau, J.-L. Effect of different brewing methods on quality ofgreen tea. J. Food Process. Preserv. 2013, 38, 1234–1243. [CrossRef]
3. Mair, V.H.; Hoh, E. The True History of Tea; Thames & Hudson: New York, NY, USA, 2009.4. Ahmed, S.; Stepp, J.R. Pu-erh Tea: Botany, Production, and Chemistry. In Tea in Health and Disease Prevention;
Elsevier Science and Technology: Amsterdam, The Netherlands, 2013; pp. 59–71.5. Menet, M.C.; Sang, S.; Yang, C.S.; Ho, C.T.; Rosen, R.T. Analysis of theaflavins and thearubigins from black
tea extract by MALDI-TOF mass spectrometry. J. Agric. Food Chem. 2004, 52, 2455–2461. [CrossRef] [PubMed]6. Hodgson, J.M.; Croft, K.D. Tea flavonoids and cardiovascular health. Mol. Aspects Med. 2010, 31, 495–502.
[CrossRef] [PubMed]7. Preedy, V. Tea in Health and Disease Prevention; Elsevier: London, UK, 2013; pp. 73–77.8. Khokhar, S.; Magnusdottir, S.G.M. Total phenol, catechin, and caffeine contents of teas commonly consumed
in the United Kingdom. J. Agric. Food Chem. 2002, 50, 565–570. [CrossRef] [PubMed]9. Mossion, A.; Potin-Gautier, M.; Delerue, S.; Le Hécho, I.; Behra, P. Effect of water composition on aluminium,
calcium and organic carbon extraction in tea infusions. Food Chem. 2008, 106, 1467–1475. [CrossRef]10. Whelton, A.; Dietrich, A.; Burlingame, G.; Schechs, M.; Duncan, S. Minerals in drinking water: Impacts on
taste and importance to consumer health. Water Sci. Technol. 2007, 55, 283–291. [CrossRef] [PubMed]11. Lu, Y.; Carpenter, F. The Classic of Tea; Ecco Press: Hopewell, NJ, USA, 1974.12. Kuroda, Y.; Hara, Y. Health Effects of Tea and Its Catechins; Springer Science and Business Media: Berlin,
Germany, 2004.13. Wang, H.; Helliwell, K. Epimerisation of catechins in green tea infusions. Food Chem. 2000, 70, 337–344.
[CrossRef]

Nutrients 2019, 11, 80 12 of 13
14. Spiro, M.; Price, W.E. Kinetics and equilibria of tea infusion—Part 6: The effects of salts and of pH on theconcentrations and partition constants of theaflavins and caffeine in Kapchorua Pekoe fannings. Food Chem.1987, 24, 51–61. [CrossRef]
15. Zhang, H.; Jiang, Y.; Lv, Y.; Pan, J.; Duan, Y.; Huang, Y.; Zhu, Y.; Zhang, S.; Geng, K. Effect of water qualityon the main components in Fuding white tea infusions. J. Food Sci. Technol. 2017, 54, 1206–1211. [CrossRef][PubMed]
16. Belitz, H.-D.; Grosch, W.; Schieberle, P. Food Chemistry, 4th ed.; Springer: Berlin, Germany, 2016.17. Chen, Z.M.; Wang, H.F.; You, X.Q.; Xu, N.I.N.G. The Chemistry of Tea Non-Volatiles. In Tea: Bioactivity and
Therapeutic Potential. Medicinal and Aromatic Plants—Industrial Profiles; Taylor and Francis: London, UK, 2002.18. Yin, J.; Zhang, Y.; Du, Q.; Chen, J.; Yuan, H.; Xu, Y. Effect of Ca2+ concentration on the tastes from the main
chemicals in green tea infusions. Food Res. Int. 2014, 62, 941–946. [CrossRef]19. Noel, C.A.; Cassano, P.A.; Dando, R. College-aged males experience attenuated sweet and salty taste with
modest weight gain. J. Nutr. 2017, 147, 1885–1891. [CrossRef] [PubMed]20. Wang, E.S.T.; Yu, J.R. Means-end chain approach for exploring the motivation of ready-to-drink tea
consumers. Asia Pac. J. Mark. Logist. 2016, 28, 384–395. [CrossRef]21. Goto, T.; Nagashima, H.; Yoshida, Y.; Kiso, M. Contents of individual tea catechins and caffeine in Japanese
green tea. Tea Res. J. 1996, 1996, 21–28. [CrossRef]22. Narukawa, M.; Kimata, H.; Noga, C.; Watanabe, T. Taste characterisation of green tea catechins. Int. J. Food
Sci. Technol. 2010, 45, 1579–1585. [CrossRef]23. Gayathri Devi, A.; Henderson, S.A.; Drewnowski, A. Sensory acceptance of Japanese green tea and soy
products is linked to genetic sensitivity to 6-n-propylthiouracil. Nutr. Cancer. 1997, 29, 146–151. [PubMed]24. Yu, P.; Yeo, A.S.L.; Low, M.Y.; Zhou, W. Identifying key non-volatile compounds in ready-to-drink green tea
and their impact on taste profile. Food Chem. 2014, 155, 9–16. [CrossRef] [PubMed]25. Lee, J.; Chambers, D.H. Descriptive analysis and US consumer acceptability of 6 green tea samples from
China, Japan, and Korea. J. Food Sci. 2010, 75, S141–S147. [CrossRef]26. Lee, J.; Chambers, E., IV; Chambers, D.H.; Chun, S.S.; Oupadissakoon, C.; Johnson, D.E. Consumer acceptance
for green tea by consumers in the United States, Korea and Thailand. J. Sens. Stud. 2010, 25, 109–132.[CrossRef]
27. Kiesow, F. Beiträge zur Physiologischen Psychologie des Geschmackssinnes; Wilhelm Engelmann: Leipzig,Germany, 1894; Volume 3.
28. Kroeze, J.H.; Bartoshuk, L.M. Bitterness suppression as revealed by split-tongue taste stimulation in humans.Physiol. Behav. 1985, 35, 779–783. [CrossRef]
29. Lee, K.; Lee, S. Extraction behavior of caffeine and EGCG from green and black tea. Biotechnol. BioprocessEng. 2008, 13, 646–649. [CrossRef]
30. Xu, Y.; Zou, C.; Gao, Y.; Chen, J.; Wang, F.; Chen, G.; Yin, J. Effect of the type of brewing water on thechemical composition, sensory quality and antioxidant capacity of Chinese teas. Food Chem. 2017, 236,142–151. [CrossRef] [PubMed]
31. Rossetti, D.; Bongaerts, J.H.H.; Wantling, E.; Stokes, J.R.; Williamson, A.M. Astringency of tea catechins:More than an oral lubrication tactile percept. Food Hydrocoll. 2009, 23, 1984–1992. [CrossRef]
32. Kapaun, C.L.; Dando, R. Deconvoluting physical and chemical heat: Temperature and spiciness influenceflavor differently. Physiol. Behav. 2017, 170, 54–61. [CrossRef] [PubMed]
33. Sugrue, M.; Dando, R. Cross-modal influence of colour from product and packaging alters perceived flavourof cider. J. Inst. Brew. 2018, 124, 254–260. [CrossRef]
34. Liu, Y.; Luo, L.; Liao, C.; Chen, L.; Wang, J.; Zeng, L. Effects of brewing conditions on the phytochemicalcomposition, sensory qualities and antioxidant activity of green tea infusion: A study using response surfacemethodology. Food Chem. 2018, 269, 24–34. [CrossRef] [PubMed]
35. Bertino, M.; Beauchamp, G.K.; Engelman, K. Increasing dietary salt alters salt taste preference. Physiol. Behav.1986, 38, 203–213. [CrossRef]
36. Wise, P.M.; Nattress, L.; Flammer, L.J.; Beauchamp, G.K. Reduced dietary intake of simple sugars altersperceived sweet taste intensity but not perceived pleasantness. Am. J. Clin. Nutr. 2016, 103, 50–60. [CrossRef][PubMed]

Nutrients 2019, 11, 80 13 of 13
37. Noel, C.A.; Finlayson, G.; Dando, R. Prolonged exposure to monosodium glutamate in healthy young adultsdecreases perceived umami taste and diminishes appetite for savory foods. J. Nutr. 2018, 148, 980–988.[CrossRef] [PubMed]
38. Shahbandi, A.; Choo, E.; Dando, R. Receptor regulation in taste: Can diet influence how we perceive foods?Multidiscip. Sci. J. 2018, 1, 106–115. [CrossRef]
© 2019 by the authors. Licensee MDPI, Basel, Switzerland. This article is an open accessarticle distributed under the terms and conditions of the Creative Commons Attribution(CC BY) license (http://creativecommons.org/licenses/by/4.0/).