the influence of weir pool raising on main channel ...€¦ · bice, c. m. and zampatti, b. p....
TRANSCRIPT

The influence of weir pool raising on main channel hydraulics in the lower River Murray
C. M. Bice and B. P. Zampatti
SARDI Publication No. F2015/000381-1 SARDI Research Report Series No. 840
SARDI Aquatics Sciences
PO Box 120 Henley Beach SA 5022
June 2015

Bice, C. M. and Zampatti, B. P. (2015) Influence of weir pool raising on hydraulics in the lower River Murray
II
The influence of weir pool raising on main channel hydraulics in the lower River Murray
C. M. Bice and B. P. Zampatti
SARDI Publication No. F2015/000381-1 SARDI Research Report Series No. 840
June 2015

Bice, C. M. and Zampatti, B. P. (2015) Influence of weir pool raising on hydraulics in the lower River Murray
III
This publication may be cited as: Bice, C. M. and Zampatti, B. P. (2015). The influence of weir pool raising on main channel hydraulics in the lower River Murray. South Australian Research and Development Institute (Aquatic Sciences), Adelaide. SARDI Publication No. F2015/000381-1. SARDI Research Report Series No. 840. 38pp. South Australian Research and Development Institute SARDI Aquatic Sciences 2 Hamra Avenue West Beach SA 5024 Telephone: (08) 8207 5400 Facsimile: (08) 8207 5406 http://www.sardi.sa.gov.au DISCLAIMER
The authors warrant that they have taken all reasonable care in producing this report. The report has been through the SARDI internal review process, and has been formally approved for release by the Research Chief, Aquatic Sciences. Although all reasonable efforts have been made to ensure quality, SARDI does not warrant that the information in this report is free from errors or omissions. SARDI does not accept any liability for the contents of this report or for any consequences arising from its use or any reliance placed upon it. The SARDI Report Series is an Administrative Report Series which has not been reviewed outside the department and is not considered peer-reviewed literature. Material presented in these Administrative Reports may later be published in formal peer-reviewed scientific literature. © 2015 SARDI
This work is copyright. Apart from any use as permitted under the Copyright Act 1968 (Cth), no part may be reproduced by any process, electronic or otherwise, without the specific written permission of the copyright owner. Neither may information be stored electronically in any form whatsoever without such permission.
Printed in Adelaide: June 2015
SARDI Publication No. F2015/000381-1 SARDI Research Report Series No. 840 Author(s): C. M. Bice and B. P. Zampatti Reviewer(s): D. Hanisch (DEWNR) and S. Gehrig (SARDI) Approved by: Q. Ye Science Leader – Inland Waters & Catchment Ecology Signed: Date: 10 June 2015 Distribution: SAASC Library, University of Adelaide Library, Parliamentary Library, State
Library and National Library Circulation: Public Domain
Bice, C. M. and Zampatti, B. P. (2015) Influence of weir pool raising on hydraulics in the lower River Murray
IV
TABLE OF CONTENTS
ACKNOWLEDGEMENTS ....................................................................................................... VIII
EXECUTIVE SUMMARY ........................................................................................................... 1
1. INTRODUCTION ................................................................................................................ 4
1.1. Background.................................................................................................................. 4
1.2. Objectives .................................................................................................................... 6
2. METHODS .......................................................................................................................... 7
2.1. Study site ..................................................................................................................... 7
2.2. Survey technique ........................................................................................................10
2.3. Data analysis ..............................................................................................................10
3. RESULTS ..........................................................................................................................15
3.1. Water level and hydrology ...........................................................................................15
3.2. General hydraulic parameters .....................................................................................17
3.3. Reach-scale hydraulic complexity ...............................................................................21
3.4. Within site hydraulic complexity ..................................................................................27
4. DISCUSSION ....................................................................................................................32
5. CONCLUSION ...................................................................................................................35
REFERENCES .........................................................................................................................36

Bice, C. M. and Zampatti, B. P. (2015) Influence of weir pool raising on hydraulics in the lower River Murray
V
LIST OF FIGURES
Figure 1. Map of the study area in the lower River Murray, South Australia, depicting the Locks
1, 2, 3 and 4, and sites (red dots) where cross-sectional velocity profiles were undertaken
in the lower, mid and upper reaches of the Lock 1–2, Lock 2–3 and Lock 3–4 weir pools.
These sites correspond with those presented in Table 1. .................................................. 8
Figure 2. a) The SonTek River Surveyor M9 ADCP mounted on hydroboard and b) undertaking
a transect with the ADCP. ................................................................................................10
Figure 3. Schematic representation of a river reach and a subset of the hydraulic metrics
measured (after Shields and Rigby 2005), downstream cross-sectional velocity (U) and
vertical (M3) and horizontal (M4) modified circulation metrics, which represent the area
weighted frequency and strength of eddies within a cross-section. ..................................12
Figure 4. a) Daily pool level (normal ‘pool level’ ± m) upstream of Lock 3, Lock 2 and Lock 1 and
b) daily discharge (ML.day-1) over Lock 4, Lock 3 and Lock 2 from August 2014 to March
2015. The timing of sampling events are indicated by shaded boxes. Water level and
discharge data were sourced from the Department of Environment, Water and Natural
Resources (DEWNR 2015). .............................................................................................16
Figure 5. Mean ± SE values of a) downstream cross-sectional velocity (U, m.s-1), b) the modified
vertical circulation metric (M3, s-1), c) the modified horizontal circulation metric (M4, s
-1), d)
Reynolds number (Re) and e) Froude number (Fr) in the lower, middle and upper reaches
of the Lock 1–2 (left column), Lock 2–3 (middle column) and Lock 3–4 (right column) weir
pools. ...............................................................................................................................22
Figure 6. Change in mean downstream velocity (U, m.s-1) in the a) upper, b) middle and c) lower
reaches of the Lock 1–2, Lock 2–3 and Lock 3–4 weir pools in September 2014,
November 2014 and February 2015, plotted as the number of standard deviations away
from their common average (±SE). ..................................................................................27
Figure 7. Cross-sectional velocity profiles generated from ADCP transects undertaken at five
sites in the upper reach of the Lock 3–4 weir pool in September 2014 (left column;
discharge 3970 ML.day-1) and February 2015 (right column; discharge ~7850 ML.day-1). 28
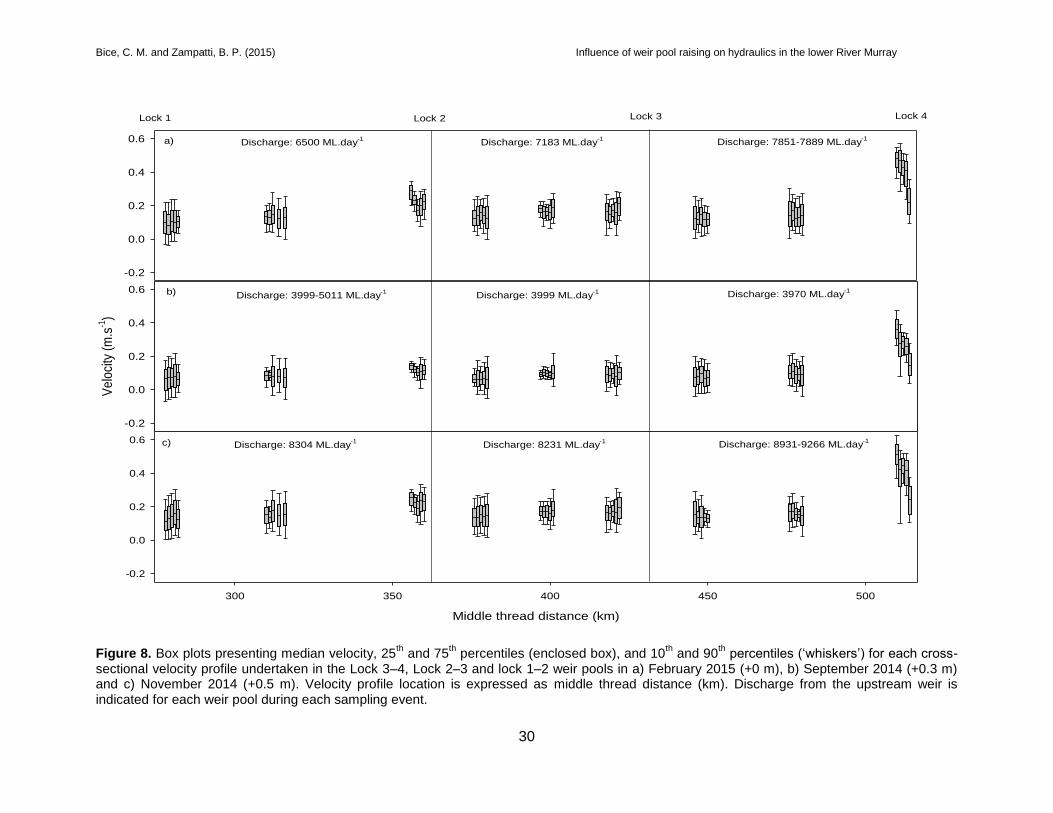
Figure 8. Box plots presenting median velocity, 25th and 75th percentiles (enclosed box), and
10th and 90th percentiles (‘whiskers’) for each cross-sectional velocity profile undertaken in
the Lock 3–4, Lock 2–3 and lock 1–2 weir pools in a) February 2015 (+0 m), b) September
2014 (+0.3 m) and c) November 2014 (+0.5 m). Velocity profile location is expressed as
middle thread distance (km). Discharge from the upstream weir is indicated for each weir
pool during each sampling event. .....................................................................................30

Bice, C. M. and Zampatti, B. P. (2015) Influence of weir pool raising on hydraulics in the lower River Murray
VI
LIST OF TABLES
Table 1. Location of sites indicated as middle thread distance (km), latitude and longitude where
cross-sectional velocity profiles were undertaken in the lower, middle and upper reaches
of the Lock 1–2, Lock 2–3 and Lock 3–4 weir pools. ......................................................... 8
Table 2. Mean values (± SE) and ranges (in brackets) of hydraulic habitat metrics calculated
from ADCP generated cross-sectional velocity profiles from the upper, middle and lower
reaches of the Lock 3–4 weir pool in February 2015 (+0 m), September (+0.3 m) and
November (+0.5 m). Metrics include measured discharge (m3.s-1), transect length (m),
max depth (m), cross-sectional area (m2), downstream cross-sectional velocity (U, m.s-1),
the modified vertical circulation metric (M3, s-1), the modified horizontal circulation metric
(M4, s-1), Reynolds number and Froude number. Note: no water level manipulation
occurred in this weir pool. ................................................................................................18
Table 3. Mean values (± SE) and ranges (in brackets) of hydraulic habitat metrics calculated
from ADCP generated cross-sectional velocity profiles from the upper, middle and lower
reaches of the Lock 2–3 weir pool in February 2015 (+0 m), September (+0.3 m) and
November (+0.5 m). Metrics include measured discharge (m3.s-1), transect length (m),
max depth (m), cross-sectional area (m2), downstream cross-sectional velocity (U, m.s-1),
the modified vertical circulation metric (M3, s-1), the modified horizontal circulation metric
(M4, s-1), Reynolds number and Froude number. ..............................................................19
Table 4. Mean values (± SE) and ranges (in brackets) of hydraulic habitat metrics calculated
from ADCP generated cross-sectional velocity profiles from the upper, middle and lower
reaches of the Lock 1–2 weir pool in February 2015 (+0 m), September (+0.3 m) and
November (+0.5 m). Metrics include measured discharge (m3.s-1), transect length (m),
max depth (m), cross-sectional area (m2), downstream cross-sectional velocity (U, m.s-1),
the modified vertical circulation metric (M3, s-1), the modified horizontal circulation metric
(M4, s-1), Reynolds number and Froude number. ..............................................................20
Table 5. Summary of two-way univariate PERMANOVA comparing downstream cross-sectional
velocity (U, m.s-1), the modified vertical circulation metric (M3, s-1), the modified horizontal
circulation metric (M4, s-1), Reynolds number (Re) and Froude number (Fr) between
sampling events (February 2015 (+0 m), September 2014 (+0.3 m) and November 2014
(+0.5 m)) and reaches (upper, middle, lower) in the Lock 3–4 weir pool. When significant
differences occurred, pairwise comparisons were used to determine the groups that drove
this difference. α = 0.05 for all analyses. Significant p-values indicated in bold. ...............23

Bice, C. M. and Zampatti, B. P. (2015) Influence of weir pool raising on hydraulics in the lower River Murray
VII
Table 6. Summary of two-way univariate PERMANOVA comparing downstream cross-sectional
velocity (U, m.s-1), the modified vertical circulation metric (M3, s-1), the modified horizontal
circulation metric (M4, s-1), Reynolds number and Froude number between sampling
events (February 2015 (+0 m), September 2014 (+0.3 m) and November 2014 (+0.5 m))
and reaches (upper, middle, lower) in the Lock 2–3 weir pool. When significant differences
occurred, pairwise comparisons were used to determine the groups that drove this
difference. α = 0.05 for all analyses. Significant p-values indicated in bold. .....................24
Table 7. Summary of two-way univariate PERMANOVA comparing downstream cross-sectional
velocity (U, m.s-1), the modified vertical circulation metric (M3, s-1), the modified horizontal
circulation metric (M4, s-1), Reynolds number and Froude number between sampling
events (February 2015 (+0 m), September 2014 (+0.3 m) and November 2014 (+0.5 m))
and reaches (upper, middle, lower) in the Lock 1–2 weir pool. When significant differences
occurred, pairwise comparisons were used to determine the groups that drove this
difference. α = 0.05 for all analyses. Significant p-values indicated in bold. .....................25
Table 8. 25th and 75th percentile downstream velocity ranges (m.s-1) for all cross-sectional
velocity profiles measured in February 2015 (+0 m), September 2014 (+0.3 m) and
November 2014 (+0.5 m), and results of Kolmogorov-Smirnov ‘goodness of fit’
comparison (D statistic and p-value, α = 0.05. Significant p-values indicated in bold)
between February 2015 and November 2014 data. .........................................................31

Bice, C. M. and Zampatti, B. P. (2015) Influence of weir pool raising on hydraulics in the lower River Murray
VIII
ACKNOWLEDGEMENTS
This study was funded by the South Australian Department of Environment, Water and Natural
Resources (DEWNR) under the Riverine Recovery Project (RRP), a component of South
Australia’s Murray Futures Program, and was managed by Daniel Hanisch (DEWNR). The
authors would like to thank the following SARDI staff for assistance with field trips and the
production of figures: Arron Strawbridge, Ian Magraith, Phillipa Wilson and Josh Fredberg.
Special thanks go to Charles James (SARDI) for assistance with data manipulation and
analyses. Thanks also to Daniel Hanisch and Susan Gehrig (SARDI) for reviewing this
document.

Bice, C. M. and Zampatti, B. P. (2015) Influence of weir pool raising on hydraulics in the lower River Murray
1
EXECUTIVE SUMMARY
River regulation and consumptive water use have dramatically altered the flow regime of the
lower River Murray. Reductions in flow volumes have led to decreases in the frequency,
magnitude and duration of within-channel and overbank flows, whilst the construction of 10 low-
level weirs, has transformed over 800 km of free-flowing river into a series of contiguous weir
pools that are predominantly lentic in character. As such, hydrological variability in the lower
River Murray has been diminished, water levels are highly stable and the within-channel
hydraulic environment (i.e. water depth, velocity and turbulence) is homogenous when
compared to the unregulated river. Substantial changes in ecological patterns and processes
have been associated with these aspects of flow regime alteration.
Weir pool manipulations (i.e. raising or lowering river stage using existing lock and weir
infrastructure) are currently being investigated by South Australian and federal agencies as a
tool for reinstating greater water level variability in the lower River Murray. There has been
considerable interest in the utility of raising weir pools with the objective of inundating littoral
zones, and thus achieving environmental outcomes (e.g. responses from littoral and floodplain
vegetation) in the absence of elevated flows. Nonetheless, the action of raising a weir pool,
reduces the physical flow gradient and may thus, further impact hydraulic complexity. An
understanding of the influence of weir pool raising on within channel hydraulic conditions and
how this influence varies with discharge and location, both within and among weir pools, is
required to inform future weir pool manipulations.
In spring/summer 2015, weir pool manipulation was undertaken in the Lock 1–2 and Lock 2–3
weir pools. Water levels in the weir pools were first raised to +0.3 m above ‘full supply level’
(FSL) and then further raised to a maximum of +0.5 m for a period of approximately two weeks,
before being reduced to +0 m. The objective of the current study was to utilise cross-sectional
velocity profiles to investigate the influence of raising the level of the Lock 1–2 and Lock 2–3
weir pools on within channel hydraulics. Specifically, the aims were to,
1) Characterise and compare spatio-temporal variability in the hydraulic environment in two
raised (Lock 1–2 and Lock 2–3) and one unraised ‘reference’ weir pool (Lock 3–4) at
+0 m (FSL), +0.3 m and +0.5 m, using a range of hydraulic metrics; and
2) To integrate these data, to determine the influence of weir pool raising on hydraulic
complexity and inform future weir pool manipulations in the lower River Murray.

Bice, C. M. and Zampatti, B. P. (2015) Influence of weir pool raising on hydraulics in the lower River Murray
2
A vessel-mounted Acoustic Doppler Current Profiler (ADCP) was used to measure cross-
sectional velocity profiles from five sites, within three reaches (i.e. lower, middle and upper weir
pool), across the three weir pools. Velocity profiles were measured on three occasions, timed to
coincide with different stages of the weir pool manipulation: 1–9 September 2014 (+0.3 m), 11–
13 November 2014 (+0.5 m) and 9–11 February 2015 (+0 m). Water level in the Lock 3–4 weir
pool was not actively raised and ranged 0.004–0.028 m during sampling. Discharge was
generally low but variable over the study period ranging 3970–5011, 8231–9266 and 6500–
7889 ML.day-1 in September 2014, November 2014 and February 2015, respectively, across all
weir pools.
Patterns of spatio-temporal variability in mean downstream velocity and metrics, which indicate
the level of turbulence (i.e. Reynolds number), ‘rapidly’ flowing water (i.e. Froude number), and
strength and frequency of eddies (i.e. modified circulation metrics) in cross-sectional profiles,
were consistent across weir pools, raised and unraised. There was little significant difference in
these parameters, in all three weir pools, between periods of similar discharge in November
2014 (+0.5 m in Lock 1–2 and Lock 2–3, and +0 m in the Lock 3–4 weir pool) and February
2015 (+0 m in all weir pools). These results suggest that weir pool raising in the Lock 1–2 and
Lock 2–3 weir pools had little impact on within channel hydraulics at the weir heights and
discharges investigated.
Substantial spatial variability in hydraulics was observed both within and among the three weir
pools. Typically, wetted width, depth and cross-sectional area increased and in association,
mean velocities and turbulence decreased, in a downstream direction and proximity to the
downstream weir, with upper reaches exhibiting the greatest levels of hydraulic complexity. This
‘downstream weir effect’ was present in each weir pool but differences in the length and
sinuosity of the weir pools results in the level of impact of the ‘downstream weir effect’ differing
between weir pools, which drove the observed differences in hydraulics. Relatively low
velocities throughout the Lock 2–3 weir pool, including in the upper reach, suggests the
‘downstream weir effect’ extends upstream through the entire length of the weir pool.
Alternatively, the presence of relatively high velocities in the upper reach of the Lock 3–4 weir
pool, regardless of discharge, suggests that the ‘downstream weir effect’ is attenuated some
distance below Lock 4 and this reach represents a comparatively ‘free-flowing’ reach in the
otherwise lentic and hydraulically homogenous lower River Murray.

Bice, C. M. and Zampatti, B. P. (2015) Influence of weir pool raising on hydraulics in the lower River Murray
3
The results of the current study have important implications for future weir pool manipulations.
Firstly, raising the Lock 1–2 and Lock 2–3 weir pools, at similar discharge to that experienced in
the current study is unlikely to have a significant impact on hydraulic complexity. Alternatively,
the upper reach of the Lock 3–4 weir pool appears to represent a unique lotic reach in the
otherwise lentic lower River Murray, and thus, raising events in this weir pool should be carefully
considered given potential risks to this now rare habitat. The spatial variability in hydraulics
observed between weir pools suggests a greater understanding of weir pool specific hydraulics
is required for other weir pools of the lower River Murray to assess potential impacts/benefits of
water level manipulations. Ultimately, any future weir pool manipulation program is likely to elicit
the greatest ecological benefit if it is integrated with broader riverine rehabilitation programs
(e.g. hydrological rehabilitation through environmental flow delivery), planned over a long-term
(> 10 years), incorporates both raisings and lowerings, and considers both potential risks (e.g.
loss of hydraulic complexity) and benefits (e.g. vegetation response) in a spatial and
hydrological context (i.e. where and at what flows manipulations occur).

Bice, C. M. and Zampatti, B. P. (2015) Influence of weir pool raising on hydraulics in the lower River Murray
4
1. INTRODUCTION
1.1. Background
River regulation and water abstraction typically result in the alteration of natural flow regimes to
the detriment of ecosystem structure and function (Bunn and Arthington 2002). In general,
regulation alters the hydrological and hydraulic nature of rivers, which impact different aspects
of the ecosystem, but which may ultimately act in conjunction in many catchments. For instance,
total discharge and subsequently floodplain inundation extent, frequency and duration are
impacted by upstream storage and extraction, whilst instream hydraulics (i.e. depth, flow
velocity and turbulence) or the ‘physical nature of flow’ are impacted by overall reductions in
discharge but also the presence of smaller instream structures such as weirs (Poff et al. 1997).
To achieve the greatest ecological benefit, the restoration of regulated rivers must be
multifaceted and consider actions to mitigate hydrological and hydraulic impacts.
The hydraulic characteristics of fluvial ecosystems result from the interaction of discharge and
physical features (e.g. channel morphology, woody debris, man-made structures, etc.), and
have a profound influence on ecosystem structure and function (Biggs et al. 2005). Hydraulics
vary spatially due to physical habitat heterogeneity and temporally with discharge; both sources
of variability are important in lotic ecology. Spatial heterogeneity in hydraulics facilitates
variability in microhabitats that may be utilised by different biota and subsequently, is often
associated with high levels of biological diversity (de Nooij et al. 2006, Dyer and Thoms 2006).
Temporal variability in hydraulic conditions performs other functions including scouring and
sediment transport, altering biofilm composition (Sheldon and Walker 1997) and facilitating
critical life history processes like fish spawning (Zampatti and Leigh 2013) and larval drift
(Dudley and Platania 2007). Subsequently, changes to hydraulic conditions, as a result of river
regulation, impact biota and processes reliant on complex hydraulic environments.
The lower River Murray was once a lotic system, which experienced highly variable discharge
and heterogeneous hydraulics over a range of spatial scales, even during times of low flow
(Mallen-Cooper et al. 2011). However, river regulation and increased consumptive water use
has reduced overall flow volumes and subsequently reduced the frequency and duration of
medium–high flows (Maheshwari et al. 1995). Furthermore, the construction of 10 low-level
weirs in the 1920s and 1930s, transformed over 800 km of river into a series of contiguous, weir
pools which are predominantly lentic in character (Walker and Thoms 1993). As such, variability

Bice, C. M. and Zampatti, B. P. (2015) Influence of weir pool raising on hydraulics in the lower River Murray
5
in the flow regime has been diminished and water levels are now relatively stable (Maheshwari
et al. 1995, Blanch et al. 2000). During low flows (<5,000 ML/d), variability in water velocities
and thus hydraulic complexity, is far greater in unregulated reaches of the mid-Murray
compared to the weir pool environments of the lower River Murray (Kilsby 2008). This suggests
that under entitlement flows (3000–7000 ML.day-1), which predominate, the lower River Murray
is now hydraulically homogenous compared to the unregulated river, and significantly elevated
flow may be required to reinstate hydraulic complexity (Bice et al. 2013).
Weir pool manipulations (i.e. raising or lowering river stage using existing lock and weir
infrastructure) are currently being investigated by South Australian and federal agencies as a
tool for reinstating greater variability in water level and riparian zone/floodplain inundation in the
lower River Murray. In the lower River Murray in South Australia, there has been considerable
interest in the utility of raising weir pools with the objective of inundating littoral zones and low-
level floodplain, and thus achieving environmental outcomes (e.g. improved river red gum
(Eucalyptus camaldulensis) condition and increased productivity) in the absence of elevated
discharge. Nonetheless, the action of raising a weir pool effectively ‘backs’ water up from a
downstream weir, which reduces the physical flow gradient of a weir pool and may potentially,
further impact hydraulic complexity. An understanding of the influence of weir pool raising on the
within-channel hydraulic environment and how this influence varies with discharge and location,
both within and among weir pools, is required to inform future application of weir pool
manipulation.
Weir pool raisings were undertaken in the Lock 1–2 and Lock 2–3 weir pools in spring/summer
2015. The weir pools were raised to +0.3 m above ‘full supply level’ (FSL, +0 m) and then
further raised to a maximum of +0.5 m for a period of approximately two weeks, before being
reduced back to pool level. This presented the opportunity to investigate the influence of weir
pool raising on within channel hydraulics in two adjacent weir pools.

Bice, C. M. and Zampatti, B. P. (2015) Influence of weir pool raising on hydraulics in the lower River Murray
6
1.2. Objectives
The primary objective of this project was to utilise cross-sectional velocity profiles to investigate
the influence of raising the level of the Lock 1–2 and Lock 2–3 weir pools on within channel
hydraulics. Specifically, the aims were to,
3) Characterise and compare spatio-temporal variability in the hydraulic environment in two
raised (Lock 1–2 and Lock 2–3) and one unraised ‘reference’ weir pool (Lock 3–4) at +0
m (FSL), +0.3 m and +0.5 m, using a range of hydraulic metrics; and
4) To integrate these data, to determine the influence of weir pool raising on hydraulic
complexity in the Lock 1–2 and Lock 2–3 weir pools, and inform future weir pool
manipulations in the lower River Murray.

Bice, C. M. and Zampatti, B. P. (2015) Influence of weir pool raising on hydraulics in the lower River Murray
7
2. METHODS
2.1. Study site
Velocity profiles were measured across transects in three weir pools in the main channel of the
lower River Murray; Lock 1–2 and Lock 2–3, within which water levels were raised, and Lock 3–
4, within which water levels were not raised. Within each weir pool, cross-sectional velocity
profiles were undertaken at 5 sites, separated by approximately 1 km, within each of 3
‘reaches’, 1) the upper weir pool (in the vicinity of the upstream weir), 2) the mid weir pool
(approximately mid-way between the two weirs) and 3) the lower weir pool (within the vicinity of
the downstream weir) (Figure 1 and Table 1). Below bank-full discharge (~50,000 ML.day-1)
within weir pools of the lower River Murray there is a general downstream gradient of
decreasing water velocity and water level variability. As such, hydraulics and geomorphic
processes (i.e. erosion and deposition) differ between ‘reaches’ within individual weir pools, and
may thus respond differently to weir pool manipulations. The terms ‘upper’, ‘middle’ and ‘lower’
weir pool are adopted from previous authors (Walker et al. 1994). Velocity profiles were
measured on three occasions, which were timed to coincide with different stages of the weir
pool manipulation: 1–9 September 2014 (+0.3 m above FSL), 11–13 November 2014 (+0.5 m
above FSL) and 9–11 February 2015 (+0 m FSL).

Bice, C. M. and Zampatti, B. P. (2015) Influence of weir pool raising on hydraulics in the lower River Murray
8
Figure 1. Map of the study area in the lower River Murray, South Australia, depicting the Locks 1, 2, 3 and 4, and sites (red dots) where cross-sectional velocity profiles were undertaken in the lower, mid and upper reaches of the Lock 1–2, Lock 2–3 and Lock 3–4 weir pools. These sites correspond with those presented in Table 1.

Bice, C. M. and Zampatti, B. P. (2015) Influence of weir pool raising on hydraulics in the lower River Murray
9
Table 1. Location of sites indicated as middle thread distance (MTD, km), latitude and longitude where cross-sectional velocity profiles were undertaken in the lower, middle and upper reaches of the Lock 1–2, Lock 2–3 and Lock 3–4 weir pools. MTD is the distance, measured along the middle of the river, from a specific point to the river’s mouth.
Weir pool Reach Site Middle thread distance (km)
Latitude Longitude
Lock 1–2 lower 1 278 -34.31307 139.63138 2 279 -34.31073 139.63528 3 280 -34.30386 139.64095 4 281 -34.29832 139.64137 5 282 -34.29425 139.63351
middle 1 310 -34.09372 139.67863 2 311 -34.08958 139.68272 3 312 -34.08081 139.68723 4 314 -34.06710 139.68060 5 316 -34.05790 139.68175
upper 1 356 -34.10050 139.88994 2 357 -34.09122 139.89282 3 358 -34.08313 139.89793 4 359 -34.08324 139.90637 5 360 -34.08190 139.91483
Lock 2–3 lower 1 376 -34.16262 139.93123 2 377 -34.16879 139.93976 3 378 -34.16600 139.94679 4 379 -34.16007 139.95306 5 380 -34.16045 139.96623
middle 1 397 -34.18191 140.08530 2 398 -34.18369 140.09853 3 399 -34.18229 140.11159 4 400 -34.17952 140.12218 5 401 -34.17498 140.13234
upper 1 418 -34.17813 140.27609 2 419 -34.18495 140.28760 3 420 -34.18251 140.29639 4 421 -34.17456 140.30458 5 422 -34.16854 140.31305
Lock 3–4 lower 1 446 -34.25627 140.39619 2 447 -34.26559 140.39651 3 448 -34.26380 140.38525 4 449 -34.26489 140.37570 5 450 -34.27085 140.37054
middle 1 476 -34.40580 140.48557 2 477 -34.40699 140.49330 3 478 -34.41606 140.49686 4 479 -34.42175 140.49654 5 480 -34.43158 140.49712
upper 1 510 -34.35940 140.57028 2 511 -34.35612 140.57640 3 512 -34.35566 140.56619 4 513 -34.34800 140.55652 5 514 -34.34154 140.55424

Bice, C. M. and Zampatti, B. P. (2015) Influence of weir pool raising on hydraulics in the lower River Murray
10
2.2. Survey technique
Cross-sectional velocity profiles were collected using a vessel-mounted SonTek River Surveyor
M9 Acoustic Doppler Current Profiler (ADCP) (Figure 2a). In brief, ADCP measure the Doppler
shift in acoustic signals as they are reflected off of suspended particles in the water column.
Transducers on the unit send acoustic pulses vertically into the water column and, after a brief
blackout period, begin recording pulses reflected from suspended particles, assuming that the
velocity of suspended particles equates to fluid flow velocities (Shields and Rigby 2005). The
water column is divided into depth ‘cells’ and the instrument uses the speed of sound in water to
group reflected signals from given depth cells. Data, including water depth, heading, echo
intensity and velocity are recorded at intervals of ~1 second and are used to produce measures
of mean velocity for each depth cell. The ADCP unit is mounted on the gunwale of the vessel
and transects are driven across a river reach to generate cross-sectional flow velocity profiles
for the given transect (Figure 2b).
a) b)
Figure 2. a) The SonTek River Surveyor M9 ADCP mounted on hydroboard and b) undertaking a transect with the ADCP.
2.3. Data analysis
Data that were generated from ADCP transects were first viewed in the SonTek ADCP software
package RiverSurveyor Live. Data were then exported to the numerical computing program
MATLAB and interpolated across grids with equal cell sizes (0.5 m long x 0.25 m high) using the
Delaney triangulation scattered data function (The Mathworks Inc. 2010). Water velocities for
each cell are generated in three planes; perpendicular or cross-transect (i.e. upstream to

Bice, C. M. and Zampatti, B. P. (2015) Influence of weir pool raising on hydraulics in the lower River Murray
11
downstream), parallel to or along a transect (i.e. from bank to bank) and vertically (i.e. up or
down). These velocity data may then be used to calculate various hydraulic metrics. In the
current study, spatio-temporal variability in hydraulic complexity was investigated at two scales;
1) the reach-scale (i.e. lower, middle and upper reaches) and 2) site-scale (i.e. individual
transects).
Variability in discharge between sampling events has implications for data analysis and
interpretation in the current project. Discharge was most similar between November 2014 (+0.5
m) and February 2015 (+0 m) (see results Section 3.1), and on both occasions greater than that
experienced in September 2014. The hydraulic metrics outlined below cannot be standardised
for discharge as a linear relationship with flow cannot be assumed and consequently, direct
comparisons between hydraulic metrics from November 2014 and February 2015 provide the
greatest insight into the influence of weir pool raising on river channel hydraulics.
Reach-scale hydraulic complexity
Spatio-temporal variability in hydraulic complexity within each weir pool was investigated by
computing the following hydraulic metrics from cross-sectional velocity profiles and comparing
between sampling events, and reaches: 1) cross-sectional downstream velocity (U), 2) modified
vertical circulation metric (M3), 3) modified horizontal circulation metric (M4), 4) Reynolds
number (Re) and 5) Froude number (Fr).
The vertical and horizontal modified circulation metrics are spatial hydraulic metrics developed
by Crowder and Diplas (2000a) to quantify flow complexity over a defined area, in this case,
river cross-sections as measured by ADCP transects. In brief, the modified circulation metrics
expand on the point calculation of vorticity, which is defined as twice the rate at which a fluid
rotates about its vertical axis (Crowder and Diplas 2000, 2002). Vorticity is a point measure, but
the modified circulation metrics (M3 and M4) (after Shields and Rigby 2005) build upon the
calculation of vorticity and represent a weighted average of absolute vorticity (i.e. flow rotation)
in the vertical and horizontal planes per unit area, transverse to the channel, and are a measure
of the strength and frequency of eddies in a river cross-section (Figure 3). Calculation of M3 is
explained by Equation 1, where w represents velocity in the vertical plane z and v represents
velocity in the lateral plane y. Calculation of M4 is explained by Equation 2 where v represents
velocity in the lateral plane y and u represents velocity in the lateral plane x. Absolute values of
velocity are used so that the direction of calculation (i.e. clockwise or counter-clockwise) does

Bice, C. M. and Zampatti, B. P. (2015) Influence of weir pool raising on hydraulics in the lower River Murray
12
not result in the cancellation of eddies of equal strength in opposing directions. Higher values of
M3 and M4 indicate greater frequency and strength of eddies or greater levels of circulation (i.e.
flow rotation) within a cross-section. Crowder and Diplas (2002) present an example of utilising
M3 to describe the hydraulic habitat surrounding a series of brown trout (Salmo trutta) redds (i.e.
spawning sites) relative to reaches without redds. Furthermore, this metric has been adopted by
Shields and Rigby (2005) to analyse river habitat quality and found to be a good discriminator of
differences in hydraulic conditions between modified and natural stream reaches.
Equation 1. M3 =
∑|(∆𝒘∆𝒚
−∆𝒗∆𝒛
)|∗∆𝒚∗∆𝒛
∑∆𝒚∗∆𝒛
Equation 2. M4 =
∑|(∆𝒗∆𝒙
−∆𝒖∆𝒚
)|∗∆𝒙∗∆𝒚
∑∆𝒙∗∆𝒚
Figure 3. Schematic representation of a river reach and a subset of the hydraulic metrics measured (after Shields and Rigby 2005), downstream cross-sectional velocity (U) and vertical (M3) and horizontal (M4) modified circulation metrics, which represent the area weighted frequency and strength of eddies within a cross-section.
Reynolds number (Re) is a dimensionless metric that indicates whether flow in a channel is
laminar or turbulent. In any open stream, flow is almost never laminar and thus the transition
from laminar to turbulent flow is not of great importance (Gordon et al. 2004). Nonetheless,
greater values of Reynolds number indicate greater levels of turbulence. Reynolds number is
calculated using Equation 3, where U represents downstream cross-sectional velocity, L
U
M3
M4

Bice, C. M. and Zampatti, B. P. (2015) Influence of weir pool raising on hydraulics in the lower River Murray
13
represents the hydraulic radius of a cross section (i.e. the cross-sectional area of the channel
divided by the wetted perimeter (the river bed)) and v represents kinematic viscosity of water.
Equation 3. 𝑹𝒆 =𝑼∗𝑳
𝒗
Froude number (Fr) is a dimensionless metric that indicates the ratio of inertial to gravitational
forces, where gravity encourages water to flow down an elevation gradient and inertial forces
indicate the waters compulsion to follow this path (Gordon et al. 2004). The Froude number is
calculated using Equation 4 where U represents downstream cross-sectional velocity, D
represents average channel depth and g acceleration due to gravity (i.e. 9.81 m.s-1). Values of
Fr > 1 indicate supercritical or ‘rapid’ flow, whilst values < 1 indicate subcritical or ‘tranquil’ flow
(Gordon et al. 2004). Much flow in large rivers like the lower River Murray, particularly under low
flow, is likely to be subcritical, but higher relative values indicate a greater prevalence of faster
flowing habitats and in streams can indicate a greater prevalence of ‘riffles’ over ‘pool’ habitat
(Lamouroux and Souchon 2002).
Equation 4. 𝑭𝒓 =𝑼
√𝒈∗𝑫
Values of the above metrics cannot be explicitly compared between weir pools due to the
differing physical nature of each weir pool, but rather the relative change in metrics across time
can be investigated to determine the influence of weir pool raising on hydraulics. All hydraulic
metrics (i.e. U, M3, M4, Re and Fr) were compared between reaches (i.e. lower, middle and
upper) and sampling events (i.e. September 2014 (+0.3 m), November 2014 (+0.5 m) and
February 2015 (+0 m)) within weir pools, using univariate two-factor PERMANOVA
(permutational ANOVA and MANOVA), in the software package PRIMER v. 6.1.12 and
PERMANOVA+ (Anderson et al. 2008). All analyses were performed on Euclidean Distance
similarity matrices and α = 0.05 for all comparisons. Should weir pool raising have a significant
influence on within channel hydraulic conditions, patterns of temporal variability in the above
metrics should be different between raised (Lock 1–2 and Lock 2–3) and unraised weir pools
(Lock 3–4). Additionally, for downstream cross-sectional velocity an overall mean value for each
reach within each weir pool (all sampling events combined) was determined. Values of

Bice, C. M. and Zampatti, B. P. (2015) Influence of weir pool raising on hydraulics in the lower River Murray
14
variability (in standard deviations) from this mean for each reach, across all sampling events,
was determined and qualitatively compared between weir pools.
Site-scale hydraulic complexity
The above analyses provide insight on spatio-temporal variability in reach- and weir pool-scale
hydraulics, but they do not provide insight on variability in velocities at the site-scale (metres),
particularly the prevalence of ‘patches’ of given velocities. Assessment of site-scale variability in
hydraulics involved comparing downstream velocity distributions within individual cross-sections
across sampling events (i.e. September 2014 (+0.3 m), November 2014 (+0.5 m) and February
2015 (+0 m)). Velocity distributions were explicitly compared between November 2014 (+0.5 m)
and February 2015 (+0 m) using the Two-tailed Kolmogorov-Smirnov ‘goodness of fit’ test.
Potential differences in velocity distributions were interpreted using box and whisker plots which
present median and 10th, 25th, 75th and 90th percentile velocities for each individual transect.

Bice, C. M. and Zampatti, B. P. (2015) Influence of weir pool raising on hydraulics in the lower River Murray
15
3. RESULTS
3.1. Water level and hydrology
Velocity profiles were measured on three occasions, which were timed to coincide with different
stages of the weir pool manipulation: 1–9 September 2014 (+0.3 m above FSL), 11–13
November 2014 (+0.5 m above FSL) and 9–11 February 2015 (+0 m FSL) (Figure 4a). Raising
of water levels in the Lock 1–2 and Lock 2–3 weir pools began in early August 2014 and
reached +0.3 m by mid-August. This level was maintained for ~8 weeks, before being gradually
raised over a period of ~3 weeks, reaching the maximum level of +0.5 m in early November.
This level was maintained for ~2 weeks before recession began. The water level in the Lock 1–
2 weir pool was then rapidly drawn down over a period of ~1 week in response to water leakage
through the structure. This leaking also resulted in the level of this weir pool dropping below +0
m (-0.096 m) during sampling in February 2015. Water level within the Lock 2–3 weir pool was
more gradually drawn down over a period of ~4 weeks. Whilst not specifically raised, water level
in the Lock 3–4 weir pool was +0.005–0.017 m and +0.004–0.010 m during the September and
November 2014 sampling events, respectively. During sampling in February 2015 water level
was +0.028 and +0.032 m in the Lock 3–4 and Lock 2–3 weir pools, respectively (Figure 4a).
Discharge was generally low, but variable over the study period (Figure 4b), with greatest
discharge from all three weirs in November 2014 and lowest in September 2014. During
sampling, discharge from Lock 4 was 3970 ML.day-1, 8931–9266 ML.day-1 and 7851–7889
ML.day-1 in September 2014, November 2014 and February 2015, respectively. Discharge from
Lock 3 was 3999 ML.day-1, 8231 ML.day-1 and 7183 ML.day-1 in September 2014, November
2014 and February 2015, respectively. Discharge from Lock 2 was 3999–5011 ML.day-1 in
September 2014, 8304 ML.day-1 in November 2014 and 6500 ML.day-1 in February 2015.

Bice, C. M. and Zampatti, B. P. (2015) Influence of weir pool raising on hydraulics in the lower River Murray
16
Figure 4. a) Daily pool level (normal ‘pool level’ ± m) upstream of Lock 3, Lock 2 and Lock 1 and b) daily
discharge (ML.day-1
) over Lock 4, Lock 3 and Lock 2 from August 2014 to March 2015. The timing of sampling events are indicated by shaded boxes. Water level and discharge data were sourced from the Department of Environment, Water and Natural Resources (DEWNR 2015).
Aug Sep Oct Nov Dec Jan Feb Mar
Dis
ch
arg
e M
L.d
ay
-1
0
2000
4000
6000
8000
10000
12000
14000
16000
18000
20000
Lock 4
Lock 3
Lock 2
Wate
r le
ve
l (±
m f
rom
'norm
al'
po
ol le
vel)
-0.2
-0.1
0.0
0.1
0.2
0.3
0.4
0.5
0.6
Lock 3
Lock 2
Lock 1
a)
b)
2014 2015

Bice, C. M. and Zampatti, B. P. (2015) Influence of weir pool raising on hydraulics in the lower River Murray
17
3.2. General hydraulic parameters
Changes in general hydraulic parameters were evident within all weir pools between sampling
events (Tables 2–4). In the Lock 3–4 weir pool, discharge (m3.s-1) as measured from ADCP
transects, varied in association with calculated discharge over Lock 4 (Table 2 and Figure 4b).
Transect length, as an indication of wetted width, did not vary substantially, but max depth and
cross-sectional area exhibited minor variations in association with variation in discharge,
particularly in the upper reach.
In the Lock 2–3 and Lock 1–2 weir pools, measured discharge also reflected calculated
discharge over the locks (Tables 3–4 and Figure 4b). Transect length did not vary substantially
between sampling events, but maximum depth and cross-sectional area increased in the
following order February 2015 < September 2014 < November 2014 reflecting the different weir
pool levels, +0 m, +0.3 m and +0.5 m, during these sampling events.
All weir pools exhibited variability in general hydraulic metrics in a downstream direction,
including increases in max depth and cross-sectional area, whilst mean velocity decreased
reflecting the influence of the downstream lock and weir structure in each weir pool (Tables 2–
4). This difference, however, was not as pronounced in the Lock 2–3 weir pool.
The different physical nature of the weir pools is evident from the general hydraulic metrics. The
upper reach of the Lock 3–4 weir pool in particular, is noticeably different to all other reaches;
with much lower transect length and cross-sectional area (Tables 2–4). Accordingly, the
greatest velocities recorded in the study occurred in this reach, with mean downstream velocity
ranging 0.262–0.392 m.s-1 (Table 2). The upper reach of the Lock 1–2 weir pool also exhibited
mean downstream velocities >0.2 m.s-1 in both November 2014 and February 2015, but all other
reaches exhibited mean downstream velocities of <0.2 m.s-1 and often <0.15 m.s-1.

Bice, C. M. and Zampatti, B. P. (2015) Influence of weir pool raising on hydraulics in the lower River Murray
18
Table 2. Mean values (± SE) and ranges (in brackets) of hydraulic habitat metrics calculated from ADCP generated cross-sectional velocity profiles from the upper, middle and lower reaches of the Lock 3–4 weir pool in February 2015 (+0 m), September (+0.3 m) and November (+0.5 m). Metrics include measured discharge (m
3.s
-1), transect length (m), max depth (m), cross-sectional area (m
2), downstream cross-sectional
velocity (U, m.s-1
), the modified vertical circulation metric (M3, s-1
), the modified horizontal circulation metric (M4, s-1
), Reynolds number and Froude
number. Note: no water level manipulation occurred in this weir pool.
February 2015 (+0 m) September 2014 (+0.3 m) November 2014 (+0.5 m)
Means Lower Mid Upper Lower Mid Upper Lower Mid Upper
Discharge (m
3.s
-1)
88.14 ± 0.69 (85.72–89.50)
95.31 ± 1.71 (90.86–101.43)
85.75 ± 1.89 (81.75–92.54)
54.08 ± 1.73 (49.43–57.25)
62.66 ± 1.48 (59.11–66.73)
53.82 ± 1.19 (51.82–58.39)
99.64 ± 0.76 (97.87–102.23)
108.82 ± 2.86 (103.20–116.23)
94.29 ± 2.00 (91.40–102.18)
Transect length (m)
174.14 ± 15.31 (130.31–205.19)
167.92 ± 14.19 (137.47–214.34)
103.00 ± 8.95 (76.42–132.47)
174.27 ± 15.95 (134.55–207.11)
165.87 ± 14.10 (136.57–212.65)
102.98 ± 8.15 (76.85–127.24)
175.81 ± 15.85 (133.45–206.49)
166.89 ± 14.59 (136.41–215.82)
104.69 ± 8.77 (79.01–133.46)
Max depth (m)
6.11 ± 0.45 (5.06–7.20)
6.17 ± 0.54 (4.70–7.65)
4.24 ± 0.49 (3.10–5.84)
6.38 ± 0.50 (4.89–7.38)
6.13 ± 0.54 (4.60–7.26)
4.09 ± 0.64 (2.58–5.88)
5.98 ± 0.40 (5.06–6.99)
6.21 ± 0.57 (4.64–7.60)
4.41 ± 0.61 (2.99–6.22)
Area (m2) 756.82 ± 24.10
(691.36–814.68) 704.01 ± 27.64
(617.99–772.08)
266.48 ± 45.14 (205.09–444.36)
759.26 ± 26.12 (696.27–830.60)
697.84 ± 22.47 (629.16–757.17)
246.63 ± 43.65 (163.74–415.51)
762.69 ± 23.73 (698.97–835.27)
705.73 ± 26.27 (620.77–773.19)
285.33 ± 47.99 (203.18–473.42)
U (m.s-1
) 0.125 ± 0.004 (0.116–0.139)
0.146 ± 0.006 (0.133–0.165)
0.389 ± 0.043 (0.224–0.463)
0.077 ± 0.003 (0.072–0.087)
0.098 ± 0.006 (0.085–0.115)
0.262 ± 0.034 (0.152–0.363)
0.141 ± 0.005 (0.130–0.158)
0.158 ± 0.006 (0.145–0.177)
0.392 ± 0.043 (0.242–0.501)
M3 (s-1
) 0.171 ± 0.017 (0.130–0.228)
0.158 ± 0.014 (0.113–0.189)
0.142 ± 0.016 (0.108–0.201)
0.173 ± 0.007 (0.152–0.191)
0.163 ± 0.011 (0.130–0.190)
0.120 ± 0.020 (0.075–0.184)
0.151 ± 0.028 (0.086–0.224)
0.135 ± 0.025 (0.043–0.185)
0.146 ± 0.018 (0.101–0.184)
M4 (s-1
) 0.083 ± 0.008 (0.066–0.106)
0.084 ± 0.012 (0.055–0.112)
0.062 ± 0.008 (0.046–0.088)
0.063 ± 0.008 (0.044–0.091)
0.075 ± 0.007 (0.058–0.101)
0.039 ± 0.007 (0.025–0.063)
0.075 ± 0.018 (0.034–0.119)
0.065 ± 0.013 (0.022–0.095)
0.062 ± 0.008 (0.043–0.082)
Reynolds number
55910 ± 5322 (45462–73571)
62624 ± 5938 (47202–79163)
94826 ± 7653 (75076–122209)
34599 ± 3717 (26633–46822)
41986 ± 3942 (30810–52901)
58801 ± 4857 (49568–76723)
63031 ± 5852 (51885–77875)
68493 ± 5658 (52522–81607)
101216 ± 6050 (85738–121852)
Froude number
0.019 ± 0.001 (0.018–0.021)
0.023 ± 0.001 (0.020–0.027)
0.080 ± 0.011 (0.039–0.105)
0.012 ± 0.000 (0.011–0.013)
0.015 ± 0.001 (0.012–0.019)
0.057 ± 0.010 (0.027–0.090)
0.021 ± 0.001 (0.019–0.024)
0.025 ± 0.002 (0.020–0.029)
0.079 ± 0.014 (0.041–0.114)

Bice, C. M. and Zampatti, B. P. (2015) Influence of weir pool raising on hydraulics in the lower River Murray
19
Table 3. Mean values (± SE) and ranges (in brackets) of hydraulic habitat metrics calculated from ADCP generated cross-sectional velocity profiles from the upper, middle and lower reaches of the Lock 2–3 weir pool in February 2015 (+0 m), September (+0.3 m) and November (+0.5 m). Metrics include measured discharge (m
3.s
-1), transect length (m), max depth (m), cross-sectional area (m
2), downstream cross-sectional
velocity (U, m.s-1
), the modified vertical circulation metric (M3, s-1
), the modified horizontal circulation metric (M4, s-1
), Reynolds number and Froude
number.
February 2015 (+0 m) September 2014 (+0.3 m) November 2014 (+0.5 m)
Means Lower Mid Upper Lower Mid Upper Lower Mid Upper
Discharge (m
3.s
-1)
86.27 ± 1.46 (82.46–89.76)
83.47 ± 0.44 (82.03–84.59)
84.38 ± 0.83 (81.77–86.07)
44.92 ± 0.53 (42.90–45.81)
51.71 ± 0.87 (48.68–53.90)
49.00 ± 0.88 (46.10–51.08)
99.87 ± 0.85 (97.80–102.06)
98.96 ± 0.66 (97.01–101.14)
101.35 ± 2.55 (96.57–108.71)
Transect length (m)
149.01 ± 13.05 (113.85–193.13)
182.05 ± 13.69 (146.14–227.87)
147.71 ± 9.94 (112.21–172.72)
149.95 ± 13.06 (110.94–191.01)
182.64 ± 13.81 (146.07–226.30)
146.94 ± 9.53 (113.25–170.71)
152.09 ± 13.48 (112.17–195.56)
181.63 ± 12.68 (149.84–224.05)
151.18 ± 9.14 (119.25–175.21)
Max depth (m)
6.48 ± 0.65 (5.10–8.07)
3.96 ± 0.39 (2.80–5.15)
5.06 ± 0.59 (3.32–6.78)
6.82 ± 0.66 (5.44–8.47)
4.30 ± 0.47 (3.01–5.94)
5.21 ± 0.55 (3.67–7.06)
7.06 ± 0.67 (5.70–8.83)
4.68 ± 0.48 (3.31–6.29)
5.44 ± 0.59 (3.79–7.34)
Area (m2) 662.82 ± 15.35
(605.30–695.23) 535.86 ± 18.61
(488.49–572.41)
550.68 ± 25.80 (459.34–599.17)
704.30 ± 10.44 (675.75–729.99)
571.57 ± 16.39 (531.08–630.19)
588.40 ± 27.22 (511.17–651.07)
737.44 ± 17.82 (672.67–771.96)
614.11 ± 22.81 (550.28–684.66)
619.60 ± 22.60 (546.51–680.73)
U (m.s-1
) 0.139 ± 0.005 (0.128–0.155)
0.166 ± 0.006 (0.156–0.187)
0.167 ± 0.009 (0.148–0.201)
0.069 ± 0.000 (0.067–0.070)
0.096 ± 0.003 (0.087–0.106)
0.092 ± 0.004 (0.083–0.102)
0.146 ± 0.003 (0.139–0.155)
0.171 ± 0.005 (0.158–0.188)
0.171 ± 0.006 (0.155–0.191)
M3 (s-1
) 0.153 ± 0.017 (0.097–0.200)
0.080 ± 0.017 (0.037–0.121)
0.146 ± 0.028 (0.056–0.202)
0.148 ± 0.016 (0.095–0.195)
0.062 ± 0.025 (0.031–0.160)
0.148 ± 0.020 (0.086–0.183)
0.177 ± 0.010 (0.152–0.198)
0.113 ± 0.021 (0.051–0.161)
0.141 ± 0.020 (0.086–0.205)
M4 (s-1
) 0.072 ± 0.009 (0.050–0.096)
0.031 ± 0.005 (0.018–0.042)
0.051 ± 0.011 (0.021–0.087)
0.083 ± 0.015 (0.044–0.135)
0.033 ± 0.014 (0.015–0.087)
0.057 ± 0.011 (0.042–0.099)
0.080 ± 0.008 (0.057–0.098)
0.043 ± 0.008 (0.021–0.070)
0.058 ± 0.012 (0.037–0.106)
Reynolds number
63381 ± 5476 (45116–78142)
50231 ± 3927 (38733–62362)
62905 ± 4361 (53378–78766)
33362 ± 3484 (24644–45128)
30911 ± 2776 (22524–38504)
36983 ± 2175 (30460–43946)
73022 ± 7069 (54844–97439)
58767 ± 4084 (45306–69165)
70917 ± 5536 (59583–92087)
Froude number
0.021 ± 0.001 (0.017–0.024)
0.031 ± 0.002 (0.027–0.039)
0.028 ± 0.003 (0.022–0.039)
0.010 ± 0.001 (0.009–0.012)
0.017 ± 0.001 (0.015–0.019)
0.015 ± 0.001 (0.011–0.019)
0.021 ± 0.001 (0.019–0.024)
0.030 ± 0.001 (0.026–0.034)
0.027 ± 0.002 (0.024–0.035)

Bice, C. M. and Zampatti, B. P. (2015) Influence of weir pool raising on hydraulics in the lower River Murray
20
Table 4. Mean values (± SE) and ranges (in brackets) of hydraulic habitat metrics calculated from ADCP generated cross-sectional velocity profiles from the upper, middle and lower reaches of the Lock 1–2 weir pool in February 2015 (+0 m), September (+0.3 m) and November (+0.5 m). Metrics include measured discharge (m
3.s
-1), transect length (m), max depth (m), cross-sectional area (m
2), downstream cross-sectional
velocity (U, m.s-1
), the modified vertical circulation metric (M3, s-1
), the modified horizontal circulation metric (M4, s-1
), Reynolds number and Froude
number.
February 2015 (+0 m) September 2014 (+0.3 m) November 2014 (+0.5 m)
Means Lower Mid Upper Lower Mid Upper Lower Mid Upper
Discharge (m
3.s
-1)
75.28 ± 2.79 (66.01–81.76)
79.08 ± 0.81 (76.23–80.61)
76.26 ± 0.85 (73.09–78.02)
57.14 ± 1.68 (50.56–59.94)
49.73 ± 1.57 (44.09–53.34)
46.44 ± 0.59 (44.73–47.50)
123.01 ± 6.46 (112.92–223.38)
97.65 ± 1.51 (92.42–100.79)
95.98 ± 4.88 (85.49–114.04)
Transect length (m)
161.69 ± 17.29 (120.81–221.48)
139.57 ± 9.96 (107.96–167.66)
157.50 ± 18.30 (109.80–203.73)
163.87 ± 16.28 (121.9–219.03)
141.32 ± 9.87 (110.98–170.64)
154.56 ± 15.61 (109.27–194.9)
163.86 ± 17.78 (119.22–223.38)
139.89 ± 10.69 (105.20–169.55)
153.39 ± 15.51 (108.84–194.77)
Max depth (m)
6.89 ± 0.51 (5.63–8.16)
6.60 ± 0.83 (4.43–8.95)
3.81 ± 0.50 (2.37–4.88)
7.57 ± 0.56 (6.01–8.70)
7.05 ± 0.92 (4.68–9.68)
4.26 ± 0.53 (2.40–5.43)
7.24 ± 0.49 (6.06–8.47)
7.07 ± 0.84 (4.92–9.30)
4.37 ± 0.52 (2.64–5.56)
Area (m2) 826.41 ± 21.48
(752.71–874.42) 643.11 ± 15.84
(583.90–670.41)
399.57 ± 28.65 (301.95–477.13)
867.74 ± 33.30 (738.62–912.79)
682.56 ± 13.94 (633.22–705.81)
426.04 ± 24.70 (362.08–497.04)
906.74 ± 32.57 (780.07–950.67)
702.30 ± 22.03 (615.62–731.11)
454.54 ± 25.61 (395.03–519.90)
U (m.s-1
) 0.101 ± 0.004 (0.087–0.110)
0.132 ± 0.005 (0.124–0.153)
0.217 ± 0.018 (0.170–0.277)
0.069 ± 0.003 (0.060–0.082)
0.080 ± 0.003 (0.069–0.087)
0.117 ± 0.007 (0.103–0.140)
0.139 ± 0.008 (0.120–0.165)
0.151 ± 0.007 (0.136–0.176)
0.221 ± 0.009 (0.191–0.245)
M3 (s-1
) 0.179 ± 0.015 (0.127–0.217)
0.166 ± 0.015 (0.132–0.207)
0.104 ± 0.017 (0.061–0.147)
0.175 ± 0.007 (0.153–0.191)
0.131 ± 0.021 (0.055–0.161)
0.081 ± 0.017 (0.047–0.143)
0.191 ± 0.003 (0.182–0.200)
0.164 ± 0.009 (0.146–0.195)
0.118 ± 0.022 (0.057–0.179)
M4 (s-1
) 0.082 ± 0.010 (0.043–0.096)
0.073 ± 0.008 (0.049–0.088)
0.037 ± 0.006 (0.021–0.052)
0.100 ± 0.009 (0.068–0.117)
0.086 ± 0.017 (0.034–0.124)
0.034 ± 0.008 (0.017–0.059)
0.087 ± 0.005 (0.069–0.096)
0.076 ± 0.010 (0.043–0.105)
0.044 ± 0.007 (0.025–0.058)
Reynolds number
53344 ± 4970 (38789–66028)
62269 ± 5569 (49347–82807)
56316 ± 6030 (43019–76140)
38056 ± 4028 (27008–49575)
39193 ± 2926 (32345–49275)
33209 ± 3150 (25994–43177)
80047 ± 9681 (54004–108137)
78048 ± 7331 (58667–102941)
68014 ± 7590 (49600–87610)
Froude number
0.014 ± 0.001 (0.011–0.017)
0.020 ± 0.001 (0.018–0.021)
0.045 ± 0.008 (0.031–0.071)
0.010 ± 0.000 (0.008–0.011)
0.012 ± 0.001 (0.010–0.014)
0.023 ± 0.003 (0.018–0.033)
0.019 ± 0.001 (0.017–0.021)
0.021 ± 0.000 (0.021–0.023)
0.041 ± 0.004 (0.033–0.055)

Bice, C. M. and Zampatti, B. P. (2015) Influence of weir pool raising on hydraulics in the lower River Murray
21
3.3. Reach-scale hydraulic complexity
In the Lock 3–4 weir pool, mean velocity, Re and Fr were significantly different between
sampling events and reaches, with no interaction (Figure 5 and Table 5). Pairwise comparisons
revealed mean velocity, Re and Fr were significantly less during low discharge in September
2014 than during higher discharge in both November 2014 and February 2015, when these
metrics were comparable. Mean velocity and Fr in each reach were also significantly different,
with substantial declines from the upper reach to the middle reach, and a moderate decline
between the middle and lower reach. Re was significantly greater in the upper reach than in
both the middle and lower reaches. The circulation metrics exhibited a different pattern with no
significant difference in M3 between sampling events or reaches, but M4 was significantly
different between reaches, with greater circulation in the middle and lower reach, compared with
the upper reach.

Bice, C. M. and Zampatti, B. P. (2015) Influence of weir pool raising on hydraulics in the lower River Murray
22
Figure 5. Mean ± SE values of a) downstream cross-sectional velocity (U, m.s-1
), b) the modified vertical circulation metric (M3, s
-1), c) the modified horizontal circulation metric (M4, s
-1), d) Reynolds number (Re)
and e) Froude number (Fr) in the lower, middle and upper reaches of the Lock 1–2 (left column), Lock 2–
3 (middle column) and Lock 3–4 (right column) weir pools.
U (
m.s
-1)
0.0
0.1
0.2
0.3
0.4
0.5
M3 (
s-1
)
0.00
0.05
0.10
0.15
0.20
0.25
M4 (
s-1
)
0.00
0.02
0.04
0.06
0.08
0.10
0.12
Re
0.0
2.0e+4
4.0e+4
6.0e+4
8.0e+4
1.0e+5
1.2e+5
lower middle upper
Fr
0.00
0.02
0.04
0.06
0.08
0.10
Feb 2015 (0 m)
Sept 2014 (0.3 m)
Nov 2014 (0.5 m)
lower middle upper lower middle upper
Lock 1-2 Lock 2-3 Lock 3-4
a)
b)
c)
d)
e)

Bice, C. M. and Zampatti, B. P. (2015) Influence of weir pool raising on hydraulics in the lower River Murray
23
Table 5. Summary of two-way univariate PERMANOVA comparing downstream cross-sectional velocity (U, m.s
-1), the modified vertical circulation metric (M3, s
-1), the modified horizontal circulation metric (M4, s
-
1), Reynolds number (Re) and Froude number (Fr) between sampling events (February 2015 (+0 m),
September 2014 (+0.3 m) and November 2014 (+0.5 m)) and reaches (upper, middle, lower) in the Lock 3–4 weir pool. When significant differences occurred, pairwise comparisons were used to determine the groups that drove this difference. α = 0.05 for all analyses. Significant p-values indicated in bold.
Factor df Pseudo-F P Pairwise comparison
U
Event 2, 44 11.61 0.002 (Feb 15 = Nov 14) > Sept 14
Reach 2, 44 90.63 <0.001 Upper > middle > lower
Event x reach 4, 44 1.10 0.368 -
M3
Event 2, 44 0.37 0.694 -
Reach 2, 44 1.90 0.171 -
Event x reach 4, 44 0.65 0.605 -
M4
Event 2, 44 2.03 0.155 -
Reach 2, 44 3.42 0.049 (Middle = lower) > upper
Event x reach 4, 44 0.65 0.624 -
Re
Event 2, 44 28.66 <0.001 (Feb 15 = Nov 14) > Sept 14
Reach 2, 44 31.17 <0.001 Upper > (middle = lower)
Event x reach 4, 44 0.82 0.53 -
Fr
Event 2, 44 4.13 0.026 (Feb 15 = Nov 14) > Sept 14
Reach 2, 44 66.57 <0.001 Upper > middle > lower
Event x reach 4, 44 0.55 0.678 -
Mean velocity, Re and Fr were also significantly different between sampling events and reaches
in the Lock 2–3 weir pool, with no interaction (Figure 5 and Table 6). Pairwise comparisons
revealed mean velocities, Re and Fr were significantly less during the +0.3 m raising in
September 2014, when discharge was lowest, than during higher discharge in both November
2014 and February 2015. There was no significant difference in mean velocity, Re and Fr
between sampling during the +0.5 m raising in November 2014 and +0 m in February 2015. M3
and M4 did not differ between sampling events, but were significantly different between reaches,
with typically greater levels of circulation in the upper and lower reaches, relative to the middle
reach.

Bice, C. M. and Zampatti, B. P. (2015) Influence of weir pool raising on hydraulics in the lower River Murray
24
Table 6. Summary of two-way univariate PERMANOVA comparing downstream cross-sectional velocity (U, m.s
-1), the modified vertical circulation metric (M3, s
-1), the modified horizontal circulation metric (M4, s
-
1), Reynolds number and Froude number between sampling events (February 2015 (+0 m), September
2014 (+0.3 m) and November 2014 (+0.5 m)) and reaches (upper, middle, lower) in the Lock 2–3 weir pool. When significant differences occurred, pairwise comparisons were used to determine the groups that drove this difference. α = 0.05 for all analyses. Significant p-values indicated in bold.
Factor df Pseudo-F P Pairwise comparison
U
Event 2, 44 206.18 <0.001 (Feb 15 = Nov 14) > Sept 14
Reach 2, 44 25.91 <0.001 (Upper = middle) > lower
Event x reach 4, 44 0.12 0.977 -
M3
Event 2, 44 1.21 0.346 -
Reach 2, 44 11.80 <0.001 (Upper = lower) > middle
Event x reach 4, 44 0.57 0.678 -
M4
Event 2, 44 0.59 0.584 -
Reach 2, 44 11.90 <0.001 Lower > upper > middle
Event x reach 4, 44 0.11 0.98 -
Re
Event 2, 44 44.66 <0.001 (Feb 15 = Nov 14) > Sept 14
Reach 2, 44 4.96 0.012 (Upper = lower) > middle
Event x reach 4, 44 0.52 0.724 -
Fr
Event 2, 44 55.65 <0.001 (Feb 15 = Nov 14) > Sept 14
Reach 2, 44 21.77 <0.001 (Upper = middle) > lower
Event x reach 4, 44 0.24 0.941 -
In the Lock 1–2 weir pool, mean velocity differed significantly between sampling events and
reaches, and there was a significant interaction, indicating changes in velocity between
sampling events was not consistent across reaches (Figure 5 and Table 7). Pairwise
comparisons revealed that mean velocities in both the upper and middle reaches were similar
between November 2014 (+0.5 m) and February 2015 (+0 m), but significantly lower in
September 2014 (+0.3 m). Alternatively, velocities in the lower reach were significantly different
between all sampling events and decreased in magnitude in the following order November 2014

Bice, C. M. and Zampatti, B. P. (2015) Influence of weir pool raising on hydraulics in the lower River Murray
25
> February 2015 > September 2014. Re differed between events, but not between reaches, and
was greatest in November 2014, followed by February 2015 and then September 2014. Fr
varied between sampling events and reaches in a similar pattern to Lock 3–4, with similar Fr in
November 2014 and February 2015, and lower Fr in September 2014. Fr also decreased in a
downstream direction from upper to middle to lower reaches. As with both other weir pools, M3
and M4 did not differ between sampling events, but differed between reaches, with typically
greater circulation in the lower and middle reaches than the upper reach.
Table 7. Summary of two-way univariate PERMANOVA comparing downstream cross-sectional velocity (U, m.s
-1), the modified vertical circulation metric (M3, s
-1), the modified horizontal circulation metric (M4, s
-
1), Reynolds number and Froude number between sampling events (February 2015 (+0 m), September
2014 (+0.3 m) and November 2014 (+0.5 m)) and reaches (upper, middle, lower) in the Lock 1–2 weir pool. When significant differences occurred, pairwise comparisons were used to determine the groups that drove this difference. α = 0.05 for all analyses. Significant p-values indicated in bold.
Factor df Pseudo-F P Pairwise comparison
U
Event 2, 44 77.10 <0.001 -
Reach 2, 44 79.67 <0.001 -
Event x reach 4, 44 4.41 0.006 Upper: (Feb 15 = Nov 14) > Sept 14
Middle: (Feb 15 = Nov 14) > Sept 14
Lower: Nov 14 > Feb 15 > Sept 14
M3
Event 2, 44 2.78 0.078 -
Reach 2, 44 21.71 <0.001 Lower > middle > upper
Event x reach 4, 44 0.32 0.869 -
M4
Event 2, 44 0.78 0.473 -
Reach 2, 44 24.42 <0.001 (Lower = middle) > upper
Event x reach 4, 44 0.52 0.731 -
Re
Event 2, 44 30.27 <0.001 Nov 14 > Feb 15 > Sept 14
Reach 2, 44 1.12 0.330 -
Event x reach 4, 44 0.42 0.801 -
Fr
Event 2, 44 15.63 <0.001 (Feb 15 = Nov 14) > Sept 14
Reach 2, 44 46.73 <0.001 Upper > middle > lower
Event x reach 4, 44 2.29 0.079 -

Bice, C. M. and Zampatti, B. P. (2015) Influence of weir pool raising on hydraulics in the lower River Murray
26
Patterns of variability in hydraulic metrics between sampling events appeared consistent
between weir pools, despite raising occurring in the Lock 1–2 and Lock 2–3 weir pools. In
particular, mean velocity, Re and Fr did not differ between November 2014 and February 2014
in the Lock 3–4 weir pool, and the same result was typical of the Lock 1–2 and Lock 2–3 weir
pools, despite raising of +0.5 m during November 2014. Whilst we cannot quantitatively
compare velocities between the different weir pools, due to their underlying geomorphological
differences, Figure 6 demonstrates the change in mean velocity in each weir pool reach,
between sampling events, as x deviations from their collective mean (e.g. the mean of all cross-
sectional velocities from a weir pool reach across all sampling events). With the exception of
the lower reaches in February 2015 (Figure 6c), there was no difference in the relative change
in mean velocity between sampling events at the upper, middle and lower reaches between weir
pools (Figure 6a–c).

Bice, C. M. and Zampatti, B. P. (2015) Influence of weir pool raising on hydraulics in the lower River Murray
27
Figure 6. Change in mean downstream velocity (U, m.s-1
) in the a) upper, b) middle and c) lower reaches of the Lock 1–2, Lock 2–3 and Lock 3–4 weir pools in September 2014, November 2014 and February 2015, plotted as the number of standard deviations away from their common average (±SE).
3.4. Within site hydraulic complexity
The above analyses are suitable for determining reach-scale and weir pool-scale variability in
hydraulic conditions, but they are not suitable for determining site-scale variability in velocities
between sampling events. Figure 7 presents examples of cross-sectional velocity profiles for
sites in the upper reach of the Lock 3–4 weir pool in September 2014 (3970 ML.day-1) and
February 2015 (~7850 ML.day-1), and the presence of ‘patches’ of varying velocity within
September November February
-2
-1
0
1
2
?U
-2
-1
0
1
2
-2
-1
0
1
2
Lock 1-2
Lock 2-3
Lock 3-4
a)
b)
c)

Bice, C. M. and Zampatti, B. P. (2015) Influence of weir pool raising on hydraulics in the lower River Murray
28
individual cross-sections across sampling events. In this section we investigate how the
frequency of occurrence of patches of different velocities changed within sites between
sampling events.
Figure 7. Cross-sectional velocity profiles generated from ADCP transects undertaken at five sites in the upper reach of the Lock 3–4 weir pool in September 2014 (left column; discharge 3970 ML.day
-1) and
February 2015 (right column; discharge ~7850 ML.day-1
).
Velocities of different ‘cells’ within individual cross-sections varied between sampling events as
detailed in Figure 8, which presents the median and 10th, 25th, 75th and 90th percentile velocities
for all sites, reaches, weir pools and sampling events. The frequency distribution of velocities
from each site were compared between February 2015 (approximately +0 m in all weir pools)

Bice, C. M. and Zampatti, B. P. (2015) Influence of weir pool raising on hydraulics in the lower River Murray
29
and November 2014 (+0.5 m in Lock 1–2 and Lock 2–3, and +0 m in Lock 3–4) using the
Kolmogorov-Smirnov ‘goodness of fit test’. This test compares the ‘shape’ of a data distribution
rather than testing for differences in the mean. All transects, with the exception of those at 377
(Lock 2–3 lower) and 420 km MTD (Lock 2–3 upper), were significantly different (α = 0.05)
(Table 8).
In the Lock 3–4 weir pool, 7 of the 15 sites exhibited greater 25th to 75th percentile velocity
ranges during slightly elevated discharge in November 2014 (8231–9266 ML.day-1), relative to
February 2015 (6500–7889 ML.day-1) (Table 8). In the Lock 2–3 and Lock 1–2 weir pools, 9 of
15 sites and 12 of 15 sites, respectively, exhibited greater 25th to 75th percentile velocity ranges
in November 2014 during +0.5 m raising, relative to February 2015 at approximately +0 m. As
such, despite raising, there was greater evidence of increased velocity ranges with slightly
elevated discharge in November 2014, relative to February 2015, in the Lock 1–2 and Lock 2–3
weir pools than in the ‘unraised’ Lock 3–4 weir pool.
Bice, C. M. and Zampatti, B. P. (2015) Influence of weir pool raising on hydraulics in the lower River Murray
30
Figure 8. Box plots presenting median velocity, 25th and 75
th percentiles (enclosed box), and 10
th and 90
th percentiles (‘whiskers’) for each cross-
sectional velocity profile undertaken in the Lock 3–4, Lock 2–3 and lock 1–2 weir pools in a) February 2015 (+0 m), b) September 2014 (+0.3 m) and c) November 2014 (+0.5 m). Velocity profile location is expressed as middle thread distance (km). Discharge from the upstream weir is indicated for each weir pool during each sampling event.
-0.2
0.0
0.2
0.4
0.6
Ve
loci
ty (
m.s
-1)
-0.2
0.0
0.2
0.4
0.6
Middle thread distance (km)
300 350 400 450 500
-0.2
0.0
0.2
0.4
0.6
Lock 1 Lock 2 Lock 3 Lock 4
a)
b)
c)
Discharge: 6500 ML.day-1
Discharge: 8304 ML.day-1
Discharge: 3999-5011 ML.day-1
Discharge: 7851-7889 ML.day-1
Discharge: 8931-9266 ML.day-1
Discharge: 3970 ML.day-1
Discharge: 7183 ML.day-1
Discharge: 8231 ML.day-1
Discharge: 3999 ML.day-1

Bice, C. M. and Zampatti, B. P. (2015) Influence of weir pool raising on hydraulics in the lower River Murray
31
Table 8. 25th and 75
th percentile downstream velocity ranges (m.s
-1) for all cross-sectional velocity profiles
measured in February 2015 (+0 m), September 2014 (+0.3 m) and November 2014 (+0.5 m), and results of Kolmogorov-Smirnov ‘goodness of fit’ comparison (D statistic and p-value, α = 0.05. Significant p-values indicated in bold) between February 2015 and November 2014 data.
February 2015
(+0 m) September 2014
(+0.3 m) November 2014
(+0.5 m) Feb v Nov K-S
MTD (km) D p
278 0.033–0.162 -0.001–0.123 0.058–0.177 0.09 <0.001 279 0.025–0.149 0.005–0.135 0.067–0.201 0.20 <0.001 280 0.043–0.174 0.017–0.125 0.074–0.213 0.13 <0.001 281 0.041–0.173 0.013–0.149 0.094–0.236 0.23 <0.001 282 0.071–0.138 0.025–0.105 0.069–0.182 0.21 <0.001 310 0.096–0.169 0.053–0.107 0.101–0.194 0.15 <0.001 311 0.087–0.173 0.073–0.102 0.104–0.170 0.10 <0.001 312 0.094–0.204 0.019–0.140 0.112–0.237 0.15 <0.001 314 0.067–0.179 0.041–0.122 0.082–0.213 0.14 <0.001 316 0.063–0.187 0.015–0.125 0.086–0.218 0.12 <0.001 356 0.236–0.322 0.124–0.160 0.209–0.285 0.30 <0.001 357 0.207–0.260 0.102–0.142 0.198–0.253 0.07 <0.001 358 0.143–0.199 0.084–0.126 0.150–0.233 0.20 <0.001 359 0.139–0.245 0.061–0.154 0.173–0.289 0.22 <0.001 360 0.175–0.266 0.089–0.148 0.175–0.273 0.06 <0.001 376 0.082–0.173 0.041–0.089 0.081–0.192 0.09 <0.001 377 0.080–0.197 0.021–0.116 0.081–0.201 0.02 0.316 ns 378 0.109–0.204 0.033–0.102 0.106–0.205 0.05 <0.001 379 0.096–0.190 0.029–0.107 0.083–0.202 0.05 <0.001 380 0.061–0.197 0.006–0.134 0.082–0.214 0.09 <0.001 397 0.158–0.204 0.076–0.102 0.148–0.203 0.09 <0.001 398 0.126–0.195 0.085–0.119 0.137–0.202 0.08 <0.001 399 0.140–0.187 0.082–0.116 0.134–0.206 0.16 <0.001 400 0.120–0.201 0.075–0.101 0.115–0.204 0.04 <0.001 401 0.131–0.240 0.065–0.143 0.139–0.234 0.08 <0.001 418 0.110–0.213 0.045–0.137 0.118–0.209 0.03 0.020 419 0.101–0.193 0.051–0.126 0.116–0.199 0.10 <0.001 420 0.137–0.210 0.068–0.125 0.140–0.208 0.02 0.472 ns 421 0.089–0.221 0.019–0.143 0.101–0.242 0.06 <0.001 422 0.145–0.250 0.063–0.135 0.128–0.254 0.10 <0.001 446 0.060–0.193 0.017–0.134 0.082–0.231 0.12 <0.001 447 0.090–0.162 0.030–0.119 0.103–0.175 0.16 <0.001 448 0.091–0.192 0.041–0.137 0.076–0.204 0.07 <0.001 449 0.075–0.160 0.021–0.118 0.113–0.160 0.22 <0.001 450 0.079–0.154 0.026–0.117 0.107–0.152 0.18 <0.001 476 0.077–0.224 0.069–0.148 0.111–0.217 0.14 <0.001 477 0.113–0.222 0.068–0.159 0.129–0.219 0.06 <0.001 478 0.074–0.189 0.040–0.137 0.120–0.188 0.23 <0.001 479 0.076–0.191 0.054–0.128 0.134–0.171 0.32 <0.001 480 0.079–0.208 0.025–0.143 0.086–0.203 0.05 <0.001 510 0.432–0.516 0.307–0.423 0.452–0.571 0.25 <0.001 511 0.400–0.530 0.202–0.346 0.319–0.484 0.21 <0.001 512 0.381–0.471 0.246–0.319 0.398–0.488 0.13 <0.001 513 0.317–0.466 0.211–0.306 0.328–0.477 0.06 <0.001 514 0.145–0.302 0.084–0.217 0.155–0.323 0.07 <0.001

Bice, C. M. and Zampatti, B. P. (2015) Influence of weir pool raising on hydraulics in the lower River Murray
32
4. DISCUSSION
Hydraulic conditions (i.e. depth, flow velocity and turbulence) have a great influence on
ecological patterns and processes in riverine ecosystems. The use of weir pool manipulations
(i.e. water level raising) to achieve environmental outcomes in the lower River Murray is
becoming increasingly common; nonetheless, there remains a need to quantify the
impact/benefit of weir pool manipulations on the within-channel hydraulic environment. The
current study aimed to determine the influence of a +0.5 m water level raising in the Lock 1–2
and Lock 2–3 weir pools in spring 2014, by generating cross-sectional velocity profiles and
calculating a range of hydraulic metrics, and comparing spatio-temporal variability in these
parameters with the Lock 3–4 weir pool, in which no water level manipulation occurred. Patterns
of temporal variability in hydraulic metrics were consistent across weir pools, raised and
unraised, with little significant difference between periods of similar discharge in November
2014 (8231–9266 ML.day-1) and February 2015 (6500–7889 ML.day-1). These results suggest
that weir pool raising in the Lock 1–2 and Lock 2–3 weir pools had negligible impact on within
channel hydraulics at the discharges investigated. Additionally, the current study has
documented important spatial differences in the physical nature and hydraulic environment
between, and within weir pools. The results of the study are discussed in the context of their
implications for future weir pool manipulations.
Mean downstream velocity, as well as metrics that indicate the level of turbulence (Reynolds
number) and ‘rapidly’ flowing water (Froude number) in cross-sectional velocity profiles were
similar in November 2014 and February 2015, but significantly lower in September 2014, in all
weir pools. Furthermore, the magnitude of temporal change in mean downstream velocity was
similar between the raised and unraised weir pools. At a site-scale, velocity distributions were
significantly different between November 2014 and February 2015, but consistently exhibited
greater ranges during slightly greater discharge across all weir pools in November 2014. In
contrast, the circulation metrics indicated no significant change in the frequency and strength of
eddies in the vertical and horizontal planes between sampling events, suggesting the metrics
may be insensitive to variability in discharge of the magnitude experienced in the current study.
Substantial spatial variability in hydraulics was observed both within and between the three weir
pools, and these differences were consistent across sampling events. Typically, wetted width,
depth and cross-sectional area increased in a downstream direction, with proximity to the
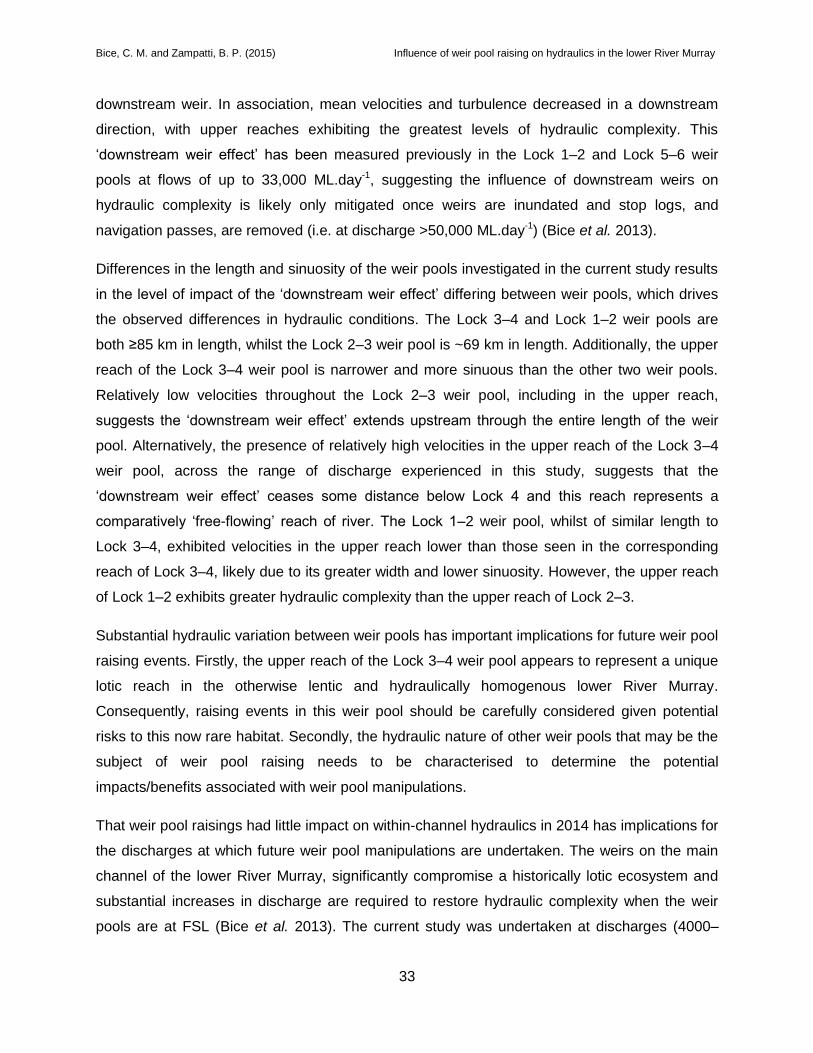
Bice, C. M. and Zampatti, B. P. (2015) Influence of weir pool raising on hydraulics in the lower River Murray
33
downstream weir. In association, mean velocities and turbulence decreased in a downstream
direction, with upper reaches exhibiting the greatest levels of hydraulic complexity. This
‘downstream weir effect’ has been measured previously in the Lock 1–2 and Lock 5–6 weir
pools at flows of up to 33,000 ML.day-1, suggesting the influence of downstream weirs on
hydraulic complexity is likely only mitigated once weirs are inundated and stop logs, and
navigation passes, are removed (i.e. at discharge >50,000 ML.day-1) (Bice et al. 2013).
Differences in the length and sinuosity of the weir pools investigated in the current study results
in the level of impact of the ‘downstream weir effect’ differing between weir pools, which drives
the observed differences in hydraulic conditions. The Lock 3–4 and Lock 1–2 weir pools are
both ≥85 km in length, whilst the Lock 2–3 weir pool is ~69 km in length. Additionally, the upper
reach of the Lock 3–4 weir pool is narrower and more sinuous than the other two weir pools.
Relatively low velocities throughout the Lock 2–3 weir pool, including in the upper reach,
suggests the ‘downstream weir effect’ extends upstream through the entire length of the weir
pool. Alternatively, the presence of relatively high velocities in the upper reach of the Lock 3–4
weir pool, across the range of discharge experienced in this study, suggests that the
‘downstream weir effect’ ceases some distance below Lock 4 and this reach represents a
comparatively ‘free-flowing’ reach of river. The Lock 1–2 weir pool, whilst of similar length to
Lock 3–4, exhibited velocities in the upper reach lower than those seen in the corresponding
reach of Lock 3–4, likely due to its greater width and lower sinuosity. However, the upper reach
of Lock 1–2 exhibits greater hydraulic complexity than the upper reach of Lock 2–3.
Substantial hydraulic variation between weir pools has important implications for future weir pool
raising events. Firstly, the upper reach of the Lock 3–4 weir pool appears to represent a unique
lotic reach in the otherwise lentic and hydraulically homogenous lower River Murray.
Consequently, raising events in this weir pool should be carefully considered given potential
risks to this now rare habitat. Secondly, the hydraulic nature of other weir pools that may be the
subject of weir pool raising needs to be characterised to determine the potential
impacts/benefits associated with weir pool manipulations.
That weir pool raisings had little impact on within-channel hydraulics in 2014 has implications for
the discharges at which future weir pool manipulations are undertaken. The weirs on the main
channel of the lower River Murray, significantly compromise a historically lotic ecosystem and
substantial increases in discharge are required to restore hydraulic complexity when the weir
pools are at FSL (Bice et al. 2013). The current study was undertaken at discharges (4000–

Bice, C. M. and Zampatti, B. P. (2015) Influence of weir pool raising on hydraulics in the lower River Murray
34
9000 ML.day-1) similar to the range of ‘entitlement flows’ (4000–7000 ML.day-1) in the lower
River Murray and it appears, that under such discharge, the existing impact of the weirs on
hydraulic complexity overshadows any influence of a further +0.5 m raising of water levels.
Nevertheless, raising events may reduce hydraulic complexity, relative to +0 m FSL, if
undertaken at higher discharges, when the existing impact of the weirs is reduced.
Discharges at which ecologically relevant hydraulic complexity is restored are uncertain, partly
due to limited understanding of explicit links between hydraulics and ecological processes and
patterns. Nonetheless, hypotheses can be developed from biological data collected in
association with variable discharge, including fish spawning and larval drift. Golden perch
(Macquaria ambigua ambigua) and silver perch (Bidyanus bidyanus) are the only fish species in
the lower Murray known to be stimulated to spawn by elevated discharge, and the eggs and
larvae of both species undergo an obligate drifting stage (Mallen-Cooper and Stuart 2003,
Tonkin et al. 2007, Zampatti and Leigh 2013). Fish are likely to perceive and thus respond to
changes in discharge through changes in hydraulics, whilst specific hydraulics (e.g. velocity and
turbulence) are likely required to facilitate the suspension of larvae and downstream drift
(Dudley and Platania 2007). Evidence of spawning of golden perch and silver perch, and indeed
recruitment to young-of-year, is typically only observed in the lower River Murray following
discharges >15,000 ML.day-1 that coincide with temperature thresholds (Zampatti and Leigh
2013).
Evidence of spawning and recruitment of golden perch and silver perch in association with
within-channel flow events of >15,000 ML.day-1 suggests ecologically relevant hydraulic
complexity, in regards to flow-cued spawning fish species, may be restored to the lower River
Murray at these flows. As such, any potential for impacts to hydraulic complexity and resulting
ecological processes, should be considered and evaluated when planning weir pool
manipulations at such discharges. Nonetheless, it is likely that the discharge at which
ecologically relevant hydraulic complexity is restored will differ between weir pools given the
geomorphological differences between weir pools and the inter-weir pool hydraulic variation
detected in this study. This is a priority for future research together with investigations of the
explicit link between ecological processes (e.g. fish spawning) and hydraulics.

Bice, C. M. and Zampatti, B. P. (2015) Influence of weir pool raising on hydraulics in the lower River Murray
35
5. CONCLUSION
Raising the water level within the Lock 1–2 and Lock 2–3 weir pools in spring 2014 had little
impact on the within-channel hydraulic environment, with consistent patterns of temporal
variability in hydraulic metrics between these weir pools and the ‘unraised’ Lock 3–4 weir pool.
Accordingly, future raisings of the Lock 1–2 and Lock 2–3 weir pools at discharges
≤9000 ML.day-1 are unlikely to have a significant impact on within-channel hydraulics.
Alternatively, raising weir pools at discharges of 10,000–20,000 ML.day-1 may present risks to
ecologically important hydrodynamics, necessitating rigorous monitoring of any such events to
assess impact. Ultimately, the influence of weir pool manipulations on hydraulic complexity and
concomitant benefits/impacts to riverine biota, over a range of discharges from entitlement to
bank-full, requires further quantification.
The current study demonstrated that there are substantial physical and hydraulic differences
between weir pools, and thus, the potential for differences in the impact/benefit of weir pool
manipulations. The upper reach of the Lock 3–4 weir pool exhibits considerable hydraulic
complexity, representing a rare reach of free-flowing river in the regulated lower River Murray.
Raising events in this weir pool may have considerable impact.
Future weir pool manipulations (i.e. raisings and lowerings) will be greatly informed by
hypothesis-driven research and monitoring investigating ecological response (e.g. productivity,
reproduction, recruitment) to weir pool raisings. Furthermore, the application of weir pool
lowerings should be investigated, given the potential to restore lotic habitats and promote
hydraulic complexity. Ultimately, a future weir pool manipulation program that is integrated with
broader riverine rehabilitation programs (e.g. environmental flow delivery), is planned over a
long-term (> 10 years), incorporates both raising and lowering, and considers both potential
risks (e.g. loss of hydraulic complexity) and benefits (e.g. recruitment of flood-dependent
vegetation) in a spatial and hydrological context (i.e. where and at what discharges
manipulations are undertaken) is likely to elicit the greatest ecological benefit.

Bice, C. M. and Zampatti, B. P. (2015) Influence of weir pool raising on hydraulics in the lower River Murray
36
REFERENCES
Anderson, M. J., Gorley R. N. and Clarke K. R. (2008). PERMANOVA+ for PRIMER: Guide to Software and Statistical Methods, PRIMER-E: Plymouth, UK.
Basu, B. K. and Pick F. R. (1996). Factors regulating phytoplankton and zooplankton biomass in temperate rivers. Limnology and Oceanography 41: 1572-1577.
Bice, C. M., Leigh S. L., Nicol J. M. and Zampatti B. P. (2013). Changes in hydraulic complexity in the lower River Murray main channel in relation to flow variability. South Australian Research and Development Institute (Aquatic Sciences), Adelaide. SARDI Publication No. F2013/000214-1. SARDI Research Report Series No. 709. 32 pp.
Bice, C. M., Zampatti B. P., Aldridge K. A., Furst D., Kilsby N. N., Maxwell S., Nicol J., Oliver R., Rogers D., Turner R. and Wallace T. (2014). An assessment of the knowledge requirements to support effective provisions of environmental water in the South Australian Murray-Darling Basin: Part 2 – Development of hydro-ecological conceptual models and identification of knowledge gaps in current understanding of flow‒biota relationship. Prepared by the South Australian Research and Development Institute (Aquatic Sciences) for the Goyder Institute for Water Research. Goyder Institute for Water Research Technical Report Series No 14/18. .
Biggs, B. J. F., Nikora V. I. and Snelder T. H. (2005). Linking scales of flow variability to lotic ecosystem structure and function. Regulated Rivers: Research & Mangement 21: 283-298.
Blanch, S. J., Walker K. F. and Ganf G. G. (2000). Water regimes and littoral plants in four weir pools of the River Murray, Australia. Regulated Rivers: Research & Mangement 16: 445-456.
Bunn, S. E. and Arthington A. H. (2002). Basic principles and ecological consequences of altered flow regimes for aquatic biodiversity. Environmental Management 30: 492-507.
Crowder, D. W. and Diplas P. (2000). Evaluating spatially explicit metrics of stream energy gradients using hydrodynamic model simulations. Canadian Journal of Fisheries and Aquatic Sciences 57: 1497-1507.
Crowder, D. W. and Diplas P. (2002). Vorticity and circulation: spatial metrics for evaluating flow complexity in stream habitats. Canadian Journal of Fisheries and Aquatic Sciences 59: 633-645.
de Nooij, R. J. W., Verberk W. C. E. P., Lenders H. J. R., Leuven R. S. E. W. and Nienhuis P. H. (2006). The importance of hydrodynamics for protected and endangered biodiversity of lowland rivers. Hydrobiologia 565: 153-162.
DEWNR (2015). DEWNR Unpublished Data.

Bice, C. M. and Zampatti, B. P. (2015) Influence of weir pool raising on hydraulics in the lower River Murray
37
Dudley, R. K. and Platania S. P. (2007). Flow regulation and fragmentation imperil pelagic-spawning riverine fishes. Ecological Applications 17: 2074-2086.
Dyer, F. J. and Thoms M. C. (2006). Managing river flows for hydraulic diversity: an example from an upland regulated gravel-bed river. Regulated Rivers: Research & Mangement 22: 257-267.
Gordon, N. D., McMahon T. A., Finlayson B. L., Gippel C. J. and Nathan R. J. (2004). Stream Hydrology: An Introduction for Ecologists, John Wiley & Sons Ltd, Chichester.
Kilsby, N. N. (2008). Reach-scale spatial hydraulic diversity in lowland rivers: characterisation, measurement and significance for fish. PhD Thesis. School of Earth and Environmental Sciences, and School of Civil, Environmental and Mining Engineering, The University of Adelaide.
Lamouroux, N. and Souchon Y. (2002). Simple predictions of instream habitat model outputs for fish habitat guilds in large streams. Freshwater Biology 47: 1531-1542.
Maheshwari, B. L., Walker K. F. and McMahon T. A. (1995). Effects of regulation on the flow regime of the River Murray, Australia. Regulated Rivers: Research & Management 10: 15-38.
Mallen-Cooper, M. and Stuart I. G. (2003). Age, growth and non-flood recruitment of two potamodromous fishes in a large semi-arid/temperate river system. River Research and Applications 19: 697-719.
Mallen-Cooper, M., Zampatti B., Hillman T., King A., Koehn J., Saddlier S., Sharpe S. and Stuart I. (2011). Managing the Chowilla Creek Environmental Regulator for Fish Species at Risk. Report prepared for the South Australian Murray-Darling Basin Natural Resources Management Board. 128pp.
Poff, N. L., Allan J. D., Bain M. B., Karr J. R., Prestegaard K. L., Richter B. D., Sparks R. E. and Stromberg J. C. (1997). The natural flow regime: A paradigm for river conservation and restoration. Bioscience 47: 769-784.
Sheldon, F. and Walker K. F. (1997). Changes in biofilms induced by flow regulation could explain extinctions of aquatic snails in the lower River Murray, Australia. Hydrobiologia 347: 97-108.
Shields, F. D. and Rigby J. R. (2005). River habitat quality from river velocities measured using acoustic doppler current profiler. Environmental Management 36: 565-575.

Bice, C. M. and Zampatti, B. P. (2015) Influence of weir pool raising on hydraulics in the lower River Murray
38
The MathsWorks Inc (2010). MATLAB version 7.10.0. Natick, Massachusetts.
Tonkin, Z., King A., Mahoney J. and Morrongiello J. (2007). Diel and spatial drifting patterns of silver perch Bidyanus bidyanus eggs in an Australian lowland river. Journal of Fish Biology 70: 313-317.
Walker, K. F., Boulton A. J., Thoms M. C. and Sheldon F. (1994). Effects of water-level changes induced by weirs on the distribution of littoral plants along the River Murray, South Australia. Australian Journal of Marine and Freshwater Research 45: 1421-1438.
Walker, K. F. and Thoms, M. C. (1993). Environmental effects of flow regulation on the lower River Murray, Australia. Regulated Rivers: Research & Management 8: 103-119.
Zampatti, B. P. and Leigh S. J. (2013). Within-channel flows promote spawning and recruitment of golden perch, Macquaria ambigua ambigua – implications for environmental flow management in the River Murray, Australia. Marine and Freshwater Research 64: 618-630.