the informal economy in puerto rico
DESCRIPTION
TRANSCRIPT
August 9, 2012
Ave. Domenech 113, Hato Rey, Puerto Rico, 00918-3501 Tel. (787) 751-1675 • Fax (787) 767-2117 Apartado 12144, San Juan, Puerto Rico, 0 0 9 1 4 - 0 1 4 4 e studiostecnicos@estudios-tecnicos. c o m
Table of Content
Background on the economy
Estimates of the size of the informal economy: Introduction
International comparisons
Estimates
The informal economy and personal consumption
Sources consulted
2
3
Background on the economy …
4.0%
2.6%
0.7%
3.6%
2.2%
3.4%
1.8%
-1.5% -1.5%
2.4% 3.0%
2.4%
3.7%
2.5%
4.0%
2.9%
1.2%
2.9%
1970-75 1975-80 1980-85 1985-90 1990-95 1995-00 2000-05 2005-10 2011
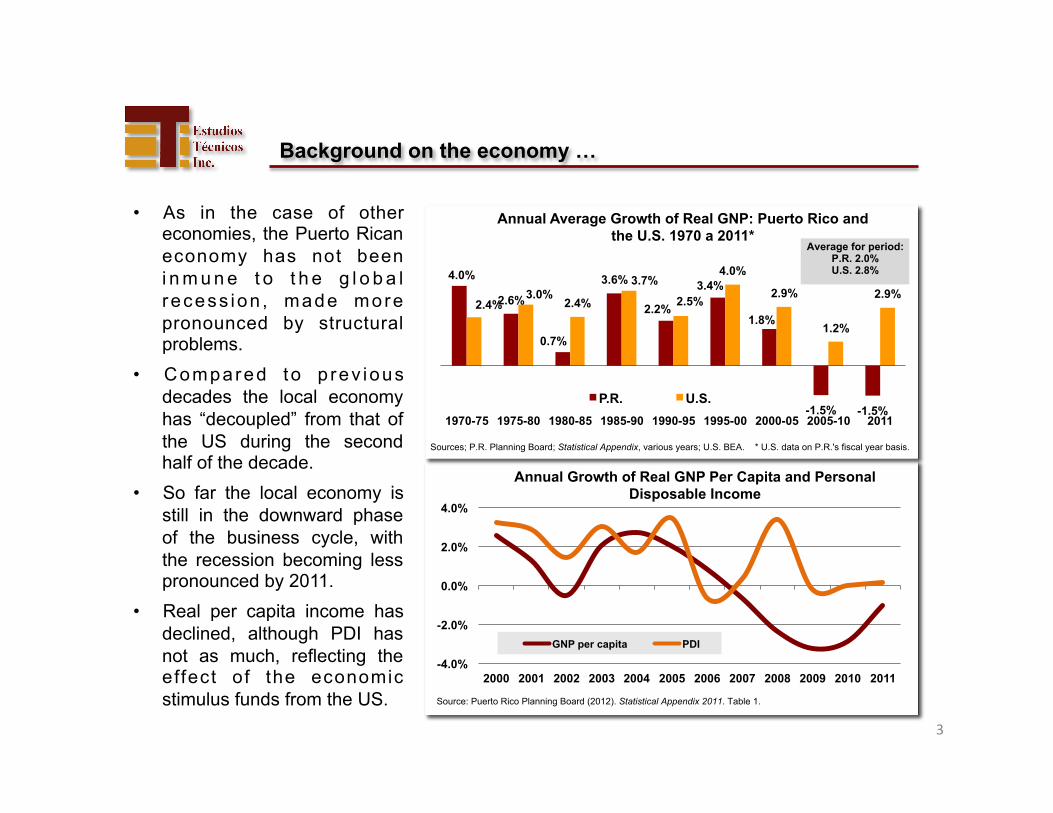
Annual Average Growth of Real GNP: Puerto Rico and the U.S. 1970 a 2011*
P.R. U.S.
Average for period: P.R. 2.0% U.S. 2.8%
Sources; P.R. Planning Board; Statistical Appendix, various years; U.S. BEA. * U.S. data on P.R.'s fiscal year basis.
-4.0%
-2.0%
0.0%
2.0%
4.0%
2000 2001 2002 2003 2004 2005 2006 2007 2008 2009 2010 2011
Annual Growth of Real GNP Per Capita and Personal Disposable Income
GNP per capita PDI
Source: Puerto Rico Planning Board (2012). Statistical Appendix 2011. Table 1.
• As in the case of other economies, the Puerto Rican economy has not been i n m u n e t o t h e g l o b a l recess ion , made more pronounced by structural problems.
• Compared to p rev ious decades the local economy has “decoupled” from that of the US during the second half of the decade.
• So far the local economy is still in the downward phase of the business cycle, with the recession becoming less pronounced by 2011.
• Real per capita income has declined, although PDI has not as much, reflecting the effect of the economic stimulus funds from the US.
4
Background on the economy …
10 11 12 13 14 15 16 17 18
2005
Feb-
09
Jul-0
9
Dec
-09
May
-10
Oct
-10
Mar
-11
Aug
-11
Jan-
12
Jun-
12
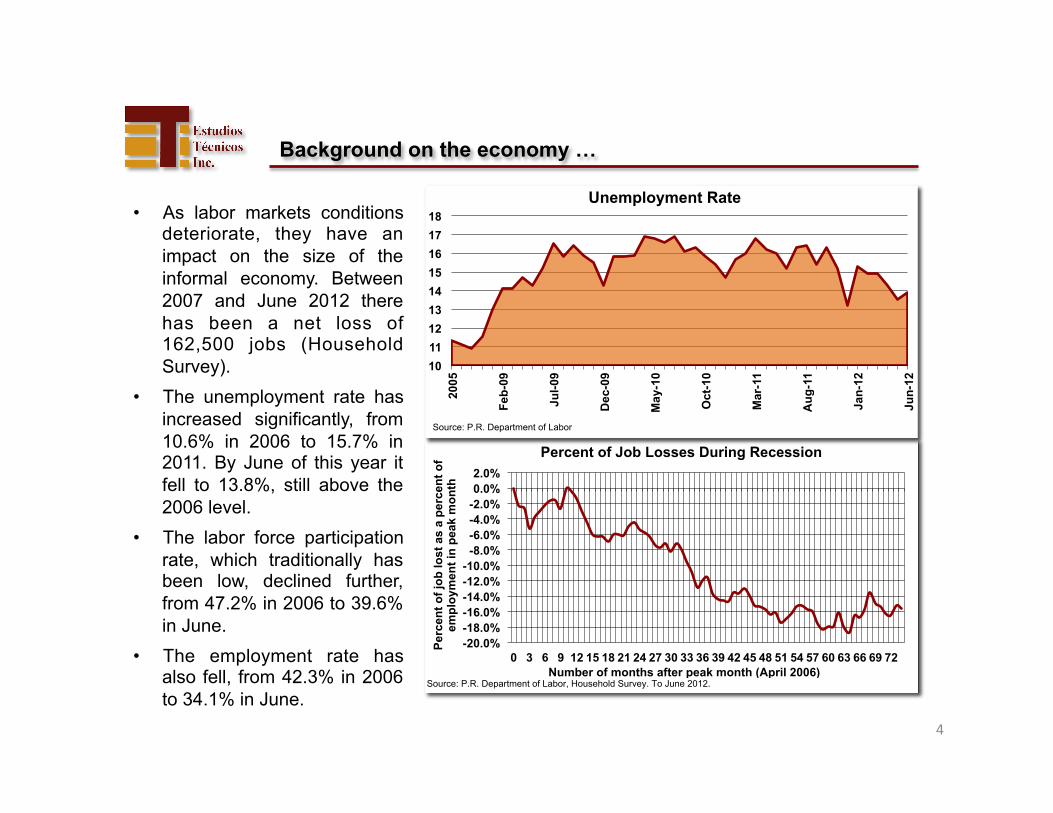
Unemployment Rate
Source: P.R. Department of Labor
-20.0% -18.0% -16.0% -14.0% -12.0% -10.0% -8.0% -6.0% -4.0% -2.0% 0.0% 2.0%
0 3 6 9 12 15 18 21 24 27 30 33 36 39 42 45 48 51 54 57 60 63 66 69 72
Percent of Job Losses During Recession Pe
rcen
t of j
ob lo
st a
s a
perc
ent o
f em
ploy
men
t in
peak
mon
th
Number of months after peak month (April 2006) Source: P.R. Department of Labor, Household Survey. To June 2012.
• As labor markets conditions deteriorate, they have an impact on the size of the informal economy. Between 2007 and June 2012 there has been a net loss of 162,500 jobs (Household Survey).
• The unemployment rate has increased significantly, from 10.6% in 2006 to 15.7% in 2011. By June of this year it fell to 13.8%, still above the 2006 level.
• The labor force participation rate, which traditionally has been low, declined further, from 47.2% in 2006 to 39.6% in June.
• The employment rate has also fell, from 42.3% in 2006 to 34.1% in June.
5
Estimates of the size of the informal economy
The informal or underground economy in Puerto Rico has been the subject of study since the early 1980’s. As in the case of similar studies worldwide, different approaches and areas were measured, mostly that of tax evasion of individuals. The most recent studies on the subject are those undertaken by Estudios Técnicos, Inc. (ETI) in 2004 and 2010. The first study covers the period 1980-2002, while the second study extends it to 2009. About the same time, two comparative studies by F. Schneider (2004; 2006) on the size of the shadow economy worldwide included Puerto Rico for the first time, among Latin America and the Caribbean economies. The studies applied two methods: the Dynamic Multiple Indicators Multiple Causes approach, and that of currency demand, for the period 1999-2003. In tables 1 and 2 below, we present a comparative summary of the estimates of ETI, Schneider, and of other studies by country and region, including Puerto Rico. In the first study by ETI, a basic methodological approach was used, that of differences in the labor force participation rate. In the 2010 study, which updates that of 2004, three methods were used: the physical inputs approach (the M. Lackó method), that of discrepancies in the labor force participation rate, and a structural approach using MIMIC (multiple indicators multiple causes). Another estimate (in the case of individuals) was developed, that of the tax gap, that is, the proportion of potential tax revenues from individuals not received as a result of informal activity (does not include the ilegal part), for the period 2000-2009. Tables 4 and 5 below, and Figure 1 presents the estimates from the different approaches by ETI. A very important point to take into consideration, when examining and comparing estimates of informal activity, very much emphasized in the literature, is that no single method or approach is better than the other. Each one has its advantages and disadvantages.
Introduction
6
Estimates of the size of the informal economy
International comparisons
Table 1
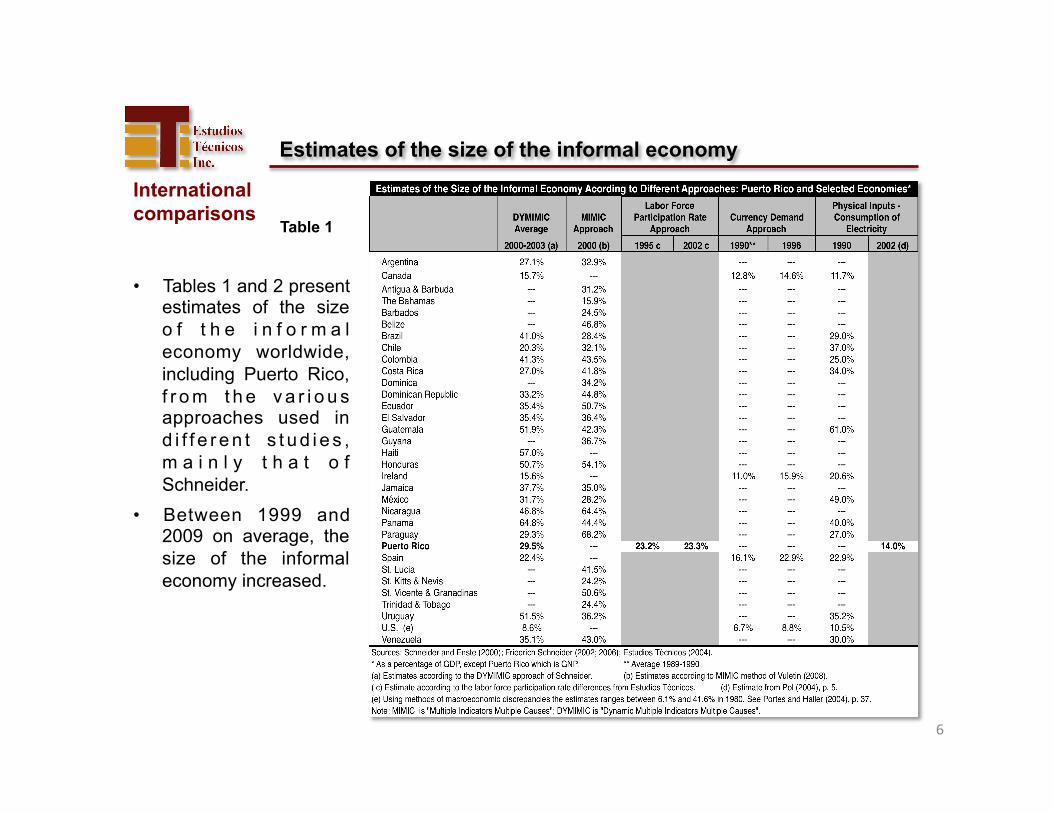
• Tables 1 and 2 present estimates of the size o f t h e i n f o r m a l economy worldwide, including Puerto Rico, f r o m t h e v a r i o u s approaches used in d i f f e r e n t s t u d i e s , m a i n l y t h a t o f Schneider.
• Between 1999 and 2009 on average, the size of the informal economy increased.
7
Estimates of the size of the informal economy
Table 2 International comparisons
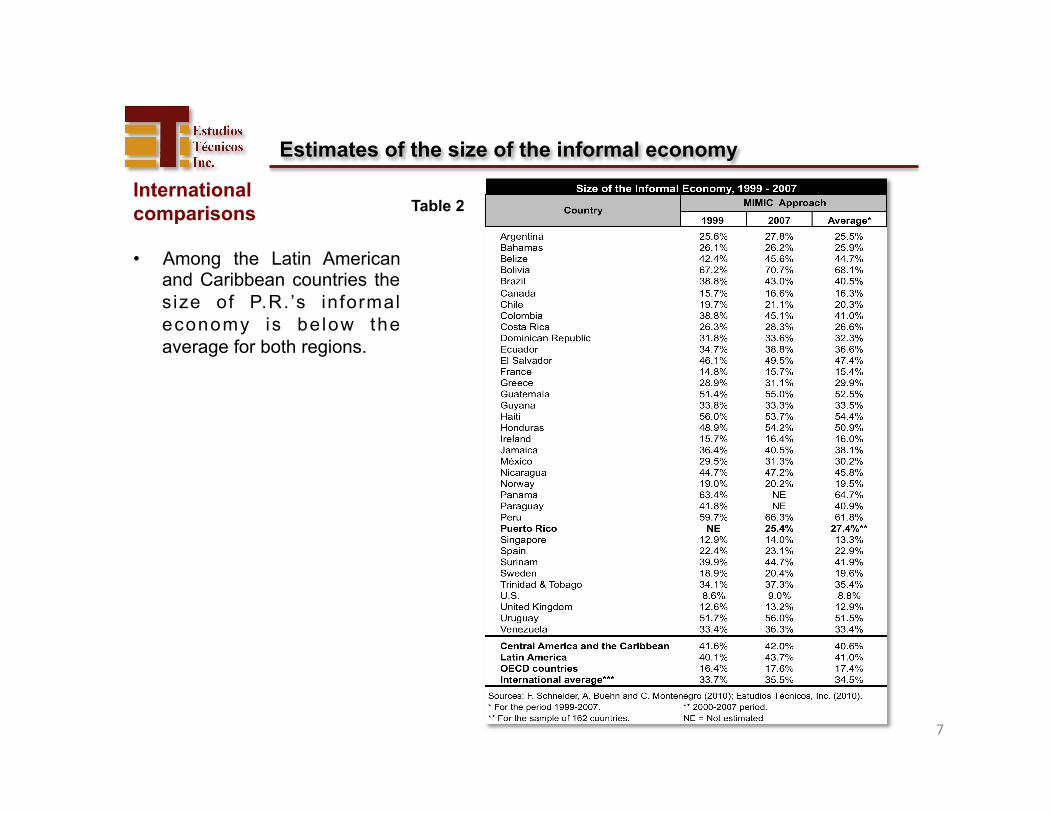
• Among the Latin American and Caribbean countries the size of P.R. ’s informal economy is be low the average for both regions.
8
Estimates of the size of the informal economy
Estimates
Table 3 Table 4 Estimates of the Size of the Informal Economy of
Puerto Rico According to Different Methods*
Year
Physical Inputs (Lackó
method) Discrepancies
in LFPR MIMIC
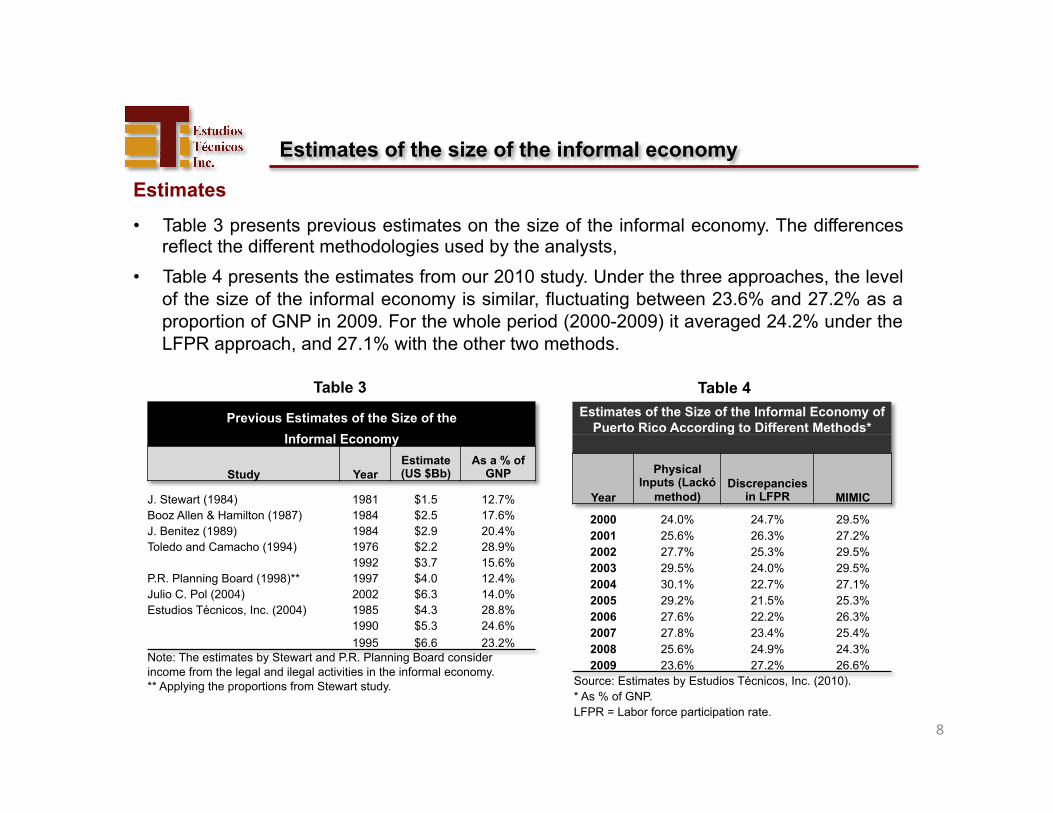
2000 24.0% 24.7% 29.5% 2001 25.6% 26.3% 27.2% 2002 27.7% 25.3% 29.5% 2003 29.5% 24.0% 29.5% 2004 30.1% 22.7% 27.1% 2005 29.2% 21.5% 25.3% 2006 27.6% 22.2% 26.3% 2007 27.8% 23.4% 25.4% 2008 25.6% 24.9% 24.3% 2009 23.6% 27.2% 26.6%
Source: Estimates by Estudios Técnicos, Inc. (2010). * As % of GNP. LFPR = Labor force participation rate.
• Table 3 presents previous estimates on the size of the informal economy. The differences reflect the different methodologies used by the analysts,
• Table 4 presents the estimates from our 2010 study. Under the three approaches, the level of the size of the informal economy is similar, fluctuating between 23.6% and 27.2% as a proportion of GNP in 2009. For the whole period (2000-2009) it averaged 24.2% under the LFPR approach, and 27.1% with the other two methods.
Previous Estimates of the Size of the Informal Economy
Study Year Estimate (US $Bb)
As a % of GNP
J. Stewart (1984) 1981 $1.5 12.7% Booz Allen & Hamilton (1987) 1984 $2.5 17.6% J. Benitez (1989) 1984 $2.9 20.4% Toledo and Camacho (1994) 1976 $2.2 28.9%
1992 $3.7 15.6% P.R. Planning Board (1998)** 1997 $4.0 12.4% Julio C. Pol (2004) 2002 $6.3 14.0% Estudios Técnicos, Inc. (2004) 1985 $4.3 28.8%
1990 $5.3 24.6% 1995 $6.6 23.2% Note: The estimates by Stewart and P.R. Planning Board consider income from the legal and ilegal activities in the informal economy. ** Applying the proportions from Stewart study.
9
Estimates of the size of the informal economy
Estimates
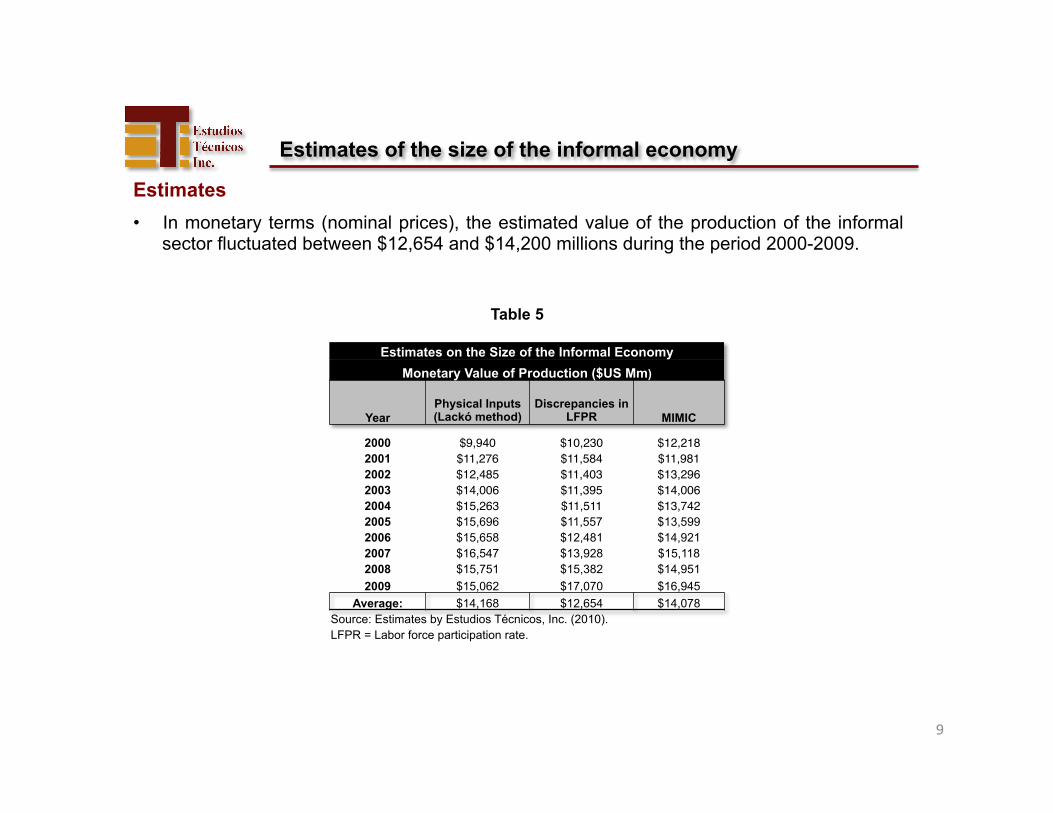
Table 5
Estimates on the Size of the Informal Economy Monetary Value of Production ($US Mm)
Year Physical Inputs (Lackó method)
Discrepancies in LFPR MIMIC
2000 $9,940" $10,230" $12,218"2001 $11,276" $11,584" $11,981"2002 $12,485" $11,403" $13,296"2003 $14,006" $11,395" $14,006"2004 $15,263" $11,511" $13,742"2005 $15,696 $11,557 $13,599 2006 $15,658 $12,481 $14,921 2007 $16,547 $13,928 $15,118 2008 $15,751 $15,382 $14,951 2009 $15,062 $17,070 $16,945
Average: $14,168 $12,654 $14,078 Source: Estimates by Estudios Técnicos, Inc. (2010). LFPR = Labor force participation rate.
• In monetary terms (nominal prices), the estimated value of the production of the informal sector fluctuated between $12,654 and $14,200 millions during the period 2000-2009.
10
Estimates of the size of the informal economy
Estimates
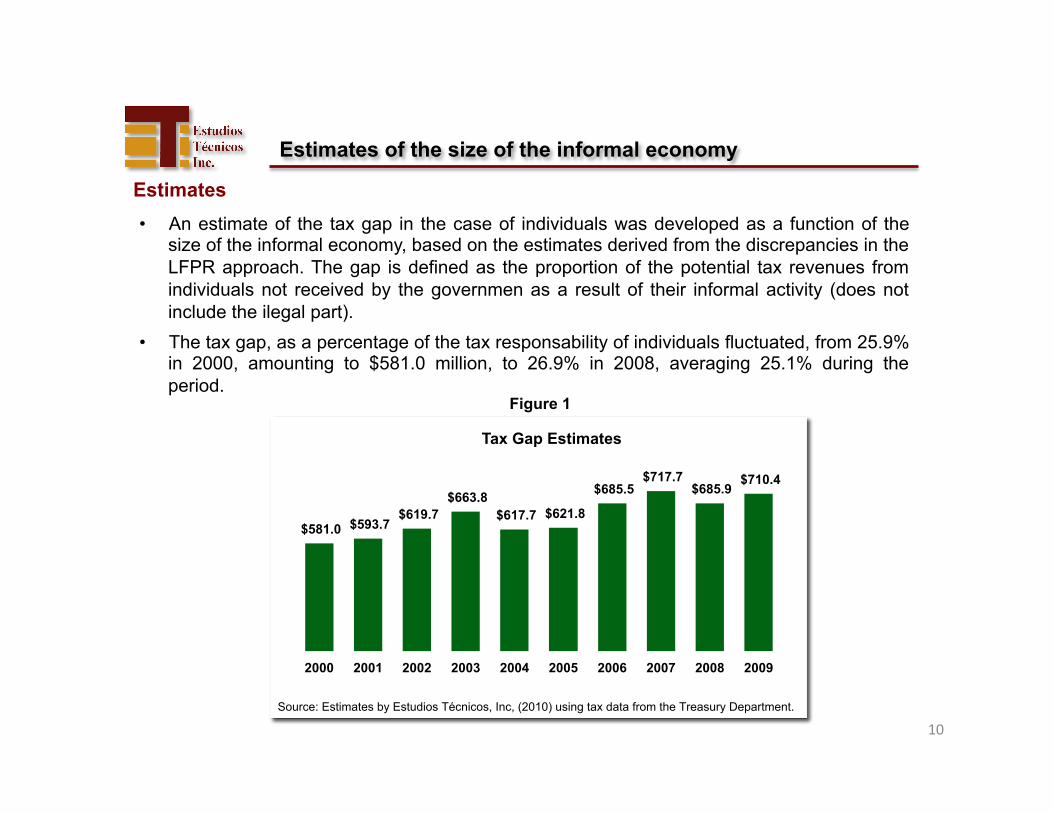
Figure 1
$581.0 $593.7 $619.7
$663.8 $617.7 $621.8
$685.5 $717.7
$685.9 $710.4
2000 2001 2002 2003 2004 2005 2006 2007 2008 2009
Tax Gap Estimates
Source: Estimates by Estudios Técnicos, Inc, (2010) using tax data from the Treasury Department.
• An estimate of the tax gap in the case of individuals was developed as a function of the size of the informal economy, based on the estimates derived from the discrepancies in the LFPR approach. The gap is defined as the proportion of the potential tax revenues from individuals not received by the governmen as a result of their informal activity (does not include the ilegal part).
• The tax gap, as a percentage of the tax responsability of individuals fluctuated, from 25.9% in 2000, amounting to $581.0 million, to 26.9% in 2008, averaging 25.1% during the period.
11
Estimates of the size of the informal economy
The informal economy and personal consumption
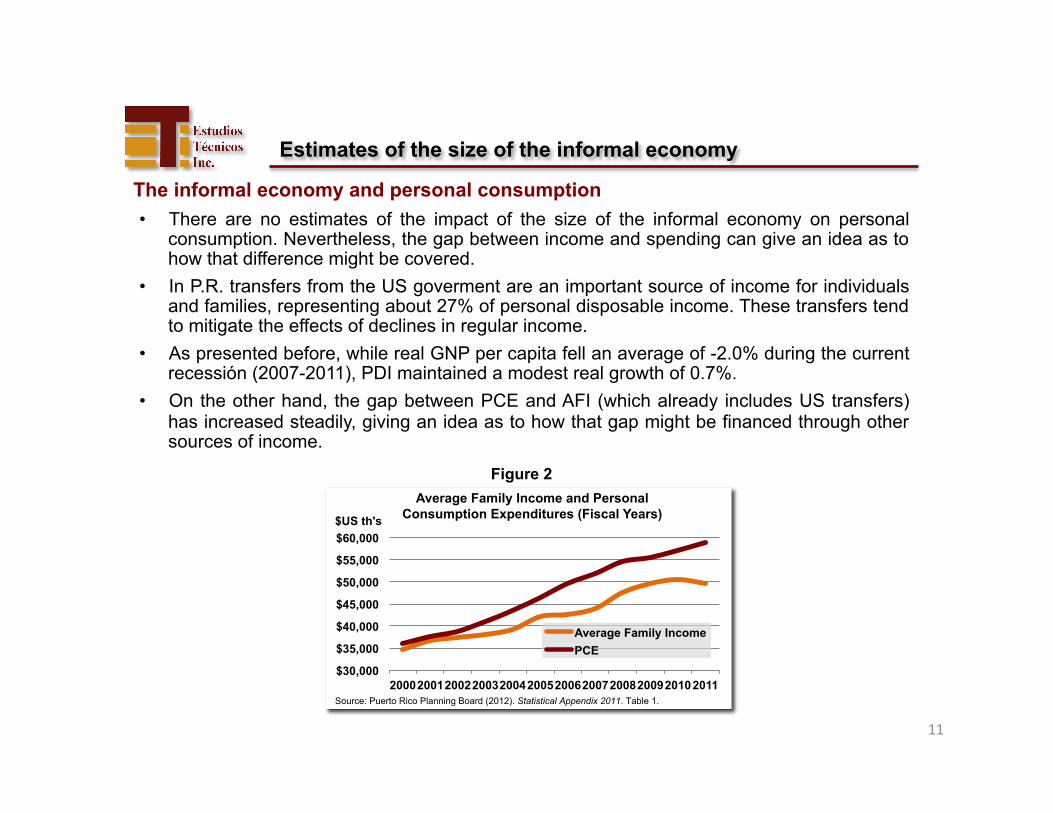
Figure 2
• There are no estimates of the impact of the size of the informal economy on personal consumption. Nevertheless, the gap between income and spending can give an idea as to how that difference might be covered.
• In P.R. transfers from the US goverment are an important source of income for individuals and families, representing about 27% of personal disposable income. These transfers tend to mitigate the effects of declines in regular income.
• As presented before, while real GNP per capita fell an average of -2.0% during the current recessión (2007-2011), PDI maintained a modest real growth of 0.7%.
• On the other hand, the gap between PCE and AFI (which already includes US transfers) has increased steadily, giving an idea as to how that gap might be financed through other sources of income.
$30,000
$35,000
$40,000
$45,000
$50,000
$55,000
$60,000
2000 2001 2002 2003 2004 2005 2006 2007 2008 2009 2010 2011
Average Family Income and Personal Consumption Expenditures (Fiscal Years)
Average Family Income PCE
Source: Puerto Rico Planning Board (2012). Statistical Appendix 2011. Table 1.
$US th's
12
Sources consulted
• Autoridad de Energía Eléctrica de Puerto Rico (2010). Serie facturación mensual consumo de energía eléctrica residencial. Department of Statistics and Forecasts (July 8th).
• Alejandro Portes y William Haller (2004). La Economía Informal. CEPAL, Serie Políticas Sociales #100, División de Desarrollo Social, Santiago de Chile (November). At www.eclac.org/publicaciones/xml/5/20845/sps100_lcl2218.pdf.
• Booz-Allen & Hamilton (1987). Final Report on the Tax Reform Program. Prepared for the Department of the Treasury, Commonwealth of Puerto Rico. Washington D.C. (February).
• Daniel Mitchell (2007). “The Tax Gap Mirage”, Tax & Budget Bulletin, Cato Institute No. 44 (March). At http://www.cato.org/pubs/tbb/tbb_0306-44.pdf.
• David Giles (1998). The Underground Economy: Minimizing the Size of Government. Vancouver, The Fraser Institute, Canadá. At www.fraserinstitute.org/.../HowtoUseFiscalSurplusUndergroundEconomy.pdf.
• David Giles y B. Johnson (1999a). “Taxes, Risk Aversion, and the Size of the Underground Economy: A Nonparametric Analysis with the New Zealand Data.” Econometrics Working Paper EWP 9910, University of Victoria, Canadá. Athttp://web.uvic.ca/econ/research/papers/pdfs/ewp9910.pdf.
• David Giles (1999b). Modelling the Hidden Economy and the Tax Gap in New Zealand. Departament de Economía, Universidad de Victoria, Canadá (February). At http://web.uvic.ca/econ/research/papers/ewp9905.pdf.
• Department of Labor and Human Resources of Puerto Rico. Series on Employment and Unemployment. Bureau of Labor Statistics. Various years.
• Estudios Técnicos, Inc. (2004). La Economía Informal en Puerto Rico. San Juan. Report prepared for the Department of Labor and Human Resources of Puerto Rico (October).
• Estudios Técnicos, Inc. (2010). Estudio Sobre la Economía Informal en Puerto Rico. San Juan. Study prepared for the Government Development Bank of Puerto Rico (August).
• Friedrich Schneider and Dominik Enste (2000). “Shadow Economies: Size, Causes, and Consequences,” Journal of Economic Literature, Vol. 37 (Marzo) pp. 77-114.
• Friedrich Schneider and Dominik Enste (2001). Increasing Shadow Economies All Over the World: Fiction or Reality. A Survey of the Global Evidence of their Size and of their Impact from 1970 to 1995. NP, mimeo. At www.rebe.rau.ro/RePEc/rau/journl/SP07/REBE-SP07-A13.pdf.
13
Sources consulted
• Friedrich Schneider (2002). Size and Measurement of the Informal Economy in 110 Countries Around the World (Julio). Paper presented at the Workshop of the Australian National Tax Center, Canberra, Australia. At http://www.unescap.org/tid/gateway/tisgway_is.pdf.
• Friedrich Schneider (2004). The Size of the Shadow Economies of 145 Countries all over the World: First Results over the Period 1999 to 2003. Discussion Paper No. 1431, Institute for the Study of Labor, Bonn (December). Athttp://www.dur.ac.uk/john.ashworth/EPCS/Papers/Schneider.pdf.
• Friedrich Schneider (2006). Shadow Economies of 145 Countries all over the World: What do we really know? (August). At http://www.crema-research.ch/papers/2005-13.pdf
• Friedrich Schneider, Andreas Buehn and Claudio E. Montenegro (2010). Shadow Economies all over the World: New estimates for 162 Countries from 1999 to 2007. Research paper for the Word Bank study on the informal sector in the economies of Eastern Europe and Baltic countries (January 20th).
• Guillermo Vuletin (2008). Measuring the Informal Economy in Latin America and the Caribbean. Washington, D.C., International Monetary Fund, WP/08/102 (April). At http://www.imf.org.
• John Stewart (1984). “Notes on the Underground Economy of Puerto Rico”, Puerto Rico Business Review, Government Development Bank of Puerto Rico, Vol. 9:4 (April).
• Julio C. Pol (2004). Estimaciones de la economía subterránea: El caso de Puerto Rico. Ensayos y Monografías No. 117, Economics Research Unit, Department of Economics, University of Puerto Rico, Río Piedras Campus (January). AtHttp://www.economia.uprrp.edu/ensayo%20117.pdf.
• Leandro Colón (2002). “La economía informal en Puerto Rico: Problemática, estimados macroeconómicos y agenda sugerida,” in Francisco Martínez and Francisco Catalá, eds., Ensayos sobre la Pobreza en Puerto Rico, San Juan, Publicaciones Puertorriqueñas.
• Puerto Rico Planning Board (1998). Algunas consideraciones sobre la economía subterránea en Puerto Rico. Informe Económico al Gobernador 1997, San Juan, Bureau of Economic Analysis, chapter VI.
• Puerto Rico Planning Board (2012). Statistical Appendix to the Economic Report to the Governor, 2011. San Juan, Bureau of Economic Analysis. At Apéndice Estadístico, http://www.jp.gobierno.pr/
• Wilfredo Toledo and Wilfredo Camacho, “Evasión contributiva y economía informal en Puerto Rico,” in Suphan Andic and Ramón J. Cao, eds. (1996), Estudios de Base para la Reforma Contributiva, Río Piedras, University of Puerto Rico Press, chapter. 8.