the information divide in the climate sciences · the information divide in the climate sciences...
TRANSCRIPT

i
The Information Divide in the Climate Sciences
Andrew Gettelman National Center for Atmospheric Research∗
PO Box 3000 Boulder, Colorado 80307 USA
Tel: 303-497-1887 Fax: 303-497-1492
Email: [email protected]
May 2003
∗ The National Center for Atmospheric Research is sponsored by the National Science Foundation.

i
Table of Contents
Executive Summary............................................................................................................................. 1 1. Introduction ...................................................................................................................................... 2 Statement of issues and hypotheses................................................................................................... 2 Outline of work performed ................................................................................................................. 3 Survey................................................................................................................................................ 3 Places visited .................................................................................................................................... 3 Interviews with journal editors...................................................................................................... 5 2. Survey results ................................................................................................................................... 5 Respondents .......................................................................................................................................... 5 Access to resources ............................................................................................................................... 5 Other efforts........................................................................................................................................... 7 Publishing.............................................................................................................................................. 8 Perceptions from authors................................................................................................................ 8 Perceptions from editors................................................................................................................. 9 Statistics........................................................................................................................................... 10 Communications................................................................................................................................. 10 Survey responses ........................................................................................................................... 10 Computer and Internet access...................................................................................................... 11 Net tests........................................................................................................................................... 11 3. Country case studies...................................................................................................................... 13 Countries: Summary .......................................................................................................................... 13 East Africa............................................................................................................................................ 14 Kenya............................................................................................................................................... 14 Uganda............................................................................................................................................ 14 South Asia............................................................................................................................................ 15 India................................................................................................................................................. 15 Nepal ............................................................................................................................................... 16 Southeast Asia ..................................................................................................................................... 16 Thailand .......................................................................................................................................... 16 Myanmar......................................................................................................................................... 17 Vietnam........................................................................................................................................... 17 Northeast Asia: China ........................................................................................................................ 18 4. Synthesis and recommendations ................................................................................................ 18 Synthesis of results ............................................................................................................................. 18 Expected.......................................................................................................................................... 19 Unexpected..................................................................................................................................... 20 Rejection rates ................................................................................................................................ 20 5. Other issues raised ........................................................................................................................ 21 Sustainability....................................................................................................................................... 21 Privatization ........................................................................................................................................ 21 Organization........................................................................................................................................ 21 Electronic publishing.......................................................................................................................... 22 Future and role of the GTS ................................................................................................................ 22
ii
6. Recommendations ......................................................................................................................... 22 Short term ............................................................................................................................................ 22 Medium term....................................................................................................................................... 23 Long term............................................................................................................................................. 23 References ............................................................................................................................................ 24 Acknowledgments.............................................................................................................................. 24 Appendix A: Survey Form................................................................................................................ 25 Appendix B: Country Case Study Notes ....................................................................................... 31 List of Tables and Figures Figure 1.1. GDP per capita for countries surveyed .......................................................................... 4 Table 1.1. List of institutes visited ...................................................................................................... 4 Table 2.1. Journals read and journals desired................................................................................... 6 Table 2.2. Means of communication................................................................................................. 10 Figure 2.1. Internet users ................................................................................................................... 11 Figure 2.2. Internet hosts.................................................................................................................... 12 Figure 2.3. Net test plot ...................................................................................................................... 12 Figure 2.4. Success rates..................................................................................................................... 12 Figure 2.5. Relative costs of Internet use vs. restaurant meal ....................................................... 13

1
Executive Summary There exists a broad “information divide” in climate and meteorological science, between researchers and forecasters in highly developed countries and those in less-developed countries. Information in this context includes forecasts, meteorological data or analyses, research data, journals, and educational materials and textbooks. Barriers to the flow of information to and from developing countries create adverse effects for the global community, limiting the ability of developing countries to deal with extreme weather or climate events. The lack of in situ data for weather and climate studies for large sections of the planet also impedes research in developed countries into the global climate system, inhibiting identification of climate trends and shifts, as well as limiting forecast skill. This study combines visits to 8 developing countries with a survey of 50 scientists and journal editors around the world to characterize the information divide, and provides some suggestions to bridge it. Statistics from journal editors and publishers indicate that there are very few published articles from developing-country authors in international journals. While typical acceptance ratios (the ratio of papers published to papers submitted) are 75% for papers with first authors from the United States, Canada, the European Union, Japan, Australia or New Zealand, for other countries the acceptance ratio drops to 25%. Editors and some contributors identified the major cause of higher rejection rates as inappropriate or poor methodologies in articles. Language difficulties sometimes mask these problems, but they were not the main concern. There are large collections of weather and climate data in many locations in the developing world. These observations may go back 100 years or more. These data are often archived and kept current (even digitized), but are rarely shared or made available to researchers in developing or developed countries. Often even domestic researchers cannot get access to climate data.
The causes for the information divide are not surprising. Significant costs to access information exist in most countries, and few researchers are able to pay for information. About 3/4 of researchers surveyed noted that the cost of scientific journals was the most significant barrier, and about half noted that cost was a barrier for accessing data. Cost is also an issue for electronic communication. A third of those desiring more data indicated that limitations on Internet usage reduced their ability to get information. The cost of Internet access in relative terms can be 10 times as high in many developing countries as in developed countries. In many places, bandwidth is also a significant limitation. Email is generally accessible about 3/4 of the time. More complex functions are available less often. From many places in Africa and Asia, connections are impractical for downloading even small electronic articles or datasets. Several interesting results of the survey dispel commonly held beliefs about the information divide. A moderate delay in receiving information was not found to be a problem for most scientists. Most scientists have a rudimentary level of Internet access. Several simple things would go a long way toward bridging the information divide. In the short term, the most effective action would be to open up electronic access to scientific journals and indexes in the field, along with distributing back issues of journals on CD-ROM to developing countries. In the medium term, scientists would benefit from mentoring for publications and from education and training for new techniques (such as numerical weather prediction) and data (advanced satellite sensors). In the long term, a transition to electronic publishing for developing-country journals should be encouraged, and the Global Telecommunications System (GTS) for weather data should be enhanced to be more interactive and include research data, reports, and journals.
2
1. Introduction Statement of issues & hypotheses Anecdotal evidence suggests that an “information divide” exists in the climate sciences between developed and developing countries. Basic weather and forecast information may not reach developing countries in a timely manner. In addition, important advances in scientific understanding of our earth's climate system may not reach those researchers in the developing world who might benefit from the information. This creates an information divide. The types of information for which a gap exist include short- and long-term forecasts, journal articles and reports, other climate data, and educational materials. The gap may extend over more than physical science research to include strategies for disaster mitigation or adapting to climate variability. Another consequence of the information divide is that climate researchers in developed countries may not have access to valuable research or data from their counterparts in developing countries. A vibrant global science base is critical to properly interpret our changing climate and to provide a local base for climate forecasting and impact mitigation. This report details the results of a year-long study that examined in detail the information divide in the climate sciences. The study identifies needs for information and suggests potential ways to meet those needs. On one side of the information divide is a dearth of available information in developing countries. Analysis of subscription information from major journals (American Meteorological Society, personal communication, 2001) indicates that only a few places in developing countries have access to print journals. Even fewer have access to electronic journals. The lack of information may extend to research data and access to forecast and prediction information. The other side of the information divide appears as a lack of contributions to the scientific
literature from researchers in developing countries. This divide is apparent in general in statistics of published material (Gibbs, 1995; May, 1997) and in anecdotal information from major research journals in climatology and meteorology. Discussions with journal editors indicated fewer submissions from researchers in developing countries, as well as lower acceptance rates. A case study of Indian climate science (Kandlikar and Sagar, 1999) supports these results and indicates it is likely that the two sides of the information divide are linked: a lack of the same breadth and quality of information that developed-country scientists take for granted, combined with a lack of resources, may result in fewer submissions to the literature. In addition, the information divide may limit the communication that developing country researchers have with colleagues in other developing countries. With the rise of electronic publishing and communication, there appears to be no physical barrier for communication and access to information. Most scientific journals, indexes, and data are or will be available electronically. There is a danger that the information divide is rapidly growing into a “digital divide” between those with access to electronic information and those without. But technology may also be used to help bridge the information divide at low cost. The marginal cost of delivering a full up-to-date research library anywhere in the world is no longer limited by the cost of the printed page and postage. A full electronic library can be made available with a personal computer and a connection to the global Internet. In addition, digital communities may expand the ability to communicate and collaborate electronically beyond written or oral communication. As we build digital communities of scientists who work collaboratively and virtually across the planet with their colleagues, is there a group with valuable skills and knowledge that we are forgetting? Several hypotheses were tested: Would scientists value electronic access to information
3
resources? Do they want enhanced access to the community of the Internet, or communities of other scientists built on the Internet? Do they want to publish in journals issued in the developed world but have difficulty doing so? Do they want electronic teaching tools? Or are capabilities so limited that communication enhancements are more basic (a phone line or a photocopy machine)? Outline of work performed The survey consisted of three parts. The first portion was a written survey, sent directly by mail to scientists and available on the Internet in electronic form. The second portion of the survey consisted of a series of field visits to eight countries with a developing geoscience base. The third component of the survey was a series of personal interviews with editors of major international journals in climate and meteorology, and discussions with researchers in several scientific societies. The survey was conducted from October 2001 to October 2002. Survey
The written survey focused on several areas. The English text of the survey is in Appendix A. It was sent to a list of World Meteorological Organization (WMO) members, as well as a list of Intergovernmental Panel on Climate Change (IPCC) contacts in developing countries. The written survey consists of four main sections. Section 1 focuses on access to information resources, including questions on journals read and desired, and sources of data or forecasts. Section 2 focuses on publications written by researchers, including where they were submitted and personal experiences. Section 3 focuses on communications infrastructure, including how researchers communicate with colleagues and their use of the Internet. Finally, general descriptive information about the institutions and areas of expertise was collected, including information about languages spoken and written.
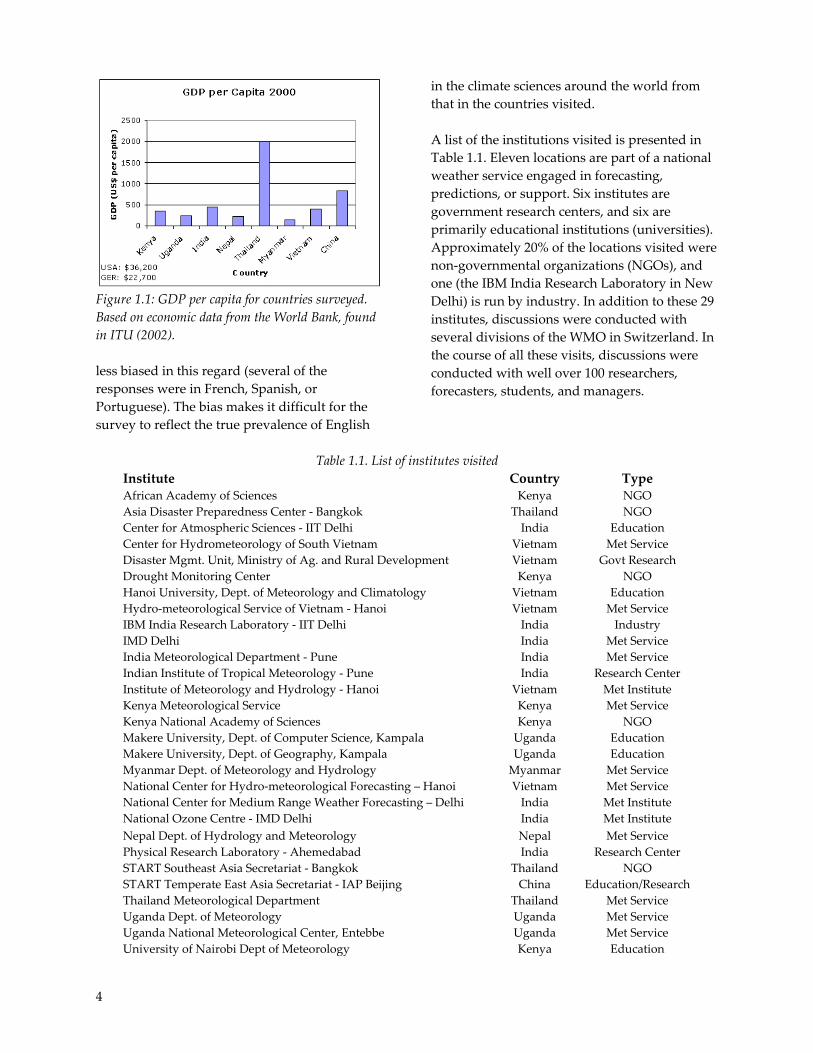
In addition to written form, the survey was made available on the Internet in 4 languages: English, French, Spanish and Portuguese. Forty-nine responses were received from the survey, about half of them electronically. More details about the nature of the responses can be found in Section 2. Places visited The country visits focused on developing countries bordering the Indian Ocean, the "Indian rim" countries. These countries represent almost one-third of the earth’s population, from Africa to India to Indonesia. The countries share common exposure to several scales of climate variability, dominated by monsoon variability and tropical storms, including effects of the El Niño−Southern Oscillation. Indian rim countries experience similar climate impacts on agriculture and water resources. The country setting varies widely, ranging from highly developed regions of India to very underdeveloped regions of Africa. Many of these countries have significant scientific cultures and active programs that attempt to understand climate variability and its impacts on society. In many of the countries targeted (e.g., India and Kenya), English is widely spoken for historical reasons. In the course of the survey, 29 different institutes in eight countries were visited. These countries are: Kenya, Uganda, India, Nepal, Myanmar, Thailand, Vietnam, and China. A distribution of the per-capita gross domestic product (GDP) of these countries is presented in Figure 1.1. Most of the countries, with the exception of Thailand and China, have per-capita GDP of less than 500 USD per person. The selection of countries necessarily biased some of the results, particularly with regard to language. All of the interviews and visits were conducted largely in English. Most of the researchers visited are fluent in spoken, and usually written, English. The written survey is
4
Figure 1.1: GDP per capita for countries surveyed. Based on economic data from the World Bank, found in ITU (2002). less biased in this regard (several of the responses were in French, Spanish, or Portuguese). The bias makes it difficult for the survey to reflect the true prevalence of English
in the climate sciences around the world from that in the countries visited. A list of the institutions visited is presented in Table 1.1. Eleven locations are part of a national weather service engaged in forecasting, predictions, or support. Six institutes are government research centers, and six are primarily educational institutions (universities). Approximately 20% of the locations visited were non-governmental organizations (NGOs), and one (the IBM India Research Laboratory in New Delhi) is run by industry. In addition to these 29 institutes, discussions were conducted with several divisions of the WMO in Switzerland. In the course of all these visits, discussions were conducted with well over 100 researchers, forecasters, students, and managers.
Table 1.1. List of institutes visited
Institute Country Type African Academy of Sciences Kenya NGO Asia Disaster Preparedness Center - Bangkok Thailand NGO Center for Atmospheric Sciences - IIT Delhi India Education Center for Hydrometeorology of South Vietnam Vietnam Met Service Disaster Mgmt. Unit, Ministry of Ag. and Rural Development Vietnam Govt Research Drought Monitoring Center Kenya NGO Hanoi University, Dept. of Meteorology and Climatology Vietnam Education Hydro-meteorological Service of Vietnam - Hanoi Vietnam Met Service IBM India Research Laboratory - IIT Delhi India Industry IMD Delhi India Met Service India Meteorological Department - Pune India Met Service Indian Institute of Tropical Meteorology - Pune India Research Center Institute of Meteorology and Hydrology - Hanoi Vietnam Met Institute Kenya Meteorological Service Kenya Met Service Kenya National Academy of Sciences Kenya NGO Makere University, Dept. of Computer Science, Kampala Uganda Education Makere University, Dept. of Geography, Kampala Uganda Education Myanmar Dept. of Meteorology and Hydrology Myanmar Met Service National Center for Hydro-meteorological Forecasting – Hanoi Vietnam Met Service National Center for Medium Range Weather Forecasting – Delhi India Met Institute National Ozone Centre - IMD Delhi India Met Institute Nepal Dept. of Hydrology and Meteorology Nepal Met Service Physical Research Laboratory - Ahemedabad India Research Center START Southeast Asia Secretariat - Bangkok Thailand NGO START Temperate East Asia Secretariat - IAP Beijing China Education/Research Thailand Meteorological Department Thailand Met Service Uganda Dept. of Meteorology Uganda Met Service Uganda National Meteorological Center, Entebbe Uganda Met Service University of Nairobi Dept of Meteorology Kenya Education
5
The personal interviews covered similar topics as the written survey, and in some cases those interviewed personally filled out survey questionnaires as well. In addition to the written survey, the site visits included tours of libraries and computer facilities, as well as laboratories and offices. The field visits complement the survey results in a fairly unique way and allow some of the biases in the survey to be examined in more detail. In addition, personal interviews touched on cultural issues that could not be fully anticipated in the survey. Those issues are discussed in detail in this report. A summary of these visits is contained in Section 3, and more details appear in Appendix B. Internet access, availability, and cost were also tested in the course of the survey. A standard set of files and websites was accessed from 25 locations in the eight countries visited. This set included accessing a website and downloading a file located in the United States and accessing a website located in Kenya. The times for access (or failure of access) were recorded and tallied. The results are presented in Section 2. Interviews with journal editors In the summer and fall of 2001, several journal editors were interviewed to gauge their perceptions of the information divide. These editors represent several established and well-regarded journals in climate and meteorology. The editor of a developing-country journal was also interviewed in early 2002. The interviews attempted to understand the perceptions of editors toward article submissions from researchers in developing countries, to gather statistics or anecdotes, and to garner ideas and recommendations from the editors. A summary of the discussions is also presented in Section 2.
2. Survey results The sample size from the survey of 49 responses does not permit statistical rigor, but common and consistent answers from the survey and
field responses (which add another 100+ responses from 8 countries) do allow a broad picture of the information divide at the beginning of the twenty-first century.
Respondents As stated earlier, 49 responses to the survey were received by mail or over the Internet. These responses came from 23 different countries: 10 from South America, 7 from Africa, 5 from the Middle East, Russia and the Former Soviet Union, 11 from India, 14 from Southeast Asia, and 1 from China. The distribution is skewed toward those regions in which the field survey was conducted. This distribution is likely due to surveys completed by researchers at institutes visited, or colleagues of those researchers. Of the researchers responding to the survey, 60% work at government institutions, 25% at educational institutions, and 15% at NGOs. Approximately 25% of respondents are primarily concerned with meteorology and forecasting. A further 25% are concerned with climate and climate change. The remainder represent a mix of fields from hydrology to energy and environment to oceanography. Nearly two-thirds are engaged in research and a third in teaching, with 25% also having some management responsibilities. Ten percent of the respondents indicated forecasting is their primary job, or one of their primary jobs. Of the researchers surveyed, 60% had doctoral (PhD, D.Phil or equivalent) degrees. Approximately one-half of those degrees were received in developing countries, and the other half in developed countries. English is a native language for only 3 of the 49 respondents. Despite this, over 80% (42 of 49) speak and write English. Spanish was the next most common language, spoken by 20% of respondents. Access to resources Survey respondents were asked several questions about what journals or publications

6
they use for their research, and how they access these publications. Respondents were asked to name up to four periodicals that are most important to their work and whether they had easy access to them. In addition, respondents were asked to name up to four additional periodicals they would most like to receive. The top four replies are in Table 2.1. About 2/3 of the respondents did not have timely access to the publications they use in their work. The average delay for receipt of journals was about 6 months, with 10% of respondents facing a delay of a year or more to receive needed journals (if at all). However, 60% did not find this delay detrimental to their work.
Table 2.1
Top 4 Journals Read (25% of total requests) 1. Journal of Climate 2. Monthly Weather Review 3. Journal of the Atmospheric Sciences 4. IPCC publications Top 4 Journals Desired (30% of total requests) 1. Journal of Climate 2. Monthly Weather Review 3. Boundary Layer Meteorology 4. Journal of the Atmospheric Sciences Note that most of the journals listed in Table 2.1 are publications of the American Meteorological Society (AMS), and these rank high on the ISI citation lists (ISI Essential Science Indicators, 2003). However, Boundary Layer Meteorology, from a private publisher, costs 1200 USD per year for an individual and 2200 USD a year for a library subscription. While most of the other journals mentioned are “high-impact” journals (in the top 20 of 168 journals) for citations or citations per article), Boundary Layer Meteorology is not (49th in citations and 72nd in citations per paper). The lack of access may have to do with cost. The most common way in which respondents find out about research is from a reference in another publication, followed by locating and reading articles directly. Internet browsing was
the next most common way to find articles. One-half of the respondents used databases to find information, and most of these were electronic (Internet or CD-ROM). It appears from discussions that broad Internet searches (using search engines such as www.google.com) on topics or names, combined with searches of known research websites, are an increasingly common way to access information. These Internet tools have surpassed databases, conferences, and conversations with colleagues as ways to hear about new results and articles. Research or forecast data was also the subject of several survey questions. The most common data source for respondents was self-generated data (used by 80%), followed by international analyses and other domestic data. The international analyses, typically from the National Centers for Environmental Prediction (NCEP) and the European Center for Medium-range Weather Forecasting (ECMWF), were highly valued by forecasters. Seventy percent of those surveyed did not have access to all the data they need for their work. This includes forecasters and researchers. The most common reason cited was cost (nearly half of respondents). Insufficient Internet access was also cited by 1/3 of those who need more data. In particular, there were unprompted complaints, in both written remarks and respondents at visited institutes, about the lack of access to ECMWF global analyses. Many were confused that a publicly funded entity charges other publicly funded entities for data. A small number of respondents also had problems with either domestic bureaucracy or their own computer and data processing facilities. Other issues included problems with data formatting that are pervasive everywhere, as well as a desire for software or training materials for the use of larger data sets. Much of the problem with the cost of data or journals stems from the fact that most nonprofit entities in developing countries are unable to pay for information, whether journals or data. There are some small budgets for journals, but virtually no budgets for data collected outside a
7
country. The cost of a journal in foreign currency may be a significant fraction of a researcher’s salary in many countries. This is also true of Internet access. The survey results were, however, not entirely bleak. Several researchers noted the increasing availability of data on the Internet and their increasing ability to access certain data sets and forecast products. In some weather services and forecast offices visited, forecasts and analyses from the Internet are used more frequently than information from the Global Telecommuni-cations System (GTS) for forecasts and prediction. Other efforts Several existing efforts seek to develop capacity for climate science in the developing world. Some of these efforts include the educational and training efforts of the WMO, outreach and education efforts of the global change system for analysis, research and training (START) project, and the outreach efforts of the IPCC. The International Research Institute for climate prediction (IRI) also has an outreach program to train developing-country scientists in climate forecasting. These efforts are quite rightly focused on specific scientific objectives related to each organization's mission. Several efforts are currently under way on a formal and informal basis to deliver journals to researchers in developing countries in a more timely fashion. The National Oceanic and Atmospheric Administration (NOAA) has for several years provided free journal subscriptions from the AMS to approximately 100 locations worldwide. In addition, several major libraries in developed countries send extra collections to developing countries. These programs, in conjunction with other donations from individuals, have been a major lifeline for researchers in developing countries. Most libraries visited depend on donated or free journal subscriptions for their collections. This makes the journal collections uneven. Journals only arrive when external funding is available or donations are found. The continuity of
collections is lacking in many places, and issues are missing because either donors didn’t have that issue to send, or a program didn’t have a subscription for a particular year. Most of the journals sent free of charge are publications from not-for-profit societies. Very few recent copies of commercially published journals were seen. Additional programs are under way to make electronic access available to researchers in developing countries. Some of these initiatives are specific to the climate and meteorology community, and some are more general across scientific disciplines. Several efforts are under way to promote electronic access to journals. These efforts rely on existing websites and tools built for existing subscribers. The AMS is undergoing a transition to open access for back issues of their journals. The American Association for the Advancement of Science (AAAS) is doing the same for the journal Science. These programs have advantages and disadvantages. Advantages stem from the low marginal cost of supplying electronic information to developing countries, which makes the programs much cheaper, and easier to scale for donors and suppliers of information. The disadvantages of electronic distribution programs are that they require some computer capacity, and most require Internet access faster than a dial-up modem (>56 kilobytes sec-1) to be practical (see discussion below under Communications for more details). A further disadvantage of Internet-based programs is that while they often permit access to an entire and complete catalog of back issues, this access ends if the program terminates or if the connection or computer is inaccessible, while print journals are always available. Note that this latter concern is an inherent problem with networked electronic libraries. If the network is down the entire library is closed. Personal communication with colleagues in the United States indicates that this is a growing concern of research libraries and researchers in developed countries as well. In addition to these specific activities in the meteorological and climate sciences, there are
8
several larger efforts occurring around the world to try to promote and enhance access to information. The Third World Academy of Sciences is promoting an open electronic archive of journals across the sciences. This archive is targeted to developing countries. In addition, an effort called the Budapest Open Access Initiative has been formed to attempt to promote open access to journals and to encourage public scientific research organizations not to designate copyright to other parties, particularly for-profit entities. These are only two examples of many efforts to bridge the “digital divide” and the information divide in the physical and biological sciences. The number of efforts is increasing with time. Publishing Perceptions from authors According to the survey, papers in climatology and meteorology are published overwhelmingly in English. Seventy-five percent of the developing-country scientists polled submitted their papers in English, though it is a native language for only 3 of 49 respondents. Despite the overwhelming prevalence of English, 45% of the papers recently submitted by these researchers went to emerging country journals (15% of the total to India). Some of these statistics are biased by the sample chosen. Part of the concentration on English is probably due to the significant fraction of replies from India, where English is the common language. In parts of West Africa, several countries still publish locally in French. And there are significant publications in Spanish from Latin America, though there is little doubt that much of the international literature is in English. In addition, there are other trends and incentives (mostly economic) in many countries to learn English. English usage was higher among younger scientists in rapidly developing countries in Asia, notably China and Vietnam. Interestingly, language was not considered a major barrier by many of the survey
respondents. Only 1/6 of respondents indicated that language was an important issue for them. Translation help was important for a small percentage of respondents. A greater proportion (perhaps 1/3) of the researchers visited thought language is an issue. Difficulties in reading and writing English varied dramatically country by country. Former colonies with English as a colonial language (Kenya, Uganda, India, Myanmar), a large number of those countries sampled, had less trouble with English, and hence contribute to a bias in the survey. The average time reported by these authors from submission to publication was 11 months. This is comparable to the time required in developed countries. However, the tail of the distribution is skewed toward longer time periods, with some papers taking well over 18 months to publication. Authors complained about several things in the publishing process in developed-country journals. Page charges for articles are prohibitive for most developing countries. The charge for an article, typically on the order of 1000 USD per paper, is easily the monthly salary of a researcher in many countries. While most journals will waive the fees for researchers in developing countries, many authors are not aware of this. This results in the self-selection of certain journals without page charges. Many authors send papers to specific journals based on the cost (or lack of cost) of publication. Cost was a barrier for 2/3 of those surveyed, as well as a similar proportion of those interviewed during field visits. Page charges in particular were mentioned by half of the respondents. Other desired publication assistance included more access to articles and data. The type of submission to international journals from developing countries is often different than from developed countries, and is different from that submitted to domestic journals in developing countries. Authors know that certain types of work (reanalysis of an old data set, publishing a limited data set, or research that may be more “applied”) is not suitable for

9
certain journals, and they appear to be very selective about sending work to international journals. This is really a difference in priorities between international journals and developing-country scientists. It is perhaps expected in some areas of the field (dealing with advanced techniques or instrumentation). But for climate research, for example, standard data products in new locations or historical records are themselves new research. For forecasting, there are approaches from other developing countries that might be useful. International journals for developing countries are necessary to cover some of these topics, and these journals are rare. In addition, some respondents and researchers indicated they detected a “reviewer bias” toward developing-country submissions. Part of the bias may be cultural. The scientific method of questioning previous results and hypotheses is culturally different than the deference to authority found in many countries. While it is true that senior scientists in developed countries may also face less scrutiny, in principle all work is evaluated on its merits during peer review. Criticism of the work of a senior person in many developing countries is often not acceptable. This cultural deference to authority may also explain a perceived resistance to using and adopting new methodologies and techniques. These issues were raised by developing-country scientists (often younger ones) during several of the field visits. Perceptions from editors Editors of five major journals were interviewed in the fall of 2001 in order to ascertain their perceptions and experiences with submissions from developing-country researchers. In general, editors identified a difference in submissions between developing and developed countries, as well as a difference in acceptance rates, which comes out of the statistics for all the major journals examined. However, there are not many submissions to some of these major journals from developing countries. The editors suppose that many authors will self-select away from these journals either due to cost, time, or subject matter. All of these suppositions are
correct based on the discussions with authors. Cost is an additional consideration, as noted above. Similar to the perceptions of authors described above, language was not cited by many editors as a problem, and by none as the major problem. One editor noted that problems with language were usually correctable; however, problems with methodology or subject matter were more serious. Another editor of an English language journal noted that the paper with the most language problems, received in the last few years, came from Western Europe and had a co-author who was a native English speaker. Formatting issues were also a concern to editors. Submissions did not follow conventions (double-spaced, containing an abstract). While the editors considered these issues minor, it was noted that not conforming to norms was symptomatic of larger issues. Access to current literature and methodology were the two most frequent criticisms about submissions received from emerging countries. Editors noted that authors were not aware of the current literature from the last 5 to 10 years, and that their choice of methodology was often outdated. They often repeated analyses with a slightly different data set, or used older and outdated data products. Papers were often thought to be more like a “textbook,” repeating what is known, documenting observations without interpretation, or a model exercise with little evaluation. These also were the most difficult problems to address, and in many cases these issues made papers unpublishable. Editors also noted that postal communication with developing countries is often difficult and unreliable. Electronic communication was therefore viewed as a great leveler. There are some systematic differences among countries in the developing world noticed by editors: some good, some bad. There were some favorable comments about papers and programs in Brazil and the “Southern Cone” of South America. India was also noted for the quantity, as well as quality, of manuscripts. However, India also appeared to the editors to have the

10
biggest problem with the review process and accepting criticism. The editors noted that this was more of a problem for senior scientists from India than younger ones. In addition, editors are receiving increasing numbers of papers sent in electronic format from some locations (South America was noted especially by one editor). Editors also provided suggestions for assisting publications from developing countries. Electronic communication was viewed as a big help to the editorial process for developing countries, reducing time delays and postage charges. Enhancing on-line access to papers would be another way to increase access to the literature. Another suggestion was to enhance co-authorship of papers with Western researchers. Many scientists from developing countries who are publishing successfully have collaborations with institutions in developed countries and have spent time working in developed countries. Also, exposure to current science at meetings would help, rather than simply being exposed to the literature. Several editors suggested that more financial assistance to send journals and information to developing countries would be beneficial, as well as enhancing electronic access and communication for editors and contributors to journals. Statistics Preliminary statistics available from several major US and European journals confirm the perceptions of authors and editors. The simplest metric to use is to look at acceptance rates: the number of papers accepted divided by the total submitted. The acceptance rates for manuscripts for all publications from the AMS are approximately 80% for those whose corresponding author is in the United States, and nearly 50% for all submissions outside the US (including other developed countries in Europe and Japan). For a single AMS journal with available data, the acceptance rates are nearly 75% for manuscripts from the United
States, and 15−20% for manuscripts from developing countries. A major European journal has similar numbers (70% acceptance from developed countries and 20% for manuscripts from developing countries). Communications Several aspects of communications were explored. Basic information about how and with whom researchers communicate was obtained. In addition, based on the hypothesis that information is increasingly electronic, more detailed information about computing and network capabilities was examined. In addition to the survey responses, data were obtained by visiting various facilities and by using researchers’ communications infrastructure. Objective tests of Internet access from various locations were also conducted. Survey responses The most common means of communication between researchers and their colleagues was by electronic mail. This applies to domestic colleagues as well as those from other countries. The results are summarized in Table 2.2. Conventional mail has dropped in use among researchers for communication with colleagues. For over 80% of researchers, the ranking was their preferred ranking.
Table 2.2: Means of communication
Rank Domestic Foreign 1 Email Email 2 Face Fax 3 Phone Face 4 Fax Mail 5 Mail Phone
Nearly 80% of those surveyed, and a slightly lower proportion of those visited, work with international networks (such as the IPCC) or collaborate with scientists in other countries. Of the collaborations noted (respondents were encouraged to name up to three countries), more than 2/3 were with a developed country (US, Europe, or Japan) and less than 1/3 of the

11
collaborations were with other developing countries. This situation is perhaps expected, given the desires of developing-country scientists, but one may ask whether the lower level of collaboration with other countries either in the “neighborhood” or with similar conditions is a concern. It would appear at first glance that countries may suffer from similar types of weather patterns, similar climate events and extremes, and would have much greater need for collaboration on research projects with each other. The communication between developing countries appears to be higher in Southeast Asia, with certain projects such as research on the Mekong river system, spanning borders. Some communication between countries in East Africa, which face common drought problems, was also noted. However, there appeared to be little communication between India and either Africa or Southeast Asia. Computer & Internet access All of the scientists surveyed have some access to a computer. For most, their primary use is in the office. Most of the computer systems seen in the field survey were models from the mid- to late 1990s. Most of them run some version of Microsoft Windows software and have CD-ROM drives. In Southeast Asia and India, the computers in many places were less than five years old. Only about 20% of those surveyed are required to pay for computer usage. In some places, notably East Africa, most of the computers are donated. According to the scientists in East Africa, the most difficult thing is not to get donations of equipment, but to get the equipment through customs. Several places in Kenya have received computers from the WMO in Switzerland, which had to be brought into the country in diplomatic pouches. Ninety percent of those surveyed have electronic mail and/or access to the Internet. Most people use the Internet at the office. In many locations these connections are shared. Internet access to the desktop for all but senior researchers is only found in more developed countries, such as Thailand or China. Similar to
computer use, 25% pay a marginal cost for access every time they use the Internet. One-third of survey respondents, and close to half of those visited, indicated that cost limits Internet access (see below). Cost was a significant barrier especially in Africa and the Former Soviet Union. In addition to email and the Internet, nearly 3/4 use file transfers for downloading information, and less than one-half use the Internet for remote access to other computers. Net tests Several metrics of Internet use were obtained for the countries visited. These indicators help to put the comparisons between countries in to perspective. These data come from international sources, as well as from data collected in various countries as part of the survey.
Figure 2.1. Internet users
Figure 2.1 illustrates the level of Internet and personal computer (PC) use per capita in various countries based on data from the International Telecommunications Union (ITU, 2002). Of the countries surveyed, Thailand has the highest proportion of Internet users (5%) and personal computers (nearly three computers for every 100 people). For comparison, in the United States 50% of the population uses the Internet, and there are 62 computers for every 100 people. Developing countries are still nearly an order of magnitude behind most European countries (Germany is given as an example, with 1/3 of the population using the Internet).

12
More striking is the location of Internet hosts, indicated in Figure 2.2. There may exist a global Internet, but in 2001, 75% of all the host computers on the network reside in the United States (with 5% of the world’s population). With 13% of the world’s population, Africa has only 2% of the world’s host computers (mostly in South Africa). This is dramatic evidence of the “digital divide” between developed and developing countries.
Figure 2.2. Internet hosts Internet access and cost was examined directly in the countries visited. To test Internet access, the access time for three different locations on the Internet was tested. One test measured the time to load a small (0.25MB) article published in a journal and stored in Portable Document Format (PDF) on a web page at the National Center for Atmospheric Research in Boulder, USA. A typical PDF article from a journal runs 0.5−3MB. The second test calculated the time to load the Internet home page of the National Oceanic and Atmospheric Administration’s Climate Diagnostic Center (www.cdc.noaa.gov), also located in Boulder, USA. The third test was the time to load the Internet home page of the Drought Monitoring Center for East Africa (www.meteo.go.ke/dmc/), located in Nairobi Kenya. The results for accessing these three locations are indicated in Figure 2.3. Internet access in most countries, either at dedicated Internet cafés or in offices with mostly dedicated lines, is usually reasonable for most applications. For activities that take longer than a minute or so, however, these speeds can be limiting. Keep in mind that these statistics
measure the time to load a small article and a single web page with more complicated links and photos. For an average article or session, access in Africa is prohibitively slow from most locations tested. It might take 5−10 minutes for an average-sized article, assuming that transfer rates were sustained, and the server or phone line did not disconnect. Add to this the time to search for the article, with nearly 2−5 minutes per page viewed, and the time to access a single article may run 30 minutes or more. Also, since charges are a function of time, access gets expensive, particularly with frequent disconnects.
Figure 2.3. Net test plot These numbers are in line with the success rates that were reported by survey respondents.
Figure 2.4. Success rates
Figure 2.4 illustrates the approximate percentage of time that researchers are able to access various functions on the Internet. The success rate was calculated by assigning an average success rate to verbal categories: almost never (5%), sometimes (30%), usually (70%), almost always (95%), and averaging across all 49
13
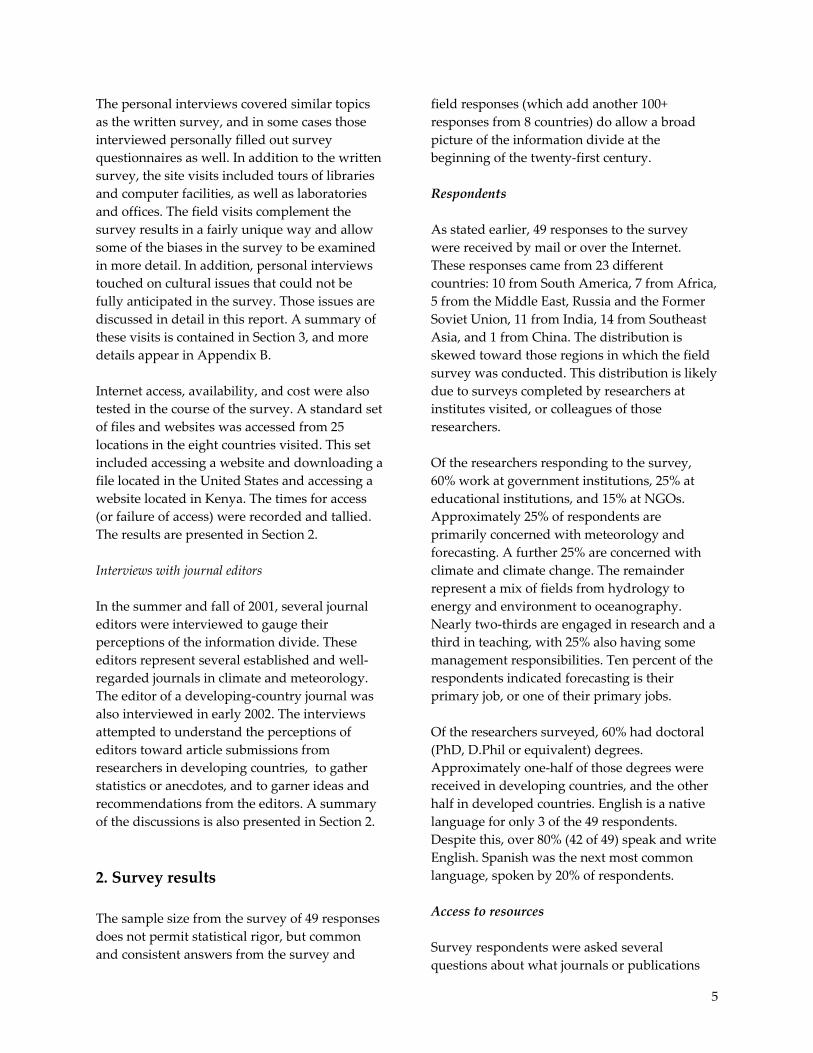
responses. Success rates for email are the highest at 75%, with the web “usually” accessible (70% of the time), and remote access to other machines available only half the time. FTP (file transfers or downloads) may give some indication of the potential for downloading articles and other information. It appears to be successful only 60% of the time. In addition, the “street” cost of Internet access was examined in various countries. The relative cost was calculated by dividing the cost of an hour of Internet usage by the cost of a typical meal in a restaurant. This metric is presented in Figure 2.5. For example, in the Netherlands, Internet access costs 1.25 EUR/hour, and a meal typically 10 EUR/meal, so the cost is 0.125 meals per hour of Internet access. Also note that while Myanmar does not have access available to residents, they can send a single email for about the cost of a restaurant meal (this would probably work out to something like 10−15 meals/hour on the scale in Figure 2.5).
Figure 2.5. Relative costs of Internet use vs. restaurant meal
Figure 2.5 has a similar structure to Figure 2.3. Higher costs are often associated with slower access speeds (note the speed and cost in China and Uganda on either ends of the scale). These numbers do not resemble GDP per capita (Figure 1.1). Rather, with the exception of India, they are much closer to the relative relationships of total GDP. Larger and richer countries have higher levels of Internet access. The relatively high cost of access in India is a result of extremely low costs for food, and lower concentration of Internet users (Figure 2.1). The physical bandwidth in India was quite fast
when tested either at cafés or in researchers’ offices. The results were confirmed in discussions with researchers. Africa in particular suffers from physical bandwidth problems (it is a relatively poor place with low population density). A similar perception can be gathered from looking at physical transportation infrastructure in Africa. The road networks are thinner and smaller than in many places in Asia. Myanmar, with a lower GDP per capita than Uganda or Kenya (Figure 1.1) and with far less foreign assistance, has about the same level of transportation infrastructure as East Africa, largely due to population density. 3. Country Case Studies Eight countries were visited during the course of the survey, and more detailed information is available on the state of these countries. As indicated in the introduction, these countries form a sample of several different levels of capability and size. Countries: Summary Comparisons among the countries visited are very revealing. There is tremendous variety in the issues facing these countries, and an information divide that ranges from a crevasse, easily bridged, to a canyon. Some of the broad themes and issues for each country are noted here, with more detailed notes in Appendix B. In general, certain countries are struggling to maintain a basic level of weather services and forecasting (Uganda, Myanmar, and Nepal); some are attempting to do more seasonal prediction (Kenya, Nepal, and Vietnam)’ some are already running numerical prediction models (Vietnam, India, China, and Thailand); and some are doing extensive fundamental research (China and India).

14
East Africa Two countries in East Africa were visited in the course of the survey: Kenya and Uganda. Interviews were conducted with meteorological services, NGOs, and universities in both countries. Common issues of concern include basic access to the Internet and inadequate levels of funding for research. As indicated in the results, Africa suffers from a generally low level of development in all infrastructure, whether physical or electronic. In East Africa, this is due to poverty and low population density, which affects telecommunications and Internet access as well. The physical bandwidth simply does not exist in the region to make high-speed Internet access available, even for government entities or researchers. The levels of poverty in the region significantly limit the funding available to support research and services across the board. Ability to pay for anything is limited. Many researchers are forced to use donated computer equipment or purchase it themselves. Funding for information is nonexistent for research and very limited even for operational meteorology. Research conducted in climate and meteorology is usually funded by international agencies or donor institutions. However, education levels are high, and the widespread use of English as a second language is a benefit to many in the region. There is an active scientific research community, particularly in Kenya. Kenya Kenya has a large and historically active meteorology community, dating from colonial times. However, along with the condition of the general economy, that community is eroding. Kenya’s research community fared better 20 years ago than it does today. Gaps between Kenya and developed countries have widened over this period of time. This is a general condition of the economy and not localized in the scientific community.
Currently, infrastructure is poor for meteorology. The number of domestic reporting stations has declined over the past 10 years, largely due to a lack of funds to continue programs to support voluntary reporting. The meteorology community uses a donated satellite link from France as its sole Internet connection. This provides good service to the Kenya Meteorology Department, the WMO regional headquarters, and Drought Monitoring Center co-located within it, as well as the Department of Meteorology at the University of Nairobi, and even the Department of Meteorology and Hydrology in Kampala, Uganda (see below). The general education level in the meteorology community is high. There is a good tradition of higher education in meteorology at the University of Nairobi, which also trains large numbers of students from other African countries. The influx of funds from donors has helped in a number of areas. In particular, Kenya serves as a regional training center for East Africa, with educational and training facilities, as well as a large meteorology library. There is an active Drought Monitoring Center, sponsored in part by the WMO, which helps to issue seasonal forecasts and predict extreme events, working with researchers and data from throughout the region. This program is well funded and has been successful. Uganda Uganda is struggling to maintain a basic level of meteorological services against very difficult odds. The general situation in the country is that it is struggling to recover from a civil war and to maintain its borders against disputes with neighbors. The situation has been getting better, but at least 25%, and possibly as much as 50%, of the government budget consists of donations from developed countries. Communications facilities are even more limited than in Kenya, and there are even fewer available resources. The entire meteorology service gets its information through one modem

15
line located in Nairobi and a backup satellite receiver. No data are received from the neighbor to the west (Democratic Republic of the Congo), and this makes forecasting difficult. The cost of Internet access is quite high, almost unaffordable for the Meteorology and Hydrology Service. There is no funding to purchase journals and little for Internet access. Downloading a single 1MB article takes about 40 minutes and costs 4 USD, which is prohibitive. Uganda has several examples of innovative as well as failed programs to bridge the information divide. On the good side, they are using satellite radio receivers (Worldspace) to obtain weather and forecast data, as well as to broadcast warnings to remote regions. This system is well suited for hydrology, sending warnings to far-flung regions of the country. There is a climate records rescue project to digitize old climate records, but several older projects (such as microfilming the records) were unsuccessful. The major university in the capital does work with the Meteorology Department to train forecasters. The university has recently received an influx of funds to their computer science department, but maintaining campus-wide Internet access is, again, very expensive. South Asia Two countries in South Asia, India and Nepal, were visited. Several major centers in India were visited and one center in Nepal. In general, South Asia, particularly India, has a very different situation than East Africa; the level of development in India is much higher. This is apparent in the general infrastructure (roads, rail, etc.) as well as in electronic communication. Internet bandwidth is not really an issue. Resources are an issue in Nepal. In India, it is simply a question of how to allocate resources. Because of the large and capable science base in India, some interesting cultural issues arise for scientists trying to publish in developed-country journals, which they do on a regular basis.
India India is a country of tremendous contrasts, with world-class research centers, supercomputing facilities, and locations with Internet access faster than the WMO offices in Switzerland. These facilities coexist with tremendous poverty and a much larger number of substandard research and education facilities. There is a class of top-tier universities and research centers with good facilities, which were mostly the class of center visited in this survey. Researchers discussed the problems faced by non-world-class centers in India, which were more typical of East Africa, lack of resources, poor computers and communications infrastructure, and a lack of access to basic textbooks and educational materials in the field. English is a de facto second or third language among a large percentage of the educated population and is widely used throughout all society. All the researchers encountered were fluent in spoken English, and few had trouble with written English, though some students were not totally fluent. The Indian Meteorology Department (IMD) is a large institution with many forecast centers and an active research program. The Indian government operates its own weather satellite. Several active groups are working operationally or experimentally with numerical models. Much of the cutting-edge research work focuses on the dynamics and predictability of monsoon circulations. Access to data and research information is quite good. Most major journals can be found in a few major locations, the world-class centers. Beyond these, the information is not available. Several libraries were visited, with comprehensive collections of most common journals and textbooks, and extensive archives. An active data digitization project is under way, but it is not clear if the data will be made accessible or migrated to a usable form. India also has an active scientific publishing community. There are a few world-class journals

16
in meteorology, including Climate Change, and Mausam. Mausam, the official journal of the IMD, has a long history, dating back almost 100 years. A broader set of scientific publications exists as well. Many of these publications receive submissions from all over the world. Some interesting cultural issues were highlighted in the course of the interviews, which shed some light on publication concerns identified above. India suffers or survives under the weight of a large bureaucracy, which sometimes does things only for its own sake. Researchers indicated a strong cultural deference to authority. This deference, for example, prevents junior staff from critiquing the work of senior staff. It also means that new methodologies and techniques are not necessarily encouraged, and that it is safer to work on more established projects. This is particularly the case at smaller institutions. These cultural traits appear stronger in India than in Western countries, and may explain why there appears to be consistent cultural differences and problems with papers submitted from India to Western journals. Nepal Nepal is a much smaller and less-developed country than India, with more significant physical and development barriers. The Meteorology and Hydrology Service has a higher level of infrastructure than in East Africa (Internet access, computers, etc.), and a competent staff, but fewer resources than in India. Due to geography, the service struggles to maintain a network and conduct forecasting in the presence of highly variable conditions. Significant donor assistance exists for all research conducted. In most cases, research topics appear to be chosen by the donor countries. Data needs are met through a satellite reception link and through use of connections with India. Public websites are also used to supplement data received through the Global Telecommunications System (GTS) or via direct satellite links. Again, there are no resources to
pay for publications, and few researchers try to publish their research in international journals. Several programs are under way with researchers who study mountain meteorology (these foreigners publish their research in international journals). Internet access is improving, and sometimes researchers are able to get copies of articles on the Internet. Southeast Asia Southeast Asia has a wide variety of capacities, ranging from Thailand, which is relatively highly developed, to Vietnam, which is developing rapidly, to Myanmar, which has a low development level for the region and is struggling to move forward. There are some interesting issues of language and education in the various countries, and some interesting insights into different problems faced by countries, even those with significant resources. Thailand Thailand is one of the most developed countries in this survey. It has the highest per-capita GDP (Figure 1.1), as well as the highest percentage of Internet use (Figure 2.1) and servers of any country surveyed. The speed of Internet access and the penetration of computers into offices is high. However, there are some interesting aspects to this development. Many universities and several active NGOs are working on disaster management, predictability, and climate change. Yet there is no faculty of atmospheric science or meteorology in any university, and the strongest tradition in the field is an active research program on weather modification, which is a pet project of the King of Thailand. The first professorship in meteorology or climatology is due to be filled in late 2002 or 2003. The NGOs are quite active and often based within universities. As a communications and economic center, Bangkok has a number of regional organizations (as well as a large United Nations presence) that work throughout Southeast Asia.

17
The Thailand Meteorology Department (TMD) has a relatively new and spacious campus outside of Bangkok with good facilities and a technically advanced forecast room. There are 10 Doppler radar sites in the country and a well-developed network. Yet only two of the sites appeared to be working when the visit was conducted. TMD has several research divisions, including one for climate. However, training must occur in-house without university support. In addition, the general level of English proficiency was low. This could be seen in the TMD Library, which has a relatively large collection, but most of the books are old, and it contains few journals. Most of the researchers at the TMD do not use the library, and many have difficulty reading English. Though Thailand has facilities and an advanced level of development, the general education level in climate and meteorology is low. This is paradoxically due to Thailand’s historical independence, wealth and use of a native language other than English. It illustrates some of the problems faced by successful developing countries that have their own strong traditions and cultures. Myanmar Myanmar is a very different case from Thailand. Its level of development is more in line with East Africa than with other countries in Southeast Asia. The country has virtually no Internet access. This is largely by government choice, which restricts the flow of information and keeps the country insulated from the outside world. Even the Department of Meteorology and Hydrology as of May 2002 was unable to gain approval to access the World Wide Web. Interestingly, the Meteorology and Hydrology Department recently invested a great deal of money on a sophisticated computer system to produce television weather forecasts and has hired and trained staff to be television presenters for the government network. The system comes with some expensive computer hardware to render the presenter’s graphics over a map of the country showing weather systems. This same system contains the software and capacity for running a numerical weather
prediction model which the department is not currently using. This system has raised the Department’s visibility in the government, as well as in the general population and is judged to be a valuable resource and a great success, despite its cost. As the monsoon season started in late May 2002, the Department had no satellite link to the Global Telecommunications System (GTS) because of local line problems between the government receiving station and the department forecast center (about 10 km apart). Satellite data were viewed from a secondary system donated by China that could receive information directly (using a small dish) from either the Chinese or the Japanese weather satellites. Forecasts were constructed with limited satellite pictures and charts, since there was virtually no GTS data. The department was considering investing in world space receivers (similar to those in Africa) to attempt a remedy to the situation. It is not clear whether permission from the government for such a device would be forthcoming. In general, the senior staff at the Department is well educated, often receiving advanced degrees in a developed country. There is a desire to send more staff abroad (to India, Europe, or the United States) for training. Some funding exists for this effort, but political considerations make this effort difficult. The level of English proficiency is good among most of the staff. There is a well-developed and maintained domestic network of meteorology and hydrology stations. Forecasting is done using empirical or statistical methods (such as a statistical hydrology model for streamflow). Myanmar is rarely able to access Indian meteorological data, which can be detrimental to forecast skill. Vietnam Vietnam is a large country that is moving forward rapidly after a long period of several wars throughout the latter half of the twentieth century. The pace of development increased after the collapse of the Soviet Union and the

18
influx of foreign investment. The biggest change, according to researchers, came in 1995 following the normalization of relations with the United States. While the government still restricts the flow of information (keeping Internet rates high and international phone rates the highest in the world), things appear to be improving rapidly. It is still difficult for researchers to get high-speed or dedicated Internet access. The meteorological service itself appears, however, to have good resources. Several different locations were visited in North and South Vietnam. An active research community in climate, meteorology, and hydrology works largely under the umbrella of the Department of Meteorology and Hydrology (DMH), with large regional forecast centers in the south and north of the country. Hanoi University also has a small but significant Department of Meteorology, which serves as a training ground. Both the university and researchers in the DMH are working to get numerical weather prediction models running. Vietnam is also actively collaborating with its neighbors, particularly in the southern part of the country, where the Mekong River Delta is located. There are several basin-wide projects that include Cambodia, Laos, Thailand, and China. In addition, Vietnam is now helping to train forecasters in Cambodia and Laos. Vietnam is unique in having an incredible variety of “second” languages. The library of the Hydro-Meteorological Center for South Vietnam in Ho Chi Minh City contains publications in French, English, Russian, and Vietnamese. Senior scientists were trained largely in Russian, whereas younger scientists are increasingly learning English. Rapid development in the country has made it difficult to attract staff, because technical expertise is usually valued more highly in other sectors of the economy rather than government service. Northeast Asia: China China was the only country visited in Northeast Asia. It is perhaps not a “developing” country in
the same sense as the others in this survey, but it is certainly a country with a developing and emerging geoscience base. Like India, China is a large country with tremendous contrasts, is developing rapidly (perhaps even more rapidly than India), with many world-class centers in the country. The level of development in information technology is notable. Internet access is widespread and inexpensive. As a large manufacturing center, computer equipment is also cheap. Resources exist to purchase capital equipment as well in the top-tier centers. Journals are widely available, and like India, a number of domestic science journals are produced, although they do not receive as much exposure or foreign submissions, because most of them are in Chinese. Again, availability is limited in many cases to top-tier centers. As an example, the Chinese Academy of Sciences has a very extensive on-line catalog and information search tools on its website (www.las.ac.cn) in both Chinese and English. The availability of Internet access gives researchers the ability to search and find papers on-line, and a large percentage of researchers visited at the Institute for Atmospheric Physics in Beijing make use of this. The use of English is improving in China. In many cases, younger researchers have a greater command of English than do more senior researchers. English as a second language is spreading, as mentioned earlier. In addition, Chinese researchers can afford to hire editors to help write papers in English if they choose to send them to foreign journals. 4. Synthesis & Recommendations Synthesis of results The results of the field and written survey permit a number of observations. Despite the individual conditions encountered, several common issues emerged. Some are not surprising and validate the initial hypotheses that there is a significant information divide,

19
and that it exists as a problem and limitation for many. Some of the results are counter to initial assumptions. Some of the reasons for problems with developing-country acceptance rates are easier to understand in light of the survey results. Expected Several results from the survey are not surprising. Chief among these is the high demand for scientific information of all types in developing countries. The needs of researchers vary, but most do not have access to current journal articles, and many would like better access to data. There also appears to be a significant deterioration of the Global Telecommunication System (GTS) in several regions of the world, so that meteorological services in some of the least developed countries are not receiving information on a daily basis. There is less information available now than in the past. In many locations, the basic protocol of the GTS, that information is provided locally and received from everywhere else, no longer functions effectively, and countries circumvent the GTS to get the information they need. It is also not surprising that there are few, if any, resources in most developing countries to pay for information. In some cases, there is barely enough to pay salaries. In most countries, information from foreign sources must be paid in hard currencies. These are inordinately expensive for most locations. Even where such resources exist, such as in India, the lack of hard currency makes it difficult to sustain funds to purchase information. This applies to journal articles as well as analyses and data. The Internet is changing the way people communicate in the developing world, just as it is in the developed world. Despite limitations, almost all of the researchers visited and surveyed have some sort of access to the Internet, usually to electronic mail. Everyone, from researchers to editors of international journals, agrees that the situation will likely improve, access will increase, and that electronic communication can reduce some barriers to
sharing information between developing and developed countries. This may operate on a more simple level initially in the least developed areas, where the Internet is already a lifeline for receiving weather data. On a more sophisticated level, higher bandwidth in world-class centers in the developing world may permit them to participate more fully in the global geoscience enterprise and gain access to a wider array of information. In some places, Internet cost is prohibitive, and bandwidth is still limited. This is most notable in Africa and in the former Soviet Union. It appears to be a limitation based both on government policies (monopolies on information and telecommunications) and on physical costs of providing access. In less developed regions of Africa and in Central Asia, governments control all telecommunications services. In isolated regions (such as Myanmar), extreme controls exist for political reasons. In addition, in many of these regions, the lower population density discourages competition for telecommunication services or limits the physical infrastructure for higher bandwidth. It is hoped that this will change over time, but it is likely to be slower and driven more by governments and donations than by the private sector. Many of the countries that lack Internet infrastructure also lack other basic infrastructure, so the digital divide is a broader expression of a development divide. With regard to publications, because of the cost of information, many locations do not receive desired information. In addition, there are barriers to publishing. Costs of publication, both in terms of mailing and postage costs, and page charges constitute a significant barrier. There is also a perceived bias against submissions from developing countries. This bias is real, and there are some good reasons for it, but the bias also discourages publication. In general, some of this is expected from the different focus of much research in developing countries, which is often more applied and less theoretical.
20
Unexpected Several results from the survey were unexpected. As noted earlier, Internet access is everywhere, and almost 90% of respondents had some access and were reachable by this means. In Asia, there were very few complaints about the quality or speed of access, just its cost. The physical infrastructure has developed rapidly from India to Southeast Asia to China. In more remote areas this may not be true, but at least for major universities, research centers, and meteorological services, the picture is improving. While few researchers were able to get all the information and journals they needed, several interesting encouraging trends were noted. A delay of up to six months or so to receive journal articles was not as important to many of those surveyed, as long as the information arrived eventually. In addition, language was not perceived as a major barrier to many. To some extent, this survey is biased toward countries and groups of people with a good command of the English language. However, in other countries without a tradition of English as a second language, it is rapidly becoming a second language. This is likely due to what could be called a “Microsoft Effect,” after the de facto standard in the personal computer industry. There is a desire for a common means of communication and expression, which gains users not necessarily on its merits, but is based on the number of other users. In many places, a younger generation is learning English and information technology for economic advancement, and this population is filtering into the climate and meteorology fields. However, language can be a big barrier. Ironically, one of the places where language was found to be the largest barrier is also the most developed country in the survey: Thailand. Thailand was one of only three countries visited not to have been a former European colony (Nepal and China being the others). Perhaps as a result, the strong local language and traditions have led to a lower penetration of English among researchers. This may also reflect the lack
of education in the field, as evidenced by the absence of a university program in climate or meteorology. The lack of a higher education programs in meteorology may not be surprising in Nepal or Uganda, but it is quite surprising not to have one in Thailand, a country of 60 million people and many universities. Rejection rates Finally, the survey provides some interesting answers as to why developing country submissions are rejected more often than others. The higher rejection rates are likely due to problems with methodology and the focus of research, as well as to cultural differences. Old or out-of-date methodologies could be partially corrected with better access to current literature. The focus of research in many developing countries is more applied than theoretical, and the focus of many journals is geared more toward theoretical research. In addition, significant cultural differences in many of these countries make adherence to the scientific method, developed in a European culture, alien to many researchers. In particular, younger scientists identified a risk in using new methods over traditional methods. And secondly, there is deference to authority that does not permit or encourage the questioning of senior scientists. Some of these issues are also prevalent in developed countries, but they are supposed to be factored out of the editorial process by peer review, and they are culturally less prominent. According to editors, and also according to most authors, language is not the major issue with submissions. Difficulty with written English often masks problems with methodology. Most editors see difficulty with English from European or Japanese researchers as well. Problems with language do make it more difficult for reviewers. Language and methodology issues often combine to create a bias on the part of reviewers.
21
5. Other issues raised In the course of the survey, several other interesting and important issues were raised which are largely tangential to the major goals of the survey, but are discussed briefly here. Sustainability The concept of sustainability or sustainable development has a very different meaning in many of the locations visited. In developing countries, scientists are often thinking of these ideas not in terms of environmentally friendly policies and development, but in more basic and literal terms: will a particular project or research initiative be sustained after funding from an international source ends? In many cases, research is conducted with donor funds, and projects cease as soon as these funds are exhausted. Capacity may be built in the process, but usually the activity has little lasting local (constrained) benefit. Examples of such projects range from initiatives to develop inventories of greenhouse gases and ozone-depleting substances to data-rescue efforts to microfilm or digitize climate records. Projects that are unsustainable usually do not have immediate and direct or tangible benefits to the affected country, while sustainable projects are those with tangible benefits, and usually low cost, or use domestic technology. This begs the question of what is the best way to ensure the maximum benefit and the maximum level of “sustainability” of efforts in developing countries. Privatization In the last decade, while it has become increasingly difficult for weather services in many developing countries to sustain their current level of activity, several experiments to turn weather services into semi-private or for-profit entities have emerged. 1 In 1992, the New Zealand Weather Service became a semi-private entity. In 1999, Tanzania did the same. In all cases, these entities receive government 1 The WMO calls this process “adjunctization.”
contracts to provide weather services. In discussions in Africa, both the Kenyan and Ugandan meteorology departments are considering a similar step. Several issues are involved. A key question is whether this will result in an improvement of available services. The basic concept is that users can be expected to pay for services. In Africa (as well as to some extent in New Zealand), civil aviation is a major user of weather services, which can be forced to pay (usually with hard currencies) for services. This enables the weather service to meet basic international aviation requirements. Without a basic weather facility at the Entebbe International Airport in Uganda, for example, international airlines would not be permitted to land. It is not clear that this pay-for-services policy could be extended to other key users of services (such as agriculture). Another question is how privatization or “adjunctization” will affect the availability of data for weather and climate use. New Zealand continues to provide data to the Global Telecommunications System (GTS) as required, and there are existing models to resolve some of these issues. 2 Organization The organization of meteorological services within a government structure may also have significant implications for providing services. These are issues that are felt in many countries and across many levels of development. It has been a big issue recently in Myanmar. Basically it is a question of outlook, culture, and expected users. In some cases, the meteorology and/or hydrology service is under an “Environment” Ministry (usually in a more developed country). In smaller countries it is often linked to a Transport ministry, sometimes very tightly linked with civil aviation, or to an Agriculture Ministry. In other cases the meteorology service may be viewed strategically as part of the Air or Armed Forces. This has significant funding implications and for access to information within the service and with other countries. In other cases, climate and meteorological services
2 WMO Resolution 40 spells out many of the issues regarding commercial activities (see www.wmo.ch).

22
might be split (between Agriculture and Transport ministries, for example). Electronic publishing The future of the scientific journal is now in flux. The traditional model of scientific publishing uses a peer-reviewed editorial process to judge the quality of submissions and to regulate how much is appropriate to disseminate in print. However, with electronic publishing the costs of printing and distribution drop dramatically. At the same time, an increasing volume of research makes the role of the editor even more important. The change in the economics of scientific publishing may have profound implications for the future of the scientific journal. It is not clear that electronic publishing is substantially cheaper to produce in a developed country, where much of the labor costs for editing and layout are fixed. This may be different for developed and developing countries, since the cost structure of a journal may be different. In developing countries labor costs are low and fixed costs of printing are high. Understanding these costs and the appropriate balance for developing country journals in the electronic age will be important for assisting these journals in the future. Future and role of the GTS The Global Telecommunications System (GTS) for weather information has been very effective at sharing information for forecasting. However over the last 20 years the availability of station data has decreased, due to the loss of stations on the network. Major international centers have compensated with more complex modeling systems and space-based sensors. However, these systems may not serve us well for monitoring climate. Trying to increase the participation of countries in the network and the data contributed to the GTS will be very important for climate monitoring. In addition, there are currently discussions on how to best utilize the GTS in conjunction with
the Internet. The use of the packet switched global Internet to deliver GTS data will enable a much larger bandwidth and enhanced interactivity with all national centers connected to it. This may enable the system to provide an expanded set of products for climate and environmental monitoring, which may benefit all parties to the system, as the original GTS has done. 6. Recommendations The results indicate several obvious avenues for dealing with the information divide. Not all proposed recommendations will be appropriate for every country, but most countries will benefit from these recommendations. Short Term In the short term, enhancing the availability of electronic journals would be of great value to most developing countries. This might be done in two different ways. One way would be to permit open electronic access to journal back issues that are available electronically. Given that up-to-the-minute access does not seem to be critical in many developing countries, having a one-year delay in availability, similar to what journals such as Science has done, or what the American Meteorological Society is planning, would be reasonable. This solution would benefit those with well-developed and reliable Internet access. In addition to this, back issues of electronic journals should be made available on CD-ROM sets to libraries in developing countries. One of the problems with electronic access is that it may have a prohibitive cost, and if Internet access lapses or fails, all information is lost. If access is interrupted, or if a website becomes unavailable, archived copies would be invaluable, and the access is not dependent on continual contact or payment. While many locations struggle with Internet access, almost all locations visited are capable of reading a standard product such as a file in Adobe Portable Document Format (PDF),
23
its open-source derivatives, or HyperText Markup Language (HTML) used on the Internet. CD-ROM access is also easier to disseminate broadly. While this may not be the aim of publishers in developed countries, it should be their aim in developing countries. CD-ROMs can be easily copied in many places, allowing researchers to share the information with others who currently have no hope of getting the information. Such a solution would strictly violate some of the copyright permissions currently inherent in journal publishing. This starts to get at larger issues of whether information should become free, and the costs of producing information (see below). In addition to journals themselves, on-line database and searching tools should be made available to scientists from developing countries. This is particularly true for tools that were developed by scientific societies such as the Earth and Space Index from the American Geophysical Union, and perhaps Meteorological and Geophysical Abstracts. This will enable researchers to become aware of the latest research and where to find it when it does become available. Medium Term In the medium term, efforts could be focused on trying to better include researchers into the global geoscience community by encouraging publications and dissemination of information from developing countries to one another, as well as to developed countries. There are significant benefits over time for those in developed countries trying to understand global phenomena. The way that such support might most usefully take place is to find ways to institutionalize informal information networks, reduce the barriers to entry, and make communications and networking in the sciences more open. This might be accomplished by providing forums in which researchers can learn about what is being done by others in similar areas
around the globe. Rather than focusing on expanding the already significant meeting agenda, such activities might be conducted as opt-in electronic communication groups: either mailing lists, websites with information, and/or dedicated climate and meteorological “collaboratories” (virtual collaborations and laboratories), which could be set up in individual subject areas with interested parties. Focusing specifically on publications, mentoring assistance could be provided to developing-country scientists to help them through the editorial process. This happens in an informal way when developing-country scientists spend time in developing countries, or when collaborations result. But it might be institutionalized by matching up volunteer developed-country scientists with developing-country scientists. One way to do this is to submit a paper with a developed-country scientist as the last co-author and the corresponding author. The developing-country scientist gains exposure, and the developed-country scientist (who might be a junior faculty member, researcher, or post-doc) would gain publication credit for their efforts, without taking credit away from the developing-country researcher. Ideally, volunteers could work on papers in their field of interest and it might lead to future collaborations. It might work in a centralized way, or it might work on a journal-by-journal basis. Long Term In the long term, there is a need to improve the capacity of developing countries to use new technologies and methodologies. There are two important avenues for doing this. One is through education, and the other is by enhancing the capability and viability of developing-country scientific journals. Educational development and access to education can be greatly enhanced by the Internet and information technologies. The WMO is involved in some of these efforts, but programs could be expanded from core WMO competencies into data analysis and other
24
methodologies, particularly for climate research. Regional Meteorological Training Centers (RMTCs) are already using and developing electronic tools to teach forecasting and analysis (for example, CD-ROM courses on how to use satellite data). These programs could be expanded to include new tools and methodologies to examine climate data and trends. Packages might contain sample data sets as well as articles describing the methodologies. In many cases, these could be built from electronic materials developed by faculty to teach graduate students. One example might be objective analysis tools for analyzing climate data, including not just spectral analysis, but singular vector and empirical orthogonal function or wavelet analysis. Similar packages might be built for using numerical prediction models for meteorology or hydrology (including how to develop input data sets from analyses or station data). Packages and tools that assist scientists in learning how to use and search for information electronically would also be useful, as many scientists have not been trained in information searching methods. Secondly, the transition to electronic publishing also portends fundamental changes to scientific journals around the world. Not only developed countries are affected. In fact, it is likely that developing countries would benefit the most from a transition to electronic publishing. Much of the cost of a journal is fixed by the time and labor needed to communicate between author, reviewer, and editor, as well as for typesetting, copy editing, and formatting. An electronic journal merely dispenses with printing costs in favor of electronic distribution. In developed countries, where labor and time are expensive, the fraction of costs eliminated by printing and postage are likely smaller than in a developing country, where labor is cheap, and many publications are sent though a comparatively expensive mail system. Developing-country journals might save significantly by a transition to electronic publishing, as long as they have the technical capacity to make the switch. The transition might be encouraged through assistance with open-source electronic software
and expertise from journals and societies that have already accomplished it. References Gibbs, W. W. Lost science in the third world.
Scientific American, August:92-99, 1995. ISI, 2003. ISI Essential Science Indicators
(geosciences), www.isiknowledge.com, 2003.
ITU (International Telecommunications Union),
Basic Telecommunications Indicators, Geneva, 2002.
Kandlikar, M. and A. Sagar, Climate change
research and analysis in India: an integrated assessment of the North-South divide, Global Environmental Change 9:119−138, 1999.
May, R. M. The scientific wealth of nations.
Science 275:793−96, 1997. Acknowledgments Thanks are due to Al Cooper of the Advanced Study Program at NCAR, and to Robert Harriss of the Environmental and Societal Impacts Group at NCAR for their encouragement and support for this study. Thanks also to Dr. Sundararaman and Dr. Love of the IPCC Secretariat for their assistance with mailing. This report would not have been possible without the excellent editorial assistance of D. Jan Stewart and the graphics expertise of Anne Oman.
www.esig.ucar.edu/infodivide

25
APPENDIX A: SURVEY FORM
International Survey of the Information Divide in the Climate & Atmospheric Sciences
Part One: Access to resources --------------------------------------------------------------------------- 1. Please list titles of up to 4 publications that contain articles or information most important for your work. If you know the country of publication, please indicate it as well. Title Country of publication A. [ ] [ ] B. [ ] [ ] C. [ ] [ ] D. [ ] [ ] 2. Do you have full access to all of these publications? [ ]Yes [ ]No If 'no', what are the reasons limiting your access? [ ] [ ] 3. Do you receive the publications as soon as they are published ? Please indicate [yes] or [no] for each publication in question 1. A.[ ] B.[ ] C.[ ] D.[ ] If no, how many months later? A.[ ] B.[ ] C.[ ] D.[ ] 4. Does any delay negatively affect your ability to do work/research? [ ]Yes [ ]No 5. Are there any publications you would like to have access to but do not? [ ]Yes [ ]No If yes, please list up to 3 titles: A.[ ] B.[ ] C.[ ] 6. How many Conferences do you attend in a year? (indicate number in each box) [ ]Domestic [ ]Foreign 7. Please rank the ways in which you find new articles/information (1=most frequently, 2=next most frequently, etc. leave blank ways not used) [ ]Find references in Articles [ ]Read new publications directly [ ]Search Databases If databases are used please specify names of up to two

26
databases: 1.Name:[ ] [ ]Paper or [ ]Electronic 2.Name:[ ] [ ]Paper or [ ]Electronic [ ]Get or hear about from Colleagues [ ]World Wide Web search or browse [ ]Hear results at Conferences [ ]Other Please elaborate [ ] 8. Where does the data/information for your work come from? (1=most frequently, 2=next most frequently, leave blank sources not used) [ ]generated by you or your institution [ ]from other domestic sources [ ]international meteorological or forecast data (forecasts, [ ](re)analyses, met satellite data) [ ]from other international sources 9. Do you have access to all the data you need? [ ]Yes [ ]No If no, what are the major reasons limiting your access? [ ] [ ] 10. Other issues or experience with accessing information/forecasts or data you would like to share [ ] [ ] 11. Do you collaborate with researchers in other countries? [ ]Yes [ ]No 12. If yes, please list up to 3 countries: A.[ ] B.[ ] C.[ ] 13. Means of communication. Please rank the means of communication you use with colleagues: (1=most frequently, 2=next most frequently, leave blank methods not used) With foreign colleagues: [ ]Phone [ ]Fax [ ]Mail [ ]E-mail [ ]Face to Face With domestic colleagues: [ ]Phone [ ]Fax [ ]Mail [ ]E-mail [ ]Face to Face 14. Is the most frequent means of communication indicated in 13. the means of communication you would prefer? [ ]Yes [ ]No If `no', what limits your use of your preferred means? [ ] [ ]
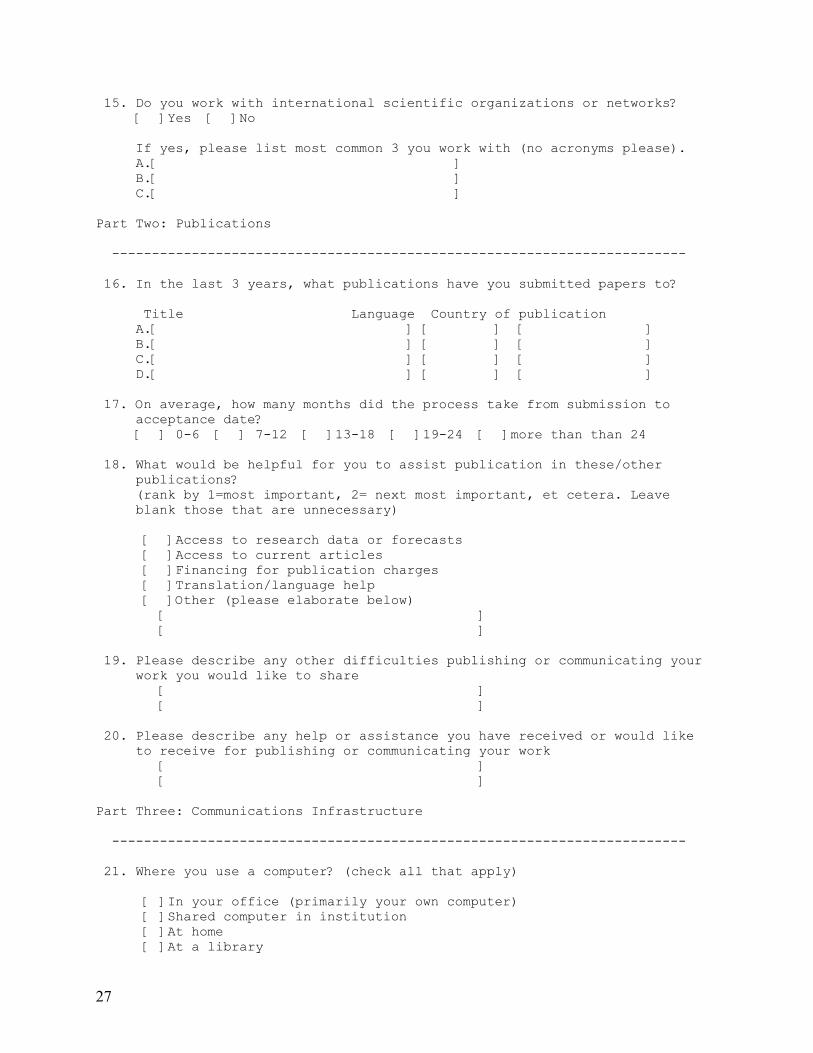
27
15. Do you work with international scientific organizations or networks? [ ]Yes [ ]No If yes, please list most common 3 you work with (no acronyms please). A.[ ] B.[ ] C.[ ] Part Two: Publications ------------------------------------------------------------------------ 16. In the last 3 years, what publications have you submitted papers to? Title Language Country of publication A.[ ] [ ] [ ] B.[ ] [ ] [ ] C.[ ] [ ] [ ] D.[ ] [ ] [ ] 17. On average, how many months did the process take from submission to acceptance date? [ ] 0-6 [ ] 7-12 [ ]13-18 [ ]19-24 [ ]more than than 24 18. What would be helpful for you to assist publication in these/other publications? (rank by 1=most important, 2= next most important, et cetera. Leave blank those that are unnecessary) [ ]Access to research data or forecasts [ ]Access to current articles [ ]Financing for publication charges [ ]Translation/language help [ ]Other (please elaborate below) [ ] [ ] 19. Please describe any other difficulties publishing or communicating your work you would like to share [ ] [ ] 20. Please describe any help or assistance you have received or would like to receive for publishing or communicating your work [ ] [ ] Part Three: Communications Infrastructure ------------------------------------------------------------------------ 21. Where you use a computer? (check all that apply) [ ]In your office (primarily your own computer) [ ]Shared computer in institution [ ]At home [ ]At a library

28
[ ]At an Internet cafe [ ]Other, please describe below [ ] 22. Where do you use a computer most frequently? [ ] 23. Do you pay for each time you use the computer in location in 22 above? [ ]Yes [ ]No 24. Do you have access to the Internet? [ ]Yes [ ]No If you do not have access to the Internet, please skip to question 31. 25. Where do you access the Internet. (please mark all that apply) [ ]From your desk/office [ ]From a Shared computer in institution [ ]From home [ ]From a library [ ]From an Internet cafe [ ]Other, please describe below [ ] 26. Where do you use the Internet most frequently? [ ] 27. Do you pay for each time you use the Internet from your most frequent choice in 26? [ ]Yes [ ]No 28. Does the cost of Internet access negatively affect your ability to do your work/research? [ ]Yes [ ]No 29. What Internet functions do you commonly use : (please rank all that apply, 1=most frequent, 2=next most frequent, etc. leave blank those not used) [ ]Electronic mail [ ]World wide web (Netscape, Internet Explorer or other) [ ]Remote use of other machines (Telnet) [ ]File transfer (FTP) or Download Files [ ]Other (please elaborate below) [ ] 30. Is your connection fast enough or reliable enough to permit: almost almost always usually, rarely, never, don't use (>90%) (>50% time) (<50% time) (<10%) Email [ ] [ ] [ ] [ ] [ ] Web [ ] [ ] [ ] [ ] [ ] Telnet (remote use) [ ] [ ] [ ] [ ] [ ] File download [ ] [ ] [ ] [ ] [ ] 31. Are there other resources or programs on the Internet you would like access to? [ ]

29
32. Please describe any other concerns, difficulties or experiences using the Internet you would like to share. [ ] [ ] Part Four: Descriptive Information ------------------------------------------------------------------------ Please tell us a little about yourself and your institution. This information is not for identification purposes, but to classify the responses. Answers will be kept confidential. A) Your Institution: --------------------- Institution Name: [ ] Division Name: [ ] Country [ ] Institution Type: [ ] Educational/ University/ College [ ] Government Research/Meteorological Service [ ] Non-Governmental Organization (NGO) (Please specify NGO type: [ ] for profit [ ] not for profit) Institution Size (approximate number of researchers) [ ] Department/Division Size (approximate number of researchers) [ ] B) Descriptive Information: --------------------------- Primary Field: [ ] Major Research Topic(s): [ ] Native Language: [ ] Other Languages Spoken (please mark all that apply): [ ] English [ ]Spanish [ ]French [ ]Russian [ ]Others If others please specify [ ] Other Languages Written (please mark all that apply): [ ] English [ ]Spanish [ ]French [ ]Russian [ ]Others If others please specify [ ] Primary Language used at your institution Spoken: [ ] English [ ]Spanish [ ]French [ ]Russian [ ] Other If Other please specify [ ] Written: [ ] English [ ]Spanish [ ]French [ ]Russian [ ] Other If Other please specify [ ] Your title: [ ] Your Primary Job:
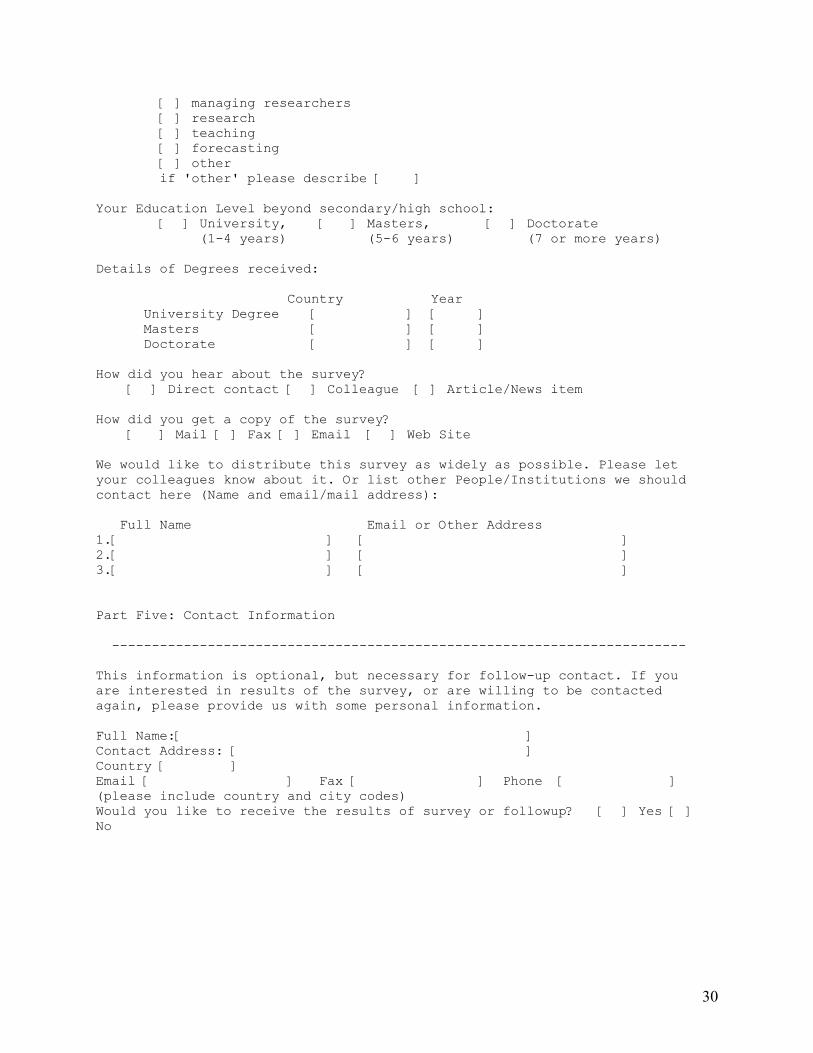
30
[ ] managing researchers [ ] research [ ] teaching [ ] forecasting [ ] other if 'other' please describe [ ] Your Education Level beyond secondary/high school: [ ] University, [ ] Masters, [ ] Doctorate (1-4 years) (5-6 years) (7 or more years) Details of Degrees received: Country Year University Degree [ ] [ ] Masters [ ] [ ] Doctorate [ ] [ ] How did you hear about the survey? [ ] Direct contact [ ] Colleague [ ] Article/News item How did you get a copy of the survey? [ ] Mail [ ] Fax [ ] Email [ ] Web Site We would like to distribute this survey as widely as possible. Please let your colleagues know about it. Or list other People/Institutions we should contact here (Name and email/mail address): Full Name Email or Other Address 1.[ ] [ ] 2.[ ] [ ] 3.[ ] [ ] Part Five: Contact Information ------------------------------------------------------------------------ This information is optional, but necessary for follow-up contact. If you are interested in results of the survey, or are willing to be contacted again, please provide us with some personal information. Full Name:[ ] Contact Address: [ ] Country [ ] Email [ ] Fax [ ] Phone [ ] (please include country and city codes) Would you like to receive the results of survey or followup? [ ] Yes [ ] No

31
APPENDIX B: COUNTRY CASE STUDY NOTES KENYA LOCATIONS VISITED 1. Kenya Meteorological Department, Nairobi 2. WMO Drought Monitoring Center, Nairobi 3. Kenya National Academy of Sciences
4. Institute for Meteorological Training (WMO RMTC) and ASMET (African Satellite Meteorology) training center.
5. African Academy of Sciences. 6. Meteorology Department, University of Nairobi. METEOROLOGICAL / CLIMATE SCIENCE COMMUNITY DESCRIPTION The meteorological and climate community in Kenya is concentrated in Nairobi. The Kenya Meteorological department hosts the National Meteorological Library, a training institute that functions as the WMO Regional Meteorological Training Center (RMTC) and the WMO sponsored Drought Monitoring Center for East and Southern Africa. The Department of Meteorology at the University of Nairobi has 15 faculty members and lecturers. As of December 2001 there were 2 masters students, 10 PhD students (none from Kenya) and 5-10 students in each of 4 undergraduate classes. Kenya has been a center for training for most of East Africa for many years. In addition, there is an active science base outside of meteorology and climate. The Kenyan Academy of sciences has an active program and journals, as does the African Academy of Sciences, which is headquartered in Nairobi. There is also an active Kenyan Meteorological Society, which holds a workshop every 2 years. But there is no funding to publish proceedings. MAJOR CONCERNS/ISSUES: The Ministry of Environment works on climate issues on a project by project basis, with funding from international agencies (including the US country studies program and the GEF). They are interested in participating in regional modeling efforts, not just the inventories and mitigation studies. A sustainable basis for information was desired. Sustainable in this context means continuing after external resources have been exhausted. Email access is expensive, bandwidth is low, and researchers do not have access to the Internet (almost a government monopoly). They often come to the Ministry of Environment for assistance, and the ministry itself may not have access after projects end. The Kenya Meteorological Department maintains 35 national stations by telephone and radio telephone links. They would like to install automated weather stations and would like a system to communicate more directly with rural areas. For climate records they started off with 2500 voluntary reporting stations in the 1960’s. Perhaps 400-600 remain, mostly because of a lack of funds to go visit the stations every year or two. Forecasting is conducted by computer plotting of GTS data, manual addition of other data (radio telephone links) and then hand analysis. The greatest need of the KMD is for data collection. They are hoping to delink from the civil service

32
and try to operate like a business (‘privatization’). Potential advantages seen from such a move are to get sufficient funds and to reduce bureaucracy. The KMD hopes to follow the aviation authority after it is ‘de-linked’. A large climate records archive exists. However, most digital data is on unread tapes and is deteriorating. Paper charts are used for analysis and forecasting but are not microfilmed or digitized. The KMD National Meteorology Library has a collection of journals and textbooks, which is fairly comprehensive. Many major journals were current to within nearly a year (January 2001 issues were on the shelf in November 2001). Most of the textbooks are old (first versions and more complete for 1960-1970’s than post 1980 books). Several journals are missing issues. Most international journals are from donated subscriptions or donated copies of journals. It is possible to do basic research and training but difficult to keep current in a disciplinary area with this information. The collection of WMO materials was more comprehensive. The Institute for Meteorological Training and Research (IMTR) houses the WMO East African Regional Meteorological Training Center (RMTC). It has 3 classrooms and computer labs for hydrology (Dutch funding), satellite meteorology (EUMETSAT funding) and students. Most information comes from the WMO, some from donated (American Meteorological Society) Journals. The IMTR subscribes to a few journals. The major issue is that they cannot afford subscriptions or books, and get by on donated textbooks. The center would like to be operationally focused with an emphasis on media (have a popular 5 week course with forecasters from 10 countries) and commercialization to get revenue to sustain and upgrade systems. The Drought Monitoring Center produces forecasts for all of east Africa. Resources include a 10 PC lab and an IBM server that is being prepared to run the RegCM (Regional Climate Model). These resources are funded by IRI and USAID. Much of the forecasting is based on using online data and forecast tools, such as 10 day forecasts from the Center for Ocean, Land and Atmospheres (COLA) in the USA, medium range forecasts from the Indian Meteorological Department and 7-10 day forecasts from the National Centers for Environmental Prediction (NCEP) in the USA. Hydrological forecasting is planned using a hydrologic model from the United States Geological Survey (USGS). The DMC is highly dependent on Internet connectivity for forecast data. The University of Nairobi Department of Meteorology does not have resources to pay even for postage and copies (for example, for submissions to journals). The department does not subscribe to journals, but gets some donated copies by informal links. Neither department library or university library has recent journals or books. 4 of 15 faculty have Internet access in their offices. Dialup connections exist to either the university computer science server or to the KMD. The university server was down the entire week of the country visit. Limitations on research were identified as : 1- Funding (some funding agencies will not fund government institutions) and 2- no textbooks or journals. There is no national body in Kenya (or in Africa outside of South Africa) that funds atmospheric science. Communication tends to be by mail even with domestic contacts and by email with foreign colleagues. The cost of publications is prohibitive, and many researchers in Kenya are discouraged by the cost, not realizing that they can get waivers. In addition, there is currently a problem attracting good students. Many students are going to other fields because there are difficulties for graduates of the program to get jobs (no
33
research money). Future strategies for the department of meteorology include increased involvement with the private sector. The Kenyan Academy of Sciences is trying to get a link to the online library at the Third World Academy of Sciences (TWAS) in Trieste, Italy. Major limitations on information were identified as the cost of Internet access, and the limited availability of computers. Some local Kenyan journals exist, and publication in domestic or international journals is necessary for academic promotions. Also, the dominant generation in Kenyan academia is older, and doesn’t use information technology (IT). Thus it is difficult to train students in IT. The African Academy of Sciences (AAS) indicated some general barriers to information exchange and publishing by African scientists. These were, 1- often research topics by African scientists are only of local interest. 2. The local nature of research often precludes verification. Northern journals are often narrow-minded. 3. The format of the submission may not match the journals’ requested format. 4. The authors might not know the journals because they do not have access to reading them. 5- financial constrains exist to publishing, even in copying and shipping. One suggestion from the AAS was to have ‘agents’ or ‘paper brokers’ to assist developing country scientists. INTERNET CONNECTIVITY/ PHYSICAL INFRASTRUCTURE Most of the Meteorological community (including the university) uses a satellite downlink from France given to the KMD. This line provides better reliability than other ways of connecting to the Internet. Computers were available at the university, but are old and unsupported (generally PC’s 5 years and older). University faculty generally have to obtain donated computers and purchase ancillary equipment (printers) themselves. Most university computers are not networked. DMC computers are networked, and many hooked up to the Internet on the KMD campus. In general, Internet access was easily available in Nairobi, but at significant cost. Speed was generally slow, with some down time. Occasionally fast access could be had. Interestingly, Kenya is a hub for African IT development. While the number of Internet users (56 per 10,000) is low, the number of Internet host computers is relatively high, second only to Thailand, and much higher than countries with a similar GDP level. This is probably due to the relative stability and education level in Nairobi, and its historical location as a hub for east Africa. UGANDA LOCATIONS VISITED
1. Department of Meteorology and Hydrology, HQ, Kampala. 2. National Meteorological Center, Entebbe 3. Mykere University, Dept of Geography & Dept of Computer Science, Kampala
METEOROLOGICAL / CLIMATE SCIENCE COMMUNITY DESCRIPTION

34
The Department of Meteorology and Hydrology has several divisions, and two other forecast centers, one at the Kampala airport (Entebbe) and one at Soroti (in the northern part of the country). The equipment at department headquarters is mostly PC’s. A few have CD-ROM drives. The main focus areas are operations, research and training. Operational data is sent and meteorological bulletins produced for 10 day forecasts, seasonal forecasts and hydro-meteorological forecasts. These are sent by postal mail to district level (59 facilities), and to the drought monitoring center in Nairobi. Bulletins sent by Internet where possible (20 users). Data from the Nairobi Drought Monitoring Center (DMC) is usually received within 10 days. Seasonal forecasts are developed in Nairobi (a forecaster travels to the workshop) and then the Uganda consensus forecast is modified. This is a WMO sponsored program. The meteorology department runs courses for training as a graduate course with Mykere University in Kampala. But they need 10 people for a course, and there are not that many job opportunities with the Meteorology department. Also, a lot of training is done with the IMTR Nairobi. They are trying to build in country capacity however. Class II training (below university level) is conducted at the National Meteorology Center-Entebbe with WMO instruction materials. In addition, a few forecasters are being trained in the US and Australia. Research is dictated by demand (funding). Areas include climate, adaptation, vulnerability, CO2 sequestration. Data for research comes from some journals and publications. No electronic access used, though they would like to move that way. Climate data is being archived on a data base system (Clicom v. 3.0 1996) on 33Mhz MS-DOS computers. Export printouts to tape and disk. 150 stations, 15 ‘synoptic’ stations. Problems include no supplies for automatic records (like sun-tracking paper) The department receives records mailed in each month. A former data rescue project with Belgium resulted in a broken microfilm recorder/reader. 5 stations were filmed, but they can’t read the microfilm. The meteorology and hydrology has a RANET satellite system with 12 sites in Uganda. They uplink data to the system (warnings and bulletins) via the Internet and they download data via satellite (DMC Nairobi bulletins are on RANET). A radio and computer are necessary for reception. The Department of Geography at Mykere University has worked with the Meteorology Department on training in the past. Students have been funded by the WMO. The program was shelved but focused on staff training. There are also undergraduate courses on climatology. The major problem with this research is access and affordability of information and poor record keeping. The university cannot purchase foreign journals or textbooks. There is Internet in central computer labs and main library, but no Internet in department. No dedicated research time, teaching only. The information science department at Mykere University maintains an ISP for the university and a computer lab. It has several large labs with 100 computers (for 400 students). The ISP costs US$30,000 /month. The department has distance learning on-line. They hope to get some

35
electronic journals through Donor funding. The department uses some electronic databases, trying to get optical fiber links to other regional universities. Sustainability of funding for Internet access is an issue for the university (beyond 1-2 year grant). They hope to incorporate this into student fees. MAJOR CONCERNS/ISSUES: The department of meteorology and hydrology has major concerns about trying to improve the flow of data, and to maintain its station network. They would like to get a better satellite data receiver for their national meteorological center. For research, journals are too expensive. Only free journals are available. Standard download speeds take 40min/MB or US$4/MB. CDROM training materials would be useful, but few machines have CDROM drives. The National Meteorological Center has several issues regarding data collection. Currently no data is received from central Africa (Congo) to the west. The Center has one system to get satellite imagery, and can use the Internet to get data from Nairobi, including some ECMWF analyses. They also use web to look at South African data that might not make it through the GTS system. Funding is part of the problem. The automated reporting system at airport needs replacing but the government doesn’t allocate enough funds. The department of Meteorology and Hydrology is also thinking of trying to transform itself into an independent agency. They are hoping to be semi-autonomous in 1-3 years with funding from the government, research and consultancy funding, and sale of products. Tanzania is an example for Uganda, they have just finished ‘privatization’. The major concern for the University is to sustain IT infrastructure, and for basic funding of core services (textbooks, Internet access). Hardware appears to be available. But sustaining connectivity to Internet (sustainability) takes funding that may not be available in future. INTERNET CONNECTIVITY/ PHYSICAL INFRASTRUCTURE The Deptartment of Meteorology HQ has dial up Internet access on 3 PC’s but it is very expensive. The ISP is $65/month unlimited access, but a telephone charge of 150USH/min (0.1 USD/min) is levied. There is thus a large cost for multiple lines. The department is trying to reduce the cost with a wireless connection and an internal network, but the cost is US$10,000 up front and $250/month. The NMC in Entebbe is connected on 14kbps line through the Kenya Meteorology Department in Nairobi. They get some forecast products from ECMWF through this line. Commercial Internet access in Kampala (Internet cafes) was not cheap and was not fast. Connections were intermittent and by relatively slow modem links. Failures were common for downloads.

36
INDIA LOCATIONS VISITED 1. Indian Institute for Tropical Meteorology, Pune (IITM) 2. Indian Meteorological Department, Pune (IMD) 3. Physical Research Laboratory (PRL), Ahemedabad 4. Center for Atmospheric Sciences, Indian Institute of Technology (IIT-D), Delhi 5. IBM Research Lab, Indian Institute of Technology (IIT-D), Delhi 6. Indian Meteorological Department (IMD), Delhi 7. National Center for Medium Range Weather Forecasts (NCMRWF), Delhi METEOROLOGICAL / CLIMATE SCIENCE COMMUNITY DESCRIPTION The top levels of the Indian climate and meteorological science community have good collaborations between principals and western researchers or institutes. Joint projects lead to resources and collaborations between senior and junior staff. Many of the top level Indian scientists are western trained or have western experience (post-graduate). Many post-doctoral students study abroad and many of these scientists publish in international journals. This is helped by the fact that English is rarely a problem for these scientists. Internet access is rarely an issue. Most of the world-class research centers visited had dedicated connections, usually from a desktop. Below this top tier science there are many other universities that do not have the same access to resources or collaborations. Their training and funding levels are not as high, and they are not as well connected. The status and issues regarding Internet access at these institutions is unknown. The Indian Institute for Tropical Meteorology (IITM) in Pune has several large research divisions that study and model monsoons, as well as aeronomy and the upper atmosphere. They are running climate and chemical models. The goal of the modeling division is to run a coupled ocean—atmosphere general circulation model. IITM is affiliated with the university in Pune, which has a small number of students. The institute has a large library with 30-40 years of many international journals. The Indian Meteorological Department (IMD) Pune is the second largest center for the IMD after the headquarters in Delhi. There is a large forecasting center, which forecasts tropical cyclones, as well as seasonal forecasting, agricultural forecasts, and ocean forecasts. The IMD National Data Center for Climate Records is located in Pune. The center is digitizing climate data onto CDROM. There are old digitized tapes as well they are trying to migrate forward. Also, the IMD training center, a WMO RMTC, is located in Pune. Training is conducted for IMD staff, as well as for many other countries in the region. The Physical Research Laboratory (PSR) in Ahemedbabad has 6 research divisions, Space and Atmospheric Sciences is one. Other divisions include astronomy, geology, theoretical physics and physical oceanography. The institute is part of the Department of Space. The institute has students as well as researchers. Many of the groups are quite well connected internationally. It has good computer networks (internal), central file servers and an IBM

37
RS/6000 SP supercomputer (similar to computers at NCAR with fewer nodes). Researchers publish some work in international journals. The library has an electronic catalog (www.prl.res.in/~library), and many major international journals. The IBM research institute at the Indian Institute of Technology, Delhi (IIT-D), has a climate research group. The IBM research center has 60 people, and the atmospheric science group has 4 scientists, paid by the US based computer company. The Center for Atmospheric Sciences at the Indian Institute of Technology, Delhi (IIT-D) has 16 faculty and 35-40 students. Much of the work is done on monsoons, including trends, and predictability and air pollution. The research includes running numerical models as well as analyzing data, both station data from India as well as analysis data from overseas, usually acquired through collaborations or individual requests. Graduate students at the center frequently do post-doctoral fellowships abroad. The National Center for Medium Range Weather Forecasting (NCMRWF) in Delhi is a new center that does numerical modeling and medium term (10 day – seasonal) prediction. They have 35 scientific staff, significant computational resources, and are running several global and regional models, some with ensembles. They have numerous collaborations with centers internationally. Their main concern is trying to enhance monsoon prediction using models. They are operationally getting most of the standard GTS data products, but are now trying to get more information to do data assimilation. For these products (e.g. satellite radiances) the data are available but there are bandwidth limitations to receiving the data. MAJOR CONCERNS/ISSUES: Education Outside of top tier schools (such as the IIT system) there was concern that India’s university system was weak, particularly for research. Original work and development work (for example, of models) is difficult. Universities are not turning out good students in climate/meteorology. Most of the good students are going into information technology jobs. Journals Journals are available to ‘top’ centers. IITM and PSR both have large and well used, well organized libraries, with most major journals available. Some journals are missing, and journals are generally 2-4 months behind on the shelves, but common international journals are available. The delay is a minor issue. Cost was a concern for the libraries, most have had to cut back on their journal subscriptions. Some scientists do use electronic journals, mostly for search functions and to find abstracts. In addition, many Indian journals exist, several in English.

38
Mausam is the official journal of the IMD. It has a long history and is circulated internationally. However, there have been recent troubles maintaining a regular schedule of publication. The slip in regular publication schedules has resulted in Mausam being dropped from several international electronic archives. The new editor is trying to get the journal back on course. It faces a particularly tough time serving the needs of the IMD as well as producing an internationally relevant journal. There are several other top tier Indian journals that many researchers publish in (Earth & Planetary Sciences, Indian Journal of Marine Sciences, Proceedings of the Indian Academy of Sciences). One problem is that in some sub fields (like atmospheric chemistry) there are not enough reviewers for articles in domestic journals. Publishing Cost is a major issue for most scientists when sending articles to an international journal. Only a few of the scientists knew that it was generally possible to get page charges waived. The subject also determines journal selection. Often work is not considered to be relevant. Several scientists commented on a perceived ‘reviewer bias’ against them when publishing in international journals. This bias might be related to the choice of subject matter. Methodologies in many research articles are often developed or applied with limited access to international journals or to data sources. Modelers have a tough time publishing since they cannot do lots of computer runs. New methodologies, techniques or instruments are often very hard to get developed or funded. It is easier if one conforms to existing norms. Nonetheless, despite these barriers, top tier scientists view publishing in international journals as important for recognition. This is especially true for younger scientists and those with training abroad. Several reported that their “good” research was sent to foreign journals and that they sent more review style articles to Indian journals. Some good domestic journals exist in India, and these are commonly read and published in. Mausam, the official IMD journal, is probably the best known. Data Cost is an issue for getting data. No one seems to be able to get access to data from ECMWF, because they are unable to pay. NCEP/NCAR reanalyses are commonly used. Several scientists noted that they will package NCEP/NCAR Reanalysis data on CD for other institutes in India without Internet access. The NOAA Climate Diagnostics center website is also commonly used. After the September 11th terrorist attacks there was some difficulty in accessing the US government web sites. Some institutes outside of the IMD were concerned that their access to international collaboration is limited. INTERNET CONNECTIVITY/ PHYSICAL INFRASTRUCTURE Internet access in India is relatively widespread for the top tier science community. Internal networks and dedicated Internet throughout research buildings was common. Only senior people had computers in offices, others shared machines. Computer networks included several relatively new supercomputers, and many mini-computers (multiprocessor UNIX machines). India has

39
even built some of its own supercomputers (massively parallel architecture off of standard Intel microprocessors). Internet on the street varied by location. In major cities in north India, access was quite good. In several more rural locations or in the south, either government security regulations (near the Pakistan border) or frequent power cuts made Internet access more difficult and slower. Dial up lines were common. Big Internet cafes for locals were found in major cities (Delhi for example). NEPAL LOCATIONS VISITED 1. Meteorology and Hydrology Service Headquarters, Kathmandu. METEOROLOGICAL / CLIMATE SCIENCE COMMUNITY DESCRIPTION The Meteorology and Hydrology Service has links with international groups studying mountains. Also there are several active non-governmental organizations working on development and environment issues with some capacity in Kathmandu. The university in Kathmandu offers a BS in meteorology and has a department of Meteorology. Some climate change research is conducted under UNEP grants, mostly for national communications under the Framework Convention on Climate Change. Also, the research division has grant money from the US Country Studies Program to do an emissions inventory and to look at adaptation to climate change in Nepal. MAJOR CONCERNS/ISSUES: No upper air information exists for most of Himalayan region. Also, data is only received from a few outside stations (Delhi and Darjeeling only). The service would like help for establishing their own upper air networks. They are part of WMO Voluntary Cooperation Program, and would like to get some radiosondes, but they are too expensive to purchase. More development aid in the past meant more data. From 1978 to 1980, upper air data was taken as part of MONEX through a UNDP project. The service issues 24 and 48 hour forecasts. They use NOAA & GMS satellite data (there is a receiving station for NOAA data). They also use the Indian Meteorological Department website (and satellite images from the Indian satellite on this site). The service would like to get analyses, but currently they get nothing (can’t pay for ECMWF analyses). They do get Bracknell Aviation analyses through a satellite distribution system as an ICAO/WMO project. They have received a computer and VSAT receiver for forecast products only. Some facilities are not operating (for example- a US installed Doppler style radar which has some broken parts and doesn’t operate). Major needs are a better satellite data receiver and they would like to get a numerical model. Have several trained people (MS from US universities).

40
Nepal is currently trying to develop a better hydrological forecasting system. It is easier to get surface stations to report (43 stations in Nepal for rainfall). They want to borrow a model to do flood forecasting. Computers shouldn’t be too much of an issue. Training on using a model would be more helpful. Publications are an issue. There are no resources to pay for journals. Nepal does get some donations: some AMS journals, and the JMSJ from Japan. Most researchers never really look at journals for publishing. When they do, they look to journals that are free to publish in. Most research publication is done personally (no resources are provided for publication). No hydrology journals are received. The Internet is helping. Recently the Third World Academy of Sciences (TWAS) has tried to make articles available on the Internet, some in meteorology/ hydrology, more would be helpful. Most of the time papers can be free, and they can get papers over Internet. Data is mostly self-generated, sometimes they get data from other countries for projects. INTERNET CONNECTIVITY/ PHYSICAL INFRASTRUCTURE Computer facilities are mostly personal computers, Pentium III or Pentium 4. The satellite downlink facility is located at the international airport. The forecasting center at the Meteteorology Department gets satellite data on a land line from Delhi. Synoptic reports come from the GTS on a 56k modem line. Computers are not viewed as a major issue. Internet connectivity in Kathmandu area is good, relatively fast Internet connections (at least for foreigners). A few Nepalis were found in Internet cafes in travelers areas. THAILAND LOCATIONS / PEOPLE VISITED 1.Asia Disaster Preparedness Center (ADPC) 2. Thailand Meteorology Department, Climate Division 3. START Secretariat, Environmental Research Institute, Chulaongkorn University, Bangkok & START members from several universities METEOROLOGICAL / CLIMATE SCIENCE COMMUNITY DESCRIPTION Thailand has a large number of universities, several prominent and internationally recognized NGO’s and a Meteorological Department. Agriculture and hydrology are the foci for much of the research and forecasting work that is done. There is an active university research community, mostly in agriculture, hydrology and forestry. The Thailand Meteorological Department (TMD) has generally good facilities, and 10 divisions. These include a climate division and a research division. Discussions were held with staff from the hydrology division and the climate division. The climate division has 50 people and 20 researchers. Research projects deal with statistically analyzing 50 years of domestic climate records and forecasting. The TMD has a state of the art forecasting room, and radar data from around the country (but little of the radar data appeared to be operational except for the Bangkok airport). The climate division is trying to use the MM5 mesoscale model, running on a
41
PC. They have downloaded the code from the Internet in conjunction with a Japanese sponsored project and are trying to get it to run. But they do not have initial conditions for it. The TMD has a supercomputer on which some numerical modeling is done. In general it seems that Internet access and computer infrastructure are not a problem in Thailand (for universities and for the TMD). Submission of articles to major international journals and to conferences appears to happen occasionally for the ‘top tier’ of researchers well connected internationally. European Journals were the most commonly cited (Atmospheric Environment, Tellus). It is difficult to publish in these journals due to the ‘level of data analysis required’. Access to journals is fairly good. Some researchers have access to electronic journals like the Journal of Geophysical Research. There is an active inter-library loan system in Thailand that works. In addition, a new ‘JournalLink’ program pools subscriptions and trades journals on loan. Electronic journals work well for professors, but do not work well for students where English is a problem. Sometimes they are just able to get the abstract of an article, or the volume/issue is missing. In South East Asia, the capability for state of the art analysis is limited. This is probably not a computational problem. Even many of the ‘internationally connected’ researchers do not have the technical background for some of the analysis. Most work is ‘applied’, not theoretical. Many western journals publish only ‘theoretical’ work. There exist a few ‘regional’ journals as well, on topics such as remote sensing. Several university professors indicated that they are able to request articles by email to authors. A delay of weeks to a month is okay for receiving papers. Getting information, particularly data, depends on the effort of students, as no systematic data collection exists. Kasetsart University is more concerned with agriculture. They have many English language journals and Japanese journals in English. Few students pay attention to climate change. In general, there is no university level program in Atmospheric Sciences or Meteorology. At Chulalongkorn University, the capacity that exists is under geology (which is transitioning to earth sciences). Chulalongkorn University is getting a staff member for Meteorology (fall 2002). Their major effort is trying to get data, and build collaborations. Currently they have an observatory in central Thailand to do radiation budgets, as well as having a LIDAR (aerosols to 10km) and a low level wind profiler (2-4km). The latter two instruments are from Japan. A regional flood forecasting system, and active regional research on the hydrology of the Mekong river are currently some of the major work of the START body, with input from several other countries in the region. Within the region, it was noted that Indonesia has better information and data collection than some other countries due to an influence from Australia. Within countries, there is a huge divide between climate and meteorological services. There is reluctance to incorporate climatological data into 3—10 day forecasting, at least in Thailand. It was also noted that there are issues associated with the administrative location of the meteorological services in various countries. This affects access to resources and data.
42
Thailand’s Met Department is under the ministry of transport. In Bangladesh, it is under the Ministry of Defense (also see discussion under Myanmar). In general the Meteorological agencies seem to be lagging behind environmental ministries/agencies. Meteorological agencies could leverage a lot of resources by moving to climate studies. Weak links exist between climate change and climate variability communities. MAJOR CONCERNS/ISSUES: Kasetsart University faces a problem with limited understanding of English by students. It is generally not a problem to access data on the Internet. The difficulty in Thailand is the human capacity to use data. Large quantities of data are an issue (for example: model output). One of the big concerns regarding data is the usage policy of data holders in the South East Asia region. Lots of data for climate, hydrology and oceanography is restricted by countries on national security grounds. This is especially true for data collected by militaries (such as oceanographic data collected by the Navy). China, Cambodia, Malaysia and Myanmar are difficult to get data from. Human networks and collaborations can solve the data problem between developing countries. Lists of experts willing to help developing countries might assist with some of the ‘global’ datasets. The concept of a special program to assist developing country scientists with data requests was discussed at the START center with representatives from universities and the Thai Meteorological Department. One problem with such a program is that capacity for using data is limited. More capacity has to be built to send students overseas and bring them home to Thailand with PhDs for teaching and research. Most PhD’s in the TMD do not teach. For example: the TMD has a supercomputer. But it is under-utilized. Many other countries in the region have better training facilities than Thailand. The Hydrology division of TMD reports that while flood forecasting has received increased attention, the data collection is still problematic. They have tried advanced telemetry projects for automated hydrology stations, but the equipment at the station was stolen. Also, high humidity and insects/animals/children create instrument problems. They have not gotten the station running on a reliable basis. Only one staff member exists for many provinces. Stations are often sited for political reasons. The TMD indicated that limited higher education in meteorology/climatology was a significant issue for Thailand. The TMD has a 6 month training course in meteorology, and some WMO support for further training. A majority of forecasters are trained in the department. The limited knowledge of English is a serious limitation on the research division. This is reflected in the quality and quantity of journals in the TMD library. There are very few textbooks in English (or any other non-Thai language) published after the early 1970’s. The TMD indicated a need for more scholarships for study abroad. The TMD staff (climate division) indicated that they do not have enough background knowledge to read the journals and understand the methods. Recent journals were particularly difficult. There is interest in Internet training tools or course materials. The TMD hopes to raise standards with scholarships and exchange programs. TMD climate staff are interested in collaborations with foreign countries but do not know whom to contact.

43
The Asia Disaster Preparedness Center (ADPC) expressed some more general concerns about research directions in the South-East Asia region. National groups have emerged and climate change has become an excuse to do more general or more traditional ‘environmental’ work. Also, there is not enough linkage across communities. The problem has been approached from the wrong end. Certain vulnerabilities to climate change do not depend on how much climate change, and are applicable to general climate variability issues (Adaptation to ENSO for example). INTERNET CONNECTIVITY/ PHYSICAL INFRASTRUCTURE Internet access in Thailand was not thought to be an issue by anyone. The speed of access was generally quite good, particularly for those with dedicated connections. University and NGO communities seemed to be well supplied with reasonably new computer equipment. The TMD has a new and well equipped forecast discussion room, with multiple monitors and projection equipment. The cost of commercial Internet access does not appear to be an issue either. None of the people surveyed thought cost was a limiting constraint on access to the Internet. Some concern was expressed over the acquisition of large data sets and the speed with which this was possible. Street level Internet access was relatively fast and inexpensive in travelers areas of Bangkok. Computers we readily advertised as well in newspapers and on billboards. MYANMAR LOCATIONS VISITED Department of Meteorology and Hydrology, Yangoon METEOROLOGICAL / CLIMATE SCIENCE COMMUNITY DESCRIPTION The Department of Meteorology and Hydrology is most of the community in Mynamar. Little community or capacity exists outside of the department in Yangoon, except for a regional forecast center in Mandalay. Climate records are being digitized to CDROM as part of an ASEAN project 60-70 years of records. MAJOR CONCERNS/ISSUES: Budgets are limited (particularly in hard currency). International cooperation is less than other countries. Instruments and computers are ancient, even conventional instruments. Automatic weather stations are obsolete and new ones are too expensive. The WMO Voluntary Cooperation Program has helped a little bit. A new satellite receiver was recently received from China. The department gets real-time satellite imagery from the Japanese GMS satellite. They want to also get Landsat images and GIS system. The department would like to update meteorology and hydrologystation networks. Currently they are using 25 year old donated single sideband communications system from the USA. 27 World Weather Watch stations exist, and they want to replace old instruments and telecommunications. The GTS system receiver has no print head and they can’t find one. GTS data comes to a central government satellite facility, then by phone line to the deparment. 4 upper air stations are listed
44
for Myanmar, but they only get temperature and humidity, not winds from current sounding system. Furthermore, only 1 station is working (Mandalay). No data is sent up to the GTS. Education and training is a significant concern. It is the second biggest problem after the data collection system. The department still needs skilled professionals (for forecasting and management). There is less professional development in the next generation. Some people have been sent out of the country for advanced training. Want to send more people for post-graduate training. The meteorology department has candidates, but can’t get spots or funding. Some more scholarships have been appearing in the last few years. The department trains lower levels of staff in house with a degree program in meteorology and hydrology. Some people go to regional RMTCs, mostly to the ASEAN science and technology center in Singapore. Also to the Philippines and China (seismology and meteorology). People go to India as well for training in hydrology, instruments and telecommunication. They cannot purchase books or journals for library, and have to rely on getting WMO and other countries’ publications (Journals). Get some AMS journals, JMSJ, QJRMS, plus WMO and IPCC publications. The library contains few journals from the US and Japan and some old textbooks. Also, the library is disorganized. The department recently purchased a system for doing graphics for TV news. They have their own studio and trained presenters in house to produce a show for TV. The system also can be used for forecasting with several numerical models installed. They need better data link to feed data into models. The system is powerful at communicating to users and raising the visibility of meteorology department. Research work of the department is limited. Principals do 3-4 research projects a year. Mostly climatology and the monsoons, based on synoptic maps. Also, the department is interested in the impact of ENSO on climate in Myanmar and the monsoon. They have some stations with 50 years of data or more to do climate studies. Most work is published in department or presented at workshops or in domestic science and technology journals. Mostly results are published in English, sometimes in Burmese. There is also some research on hydrology and river forecasting. Hydrologic forecasting is done with an empirically derived statistical model. INTERNET CONNECTIVITY/ PHYSICAL INFRASTRUCTURE The department of Meteorology and Hydrology does not have Internet access. They are trying to get it from the government. An internal request from Met & Hydro goes to their ministry (transport) and transport has to go to higher level for approval. There is an email account. The department has a small number of computers. Most notable are the graphics system for television, and the satellite download system. Telecoms: data collection by Single Side Band (SSB) system GTS by satellite, 50 characters/minute. The GTS system needs an upgrade. It is slow and the hardware is no longer functioning. Most importantly, they want their own independent satellite antenna, not to work off of the government system. In May 2002, ground telecom failures in

45
Yangoon (telephone system) limited all access to the GTS. This problem is more important than education and training. The department would also like to explore world space receivers as an option. There is an India Meteorological Department trial program to disseminate digital data on the Worldspace Asian satellite footprint. SUMMARY In summary, data collection is the biggest need. Education is a secondary need. The department relies heavily on an outdated GTS system because they do not have the Internet. Internet access is a governmental or political issue (controlling information) not an infrastructure issue. World space receivers are a possible option. Some data needs might be met with web access. Their internal data system also needs re-vamping. A data rescue project seems to be proceeding with extensive climate records. The Human infrastructure is in better shape, but also aging. Forecasters are capable. Hydrologic forecasting is based on correlations, but works and is continuously developed. No Numerical Weather Prediction is done. There is little capacity to implement it as well, particularly with current data problems. Some research on the monsoon is conducted, published in local journals, sometimes in English. There is no thought of publishing in western journals, though some publications are sent to Mausam (Indian Journal). Education levels are dropping. In the department, there is only one western educated MS or PhD in last 10 years. They need more advanced degree holders. The issues are scholarships and money as well as the political problem of getting people into programs and allowing people to go overseas. Computers do not seem to be too much of an issue. A decent internal network exists within the Yangoon campus. But no Internet access is permitted, so there is little need of the machines except for administration. VIETNAM LOCATIONS VISITED: 1. Hydrometeorology Center for South Vietnam, Ho Chi Minh City 2. Department of Meteorology and Climatology, Hanoi University 3. Disaster Management Unit, Ministry of Agriculture, Hanoi. 4. Institute for Meteorology and Hydrology, Hanoi 5. Climate Research Center, Institute for Meteorology and Hydrology, Hanoi 6. Hydrometeorology Data Center, Hanoi METEOROLOGICAL / CLIMATE SCIENCE COMMUNITY DESCRIPTION The Hydrology and Meteorology Service of Vietnam (HMS) is a fairly large organization with several research and forecast centers, including the Institute for Meteorology and Hydrology
46
(IMH) in Hanoi, and a South Vietnam Forecast center in Ho Chi Minh City (HCMC). About 15% of the Hydro Met Service does research. The service is weak on NWP, and forecasts primarily using statistics and synoptic charts. In addition, there is a Department of Meteorology and Climatology at Hanoi University. The Disaster Management Unit (DMU) of the Ministry of Agriculture in Hanoi is a externally funded (USAID and others) unit that assists in coordinating disaster forecasts. The DMU is implementing a commercial system to do 10 day forecasting. Using a system where model forecast data is sent by satellite (models are US developed MRF and AVN models). The Vietnam Television Network (VTV) has such a system. HMS forecasts of 3 days are not sufficient lead time. The HMS has 5 radar stations throughout the country. The HMS also has a GMS satellite receiver (in Hanoi, then sent to HCMC via phone line, clouds only, degraded resolution). There is also an unused NOAA satellite receiver. Forecasts are not made with numerical weather prediction, but using synoptic and statistical forecasts only (hence the 3 day limit). The big issue for the DMU is tropical cyclones. The DMU gets articles through the Internet, direct contacts or through workshops. Many don’t speak or read English, which is a limitation on using journals. Most DMU work published in Vietnamese. Writing in English is difficult for all. The Institute for Meteorology and Hydrology (IMH) has 5 research centers, a training division and about 158 scientific staff. The climate division collects climate data, and rescues old data (CliCom software). They are also involved in climate forecasting applying dynamic models, and are trying to apply the MM5. Initial conditions are an issue for their modeling efforts. The IMH Hydrology division is also trying to apply numerical models. The IMH training division has a Doctoral Program. University faculty (from Vietnam, mostly Hanoi University) are occasional teachers. They would like to invite foreign faculty. Also, they would like to send people abroad for training for 3—6 months. They are developing a program with the Netherlands and Sweden. Cooperation is progressing fast in many areas with the US, but no educational exchange yet. An agreement between the Meteorological services of the US and Vietnam was signed in 2001. They may also train students from Laos and Cambodia in the future. The meteorological libraries in both S. Vietnam (HCMC) and N. Vietnam are very interesting. The libraries contain mostly old books ‘from many years ago’ in French, Russian and Chinese, with a few English books. More English books are found in HCMC (all from before 1975). No books are available on more modern techniques (satellite applications to meteorology for example). The libraries are catalogued (physical catalogs) and well organized. The HMS Hydro-Met data center in Hanoi is digitally adept, but has limited access to foreign sites. The Center IT Director has a bachelors in hydrology and a masters in computer science from Australia. The data center only has data from Vietnam. Data is both digital and in paper logbooks, back to the early 20th century. The Haiphong station is 101 years old as of 2002. The Hydrometeorological Center for South Vietnam in Ho Chi Minh City (HCMC) is also part of HMS. It is a research center, co-located with the forecast center for South Vietnam. The center has some dial up Internet lines (the research division, some 50-100 people, has 5 dial up lines), and receives a reduced subset of satellite data and other synoptic data from Hanoi HMS. There is a small Hydro-met college in S. Vietnam associated with the center that assists with
47
education and training. Some of the researchers there have done their higher education in the Soviet Union. One was trained in Ireland on a WMO fellowship. Computer facilities were considered sub-standard. A lot of the problem seems to be lack of training or experience of forecasters in using computer models. Much of the research is centered around forecasting. Trying to get researchers and forecasters talking is a big concern. The library at the S. Vietnam Hydromet center contains works in French, English, Russian, Japanese and Vietnamese. It is mostly disorganized in preparation for a move to a new building. WMO manuals are only old donated copies (full set goes to Hanoi). Get some new WMO publications in HCMC as well. Journal collections are sporadic, mostly from donations. The Department of Meteorology and Hydrology at Hanoi University has 8 staff and 100 total students. There is a small graduate program as well. Most of the students work at the HMS when they are finished. The university is working on seasonal forecasting and modeling. They are running a forecast model (from Germany) in real time to generate 48 hour forecasts, and they would like to get a Regional Climate Model (RegCM) and perhaps a general circulation model (CCM3) running as well. They need to get boundary conditions (analysis data from NCEP or ECMWF) to start running these models. The university has ‘good’ Internet connections, and ‘enough’ computer power for running models, including Sun workstations. Most publishing occurs in the HMS journal. MAJOR CONCERNS/ISSUES: English is a limiting constraint for many researchers in Vietnam. Older scientists generally educated in Russia and speak Russian in addition to Vietnamese. The younger generation is speaking more English. HMS is beginning the process of Numerical Weather Prediction (NWP). The basic problem is manpower- there are not enough educated people to do the modeling. The Institute for Meteorology and Hydrology (Hanoi) plans to study the MM5. Hanoi University is actually already running NWP models, with some collaborations from abroad. The climate research center at IMH is trying to do this modeling. Personnel and training are the main issues for applying models. At IMH the lack of journals was thought to be a problem. The Internet is problematic for getting data, but may improve. The IMH physical connections are bad, but are starting to improve. The IMH staff often goes to the National Forecast Center in Hanoi, which has a faster Internet connection. Staffing levels for information technology are weak. Among the staff of the HMS Data Center (60 people), very few speak English (10-15%). This is a problem with data access since the interfaces for the digital systems are all in English. At the Hydro-Met center for South Vietnam, there are difficulties in making longer term forecasts due to a lack of data. Indian ocean data is necessary for predicting the start of the rainy season, and upper Mekong River precipitation data is necessary for making accurate hydrological forecasts. The Mekong Secretariat helps in sharing information across borders. How to get timely information about typhoons is another difficulty. Ocean data is lacking, it is difficult to get from outside. Who can run a typhoon model? Use of data was also a problem.
48
They have some CD-ROM data access (e.g. some CD-ROMs of data from the Journal of Climate), but they do not know how to use and access data formats. A training course was desired. Other issues for the S. Vietnam Hydromet center included journals, the cost of Internet access and English. The second identified concern was a lack of a budget for new publications. Journals cannot be purchased, and it is hard to look at new research results. If electronic access is granted it might be used. However, the cost of Internet access is high compared to salaries. One month of Internet access costs 1.5 million VND ($100) or 3x salary of a Senior Hydrologist Another concern was English. Few researchers/ forecasters are very capable in English. Most people cannot read books in English, therefore few works are used even if obtained. English and the budget were the biggest problem for accessing Journals at the center. Research is thought of as only having local application, therefore it is rarely sent to international journals. At Hanoi University, the most important issue was thought to be access to research articles. In the near future, data needs for modeling will be a concern, and training is an ongoing issue. The university gets almost no articles and reports on its own, but must rely on collaborators to send specific articles. Publishing in international journals was rarely considered. Research is generally published in Vietnamese with an English abstract. English is one problem, and written English is especially difficult. Some assistance in editing and checking English would help. Most of their work is not considered “original” (second main concern). INTERNET CONNECTIVITY/ PHYSICAL INFRASTRUCTURE Internet access is available in Vietnam, but limited and expensive. High bandwidth access is particularly expensive for organizations. There are 5 ISPs but all are ‘overseen’ by government agency. Overall access has improved as the backbone network has gotten better tied into the Internet. However, with staff making less than US$ 50 /month, even Internet costs of <US$1 per hour are expensive. Internet access per hour is comparable to the cost of a meal in a local restaurant. Improvements in access are very expensive. A leased line (T1 or so) would be 28 million VND/ mo for IMH (US$2000) and 60 million VND. mo (US$4,000) for the Forecast Center. Currently the Forecast center uses a slower line for 30 million VND/mo (US$2000). The cost of these lines represents the salaries of many senior staff. The forecast center is the only facility with a leased line. HMS does not have an internal network. In 5 years they hope to have all 5 institutes in Hanoi on line, and then all 9 regional centers. There are several political issues with the Internet as well. It used to be permission was required to go online to sites out of Vietnam. But it is easier now after normalization of relations with US. More young people use the Internet. Costs must come down to increase use. The government is promoting the use of email. Use of the Internet in HMS is primarily for email. A few use it for information. SUMMARY

49
English is a major barrier for many. In the southern part of the country, English was not good among most of the staff. It is probable that English speakers have other opportunities. As a result, journals are not commonly read. Publishing in outside journals is not really thought of, work is not deemed relevant and English written skills are not sufficient, even among top staff. Typhoons, hydrology and mitigation of impacts (weather—not climate impacts) are seen as major issue. Some foreign collaborations occur in HMS, but mostly through the international division in Hanoi, and stop when funding runs out. The University in Hanoi seems to have more collaborations and capacity to use models and data. Models and NWP are ‘cutting edge’ for HMS. CHINA LOCATIONS VISITED 1. START Secretariat, Institute for Atmospheric Physics, Chinese Academy of Sciences, Beijing METEOROLOGICAL / CLIMATE SCIENCE COMMUNITY DESCRIPTION The START secretariat Climate Change Research Center, and the Institute for Atmospheric Physics (IAP) is likely not representative of research in China. Conditions at the Chinese Academy of Sciences (CAS) in which the IAP is located are much better. Discussions indicated that Shenzen, Shangai, Guangzhou and Nanjing have good universities. Outside of these areas the situation is not good for local colleges and universities, except for Internet ‘bars’. A large domestic science base does exist, which is well funded by the government. China has several world class centers, and the IAP is one of them. IAP is indicative of the highest caliber of research, which is well connected to the international community. This occurs by definition, as the center serves the START network in Temperate East Asia. The physical network infrastructure was supported by a START grant. The center is funded by the Asia-Pacific Network (APN), the START network and domestic sources. Domestic funding comes from the Chinese Academy of Sciences, the National Science Foundation of China and the Ministry of Science and Technology. The institute has a library with several hundred journals (Chinese, English and German languages). The Chinese Academy of Sciences has a large library. Most international journals are accessible in the library (including Science, Nature and many remote sensing journals). The Internet and CDROM indexes are used to find information. The CAS Library web site (www.las.ac.cn) has extensive on-line catalog and index features in Chinese and English, and is commonly used by scientists. Many Chinese journals exist. Most work is published in journals, proceedings, reports and books. Chinese scientists like to write papers in Chinese, but this is changing. More high quality papers are sent to international journals. There has been a change in policy to send papers to

50
international journals to enhance the influence of the results. Many scientists need assistance with English however. The institute employs a Canadian scientist to edit journal articles for English language. Interestingly, young scientists generally have better English skills and do not have difficulty reading papers. Older scientists learned Russian in university. Now English is virtually required. Because of the Olympics in Beijing in 2008, the government is seeking to improve the level of English among students at all levels. In addition, students want to pass the Graduate Record Exam (GRE) and Test Of English as a Foreign Language (TOFEL) to study in the USA. MAJOR CONCERNS/ISSUES Scientists complained that data sharing within China is still poor. Data are usually controlled by different groups and individuals. The exchange of data is getting better, and data exchange is being encouraged within regional climate modeling and desertification projects underway by START center. But outside of this project data access is difficult, and integrated studies are difficult. Major issues for START are GCM output for analysis and ground truth data for regional modeling, especially remote sensing data. Also mentioned were advanced and current satellite data (TRMM and AVHRR for example). INTERNET CONNECTIVITY/ PHYSICAL INFRASTRUCTURE The START secretariat consists of an administrative facility, a central laboratory and a data network. The physical networks at IAP in Beijing are quite good, consisting of a 16 CPU Silicon Graphics Origin system (UNIX system), with nearly a terabyte of disk storage, and 6 additional workstations. Internet access is not a problem in the larger cities, according to staff at START/IAP Beijing. This was verified by travels throughout Eastern China. Even in smaller cities (500,000-1 million people), fast Internet access was available. However, Internet access can be intermittent: public Internet access (Internet cafes) was closed for several weeks in the summer of 2002 by central government order. Intermittent censorship is also practiced (blocking of news and information sites, including search engines, is common). This does not seem to be a problem for researchers with Internet access in offices, and using research based web sites. Some direct access to data may be blocked for political reasons by China, or by the data provider (for example to US government web sites). The Chinese claim to have the second largest base of Internet users in the world, expected soon to be the largest. International Telecommunications Union statistics place China 3rd, behind the US and Japan, and just ahead of Germany, but China is likely to pass Japan in the future. Internet access times were rapid across Eastern China, even from smaller cities. Internet is available but slower in remote areas. However, Internet access in China is better than in many other countries, even in remote areas. Access to several commonly used sites (Internet email

51
sites) was faster in Lhasa (Tibet Autonomous Region) than across the border in Kathmandu (Nepal).