the interfacial reactions of infrared brazing cu and ti with two silver-based braze alloys
TRANSCRIPT
Journal of Alloys and Compounds 372 (2004) 148–157
The interfacial reactions of infrared brazing Cu and Tiwith two silver-based braze alloys
R.K. Shiuea, S.K. Wub,∗, C.H. Chanb
a Department of Materials Science and Engineering, National Dong Hwa University, Hualien 974, Taiwanb Department of Materials Science and Engineering, National Taiwan University, Taipei 106, Taiwan
Received 18 August 2003; received in revised form 30 September 2003; accepted 30 September 2003
Abstract
The microstructural evolution and shear strength of the infrared brazed Cu and Ti with two silver-based braze alloys are studied. Thedissolution between the molten braze and Cu substrate is much more prominent than that of Ti substrate. For specimens infrared brazed withpure Ag, the molten braze is separated into Ag-, Cu- and Ti-rich liquids. The Ag-rich liquid overflows out of the joint, so only the liquid rich inCu and Ti is left in the joint. The joint is primarily comprised of Cu4Ti and Cu2Ti phases, and three interfacial reaction layers, CuTi2, CuTi andCu4Ti3 are observed after infrared brazing. For specimens infrared brazed with 72Ag–28Cu, the microstructural evolution is well elucidatedby the Ag–Cu–Ti ternary alloy phase diagram, and its shear strength is strongly related to the presence of interfacial phases between Ti andthe braze alloy.© 2003 Elsevier B.V. All rights reserved.
Keywords: Bonding; Silver-based braze alloys; Titanium and copper; Microstructure; Mechanical properties
1. Introduction
Infrared brazing makes use of infrared energy generatedby heating a tungsten filament in quartz tube as the heat-ing source, providing a rapid heating rate up to 3000◦C/min[1–5]. Additionally, the infrared rays can easily transmitthrough the quartz tube, and not be absorbed by the quartzfurnace itself. Using an appropriate optical focusing system,locally heating of the joint can be obtained. Therefore, in-frared brazing is featured with both high-speed thermal cy-cles and high-energy efficiency, making it a very promisingtechnique among all joining processes[3].
A fast brazing thermal cycle is important for certain ap-plications in order to avoid liquation of the molten braze[6]. For the brazing filler metal with different solidus andliquidus temperatures, the composition of the melt changesgradually as the temperature increases from the solidus toliquidus. If the portion that melts first is allowed to flow out,the remaining solid may not melt and may remain behind asa residue, which is called liquation[6]. Filler metal with a
∗ Corresponding author. Tel.:+886-2-2363-7846;fax: +886-2-2363-4562.
E-mail address: [email protected] (S.K. Wu).
wide melting range needs rapid heating cycles to minimizeseparation during brazing. Therefore, a fast thermal cycleis crucial for certain braze alloys with wide melting ranges.Additionally, it is also noted that most interfacial reactionsbetween the base metal and braze alloy can be inhibited orslowed down by using a rapid brazing thermal cycle[7,8].
The bonding between pure titanium and copper is en-countered in production of the titanium target used in thephysical vapor deposition (PVD) facility. The titaniumtarget is joined with the water-cooled oxygen-free coppersubstrate. There are many joining processes available inbonding dissimilar alloys. For example, pure Ti and Cu canbe bonded using adhesive bonding, mechanical fastening,friction welding and brazing, etc.[8,9]. Brazing is probablyone of the best choices in this case due to high thermalconductivity of the brazed joint. It has been reported that ti-tanium and its alloys can be brazed with silver-based brazealloys [6–11]. Although the TiAg intermetallic compoundis formed in brazing Ti alloys using pure silver as the fillermetal, TiAg is not as brittle as most of other intermetallics[7,10,11]. There is no elongation and/or ductility data avail-able for TiAg intermetallic compound in the literature. Theductile nature of the TiAg intermetallic compound is demon-strated by the existence of dimples on its fractured surface
0925-8388/$ – see front matter © 2003 Elsevier B.V. All rights reserved.doi:10.1016/j.jallcom.2003.09.155
R.K. Shiue et al. / Journal of Alloys and Compounds 372 (2004) 148–157 149
Table 1The silver-based braze alloys used in the experiment
Alloy Nominal composition (wt.%) Solidus/liquidus (◦C)
Ag 100Ag 961/961BAg-8 72Ag–28Cu 780/780
[11]. In contrast, fractographs of many other intermetallics,e.g. TiCu, TiAl3 and TiFe, etc. are usually dominated bycleavage fracture. Therefore, most Ti alloys brazed by thesilver-based filler metal demonstrate good bonding strength[3,8–12]. Additionally, pure copper is also readily brazedusing the silver-based braze alloy[6,8,9]. Consequently, thepure silver is selected as the brazing filler metal in the study.In addition to the pure silver, 72Ag–28Cu in weight percentfeatured with a much lower melting temperature of 780◦Cis also used as the filler metal in brazing Cu and Ti. Thepurpose of this investigation is to study the infrared brazingof Ti and Cu substrates using two silver-based braze alloys.Both the microstructural evolution and bonding strength ofthe infrared brazed joint are extensively evaluated.
2. Experimental procedures
The base metals used in the experiment were thecommercially pure titanium plate (CPTi) in the form of10 mm× 10 mm× 2 mm and the oxygen-free copper platewith the dimension of 10 mm×15 mm×5 mm, respectively.The nominal composition of the commercially pure titaniumin weight percent is 0.08% C, 0.20% Fe, 0.03% N, 0.18%O, 0.015% H and balance Ti. The chemical composition ofthe oxygen-free copper in weight percent is 99.95% Cu and0.003% P. The base metals were first polished with SiC pa-pers and subsequently cleaned by an ultrasonic bath usingacetone as the solvent prior to infrared brazing. There weretwo silver-based braze alloys available in the experiment,including pure Ag and 72Ag–28Cu (wt.%). Based on theAWS specification for silver-based braze alloys, the chem-ical composition of 72Ag–28Cu alloy was in accordancewith the BAg-8 braze alloy[6,8]. Table 1 illustrates thechemical compositions, solidus and liquidus temperaturesof these silver-based braze alloys. Additionally, braze alloyfoils with the thickness of 100�m were applied throughoutthe experiment.
Infrared brazing was performed in a vacuum of 8×10⁻⁵ mbar, and the heating rate was set at 900◦C/minthroughout the experiment. To enhance the absorption ofinfrared rays, a graphite fixture was used during brazing asdescribed in the previous studies[1,3–5]. Specimens weresandwiched between two graphite plates, and an R-typethermal couple was inserted into the upper graphite plate, incontact with the brazed specimen. The area of filler metalfoil was approximately the same as that of base metal. Allspecimens were preheated to 500◦C for 90 s before theywere heated up to the brazing temperature. Because there
Table 2The process variables used in the infrared brazing
Filler metal Time (s) 800◦C 850◦C 980◦C 1000◦C
Ag 30 M M60 M M
72Ag–28Cu 30 M/S M/S60 M/S M/S
M: metallographic observation specimen; S: shear test specimen.
was a time delay between the actual specimen temperatureand programmer temperature, time compensation was in-cluded throughout the experiment[3–5]. The brazing timespecified in the test was the actual specimen holding time.Table 2summarized all infrared brazing process variablesused in bonding copper and titanium.
The infrared brazed specimens were cut by a low speeddiamond saw, followed by experiencing a standard metallo-graphic procedure. 2 g CrO3 +2 ml H2SO4 +1000 ml waterwas used as the etching solution prior to metallographic ex-amination. The cross-section of the brazed specimens wasexamined using either LEO 1530 field emission scanningelectron microscope (FESEM) or Philips XL-30 scanningelectron microscope (SEM) with an accelerating voltage of15 kV. Quantitative chemical analyses were performed usinga JEOL JXL-8600SX electron probe microanalyzer (EPMA)with an operation voltage of 20 kV and spot size of 1�m.The intensities of Cu K�, Ti K� and Ag L� characteristiclines were measured for the EPMA analyses. Additionally,pure Ag, Cu and Ti were used as the standards, respectively.
The shear test was performed to evaluate the bondingstrength of the infrared brazed specimen.Fig. 1displays theschematic diagram of the specimen used in the shear test.The shaded areas in the graph were Cu and Ti substrates,and the outer part of the layout was the graphite fixtureused in the infrared brazing[3–5]. Two bold lines withthe width of 1.5 mm in the figure illustrated the locationof the braze alloy. The brazed specimen was compressedby a Shimadzu AG-10 universal testing machine with aconstant speed of 1 mm/min. The fractured surface aftershear test was firstly examined by an SEM, and followedby a structural analysis. The structure analysis was per-formed using a Philips PW1710 X-ray diffractometer. CuK� was selected as the X-ray source. The X-ray scanrate was set at 4◦/min, and its range was between 30◦and 80◦.
Fig. 1. The schematic diagram of the specimen used in the shear test.
150 R.K. Shiue et al. / Journal of Alloys and Compounds 372 (2004) 148–157
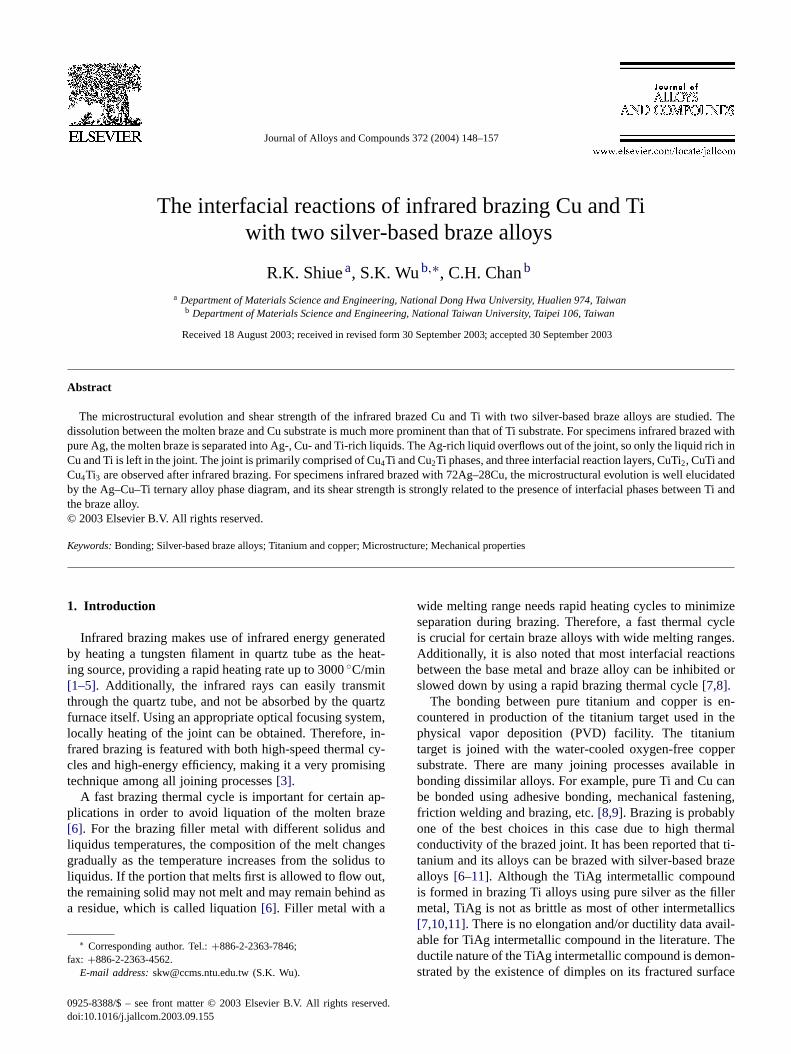
Fig. 2. The SEM BEIs of Ti/Ag/Cu specimens infrared brazed at (a) 980◦C × 30 s, (b) 980◦C × 60 s, (c) 1000◦C × 30 s, (d) 1000◦C × 60 s.
3. Results and discussion
3.1. Infrared brazing of Ti and Cu using pure silver
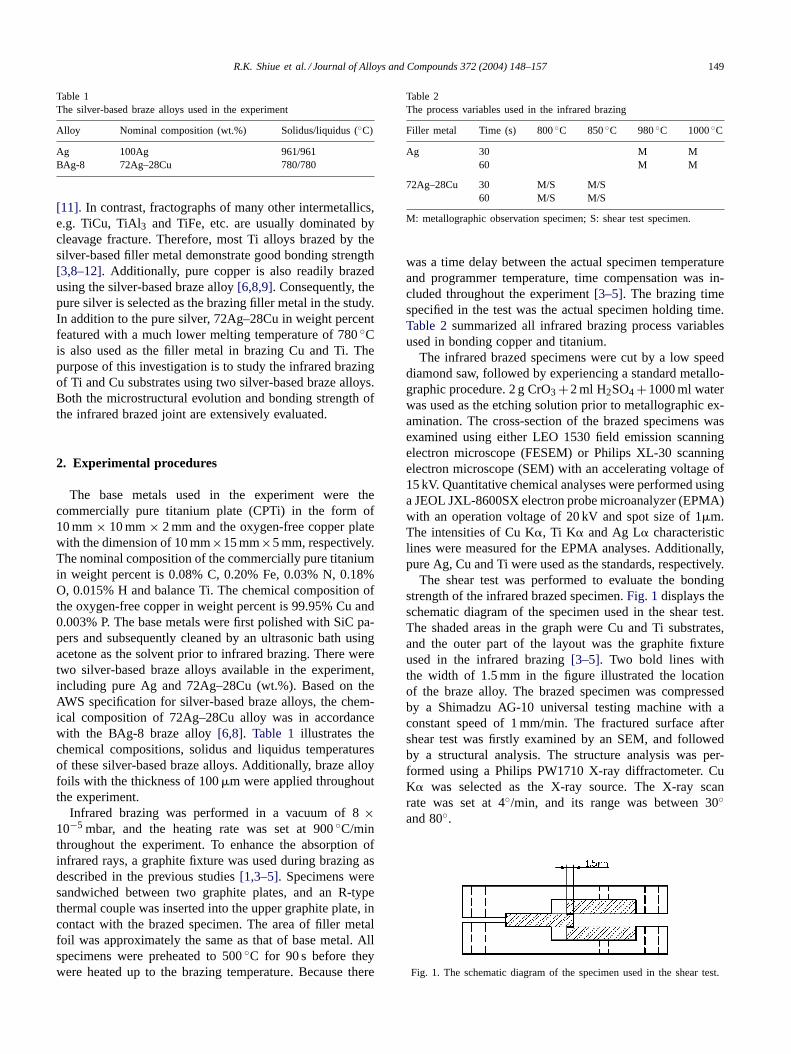
Fig. 2 shows the SEM backscattered electron images(BEIs) of Ti/Ag/Cu infrared brazed joints for various braz-ing conditions. The backscattered image does not providetopographic contrast but primarily shows the element distri-bution in the brazed joint[7,13]. According toFig. 2, bothTi and Cu substrates were dissolved into the molten brazeduring brazing, and the dissolution of substrates into themolten braze resulted in the chemical composition of thebraze alloy deviating from pure silver. Additionally, the dis-solution between molten braze and Cu substrate was muchmore prominent than that of Ti substrate.Fig. 3 shows theSEM BEI and EPMA chemical analysis results of Ti/Ag/Cuspecimen infrared brazed at 980◦C for 30 s. The EPMAanalysis at point B inFig. 3 is not a reliable data due toits thickness much lower than 1�m. In contrast, the accu-racy of points C and D is much better than that of pointB, because the width of reaction layer at point C and D isabout 1�m. Based on the EPMA chemical analysis, thebrazed joint is primarily comprised of Cu4Ti (marked by E)and Cu2Ti (marked by F). There are at least two interfacialphases, including: CuTi (marked by C) and Cu4Ti3 (markedby D) as shown inFig. 3. It is also important to note thatthe silver content in the brazed joint is almost disappeared.
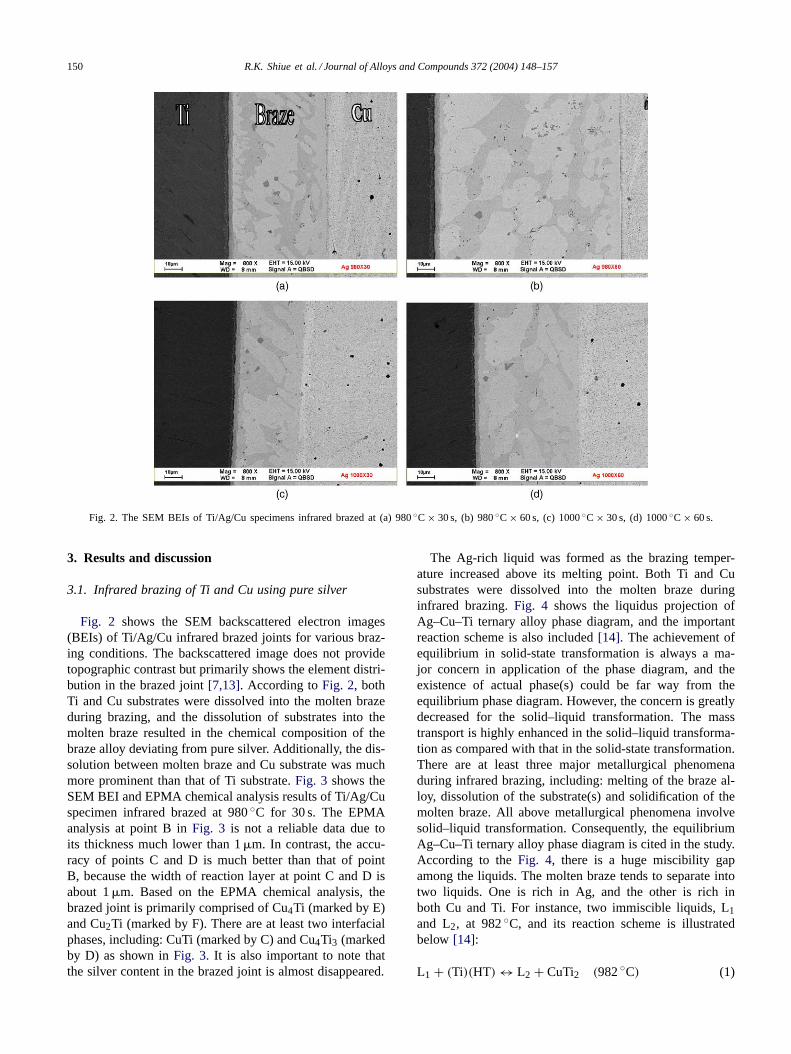
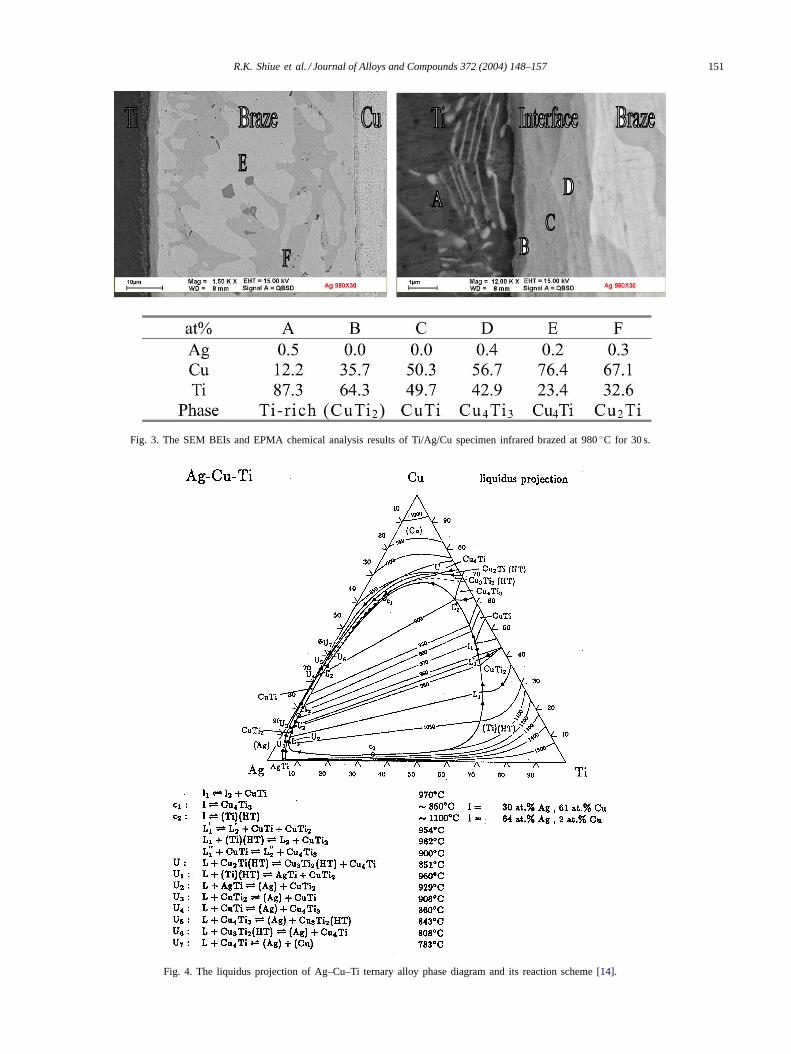
The Ag-rich liquid was formed as the brazing temper-ature increased above its melting point. Both Ti and Cusubstrates were dissolved into the molten braze duringinfrared brazing.Fig. 4 shows the liquidus projection ofAg–Cu–Ti ternary alloy phase diagram, and the importantreaction scheme is also included[14]. The achievement ofequilibrium in solid-state transformation is always a ma-jor concern in application of the phase diagram, and theexistence of actual phase(s) could be far way from theequilibrium phase diagram. However, the concern is greatlydecreased for the solid–liquid transformation. The masstransport is highly enhanced in the solid–liquid transforma-tion as compared with that in the solid-state transformation.There are at least three major metallurgical phenomenaduring infrared brazing, including: melting of the braze al-loy, dissolution of the substrate(s) and solidification of themolten braze. All above metallurgical phenomena involvesolid–liquid transformation. Consequently, the equilibriumAg–Cu–Ti ternary alloy phase diagram is cited in the study.According to theFig. 4, there is a huge miscibility gapamong the liquids. The molten braze tends to separate intotwo liquids. One is rich in Ag, and the other is rich inboth Cu and Ti. For instance, two immiscible liquids, L1and L2, at 982◦C, and its reaction scheme is illustratedbelow [14]:
L1 + (Ti)(HT) ↔ L2 + CuTi2 (982◦C) (1)
R.K. Shiue et al. / Journal of Alloys and Compounds 372 (2004) 148–157 151
Fig. 3. The SEM BEIs and EPMA chemical analysis results of Ti/Ag/Cu specimen infrared brazed at 980◦C for 30 s.
Fig. 4. The liquidus projection of Ag–Cu–Ti ternary alloy phase diagram and its reaction scheme[14].
152 R.K. Shiue et al. / Journal of Alloys and Compounds 372 (2004) 148–157
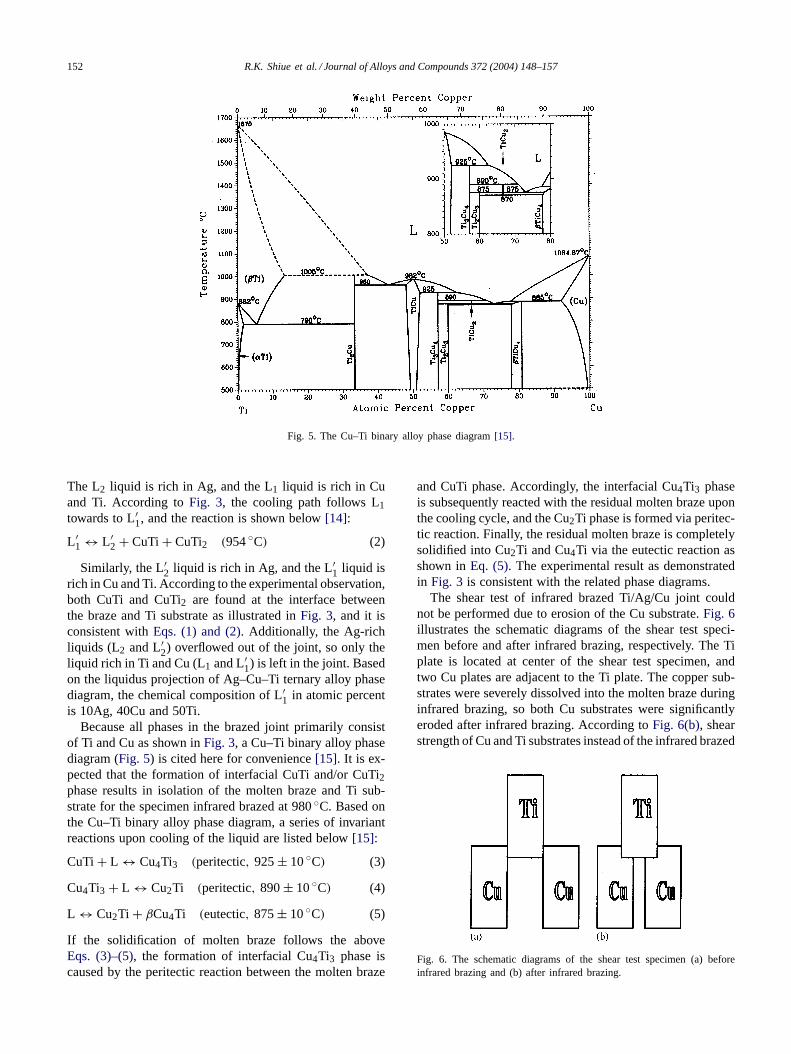
Fig. 5. The Cu–Ti binary alloy phase diagram[15].
The L2 liquid is rich in Ag, and the L1 liquid is rich in Cuand Ti. According toFig. 3, the cooling path follows L1towards to L′1, and the reaction is shown below[14]:
L ′1 ↔ L ′
2 + CuTi + CuTi2 (954◦C) (2)
Similarly, the L′2 liquid is rich in Ag, and the L′1 liquid isrich in Cu and Ti. According to the experimental observation,both CuTi and CuTi2 are found at the interface betweenthe braze and Ti substrate as illustrated inFig. 3, and it isconsistent withEqs. (1) and (2). Additionally, the Ag-richliquids (L2 and L′
2) overflowed out of the joint, so only theliquid rich in Ti and Cu (L1 and L′
1) is left in the joint. Basedon the liquidus projection of Ag–Cu–Ti ternary alloy phasediagram, the chemical composition of L′
1 in atomic percentis 10Ag, 40Cu and 50Ti.
Because all phases in the brazed joint primarily consistof Ti and Cu as shown inFig. 3, a Cu–Ti binary alloy phasediagram (Fig. 5) is cited here for convenience[15]. It is ex-pected that the formation of interfacial CuTi and/or CuTi2phase results in isolation of the molten braze and Ti sub-strate for the specimen infrared brazed at 980◦C. Based onthe Cu–Ti binary alloy phase diagram, a series of invariantreactions upon cooling of the liquid are listed below[15]:
CuTi + L ↔ Cu4Ti3 (peritectic, 925± 10◦C) (3)
Cu4Ti3 + L ↔ Cu2Ti (peritectic, 890± 10◦C) (4)
L ↔ Cu2Ti + βCu4Ti (eutectic, 875± 10◦C) (5)
If the solidification of molten braze follows the aboveEqs. (3)–(5), the formation of interfacial Cu4Ti3 phase iscaused by the peritectic reaction between the molten braze
and CuTi phase. Accordingly, the interfacial Cu4Ti3 phaseis subsequently reacted with the residual molten braze uponthe cooling cycle, and the Cu2Ti phase is formed via peritec-tic reaction. Finally, the residual molten braze is completelysolidified into Cu2Ti and Cu4Ti via the eutectic reaction asshown inEq. (5). The experimental result as demonstratedin Fig. 3 is consistent with the related phase diagrams.
The shear test of infrared brazed Ti/Ag/Cu joint couldnot be performed due to erosion of the Cu substrate.Fig. 6illustrates the schematic diagrams of the shear test speci-men before and after infrared brazing, respectively. The Tiplate is located at center of the shear test specimen, andtwo Cu plates are adjacent to the Ti plate. The copper sub-strates were severely dissolved into the molten braze duringinfrared brazing, so both Cu substrates were significantlyeroded after infrared brazing. According toFig. 6(b), shearstrength of Cu and Ti substrates instead of the infrared brazed
Fig. 6. The schematic diagrams of the shear test specimen (a) beforeinfrared brazing and (b) after infrared brazing.

R.K. Shiue et al. / Journal of Alloys and Compounds 372 (2004) 148–157 153
Fig. 7. The SEM BEIs of Ti/72Ag–28Cu/Cu specimens infrared brazed at (a) 800◦C × 60 s, (b) 850◦C × 30 s, (d) 850◦C × 60 s.
joint was measured in the shear test. Consequently, the shearstrength of infrared brazed Cu/Ag/Ti joint could not be ac-curately determined in the experiment. Actually, the infraredbrazed Ti/Ag/Cu specimen was not fractured even if the ap-plied shear stress exceeded 400 MPa. Both Cu substrateswere distorted if the applied shear stress exceeded 400 MPa.Consequently, there was no shear strength available for theTi/Ag/Cu infrared brazed joint.
3.2. Infrared brazing of Ti and Cu using 72Ag–28Cu
Fig. 7 shows the SEM BEIs of Ti/72Ag–28Cu/Cu spec-imens infrared brazed at different brazing conditions. Themicrostructure of Ti/72Ag–28Cu/Cu joint is very differentfrom that of Ti/Ag/Cu joint as compared betweenFig. 2andFig. 7. Because the brazing temperature of 72Ag–28Cubraze is much lower than that of pure silver, overflow of theAg-rich liquid during infrared brazing was greatly abated.Similar to the aforementioned result, the dissolution betweenmolten braze and Cu substrate was much more prominentthan that of Ti substrate. Additionally, there was no interfa-cial reaction between the braze and Cu substrate, but inter-facial reaction layers were observed at the interface betweenTi and braze.
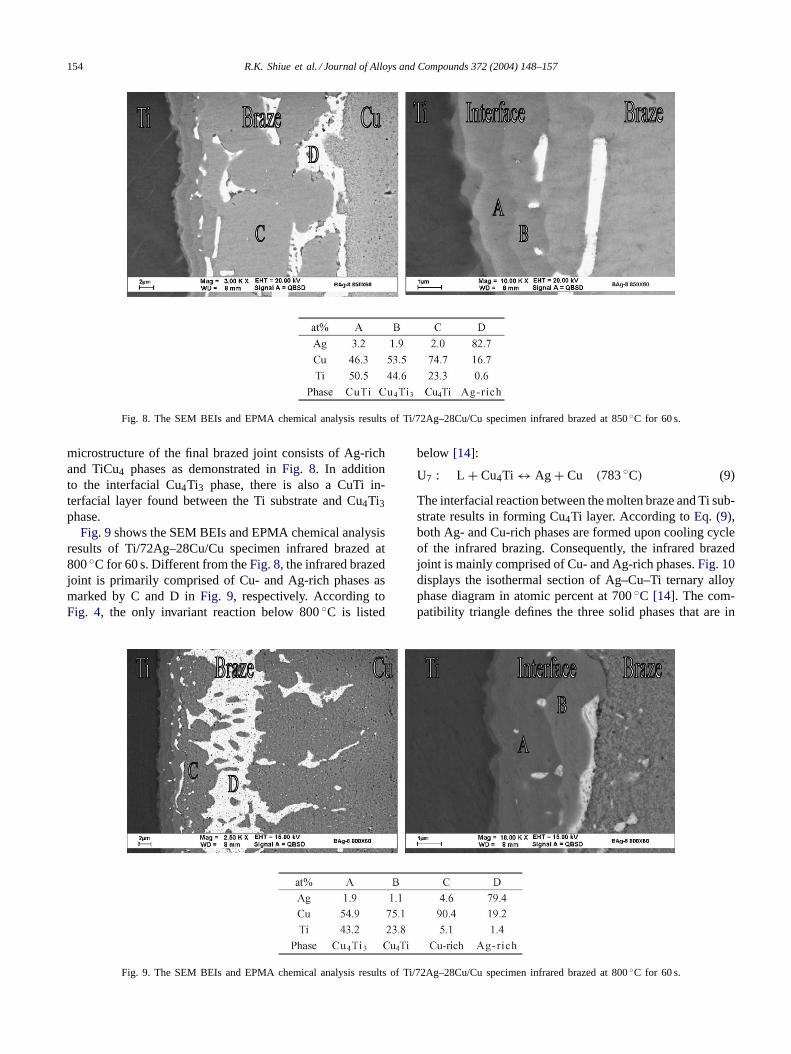
Fig. 8displays the SEM BEIs and EPMA chemical analy-sis results of Ti/72Ag–28Cu/Cu specimen infrared brazed at850◦C for 60 s. The infrared brazed joint is primarily com-
prised of Cu4Ti and Ag-rich phases, as marked by C and Din Fig. 8, respectively. At least two interfacial reaction lay-ers are found in the figure. Based on the EPMA chemicalanalysis results, the stoichiometric ratios between Cu and Tiat the reaction layers are close to CuTi (marked by A) andCu4Ti3 (marked by B). According toFig. 4, the reaction atpoint c1 is shown below[14]:
L ↔ Cu4Ti3(∼ 850◦C) (6)
where the chemical composition in atomic percent of the liq-uid (L) is 30Ag, 61Cu and 9Ti. Based on theEq. (6), Cu4Ti3is readily formed from the molten braze with the chemicalcomposition of 30Ag–61Cu–9Ti (at.%). Additionally, the in-terfacial Cu4Ti3 phase is also formed upon infrared brazingat 850◦C. There are several invariant reactions upon coolingof the infrared brazed specimen as shown below[14]:
U5 : L + Cu4Ti3 ↔ (Ag) + Cu3Ti2(HT) (843◦C) (7)
U6 : L + Cu3Ti2(HT) ↔ (Ag) + Cu4Ti (808◦C) (8)
The interfacial Cu4Ti3 phase reacts with the molten brazeupon cooling cycle, and both Ag-rich and Cu3Ti2(HT)phases are formed. The Cu3Ti2(HT) phase further reactswith the residual liquid and forms both Cu4Ti and Ag-richphases as illustrated inEq. (8). According to the experimen-tal observations, the residual molten braze is completelyconsumed at the transition reaction U6. Consequently, the
154 R.K. Shiue et al. / Journal of Alloys and Compounds 372 (2004) 148–157
Fig. 8. The SEM BEIs and EPMA chemical analysis results of Ti/72Ag–28Cu/Cu specimen infrared brazed at 850◦C for 60 s.
microstructure of the final brazed joint consists of Ag-richand TiCu4 phases as demonstrated inFig. 8. In additionto the interfacial Cu4Ti3 phase, there is also a CuTi in-terfacial layer found between the Ti substrate and Cu4Ti3phase.
Fig. 9shows the SEM BEIs and EPMA chemical analysisresults of Ti/72Ag–28Cu/Cu specimen infrared brazed at800◦C for 60 s. Different from theFig. 8, the infrared brazedjoint is primarily comprised of Cu- and Ag-rich phases asmarked by C and D inFig. 9, respectively. According toFig. 4, the only invariant reaction below 800◦C is listed
Fig. 9. The SEM BEIs and EPMA chemical analysis results of Ti/72Ag–28Cu/Cu specimen infrared brazed at 800◦C for 60 s.
below [14]:
U7 : L + Cu4Ti ↔ Ag + Cu (783◦C) (9)
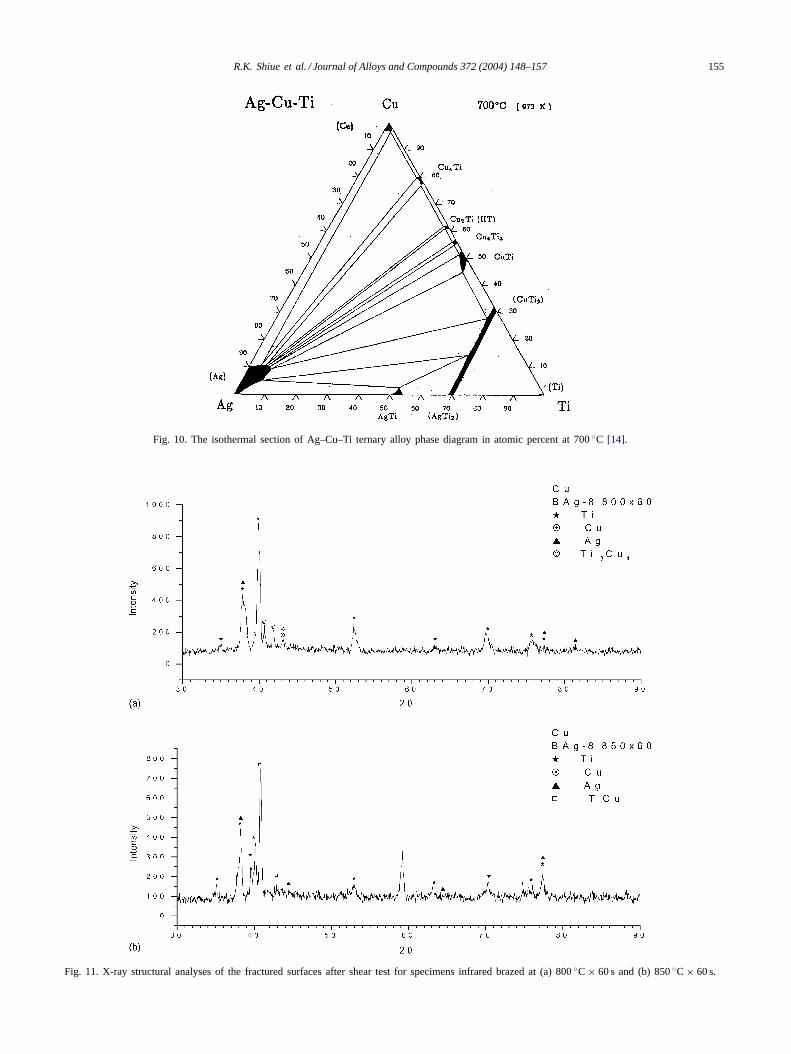
The interfacial reaction between the molten braze and Ti sub-strate results in forming Cu4Ti layer. According toEq. (9),both Ag- and Cu-rich phases are formed upon cooling cycleof the infrared brazing. Consequently, the infrared brazedjoint is mainly comprised of Cu- and Ag-rich phases.Fig. 10displays the isothermal section of Ag–Cu–Ti ternary alloyphase diagram in atomic percent at 700◦C [14]. The com-patibility triangle defines the three solid phases that are in
R.K. Shiue et al. / Journal of Alloys and Compounds 372 (2004) 148–157 155
Fig. 10. The isothermal section of Ag–Cu–Ti ternary alloy phase diagram in atomic percent at 700◦C [14].
Fig. 11. X-ray structural analyses of the fractured surfaces after shear test for specimens infrared brazed at (a) 800◦C × 60 s and (b) 850◦C × 60 s.
156 R.K. Shiue et al. / Journal of Alloys and Compounds 372 (2004) 148–157
Table 3The shear strength of infrared brazed Cu/72Ag–28Cu/Ti specimens
Brazingtemperature (◦C)
Brazingtime (s)
Shear strength(MPa)
Average shearstrength (MPa)
800 30 13.1 19.430 25.8
800 60 208.7 209.760 210.7
850 30 176.4 177.630 178.8
850 60 82.3 89.760 97.0
equilibrium after cooling below the solidus temperature[16].A compatibility triangle consists of Ag, Cu and Cu4Ti asdemonstrated inFig. 10, and it is in accordance with the mi-crostructural observation of the specimen infrared brazed at800◦C for 60 s.
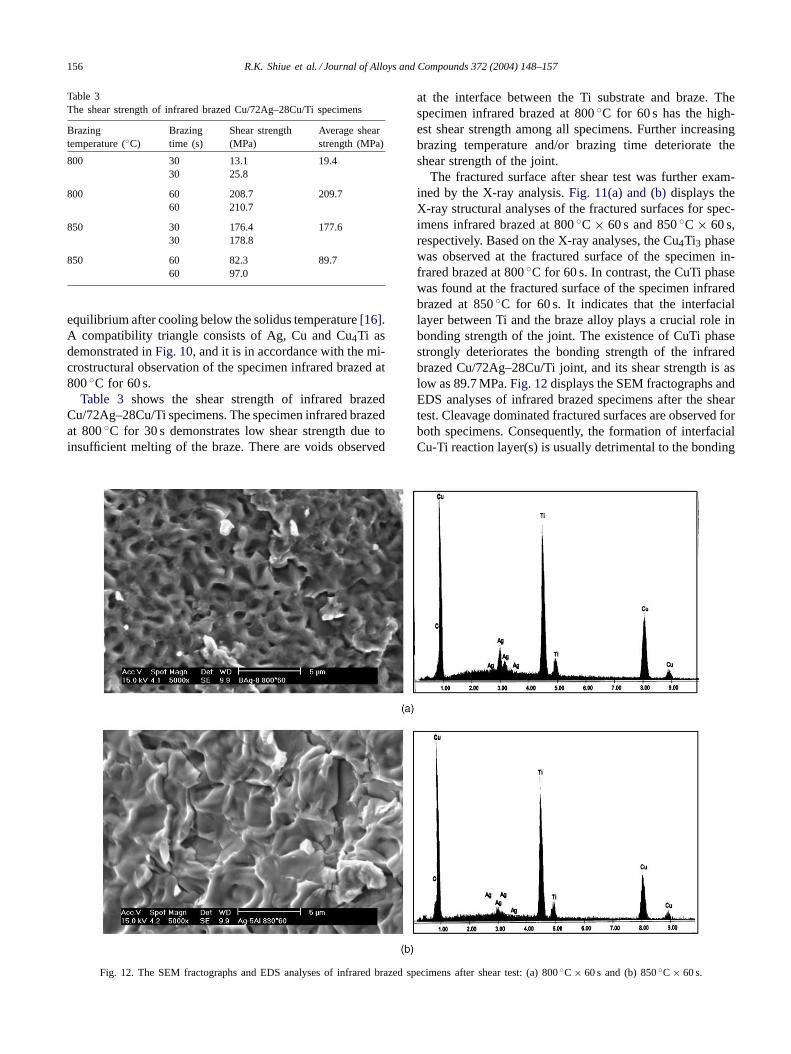
Table 3 shows the shear strength of infrared brazedCu/72Ag–28Cu/Ti specimens. The specimen infrared brazedat 800◦C for 30 s demonstrates low shear strength due toinsufficient melting of the braze. There are voids observed
Fig. 12. The SEM fractographs and EDS analyses of infrared brazed specimens after shear test: (a) 800◦C × 60 s and (b) 850◦C × 60 s.
at the interface between the Ti substrate and braze. Thespecimen infrared brazed at 800◦C for 60 s has the high-est shear strength among all specimens. Further increasingbrazing temperature and/or brazing time deteriorate theshear strength of the joint.
The fractured surface after shear test was further exam-ined by the X-ray analysis.Fig. 11(a) and (b)displays theX-ray structural analyses of the fractured surfaces for spec-imens infrared brazed at 800◦C × 60 s and 850◦C × 60 s,respectively. Based on the X-ray analyses, the Cu4Ti3 phasewas observed at the fractured surface of the specimen in-frared brazed at 800◦C for 60 s. In contrast, the CuTi phasewas found at the fractured surface of the specimen infraredbrazed at 850◦C for 60 s. It indicates that the interfaciallayer between Ti and the braze alloy plays a crucial role inbonding strength of the joint. The existence of CuTi phasestrongly deteriorates the bonding strength of the infraredbrazed Cu/72Ag–28Cu/Ti joint, and its shear strength is aslow as 89.7 MPa.Fig. 12displays the SEM fractographs andEDS analyses of infrared brazed specimens after the sheartest. Cleavage dominated fractured surfaces are observed forboth specimens. Consequently, the formation of interfacialCu-Ti reaction layer(s) is usually detrimental to the bonding
R.K. Shiue et al. / Journal of Alloys and Compounds 372 (2004) 148–157 157
strength of the joint. It is also deduced that the bond-ing strength of infrared brazed Cu/72Ag–28Cu/Ti joint isstrongly related to types of the interfacial reaction layer(s).
4. Conclusions
The microstructural evolution and shear strength of theinfrared brazed Ti and Cu with two silver-based braze alloyswere extensively evaluated in this study. Important conclu-sions are summarized below:
1. For the specimen infrared brazed with pure Ag, both Tiand Cu substrates are dissolved into the molten brazeduring infrared brazing, and the dissolution of substratesinto the molten braze results in the chemical compositionof the braze alloy deviating from pure silver. The moltenbraze tends to separate into two liquids, one is rich inAg, and the other is rich in Cu and Ti.
2. The Ag-rich liquid overflows out of the joint, so onlythe liquid rich in Ti and Cu is left in the joint. The jointis primarily comprised of Cu4Ti and Cu2Ti phases afterinfrared brazing. Additionally, there are three interfacialreaction layers, including: CuTi2, CuTi and Cu4Ti3, re-spectively. The shear test of infrared brazed Ti/Ag/Cujoint cannot be performed completely due to erosion ofthe copper substrates.
3. The microstructural evolution of infrared brazed Ti/72Ag–28Cu/Cu joint is in accordance with the Ag–Cu–Titernary alloy phase diagram. The interfacial reactionlayers between Ti and the braze alloy plays a crucial rolein bonding strength of the joint. The Ti/72Ag–28Cu/Cujoint infrared brazed at 800◦C for 60 s demonstrates thehighest shear strength up to 209.7 MPa. Further increas-ing brazing temperature and/or brazing time deterioratethe shear strength of the joint. Cleavage dominatedfractured surfaces are observed for specimens infrared
brazed at 800◦C and 850◦C for 60 s. Additionally, theformation of interfacial Cu–Ti reaction layer(s) is usuallydetrimental to the bonding strength of the joint.
Acknowledgements
The authors gratefully acknowledge the financial sup-port from the National Science Council (NSC), Republic ofChina, under the Grant NSC 91-2216-E002-038.
References
[1] R.K. Shiue, S.K. Wu, J.M. O, J.Y. Wang, Metall. Mater. Trans. 31A(2000) 2527.
[2] C.L. Ou, R.K. Shiue, J. Mater. Sci. 38 (2003) 2337.[3] R.K. Shiue, S.K. Wu, S.Y. Chen, Acta Mater. 51 (2003) 1991.[4] T.Y. Yang, S.K. Wu, R.K. Shiue, Intermetallics 9 (2001) 341.[5] R.K. Shiue, S.K. Wu, C.M. Hung, Metall. Mater. Trans. 33A (2002)
1765.[6] G. Humpston, D.M. Jacobson, Principles of Soldering and Brazing,
ASM International, Metals Park, 1993.[7] C.C. Liu, C.L. Ou, R.K. Shiue, J. Mater. Sci. 37 (2002) 2225.[8] D.L. Olson, T.A. Siewert, S. Liu, G.R. Edwards, ASM Handbook,
vol. 6, ASM International, Metals Park, 1993.[9] M. Schwartz, Brazing: For the Engineering Technologist, Chapman
& Hall, New York, 1995.[10] N.A. Dececco, J.N. Parks, Welding J. 32 (1953) 1071.[11] R.K. Shiue, S.K. Wu, S.Y. Cheng, in: C.T. Liu Symposium on
Intermetallic and Advanced Metallic Materials, 2003 TMS AnnualMeeting, San Diego, California, USA, 2–6 March 2003.
[12] H.Y. Chan, R.K. Shiue, J. Mater. Sci. Lett. 22 (2003) 1659.[13] R.E. Lee, Scanning Electron Microscopy and X-ray Microanalysis,
Prentice-Hall, New York, 1993.[14] P. Villars, A. Prince, H. Okamoto, Handbook of Ternary Alloy Phase
Diagrams, ASM International, Metals Park, 1995.[15] T.B. Massalski, Binary Alloy Phase Diagrams, ASM International,
Metals Park, 1990.[16] Y.M. Chiang, D.P. Birnie III, W.D. Kingery, Physical Ceramics,
Wiley, New York, 1997.