the international harmonized protocol for · pdf filethe international harmonized protocol for...
TRANSCRIPT
Pure&App/. Chern.,Vol. 65, No. 9, pp. 2123-2144,1993. Printed in Great Britain. @ 1993 IUPAC
INTERNATIONAL UNION OF PURE AND APPLIED CHEMISTRY
ANALYTICAL, APPLIED, CLINICAL, INORGANIC AND PHYSICAL CHEMISTRY DIVISIONS
INTERDIVISIONAL WORKING PARTY FOR HARMONIZATION OF QUALITY ASSURANCE SCHEMES FOR ANALYTICAL LABORATORIES*
THE INTERNATIONAL HARMONIZED PROTOCOL FOR THE PROFICIENCY TESTING OF (CHEMICAL)
ANALYTICAL LABORATORIES (Technical Report)
Resulting from the Symposium on Harmonization of Quality Assurance Systems in Chemical Analysis, Geneva, Switzerland, May 1991
held under the sponsorship of IUPAC, I S 0 & AOAC
Prepared for publication by MICHAEL THOMPSON' and ROGER WOOD2
'Department of Chemistry, Birkbeck College (University of London), London WClH OPP, UK 2Food Science Laboratory, Norwich Research Park, Colney, Norwich NR4 7UQ, UK
*Membership of the Working Party during 1989-92 was as follows: Chairman: M. Parkany (Switzerland); Members: P. de Biiivre (Belgium); S . S . Brown (UK); L. E. Coles (deceased) (UK); R. Greenhalgh (Canada); B. Griepink (Belgium); A. Head (UK); R. F. M. Herber (Netherlands); W. Horwitz (USA); S. H. H. Olrichs (Netherlands); G . Svehla (Ireland); M. Thompson (UK); R. Wood (UK).
Republication of this report is permitted without the need fo r formal IUPAC permission on condition that an acknowledgement, with full reference together with IUPAC copyright symbol (0 1993 IUPAC), is printed. Publication of a translation into another language is subject to the additional condition of prior approval from the relevant IUPAC National Adhering Organization.
The international harmonized protocol for the proficiency testing of (chemical) analytical laboratories (Technical Report)
Synopsis Ihe Internatid Standardising Organisations AOAC International [then the Association of Official Analytical Chemists], IS0 and IUPAC have cooperated to produce agreed protocol on the "Design, Ccnduct and Interpretation of Collaborative Studies" 'The working Grcup which produced the protocol met and agree3 at its April 1989 W & n g t o n D.C. meeting to develop a further protocol on proficierlcy testing, i.e. consideration of the use of results generated in interlaboratory test canparim for the purpase of a cantinuing assessment of the technical canpetace of participating testing laboratories. Such a harmonised protccol d d have to Outline the minimum requirements for agencies (laboratories or other organisations) who wished to develop and operate proficiency testing schemes and recomnend statistical treatment of the reported data. A draft hanmised protocol for the Organisation of proficiency testing schemes was prepared a d discussed at the A ~ A C Internatid/IS0/mx Meeting on the "Hammisaticm of Quality Assurance Systems in chemical Analysis", Geneva, m y 1991, as part of the develcpnent process of such a protocol, and finalised at a meeting of the working Party in Delft, ?he Netherlands, May 1992.
CONTENTS 1 . Introduction ................................................................................................................................................................ 21 25
2. Definitions ................................................................................................................................................................. 21 25
3. Organisation (Protocol) of Proficiency Testing Schemes .......................................................... 21 28 3.1 Framework 3.2 Organisation 3.3 Test Materials 3.4 3.5 Establishing the Assigned Result 3.6 Choice of Analyticdl Methcd 3.7 Assessment of Performance 3.8 Performance Criteria 3.9 Reporting of Results 3.10 Liaison with participants 3.11 3.12 Repeatability
Frequency of Test Sample Distribution
Collusion and Falsification of Results
4. Generalised Statisticdl Procedure for the Analysis of Results - Approaches to Data Analysis in Proficiency Testing .................................................................... 2133
4.1 Estimates of Assigned Value 4.2 Formation of a 2-Score 4.3 Interpretation of z-Scores 4.4 An Alternative Score 4.5 4.6 Running Scores 4.7 Classification, Ranking and Other Assessment of Proficiency Data
Canbination of Results of a Laboratory Within a Round of the Trial
5. An Outline Example of how assigned values and target values may ......................................................................................................................... 2137
6 . References ..................................................................................................................................................................... 21 37
Appendix I: Suggested Headings to a Quality Manual for Organisation of Proficiency Testing Schemes (Not necessarily in this order) ....................... 2137
Appendix 11: A Recannended Procedure for Testing Material for Sufficient Hcrogeneity ......................................................................................................................................... 21 38
Appendix 111: Canbination of Results of a Laboratory Within one Round of a Trial ..... 2139 Appendix IV: Calculation of Running Scores .............................................................................................. 2140 Appendix V: An Alternative Scoring Procedure for Proficiency Testing Schemes .......... 2141 Appendix V I : A n Outline Example of Hcw Assigned Values and Target Values
may be Specified and Used ........................................................................................................ 2142
be specified and used
21 24

Protocol for proficiency testing of analytical laboratories 21 25
1. INTRODUCTION 9
For a laboratory to produce consistently reliable data it must implement an appropriate programne of quality assurance procedures.
Analytical methods must be validated as fit for their purpase before use in the laboratory. Whenever possible validation should be ~ p e d by means of collaborative trials that conform to a recognised protocol . These methods must be fully dxunented, laboratory staff trained in their use and control charts shculd be established to ensure that the procedures are under statistical control. where possible, all reported data shculd be traceable to reliable and well-documented reference materials, preferably certified reference materials. where certified reference materials are not available, traceability to a definitive methcd shculd be established. Accreditation of the laboratory by the appropriat2)national accreditation scheme, which itself should conform to accepted standatds , indicates w) the laboratory is applying sound quality assurance principles. IS0 Guide 25 describes the general guidelines for assessing a testing laboratory's technical competence. Although proficiency testing can be executed independently(3yxreditation assessments now use the information produced by proficiency testing . Participation in proficiency testing schemes provides laboratories with an objective means of assessing and damstrating the reliability of the data they are producing. Although there @e several types of proficiency testing schemes, as described in IS0 Guide 43 , they all share the carmon feature of the canparison of test results obtained by one testing laboratory with those obtained by one or mre other testing laboratories. Schemes may be "open" to any lahratory or participation may be by invitation only. Schemes may set out to assess the ccqetence of laboratories undertaking a specific analysis in a specified matrix (i.e. lead in blood, fat in bonemeal) rather than the general type (food analysis) mentioned.
Although various protocols for the design and operation of proficiency testing schemes have been produced to cover particular areas of analytical chemistq, the need now is for a harmonised protocol for the organisation of proficiency testing schemes that would be universally accepted. The harmonised protocol detailed in Section Q4ytains specific details and does not, therefore, coincide with IS0 Guide 43 . In addition to describing the organisation and operation of the practical aspects of proficiency testing schemes, the document prescribes a minimdl statistical treatment of the analytical data produced, which are primarily measurements of concentration.
Although various terms may be used to describe schemes conforming to this protocol (e.g. external quality assessment, performance schemes etc), the preferred term is "proficiency testing".
For any particular scheme the aims must be carefully described by the coordinating organisation. In addition, the coordinating organisation should appreciate that the procedure outlined below is to be regarded as the minimum that shculd be undertaken.
Schemes cannot cover all aspects of scme areas of activity, and must be regarded as being remesentative of the particular sector of interest.
2. DEFINITIONS AND TERMINOLOGY USED IN PROTOCOL
2.1 Proficiency testing scheme
Methods of checking laboratory testing performance by means of interlaboratory tests.
[It includes canparison of a laboratory's results at intervals with th of other laboratories, with the main object being the establishment of trueness BY. I

21 26 WP FOR HARMONIZATION OF QUALITY ASSURANCE SCHEMES FOR ANALYTICAL LABORATORIES
2.2 Internal quality control (IQC)
The set of procedures undertaken by the laboratory for continuous monitoring of operations and results in order to decide whether the results are reliable enough to be released; I E primarily mitors the batchwise accuracy of results on quality control materials, and precision on independent replicate analysis of test materials.
2.3 Quality assurance programme/system
The sun total of a laboratory's activities aimed at achieving the required standard of analysis. While IQC and proficiency testing are very important canponents a quality assurance programne must also include staff training, administrative procedures, management structure, auditing etc. Accreditation bodies judge laboratories on the basis of their quality assurance programne.
2.4 Testing laboratory
A laboratory that measures, examines, tests, calibrates or otherwise determines the characteristics or performance of materials or products.
2.5 Reference material (RM)
A material or substance one or mre of whose properties values are sufficiently humgeneous and well established to be used for the calibration of an ap the assessment of a measurement method, or for assigning values to material
Further information of the deqif)ition and use of reference material is available in the IS0 REMCO documentation .
wtus, .
2.6 Certified reference material (CRM)
A reference material, accmpnied by a certificate, one or wre of whose property values are certified by a procedure which establishes traceability to an accurate realisation of the unit in which the property values are expressed, and for which each certeed value is acccmpanied by an uncertainty at a stated level of confidence . Further information of the definition(Qfd use of certified reference materials is available in the IS0 REMCO activities . 2.7 True value
?he actual concentration of the analyte in the matrix.
2.8 Assigned value
The value to be used as the true value by the proficiency test coordinator in the statistical treatment of results. It is the best available estimate of the true value of the analyte in the matrix.
2.9 Target value for standard deviation
A numerical value for the standard deviation of a measurement result, which has been designated as a godl for measurement quality.
2.10 lnterlaboratory test comparisons
Organisation, performance and evaluation of tests on the same items or materials on identical portions of an effectively hamgeneous material, by two or mre different laboratories i n accordance with predetermined conditions.
2.1 1 Coordinator
The organisation with responsibility for coordinating all of the activities involved in the operation of a proficiency testing scheme.

Protocol for proficiency testing of analytical laboratories 21 27
2.12 Accuracy
The closeness of agreement between a test result and the accepted reference value.
NOTE - The term accuracy, when applied to a set of test results, describes a ccmbination of randan ccmponents and a canmn systematic error or bias canponent.
2.13 Trueness
The closeness of agreement between the average value obtained from a large series of test results and an accepted reference value.
NOTE - The measure of trueness is usually expressed in terms of bias.
2.14 Bias
The difference between the expectation of the test results and an accepted reference value.
NOTE - Bias is a systematic error as contrasted to randan error. one or more systematic error canpnents contributing to the bias. A larger systematic difference fran the accepted reference value is reflected by a larger bias value.
There may be
2.15 Laboratory bias
The difference between the expectation of the test results frcm a particular laboratory and an accepted reference value.
2.16 Bias of the measurement method
The difference between the expectation of test results obtained frm all laboratories using that methcd and an accepted reference value.
NOTE - One example of this in operation would be where a method purporting to measure the su l fu~ content of a ccmpound consistently fails to extract all the sulfur, The bias of the measurement methcd is measured by the displacement of the average of results frcm a large n d r of different laboratories all using the same method. The bias of a measurement methcd may be different at different levels.
giving a negative bias to the measurement method.
2.17 Laboratory component of bias
The difference between the laboratory bias arid the bias of the measurement method.
m 1. The laboratory canpnent of bias is specific to a given laboratory and the
conditions of measurement within the laboratory, and also it may be different levels of the test.
The laboratory ccmponent of bias is relative to the overall average result, not the true or reference value.
2 .
2.18 Precision
The closeness of agreement between independent test results obtained under prescribed condi tions . m 1. Precision depends only on the distribution of randan errors and does not
relate to the accepted reference value.

2128 WP FOR HARMONIZATION OF QUALITY ASSURANCE SCHEMES FOR ANALYTICAL LABORATORIES
2. The measure of precision is usually expressed in terms of imprecision and ccmputed as a standard deviation of the test results. Higher imprecision is reflected by a larger standard deviation.
'Independent test results' means results abtained in a m e r not influenced by any previous result on the same or similar material.
3.
3. ORGANISATION (PROTOCOL) OF PROFICIENCY TESTING SCHEMES
3.1 Framework
Test samples must be distributed on a regular basis to the participants who are required to return results within a given time. The results will be subject to statistical analysis by the coordinator and participants will be pranptly notified of their performance. Advice will be available to poor performers and all participants will be kept fully informed of the progress of the scheme. Participants will be identified in Repxts by code only.
?he structure of the scheme for any one analyte or round in a series should be as follaws:
1.
2 .
3.
4.
5 .
6 .
7.
8.
coordinator organises preparation, hanogeneity testing and validation of test material;
coordinator distributes test samples on a regular schedule;
participants analyse test portions and report results centrally;
results subjected to statistical analysis; performance of laboratories aSSeSsed;
participants notified of their performance;
advice available for poor performers, on request;
coordinator reviews performance of scheme;
next round cunnences.
Preparation for the next round of the scheme may have to be organised while the current round is taking place; details of the next round may have to be adjusted in the light of experience fran the current round.
3.2 Organisation
Day to day running of the scheme will be the responsibility of the coordinator. 'Ihe coordinator must docllment all practices and procedures in a quality manual (see Appendix I). Preparation of test materials will either be contractedat or undertaken by the coordinator. ?he laboratory preparing the test material should have demxlstrable experience in the area of analysis being tested. It is essential for the coordinator to retain control over the assessnent of performance as this will help to maintain the credibility of the scheme. Overall direction of the scheme should be overseen by a d l advisory panel having representatives (who should be practising laboratory scientists) fmn, for exarnple, the coordinator, contract laboratories (if any), appropriate professional bodies, participants and end-users of analytical data.
3.3 Test materials
'Ihe test materials to be distributed in the scheme must be generally similar in type to the materials that are routinely analysed (in respect of canpasition of the matrix and the concentration range or quantity of the analyte). It is important that they are of acceptable hanogeneity and stability. m e assigned value will not be disclosed to the participants until after the results have been collated.

Protocol for proficiency testing of analytical laboratories 2129
?he bulk material prepared for the proficiency test must be sufficiently harr0geneou.s for each analyte so that all laboratories will receive test sarples that do not differ significantly in analyte concentration. The coordinator must clearly state the procedure used to establish the hcmogeneity of the test material. (Appedix I1 describes a recarmended procedure). As a guide, the between-sample standard deviation should be less than 0.3 times the target value for the standard deviation.
Where possible the coordinating laboratory should also provide evidence that the test material is sufficiently stable to ensure that the material will not undergo any significant change throughout the duration of the proficiency test. Prior to distribution of the test samples, therefore, the stability of the matrix and the analytes it contains must be determined by carrying out analyses after it has M stored for an appropriate period of time. The storage conditions, most especially of time and teqerature, used in the stability trials must represent those conditions likely to be encountered in the entire duration of the proficiency test. Stability trials must therefore take account of the transport of the test samples to participating laboratories as well as the conditions encountered purely in a laboratory environment. The concentrations of the various analytes must show no significant changes during the stability tests, the magnitude of a "significant change" being assessed fran the knowledge of the variance expected for replicate analyses of the bulk material. When unstable analytes are to be assessed it may be necessary for the coordinating organisation to prescribe a date by which the analysis must be accmplished.
Ideally the quality checks on the samples referred to above should be performed by a different laboratory fran that which prepared the sample, although it is reccgnised that this may cause difficulties to the coordinating organisation.
?he number of test materials to be distributed per round will deperd mainly on whether there is a requirement to cover a range of canposition. Practical considerations will dictate an upper limit of six to the number of test materials per analyte.
Coordinators should consider any hazards that the test materials might pose and take appropriate action to advise any party that might be at risk (e.g. test material distributors, testing laboratories etc.) of the potential hazard involved.
3.4 Frequency of test sample distribution
?he appropriate frequency for the distribution of test sample in any one series depends upon a nuher of factors of which the most important are:
i) ii) iii) the consistency of the results fran previous rounds; iv) v)
In practice the frequency will probably fall between once every two weeks and once every four months.
A frequency greater than once every two weeks could lead to problems in the turn roUna time of test samples and results. It might also encourage the belief that the proficiency testing scheme can be used as a substitute for internal quality control, an idea that is definitely to be dismaged. If the period between distributions extends much beyond four months, there will be unacceptable delays in identifying and correcting analytical problems, it could be difficult to mitor meaningful trends in a laboratory's performance and the impact of the scheme on the participants could be smdll.
mere will be circumstances where consideration of the above factors may mean that it is acceptable to have a longer time scale between distribution of test samples. It would be one of the functions of the Advisory Panel to carment on the frequency of distribution appropriate for a particular scheme.
the difficulty of executing effective analytical quality control; the laboratory throughput of test samples;
the costbenefit of the scheme; the availability of suitable material for proficiency test schemes.
2130 WP FOR HARMONIZATION OF QUALITY ASSURANCE SCHEMES FOR ANALYTICAL LABORATORIES
In addition this Panel would also provide advice on the areas to be covered in any particular sector of analytical chemistry. This is particularly difficult where there are a considerable n&r of diverse analyses in the sector.
3.5 Establishing the assigned value
The coordinator should give details on how the assigned value was obtained where possible with a statement of its traceability and its uncertainty.
There are a number of possible approaches to establishing the assigned value for the concentration of analyte and its uncertainty in a test material, but only four are normally considered.
3.5.1 Consensus value from expert laboratories
This value is the c011sensus of a group of expert laboratories that achieve agreement by the careful execution of recognised reference methods; it is the best procedure in m t circumstances for determining the assigned value in representative materials. When such a value is used, the organising body should disclose the identities of the laboratories producing the individual results, the method of calculating the consensus value and, if possible, a statement of the traceabilitTgpnd of its uncertainty. The consensus value will normdlly be a robust mean or the d e .
3.5.2 Formulation
'Ihis method ccmprises the addition of a known arount or concentration of analyte to a base material containing none. The methcd is especially valuable when it is the amount of analyte added to individual test portions that is subject to testing, as there is no requirement for ensuring a sufficiently hanogeneous mixture in the bulk test makerial. In other circumstances problems might arise with the use of formulation, as follws.
(a) There is a need to ensure that the base material is effectively free from analyte or that the residual analyte concentration is accurately hum,
(b) It may be difficult to mix the analyte hweneouly into the base material where this is required,
(c) 'Ihe added analyte may be mre loosely bonded than, or in a different chemical form fran, that found in the typical materials *at the test materials represent.
Unless these problems can be overcane, representative materials (containing the analyte in its normally occurring form in a typical matrix) are usually preferable. Where formulation is used, traceability to certified reference materials or reference methods should be cited if possible.
3.5.3 Direct comparison with certified reference materials
In this methcd, the test material is analysed along with appropriate certified reference materials by a suitable method under repeatability conditions. In effect the method is calibrated with the CEWs, providing direct traceability and an uncertainty for the value assigned to the test material. The EMS must have both the appropriate matrix and an analyte concentration range that spans, or is close to, that of the test material. In scme areas, the lack of EMS will restrict the use of this method.
3.5.4 Consensus of participants
A value often advocated for the assigned value is the consensus (usually a robust mean or the mode) of the results of all of the participants in the ram3 of the test. This value is clearly the cheapest and easiest to obtain. The method usually gives a serviceable value when the analysis is regarded as easy, for instance when a recognised method is applied to a major constituent. In an empirical method (where the method "defines" the content of the analyte), the consensus of a large number of laboratories can be safely regarded as the true value.

Protocol for proficiency testing of analytical laboratories 2131
There are a n&r of drawbacks to the consensus of participants. At a fundamental level it is difficult to see how a traceability or an uncertainty could be attributed to such a value, unless all of the participants were using the same reference method. Other objections that can be levelled against the cmsensus are: (a) there may be no real consensus amongst the participants and (b) the consensus may be biased by the general use of faulty methodology. Neither of these conditions is rare in the determination of trace constituents.
3.5.5 Choice between methods
'Ihe choice between these methods of evaluating the assigned value depends on circumstances and is the responsibility of the organising agency. It is usually advisable to have an estimate additional to the consensus of participants. Any significant deviations observed between the estimates must be carefully considered by the technical panel.
Bnpirical methods are used when the analyte is ill-defined chemically.In an empirical method, e.g. the determination of "fat", the true result (within the limits of measurement uncertainty) is produced by a correct execution of the method. It is clear that in these circumstances the analyte content is defined only if the method is simultaneously specified. Bnpirical m e t t d s can give rise to special problems in proficiency trials when a choice of such methods is available. If the assigned value is obtained fran expert laboratories and the participants use a different empirical method, a bias may be apparent in the results even when no fault in execution is present. Likewise, if participants are free to choose between empirical methods, M valid consensus may be evident am~lg then.
(i) a separate value of the assigned value is produced for each empirical method used;
participants are instructed to use a prescribed methcd; or
method different fran that used to obtain the consensus.
Several recourses are available to overcane this problem:
(ii)
(iii) participants are warned that a bias may result fran using an empirical
3.6 Choice of analytical method
Participants will be able to use the analytical methcd of their choice except when otherwise instructed to adopt a specified method. Methods used must be validated by an appropriate means, e.g. collaborative trial, reference method etc. As a general principle, procedures used by laboratories participating in proficiency testing schemes should simulate those used in their routine analytical work.
Where an empirical method is used the assigned value will be calculated fran results obtained using that defined procedure. If participants use a method which is not equivalent to the defining method, then an autanatic bias in result must be expected when their performance is assessed (see Section 3 . 5 . 5 ) .
3.7 Assessment of performance
Laboratories will be assessed on the difference between their result and the assigned value. A performance score will be calculated for each laboratory, using the statistical scheme detailed in Section 4.
3.8 Performance criteria
For each analyte in a round a criterion for the performance score may be set, where appropriate, against which the performance score obtained by a laboratory can be judged. A "running score" could be calculated to give an assessnent of performance spread over a longer period of time; this would be based on results for several rounds.
The performance criterion will be set so as to ensure that the analytical data routinely produced by the laboratory is of a quality that is adequate for its
2132 WP FOR HARMONIZATION OF QUALITY ASSURANCE SCHEMES FOR ANALYTICAL LABORATORIES
intended purpose. criterion at the highest level that the method is capable of providing.
It will not necessarily be appropriate to set the performance
3.9 Reporting of results
Reports issued to participants should be clear and canprehensive and include data on the distribution of results fran all laboratories together with participant's performance score. The test results as used by the coordinator should be displayed also, to enable participants to check that their data have been correctly entered. Reports should be made available as quickly as possible after the return of results to the coordinating laboratory and, if at all possible, before the next distribution of samples.
Although ideally all results should be reported to participants, it may not be possible to achieve this in sane very extensive schemes (e.g. where there are 700 participants each determining 20 analytes in any one round). Participants should, hcwever, receive at least: (i) Reports in clear and siqle format, and (ii) Results of all laboratories in graphical, e.g., histogram form.
3.10 Liaison with participants
Participants should be provided with a detailed information pack on joining the scheme. Cunnunication with participants should be via a newsletter or annual report together with a periodic open meeting; participants should be advised imnediately of any changes in scheme design or operation. Advice should be available to poor performers. Participants who consider that their performance assessnent is in error must be able to refer the matter to the coordinator.
Feedback fran laboratories should be encouraged, so that participants actively contribute to the developnent of the scheme. Participants should view it as their scheme rather than one imposed by a distant bureaucracy.
3.11 Collusion and falsification of results
Although proficiency testing schemes are intended primarily to help participants improve their analytical performance, there may be a tendency among sane participants to provide a falsely optimistic impression of their capabilities. For example, collusion may take place between laboratories, so that t r u l y independent data are not subitted. Laboratories may also give a false impression of their performance if they routinely carry out single analyses, but report the mean of replicate determinations an the proficiency test samples. Proficiency testing schemes should be designed to ensure that there is as little collusion and falsification as possible. For example, alternative samples could be distributed within one mud, with no identifiable reuse of the materials in succeeding rcunds. Also instructions to participants should make it clear that collusion is contrary to professional scientific conduct and serves only to nullify the benefits of proficiency testing to custaners, accreditation bodies and analysts alike.
Although all reasonable measures should be taken by the coordinators to prevent collusion, it must be appreciated that it is the responsibility of the participating laboratories to avoid it.
3.12 Repeatability
Procedures used by laboratories participating in proficiency testing schemes shrxrld simulate those used in routine sample analysis. Thus, duplicate determinations on proficiency test samples should be carried out only if this is the norm for routine work. ?he result to be reported is in the same form (e.g., number of significant figures) as that normally reported to the custaner. sane proficiency test coordinators like to include duplication in the tests to obtain a measure of repeatability proficiency. ?his should be allowed as a possibility in proficiency tests, but is not a requirement of this protocol.

Protocol for proficiency testing of analytical laboratories 2133
4. GENERALISED STATISTICAL PROCEDURE FOR THE ANALYSIS OF RESULTS
The approach described here is intended to provide a transparent procedure by using accepted statistics without any arbitrary scaling factors.
4.1 Estimates of assigned value
The first stage in producing a score fran a result x (a single measurement of analyte concentration (or amount) in a test material) is obtaining an estimate of the bias, which is defined as:
bias estimate = x - X Where X is the true value.
In practice the assigned value, I, which is the best estimate of X, is used.
Several methods are available for obtaining the assigned value (see Section 3.5).
If x is not a concentration measure, a preliminary transformation may be appropriate.
4.2 Formation of a z-score
Most proficiency testing schemes proceed by ccmparing the bias estimate (as defined above) with a target value for standard deviation that forms the criterion of performance. An obvious approach is to form the z-score given by
z = (x-I)/a
where u is the target value for standard deviation.
Although z has the form of a normal standard deviate there is no presunption that this necessarily will be the w e . In sane cirnrmsKces the technical panel may decide to use an estimate of the actual variation (s) encountered in a particular round of a trial in place of a target standard deviation. In that case 5 should be estimated the laboratories' results after outlier elimination, or by robust methods@'for each analyte/material/rd canbination. A value of s will thus vary fran round to round. In consequence the z-score for a laboratory could not be ccmpared directly fran round to round. Hawever the bias estimate (x-8) for a single analyte/material canbination could be usefully canpared round by r d for a laboratory, and the correspnding value of 5 would indicate general improvement in "reproducibility" round by round.
A fixed value for u is preferable and has the advantage that the z-scores derived fran it can be canpared fran round to round to demonstrate general trends for a laboratory or a group of laboratories. It is suggested that whatever the value of u is chosen it is a practical value and that it is accepted by participants. For sane of the tests it is only necessary that the value chosen is sufficient clearly to discriminate in a pass/fail situation.
The value chosen can be arrived at in several ways:
4.2.1 By perception
The value of u could be fixed arbitrarily, with a value based on a perception of hctr laboratories perform. The problem with this criterion is that both perceptions and laboratory performance may change with time. The value of u therefore may need to be changed occasionally, disturbing the continuity of the scoring scheme. m v e r , there is sane evidence that laboratory perfomce responds favourably to a stepise increase in performance requirements.
4.2.2 By prescription
The value of u could be an estimate of the precision required for a specific task of data interpretation. ?his is the most satisfactory type of criterion, if it

2134 WP FOR HARMONIZATION OF QUALITY ASSURANCE SCHEMES FOR ANALYTICAL LABORATORIES
can be formulated, because it relates directly to the required information content of the data. Unless the concentration range is very small u should be specified as a function of concentration.
This is frequently used in legislation where methcd performance characteristics may be specified.
4.2.3 By reference to validated methodology
Where a standard methcd is prescribed for the analysis, u could be obtained by interpolation fran the standard deviation of reprcducibility obtained during appropriate collaborative trials.
4.2.4 By reference to a generalised model
The value of u w d be derived fran a general model of precision, such as the "Horwitz Curve" . However, while this model provides a general picture of reproducibility, substantial deviation fran it may be experienced for particular methods. It could be used if no specific information is available.
4.3 Interpretation of z-scores
If R and u were gocd estimtes of the population mean and standard deviation, arid the underlying distribution were normal, then z would be approximately normally distributed with a mean of zero and a unit standard deviation. An analytical system can be described as "well behaved" when it ccmplies with these conditions. Under these circumstances an absolute value of z ( I z I ) greater than three suggests poor performance.
Because z is standardised, it can be usefully canpared between all analytes, test materials and analytical methods. Values of z obtained fran diverse materials and concentration ranges can, therefore, with due caution (see Section 4.51, be d i n e d to give a ccmposite score for a laboratory in one round of a proficiency test. Moreover the meaning of z-scores can be imnediately appreciated, i.e. values of )21<2 would be very ccrrmon and values of 1z1>3 would be very rare in well behaved systems.
Schemes explicitly based on z-score methcd include the "Laboratory Accreditation and Audit Protocol" The z-score mew)is also implicit in the modified "variance index" methcd of Whitehead et al , where scaling to a "chosen coefficient of variation" (i .e. relative standard deviation) effectively gives a z-value multiplied by an arbitrary factor.
.
4.4 An alternative score
An alternative type of scoring, here called Q-scoring, is based not on the standardised value but on the relative bias, namely
Q = (x-R)/R
where x and 2 have their previous meaning.
Although not reccmnended in this protocol a nunbr of sectors, for example occupational hygiene, use this type of approach.
The scoring does have the disadvantage that the significance of any result is not imnediately apparent.
The alternative type of scoring is described in greater detail in Appendix V.
4.5 Combination of results of a laboratory within a round of the trial
It is c a m m for several different analyses to be required within each round of a proficiency test. While each individual test furnishes useful information, many participants want a single figure of merit that will swmarise the overall

Protocol for proficiency testing of analytical laboratories 21 35
performance of the laboratory within a round. This approach may be appropriate for the assessnent of long term trends. Hcwever, there is a danger that such a ccmbination score will be misinterpreted or abused by non-experts, especially outside the context of the individual scores. Therefore the general use of ccmbination scores is not reccmnended, but it is reccgnised that they may have specific applications if based on scud statisticdl principles and used with due caution.
4 1 l
3- -
2- -
1- -
0-- -
-1-
-2- -
-3- -
-4- -
u P 5 n 20 4 3 IS 10 9 10 7 UI 13 1 2 1 16 2 22 6 17 (I
Laboratory Number
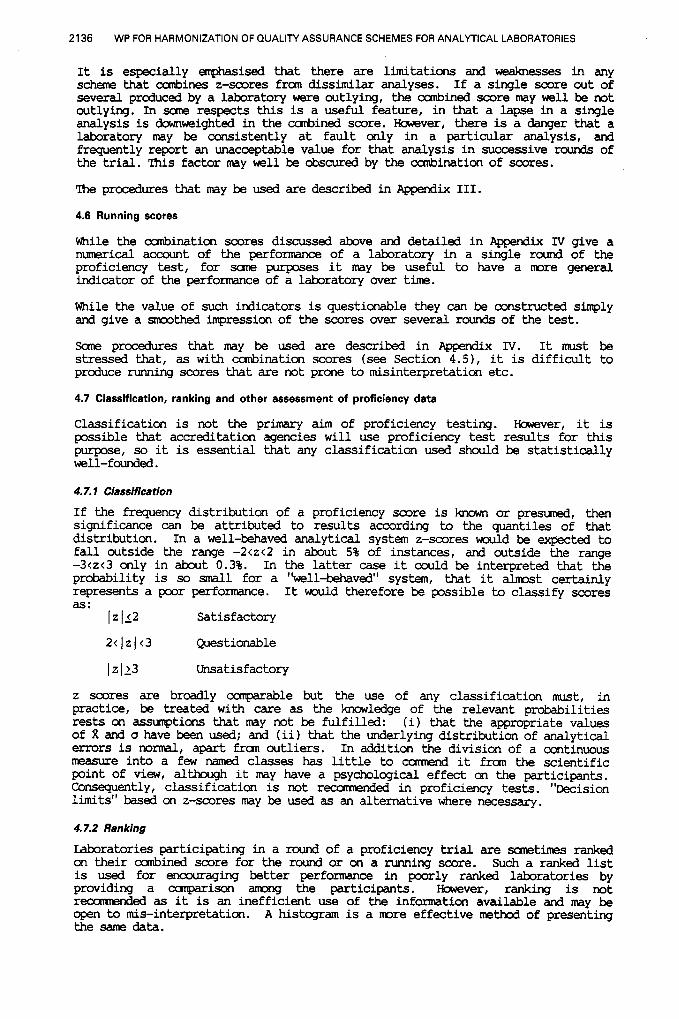
FIGURE 1: Report 0502 2-SCORE FOR HEXACHLOROBENZENE IN OIL (114.2ug/kg)
6 , -
4- -
3- -
2- -
1- -
0-- -
-1-
-2- -
I . / I / /
21 IS IO 4 12 13 m 20 s B 22 14 7 2 18 I 17 11 3 s 6 a Laboratory Number
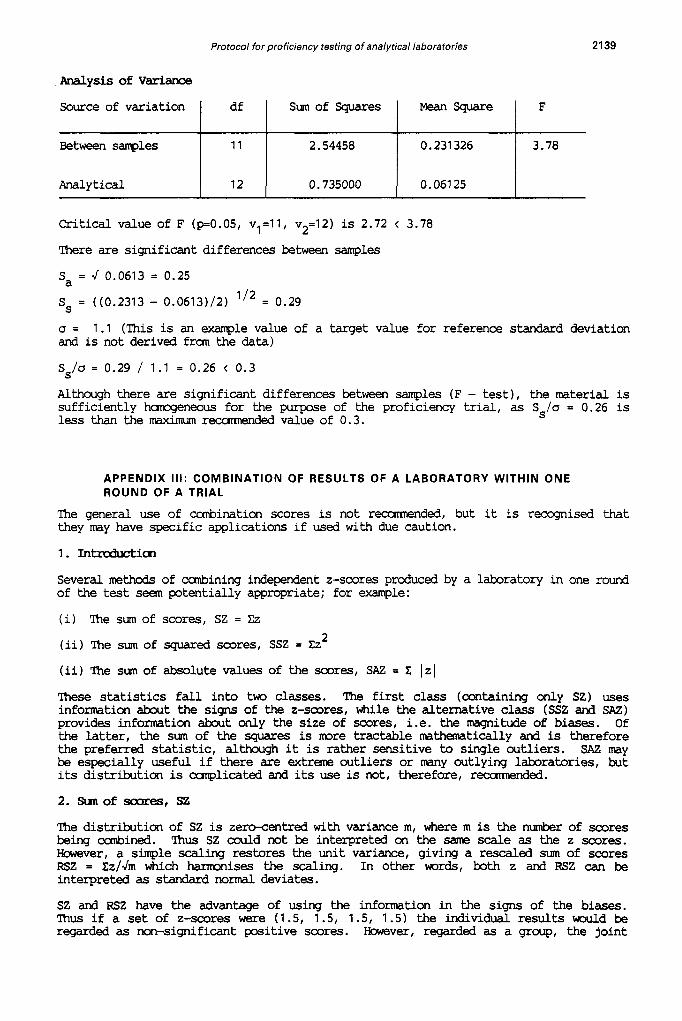
FIGURE 2: Report 0603 2-SCORE FOR NITROGEN IN CEREAL (2.93g/lOOg)
2136 WP FOR HARMONIZATION OF QUALITY ASSURANCE SCHEMES FOR ANALYTICAL LABORATORIES
It is especially emphasised that there are limitations and weaknesses in any scheme that ccmbines z-scores fran dissimilar analyses. If a single score out of several produced by a laboratory were outlying, the ccmbined score may well be not outlying. In sane respects this is a useful feature, in that a lapse in a single analysis is damweighted in the d i n e d score. However, there is a danger that a laboratory may be consistently at fault only in a particular analysis, and frequently report an unacceptable value for that analysis in successive rounds of the trial. This factor may well be abscured by the dination of scores.
The prccedures that may be used are described in Appendix 111.
4.6 Running scores
While the ccmbination scores discussed above and detailed in e i x IV give a numerical account of the perfomce of a laboratory in a single round of the proficiency test, for sane purposes it m y be useful to have a more general indicator of the performance of a laboratory over time.
While the value of such indicators is questionable they can be constructed simply and give a sroothed impression of the scores over several rounds of the test.
Sane procedures that may be used are described in Appendix IV. It must be stressed that, as with dination scores (see Section 4.51, it is difficult to produce running scores that are not prone to misinterpretation etc.
4.7 Classification, ranking and other assessment of proficiency data
Classification is not the primary aim of proficiency testing. Hcwever, it is possible that accreditation agencies will use proficiency test results for this purpose, so it is essential that any classification used should be statistically well-founded.
4.7.1 Classification
If the frequency distribution of a proficiency score is known or presumed, then significance can be attributed to results according to the quantiles of that distribution. In a well-behaved analytical system z-scores m d d be expected to fall outside the range -2<z<2 in about 5% of instances, and outside the range -3<2<3 only in about 0.3%. In the latter case it could be interpreted that the probability is so small for a "well-khaved" system, that it almost certainly represents a poor performance. It w l d therefore be possible to classify scores as:
12112 Satisfactory
2 < I z I < 3 Westionable
I 2 123 Unsatisfactory
z scores are broadly canparable but the use of any classification must, in practice, be treated with care as the knowledge of the relevant probabilities rests on assmptions that may not be fulfilled: (i) that the appropriate values of 8 and u have been used; and (ii) that the underlying distribution of analytical errors is normal, apart fran outliers. In addition the division of a continuous measure into a few named classes has little to ccmnend it fran the scientific point of view, although it m y have a psychological effect on the participants. Consequently, classification is not reccmnended in proficiency tests. "Decision limits" based on z-scores may be used as an alternative where necessary.
4.7.2 Ranking
Laboratories participating in a round of a proficiency trial are sanetimes ranked on their ccmbined score for the rcund or on a running score. Such a ranked list is used for encouraging better performance in porly ranked laboratories by providing a canparison among the participants. Hawever, ranking is not recarmended as it is an inefficient use of the information available and may be open to mis-interpretation. A histogram is a more effective method of presenting the same data.

Protocol for proficiency testing of analytical laboratories 21 37
1.
2.
3.
4.
5.
6.
7.
8.
9.
5. SPECIFIED A N D USED
A N OUTLINE OF H O W ASSIGNED VALUES A N D TARGET VALUES M A Y BE
A hypotheticdl example of how assigned values and target values may be specified and used is given in Appendix VI.
6. REFERENCES
The references cited throughout this document and its Appendices are given below. Additional references are given in IS0 Guide 43.
"Protocol for the Design, Conduct and Interpretation of Collaborative Studies", Edited W Horwitz, Pure & Appl. Chem. 1988, 60 (61, 855-864.
"Testing Laboratory Accreditation Systems - General Reccmnendations for the Acceptance of Accreditation Bodies", IS0 Guide 54, 1988, Geneva.
"General Requirements for the CaTlpetence of Calibration and Testing Laboratories", IS0 Guide 25, 3rd Edition 1990, Geneva.
"Developnent and Operation of Laboratory Proficiency Testing", IS0 Guide 43, 1984, Geneva.
"Accuracy (Trueness and Precision) of Measurement Methods and Results - Part 1: General Principles and Eefinitions", IS0 DIS-5725-1, Geneva.
"Tern and %finitions used in Connection with Reference Materials", IS0 Guide 30, 1981, Geneva.
"Uses of Certified Reference Materials", IS0 Guide 33, 1989, Geneva.
Analyticdl Methods Carmittee Report "Robust Statistics, Part 1". Analyst 1989, 1 1 4, 1693-1 697.
W Fbrwitz, Anal. Chem. 1982, 3, 67A-76A
10. "Laboratory Accreditation and Audit Protocol", Food Inspection Directorate, Food Production and Inspection Branch, Agriculture Canada, April 1986.
11. "A ccmparative survey of the results of analyses of blood serum in clinical chemistry laboratories in the united Kingdun", Whitehead, T.P., Brawning, D. M. and Gregory, A., J. Clin. Pathol., 1973, 26, 435-445.
APPENDIX I: SUGGESTED HEADINGS IN A QUALITY M A N U A L FOR ORGANISATION OF PROFICIENCY TESTING SCHEMES ( N O T NECESSARILY IN THIS ORDER)
1. W i t y policy 2. Organisation of agency 3. Staff, including responsibilities 4. Documentation control 5. Audit and review procedures 6.
7.
Aims, scope, statistical design and format (including frequency) of proficiency testing prcgramnes Procedures covering - sample preparation
- testing of sample harogeneity - equipnent - suppliers - logistics (e.g. sample dispatch) - analysis of data

2138 WP FOR HARMONIZATION OF QUALITY ASSURANCE SCHEMES FOR ANALYTICAL LABORATORIES
8. Preparation and issuing of report. 9. Action and feedback by participants when required 10. Documentation of records for each programne 11. Ccmplaints handling procedures 12. Policies on confidentiality and ethical miderations 13. Ccmputing information, including maintenance of hardware and software 14. Safety and other environmental factors 15. Subcmtracting 16. Fees for participation 17. Scope of availability of programne to others
APPENDIX II: A RECOMMENDED PROCEDURE FOR TESTING A MATERIAL FOR SUFFICIENT HOMOGENEITY
The procedure to be followed by the Laboratory preparing proficiency test materials is as follows:
1.
2.
3.
4.
5.
6.
7.
8.
Prepare the whole of the bulk material in a form that is thought to be hamgenmus, by an appropriate methcd.
Divide the material into the containers that will be used for dispatch to the participants.
Select a m i n k (n) of 10 containers strictly at randan.
Separately hamgenise the contents of each of the n selected containers and take two test portions.
Analyse the 2x1 test portions in a randan order under repeatability conditions by an appropriate method. The analytical methcd used must be sufficiently precise to allow a satisfactory estimation of Ss.
Form an estimate (Ss of the analytical variance by on-y analysis of variance, without ex8lusion of outliers.
Report values of x, Ss
If u is the target value- for standard deviation for the proficiency test at analyte concentration = x, the value of Ss/a should be less than 0.3 for sufficient hanogeneity.
2 2 of the sampling variance and an estimate (S
n and the result of the F-test. , ‘a, I
Sanvle No
1 2 3 4 5 6 7 8 9 10 11 12
1 2
10.5 9.6
10.4 9.5
10.0 9.6 9.8 9.8
10.8 10.2 9.8 10.2
10.4 9.5 9.9 9.9 9.7
10.1 10.4 10.2 10.7 10.0 9.5
10.0
&and mean = 10.02
Protocol for proficiency testing of analytical laboratories
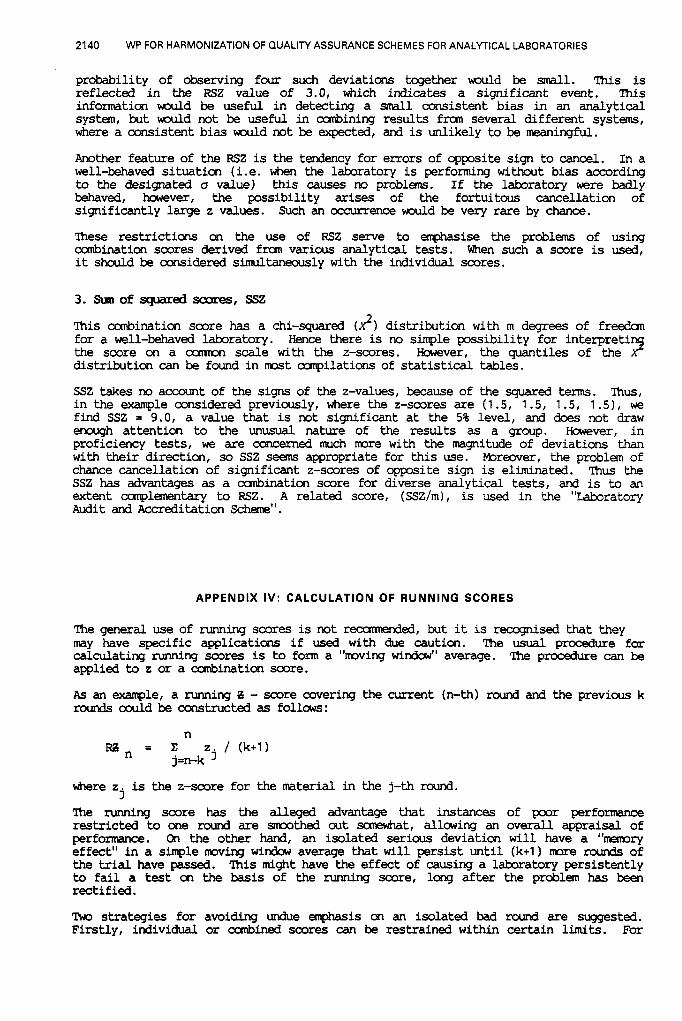
Source of variation df
Between samples 1 1
Analytical 12
2139
Sum of Squares Square F
2.54458 0.231 326 3.78
0.735000 0.061 25
Critical value of F (~0.05, vl=ll, v2=12) is 2.72 < 3.78
There are significant differences between samples
Sa = J 0.0613 = 0.25
Ss = ((0.2313 - 0.0613)/2) 'I2 = 0.29
a = and is not derived fran the data)
SS/o = 0.29 / 1.1 = 0.26 < 0.3
Although there are significant differences between samples (F - test), the material is sufficiently hcmogeneous for the purpose of the proficiency trial, as Ss/a = 0.26 is less than the maximum recarmended value of 0.3.
1.1 (This is an example value of a target value for reference standard deviation
APPENDIX 111: COMBINATION OF RESULTS OF A LABORATORY WITHIN ONE ROUND OF A TRIAL
The general use of ccmbination scores is not recunnended, but it is reccgnised that they may have specific applications if used with due caution.
1. Introductim
Several methods of canbining independent z-scores produced by a laboratory in one round of the test seem potentially appropriate; for example:
(i) The sum of scores, SZ = Cz
(ii) The sum of squared scores, SSZ = Zz
(ii) The sum of absolute values of the scores, SAZ = z IzI
These statistics fall into two classes. The first class (containing only SZ) uses information about the signs of the z-scores, while the alternative class (SSZ and SAZ) provides information about only the size of scores, i.e. the magnitude of biases. Of the latter, the sum of the squares is mre tractable mathematically and is therefore the preferred statistic, although it is rather sensitive to single outliers. SAZ may be especially useful if there are extrene outliers or many outlying laboratories, but its distribution is ccmplicated and its use is not, therefore, recanwnded.
2. sun of sacnes, sz
2
The distribution of SZ is zerclcentred with variance m, where rn is the number of scores being canbined. Thus SZ could not be interpreted on the same scale as the z scores. m v e r , a simple scaling restores the unit variance, giving a rescaled sun of scores RSZ = Zz/Jm which b i s e s the scaling. In other words, both z and RSz can be interpreted as standard normal deviates.
SZ and RSZ have the advantage of using the information in the signs of the biases. ?bus if a set of z-scores were (1.5, 1.5, 1.5, 1.5) the individual results would be regarded as non-significant positive scores. Iicwever, regarded as a group, the joint
2140 WP FOR HARMONIZATION OF QUALITY ASSURANCE SCHEMES FOR ANALYTICAL LABORATORIES
probability of observing four such deviations together d d be small. This is reflected in the RSZ value of 3.0, which indicates a significant event. 'Ihis information d d be useful in detecting a mall consistent bias in an analyticdl system, but d d not be useful in ccmbining results fran several different systems, where a consistent bias would not be expected, and is unlikely to be meaningful.
Another feature of the RSZ is the teridency for errors of opposite sign to cancel. In a well-behaved situation (i.e. when the laboratory is performing without bias according to the designated u value) this causes no problems. If the laboratory were badly behaved, hawever, the possibility arises of the fortuitous cancellation of significantly large z values.
'Ihese restrictions on the use of RSZ senre to emphasise the problems of using canbination scores derived f m various analytical tests. When such a score is used, it skdd be considered sirmltaneously with the individual scores.
Such an occurrence would be very rare by chance.
3. sun of squared sazes, ssz This canbination score has a chi-squared (2) distribution with m degrees of freedan for a well-behaved laboratory. the saxe on a ccrmrm scale with the z-scores. distribution can be found in most canpilatiom of statistical tables.
SSZ takes no account of the signs of the z-values, because of the squared terms. 'Thus, in the example considered previously, where the z-scores are (1.5, 1.5, 1.5, 1 . 5 ) , we find SSZ = 9.0, a value that is not significant at the 5% level, and does not draw enough attention to the unusual nature of the results as a group. However, in proficiency tests, we are concerned much mre with the magnitude of deviations than with their direction, so SSZ seems appropriate for this use. mrmver, the problem of chance cancellation of significant z-scores of opposite sign is eliminated. ?hus the SSZ has advantages as a ccmbination score for diverse analytical tests, and is to an extent canplementary to RSZ. A related score, (SSZ/m), is used in the "Laboratory Audit acd Accreditation Scheme".
Hence there is no simple possibility for interpretin However, the quantiles of the 2
APPENDIX I V : CALCULATION OF R U N N I N G SCORES
'Ihe general use of running scores is not reccmnended, but it is recognised that they may have specific applications if used with due caution. The usual procedure for ddating running scores is to form a "mving window" average. The procedure can be applied to z or a dination score.
As an example, a running B - score covering the current (n-th) round and the previorzs k rounds could be constructed as follows:
n I j=n-k
z . / (k+l) Rzn = c
where z. is the z-score for the material in the j-th round. 3
'Ihe running score has the alleged advantage that instances of poor performance restricted to one round are sooothed out sanewfiat, allcwing an overall appraisal of performance. On the other hand, an isolated serious deviation will have a " m r y effect'' in a simple mving window average that will persist until (k+l) mre r d of the trial have passed. This might have the effect of causing a laboratory persistently to fail a test on the basis of the running score, long after the problem has been rectified.
Tho strategies for avoiding undue emphasis on an isolated bad round are suggested. Firstly, individual or d i n e d scores can be restrained within certain limits. For

Protocol for proficiency testing of analytical laboratories 2141
exanple, we wuld apply a rule such as:
if 1z1>3 then z' = 23, the sign being the same as that of z
where z is the raw value of a z-score, and the nrodified value z' is limited to the range 23.
The actual limit used could be set in such a way that an isolated event does not raise the running score above a criticdl decision level for otherwise well behaved conditions.
As a second strategy for avoiding m r y effects, the scores could be "filtered" so that results fran rounds further in the past wwld have a smaller effect on the running score. For example, exponential sroothing uses:
calculated by:
where a is a parameter between zero and me, controlling the degree of smoothing.
APPENDIX V : A N ALTERNATIVE SCORING PROCEDURE FOR PROFICIENCY TESTING SCHEMES
An alternative type of scoring, which will be called (tscoring, is based not on the staradardised value but on the relative bias, namely
Q = (x-R)/R
where x and 2 have their previous meaning. This type of score relates directly to the analytical errors, without any reference to a value of u which would need to ccme either fran the participants' data or fran an iqased performance standard.
It wuld be expected that the overall distribution of Q would be centred on zero. This must be so here all-participant means are used as the estimate of the true value, provided that the nmber of outliers is relatively law. It should also be so where expert laboratory consenms means are used, as long as the group of nokexpert laboratories does not show an overall bias relative to the experts. when the true value is defined as a krmn addition, the Q distribution will be centred on zero provided that this true value is correct, and that there is no widespread use of methcdolcgy leading to biased results. In may cases, the actual distribution of Q-scores can be used to test the underlying assumptions.
The distribution of Q-scores cannot be predicted. Organisers of a scheme will need to examine the distribution of scores when laying dawn criteria for assessing whether or not performance is acceptable. In practice, the distribution has often been found to be close to normal.
An advantage of Q-scoring is that it gives a direct measure of the error associated with a determination. This can subsequently be canpared With a pe~fpnance standard which is judged to be appropriate to the purpose of the determination . If different end-uses of the determination require different performance standards, the Q-score can be used in canparison with whichever standard is most appropriate. Furthemre, if the organiser of a scheme decide at any time that a change in performance standard is justified, previously generated results can easily be canpared retrospectively with a revised standard.
1. Initial mrience with the Wrkplace Analysis Scheme for Proficiency (WASP), H M Jackson and N G West, Annals of Occupational Hygiene, in press.

2142 WP FOR HARMONIZATION OF QUALITY ASSURANCE SCHEMES FOR ANALYTICAL LABORATORIES
APPENDIX V I : A N OUTLINE EXAMPLE OF HOW ASSIGNED VALUES AND TARGET VALUES M A Y BE SPECIFIED AND USED
This is intended to be an example of how assigned values and target values may be calculated and used according to the protocol. Numerical details have been specified for the purposes of illustration only; real schemes will have to take account of factors specific to their area.
1.
2.
3.
4.
5.
5.1
5.2
The example requires that there will be four distributions of materials per year, dispatched by post on the Monday of the first full working week of January, April, July and October. Results must reach the organisers by the last day of the respective month. A statistical analysis of the results will be dispatched to participants within two weeks of the closing dates. This example considers the results fran one particular circulation of two test materials for the determination of two analytes.
Testing for Sufficient Hanogeneity
In accordance with the procedure described in Appendix 11, where a full example is given.
required
The analyses required in each round will be:
(i) Hexachlorobenzene in an oil;
(ii) Kjeldahl nitrogen in a cereal product.
O f R e s U l t s mtbods of Analysis and Repxtmg '
No methcd is specified, k t the target values were determined using a standard method, and participants must provide an outline of the methcd actually used, or give a reference to a documented methcd.
Participants must report a single result, in the same form as would be provided for a client.
Individual reported values are given in Table 1.
Assigned V a l u e s
in Oil
Take the estimate of assigned analyte concentration 8 for the batch of material as the robust mean of the results of six expert laboratories.
Reference Laboratory Result (ua/kq) 7 115.0 9 112.0
10 109.0 13 117.0 18 116.2 19 115.0
8 is 114.23 pg/kg: traceability was obtain- using a reference method ca ibrated using in house reference standards and the uncertainty on the assigned value was determined to be + l N / k g fran a detailed assessnent of this method by the reference laboratories.
K j e M a h l Nitrogen in a Cereal product
Take the assigned value of analyte concentration 8 for the batch of material as the median of the results fran all laboratories.

Protocol for proficiency testing of analytical laboratories 2143
Table 1 TABULAR EXAMPLES
Analyte Hexachlorobenzene in Oil( Nitrogen in Cereal
Assianed Value 114.2pgIkg I 2.93gllOOg
Laboratory Result I 2-Score I Result I 2-Score
001 122.6
149.8
93.4 -0.8
89.0 -1 . o 2.82 -2.0
002
003
004
005
006
007 115.0
203.8 3.5 3.17
112.0 -0.1 3.00 1.4
008
009
01 0 109.01 -0.2 I 2.821 -2.0
01 1
01 2 -4.0 2.84 -1 .6
01 3
01 4
01 5 -+q-+w 183.5
01 6
01 7
01 8 116.21 0.1 I 2.881 -0.9
01 9 115.01 0.01 2.921 -0.1
020
021 130.8 -2.8
022 150.01 1.41 2.921 -0.1
6.
6.1
Target Values for Standard D e ~ a t i m
Hexach.lorobenzene in oil In the example used in this Appendix the %RSDR value has been calculated frm the Horwitz Equation
1. (RSDR in % = 2 (1-0.51- It)
The target value for the standard deviatim (a) will therefore be:
al = 0.2228 w/kg

2144 WP FOR HARMONIZATION OF QUALITY ASSURANCE SCHEMES FOR ANALYTICAL LABORATORIES
6.2 K j e l d a h l N i t r o g e n in a Cereal Product
In the examples used in this Appendix the %F?SDR value has been calculated fran published collaborative trials.
The target value for the standan3 deviation (a) is given by:
u2 = 0.0188
7.
7.1
7.2
8.
8.1
8.2
S t a t i s t i d Analysis of Results of the Test
Hexachlombenzene in oil: Emmaticn of zscare
Calculate:
z=(x-A)/u
for each individual result (XI using the values of 8 and u derived above. results are shown in Table 1.
Kjeldahl Nitrogen in a Cereal Product: Fbrmat i rn of zsCme
Calculate :
z = ( x - 8 ) / a
for each individual result (x) using the values of 8 and u derived above. results are shown in Table 1.
These
These
Display of Results
2 scares Tables
The individual results for hexachlorobenzene pesticide in oil and for Kjeldahl nitrogen in a cereal product, together with associated z-scores are displayed in Tabular form (Table 1 1.
Histograrrs f a 2-scares
The z-scores for hexachlorobenzene pesticide in oil and for Kjeldahl nitrogen in a cereal product are also displayed as bar-charts; figure 1 and 2 respectively.
9. Decisicn Limits
Results with an absolute value for z of less than 2 will be regarded as satisfactory.
Remedial action will be recmnended when any of the 2-scores exceed an absolute value of 3.0.
In this example, such results are:
Laboratories 005, 008, 012, 014 for hexachlorobenzene pesticide in oil,
arid
Laboratory 008 for Kjeldahl nitrogen in a cereal product.