the international journal of organizational … · (psak) 45 financial year 2011 related to the...
TRANSCRIPT

The International Journal of Organizational Innovation Vol 10 Num 4 April 2018
100
THE INTERNATIONAL JOURNAL OF ORGANIZATIONAL INNOVATION
Vol 10 Num 4 April 2018 Section B:
Table Of Contents
Page: Title: Author(s): 101. Accountability And Innovative Financial Reporting To The Mosque Early Ridho Kismawadi, Uun Dwi Al Muddatstsir, Tjiptohadi Sawarjuwono 111. Application And Effects Of Capital Budgeting Among The Manufacturing Companies In Vietnam - Shu-Hui Su, Hsiu-Ling Lee, Jung-Ju Chou, Jen- Yin Yeh, Minh Hang Vu Thi 121. Evaluating Performance Of Logistics In The FMCG Industry Ying Feng, Jin-Chi Hsieh, Wen-Jie Zou, Yung-Ho Chiu, Hsin-Yi Chen 140. The Impact Of Perceived Supervisor Support And Workplace Friendship On Organizational Citizenship Behavior In Sport Center Chia-Ming Chang, Chao-Sen Wu, Wui-Chiu Mui, Yi-Hsuan Lin 150. Customer Satisfaction On The Performance Of Social Security Administrator (BPJS) Health In Central Java-Indonesia Noor Kholis, Alifah Ratnawati, Yusriyati Nur Farida 166. Affects Of Dietary Behavior And Risk Perception On Internet Foods Yang Chu Lin, Chia-Ko Lee, Yi Chih Lee 174. The Practice And Factors Of Taiwan Steel Plant To Adopt CSR Chia-Hao, Chang, Ting-Ya, Hsieh

The International Journal of Organizational Innovation Vol 10 Num 4 April 2018
101
ACCOUNTABILITY AND INNOVATIVE FINANCIAL REPORTING TO THE MOSQUE
Early Ridho Kismawadi State Institut For Islamic Studies
Zawiyah Cotkala Langsa (IAIN Langsa), Indonesia [email protected]
Uun Dwi Al Muddatstsir
State Institut For Islamic Studies Zawiyah Cotkala Langsa (IAIN Langsa), Indonesia
Tjiptohadi Sawarjuwono Airlangga University, Indonesia
Abstract This research aims to reveal of financial accountability, and as material of evaluation of mosque management as a whole with Case Study method. This research was con-ducted at the largest mosque in the province of East Java, this mosque is used as a place of research because it can reflect the mosques that exist in this province. Infor-mants in this researcher is a manager related to financial reporting and general public. This research is very important to be done at religious organization of mosque, be-cause in financing of mosque operational use fund which sourced from wider society, and obliged to be accounted well and open as expected by public society. The result of this research is the financial management which has been done by the mosque manager is very good, the evaluation material which still have to be done is to always publish the financial report to the public, as a form of financial responsibility by the manager of mosque to all parties. Keywords: Financial Accountability, Mosque, A Clash Of Jurisdictional
Introduction Accountability is the way to be responsible for the success or failure of organizational missions to achieve
previously set goals and objectives, through a periodic accountability me-dia (Mardiasmo, 2006). Islam has also required accountability as to which has

The International Journal of Organizational Innovation Vol 10 Num 4 April 2018
102
been described in the Qur'an. Accord-ing to the commentary (Katsir, 2008), Qur’an letter or Surah Al Baqarah page 282 above explains that if you do mua'malah to be written to be awake to what is agreed and become a legal force for witnesses. Then regarding the phrase "Let not the writer be reluctant to write it as Allah taught it, then let him write" Ibnu Katsir explains, people who are experts in the science of writ-ing should not refuse if there are peo-ple who ask for help and prohibited them. From the above interpretation can be concluded that the recording of any transaction activity will also pro-vide good information in accordance with the state of the order for the crea-tion of accountability that is needed by all interested parties. In the year of 2015 the Al-akbar Surabaya mosque or MAS manages funds derived from donor funds, infaq boxes, infaq use of MAS facilities, do-nations or Infak of educational institu-tions, and other infaq amounting to Rp.13.970.818.095, the number is very large and Requires good management and record keeping to be accountable for its use to all stakeholders. The fi-nancial statements of religious or non-profit organization has been set in the Financial Accounting Standard (PSAK) 45 financial year 2011 related to the preparation of non-profit organi-zations. Non-profit organizations must also create the financial statements and reported to stakeholders. In this case (Adebayo, 2013), adding that any form of organizational ownership requires appropriate management of its activi-ties for the sake of good accountability. Accounting is an art of recording fi-nancial activities that can later be used as a business communication tool that can provide information. According to
(Harahap, 2001), the purpose of ac-counting is to provide financial infor-mation to be used in the decision-making process. Accountability is actually there because the result on the relationship between the management (agent) and the public (principal) consequently ap-pears linkage is agent-principal rela-tionship. Appropriate information will reduce the circumstances under which managers have access to information on the prospect of a company that is not owned by an outsider called infor-mation asymmetry. Principal or pil-grims in this case given the authority intact to the agent as the manager in order to perform the operations of an organization, and therefore the agent expected to be responsible for all the operational organization of the princi-pal or the community (Muhammad, 2006), But the practice of accounting outside business entities, especially religious organizations, is neglected (Simanjuntak and Januarsi, 2011), there is generally a perception that the practice of accounting practices in reli-gious institutions is somewhat less ad-vanced where religionists are still prac-ticed and traditionally practiced. As an organization that manages donation funds from the general pub-lic, religious organizations such as mosques should be managing the in-coming funds and reporting them in detail in order to be accountable for the use of funds already donated by donors to the religious organization's board in order to avoid libel. Accountability is not just about compliance with appli-cable law or standards, but rather of organizational goals and public trust. Leaders of nonprofit organizations are encouraged to pay more attention to

The International Journal of Organizational Innovation Vol 10 Num 4 April 2018
103
forms of accountability strategies that can help them to achieve their mission of establishing such organizations to create public trust (Alnoor, 2003). But accounting practices outside business entities, especially religious organiza-tions, are highly neglected (Simanjun-tak and Januarsi, 2011), there is gener-ally a perception that the practice of accounting practices at religious insti-tutions is somewhat less advanced where religionists are still practiced and traditionally practiced. Meanwhile, according to A Clash of jurisdictional theory that introduced (Abbot, 1988), to obtain good results there should be a separation of authority between each profession that is impossible to under-stand each other so there is no conflict between professions. In research in the organization of the mosque during this financial management is done by relig-ionists, so the results obtained are not maximal. In the research (Siskawati and Surya, 2016), explains that account-ability practices are well under way in the of West Sumatra, as evidenced by traditionally well-dressed, neat and transparent financial management but not yet appropriate. So far only made a simple financial report by writing in-come and expenditure, but there are no records such as record-related assets owned and reports periodically for the progress of the mosque and the benefit of the people. Because the mosque's organization is very rarely the concern of other researchers who always focus with large organizations or entities, based on this researchers interested in researching at Al Akbar Surabaya mosque.
Research Methods One of the methods used in the interpretive paradigm is descriptive case study method. This research is a case study. In his book (Kamayanti, 2016), this case study is a disciplined comparative type that attempts to com-pare the problems and theories used in the research. Qualitative research has a purpose (Sugiyono, 2010) explains that qualitative research aims to reveal qualitative information so as to empha-size the process and meaning problem by describing something problem. This research is done by case study method (Case Study). Case studies are non-mainstream (qualitative) research that emphasizes the process by which the researcher must interact regularly with the research subject in the research lo-cation, and focus on the understanding, and the researcher's interpretation of the research object (Basuki, 2016). The research conducted is descriptive that is to reveal and describe the object and the subject of research as it is, the re-searchers only reveal and tend to just photograph the research. The case study approach in this study is useful to reveal the accountability done by the board of Al Akbar Surabaya mosque. To obtain information and data to be in though in this research, then pro-cedure that will be done is as follows. 1. Field research (field reseAcrch), data retrieval method used to support this research (Sugiyono, 2010) is an interview using semi structured method so that the atmosphere does not become formal, more to the con-versation Media used is written record. The in-dept interview process is con-ducted by in-dept interviews with face-to-face interviews between interview-

The International Journal of Organizational Innovation Vol 10 Num 4 April 2018
104
ers and informants involved with using or without using interview guidelines By directly interviewing the parties involved in this research such as man-agement of finance, administration And mosque congregation. The inter-view was conducted on January 3, 2017 at the office of Al Akbar mosque Surabaya. 2. Freely and structured observations aimed at presenting a realistic picture of behavior while performing activities or events to help answer research ques-tions. In this study the observer can see directly the incident as it is without can be influenced by the researchers. 3. Library research (library research) Literature research is obtained from studying library materials such as jour-nals related to the discussion in this study. Qualitative data analysis done on the data that has been obtained from the results of interviews with research-ers MAS board then in the analysis so it becomes a finding. Data obtained include Report of plan and realization of budget of mosque revenue and ex-penditure (RAPBM), Mosque balance report, financial report of surplus defi-cit, facility usage facility data and rental fee form, application usage and cash receipt form to be analyzed, The analysis is as follows: Data collection of documents, archives, other informa-tion will be selected in accordance with the needs of researchers, Data in-terviews with MAS board and observa-tions that have been done will be ar-ranged systematically and then will be selected to get good data in accordance with the needs of research , The ac-countability implementation in MAS will be compared with the literature that the researcher can find on the
standards and regulations relating to the nonprofit entity, and the data that has been collected will be compared with the theoretical basis and drawn conclusions, The findings gathered will be analyzed and interpreted through the penulian structure. This study is limited to account-ability practices implemented at the mosque al akbar surabaya. the largest mosque in the eastern jaa region be-came a form of accountability practices in the province.
Discussion To build confidence in the man-agement of a good religious organiza-tion, the need for accountability in car-rying out its operations in order to cre-ate a good organization and can be ac-countable by the manager to all parties. The studies that will be carried out in this research include mosque financial reporting, accountability definition, accountability objectives and account-ability benefits and accountability forms in terms of honest and legal ac-countability, process accountability, program accountability, and financial policy accountability (Mardiasmo, 2000), as well as theory Stewardship used in the study to determine the be-havior of the manager is more con-cerned with the purpose or benefit of the individual or organization that makes the mosques gain the trust of the public in managing funds from the public. The theory used in this research is the stewardship theory is the theory that describes that in conducting the work manager can work optimally in the interests not the interests of the or-ganization or individual goals (Podrug,

The International Journal of Organizational Innovation Vol 10 Num 4 April 2018
105
2010). This research also uses previous research as a reference comparison of research, so that the practice of reli-gious organization accountability of Al Akbar Mosque Surabaya can be man-aged well and gain trust from the pub-lic for the prosperity of the mosque.
Financial Reporting Mosque The mosque is a public institu-tion whose property belongs to the people who are entrusted to the man-agers. Managers run its role based on the beliefs of the people, then the fi-nancial statements that are a form of accountability of the mosque board is needed to provide evidence to the pub-lic. According to (Andarsari, 2016), the financial statements of a religious organization must include a report pro-viding information covering assets / assets, liabilities / debt, equity / capital, income and cash flow. In the applica-tion note that the financial reporting of the mosque is very simple that only make a report related to cash receipts and disbursements alone without mak-ing other required financial statements. With a clear record between income and expenditure, donors and the public will not be negative thoughts to the mosque administrator, because the mosque board can prove that the funds provided to them are managed well in the presence of financial statements that have been made as a form of ac-countability from the manager to the public.
Accountability Every business entity needs good management, in order to increase the level of public confidence in the or-
ganization. Good management will make the organization will be trusted by the public because of increased trust by the public to its business entities special religious organization is needed so that people can entrust the manage-ment of funds that one source from the congregation. Accountability aims as a form of accountability of organiza-tional managers to all interested parties in accordance with the goals and ob-jectives that have been specified before it periodically (Mardiasmo, 2006). Accountability is the relationship between the party in control and regu-lates the entity with the party having formal power over the controlling party (Mardiasmo, 2000). In the con-text of the organization of religious organization, accountability is needed as a proof of mosque management to the pilgrims, so the pilgrims trust the management of mosques that are en-trusted to the managers well managed and in accordance with the expecta-tions of all pilgrims for the benefit of the people. From the perspective of the ac-countability system (Mardiasmo, 2006) mentions some of the key characteris-tics of this accountability system, namely: 1. Focus on results. 2. Using some indicators that have been selected for performance measurement. 3. Pro-duce information useful for decision-making of a program or policy. 4. Generate data consistently from time to time. 5. Report the results and publish them regularly. From the above expla-nation can be concluded that to pro-duce a good accountability then the above characteristics become one of the guidelines for the organization to ensure that any management of an

The International Journal of Organizational Innovation Vol 10 Num 4 April 2018
106
institution can be accounted properly to the community. The Form of Accountability in the mosque can be done by reporting about all the activities of the mosque one of them with accounting practices in financial reporting. The financial report conducted by the mosque man-agement is done to answer the suspi-cions of various parties about the fi-nancial management conducted by mosque board and done consistently. Such financial reporting includes as-sets, liabilities / debt, equity / capital, income and cash flow. From the results of financial reporting that has been done mosque board, should be pub-lished to dismiss the suspicions that had been felt by the pilgrims and the community. During this time the ac-countability of the mosque is very simple by just making a cash report in and out without any reports related to assets owned by the mosque so that often the loss of assets owned by the mosque therefore the encouragement of all parties needed to prosper the mosque with accountability practices.
Results of Analysis
The problem faced by MAS is related to the distrust of the congrega-tion to the current mosque manager. This is caused by the lack of informa-tion obtained by the pilgrims. There-fore the stages of this research are started by analyzing accountability practices applied by mosque managers. Before analyzing to know the respon-sibility of managers to the management of the mosque then in need of ways to obtain data to know the accountability practices on the MAS.
Financial Accountability
Financial accountability is some-thing that is very sensitive to an or-ganization, because it involves every-thing in the operational processes of an organization, MAS in 2016 to manage the funds coming from grants and do-nors, donation box, use of facilities, donation of educational institutions, charity and shodaqoh, and other ap-propriate financial part of the narrative. 2016 managed funds amounted to 13,970,818,095, substantial funds are managed by the mosque, the mosque has a financial management plan and the realization of the budget revenues and expenditures are in short (RAPBM). In the use of funds belong-ing to the mosque of al akbar been very well proven by own the separa-tion between the reception and budget-ing, where each inclusion will be re-corded and immediately submitted to the expenditure part. On the expendi-ture is also pretty good supervision where the expenditure can only spend money directly if the nominal money is not more than 5,000,000, if it exceeds that there should be a direct disposition of the head of the financial sector in order to be melted. This study contradicts the studies (Triyuwono and Roekhuddin, 2000), which examines the amil zakat institu-tions, the studies found that the prac-tice of internal controls are weak, where the dual position between the revenues and expenditures, it is a po-tential for the occurrence of acts -Action that lead to the occurrence of irregularities in financial management. In reporting MAS classified into a modern organization compared to similar organizations, are already using apps in recording all financial

The International Journal of Organizational Innovation Vol 10 Num 4 April 2018
107
statements. This study is contrary to the research (Simanjuntak and Janu-arsi, 2011) where the research that is carried out in one of the mosques in Tangerang, found that management and reporting is very simple where managers only use the financial report-ing systems have traditionally only create four columns reporting ie col-umn expenditure, income and balance and its reporting is not done consis-tently and periodically. Reporting that applied at the mosque has adopted regulation of financial accounting standards or PSAK 45 on profit entities in accordance with the regulations that apply to organizations such as the mosque. In this study, researchers given the financial statements of reali-zation of government budget mosque, balance sheets, and statements of sur-plus deficit that is not given nominal, the mosque was opened her statements not to be open, the mosque invites to anyone that wants to see the report could live to see it. Observations found by research-ers found that financial reporting in the publication is not detailed, only the total of income alone. In observing that the giver of alms giving alms it directly to the charity box it does not have strong evidence that the person con-cerned alms formally, but if the con-gregation would give alms formally the mosque authorities invited directly to be given to the integrated service unit and will given the receipt of a formal charity in order to have evidence char-ity, things in handy for a monitoring system that clearly recorded revenues mosque. Financial management ac-counted mosque also to the provincial government each year. Overall finan-cial accountability applied to the man-ager has been very good, proven by the
international nature of achieving certi-fication as ISO 9001: 2008. Researchers also had to find info about a mosque that obtained ISO 9001; 2008 that turned out to be true Masjid Al Akbar mosque to two in In-donesia to obtain the certification, in addition to Al Akbar mosque first ob-tain such certification is one of the mosques belonging not famous mosques in Jakarta, the mosque of Al-Ikhlash Jati Padang, located in Pasar Minggu, South Jakarta, the mosque was also the first time obtain such cer-tification in southeast Asia. One of the standards of quality management system (QMS) that has evolved is an ISO 9001 version 2008 more emphasis on patterns of business processes within the organization of the company. Thus almost all types of businesses can implement a quality management system ISO 9001. The 2008 version is the latest version of which was published in December 2008. ISO 9001: 2008 emphasizes on the effectiveness of the processes of an organization (Hendartho, 2014). The accountability of the stew-ards always consider the risks will oc-cur. Seen how the attitudes of manag-ers consider the risks may be mini-mized by controlling Internal manner in an eye fixed on the internal and ex-ternal parties, therefore to increase public confidence, managers apply a fairly strict supervision. This study contradicts the studies (Siskawati and Surya, 2016) by using case studies re-searchers probed the practice of ac-countability in the mosque Jami 'Sun-gai Jambu, found that the mosque is considered one of the mosques in West Sumatra is still weak in the manage-

The International Journal of Organizational Innovation Vol 10 Num 4 April 2018
108
ment of its activities, where internal existing control and monitoring and financial management is still weak, while MAS have good resources and facilities such support in financial management applications to create the financial statements and its supervision has also been doing well. Therefore accountability applied by the MAS has been recognized by the international community. Control-ling both internally and externally as well have been on the run well, there-fore these achievements should be kept on hold for the creation of trust society for administrator to manage MAS is good, but there are still constraints re-lated publications finances become a problem, it is proper caretaker publish financial related in owned media, the results of the observation that the man-ager does not publish financial media that can be accessed directly by the pilgrims, should the manager be able to publish in bulletin board even up on the official website of the mosque so that the public can access it directly, during this time the manager only al-lowed in limited financial related to direct society could ask to the manager in the office. Publication is important as a form of accountability Al Akbar mosque authorities to the whole con-gregation and the community to the negative thoughts that had been circu-lating can be proved with relevant fi-nancial statements published and can be accessed by all those who need it. Theory stewardship experiences were visible where the manager sacri-ficing time for the benefit of the mosque not interests individuals and managers continue to improve their management by being open to criti-cisims and inputs provided by the con-
gregation for the sake of prosperity of the Al Akbar Surabaya mosque.
Conclusion
Based on the description of the description and the results of the above discussion, it can take the conclusion of this study is the accountability of the MAS as a whole has been very well caused due accountability that pro-duced well-documented and in accor-dance with the SOP and on show to the congregation as a principle even in-volve directly in some of its activities and accountability already reported to the East Java provincial government, still found weakness, where the direc-tors and the governor can not empower internal employees to be in the position of Head of finance that the Head of finance coming from parties external to the organization, with the retirement age and has concurrent positions at other organizations that could interfere with its performance in the mosque because it does not focus. Related publications are also the manager of the al akbar has not been able to maximize financial related to publicize the mosque, managers should be able to publish in all available me-dia, including on his official website that can be accessed all the parties so that people can see directly and ad-versely minded managers. A Clash theory of jurisdictional applies to the management of the mosque, which makes the financial statements are educated accounting who do the management maximally and full of sense of responsibility and selfless, ie regardless of what will be obtained after implementing, even managers sincerely receive income

The International Journal of Organizational Innovation Vol 10 Num 4 April 2018
109
which are given MAS or not given at all, because they have the principle of serving the congregation and work as worship instead of work. This research is very well publicized so that religious institution managers can make good financial reporting as in this research according to the prevailing provisions and publish it as a form of accountabil-ity to all parties
References Adebayo, O., Olusola, AG, &
Abiodun, OF (2013). Relation-ship Between Corporate Govern-ance And Organizational Per-formance: Nigerian Listed Or-ganizations Experiance. Interna-tional Journal Of Business And Management Invention, Vol 2 (Issue 9), 01-06.
Alnoor, E (2003). Accountability In
Practice: Mechanism For Ngos. World Development. Elsevier Science, Vol.31 No. , 813-829. Https://Doi.Org/10.1016/S0305-750X(03)00014-7
Andarsari, PR (2016). Nonprofit Or-
ganization Financial Statement (Mosque Institution). Journal Of Economics, University Of Kadiri, Vol 1, No.
Basuki. (2016). Accounting Research
Methods And Case Studies Based Management. Surabaya: Airlangga University Press.
Harahap, Sofyan Safri. (2001). The
Role Of Islamic Accounting In Encouraging The Implementation Of Sharia Economics. Journal Of
Business And Accounting, Vol 3 No 2.
Hendartho, D. (2014). Implementation
Analysis Of Quality Management System Iso 9001: 2008 At Man-dala Indonesia School Of Admin-istrative Science. Scientific Jour-nal Of Administrative Sciences, Vol 5 No 2.
Katsir, I. (2008). Tafsir Ibnu Katsir
Vol 1. Jakarta: Librarian Imam Syafi'i.
Mardiasmo. (2000). Public Sector Ac-
counting. Yogyakarta: Andi. Mardiasmo. (2006). The Realization
Of Transparency And Public Ac-countability Through Public Sec-tor Accounting: A Means Of Good Governance. The Govern-ment Accounting Journal, Vol 2 No 1, 1-17.
Moleong, J. (2007). Qualitative Re-
search Methods. Bandung: PT Rosdakarya.
Mohammed. (2002). Adjustment Of
Sharia Accounting Theory: The Perspective Of Social Account-ing And Accountability. IQTI-SAD Journal Of Islamic Eco-nomics, Vol.3, No. , 67-87.
Muhammad, R. (2006). Financial Ac-
countability In Zakat Manage-ment Organization (Opz) In Spe-cial Region Of Yogyakarta. Jour-nal Of Accounting And Invest-ment, 34-55.
Simanjuntak, D. Anzar, & Januarsi, Y.
(2011). Accountability And Fi-nancial Management IN The

The International Journal of Organizational Innovation Vol 10 Num 4 April 2018
110
Mosque. In National Symposium Accounting.
Siskawati, EF, & Surya, F. (2016).
Meaning Of Mosque Account-ability: How Mosques And Communities Mutually Prosper? Journal Of Accounting Multipa Radigma, Vol 7 No 1.
Triyuwono, I., & Roekhudin, I. (2000).
Consistency Internal Control System Practices And Account-ability At Lazis (Case Study In Lazis X Jakarta). Indonesian Journal Of Accounting Research, Vol 3 No 2.

The International Journal of Organizational Innovation Vol 10 Num 4 April 2018
111
APPLICATION AND EFFECTS OF CAPITAL BUDGETING AMONG THE MANUFACTURING COMPANIES IN VIETNAM
Shu-Hui Su Department of Accounting, I-Shou University, Taiwan, R.O.C.
Hsiu-Ling Lee Department of Accounting, I-Shou University, Taiwan, R.O.C.
Jung-Ju Chou*
Department of Accounting, I-Shou University, Taiwan, R.O.C. *Corresponding Author [email protected]
Jen-Yin Yeh
Department of Commerce Automation and Management National Pingtung University
Minh Hang Vu Thi
College of Management, I-Shou University, Taiwan, R.O.C.
Abstract
Vietnam is a developing country which joined the globalization (WTO) in 2007. Since that turning-point, Vietnamese companies have faced more challenges and business risk. To cope with these problems, especially to increase the effectiveness of financial operation, the application of capital budgeting techniques on evaluating in-vestment projects becomes more and more significant for Vietnamese firms. Never-theless, there has been no research revealing the capital budgeting practice in this country so far. Therefore, this study conducts a survey within 62 Vietnamese manu-facturing companies to provide information about the current capital budgeting prac-tice in Vietnam, regarding two aspects: the application of capital budgeting techniques and the effects of some factors on the application of these techniques. By using Two-way ANOVA with Repeated Measures and Multivariate Analysis, the results indicate there is significant difference in the importance and application fre-quency of each capital budgeting techniques by the type of investment project. Fur-

The International Journal of Organizational Innovation Vol 10 Num 4 April 2018
112
thermore, the survey finds no significantly different application of evaluation tech-niques by the size of projects. However, empirical evidence in this study also implies that sophisticated capital budgeting technique is preferred by higher educated officers. It supports and extends the finding of previous researches regarding capital budgeting practice in developing countries. Key Words: capital budgeting techniques, Vietnam, investment projects, application
Introduction
In the form of either debt or eq-uity, capital is a limited resource. To deal with limited capital sources, man-agers have to carefully implement capital budgeting with appropriate skills; otherwise, they could suffer the consequence for a long while. The terminology “capital budgeting” de-scribes how managers plan long-term investment projects such as extending existing product or introduction of new products. Since most companies have many more potential projects than can actually be funded, so managers must carefully select those projects that promise the greatest future return. Be-sides, capital budgeting is also an ex-tremely significant facet of a com-pany's financial management. The re-sult of capital budgeting could cause a considerable change in a company. For example, acceptance of an investment project may change the operational scope, field, business risks and profit-ability complexion of a company. These changes may further affect in-vestors' assessment of that company (Osaze, 1996). According to Ekeha (2010), the capital budgeting is critical especially in developing countries and should be approached much carefully and posi-tively. Among Southeast Asian coun-tries, Vietnam is a developing econ-omy which joined the World Trade
Organization (WTO) in 2007. Since the turning-point, Vietnam has been connecting itself widely with the out-side world and searching for more op-portunities to develop the economy. In response to the blooming, the capital budgeting has already been imple-mented by Vietnamese companies since early 2000s. Nevertheless, so far, there has been no research revealing the capital budgeting practice in this country. Therefore, this study focuses on how capital budgeting is being ap-plied in Vietnam, and tries to provide information by two important aspects: the application of capital budgeting techniques and the impacts of some factors on the application of these techniques.
Literature Review
In recent decades, there is a trend that sophisticated capital budgeting techniques (CBT) have been applied increasingly across countries and bene-fits of applying these techniques were demonstrated by academic literature (Danielson & Scott, 2006; Dheeriya, 2008; Verma, Gupta & Batra, 2009). To evaluate potential project, firms could use some of financial techniques to appraise investments. Some popular financial capital budgeting techniques are Discounted Cash Flow techniques (DCF) (including net present value (NPV), internal rate of return (IRR), profitability index (PI)), payback pe-

The International Journal of Organizational Innovation Vol 10 Num 4 April 2018
113
riod (PB), and accounting rate of return (ARR).
Application of Capital Budgeting
Techniques
A number of research studies have been conducted on capital budg-eting practice in many countries. By surveying this budgeting practice, re-searchers made an effort to address which project assessment technique got dominated and gained more appli-cation. For example, Parkash and Gaur (2004) found that in case of examining acceptance or rejection of a project, IRR technique does not conflict with NPV. But in case of comparing pro-jects, these techniques give different results and ranking. An investigation into capital budgeting of Australia companies (Truong, Partington, & Peat, 2008) concluded that NPV, IRR and PB were the most applicable and popu-lar investment evaluation techniques. In another research, Brijlal and Pradeep (2008) discovered the result indicated that followed by NPV, PB is preferred and applied across different sizes and business areas, after examin-ing a number of variables relating to capital budgeting in small, medium and large size companies in the West-ern Cape Province of South Africa. As mentioned above, research results showed that the application fre-quency of each evaluation technique significantly differs from each other as well as across surveyed areas. In com-mon, DCF techniques such as NPV and IRR have increased their signifi-cance over the time, and non-DCF ones such as PB and ARR tend to be used as supplements to investment proposal evaluations. The diversity of such evaluation technique application
establishes the important basis for the hypothesis of this study which sug-gests examining if there is any differ-ence in the use of each project evalua-tion technique in Vietnam. Addition-ally, the non-financial factors, some-time portrayed as non-traditional evaluation techniques such as competi-tive response, strategic linkage and growth potential, has increased its im-portance in today’s business environ-ment. Thus, this research also exam-ined the relationship between invest-ment project types and non-financial evaluation techniques.
Types of Investment Projects
Analyzing the influence of in-vestment project types in the applica-tion of capital budgeting tools is criti-cal for isolating a potential confound-ing factor in evaluating proposed pro-jects. Chen (1995) conducted a survey of capital budgeting in United States and specially focused on inspecting three types of investment projects: equipment replacement, extension of existing products and extension into new products. The study found that the role and importance of evaluation techniques over three types of invest-ment projects are significantly differ-ent. For all three types of investment, DCF techniques are the most impor-tant, followed by Payback Period, and Accounting Rate of Return. The result proposes notable differences in the ap-plication of DCF techniques in assess-ing different investment types. DCF techniques are considered more impor-tant in appraising project on extension of existing products or extension to new products than in appraising equipment replacement projects. This finding is not contradictory with

The International Journal of Organizational Innovation Vol 10 Num 4 April 2018
114
previous surveys (Klammer, Koch, & Wilner, 1991). Chen (1995) compared the utili-zation of non-financial techniques across three investment types, and showed that these techniques are more widespread for assessing projects on extension to new products. In addition, there is a significant increase in the use of these techniques for all three types of investment projects. This result is adequate to the supposition that com-panies tend to use more non-financial techniques as a supplement to DCF techniques in case of there are more uncertainty and intangible elements involved. The effect of investment types on the manner of utilizing evaluation techniques are the founda-tion of hypothesis one: H1: There is no significant difference
in the application of each capital budgeting technique by the type of investment projects.
Sizes of Investment Projects
Financial theory suggests that all projects should be formally analyzed. However, in practice there are a num-ber of firms that fail to analyze projects unless projects' relative cost is above some fixed amount. The larger invest-ment proposals, the more important they are and usually require more use of evaluation techniques to make care-ful considerations. Failure to analyze small projects may have a significant impact on firm value. Collectively, small projects consume a significant portion of a firm's capital budget. The opportunity cost of investing in a num-ber of small projects is not having the funds to invest in a larger capi-tal project. Thus, it is important that all
projects should be analyzed to ensure that resources are being used effec-tively. One survey of USA manufactur-ing firms contained questions investi-gating whether smaller projects were exempt from formal financial analysis (Dheeriya, 2008). The results revealed that, for some firms, there is still no use of capital budgeting techniques in small projects. Even though these pro-jects are mandated or required by gov-ernment, they should be subjected to formal analysis in order to consider all viable alternatives. This relationship between sizes of investment projects and the use of evaluation techniques notably proposes to test the hypothesis: H2: There is no significant difference
in the application of each capital budgeting technique by the size of investment projects.
Education Background
Several surveys pointed out the correlation between working experi-ence, education background of the fi-nance personnel and the way of using capital budgeting techniques. Most of financial directors of surveyed compa-nies believe that companies whose per-sonnel are more educated and highly qualified usually prefer to use sophisti-cated techniques such as NPV and IRR whereas the non-discounted techniques like payback period criterion are often preferred by the less qualified ones. Graham and Harvey (2002) implied that companies whose CEOs got high degree such as MBA or PHD are more likely to use NPV method than firms whose CEOs did not. Furthermore, within small firms, managers with long
The International Journal of Organizational Innovation Vol 10 Num 4 April 2018
115
tenures but without MBAs more prefer to apply payback Period. However, a survey of the capital budgeting practice within Indian com-panies showed a different result. Only the use of Payback Period is de-tected to increase with CEOs’ educa-tion and qualification improvement. For all other methods, the relation was found to be insignificant between the methods (NPV, IRR, Profitability In-dex and ARR) and the CEO education (Verma, Gupta, & Batra, 2009). These practical findings proposed the sugges-tion to test the hypothesis as the fol-lowing: H3: There is no significant difference
in the application of each capital budgeting technique by education background of decision-makers.
Methodology
This research is conducted via a questionnaire survey. Since the objec-tive respondents are usually top man-agers or chief financial officers, so the questionnaires are mostly handed to each target respondent with the pur-pose of attracting their interests in the research and increasing the response rate. Although the sampling is not completely random due to some limits, all the 62 return respondents are from the major manufacturing companies listed on the stock market. And also, it encompasses various manufacturing industries as well as various geo-graphical areas of Vietnam. The questionnaire applied in this survey is adopted from Chen (1995) and comprises two sections. In Section I, respondents are required to provide some information regarding job title,
working years and their highest de-grees. The job title is to show if the respondent is suitable with the content of this survey. In addition, respon-dents’ information about working years and highest degrees are use to assess the effect of their working ex-perience and education background on the use of capital budgeting tech-niques. Also, respondents are required to give the average size of their com-pany’s investment projects. In Section II, respondents are re-quested to estimate the percentage of each investment project type to the company’s total investment projects. These percentages are used to calculate the weighted average index for the ap-plication of each type of capital budg-eting technique by a company. This is a preparative step to test hypotheses. Respondents are also requested to evaluate the frequency of use of each evaluation technique across three types of investment projects on a five-point Likert-type scale for measurement which ranges from “1” (never use or not important) to “5” (always use or extremely important). The frequency can be seen as the importance of an evaluation technique. These assess-ments provided by respondents repre-sent the practice of evaluation tech-nique application. Two-way ANOVA with Re-peated Measures and Multivariate Analysis is utilized to test hypotheses. In each hypothesis, there are four de-pendent variables. Each one is the group of weighted average frequency of application of each capital budget-ing technique (Discounted Cash Flow Models, Payback period, Accounting Rate of Return and Nonfinancial capi-tal budgeting techniques). Each

The International Journal of Organizational Innovation Vol 10 Num 4 April 2018
116
weighted average frequency is calcu-lated by using the Percentages of each type of investment project (Replace-ment Projects, Extension of Existing Products and Extension into New Products). That is, four dependent variables counted as four groups of capital budgeting techniques with the effect of three independent variables are examined.
Results
Descriptive Statistics
As shown on Table 1, among the 62 samples, 41.9% respondents are fi-nancial managers, 30.6% respondents are accountants. The Chief Executive Officers and Chief Operating Officers in turn account for 12.9% and 8.1% of the samples. Only 6.5% respondents are treasurers. 62.9% of the samples have the Master Degrees, 9.7 % re-spondents have Doctoral Degree. Un-der the Master Degree, 25.8% respon-dents with Bachelor Degree, other de-grees are only 1.6%. Thus, the respon-dents are highly educated, over 70% of them got the master and Doctoral De-gree. Within the samples, respondents who are little experienced (less than 2 years) account for only 4.8%. The number of moderate (3-5 years) and quite experienced (6-8 years) respon-dents is larger, 32.3% and 40.3%, re-spectively. Other respondents who are very experienced also account for a fairly large percent (22.6%). Besides, about the project size, the average investment project sizes of investigated firms vary from $5,102 to $36,500,000. For more details, 19.4% of projects belong to $5,000-800,000 while 21% projects belong to $801,000 -$1,571,000. The medium project
sizes, from $1,571,100 to $3,000,000 account for 19.4%. Larger project sizes, from $3,000,100 to $6,510,000 and $6,510,100-$36,510,000 are in turn 21% and 19.4 % of the total pro-jects.
Test for Hypothesis H1
By testing first hypothesis, two aspects of capital budgeting practice are investigated. The first one is if there is any significant difference in the application of each assessment technique. The second one is whether types of investment projects affect this application practice. The first null hy-pothesis is rejected. Multivariate Tests shows highly significant results for all three Within-subjects Effects. For the technique effect, Wilkis’ (Ʌ) = 0.409, F (3, 59) = 28.410, P = 0.000. For the Project effect, Wilkis’ (Ʌ) = 0.581, F (2, 60) = 21.679, P = 0.000. It’s also significant for the interaction effect of projects by each technique, Wilkis’ (Ʌ) = 0.361, F (6, 56) = 15.554, P= 0.000. These results strongly indicate that the application of capital budgeting tech-niques differs across type of techniques as well as across type of project. Fur-thermore, the significant interaction effect proves that such application by the type of technique also depends on each type of projects. As shown on Table 2, within three types of projects investigated, the average ratio of project 2, (Extension of Existing Products) is largest (M= .4385), followed by the average ratio of project 1, (Replacement Projects) (M = 0.2905) and project 3, (Extension to New Products) (M = 0.2710). There-fore, in common, firms within the samples invest the most in project 2 and least in project 3.

The International Journal of Organizational Innovation Vol 10 Num 4 April 2018
117
Table 1. Descriptive statistics
Job title Frequency Percent
Financial manager Treasurer Chief Executive Officer Chief Operating Officer Accountant
26 4 8 5 19
41.9 6.5 12.9 8.1 30.6
Degree Frequency Percent
Doctoral Degree Master Degree BachelorDegree Other
6 39 16 1
9.7 62.9 25.8 1.6
Working years Frequency Percent
≤2 year 3-5 year 6-8 year ≥9 year
3 20 25 14
4.8 32.3 40.3 22.6
Table 2. Estimate marginal means of project* technique
T1(DCF) T2(PP) T3(ARR) T4(NF)
P1 (Replace), M=.29 4.048 3.661 3.306 2.468
P2 (Existing), M=.44 4.274 3.952 3.339 3.694
P3 (Ext-New), M=.27 Weighted
4.226 W4.183
3.903 W3.839
3.355 W3.333
4.242 W3.468
For all three types of projects, the means of DCF techniques are always the largest among four techniques. Thus, regarding the capital budgeting practice in Vietnam, DCF is the most prevalent tool in assessing investment proposals, followed by the PB and ARR, respectively. For nonfinancial techniques, there is an increase of its application from project 1 to project 2 to project 3 (from 2.468 to 3.694 to 4.242). The finding proves the increas-ing role of nontraditional techniques as the uncertainty of business environ-ment increases.
Test for Hypothesis H2
According to the result of multi-variate tests, the Test of Roy's Largest Root indicates the effect of project size is significant at 0.01 significant level, F=4.463, P= 0.003, the null hypothesis H2 is rejected. It is detected that only for technique 2, there is dissimilar ap-plication cross the sizes of investment projects, F= 2.528, P = 0.05. As shown on Table3, for projects whose sizes are larger and very large, the means of ap-plication (M= 3.685, M= 3.704) are less than very small and moderate sizes

The International Journal of Organizational Innovation Vol 10 Num 4 April 2018
118
Table 3. Estimate marginal means of re pro size
Dependent Variable re pro size Mean
very small 4.202 quite small 4.251 moderate 4.379 quite large 4.198
New T1
very large 4.263
very small 4.225 quite small 3.602 moderate 4.058 quite large 3.685
New T2
very large 3.704
very small 3.515 quite small 3.268 moderate 3.095 quite large 3.495
New T3
very large 3.287
very small 3.183 quite small 3.715 moderate 3.365 quite large 3.336
New T4
very large 3.621
(M = 4.225, M= 4.058). The result supports previous studies that Payback Period technique tends to be less ap-plied in appraising large projects. However, based on the three Multivariate Tests (Pillai's Trace, Wilks' Lambda, and Hotelling's Trace), project size is no longer significant due to large P values (>0.1). Null hypothe-sis H2 is accepted. The later survey results find out no different application of every evaluation techniques by the size of projects. This outcome could result from the correlation between the sizes of firms and investment projects. In general, the project sizes are directly proportional to firm sizes. The larger firm, the more they could afford to in-vest sizable projects. One project that is perceived small or not significant to large firms could be significant toward smaller firms (Danielson & Scott, 2006). As a result, there is no
dissimilarity in the application of the rest three remaining techniques.
Test for Hypothesis H3
Hypothesis H3 examines the capital budgeting practice under the impact of some human factors. Ac-cording to Wilks' Lambda Test, educa-tion background affects the application of capital budgeting techniques with F = 2.966, P = 0.001 (<0.01). Tests of between-subjects effects indicate that the application of technique 2 and 3, PB and ARR, do not differ across types of degree. However, for tech-nique 1 and 4, DCF and nonfinancial techniques, there are dissimilar appli-cations with P values are in turn 0.000 (<0.01) and 0.063 (<0.1). Considering the means of each evaluation technique by the type of degree in Table 4, the result shows that

The International Journal of Organizational Innovation Vol 10 Num 4 April 2018
- 119 -
Table 4. Estimated marginal means of degree
Dependent Variable Degree Mean
Doctoral Degree 4.397a Master Degree 4.322 Bachelor Degree 4.325a
T1-DCF model
Other 2.000a
Doctoral Degree 3.763a Master Degree 3.589 Bachelor Degree 3.104a
T4-nonfinancial techniques
Other 5.000a
Doctoral Degree 3.737a Master Degree 3.888 Bachelor Degree 3.765a
New T2
Other 3.800a
Doctoral Degree 3.807a Master Degree 3.213 Bachelor Degree 3.389a
New T3
Other 2.800a
the application frequency of technique 1, DCF techniques, gradually de-creases from respondents who have Doctoral degree to lower-degree re-spondents. The finding supports the theory about the application of such a sophisticated DCF model which is usually preferred by higher educated employees. For technique 4, there is also a decrease in the utilization of this technique from Doctoral degree to Master and Bachelor degree. However, this tendency is opposite to officers whose degrees are under Bachelor. It appears that the lowest-degree em-ployees always utilize the nonfinancial, qualitative techniques to evaluate pro-jects.
Conclusion
Due to the role and importance of captial budgeting toward company’s finances as well as the national economic development, particularly developing countries, this study surveys 62 Vietnamese manufacturing companies in order to capture and judge the practice of applying capital budgeting techniques in Vietnam. In
summary, the test for hypothesis H1 points out strongly statistically signifi-cant results. Each capital budgeting technique remarkable differs from their role and application frequency in evaluating investment projects. Types of investment project are found as a significant factor that causes this dif-ference. For testing hypothesis H2, an-other aspect of investment project, the size element is provided evidence about the relationship with only the application of Payback Period tech-nique. Beside aspects related to in-vestment projects, the impacts of hu-man elements are also considered in hypothesis H3. Education background of investment decision makers pro-vides empirical evidences of its influ-ence on the manner of evaluating pro-jects. Since culture considerably influ-ences the reasoning and thinking man-ners of decision makers, it could be a significant factor causing the variance in the application of capital budgeting techniques. The future study should take the effect of culture into account

The International Journal of Organizational Innovation Vol 10 Num 4 April 2018
120
to enrich the capital budgeting litera-ture. In essence, the application of capital budgeting techniques is to en-hance the effectiveness of investment activity of companies. Therefore, the future study may conduct surveys to investigate the link between the prac-tice of applying these techniques and firms’ performance represented in fi-nancial criterion such as profit, return on asset, and so forth.
References
Brijlal, & Pradeep. (2008). The State
of entrepreneurship education at tertiary institutions in the western cape. Journal of College
Teaching & Learning, 5(2), pp.25-35.
Chen, S. (1995). An empirical exami-
nation of capital budgeting techniques - impact of investment type and firm characteristics. The
Engineering Economist, 40(2), pp.145-170.
Danielson, M. G., & Scott, J. A.
( 2006). The capital budgeting decisions of small businesses. Journal of Applied Finance,
16(2), pp.45-56. Dheeriya, P. L. (2008). Investment
decision making in an entrepreneurial firm: an application. Journal of American
Academy of Business, Cambridge,
12(2), pp.22-25. Ekeha, G. E. (2010). Capital budgeting
practices and economic development: a comparative study of companies in Western Europe and West Africa. SSRN
working paper series. Graham, J. R., & Harvey, C. R. (2002),
How do CFOs make capital budgeting and capital structure decisions? The Journal of Ap-
plied Corporate Finance, 15(1), pp.8-23.
Klammer, Т., Koch, В., & Wilne, N.
(1991). Capital Budgeting Practices: A Survey of Corporate Use. Journal of Management
Accounting Research, pp.113-131. Osaze, B. (1996). The fallacy of R.O.I.
as a performance measure. First
bank of Nigeria Plc. Bi-annual
Review, pp. 40-44. Parkash, S., & Gaur, H. (2004). An
empirical examination of capital budgeting techniques. The
Engineering Economist, 40(3), pp.220-32.
Truong, G., Partington, G., & Peat, M.
(2008). Cost-of-capital estimation and capital-budgeting practice in Australia. Australian
Journal of Management, 33(1), pp.95-121.
Verma, S., Gupta, S., & Batra, R.
(2009). A survey of capital budgeting practices in corporate India. The Journal of Business
Perspective, 13( 3), pp.1-17.

The International Journal of Organizational Innovation Vol 10 Num 4 April 2018
121
EVALUATING PERFORMANCE OF LOGISTICS IN THE FMCG INDUSTRY
Ying Feng Department of Auditing, Business College
Institute of Resource Conflict and Utilization Northwest University of Political Science and Law, Xi’an City, China
E-mail: [email protected]
Jin-chi Hsieh Department of Business Administration,
Taipei City University of Science and Technology, Taipei, Taiwan 112 R.O.C. E-mail: [email protected]
Wen-jie Zou
Institute of Economics of Fujian Normal University Fuzhou, People’s Republic of China
E-mail: [email protected]
Yung-ho Chiu Department of Economics, Soochow University, Taiwan 100 R.O.C.
E-mail: [email protected]
Hsin-yi Chen Business Institute,
Soochow University, Taipei, Taiwan 100 R.O.C. E-mail: [email protected]
Abstract
The purpose of this paper is to consider the logistics performance of the fast moving consumer goods (FMCG) industry with the case study of L Company, so as to make recommendations for its logistics operation process and to be a reference for man-agement decisions. We use dynamic network data envelopment analysis (DN-DEA) and Malmquist product index (MPI) methods to discuss the overall efficiency and the division efficiency of its three divisions and to investigate the change in productivity during the period 2011-2013. Supplemented by the Wilcoxon rank sum test method, we want to understand how the numerous divisions vary in their logistics performance efficiency in different years. The input items are freight & pick costs (FPC), accep-

The International Journal of Organizational Innovation Vol 10 Num 4 April 2018
122
tance costs (AC), and return handling costs (RHC); the output item is sales revenue (SR); while storage costs (SC) play a link across divisions from the Professional Products Division (PPD) to the Consumer Products Division (CPD), or PPD to the Active Cosmetics Division (ACD), or CPD to ACD. The inventory is carried over across periods t to t+1. The results indicate the following: (1) the logistic perform-ances of the three divisions exhibit the same trend, which is 2011 shows the best per-formance, followed by 2013 and 2012; (2) the Frontier-shift effect is the main reason to cause the progress or reversion of total factor productivity; (3) total factor produc-tivity of PPD presents significant differences when comparing between CPD and ACD. Keywords: Dynamic network data envelopment analysis, Malmquist productivity in-dex, FMCG industry, Logistic, Performance, Wilcoxon rank sum test. (Note, this article is formatted in a single column to facilitate easier reading of the mathematical formulas. All Figures are shown at the end of this article).
Introduction
The factors of economic globalization and trade liberalization in recent years have brought about shorter product life cycles, enhanced customer service levels, and driven enterprise strategic alliances, business process reengineering, and concerns for environmental issues. Logistics has become the main focus of global businesses and an important strategy to strengthen firms’ competitive advantages, to make the best use of logistics to improve customer service levels, and to meet customer demand. Thus, enterprise management strategies are now targeting the promotion of logistics supply chain integration. Logistics management can maintain complete, stable operat-ing procedures and create additional values such as reductions in costs and operational risk. As businesses encounter more meager operating profits, how to reduce costs is a central issue, such as cutting logistics costs or even increasing logistics outsourcing. The logistics support department of firms is a non-core competency, especially the logistics center. When looking at efficient human resources management, expertise training, and capital equipment investment, logistics outsourcing is playing a bigger part among major strategic decisions. In the last few years the research issues of logistics have targeted using a struc-ture equation model to explore logistics outsourcing loyalty and logistics outsourcing management, such as Wallenburg et al. (2010), Juga et al. (2010), Liao et al. (2010), etc. Soni and Kodali (2011) and Talib et al. (2011) examined supply chain manage-ment practices. When employing data envelopment analysis (DEA) to assess per-formance, some studies compared the performances of different countries or compa-nies in a single period, while ignoring division performances, the overall environment, and changes with time, such as Zhou et al. (2008), etc.

The International Journal of Organizational Innovation Vol 10 Num 4 April 2018
123
Trappey et al. (2010) utilized the two-stage cluster analysis to discuss the auto-motive industry’s logistics services, they identified service needs, preferences, and outsourcing entrusted from 98th automatic industry units and found four distinctive groups: favored logistics, automotive aftermarket supplier outsourcing, original equipment manufacturer (OEM) parts suppliers, and tier suppliers. The highest pro-portions are in distribution and transportation outsourcing services. Wallenburg et al. (2010) studied the relation between logistics outsourcing performance and loyalty be-havior cross inter-culturally. Juga et al. (2010) investigated service quality and its correlation to satisfaction and loyalty in logistics outsourcing relationships. They looked at how perceived ser-vice quality influences both a shipper’s satisfaction and loyalty in third‐party logistics outsourcing relationships, using an empirically structured equation to identify critical service dimensions and their impacts on satisfaction and loyalty from a survey of 235 industrial companies in Finland. They found that the satisfaction‐loyalty model in a logistics outsourcing context confirms that service perceptions do influence loyalty through a shipper’s overall satisfaction with the service provider. Liao et al. (2010) proposed a model of supply management, supply flexibility and supply chain per-formance. They examined the relation between supply management and supply flexi-bility and extended the concept of supplier flexibility and supply network flexibility on relevant supply chain performance measures. They find that the results indicate strong positive relations between supply management practices and supply flexibility, as well as between supply flexibility and supply chain performance. Hazen et al. (2012) discussed the issue of reverse logistics disposition decision-making. By developing a decision framework via content analysis, they identified the critical components of the reverse logistics (RL) disposition decision-making process and suggested a decision framework that may guide future investigations and practice. They further utilized a problem‐driven content analysis methodology to analyze the RL literature from 2000 through 2010, extrapolated seven RL disposition decision components from a compilation of 60 variables identified in the literature, and pre-sented a RL disposition decision‐making framework. Thatte et al. (2013) investigated the impact of a firm’s supply chain management (SCM) practices on its supply chain responsiveness and competitive advantage. They focused on the supply chain respon-siveness construct and firms’ practices in response to customer demands and con-stantly changing market conditions to create a competitive advantage. Using a struc-tured equation to test the relations among SCM practices, they found that a higher level of SCM practices can lead to improved supply chain responsiveness and en-hanced competitive advantage of a firm. Moreover, supply chain responsiveness Liu et al. (2010) studied the issue of sources of competitiveness for logistics service providers (LSP’s). Employing Porter’s competitive advantage theory and the resource-based view (RBV) theories of strategic management, they found that the ca-pability considered most important among the factors of competitiveness and the most critical aspect of an LSP’s capabilities is service quality. Oliveria et al. (2011) pro-posed the relations among Internet utilization in business-to-business relationships, collaborative efforts, and their impacts over supplier and customer-oriented process

The International Journal of Organizational Innovation Vol 10 Num 4 April 2018
124
performances. They used descriptive statistics, reliability evaluations of the research model’s internal scales, path analysis, and structural equation modeling to evaluate supply chain process collaboration through data from a survey of 788 companies from the U.S., China, Canada, the United Kingdom, and Brazil. The results show that Internet utilization in supplier and customer-oriented processes is positively related to collaborative practices in business-to-business relationships, with potential effects on the performances of collaborative practices in supplier and customer-oriented proc-esses. Bilgen and Günther (2010) applied block planning for integrated production and distribution planning in the fast moving consumer goods industry. In this industry, they found that there is an ongoing trend towards increased product varieties and shorter replenishment cycle times and hence suggested that manufacturers must use the proposed block planning approach - in particular, a rigid block planning approach and a flexible one are compared in how they differ in their degree of flexibility in the scheduling of the production lots. Hingley et al. (2011) studied the issue of using fourth‐party logistics management to improve horizontal collaboration among grocery retailers. They selected three suppliers, three logistics service providers (LSPs), and one grocery retailer and used semi‐structured interviews for their exploratory qualita-tive study. They investigated the benefits of and barriers to the use of fourth‐party lo-gistics (4PL) management as a catalyst for horizontal collaboration. They find that LSPs can establish 4PL management, but the significant investment required to do so is a deterrent, and that 4PL negatively influences the grocery retailer‐supplier dy-namic, but simultaneously provides key potential benefits. Talib et al. (2011) pre-sented a set of total quality management (TQM) and supply chain management (SCM) practices through an extensive literature review and identified the relations among them by comparing the identified TQM and SCM practices. They showed six major TQM and SCM practices from 50 TQM practices and 40 SCM practices. They further compared these practices and found that management support and commit-ment, customer focus, and supplier partnership are the most common practices in both the TQM and SCM literature, noting that they have the strongest impacts in the inte-gration of TQM and SCM across organizations. Mothilal et al (2012) uses the litera-ture review to identify the key success factors of performance in the Indian third-party logistics service providers (3PL) sector. Several articles have been devoted to evaluating logistics performances in the last few years through the data envelopment analysis (DEA) method. Janvier-James and Didier (2011) studied a benchmarking framework for supply chain collaboration. Applying data envelopment analysis (DEA), they measured the extent of both col-laboration and trust in a supply chain as important components of organizational be-havior that contribute to the performance improvement of a supply chain. They found that corporate managers in non-performing decision making units have a challenge that needs to be improved, such as underperforming research and development (R&D) units. Che and Chang(2016) provide the integrated method (including analytic net-work process, data envelopment analysis, and multiple objective) to a supplier selec-tion problem of sphygmomanometer manufacturer in Taiwan.

The International Journal of Organizational Innovation Vol 10 Num 4 April 2018
125
Zhou et al. (2008) developed a benchmark of performance standards in an emerging market for Chinese third‐party logistics providers (3PLs). They identified various factors that significantly affect the operational efficiency of the Chinese 3PLs and proposed ways to improve the competitiveness of the 3PLs. They used the DEA method to measure the operational efficiency of ten leading 3PLs in China and found that the declining efficiency due to the SARS outbreak and the slow adaptation of its economy, sales opportunities, and level of technical expertise are directly correlated with operational efficiency. In contrast with the 3PL industry in the U.S., the Chinese 3PLs tend to focus on traditional service offerings such as port management, transpor-tation, and warehousing rather than playing the role as integrator or lead service pro-vider. Performance assessment denotes a continuous improvement in tools and tech-niques, with performance evaluations helping companies remain competitive by find-ing inefficiencies in existing processes in order to make for better job preparation and planning to meet customer needs and efficiency and to cut costs. Through this review of past literature, we find that most studies focus around some method of logistics performance evaluation like the traditional DEA method. Only a few attempts have so far been made at combining the period dynamic with the division network. This study follows up on Tone and Tsutsui (2014), to establish an efficiency measurement model of dynamic network DEA (DN-DEA) and Malmquist productivity index (MPI). We assume that the FMCG industry’s business performances come from three divisions: Professional Products Division (PPD), Consumer Products Division (CPD), and Ac-tive Cosmetics Division (ACD). We then evaluate the performance of overall effi-ciency and division efficiency for the case study company. Lastly, we offer recom-mendations as a reference in future decision-making. The remainder of this paper is organized as follows. Section 2 shows the DN-DEA method and MPI model. Section 3 presents the results of empirical evaluation. Section 4 reveals a discussion of the results. Section 5 offers conclusions.
Methods
Framework of DN-DEA for Logistics in the FMCG Industry
For the traditional DEA method, Charnes et al. (1978) assumed constant returns to scale (CRS) and Banker et al. (1984) assumed variable returns to scale (VRS) to measure a single efficiency indicator, which has long been used to evaluate overall efficiency. The network DEA model of Färe et al. (2007) improves upon conventional DEA’s failure to analyze the performance of a division that is divided into individual sub-processes. The network DEA model explores the sources of inefficiency within individual sub-processes. Prieto and Zofio (2007), Mostafa (2009), Yu (2010), etc. utilized a multiple-stage model and developed it into a multi-stage and multi-division network framework.

The International Journal of Organizational Innovation Vol 10 Num 4 April 2018
126
Tone and Tsutsui (2009) proposed the weighted slack-based measures network DEA and in 2013 proposed the dynamic and network DEA and MPI. Tone and Tsutsui (2014) used the DN-DEA model to resolve the division linkages of a decision making unit (DMU) that carry over from periods t to t+1. From the previous literature review, we find that issues of logistics are focused on using a structural equation model to explore the performances of logistics out-sourcing processes and management. When employing the DEA method to evaluate logistics performances, it targets the comparisons of operating performances among different countries or companies at a single point in time, but fails to investigate the impact of the overall environment with time on logistics performances. This paper adds a time factor and divisions to use the DN-DEA method to evaluate logistics per-formances. We want to look at the relations among the effects of seasonal factors as well as the effects of transportation costs, delivery costs, picking and handling costs, return costs, etc. To assess the performance of the fast moving consumer goods (FMCG) industry, our case study is L Company and its three divisions as shown in Figure 1: Professional Products Division (PPD), Consumer Products Division (CPD), and Active Cosmetics Division (ACD). The input items are freight & pick-up costs (FPC), acceptance costs (AC), and return handling costs (RHC); the output item is sales revenue (SR); and storage costs (SC) are the link across divisions: PPD linked to CPD, or PPD linked to ACD, or CPD linked to ACD. The inventory is carried over across periods t to t+1.
DN-DEA Model
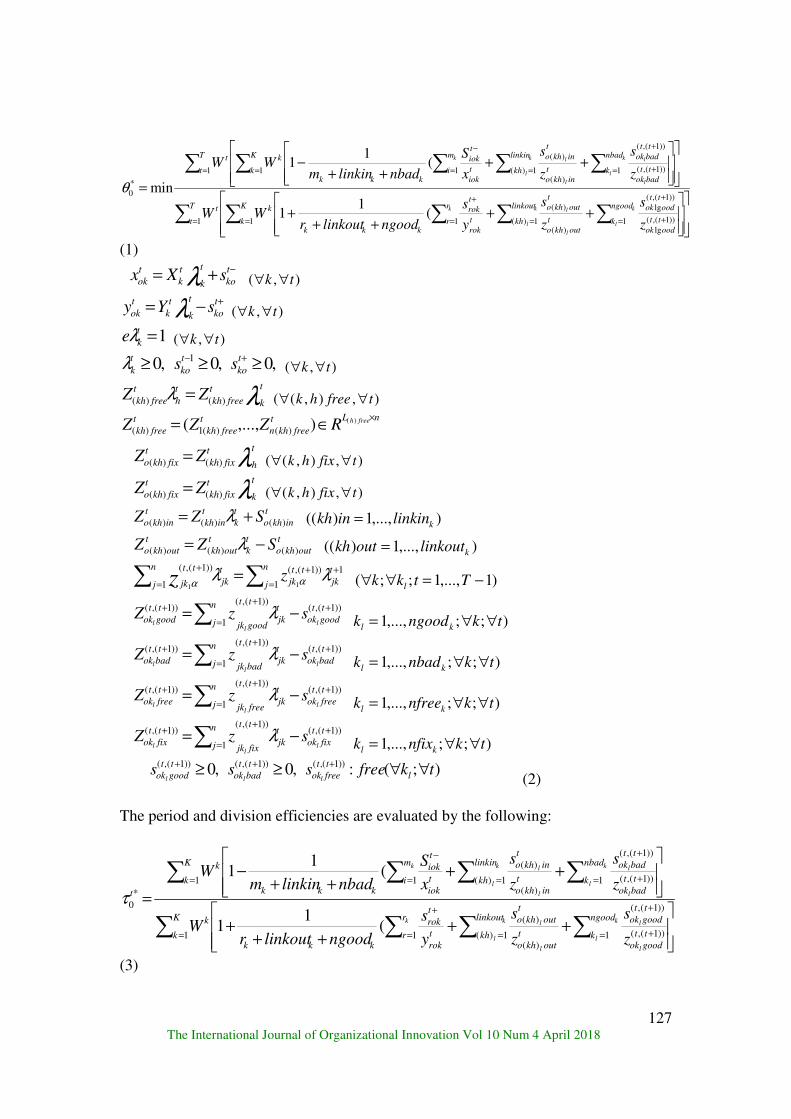
The dynamic network DEA (DN-DEA) deals with multiple divisions connected by network structure links within each period. Tone and Tsutsui (2014) proposed a dynamic network slacks-based measure (DNSBM), which combined network SBM (NSBM) (Tone and Tsutsui, 2009) with dynamic SBM (DSBM) (Tone and Tsutsui, 2010). The network structure is by means of carry-over activities between two suc-ceeding periods. This model calculates the overall efficiency over the observed entire period, the dynamic change of a time period’s efficiency, and the dynamic change of divisional efficiency. This model has n DMUs (j = 1,…, n) consisting of K divisions (k = 1,…, K) over T time periods (t = 1,…,T ). Let mk and rk be the numbers of inputs and outputs of Division k, respectively. We denote the link leading from Division k to Division h by (k,h) and the set of links by L. Overall efficiency (OE) is evaluated by the follow-ing:
The International Journal of Organizational Innovation Vol 10 Num 4 April 2018
127
= = = = = +
++
= = = = +
+
=
−
++
+++
++
++−
=
T
t
K
k
r
r
linkout
kh
ngood
k tt
oodok
tt
oodok
t
outkho
t
outkho
t
rok
t
rok
kkk
kt
T
t
K
k
linkin
kh
nbad
k tt
badok
tt
badok
t
inkho
t
inkhom
i t
iok
t
iok
kkk
kt
k k
l
k
l
l
l
k
l
k
l
l
l
l
lk
z
s
z
s
y
s
ngoodlinkoutrWW
z
s
z
s
x
S
nbadlinkinmWW
1 1 1 1)( 1 ))1,((
lg
))1,((
lg
)(
)(
1 1 1)( 1 ))1,((
))1,((
)(
)(
1
*
0
(1
1
(1
1
minθ
(1)
−
+=t
ko
t
k
t
k
t
ok sXx λ ),( tk ∀∀ +
−=t
ko
t
k
t
k
t
ok sYy λ ),( tk ∀∀
1=t
keλ ),( tk ∀∀
,0≥t
kλ
,01≥
−t
kos
,0≥+t
kos ),( tk ∀∀
λλt
k
t
freekh
t
h
t
freekh ZZ )()( = ),),(( tfreehk ∀∀
nLt
freekhn
t
freekh
t
freekhfreehRZZZ
×∈=
)(),...,( )()(1)(
λt
h
t
fixkh
t
fixkho ZZ )()( = ),),(( tfixhk ∀∀
λt
k
t
fixkh
t
fixkho ZZ )()( = ),),(( tfixhk ∀∀
t
inkho
t
k
t
inkh
t
inkho SZZ )()()( += λ
),...,1)(( klinkininkh =
t
outkho
t
k
t
outkh
t
outkho SZZ )()()( −= λ
),...,1)(( klinkoutoutkh =
1
1
))1(,(
1
))1(,(
11
+
=
+
=
+
=t
jk
n
j
tt
jk
t
jk
n
j
tt
jkzz λλ
αα )1,...,1;;( −=∀∀ Ttkk l
))1(,())1(,(
1
))1(,( ++
=
+−= tt
goodok
t
jk
tt
goodjk
n
j
tt
goodok ll
lszZ λ
);;,...,1 tkngoodk kl ∀∀=
))1(,())1(,(
1
))1(,( ++
=
+−= tt
badok
t
jk
tt
badjk
n
j
tt
badok ll
lszZ λ
);;,...,1 tknbadk kl ∀∀=
))1(,())1(,(
1
))1(,( ++
=
+−= tt
freeok
t
jk
tt
freejk
n
j
tt
freeok ll
lszZ λ
);;,...,1 tknfreek kl ∀∀=
))1(,())1(,(
1
))1(,( ++
=
+−= tt
fixok
t
jk
tt
fixjk
n
j
tt
fixok ll
lszZ λ
);;,...,1 tknfixk kl ∀∀=
,0))1(,(
≥+tt
goodokls
,0))1(,(
≥+tt
badokls
);(:))1(,(
tkfrees l
tt
freeokl∀∀
+
(2) The period and division efficiencies are evaluated by the following:
= = = = +
++
= = = +
+
=
−
++
+++
++
++−
=
K
k
r
r
linkout
kh
ngood
k tt
goodok
tt
goodok
t
outkho
t
outkho
t
rok
t
rok
kkk
k
K
k
linkin
kh
nbad
k tt
badok
tt
badok
t
inkho
t
inkhom
i t
iok
t
iok
kkk
k
t
k k
l
k
l
l
l
l
l
k
l
k
l
l
l
l
lk
z
s
z
s
y
s
ngoodlinkoutrW
z
s
z
s
x
S
nbadlinkinmW
1 1 1)( 1 ))1(,(
))1(,(
)(
)(
1 1)( 1 ))1(,(
))1(,(
)(
)(
1
*
0
(1
1
(1
1
τ
(3)

The International Journal of Organizational Innovation Vol 10 Num 4 April 2018
128
)(
(1
1
(1
1
1 1 1)( 1 ))1,((
))1,((
)(
)(
1 1)( 1 ))1,((
))1,((
)(
)(
1
*
0 k
z
s
z
s
y
s
ngoodlinkoutrW
z
s
z
s
x
S
nbadlinkinmW
T
t
r
r
linkout
kh
ngood
k tt
goodok
tt
goodok
t
outkho
t
outkho
t
rok
t
rok
kkk
t
T
t
linkin
kh
nbad
k tt
badok
tt
badok
t
inkho
t
inkhom
i t
iok
t
iok
kkk
t
k
k k
l
k
l
l
l
l
l
k
l
k
l
l
l
l
lk
∀
++
+++
++
++−
=
= = = = +
++
= = = +
+
=
−
δ
(4)
);(
(1
1
(1
1
1 1)( 1 ))1,((
))1,((
)(
)(
1)( 1 ))1,((
))1,((
)(
)(
1*
0 tk
z
s
z
s
y
s
ngoodlinkoutr
z
s
z
s
x
S
nbadlinkinmp
k k
l
k
l
l
l
l
l
k
l
k
l
l
l
l
lk
r
r
linkout
kh
ngood
k tt
goodok
tt
goodok
t
outkho
t
outkho
t
rok
t
rok
kkk
linkin
kh
nbad
k tt
badok
tt
badok
t
inkho
t
inkhom
i t
iok
t
iok
kkkt
k ∀∀
++++
+
++++
−
=
= = = +
++
= = +
+
=
−
λl
jk
n
j jlkol ZZk =
=1
)1,0()1,0(
)( kl∀ (5)
MPI of the DN-DEA Model
The Malmquist index evaluates the efficiency change of a DMU between time periods t and t+1. It is defined as the product of Catch-up and Frontier-shift terms. The catch-up term relates to the degree of efforts that the DMU attained for improving its efficiency, while the frontier-shift term reflects the change in the efficient frontiers surrounding the DMU between the two time periods t and t+1. The main variable is the division catch-up index (DCU), evaluated by the fol-lowing:
(6)
(7) The values of DCU are >1, = 1, and <1, and they indicate progression, status quo, and reversion in the catch-up effect, respectively. We define the divisional fron-tier-shift effect (DFS) from t to t+1 in the following equation (8) of the non-radial
Malmquist model, which denotes DFS by . If a division has no inputs or no outputs, then its DFS is unity.
(8)

The International Journal of Organizational Innovation Vol 10 Num 4 April 2018
129
Using DCU and DFS above, we defie the divisional Malmquist index (DMI) by their product, evaluated by the following:
(9)
The overall Malmquist index (OMI) can be obtained from the weighted geometric mean of the divisional Malmquist indices, achieved by the following:
(10)
Here, is the weighted geometric mean of , and is
the weight to division k with .
Definitions of Variables under Evaluation
For the assumptions of input items and output items in the three divisions, we refer to Hazen et al. (2012), Bilgen and Günther (2010), and Thatte et al. (2013). The input items are freight & pick-up costs (FPC), acceptance costs (AC), and return han-dling costs (RHC), and the output item is sales revenue (SR). We employ the interme-diate links between PPD and CPD or PPD and ACD or PCD and ACD as storage costs (SC). Tone and Tsutsui (2014) proposed that this indicates desirable carry-over, e.g. profit carried forward and net earned surplus carried to the next term. Thus, in this study inventory is assumed to carry over across periods t to t+1. The variables used to evaluate the division efficiencies of PPD, CPD, and ACD in-clude individual FPC, AC, and RHC as the inputs and SR as the output. The interme-diate link from PPD and CPD or PPD and ACD or CPD and ACD is individual SC. From period t to period t+1, inventory is carried over in the divisions. We pre-sent the definitions of variables as follows.
.Freight & pick-up costs: The individual costs are in accordance with the needs of
the customer-ordered items that are removed from their storage spaces to the packing departments of the company’s three divisions every month. The costs encompass positive products and accessories, measured in NT$ (New Taiwan dollars).
.Acceptance costs: The individual overall costs of removed containers, check boxes
and batch number, valid period of the company’s three divisions every month. The amount contains the overall costs of products removed from the container and all check processes, measured in NT$.
.Return handling costs: The individual total costs of handling returned products by
the company’s three divisions every month. The costs include the storage of returned products, post-classification to see whether sales can sell the products to a corre-

The International Journal of Organizational Innovation Vol 10 Num 4 April 2018
130
sponding warehouse, and scrap sorting information for reporting and follow-up treat-ment costs, measured in NT$.
.Sales revenue: The individual sales revenue of the company’s three divisions every
month, measured in NT$.
.Storage costs: The individual storage costs of the company’s three divisions every
month. They contain the provisions for goods purchase inspection, storage, shipping, returns, and staff expenses, measured in NT$.
.Inventory: The individual inventory expenses of the company’s three divisions
every month, made up of normal products, dulled and damaged goods, and stored at third-party logistics providers, measured in NT$. The empirical data include information of annual reports and financial reports in the FMCG industry for the period 2011-2013, with L Company as our case study. Table 1 provides the detailed descriptive statistics of the empirical data. The mean and standard deviation of FPC are respectively NT$157,000 and NT$126,360; NT$183,592 and NT$12,449 for AC; NT$61,485 and NT$81,522.86 for RHC; NT$2,812,200 and NT$1,457,284 for SC; NT$98,983,000 and NT$6,274,820 for In-ventory; and NT$69,325,000 and NT$44,354,800 for SR.
Results and Discussion Table 2 shows the overall efficiency and division efficiency of PPD, CPD, and ACD for the three divisions from 2011 to 2013. The mean values of overall efficiency (OE), PPD efficiency (PPDE), CPD efficiency (CPDE), and ACD efficiency (ACDE) in order are 0.9417, 0.9431, 0.9463, and 0.9606, while the standard deviation in order are 0.0227, 0.0266, 0.0297, and 0.0063. The best overall division efficiency during 2011-2013 is ACDE, followed in order by CPDE and PPDE. The better performance of OE is in February, April, November, and December, and the worst performance of OE is in June. PPDE shows good performance over 8 months, but the difference is very large between the good and bad performances; its worst performance value is in June at only 0.4406, and so the performance management strategy of this division could be improved. CPDE’s better performances are in February, April, July, Novem-ber, and December, while its worst performance is in March. ACDE’s better perform-ances are in February, April, November, and December, while its worst performance is in June.In order to compare the results of the mean values of PPDE, CPDE, ACDE, and OE, we also evaluate the efficiency scores for each period during 2011-2013, shown in Figure 2. The results indicate that the mean values of period efficiency for the FMCG industry in L Company have different variances. The operating perform-ance of ACDE is the most stable during 2011-2013. The operating performances of CPDE, PPDE, and OE are relatively poor in 2012, implying that the overall business strategy should have been reviewed in 2012.

The International Journal of Organizational Innovation Vol 10 Num 4 April 2018
131
Figure 3 illustrates the operating performances during the period 2011-2013 for every month. We find the operating performance is relatively poor in June of 2011 and 2012, and for OE the operating performance is relatively poor in January 2013. We next compare the operating performances of 2011, 2012, 2013 and OE (overall efficiency), showing that it is the worst in March, June, and October of 2012. The operating performance is good in January of 2011-2012, but significantly decreases in January of 2013. The operating performance of March significantly de-creases in 2011 and 2012, but significantly increases in 2012 and 2013. The worst op-erating performance is June of 2012, and the operating performance is relatively poor in June of 2011 and OE. The operating performance of October significantly de-creases in 2011 and 2012, but significantly increases in 2012 and 2013.
Table 1. Descriptive statistics
Variable Max Min Mean Std. Dev.
Freight & packing cost (NT$) 4,898985 373,310 157,000 126,360 Acceptance cost (NT$) 701,114 37,376 183,592 12,449 Return handling cost (NT$) 335,794 769 61,485 81,522.86 Storage cost (NT$) 4,625,454 2,312,877 2,812,200 457,284 Inventory (NT$) 252,000,000 27,257,535 98,983,000 6,274,820 Sales revenue (NT$) 212,000,000 19,980,596 69,325,000 44,354,800
Table 2. Overall efficiency and division efficiency
Overall efficiency PPD efficiency CPD efficiency ACD efficiency Month
Mean Standard Mean Standard Mean Standard Mean Standard
1 0.8928 0.1634 0.8838 0.2012 0.9429 0.0998 0.9429 0.0999
2 1 0 1 0 1 0 1 0
3 0.9582 0.0381 1 0 0.7782 0.2322 0.9999 0.0002
4 1 0 1 0 1 0 1 0
5 0.9572 0.0436 0.8895 0.1951 0.9684 0.0337 0.9725 0.0278
6 0.6598 0.1638 0.4406 0.1787 0.7925 0.1455 0.8153 0.1135
7 0.9777 0.0375 1 0 1 0 0.9284 0.1240
8 0.9999 0.0002 1 0 0.9997 0.004 0.9999 0.0001
9 0.9815 0.0166 1 0 0.9291 0.1222 0.9377 0.1080
10 0.8706 0.1556 0.6417 0.1898 0.9443 0.0965 0.9302 0.1208
11 1 0 1 0 1 0 1 0
12 1 0 1 0 1 0 1 0
Total 0.9417 0.0227 0.9431 0.0266 0.9463 0.0297 0.9606 0.0063

The International Journal of Organizational Innovation Vol 10 Num 4 April 2018
132
We note that MPI contains the catch-up effect (or called technical efficiency change) and the frontier-shift effect (or called technical change efficiency) terms. It is used to evaluate the efficiency change of a DMU between two time periods t and t+1. The catch-up effect is evaluated by the degree of efforts that the DMU put forth at improving its efficiency. The frontier-shift effect shows the change in the efficient frontiers surrounding the DMU between the two time periods. In this study the means of catch-up, frontier-shift, and MPI are contained in the three divisions of PPD, CPD, and ACD in every time period. When (catch-up), (frontier-shift), and MPI>1, Tone and Tsutsui (2009) and Tone and Tsutsui (2014) stated it indicates progress in relative efficiency during the time period, while (catch-up, frontier-shift, and MPI =1) and (catch-up, frontier-shift and MPI <1) indicate the status quo and reversion in effi-ciency, respectively. Table 3 lists the catch-up terms of PPD, CPD, ACD, and overall for the period 2011-2013. It shows that the mean value of technical efficiency change (TEC) is be-tween 0.8072 and 1.1196. The mean values of PPD, CPD, ACD, and overall in order are 0.9921, 1.0007, 0.9998, and 0.9975, and the standard deviations in order are 0.0682, 0.0611, 0.0598, and 0.0629. There is a slight progress trend for TEC of CPD
in the overall average, its TEC>1, shows the slight reversion trend for TEC of PPD,
Table 3. Result of catch-up effect from 2011 to 2013
Here, the MPI numbers are the geometric mean.
ACD, and overall. The TEC of PPD shows a progressing trend in May, June, and Au-gust, but shows the status quo and reversion in the other months. The TEC of CPD shows a progressing trend in March, May, and June, but shows the status quo and re-version in the other months. The TEC of ACD shows a progressing trend in May,
Technical Efficiency Change Month
PPD CPD ACD Overall
1 0.8072 0.9103 0.9103 0.8745
2 1 1 1 1
3 1 1.1196 1 1.0384
4 1 1 1 1
5 1.0202 1.0133 1.0134 1.0156
6 1.1139 1.0773 1.0790 1.0899
7 1 1 0.8862 0.9605
8 1.0002 1 1.0001 1.0001
9 1 0.888 1.1091 0.9949
10 0.9640 1 1 0.9879
11 1 1 1 1
12 1 1 1 1
Average 0.9921 1.0007 0.9998 0.9975
Std. Dev. 0.0682 0.0611 0.0598 0.0629

The International Journal of Organizational Innovation Vol 10 Num 4 April 2018
133
June, August, and September, but shows the status quo and reversion in the other month. The TEC of overall shows a progressing trend in March, May, June, and Au-gust, but shows the status quo and reversion in the other months. The frontier-shift effect (technical change efficiency, TCE) term shows the change in the efficient fron-tiers surrounding the DMU between the two time periods. We employ TCE in order to totally evaluate the efficiency change of all months. Table 4 lists the TCE of all months in 2011-2013. The mean values of TCE for PPD, CPD and overall in order are 1.2709, 0.8539, 1.0721, and 1.0518, and the standard deviations in order are 0.2530, 0.1518, 0.1535, and 0.1831. This shows the TCE of CPD has a regressing trend, while the TCE of PPD, ACD, and overall has a progressing trend. The TCE of PPD shows a progressing trend in all months of 2011-2013. The TCE of CPD shows a progressing trend in February, March, and April versus a regressing trend in the other months. The TCE of ACD shows a regress trending in May, November, and December, while it has a progressing trend in the other months. The TCE of overall shows a regressing trend in January, May, September, and December versus a progressing trend in the other months. Tables 3 and 4 present the MPI values in every month and PPD, CPD, ACD and overall. Figure 4 illustrates the progress ability of every month and PPD, CPD, ACD and overall in 2011-2013. The MPI value of overall has the largest progress ability in
Table 4. Result of frontier-shift effect from 2011 to 2013 years
Technical Change Efficiency Month
PPD CPD ACD Overall
1 1.1150 0.7328 1.1677 0.9845
2 1.1675 1.0054 1.0113 1.0588
3 1.0287 1.0820 1.2604 1.1195
4 1.0201 1.1317 1.2368 1.1261
5 1.2149 0.7564 0.9950 0.9706
6 1.5574 0.8019 1.1098 1.1149
7 1.8694 0.5894 1.0137 1.0375
8 1.2431 0.7942 1.2672 1.0775
9 1.1670 0.7187 1.1163 0.9783
10 1.2430 0.9164 1.0564 1.0636
11 1.5227 0.8619 0.8292 1.0286
12 1.1025 0.8562 0.8008 0.9109
Average 1.2709 0.8539 1.0721 1.0518
Std. Dev. 0.2530 0.1581 0.1535 0.1831
Here, the MPI numbers are the geometric mean. June, while OE has the worst in the same month of Table 2, indicating that man-agement strategies should have been improved. We define good efficiency when the OE value is greater than or equal to the total average value, whereas the reverse is called bad efficiency. The OE and MPI of overall exhibit that the operating perform-

The International Journal of Organizational Innovation Vol 10 Num 4 April 2018
134
ance is relatively poor in January. The MPI value of PPD has the largest progress abil-ity in July, and PPDE is also good in Table 2, indicating good operating performance in this month. PPDE has the worst value in June, while the MPI value of PPD shows a progressing tend, meaning management strategies likely improved. The reasons for bad logistics performances come from FPC and RHC in June. CPDE has the worst value in March, but the MPI value of CPD shows a progressing tend, indicating man-agement strategies likely improved. The reasons for bad logistics performances come from AC and RHC in March. ACDE has the worst value in June, and the MPI value of ACD shows a regressing tend, meaning business strategies should have been im-proved. June is a relatively slack season in ACD, and the path only has scattered shipments, resulting in relatively poor logistics performance. We employ the Wilcoxon Scores test to see the relations among divisions’ effi-ciency, TEC, TCE, and MPI between PPD and CPD or PPD and ACD or CPD and
ACD. The findings show that p > 0.05 for both division efficiency and TEC, and so the divisions do not have a significant correlation with each other. The p values of TCE and MPI for PPD and CPD in order are 0.0008 and 0.0034, as well as for PPD
and ACD in order are 0.0406 and 0.0476 (p<0.05). The test results show that TCE of CPD is better than PPD, TCE of ACD is better than PPD, MPI of CPD is better than PPD, and MPI of ACD is better than PPD. The PPD, CPD, and ACD divisions exhibit relatively poor efficiency and pro-gressing trends of MPI in January, March, June, and October. This indicates that their distribution of resources must be improved. Moreover, the overall management strat-egy of the FMCG industry for the case study of L Company should adjust the inputs and output with the distribution of resources among divisions and various months, in order to achieve the target of high efficiency.
Conclusions and Policy Implications In this paper we consider the linking activities among our case study firm’s three divisions and the carry-over activities between two consecutive periods, in order to evaluate the performance of the FMCG industry over the period from 2011 to 2013. We calculate overall efficiency from the division efficiencies of the three divisions, as well as TEC, TCE, MPI, overall MPI, etc. The logistics performances present the same trend in the three divisions of PPD, CPD, and ACD, with the best performance in 2011 and the worst performance in 2012. The overall performance is showed as expected in 2012, as a result of it gets to pursuit of performance while allowing a small amount of shipments to meet customer demand. It is used the logistics outsourcing costs of the updated quote and outsourc-ing vendors move the warehouse. It leads to the need to pay two warehouse storage costs and outsourcing vendor employees are not familiar with the company's products, so it is resulting in inefficiency. The TCE is the main reason to cause changes in average total factor productivity to have a progressing trend for CPD in 2011 to 2012 and 2012 to 2013. TCE shows a

The International Journal of Organizational Innovation Vol 10 Num 4 April 2018
135
progress trending due to the progressing trend of average total factor productivity for PPD in 2011 to 2012. TCE also show a regressing trend due to average total factor productivity showing a regressing trend for PPD in 2012 to 2013. TCE presents a re-gressing trend due to a regressing trend in average total factor productivity for ACD in 2011 to 2012. Lastly, TCE shows a progressing trend due to average total factor productivity showing a progressing trend for PPD in 2012 to 2013. Through the DN-DEA and MPI of the Wilcoxon Scores tests, we see that the divisions’ efficiency and TEC do not have any significant differences. In terms of TCE, CPD and ACD both show significant differences with PPD, because CPD and ACD have a change in logistics policy, such as increasing the value of a single order to increase the load factor of shipping boxes, thereby reducing FPC. Through the case study of L Company, we find that the FMCG industry should adjust the inputs and output through the distribution of resources among divisions and months, in order to achieve the target of high efficiency.
Acknowledgment We acknowledge the financial support from the “Young Academic Innovation Team of Northwest University of Political Science and Law”; Social Science Fund of Shaanxi Province: Efficiency Evaluation and Improvement of Urban Wastewater Treatment in Shaanxi Province(2015D064); Legal System Improvement of Urban Wastewater Treatment Industry of the PPP Model in China(17BFX042); Cost Struc-ture, Optimum Scale and Service Efficiency of Urban Wastewater Treatment Industry in China (17YJA790062)
References
Banker, R. D., A. Charnes and W. W. Cooper (1984), “Some Models for Estimating Technical and Scale Inefficiencies in Data Envelopment Analysis,” Management
Science, Vol. 30, No. 9, pp. 1078-1092. Bilgen, B. and H.-O. Günther (2010), “Integrated Production and Distribution Plan-
ning in the Fast Moving Consumer Goods Industry: A Block Planning Applica-tion”, OR Spectrum, Vol. 32, No. 4, pp. 927-955.
Charnes, A., W. W. Cooper and E. Rhodes (1978), “Measuring the Efficiency of De-
cision Making Units,” European Journal of Operational Research, Vol. 2, No. 6, pp. 429-444.
Che, Z.H. and Y.F. Chang(2016),” Integrated methodology for supplier selection: the
case of a sphygmomanometer manufacturer in Taiwan,” Journal of Business Economics and Management, Vol 17,issue 1, pp17-34
Färe, R., S. Grosskopf and G. Whittaker (2007), “Network Data Envelopment Analy-
sis,” Modeling Data Irregularities and Structural Complexities in Data Envelop-ment Analysis, Springer Science Business Media, LLC, pp. 209-240.

The International Journal of Organizational Innovation Vol 10 Num 4 April 2018
136
Hazen, B. T., D. J. Hall and J. B. Hanna (2012), “Reverse Logistics Disposition Deci-
sion-making Developing A Decision Framework via Content Analysis,” Interna-tional Journal of Physical Distribution & Logistics Management, Vol. 42, No. 3, pp. 244-274.
Hingley, M., A. Lindgreen, D. B. Grant and C. Kane (2011), “Using Fourth-Party Lo-
gistics Management to Improve Horizontal Collaboration among Grocery Retail-ers,” Supply Chain Management: An International Journal,” Vol. 16, No. 5, pp. 316-327.
Janvier-James, A. M. and E. Didier (2011), “A Benchmarking Framework for Supply
Chain Collaboration: A Data Envelopment Analysis (DEA) Application,” Inter-national Journal of Business Administration, Vol. 2, No. 3, pp. 19-31.
Juga, J., J. Juntunen and D. B. Grant (2010), “Service Quality and Its Relation to Sat-
isfaction and Loyalty in Logistics Outsourcing Relationships,” Managing Service Quality, Vol. 20, No. 6, pp. 496-510.
Liao, Y., P. Hong and S. S. Rao (2010), “Supply Management, Supply Flexibility and
Performance Outcomes: An Empirical Investigation of Manufacturing Firms,” Journal of Supply Chain Management, Vol. 46, No. 3, pp. 6-22.
Liu, X., A. C. McKinnon, D. B. Grant and Y. Feng (2010), “Sources of Competitive-
ness for Logistics Service Providers: A UK Industry Perspective,” Logistics Re-search, Vol. 2, No. 1, pp. 23-32.
Mostafa, M. M. (2009) “Modeling the efficiency of top Arab banks: A DEA-neural
network approach,” Expert Systems with Applications, 36, 309-320. Mothilal, S., Angappa Gunasekaran, S.P. Nachiappan and Jayanth
Jayaramhttp://www.tandfonline.com/author/Jayaram%2C+Jayanth (2012) “Key success factors and their performance implications in the Indian third-party logis-tics (3PL) industry,” International Journal of Production Research, Vol.50, Issue 9, 2407-2422.
Oliveira, M. P. V. de, K. Mccormack, M. B. Ladeira, P. Trkan and J. V. D. Bergh
(2011), “Supply Chain Process Collaboration and Internet Utilization: An Inter-national Perspective of Business to Business Relationships,” Economic and Business Review, Vol. 13, No. 4, pp. 203-226.
Prieto, A. M. and J. L. Zofio (2007) “Network DEA efficiency in input–output mod-
els: With an application to OECD countries,” European Journal of Operational Research, 178, 292-304.

The International Journal of Organizational Innovation Vol 10 Num 4 April 2018
137
Soni, G. and R. Kodali (2011), “A Critical Analysis of Supply Chain Management Content in Empirical Research,” Business Process Management Journal, Vol. 17, No. 2, pp. 238-266.
Talib, F., Z. Rahman and M. N. Qureshi (2011), “A Study of Total Quality Manage-
ment and Supply Chain Management Practices,” International Journal of Produc-tivity and Performance Management, Vol. 60, No. 3, pp. 268-288.
Thatte, A. A., S. S. Rao and T. S. Ragu-Nathan (2013), “Impact of SCM Practices of
A Firm on Supply Chain Responsiveness and Competitive Advantage of A Firm,” Journal of Applied Business Research, Vol. 29, No. 2, pp. 499-530.
Tone K. (1999), “A Slacks-Based Measure of Efficiency in Data Envelopment Analy-
sis,” European Journal of Operational Research, Vol. 130, No. 3, pp. 498-509. Tone K. and M. Tsutsui (2009), “Network DEA: A Slacks Based Measurement Ap-
proach,” European Journal of Operational Research, Vol. 197, pp. 243-252. Tone K. and M. Tsutsui (2010), “Dynamic DEA: A slacks-based measure approach,”
OMEGA: The International Journal of Management Science, Vol. 38, pp. 145-156.
Tone K. and M. Tsutsui (2014), “Dynamic DEA with Network Structure: A Slacks-
Based Measure Approach,” Omega, Vol. 42, No. 1, pp. 124-131. Trappey, C. V., A. J. C. Trappey, A. C. Chang and A. Y. L. Huang (2010), “Cluster-
ing Analysis Prioritization of Automobile Logistics Services,” Industrial Man-agement & Data Systems, Vol. 110, No. 5, pp. 731-743.
Wallenburg, C. M., D. L. Cahill, T. J. Goldsby and A. M. Knemeyer (2010), “Logis-
tics Outsourcing Performance and Loyalty Behavior Comparisons between Ger-many and the United States,” International Journal of Physical Distribution & Logistics Management, Vol. 40, No. 7, pp. 579-602.
Yu, M. M. (2010), “Assessment of airport performance using the SBM-NDEA
model,” OMEGA, 38, pp. 440-452. Zhou, G., H. Min, C. Xu and Z. Cao (2008), “Evaluating the Comparative Efficiency
of Chinese Third-Party Logistics Providers Using Data Envelopment Analysis,” International Journal of Physical Distribution & Logistics Management, Vol. 38, No. 4, pp. 262-279.

The International Journal of Organizational Innovation Vol 10 Num 4 April 2018
138
Figure 1. The structure diagram of this case study’s DN-DEA
Figure 2. The division and overall efficiencies for the period 2011-2013
Period t Period t+1
PPD Input: FPC, AC, RHC
output: SR
Carry-over: Inventory
PPD Input:FPC, AC, RHC
output: SR
CPD Input:FPC, AC, RHC
output: SR
CPD Input:FPC, AC, RHC
output: SR
ACD Input:FPC, AC, RHC
output: SR
ACD Input:FPC, AC, RHC
output: SR
Link: SC
Link: SC
Link: SC
Link: SC

The International Journal of Organizational Innovation Vol 10 Num 4 April 2018
139
Figure 3. Overall efficiency of every month for the years 2011-2013
Figure 4. The divisions’ MPI and overall MPI of every month

The International Journal of Organizational Innovation Vol 10 Num 4 April 2018
140
THE IMPACT OF PERCEIVED SUPERVISOR SUPPORT AND WORKPLACE FRIENDSHIP ON ORGANIZATIONAL CITIZENSHIP
BEHAVIOR IN SPORT CENTER
Chia-Ming Chang Dept. of Physical Education, Health & Recreation,
National Chiayi University, Chiayi 621, Taiwan [email protected]
Chao-Sen Wu
Dept. of Tourism and Hospitality, TransWorld University, Yunlin 640, Taiwan
Wui-Chiu Mui *
Dept. Anesthesiology, Ditmanson Medical Foundation Chia-Yi Christian Hospital, Chiayi 600, Taiwan *corresponding author: [email protected]
Yi-Hsuan Lin
Dept. of Physical Education, Health & Recreation, National Chiayi University, Chiayi 621, Taiwan
Abstract
The purpose of this study is to verify the relationship between the perceived supervi-sor support and workplace friendship on organizational citizenship behavior. Employ-ees at 14 different sport centers in Taiwan are selected to be research respondents. A total of 500 questionnaires are distributed and 405 questionnaires are collected, with valid response rate of 88.2%. The results show that the perceived supervisor support and the workplace friendship have a positive impact on organizational citizenship be-havior. The perceived supervisor support has a positive impact on the workplace friendship. The Workplace friendship has partially mediated effect. The study results can be used as a theoretical foundation for sport center management. Keywords: Civil Sports Center, Concern of Supervisors, Friendship, Citizenship Behavior

The International Journal of Organizational Innovation Vol 10 Num 4 April 2018
141
Introduction In recent years Taiwan government has taken huge steps to encourage sports. In recognition of the importance of sports, the government has built sport centers in metropolitan areas to motivate and encourage local citizens to partici-pate in sports of their choice. Sport cen-ters primarily comprise of indoor facili-ties, and serve as a focal point for com-munity. Indoor facilities typically in-clude swimming pool, indoor sport court (for badminton, table tennis, and basket-ball), fitness classes, aerobic classes, indoor climbing facilities and combative sport programs (ex. taekwondo and ka-rate). Local sports competitions are sometimes held in sports centers (Chou, Kang, & Kao, 2012). Since most sport centers are publicly owned and privately managed, citizens have easy access to the facility due to lower entry fee (Kuo, Hsieh, & Lee, 2016). In fact, more and more enterprises start to believe that improved employ-ees’ organizational citizenship behaviors result in capabilities and competence for sustainable businesses (Lamm, Tosti-Kharas, & King, 2015). According to Norris-Watts and Levy (2004), employ-ees’ organizational citizenship behaviors are not learned through individual work achievement, but through teamwork and altruistic behaviors. Bratu (2015) further stated that demonstrable organizational citizenship behaviors tend to increase work efficiency, reduce production cost, and generate more profits. Organizational research discovered that employees’ high perceived supervi-sor support contributes positive work attitude toward the management and or-ganization (Chi, 2014). Moreover, man-agement concerns about employee wel-
fare increase employees’ sense of re-sponsibility at work and employees are thus more likely to give back to the or-ganization (Othman & Nasurdin, 2013). As a result, the perceived supervisor support is a prerequisite that determines employees’ work satisfaction (Gok, Karatuna, & Karaca, 2015) and en-hances their organizational citizenship behaviors (Chen, Wang, Chang, & Hu, 2008). Workplace friendship is another source of support. Kram and Isabella (1985) found that workplace friendship sticks employees together, creates an inspiring work environment, establishes a cohesive team, and retains employees. Such friendship has a significant posi-tive impact on not only individual’s work performance but also employees’ organizational citizenship behaviors (Chen, 2011; Methot, Lepine, Podsa-koff, Christian, 2016). Based on literature, the present re-search intends to understand impacts of employees’ perceived supervisor support and workplace friendship on organiza-tional citizenship behaviors in sport cen-ters. The research hopes that there are some positive effects that lead to organ-izational citizenship behaviors. The re-search hypotheses are proposed as fol-lows.
Literature Review and Conceptual Framework Development
The Relationship between Perceived
Supervisor Support and Organizational
Citizenship Behavior
Employees perceive management’s care, concerns, and assistance as a sup-port system. The higher employees per-ceive management support, the more

The International Journal of Organizational Innovation Vol 10 Num 4 April 2018
142
likely they are to stay at work (Chi, 2014). Actually management support has been reported to have positive im-pacts on employees in many different aspects. Organ (1988) defined organiza-tional citizenship behavior as a person's voluntary commitment within an organi-zation or company that is not part of his in-role behavior. From the perspective of social exchange theory, human inter-actions and exchanges are a kind of ra-tional choices. Employees who receive management’s support, encouragement, resources, and rewards are more likely to be motivated to give positive feed-back back to management and organiza-tion. Simply put, they commit them-selves to work harder to achieve better performance (Coffey, Samuel, Collins, & Morris, 2014; Clark, Zickar, & Jex, 2014). Empirical literature evidence suggested that perceived supervisor sup-port has positive effects on employees’ organizational citizenship behaviors. Even with no management’s rewards, high level of perception of supervisor support still drives employees to com-plete their tasks (Cheung, 2013). There-fore, the hypothesis 1 of the research was proposed as follows: H1: Employees’ perceived supervisor
support has a positive impact on the organizational citizenship be-havior.
The Relationship between Workplace
Friendship and Organizational
Citizenship Behavior
Berman, West, and Richter (2002) indicated workplace friendship is a hu-man relationship naturally developed within an organization or company. It creates a culture of commitment and trust, and with core values conducive to experience sharing (Yen, Lin, Huang, &
Teng, 2011). This friendship is strength-ened through positive emotional support, information/equipment sharing, healthy competition, and resource assistance. More importantly, a positive workplace friendship builds a cohesive team and improves the service quality (Sias, Smith, & Avdeyeva, 2003). In addition, Williams and Ander-son (1991) considered organizational citizenship behavior to be an act of altru-ism and a voluntary commitment to or-ganization outside the individual’s re-sponsibility. Similarly, a mutually bene-ficial relationship enhances peer interac-tion, which in turn builds team cohe-siveness and maintains peer trust. In other word, close peer friendship usually leads to smooth business operations. Literature evidence showed that peer friendship has a positive effect on em-ployees’ organizational citizenship be-haviors. Thus, the research hypothesis 2 was formulated as follows: H2: Employees’ workplace friendship
has a positive impact on the organ-izational citizenship behavior.
The Relationship between Perceived
Supervisor Support and Workplace
Friendship
Perceived supervisor support refers to feelings of concerns, care, encour-agement, acknowledgement, and moti-vation that an employee can possibly feel about his management (Chi, 2014). The level of employees’ perception of supervisor support directly influences the supervisor-employee relationship (Chen, 2011). In social exchange theory, one party with an abundance of re-sources encourages the other to use some resources in order to complete tasks and attain team objectives, and the

The International Journal of Organizational Innovation Vol 10 Num 4 April 2018
143
idea of trading resources usually result in employees’ voluntary feedback (Wang, 2009). In consistent with early study, Chin (2014) stated that supervi-sors who emotionally and financially support employees are more likely to establish trusting rapports with their em-ployees and maintain a good relation-ship. As a result, employees demonstrate positive attitude at work and strive for improved work performance. Empirical evidence also discovered that employ-ees’ positive perception of supervisor support has positive significant effects on workplace friendship, and reduces workplace stress (Gok, Karatuna, & Ka-raca, 2015). Therefore, the hypothesis 3 was proposed as follows: H3: Employees’ perceived supervisor
support has a positive impact on the workplace friendship.
Method
Data Collection
Research subjects were employees who at least have one year of work ex-perience at sport centers in New Taipei city. They were staff, supervisors, direc-tors and managers. Five out of 14 sport centers currently running were selected. A hundred surveys were distributed to each sport center. A total of 500 surveys were distributed and a total of 405 sur-veys (81%) were received for data analysis.
Measurements
Basic variables were sex, age, edu-cation, marital status, job position, and years of work experience. The perceived supervisor support scale was a modified version of Coffey,
Samuel, Collins and Morris (2014). It consisted of 8 items (4 items for instru-mental support and 4 items for emo-tional support) on a 5-point Likert scale, ranging from 1 being strongly disagree, 2 being disagree, 3 being neutral, 4 be-ing agree, to 5 being strongly agree. The workplace friendship scale was adapted from Wang (2016). The scale was comprised of 5 instrumental support and 5 emotional support. Ten items were measured using a 5-point Likert scale, ranging from 1 being strongly disagree, 2 being disagree, 3 being neutral, 4 being agree, to 5 being strongly agree. The organizational citizenship be-havior scale was modified from Chen, Yu, and Wang (2007). The scale had three constructs and 13 items: 5 in-role behaviors, 5 organizational citizenship behaviors directed toward individual (OCB-I), and 3 organizational citizen-ship behaviors directed toward organiza-tion (OCB-O). Thirteen items were measured on a 5-point Likert scale, ranging from 1 being strongly disagree, 2 being disagree, 3 being neutral, 4 be-ing agree, to 5 being strongly agree.
Measurement Model
This study adopted a partial least squares model and the Warp PLS ver-sion 5.0 statistical software developed by Kock (2017) to verify all scales’ va-lidity and reliability. According to the suggestion by Hulland (1999), an analy-sis of the validity and reliability of all relevant scales in a model shall examine reliability, convergent validity, and dis-criminant validity.
Reliability

The International Journal of Organizational Innovation Vol 10 Num 4 April 2018
144
According to Fornell and Larcker (1981), the composite reliability and the Cronbach’s α were acceptable if they were equal to or greater than .70. In this present study, the composite reliability and the Cronbach’s α all exceeded .70, showing the reliability of each scale was acceptable. Table 1. Reliability analysis
Latent variables Composite reliability
Cronbach's α alpha
perceived supervi-
sor support
.927 .909
Instrumental support .891 .830 Emotional support .908 .865
workplace friend-
ship
.915 .896
Instrumental support .910 .876 Emotional support .907 .870
organizational citi-
zenship behavior .878 .852
In-role behaviors .922 .894 OCB-I .903 .865 OCB-O .882 .798
Convergent Validity
In perceived supervisor support scale, actor loading of variables of in-strumental support dimension is .55~.90, and actor loading of variables of emo-tional support dimension is .82~.86. In workplace friendship scale, ac-tor loading of variables of instrumental support dimension is .79~.85, and actor loading of variables of emotional dimen-sion is .62~.88. In organizational citizenship be-havior scale, factor loading of variables of in-role behaviors dimension is .82~ .86. factor loading of variables of OCB-I dimension is .77~.84 and factor loading of variables of OCB-O dimension is .76~.90. All factor loading of variables are higher than .50. and match the standard
proposed by Hair, Black, Babin, and Anderson (2009). Thus, it has good con-vergent validity.
Discriminant Validity
The test is based on square root of Average Variances Extracted (AVE) of individual latent variables proposed by Chin (1998). It should be higher than covariance relationship between the said latent variable and latent variables of other dimensions in the model. In addi-tion, Venkatesh, Thong, and Xu (2012) argued that standard of AVE square root must be at least higher than or equal to .50. According to Table 2, AVE square root of all latent variables in research model is .63 ~.79 and they are all higher than .50. Besides, AVE of all latent variables are higher than all correlation coefficients in the same column and row. It matches the standard. Therefore, measurement model of this study has good discriminant validity.
Table 2. latent variable correlations
PSP WF OCB PSP .79 .43 .42
WF .43 .72 .48
OCB .42 .48 .63
Note:PSP=perceived supervisor support, WF=
workplace friendship, OCB= organizational citi-zenship behavior, Diagonals represent the aver-age variance extracted (the square root of the average variance extracted in the parentheses) while the other entries represent the correlations.
Results
Demographic Analysis Results
A total of 405 surveys were se-lected for research analysis. The subject pool consisted of 164 (40.5%) male and 241 (59.5%) female respondents. Of all subjects, 46 (11.4%) were married and

The International Journal of Organizational Innovation Vol 10 Num 4 April 2018
145
359 (88.6%) were not. Subjects included 32 (7.9%) with high school education, 358 (88.4%) college degree, and 15 (3.7%) graduate school degree and above. The majority of subjects had one-year and less work experience (n=235, 58.8%), followed by 2-5 years (n=141, 34.8%), and 6 years and more (n=26, 6.4%). 257 respondents aged 18-25 made up 63.5% of the subjects, whereas 136 subjects aged 26-40 made up 33.6%, followed by those aged 41-58 making up 3.0%.
Models hypotheses test
Analytical results of all hypotheses in this study are shown below: H1: Employees’ perceived supervisor
support positively influences or-ganizational citizenship behaviors. Analytical result is significant (β1=.32, p<.01). Thus, when em-ployees’ perceived supervisor sup-port is higher, their organizational citizenship behaviors are higher.
H2: Employees’ workplace friendship
positively influences organiza-tional citizenship behaviors. Ana-lytical result is significant (β2=.35, p<.01). Thus, when employees’ workplace friendship is higher, their organizational citizenship be-haviors are higher.
H3: Employees’ perceived supervisor
support positively influences workplace friendship. Analytical result is significant (β3=.46, p<.01). Thus, when employees’ perceived supervisor support is higher, their workplace friendship is higher.
H4: Workplace friendship has indirect
effects on the relationship between
employees’ perceived supervisor support and organizational citizen-ship behaviors, and the relation-ship is found to be significant
(β7=.16,p<.01). Results suggest
that workplace friendship has me-diated effects.
As shown in Figure 2, coefficient for the relationship between perceived supervisor support and organizational citizenship behaviors decreases from .49 (p<.01) to .16 (p<.01) which represents mediated effects as presented in Figure 1. According to Baron and Kenny (1986), partial mediation is the case in which the dependent variable to inde-pendent variable is reduced, but still sig-nificant. In this study, workplace has partial mediation effects.
perceived
supervisor
support
workplace
friendship
R2=.21
organizational
citizenship
behaviors
R2=.33
.32*
Figure 1. standardized parameter estimation of overall model
Note:*p<.05
perceived
supervisor
support
organizational
citizenship behaviors
R2=.24.49*
Figure 2. SEM results of the relationship
between PSP and OCB *p<.05
Explanatory power
R2 denotes predictive power of research model. It is percentage of ex-plained variance of exogenous variables

The International Journal of Organizational Innovation Vol 10 Num 4 April 2018
146
on endogenous variables. It refers to predictive power of research model (Huang, Lin, Chang, & Chen, 2017). When the value is higher, predictive power is higher. Research finding in Figure 1 shows that perceived supervisor support can explain 21% variance of workplace friendship. Figure 2 shows that perceived supervisor support and workplace friendship can explain 33% variance of organizational citizenship behavior.
Discussion and Suggestion
Research findings reported high level of employees’ perception of supervisor support leads to high level of organiza-tional citizenship behaviors, indicating that employees with high perceived su-pervisor support are more likely to dis-play organizational citizenship behav-iors. The findings were consistent with literature (Cheung, 2013; Chi, 2014). Results further suggested that employees with high perceived supervisor support play a key role in business development. In addition, supervisors can look to ex-ternal source of support and social sup-port to not only minimize stress at workplace but also encourage citizen-ship behaviors. Supervisors are also re-sponsible for building team trust and avoiding internal conflicts. Chen, Yu, and Wang (2007) also stated that em-ployees are motivated to demonstrate organizational citizenship behaviors if their contributions are recognized and rewarded accordingly. Recognition can vary, from verbal encouragement to emotional support and financial incen-tives. Employee perspectives and opin-ions can be helpful in management’s decision-making process, and they are more likely to engage in organizational citizenship behaviors on a regular basis if they are heard.
In terms of the relationship be-tween workplace friendship and organ-izational citizenship behavior, findings indicated that employees with high level of workplace friendship display more organizational citizenship behaviors. The results were consistent with Chen (2011) and Hsieh and Lin (2015) that employees with positive workplace friendship tend to encourage and moti-vate each other, share work responsibili-ties, and help improve organiza-tional management and development necessary for their organization to func-tion better. Hsieh and Lin (2015) elabo-rated that there is not denying that friendship at workplace lead to more knowledge sharing, open communica-tion, and mutual learning. A gentle re-minder of a kind and caring friend at work of how to show proper organiza-tional citizenship behaviors is very help-ful as well. Organizing training sessions, group trips, and social gatherings are some of good ways to boost office mo-rale as well as to improve workplace friendship. Furthermore, research results dis-covered that employees with high per-ceived supervisor support are more likely to demonstrate behaviors that show workplace friendship. In other word, workplace friendship develops when employees feel valued and appre-ciated by their supervisors. Chi (2014) and Gok, Karatuna, and Karaca (2015) had similar research findings that emo-tional support and financial assistance from management enhances mutual trust in the employer-employee relationship. Lin, Jiang, and Hsieh (2014) stated that management and employees bond with each other doing outdoor activities to-gether. Findings also suggested that out-door gatherings provide a great opportu-nity for management and employees

The International Journal of Organizational Innovation Vol 10 Num 4 April 2018
147
alike to share their life experience and create some personal connections, and possibly prevent workplace conflicts. Future studies can consider includ-ing many different variables, such as supervisor support, workplace friend-ship, job stress, job burnout, and the in-tention to quit, and explore how they correlate with each other. Further study is also advised to verify the effects of positive psychology variables, such as perceived supervisor support and work-place friendship, on negative psychology of sport center employees.
References
Baron, R. M., & Kenny, D. A. (1986).
The moderator–mediator variable distinction in social psychological research: Conceptual, strategic, and statistical considerations. Journal of Personality and Social
Psychology, 51(6), 1173-1182. Berman, E. M., West, J. P., & Richter, M.
N. (2002). Workplace relations: Friendship patterns and conse-quences (according to managers). Public Administration Review, 62, 217-230.
Bratu, S. (2015). Are organizational citi-
zenship behaviors (ocbs) really positively associated with meas-ures of organizational effective-ness? Analysis and Metaphysics, 14, 87-93.
Chen, C. H., Wang, S. J., Chang, W. C.,
& Hu, C. S. (2008). The effect of leader-member exchange, trust, supervisor support on organiza-tional citizenship behavior in
nurses. The Journal of Nursing Re-
search, 16(4), 321-328. Chen, C. Y. (2011). The role of commu-
nal and exchange on the relation-ship between workplace friendship and organizational citizenship be-havior. Journal of Humanities and
Social Sciences, 7(2), 17-24. Chen, Y. J., Yu, M. C., &Wang, C. S.
(2007). The influence of abusive supervision on foreign labors' or-ganizational citizenship behaviors: The social exchange theory per-spective on leader-member ex-change relationship's mediating ef-fect. Journal of Management Prac-
tices and Principles, 1(4), 186-203.
Cheung, M. F. Y. (2013). The mediating
role of perceived organizational support in the effects of interper-sonal and informational justice on organizational citizenship behav-iors. Leadership & Organization
Development Journal, 34(6), 551-572.
Chi, N. W. (2014). Helpful or harmful?
Exploring the moderating effects of supervisory and coworker sup-port on the relationships between emotional labor, service perform-ance and turnover intentions. Or-
ganization and Management, 7(1), 115-160.
Chin, W. W. (1998). The partial least
squares approach for structural equation modeling. In G. A. Mar-coulides (Ed.), Modern methods
for business research (pp. 295-336). Mahwah, NJ: Lawrence Erl-baum Associates.

The International Journal of Organizational Innovation Vol 10 Num 4 April 2018
148
Chou, Y. H., Kang, C. N., & Kao, C. H. (2012). A comparative study of the effectiveness of government rec-reation centers and privately owned sports facilities. Journal of
Taiwan Society for Sport Man-
agement, 12(4), 255-284. Clark, O. L., Zickar, M. J., & Jex, S. M.
(2014). Role definition as a mod-erator of the relationship between safety climate and organizational citizenship behavior among hospi-tal nurses. Journal of Business and
Psychology, 29(1), 101-110. Coffey, M., Samuel, U., Collins, S., &
Morris, L. (2014). A comparative study of social work students in India and the UK: Stress, support and well-being. British Journal of
Social Work, 44(1), 163-180. Fornell, C., & Larcker, D. G. (1981).
Evaluating structural equation models with unobservable vari-
ables and measurement error.
Journal of Marketing Research,
18, 39-50. Gok, S., Karatuna, I., & Karaca, P. O.
(2015). The role of perceived su-pervisor support and organiza-tional identification in job satisfac-tion. Procedia - Social and Behav-
ioral Sciences, 177, 38-42. Hair, J. F., Black, W. C., Babin, B. J., &
Anderson, R. E. (2010). Multivari-
ate data analysis (7th ed.). Upple Saddle River, NJ: Prentice-Hall.
Hsieh, H. L., & Lin, H. M. (2015). Does
workplace friendship boost organi-zation citizenship behavior? per-spective of fairness heuristic the-
ory. Journal of Labor Studies, 17(1), 60-88.
Huang, H. C., Lin, T. L., Chang, C. M.,
& Chen, C. (2017). A Study on Souvenir Purchase Behavior of Sports Tourists. International
Journal of Organizational Innova-
tion, 9(3), 28-46. Hulland, J. (1999). Use of partial least
squares (PLS) in strategic man-agement research: A review of four recent studies. Strategic Man-
agement Journal, 20(2), 195–204. Kock, N. (2017). WarpPLS User Man-
ual:Version 6.0. Laredo, TX: Script Warp Systems.
Kram, K. E., & Isabella, L. A. (1985).
Mentoring alternatives: The roles of peer relationships in career de-velopment. Academy of Manage-
ment Journal, 28(1), 110-132. Kuo, K. S., Hsieh, L. F., & Lee, L. C.
(2016). To investigate the study of perception on New Taipei City Tamsui Civil Sports Center for lo-cal residence consciousness: A ex-ample of Shuidui, Tamsui District in New Taipei City. Journal of Ex-
ercise and Health Research, 6(1), 1-14.
Lamm, E., Tosti-Kharas J., & King, C.
E. (2015). Empowering employee sustainability: perceived organiza-tional support toward the environ-ment. Journal of Business Ethics, 128(1), 207-220.
Lin,Y. Y., Jiang, P. Y., & Hsieh, T. H.
(2014). The relationship between workplace friendship and sales performance of service industry:

The International Journal of Organizational Innovation Vol 10 Num 4 April 2018
149
The moderating effect of executive / non-executive. Journal of Hu-
manities and Social Sciences, 10(2), 77-84.
Methot, J. R., Lepine, J. A., Podsakoff,
N. P., Christian, J. S. (2016). Are workplace friendships a mixed blessing? exploring tradeoffs of multiplex relationships and their associations with job performance. Personnel Psychology, 69(2), 311-355.
Norris-Watts, C., & Levy, P. (2004).
The mediating role of affective commitment in the relation of the feedback environment to work outcomes. Journal of Vocational
Behavior, 65, 351-365. Organ, D. W. (1988). Organizational
citizenship behavior: The good
Solider Syndrome. Lexington, MA: Lexington Books.
Sias, P. M., Smith, G., & Avdeyeva, T.
(2003). Sex and sex-composition differences and similarities in peer workplace friendship development. Communication Studies, 54, 332-340.
Venkatesh, V., Thong, J., & Xu, X.
(2012). Consumer acceptance and use of information technology: ex-tending the unified theory of ac-ceptance and use of technology. MIS Quarterly, 36(1), 157 -178.
Wang, M. L. (2009). The effects of or-
ganizational support and market-focused human resource manage-ment on service-oriented organiza-tional citizenship behaviors. So-
ochow Journal of Economics and
Business, 64, 57-92.
Wang, Y. W. (2016). The relationship
between teacher’s workplace
friendship and teacher’s work en-
gagement in elementary school
and junior high school of Taiwan. Unpublished master’ Thesis, Na-tional Chiayi University, Taiwan.
Williams L. J., & Anderson S. E. (1991).
Job satisfaction and organizational commitment as predictors of or-ganizational citizenship and in-role behaviors. Journal of Manage-
ment, 17(3), 601-617. Wu, C. P. (2010). The study on the rela-
tionship among positive emotion,
interpersonal problem solving atti-
tudes, and school life adjustment of
junior high school students. Un-published master’ Thesis, National Chiayi University, Taiwan.
Yen, C. H., Lin, Y. Y., Huang, W. P., &
Teng, H. Y. (2011). A study of regular employees and dispatch workers among organizational jus-tice, job security and workplace friendship. Journal of Human Re-
source Management, 11(2), 47-69.

The International Journal of Organizational Innovation Vol 10 Num 4 April 2018
150
CUSTOMER SATISFACTION ON THE PERFORMANCE OF SOCIAL SECURITY ADMINISTRATOR (BPJS) HEALTH IN
CENTRAL JAVA, INDONESIA
Noor Kholis Dept. of Management, Faculty of Economics
Universitas Islam Sultan Agung (UNISSULA), Semarang-Indonesia [email protected]
Alifah Ratnawati
Dept. of Management, Faculty of Economics Universitas Islam Sultan Agung (UNISSULA), Semarang-Indonesia
Yusriyati Nur Farida Jendral Soedirman University, Purwokerto-Indonesia
Abstract
Social Security Administrator (BPJS) Health focuses on administering health insurance for all Indonesian society, hence, the service quality is still far from the expectation of BPJS members. This research aims to evaluate the performance of BPJS Health based on customer satisfaction, in this case BPJS members. The respondents of this research are 250 BPJS members from 5 different cities in Indonesia. This research uses importance-performance analysis, paired-sample t-test, and Cartesian Diagram to analyze the data. The findings show that the highest satisfaction level of BPJS members is on the dimen-sion of empathy, while the lowest satisfaction level is on the dimension of assurance sys-tem. This is unique, where BPJS Health which has established for enhancing public wel-fare has not yet been able to satisfy the expectation of society. However, improving BPJS performance cannot be realized in a blink of eyes. It requires service enhancement strat-egy by improving some supporting aspects. Keywords: BPJS Health, Customer Satisfaction, BPJS Performance, Public Welfare

The International Journal of Organizational Innovation Vol 10 Num 4 April 2018
151
Introduction
Indonesia is a country which has fourth largest population in the world. The large amount of people has contri-bution in many fields including health issue. According to WHO (2012), Indo-nesia rank the 90th most healthy country in the world. This means that health quality in Indonesia is still low. The in-dicator to see the health quality is mor-tality rate and life expectancy. A high rate of mortality shows a low level of people health, while high life expectancy shows a good health level. The admini-stration of public sector is very substan-tial to imply as it will impact the human welfare (Bennington, 2010). Service Quality is how far the dif-ference between expectation and reality about the service received by customers. It can be known by comparing between the service really received by customers and the expected service. If the received service is as the customer expectation, they will be satisfied, and vice versa. Service quality should be started from the customer needs and finished on the customer perception (Kotler, 2013). It can be said that a good quality is based on the perception of service provider, but customer perception. One of the government's efforts to improve the community welfare is the establishment of business entities that manage the National Health Insurance, formerly known as Health Insurance (ASKES). Starting from January 1st, 2014 PT ASKES Indonesia (Persero) changed its name to BPJS Health and since that date, approximately 116, 122,065 of Indonesian people automati-
cally become the members of BPJS. Of this amount coming from ASKES own as much as 16.4 million civil servants (PNS) plus retired civil servants, retired army/police, and the independence pio-neer. BPJS health is a non-profit social insurance and more focuses on providing protection for the community. In the implication, BPJS has get many complain from the members be-cause it is considered as more trouble-some than the previous program (ASKES). For example, the patients have to queue longer in the locket, lab, pharmacy, and for consulting with doc-tors. Moreover, after waiting for long time, outpatients can only get medicine for 10 days (before BPJS, they can get medicine for 30 days), so they have to come to the hospital very often. This condition has not balanced by the num-ber of doctors, paramedics, and quality of infrastructure in order to cut off the long queue. Thus, the given service qual-ity have not satisfied BPJS members’ expectation (Togarsilaban, 2014). Ser-vice quality becomes essential for BPJS in order to be maintained and acquire the members’ trust. The success of BPJS in giving good quality of service is deter-mined by the use of Quality Service ap-proach developed by Parasuraman (Lu-piyoadi, 2006:181). Based on above explanation, BPJS patients’ satisfaction should be con-sidered if BPJS wants to have good qual-ity. The problem occurs then is that the service quality of BPJS have not satisfy the members’ expectation, so this re-search aims to evaluate the administra-tion of BPJS Health in Central Java-Indonesia in giving service for society in

The International Journal of Organizational Innovation Vol 10 Num 4 April 2018
152
term of society satisfaction side and pri-ority order determination in improving the service quality of BPJS Health.
Literature Review
Service Quality
Public Health becomes the Government
Responsibility (Good Governance)
Good Corporate Governance (GCG) is essential thing to do for com-pany in order to build a tough and sus-tainable organization condition. By ap-plying GCG, the management of organ-izational resource is aimed to be effi-cient, effective, economical, and produc-tive which is always oriented on organ-izational goals and consider stake-holders’ interests. GCG is a system which manages and controls the organi-zation to maintain value added for all stakeholders. In the Guidance of Good Corporate Governance in Indonesia (2006) has been mentioned that the im-plication of GCG needs to be supported by 3 interrelated pillars, such as 1. The state and its apparatus create regulations which support healthy, efficient, and transparent climate. 2. Business world as a market participant implement GCG as a basic guideline for business implemen-tation. 3. The public as products and ser-vices members of private sectors and the affected party of the company existence shows care and social control objectively and responsibly. Then within the guide-lines of Good Corporate Governance in Indonesia (2006), there are five princi-ples of Good Corporate Governance as follows:
1. Transparency. The company should provide information which is eas-ily accessed and understood by stake-holders. The company must take initia-tive to express not only problems re-quired by the regulation but also sub-stantial things for decision-making by shareholders, creditors and other stake-holders. 2. Accountability. The company must be responsible with its performance transparently and fairly. Therefore, the company must be properly managed, scalable, and in accordance with the company interests by considering the interests of shareholders and other stakeholders. 3. Responsibility. The company must obey the legislation and implement its responsibilities towards society and en-vironment, so it can maintain the conti-nuity of the long-term business. 4. Independency. The company must be independently managed, so each or-gan of the company does not dominate or threw the responsibility to others and cannot be intervened by other parties, and free from conflicts of interest. Thus, so decision-making can be made objec-tively. 5. Fairness. The company should al-ways consider the interests of sharehold-ers and other stakeholders based on the principles of fairness and equality. The company must provide fair and equitable treatment to stakeholders in accordance with the benefits and contributions made to the company.

The International Journal of Organizational Innovation Vol 10 Num 4 April 2018
153
According to the United Nations Development Program (UNDP), there are 9 indicators to measure good govern-ance, such as: 1. Participation (commu-nity engagement), 2. Rule of law (en-forcement of fair rules), 3. Transparency (freedom of information acquirement), 4.Responsiveness (quick and respon-sive), 5.Consensus Orientation (oriented to the community interests), 6.Equity (equal opportunity), 7.Efficiency and effectiveness, 8.Accountability (public accountability), 9.Strategic vision (their future vision). If principles of Good Governance are applied in BPJS admini-stration, it will not be an easy task, be-cause it takes intention and awareness of all managers involving in providing the best service to all stakeholders.
Customer Satisfaction
Satisfaction is the level of one's feelings after comparing the perform-ance / results felt and the expectation. Therefore, the level of satisfaction is a function of the difference between the perceived performances with the expec-tation. If the performance is below the expectation, then the consumer will be disappointed, if performance is in line with expectation, the consumer will be satisfied. Meanwhile, when the perform-ance exceeds the expectation, the con-sumer will be very satisfied. (Ranaweera & Prabhu, 2003) states that customer satisfaction has become fundamental de-terminant of long-term customer behav-ior. Consumer expectation can be estab-lished from past time experiences, com-ments from relatives, and appointments and information with marketers and ri-vals. Consumers who are satisfied will be loyal for longer time, less sensitive to
price changes, and give good comments about the company. In order to satisfy all parties, BPJS is required to be able to provide quali-fied service for all BPJS members. Qual-ity of service according to Kotler (2013) can be measured from: 1. Reliability is an ability to perform the promised service accurately and re-liably. 2. Responsiveness is willingness to help customers and provide services quickly. 3. Belief is knowledge and courtesy of employees and their ability to gener-ate trust and confidence. 4. Empathy is the company's under-standing of customers’ problems as well as action towards the customer interest, and provision of personal attention to customers. 5. Physical evidence is the appear-ance of physical facilities, equipment, personnel, and communication media.
BPJS (Social Security Administrator)
Starting from January 1st, 2014 PT ASKES Indonesia (Persero) changed its name to BPJS Health in accordance with Regulation no. 24 in year of 2011 about BPJS. BPJS Health (Social Security Administrator of Health) is a State-Owned Enterprise which is specially commissioned by the government to administer health insurance for all Indo-nesian people, especially for Civil Ser-vants, Retired civil servants and

The International Journal of Organizational Innovation Vol 10 Num 4 April 2018
154
army /Police, Veterans, Independence Pioneers and their families, and other business entities or common people. BPJS is a non-profit social insurance which more on providing protection to the public, so health insurance can exist for Indonesian society. It is an essential issue that BPJS Health which aims to fulfill the people needs in term of health insurance in fact is still far from satisfying the members’ expectation. (Jansen, Beld, Goudriaan, Middelkoop, & Arbous, 2009) states that to satisfy patients, it is not only about providing medicine, but also about car-ing. However, satisfaction in this case then will not only be about “people who feel satisfied” but more about their loy-alty (Shaw, 2000). This is very important to measure “satisfaction”.
Preliminary studies
Benninghton (2010) suggests that the management and effectiveness of health sector is very important because it will impact on human welfare and eco-nomic sectors. Discussing about health management, the scope and scale are diverse, so cultural, economic and politi-cal, and other factors will need to be considered. This research inspires the authors to examine on how to optimize BPJS in order to provide welfare for people in Central Java. Zhijian Li (2011) conducts a study entitled “On residents' satisfaction with community health services after health care system reform in Shanghai, China, 2011”. The study measures the satisfac-
tion of the society on public health ser-vices in Shanghai China as a result of reformation on health care system. The research objective is to evaluate the ef-fect of health care system reformation. To evaluate the result, the study uses of public satisfaction analysis, which then is measured using four dimensions: health insurance system, provision of treatment, primary health care clinics and public health services. All dimen-sions show progress and improvement on the satisfaction level of the public since the reformation is carried out, but it finds differences on the satisfaction level in all dimensions and groups. The society feels very satisfied with the ser-vices of clinics and public health but less satisfied with the health insurance sys-tem and the provision of treatment. The group which experiences loss (parents, unemployment, primary school, the poor) is almost entirely dissatisfied of all four studied dimension aspects due to the increased financial burden and the increased drugs cost. The results of this research become the main reference for authors in deciding the dimensions of service quality, aside of service quality dimension proposed by Kotler (2013). Atinga (2011) conducts a study entitled “Managing healthcare quality in Ghana: a necessity of patient satisfac-tion” which test how communication variables, courtesy of service providers, support / care, environmental facilities and waiting time that significantly affect patients’ satisfaction on the quality of healthcare in two hospitals located in Northern Ghana. This study is an ex-ploratory study that aims to provide relevant information to policy makers and health managers on how to

The International Journal of Organizational Innovation Vol 10 Num 4 April 2018
155
effectively serve patients. The results show that three independent variables such as support / care, environmental facilities and waiting time affect the pa-tient satisfaction on health service qual-ity. Besides, communication and cour-tesy service providers do not affect the patient satisfaction on health care qual-ity. The determination coefficient is 51 percent. The results of this study become reference for the author to take some variables to then be developed for fur-ther study by the author.
Research Method
Data Collection Method
The method used in collecting the data is by directly distributing question-naires to the BPJS card members located in Semarang, Kudus, Demak, Pur-wokerto and Kendal (as many as 250 people). The variables used in this study are: 1). Insurance System with 11 indicators, 2).Tangible with 5 indicators, 3).Reliability with 3 indicators, 4). Responsiveness with 4 indicators, 5). Assurance by three indicators and 6). Empathy with two indicators.
Data Analysis Method
There are three analyzes are per-formed, such as: 1) Importance-performance analysis or analysis of the interest and performance level, used to analyze the level of mem-ber satisfaction of BPJS program. 2) Paired sample t-test is used to test the differences between the consumers’ ex-pectations when they will use BPJS ser-
vice with the service really felt when using BPJS facilities. 3) Make a Cartesian diagram to map the average value of the hope score and the average value of the performance score to determine which priority order to im-prove the service quality that need to be done in BPJS.
Findings
Respondent Description
Respondents in this study are 250 people, consisting of 108 men and 142 women. 43.6% of them are 26-40 years old, above 40 years old there are as much as 43.2%. Other 26% of res-pondents work as civil servants and 55.2% of them is private sector employ-ees. More than 60% of respondents use BPJS health of more than 2 times, while about 40% of respondents said that they used ASKES.
Public Satisfaction on BPJS Health
Program
The level of public satisfaction as BPJS card members on all indicators proposed in this study shows the dif-ferent satisfaction level. The detail is presented in Table 1. Table 1 shows that the expectation average score is 4.44, while the perform-ance average score is 3.5. The level of members’ satisfaction on BPJS program ranges about 67.17% to 96. 26%. The higher the percentage score, the better it will be. Of all attributes studied, none of them has reached a value of 100%, this means that there may be differences be-tween the expectations of BPJS

The International Journal of Organizational Innovation Vol 10 Num 4 April 2018
156
Table 1. Satisfaction Level of BPJS Members
No. Indicator Expectation Performance Satisfaction Level
1 Quickness in card making 4,50 3,02 67,17%
2 Freedom in choosing hospital 4,46 3,00 67,21%
3 Easiness in medication bureaucracy 4,47 3,08 68,88%
4 Easiness in room arrangement rule 4,50 3,15 70,02%
5 Schedule punctuality of doctor ex-amination
4,55 3,23 70,91%
6 The magnitude of inpatient cost 4,31 3,06 71,04%
8 The magnitude of outpatient cost 4,23 3,08 72,79%
7 Information clarity on patients’ right and responsibility
4,51 3,29 72,97%
9 Quickness in responding patients comments and complaints
4,60 3,37 73,27%
10 Sophistication of medical tool facili-ties in the hospital
4,57 3,42 74,92%
12 The magnitude of drugs cost 4,20 3,14 74,93%
11 Quickness of staffs in giving service 4,56 3,42 74,96%
13 The magnitude of monthly cost 4,29 3,23 75,21%
14 Accuracy of doctors in examining 4,66 3,60 77,19%
15 Easiness of service procedure in the hospital
4,53 3,508 77,47%
16 Convenience of waiting room in the hospital
4,42 3,45 78,14%
17 Responsive to patients complaints 4,54 3,55 78,27%
18 Clarity on information sign board in the hospital
4,37 3,54 81,14%
19 Easiness in registration process 4,60 3,75 81,44%
20 Cleanliness of the hospital 4,56 3,75 82,12%
21 Kind of drugs covered by BPJS 4,61 3,79 82,25%
22 Doctors’ ability in giving service 4,54 3,85 84,77%
23 Information clarity from the doctor about the patients illness
4,62 3,94 85,37%
24 Tidiness of employee performance in the hospital
4,12 3,74 90,79%
25 Doctors’ reputation 4,03 3,73 92,53%
26 The hospital’s reputation 4,01 3,72 92,89%
27 Hospitality of staffs and medical of-ficers
4,46 4,29 96,26%

The International Journal of Organizational Innovation Vol 10 Num 4 April 2018
157
28 Staffs and medical officers do not differ the patients’ social status
4,46 4,29 96,26%
AVERAGE 4,44 3,50 78,86%
Source: primary data 2015 members and the services they actually receive. Overall, of all indicators tested the average level of BPJS card members’ satisfaction is 78.86%, with 17 of them place below the average satisfaction level (78.86%). The lowest satisfaction level of BPJS card members is in the indicator of the quickness of cards making process, freedom of choice and easiness on Hos-pital medication bureaucracy. The third indicator shows the satisfaction level less than 70%. The highest satisfaction level of BPJS card members is on the indicator of employee performance, Hospital tidi-ness, doctors’ reputation, Hospital repu-tation, friendliness of the staff and medi-cal personnel as well as that they do not distinguish social status. The fifth indi-cator has satisfaction level above 90%.
Difference between Expectation and
Performance
To test the difference between con-sumer expectations when they will use BPJS with the service that is really felt when using the facilities of BPJS, paired samples t-test is used. The result is all the attributes of consumer expectations show a higher value than the perform-
ance, with significant difference about 0.00 to 0,027. Therefore, there is a sig-nificant difference between consumer expectations and the performance of BPJS. This result implies that all attrib-utes of the studied yet achieve satisfac-tion. The result of the difference be-tween expectations and performance can be seen in Table 2. The significant difference between expectation and performance means that the consumers’ expectation is higher than BPJS’s performance. This is be-cause the information given by BPJS, either through advertisement or other kinds of it, might be too much. Too much information will make the expec-tation of BPJS consumers high, while the performance does not directly be handled by BPJS but through BPJS part-ners, such as first and advanced health facility. This can impact on not optimal performance.
Priority Order of Service Quality
Improvement
The priority order of service qual-ity improvement that needs to be con-ducted by BPJS can be determined through mapping the average score of expectation and the average score of per-formance of all attributes in Cartesian Diagram. The result of the attribute mapping is illustrated in Figure 1.

The International Journal of Organizational Innovation Vol 10 Num 4 April 2018
158
Table 2. Result of Test on Difference between Expectation and Performance
No. Indicator Expectation Performance Sign
1 Easiness in registration process 4,60 3,75 .000
2 Quickness in card making process 4,50 3,02 .000
3 Easiness in room arrangement rule 4,50 3,15 .000
4 Information clarity on patients’ right and re-sponsibility
4,51 3,29 .000
5 Easiness in medication bureaucracy 4,47 3,08 .000
6 Freedom in choosing hospital 4,46 3,00 .000
7 Kind of drugs covered by BPJS 4,61 3,79 .000
8 The magnitude of monthly cost 4,29 3,23 .000
9 The magnitude of inpatient cost 4,23 3,08 .000
10 The magnitude of drug cost 4,20 3,14 .000
11 The magnitude of outpatient cost 4,31 3,06 .000
12 Sophistication of medical tool facilities in the hospital
4,57 3,42 .000
13 Cleanliness of the hospital 4,56 3,75 .000
14 Convenience of waiting room in the hospital 4,42 3,45 .000
15 Clarity on information sign board in the hospi-tal
4,37 3,54 .000
16 Tidiness of employee performance in the hospi-tal
4,12 3,74 .000
17 Schedule punctuality of doctor examination 4,55 3,23 .000
18 Quickness of staffs in giving service 4,56 3,42 .000
19 Accuracy of doctors in examining 4,66 3,60 .000
20 Easiness of service procedure in the hospital 4,53 3,508 .000
21 Responsive to patients complaints 4,54 3,55 .000
22 Quickness in responding patients comments and complaints
4,60 3,37 .000
23 Information clarity from the doctor about the patients’ illness
4,62 3,94 .000
24 Doctors’ reputation 4,03 3,73 .000
25 The hospital’s reputation 4,01 3,72 .000
26 Doctors’ ability in giving service 4,54 3,85 .000
27 Hospitality of staffs and medical officers 4,46 4,29 .027
28 Staffs and medical officers do not differ the 4,46 4,29 .027

The International Journal of Organizational Innovation Vol 10 Num 4 April 2018
159
patients’ social status
AVERAGE 4,44 3,50
Source: primary data 2015
Figure 1. Cartesian Diagram between Expectation and Performance
PERFORMANCE
EXPECTATION
QUADRANT I
QUADRANT IV
QUADRANT II
QUADRANT III I

The International Journal of Organizational Innovation Vol 10 Num 4 April 2018
160
Table 3. Position in Quadrant I
No. of At-tribute
Name of Attribute Variable
1 Easiness in registration process to be BPJS member
Assurance System
7 Kind of drugs covered by BPJS Assurance System
13 Cleanliness of the hospital Tangible
19 Accuracy of doctors in examining (diagnos-ing the illness)
Reliability
21 Responsive to patients complaints Responsiveness
23 Information clarity from the doctor about the patients’ illness
Responsiveness
26 Doctors’ ability in giving service Assurance
27 Hospitality of staffs and medical officers Empathy
28 Staffs and medical officers do not differ the pa-tients’ social status
Empathy
From the result of attribute map-ping, it can be explained as follows:
Quadrant I: The first quadrant is a posi-tion where the BPJS patients’ expecta-tion is high which is higher than the av-erage (4,44), while according to patients the BPJS’s performance is also high or above the average (3,50). This position is placed by some attributes as showed in Table 3. The first quadrant is a position where the BPJS patients’ expectation is high and according to patients the BPJS’s performance is also high. This shows that the performance of these at-tributes at least are maintained because it is good.
Quadrant II: The second quadrant is a position where the BPJS patients’ expec-tation is high or above the average (4,44), while according to the patients the BPJS’s performance is low or below the average (3,50). This position is placed by some attributes as showed in Table 4. The second quadrant is a position where the BPJS patients’ expectation is high and according to the patients the BPJS’s performance is low. This shows that the performance of above attributes becomes the Main Priority Scale need to be improved. Quadrant III: The third quadrant is a position where the BPJS patients’ expec-tation is low or below the average (4,44), while according to the patients the BPJS’s performance is also low or below

The International Journal of Organizational Innovation Vol 10 Num 4 April 2018
161
Table 4. Position in Quadrant II
No. of At-tribute
Name of Attribute Variable
2 Quickness in card making process Assurance System
3 Easiness in room arrangement rule Assurance System
4 Information clarity on patients’ right and re-sponsibility
Assurance System
5 Easiness in medication bureaucracy Assurance System
6 Freedom in choosing hospital Assurance System
12 Sophistication of medical tool facilities in the hospital
Tangible
17 Schedule punctuality of doctor examination Reliability
18 Quickness of staffs in giving service Responsiveness
20 Easiness of service procedure in the hospi-tal
Reliability
22 Quickness in responding patients com-ments and complaints
Responsiveness
Table 5. Position in Quadrant III
No. of Attrib-ute
Name of Attribute Variable
8 The magnitude of monthly cost Assurance System
9 The magnitude of inpatient cost Assurance System
10 The magnitude of drug cost Assurance System
11 The magnitude of outpatient cost Assurance System
14 Convenience of waiting room in the hos-pital
Tangible

The International Journal of Organizational Innovation Vol 10 Num 4 April 2018
162
the average (3,50). This position is placed by some attributes as showed in Table 5. The third quadrant is a position where the BPJS patients’ expectation is low and according to the patients the BPJS’s performance is also low. This shows that the performance of the above attributes becomes the Priority Scale II which needs to be improved. Quadrant IV: The fourth quadrant is a position where the BPJS patients’ expec-
tation is low or below the average (4,44), while according to the patients the BPJS’s performance is high or above the average (3,50). This position is placed by some attributes as showed in Table 6. The fourth quadrant is a position where the BPJS patients’ expectation is low and according to the patients the BPJS’s performance is high. This shows that the performance of these attributes is not the main priority to be improved, but at least has to be maintained.
Table 6. Position in Quadrant IV
No. of Attrib-ute
Name of Attribute Variable
15 Clarity on information sign board in the hospital Tangible
16 Tidiness of employee performance in the hospital Tangible
24 Doctors’ reputation Assurance
25 The hospital’s reputation Assurance
From the above explanation, it can be concluded that the improvement of the attribute performance on Quadrant II and III will be able to improve the BPJS patients’ satisfaction level. BPJS system for patients is gradual system which is started from family doctor then to hospi-tal (BPJS partner), so any service given by BPJS partners directly impacts the patients’ satisfaction. Therefore, the per-formance of BPJS partners for attributes in Quadrant II and III become the main and the second priority to be improved.
Discussion
28 attributes examined in this re-search all show significant difference between the expectation of BPJS mem-bers and the performance of BPJS ser-vice really felt by the members of BPJS Health card. The highest satisfaction of BPJS members is on the dimension of empathy with 2 indicators: staffs and medical officers do not differentiate so-cial status and the indicator of hospitality of staffs and medical officers. The result of this research is in contrast to from a study conducted by Atinga (2011) which shows that communication and courtesy of service provider do not impact the

The International Journal of Organizational Innovation Vol 10 Num 4 April 2018
163
patients’ satisfaction on service quality. This is understandable as this research is conducted in Central Java where the population upholding their culture has empathy, while Atinga’s research is conducted in Ghana. Dimension with lowest satisfaction level is Assurance System dimension. Almost all indicators of this dimension show low satisfaction level. This result is in line with research conducted by Zhijian Li (2011) which examines peo-ple satisfaction level on people health service in Shanghai China. The result of Zhijian Li’s study shows that people feel less satisfied with health assurance sys-tem and medication provision. In order to make BPJS perform-ance high, the Main Priority Scale which the performance is improved is as fol-lows: - Dimension of Assurance system, the performance need to be improved is on attributes Quickness in BPJS Card making process, easiness in room ar-rangement rule, Information clarity on BPJS members’ right and responsibility, Easiness in medication bureaucracy/ procedure/ order, and Members’ free-dom in choosing hospital. - Dimension of Tangible, the per-formance need to be improved is on at-tribute Sophistication of medical tool facilities in the hospital. - Dimension of Reliability, the per-formance need to be improved is on attributes Schedule punctuality of doctor examination and Easiness of service procedure in the hospital.
- Dimension of Responsiveness, the performance need to be improved is on attributes Quickness of staffs in giving service and Quickness in responding pa-tients’ comments and complaints.
Conclusion
The satisfaction level of BPJS card members on all indicators proposed in this study shows that there is none of them has reached 100%value, which means that there is difference between the expectation of BPJS members and the service that is actually received. The lowest satisfaction level of BPJS card members is in the indicators of Quick-ness in BPJS Card making process, Freedom in choosing hospital, and Easi-ness in medication bureaucracy. The highest satisfaction level of BPJS card members is on the indicators of Tidiness of employee performance in the hospital, Doctors’ reputation, The hospital’s repu-tation, Hospitality of staffs and medical officers, and Staffs and medical officers do not differ the patients’ social status. There is a significant difference between consumer expectation when they will use BPJS and the service they really accept when using BPJS facility. The result means that overall attributes examined in this research show that BPJS members have not reached mem-bers satisfaction.
Future Research Agenda
BPJS is a state-owned enterprise which is specially commissioned by the government to organize health insurance for all Indonesian. To optimize BPJS performance, it needs to evaluate the

The International Journal of Organizational Innovation Vol 10 Num 4 April 2018
164
BPJS administration. The evaluation is done by considering the point of view of BPJS members BPJS providers and BPJS institution itself. The agenda of the first year research is evaluating the BPJS implementation seen from the point of view of BPJS members, such as the BPJS cardholders. Research in the first year has discovered how people's satis-faction on the implementation of BPJS health. It has also been described how the priority scale optimizes BPJS, so BPJS card members feel satisfied with the service received. The second year research will study the evaluation of BPJS implementation seen from the point of view of BPJS partners, i.e. first-
level health facilities, Doctors, Hospi-tals, and Pharmacies. Variables studied using service quality approach devel-oped by Parasuraman (Lupiyoadi, 2006) and the variable of health assurance sys-tem developed by Li Zhijian (2011). The results of the study in the first year and the second year will then be used as a basis to examine how the implementa-tion of Good Corporate Governance in BPJS health is. In the third year, it will investigate how the implementation of Good Corporate Governance in BPJS institution is. Research in the third year is based on the results achieved in the first year and the second year of study.
Reference
Atinga, Roger Ayimbillah; Gordon Abekah-Nkrumah and Kwame Ameyaw Domfeh, “Managing
Healthcare Quality in Ghana: a
Necessity of Patient Satisfaction”, International Journal of Health Care Quality Assurance, Vol. 24 No. 7, pp. 548-563.
Bennington, Lynne., 2010, “Review of
the Corporate and Healthcare Gov-
ernance Literature”, Journal of Management & Organization,
Vol.16 No. 2, pp. 314–333. BPJS Kesehatan., 2013, “TakSekedar-
TransformasiStruktural”, http://www.bpjs-kesehatan.go.id/pesan-40-tak-sekedar-transformasi-struktural.html (accessed on April 1st, 2014).
Jansen, A., Beld, M., Goudriaan, M.,
Middelkoop, H., & Arbous, M. (2009). Patient satisfaction in the ICU: level of satisfaction and influencing factors. Critical Care, 13(Suppl 1), P487. https://doi.org/10.1186/cc7651
Ranaweera, C., & Prabhu, J. (2003). On
the relative importance of customer satisfaction and trust as determi-nants of customer retention and positive word of mouth. Journal of
Targeting, Measurement and
Analysis for Marketing, 12(1), 82–90. https://doi.org/10.1057/palgrave.jt.5740100
Shaw, R. (2000). How to Measure
Customer Satisfaction. Interactive
Marketing, 1(3), 333–334. https://doi.org/10.1057/palgrave.im.4340046. (Jansen et al., 2009)

The International Journal of Organizational Innovation Vol 10 Num 4 April 2018
165
Komite Nasional Kebijakan Govern-ance., 2006, “Pedoman Umum
Good Corporate Governance Indo-
nesia”
Li, Zhijian; Jiale Hou, Lin Lu, Shenglan
Tang, Jin Ma, 2011, “On Residents’
Satisfaction with Community Health
Services After Health Care System
Reform in Shanghai, China, 2011”, BMC Public Health, http://www.biomedcentral.com/1471-2458/12/S1/S9.
Silaban, Togar., 2014, “Bedanya Askes
dengan BPJS Kesehatan”, http://togarsilaban.wordpress.com/(accessed on April 6th, 2014).
Surat Edaran Nomor
HK/MENKES/32/1/2014, “Pelak-
sanaan Pelayanan Kesehatan bagi
Peserta BPJS Kesehatan pada
Fasilitas Kesehatan Tingkat Per-
tama dan Fasilitas Kesehatan Ting-
kat Lanjutan dalam Penyelengga-
raan Program Jaminan Kese-
hatan”.

The International Journal of Organizational Innovation Vol 10 Num 4 April 2018
166
AFFECTS OF DIETARY BEHAVIOR AND RISK PERCEPTION ON INTERNET FOODS
Yang Chu Lin
Department of Business Administration Soochow University, Taiwan
linyc@scu. edu. tw
Chia-Ko Lee Department of Administration, Cheng Ching General Hospital, Taiwan
Feng Chia University Ph. D. Program in Business, Feng Chia University, Taiwan 4857@ccgh. com. tw
Yi Chih Lee*
Department of International Business Chien Hsin University of Science and Technology, Taiwan
lyc6115@ms61. hinet. net *corresponding author
Abstract
The internet plays the role of a convenient platform for the public to voice their opinions, vent their emotions, and exchange professional knowledge. However, the Internet is overburdened with tantalizing graphical and textual depictions of high-fat, high-calorie, high-sugar, and high-sodium snacks, pastries, beverages, and fried foods, which only trigger consumers’ motivation to buy such foods and in turn incur burdens to their own health. The aim of this study is to understand consumer’s involvement with risk behav-iors as well as the correlation between dietary behaviors and risk perception. This study used the partial least square method to conduct reliability and validity tests and overall model analysis. The results find that consumers’ behavioral factors will affect their risk perception and behavioral intention. Key Words: Risk Perception, Dietary Behavior, Risk Behavior, Behavior Intention

The International Journal of Organizational Innovation Vol 10 Num 4 April 2018
167
Introduction
As the internet has become a part of people’s daily lives, consumers can share and disseminate a variety of in-formation online, which makes online media important intermediaries for in-formation exchange. As indicated by the internet world stats (2012) , the united states, which is home to approximately 245 million internet users, enjoy a 78. 1 % internet penetration rate. According to the 2013 pew internet project, 72% of internet users in the united states have developed the habit of using social net-works, which are fairly popular among middle-aged and elderly users, despite such social networks’ more prominent popularity among users in younger age groups. In the united kingdom, there are 53 million internet users and an 83% internet penetration rate (research, de-velopment and evaluation commission, executive yuan, 2013). As revealed by surveys in taiwan, the rate of internet usage among people aged 12 or older increased from 73. 0% in 2012 to 76. 3% in 2013, and 20. 8% of people identified searching for information online as the main reason for using the internet. From the above statistics, it can be inferred that acquiring daily life information from the internet has become a common practice for internet users. Internets play the role of a conven-ient platform for the public to voice their opinions, vent their emotions, and ex-change professional knowledge. As con-sumers in modern society are too busy with work to prepare three meals a day, they have more chances to eat out or search for delicious and comforting foods online to fulfill their psychological
needs. In a way, foods’ function has been extended from satisfying one’s physical hunger to soothing one’s emo-tions. However, the internet nowadays is overburdened with tantalizing graphical and textual depictions of high-fat, high-calorie, high-sugar, and high-sodium snacks, pastries, beverages, and fried foods, which only trigger consumers’ motivation to buy such foods and in turn incur burdens to their own health. Positive dietary behaviors and low-involvement health risk behaviors help the public to maintain good health. However the majority of food-related blogs only provide enticing news of cui-sines and shopping tips, whereas warn-ings about health risks are rarely seen. Such partial reports of health informa-tion are likely to cause consumers to ig-nore food-related risks and develop die-tary habits that are prone to result in ill-ness. Aiming to promote individuals’ accurate concepts of eating and develop accurate attitudes toward health, this study chose internet users as research subjects to understand their involvement with risk behaviors as well as the corre-lation between dietary behaviors and risk perception. Furthermore, this study ex-amined whether internet users’ behav-ioral intention is triggered by the cui-sines recommended on blogs, so as to analyze the relevance between the ap-peal of blogs and consumers’ purchase intention.
Literature Review
Risk behaviors

The International Journal of Organizational Innovation Vol 10 Num 4 April 2018
168
Risks refer to behaviors that may incur negative results or potential loss to individuals while bringing certain bene-fits concurrently. Such negative and positive outcomes may achieve a certain balance (moore and gullone, 1996). Risk-taking behaviors are seen as volun-tary behaviors which may generate re-sults that are possibly but not necessarily negative (irwin, 1993). Those risks in-clude behaviors that are harmful to one’s physical and psychological wellbeing or results that endanger one’s wellbeing and life due to one’s own behaviors (be-thin, slovice and severson, 1993). As indicated by research, there is a link be-tween risk behaviors and risk perception (bethin, slovice and severson, 1993) , and people with higher involvement in risk behaviors have weaker food risk perception. Based on the above, this study put forth the following hypothesis: H1: users with higher involvement in
risk behaviors have a lower level of risk perception in delicious foods.
Dietary behaviors
As indicated by the research, im-proper dietary behaviors may result in obesity and a higher likelihood of illness (kruger et al. , 2006; hlebowicz et al. , 2011). Therefore, a healthy diet plays an imperative role for an individual’s healthy growth and development as well as a key for precluding obesity, cardio-vascular diseases, cancers, and other chronic diseases (chiou et al. , 2012). As indicated by studies, dietary habits that are recommended to be avoided or to take on are more likely to make a deep impression on people’s minds and are
beneficial to weight loss. (chiou et al. , 2012). Therefore, appropriate behavioral interventions must be adopted to effec-tively change people’s dietary habits (chiou et al. , 2012). People with proper dietary behaviors already possess accu-rate concepts of foods. Based on the above, this study put forth the following hypothesis: H2: users with more proper dietary be-
haviors have higher risk percep-tions in delicious foods.
Appeal of blogs
Scholars have pointed out that an individual who is attracted to other indi-viduals or objects may fall into a state of intense focus, become oblivious to one-self, and engage in indulgence. Of these, intense focus is the most commonly seen effect. Therefore, a blog is deemed as engaging if the blog successfully draws readers’ attention to its content. Further, obliviousness of self, which refers to us-ers’ behaviors as a result of being drawn to the content of a blog, is enthusiasm in the most appropriate degree. Indulgence, on the other hand, is revealed in users’ engagement in issues addressed on a blog (jeng, 1992). Therefore, a attractive depiction of foods on a blog will attract consumers to read the entire blog article, search for more articles in relation to various foods, encourage family mem-bers, relatives, or friends to eat these foods which were recommended on blogs. Based on the above, this study put forth the following hypothesis: H3: the appeal of a blog is positively re-
lated to users’ behavioral intention.

The International Journal of Organizational Innovation Vol 10 Num 4 April 2018
169
Risk perception
As a type of judgment on behav-iors that is influenced by an individual’s previous experience, significance of the event, and an individual’s ability to han-dle information, risk perception refers to behaviors of judgment and decision-making on the probability that events may result in a negative influence (tseng, 1994). People’s risk perception is subject to the influence of social, cultural, psy-chological, and cognitional factors; how-ever, experts and the general public show a wide divergence in risk percep-tion (wang et al. , 2005). Scholars have pointed out that risk perception could cause decision-makers to overestimate or underestimate risks, misjudge uncertain circumstances, therefore make wrong decisions. Based on the above, this study put forth the following hypotheses: H4: risk perception has a mediation ef-
fect on risk behaviors and behav-ioral intention.
H5: risk perception has a mediation ef-
fect on dietary behaviors and be-havioral intention.
Behavioural intention
Behaviors are derivatives of an in-dividual’s knowledge and attitudes, meaning that an individual’s behaviors result from his/her attitudes (hong and fu, 2012). Ajzen (1991) put forward that behavioral intention may be subject to the influence of any or all the following three factors: attitudes toward behaviors, subjective norm, and perceived behav-ioral control. Baker and crompton (2000) suggested that the behavioral intention
of intending visitors refers to the intend-ing visitors’ willingness to revisit the same destination, i. e. , their tourism des-tination loyalty. Delicious foods which produce a more memorable impression on people are usually associated with publicity gained through media, which enhances people’ likelihood of purchas-ing and creates enhanced effect of word of mouth. After their shopping, users may even be willing to recommend the same food to their families or friends and cause their families or friends have a stronger intention to eat.
Experimental design
Participants
This study used interviews to col-lect data in private universities in Tai-wan. The samples were people who had viewed online Taiwanese foods’ blogs. There were 390 valid questionnaire samples in this study.
Measures
In this study, the construct of risk behaviors was modified from the scale developed by Weber et al. (2002). Measurements were based on a Likert 7-point scale, with scores ranging from 1 (strongly disagree) to 7 (strongly agree). In the variable of dietary behaviors, this study modified the scale developed by Povey et al. (2000) , which has seven items. The measurement was based on a 7-point Likert scale. This study defined the variable of risk perception as the construct concerning if people under-stand street side foods would bring health risks. The scale was adapted from Siegrist et al. (2000) and contained a

The International Journal of Organizational Innovation Vol 10 Num 4 April 2018
170
total of six items. This study sought to measure the construct of blog’s attrac-tiveness by referring to Power et al. (2008) for eight items which were also measured using a 7-point scale. Finally, the behavioural intention construct re-ferred to whether people would buy these Taiwanese foods which were in-troduced on the blogs. Measurements were based on the scale of Zeithaml et al. (1996) , which features a total of five items. This study used the partial least square method (PLS) to conduct reliabil-ity and validity tests as well as overall model analysis and used SmartPLS software for analysis. The reliability and validity of the overall dimensions are shown in Table 1. The measurement model’s dimensions indicated good reli-ability, with a composite reliability of over 0. 7, and the average variance ex-tracted was also above the standard of 0. 5, thereby reaching the standard for con-vergent validity.
Results
This study established five
hypotheses, which were confirmed using PLS in structural equation modeling analysis. The results are shown in Table 2. Standardization coefficients and sig-nificance test values showed that when people had higher risk behaviors, their risk perception would be poorer (esti-mate value = -0. 187, p<0. 001) , thus supporting H1. Furthermore, the results indicated that when people had better dietary behaviors, they would have bet-ter risk perception (estimate value = 0. 223, p<0. 001) ; thus, H2 was supported. Finally, it was observed that when peo-ple had be attracted by the blog’s infor-mation about Taiwanese foods, they would have better behavioral intentions (estimate value = 0. 466, p<0. 001) ; therefore, H3 was supported. The model of this study has the average R2 = 0. 3611, which was greater than 0. 35 (Cohen 1988) and the GOF = 0. 3939; thus, the model had a good fit. To further examine the mediation hypotheses, this study used the Sobel test to confirm the mediating effects (Sobel 1982). Preacher and Hayes (2004) suggested that for computations based on the path coeffi-cient and standard error, a Z value greater than 1. 96 indicates a significant
Table 1. Fit indicators of the measurement model
Construct AVE Composite Reliability
Cronbach's Alpha
Communality
Risk Behavior 0. 779744 0. 865468 0. 818 0. 479744
Dietary Behavior 0. 580754 0. 824705 0. 876 0. 580754 Blog’s Attractiveness 0. 665706 0. 932807 0. 880 0. 665706
Risk Perception 0. 521943 0. 903400 0. 790 0. 521942 Behavior Intention 0. 722364 0. 928357 0. 901 0. 722364

The International Journal of Organizational Innovation Vol 10 Num 4 April 2018
171
Table 2. Results of structural model analysis
Structural Path Estimate Value
t value p value Verify
H1 Risk Behavior→Risk Perception
-0. 187 4. 518 p<0. 001 Support
H2 Dietary Behavior→Risk Perception
0. 223 5. 245 p<0. 001 Support
H3 Blog’s Attractive-ness→Behavior Inten-
tion
0. 466 10. 537 p<0. 001 Support
Table 3. Results of Sobel test
Mediating Path Sobel z test
p value
H4 Risk Behavior→Risk Percep-tion→Behavior Intention
-4. 058 p<0. 001
H5 Dietary Behavior→Risk Percep-tion→Behavior Intention
4. 558 p<0. 001
mediating effect, which shows that the risk perception plays a mediating effect between risk behaviors and behavior intentions (estimate value = -4. 058, p<0. 001) as well as dietary behaviors and behavior intentions (estimate value = 4. 558, p<0. 001). Thus, H4 and H5 were supported by the results, as shown in Table 3.
Discussion and Conclusion
From the perspective of risk, this study examined Internet users’ state of involvement in different risk behaviors, the relationship between users’ dietary behaviors, their risk perception of Taiwan street snacks, and the influence of risk perception on their behavioral intention. In addition, this study also probed into the influence of blog con-tent on behavioral intention and reached the conclusion that both the personal causes of users and the pres-entations on the blogs influence
behavioral intention for Taiwan street snacks. Regarding the correlation be-tween risk behaviors and risk percep-tion, the results of the structural equa-tion indicated a significantly negative correlation between risk behaviors and risk perception, which was the same result as in studies of other scholars (Weber et al. , 2002). Users who are more likely to take on risk behaviors have a lower degree of risk perception of whether snacks are healthy or not. In addition, this study demonstrated a positive correlation between risk per-ception and behavioral intentions, as well as the mediation effect of risk perception. When viewing delicious foods on blogs, Internet users with higher involvement in risk behaviors and lower perception of health-related food risks and they will not make a special effort to do develop purchase intention.

The International Journal of Organizational Innovation Vol 10 Num 4 April 2018
172
Concerning the correlation be-tween dietary behaviors and risk per-ception, the results of this study re-vealed that consumers with proper die-tary behaviors have more discerning risk perception of foods recommended on blogs. Moreover, risk perception has a mediation effect on dietary be-haviors and behavioral intentions, i. e. , consumers with more correct dietary concepts and behaviors are more will-ing to purchase foods despite their heightened perception of food risks. However, when under the temptation of delicious foods, people with accu-rate dietary notions will also be willing to try such foods. As accurate dietary behaviors and purchasing behaviors are the ultimate goals of nutrition edu-cation, accurate dietary behaviors should be taught from the inception of education. Consumers facing the temp-tation of various foods online still need to be aware of the risks of foods to en-sure their subsequent healthy purchas-ing behaviors. This study found that consumers are more susceptible to being influ-enced and further developing behav-ioral intention when blog information about certain foods is more appealing. The results of this study indicated that presentations on blogs have cast an influence on consumers’ behavioral intention. Therefore, in the world of the Internet, information sharing among consumers has become an im-portant source of information. To summarize the results of this study, online media have an important influence on consumers’ buying be-haviors, and Internet education should start with developing consumers’ cor-rect health concepts, so that consumers can have the ability to make the right
choices when facing media that are loaded with foods that may inflict risks to health. However, this study was lim-ited to research on blogs about Taiwan street snacks instead of conducting ex-tensive research on other media such Facebook; therefore, it is suggested that researchers in the future use Face-book to conduct relevant analysis.
References
Ajzen, I. (1991) The theory of planned behavior, Organizational Behavior and Human Decision Processes, Vol. 50, 179-211.
Baker, D. A. & Crompton, J. L. (2000)
Quality, satisfaction and behav-ioral intentions, Annals of Tour-ism Research, Vol. 27, 785-804.
Benthin, A. , Slovic, P. , & Severson,
H. (1993) A psychometric study of adolescent risk perception, Journal of Adolescence, Vol. 16, 153-168.
Chiou, S. Y. , Chen, F. L. , Liu, & C.
H. (2012) Integrating the Tran-stheoretical Model and Problem-based Learning Strategies to Im-prove Students' Dietary Behaviors, Taiwan Journal of Publich Health, Vol. 31, 581-596.
Chou, Y. H. (2013) To Explore the
Influence of Serious Leisure Characteristics on Travel Behav-ioral Intentions: Perceived Func-tions of Travel Blogs and Destina-tion Image as Intermediated Vari-ables, Journal of Outdoor Recrea-tion Study, Vol. 26, 57-82.

The International Journal of Organizational Innovation Vol 10 Num 4 April 2018
173
Hlebowicz, J. , Persson, M. , Gullberg, B. , Sonestedt, E. , Wallström, P. , Drake, I. , Nilsson, J. , Hedblad, B. , &Wirfält, E. (2011) Food pat-terns, inflammation markers and incidence of cardiovascular dis-ease: the Malmö Diet and Cancer study, J Intern Med, Vol. 270, pp. 365-376.
Hong, J. C. & Fu, H. Y (2012) A Study
on the Pro-Environmental Behav-ioral Intention of Post-Secondary School Students, Bulletin of Edu-cational Psychology, Vol. 44, 373-387.
Irwin, C. E. (1993) Adolescence and
risk taking: How are they related? In N. J. Bell & R. W. Bell (Eds. ) , Adolescent risk taking. Newbury Park, CA: Sage.
Jeng, S. H. (1992) A Responsive Ex-
ploration towards Lee, Min-Chung's Critical Study, the Altern Ative Concepts of B. L. Driver's Recreation Experiences Theory, from the View Point of Recreation Attraction, Journal of Outdoor Recreation Study, Vol. 5, 57-96.
Kruger, J. , Blanck, H. M. , & Gilles-
pie, C. (2006) Dietary and physi-cal activity behaviors among adults successful at weight loss maintenance, Int J Behav Nutr Phys Act, Vol. 3, 17.
Moore, S. & Gullone, E. (1996) Pre-
dicting adolescent risk behavior using a personalized cost-benefit analysis, Journal of Youth and Adolescence, Vol. 25, 343-359.
The Research, Development and Evaluation Commission (2013) 2013 Individual/Household Digi-tal Opportunity Survey http://www. rdec. gov. tw/public/Attachment/3122613393871. pdf
Tseng, M. H. (1994) A Brief Study on
risk perception of MINBY Facil-ity, Journal of man and earth, Vol. 126, 36-40.
Wang, M. S. , Huang, G. L. & Kuo, W.
C. (2005) Experiment Study on Risk Perception of Drunk Driv-ing-An Application of the Infor-mation integration Theory, Jour-nal of Management, Vol. 22, 429-447.
Weber, E. U. , Blais, A. R. & Betz, N.
E. (2002) A Domain-Specific Risk-Attitude Scale: Measuring Risk Perceptions and Risk Behav-iors, Journal of Behavioral Deci-sion Making, Vol. 15, 263-290.
Yang, M. L. , Cheng, K. C. & Ni, F.
Yu (2009) The Relationship be-tween Risk Perception and Sunk Cost Effects, Journal of Manage-ment & Systems, Vol. 16, 487-504.

The International Journal of Organizational Innovation Vol 10 Num 4 April 2018
174
THE PRACTICE AND FACTORS OF TAIWAN STEEL PLANT
TO ADOPT CSR
Ph.D. Candidate Chia-Hao, Chang Graduate Institute of Construction Engineering and Management
National Central University, Taiwan (R.O.C.) [email protected]
Prof. Dr. Ting-Ya, Hsieh
Graduate Institute of Construction Engineering and Management National Central University, Taiwan (R.O.C.)
Abstract
According to the research about the CSR, the CSR can effectively better not only the corporate financial performance, but also can reduce various production costs and im-prove the corporate image. Thus, the CSR has become an important indicator for bet-tering the corporate performance, enhancing the corporate image, improving produc-tion environments and increasing the centripetal force of employees in recent years. In order to change the old viewpoints that most people consider steel plants being of high pollution, high power consumption and bad working environment, the steel plants selected to be the cases of the study have introduced the CSR five years ago to increase the recognition from people and their employees. The study adopts in-depth interview and questionnaire survey to ask top management about how to promote the CSR and use questionnaire to collect the viewpoints of the employees for their com-panies promoting the CSR in order to analyze whether the CSR can result in obvious influence to the performance of these companies. The result shows that the social per-formance can better several indicators, such as business performance, corporate im-age, product image and purchase intention; the environment performance can posi-tively increase the centripetal force of the employees. If one company promotes one of the CSR performance indicators, the viewpoint and the outcome of the company’s employees will be also improved. Keywords: CSR (corporation social responsibility), performance, steel plant

The International Journal of Organizational Innovation Vol 10 Num 4 April 2018
175
Introduction The major object of the operation of enterprises is to acquire profit in or-der to survive and allow their employ-ees to make a living. However, as many events occur in a lot of multina-tional enterprises, such as cooking the books, escaping tax, exploiting labors and illegal hiring child labor and ex-cessively polluting environment in re-cent years, the social members start to think that the object of the existence of the enterprises should not be only mak-ing profit, but also should bear more responsibilities so as to make a contri-bution to the country, the society, peo-ple and employees. Therefore, the concept of the corpora-tion social responsibility (CSR) gradu-ally attracts more attention from peo-ple. There are many research studies about the CSR; many scholars, such as Bowen (1953) & Arrow (1973), con-sider that enterprises obtain profits from the society, and the activities of enterprises are very relevant to the members of the society; thus, the members of the society should be in-cluded in the stakeholders of enter-prises. The researches of Leonardo, Stefania & Damiano (2008), Becker- Olsen, Cudmore & Hill (2006), Tsout-soura (2004), Simpson & Kohers (2002), McWilliams & Siegel (2001), Ruf, Muralidhar, Brown, Janney & Paul (2001), Hillman & Keim (2001), and Preston & O’Bannon (1997) indi-cate that the benefit of enterprises bearing the social responsibility is higher than the cost they will pay, and the enterprises adopting the CSR will also achieve better performance. Moreover, regarding the researches related to the CSR and the manage-
ment of enterprises, Turban & Green-ing (1997) find that if enterprises can provide good and safe working envi-ronments for their employees, their production will also increase. The re-searches of Bowman & Haire (1975), Alexander & Bucholtz (1978), Porter &van der Linde (1995), and Fombrun, Gardberg & Bamett (2000) find that if enterprises engage in or make a contri-bution to the public welfare, their repu-tation and trust will be better to in-crease their brand image and competi-tiveness, so the cost will be reduced; meanwhile, they can attract more at-tention from the investment institutes, and the occurrence probability of spe-cial negative events will also decrease and their capability for handling nega-tive events will increase (Tsoutsoura, 2004), which just likes purchasing in-surance for their brand image and fi-nancial performance (Werther & Chandler, 2005; Peloza, 2006). Cornell & Shapiro (1987) and Preston & O'Bannon (1997) consider that if an enterprise can satisfy the anticipation of the stakeholders from all levels of the society, its financial performance will be positively benefited; higher so-cial performance will result in better financial performance, both of which is in a positive relation. To sum up, many previous researches show that enter-prises can create better image via im-plementing the CSR, and can exert positive assistance for the society to increase their influence to the society in order to achieve the win-win situa-tion. Most people always consider that the steel plants are the industry of high pollution and high-power consump-tion, in particular to the south area of Taiwan; there are many steel factories and high- pollution industries in south

The International Journal of Organizational Innovation Vol 10 Num 4 April 2018
176
area of Taiwan, and the air pollution resulted from these factories are the serious problem for everyone. The steel plants selected as the cases of the study have strived to promote the CSR; they hope they can better their corpo-rate image and business performance via environmental protection, em-ployee welfare, and friendly commu-nity. The study adopts in-depth inter-view to ask the top management of these case steel plants about how to promote the CSR and use question-naire to collect the viewpoints of the employees for their companies promot-ing the CSR in order to analyze whether the CSR can result in obvious influence to the performance of these companies.
Literature Review Cooperation social responsibility The standards for defining the CSR in the world are still different; however, most of these standards are about the enterprises’ impacts to economy, soci-ety, politics and environment and the relation management between all stakeholders. According to the defini-tion of World Business Council for Sustainable Development (WBCSD) for the corporate social responsibility (CSR): “continuing commitment by business to behave ethically and con-tribute to economic development while improving the quality of life of the workforce and their families as well as of the local community and society at large”. The corporate social responsibil-ity working team of WBCSD classifies the coverage of the CSR into: human right, employee right, environmental protection, community participation, supplier relation, supervising (com-
pany management), stakeholder and the like. The classification method of WBCSD is to gradually extend from the internal corporate environ-ment/stakeholders to the external cor-porate environment/ stakeholders, just likes a concentric circle extending from inside to outside. The extension process does not need to completely extend from the inner ring to the outer ring; enterprises can select the desired part to do. The classification method of WBCSD does not have a fixed order. Regarding the rating standard of the CSR, the CSR rating standards of Oekom Research AG use the most comprehensive ethics standards as the determination principles, which classi-fies the CSR rating standards into three aspects, including the company’s in-fluence to individual (social sustain-ability), social and culture (culture sus-tainability) and natural environment (natural sustainability); then, the above three parts are calculated by different weighting sum to obtain the social cul-ture rating, environmental rating, and the rating of the enterprise’s responsi-bility. The CSR rating standard data of Oekom Research AG mainly obtain from the data provided by companies and the investigation results of experts, including the ratings conducted ac-cording to the data of companies’ an-nual reports, society and environments, interviews of companies’ representa-tives, examination of media, interview of independent experts, results of evaluation reports implemented by in-dependent experts for governments and public institutes, occupational labor unions, social and environment re-search institutes and consumer protec-tion groups (Leonardo, Stefania & Damiano, 2008; Becker-Olsen, Cud-more & Hill, 2006).

The International Journal of Organizational Innovation Vol 10 Num 4 April 2018
177
Regarding the CSR rating stan-dards of Taiwan, Ministry of Eco-nomic Affairs has proposed the indica-tors for evaluating the levels of the en-terprises in Taiwan implementing the CSR; the indicators include three ma-jor parts, including society, environ-ment and financial performance, where the social performance has the highest weight, 66.4%, the next is the envi-ronment performance, 20.8%, and the last is the financial performance, 12.8%. A small enterprise will also can obtain high CSR performance just by higher social participation and strictly engaging in environmental protection. The social performance is the rating item attracting most attention, which includes employee right, ethics respon-sibility, laws regulations, stakeholders, community participation, and supplier relation. Regarding environmental per-formance, the important items include environmental policies, performance management system, environmental information disclosure, and ecological effect of products and services. The financial performance includes finan-cial policies/management systems, corporate financial performance, and company management practices (Lin & Gao, 2008).
Methodology
Framework
The study cites the CSR indica-tors (social performance, environment performance, and financial perform-ance) proposed by Ministry of Eco-nomic Affairs to investigate the meth-ods and influence factors of the case steel plants in Taiwan promoting the CSR, and assumes that the three CSR performance indicators will influence the business of the steel plants.
Regarding the implementation method of the study, the study simul-taneously adopts in-depth interview and questionnaire survey to obtain the desired data from the directors and employees respectively. Regarding the in-deep interview, the study interviews 4 directors to understand how the com-pany promotes the CSR. Regarding the employees, the study collects the viewpoints of 128 employees about the company promoting the CSR, and tries to understand whether the employees consider that the promotion of the CSR is helpful for the performance of the company via the standpoint of the em-ployees. Finally, the study compares the interview result of the directors with the statistic result of the employ-ees, and combine which with each other so as to propose the conclusion and the suggestions of the study.
Interview outline
For the purpose of understanding the viewpoints of the directions about the company promoting the CSR, the study develops the following 10 ques-tions of the in-depth interview sum-mary according to social performance, environment performance, and finan-cial performance, and asks the director interviewed by us to evaluate the per-formance of the company in relation to each of the questions (very satisfied - 5 points; satisfied – 4 points; normal – 3 points; unsatisfied – 2 points; very un-satisfied – 1 point). The following questions are the in-depth interview summary. 1. How does the company protect the working right of the employees? 2. How does the company create a great working environment?

The International Journal of Organizational Innovation Vol 10 Num 4 April 2018
178
3. Do the welfare policies of the com-pany take care of the family of each employee? 4. Does the company incur any legal dispute event within 5 years? 5. Do the company take part in the community-based services or actively make a contribution to the local com-munity? 6. Does the company have a good rela-tion with the suppliers? 7. Does the company promote the pol-icy benefiting the environmental pro-tection, or promote the behavior help-ful for environmental protection? 8. Do the products of the company take the environmental protection into con-sideration in design, production and recycling? 9. What is the management style of the company? 10. How is the company’s financial performance?
Questionnaire
The study develops the question-naire of the study according to the CSR indicator proposed by Ministry of Eco-nomic Affairs, and makes the evalua-tion according to Likert Scale (very satisfied - 5 points; satisfied – 4 points; normal – 3 points; unsatisfied – 2 points; very unsatisfied – 1 point). The questions 1-17 belong social performance of the CSR, the questions 18-22 belong to the environment per-formance of the CSR, the questions 23-25 belong to the financial performance
of the CSR, and the questions 26-30 belong to the business performance of the CSR. The questions of the social performance are mainly to ask how the employees consider the company’s performances in employee right, ethics responsibility, legal regulations, stake-holders, social participation, and sup-plier relation. The questions of the en-vironment performance are to mainly ask the employees how the employees consider the company’s performances in the promotion of environmental policies, disclosure of environmental information, and ecological effect of products and services. The questions of the financial performance are to mainly ask what the employees’ viewpoints are in the financial poli-cies/management system, financial performance, and management prac-tices, etc., of the company. The ques-tions of the business performance are to ask whether the employees consider that the corporate business perform-ance, corporate image, product image and consumers’ purchase intentions, and employees’ centripetal force of the company can be better after the com-pany promotes the CSR.
Result
Interview result
1. How do the company protect the working right of the employees? The 4 directors consider that the company has protected the rights and obligations of the employees according to the regulations of Labor Standards Act; when the behaviors of the em-ployees fail to conform to the regula-tions of the company, the company will try to change the behaviors of the employees by persuasion and inter-view, which can provide more protec-

The International Journal of Organizational Innovation Vol 10 Num 4 April 2018
179
tion for the employees. Regarding the promotion, the company provides a systematic and complete assessment system, so the ground-level employees can have proper raise and assessment. The directors consider that the score of the company in the performance of protecting the rights of the employees is 4.71. 2. How do the company create a great working environment? In common departments, the sen-ior employees are willing to guide the junior employees in order to establish great interactive relation and active attitude; in the production line, the company has good environment (the company provides the rest time, takes care of the employees after the em-ployees are off-duty, and provides the sign-in system for the employees to behave themselves). Regarding the of-fice environment, the overall design of the offices and the plant houses are spacious and bright, and the company also hires the cleaners to clean the en-vironment, so the company provides excellent environment, rest time and create great working environment and quality. The interviewees consider that the score of the company in the per-formance of creating great working environment is 4.48. 3. Do the welfare policies of the company take care of the family of each employee? All 4 directors indicate that the company has tried the best to take care of all employees; for example, the company has fulfilled the responsibil-ity and morality to take care the em-ployees, and can participate in the weddings and funerals of the employ-ees; besides, the company also pro-vides the company trip and the bonus
systems. However, one of the directors also indicates that the salary paid by the company is just enough for per-sonal expense rather than the whole family. Thus, the interviewees consider that the score of the company in the performance of the welfare policies is 3.70. 4. Does the company incur any le-gal dispute event within 5 years? During the past 5 years, if the company incurs lawsuits, the legal staff of the company can always prop-erly handle all lawsuits. If the company incurs disputes with the supplies or the down- stream vendors in cooperation, the company can always solve the problems via negotiation to prevent from the following problems. There-fore, all of the interviewees provide high evaluation to the company in handling the lawsuits and dispute events. The interviewees consider that the score of the company in the per-formance of handling lawsuits and dis-putes is 4.22. 5. Do the company take part in the community-based services or actively make a contribution to the local com-munity? Two directors indicate that the company can encourage the employees to take part in the community services and achieve good interactions; in addi-tion, the company also actively joins the charity activities of Kaohsiung City. However, two directors indicate that they often saw that the company frequently participated in the reactive activities with the industry, but seldom or never saw that the company partici-pated in the community services. The interviewees consider that the score of the company in the performance of the community contribution is 3.47.

The International Journal of Organizational Innovation Vol 10 Num 4 April 2018
180
6. Does the company have a good relation with the suppliers? Three directors consider that the company and the suppliers are coop-erative partners; one of the directors considers that the company and the suppliers are not only cooperative partners, but also compete with each other. As a whole, the relation between the company and the suppliers is excel-lent. The interviewees consider that the score of the companies in the perform-ance of the relation with the suppliers is 4.73. 7. Does the company promote the policy benefiting the environmental protection, or promote the behavior helpful for environmental protection? All 4 directors indicate that the company pays a lot of attention to the environmental protection policies, and exactly implements the resource recy-cling, and total quality management (TQM), sewage treatment, planting and greening, waste recycling and the “Keep Trash Off The Ground” policy, and observes the relevant regulations of the environmental protection of the ISO, so all directors feel very satisfied. The interviewees consider that the score of the company in the perform-ance of promoting the policies and the behaviors helpful for environmental protection is 4.62. 8. Do the products of the company take the environmental protection into consideration in design, production and recycling? All 4 directors consider that the company always holds the environ-mental protection standards to imple-ment design, production and recycling in the items of the product design, pro-duction and recycling. Regarding the design, green is considered first with-
out chemical substances; regarding the production, all products adopt envi-ronmental materials; regarding the re-cycling, the company provides the waste metal recycling mechanism. It is worthy to point out that the company can always implement energy-saving and carbon-reduction policies from design, production to recycling in or-der to improve the production process. The interviewees consider the score of the company in the performance of whether the design, production and recycling conform to the environ-mental protection is 4.26, which is very close to “very satisfied”. 9. What is the management style of the company? Three of the directors indicate that the company adopts the dual sys-tem of the democratic management and group decision-making to allow all employees to express their viewpoints; in particular, to the design aspect, the company specially encourages all em-ployees to brainstorm in order to pro-vide more creative ideas. Only 1 of the directors considers that the decision-making of the company is authorita-tive, but the management method adopts the group decision-making. The interviewees consider that the score of the company in the performance of management style is 4.02. 10. How is the company’s financial performance? Two of the interviewees indicate that the financial performance of the company is not good during the past 5 years; thus, the company will more ac-tively to expand the business to in-crease the profit. 1 of the interviewees indicates that the current financial status of the company is not satisfac-tory, so it is necessary to change some

The International Journal of Organizational Innovation Vol 10 Num 4 April 2018
181
bad conditions. Only 1 of the inter-viewees indicates that the current fi-nancial status of the company is satis-factory; however, for the purpose of solving the problem of the poor finan-cial status of the company last year, all employees should exactly implement the tasks allocated by the directors. The interviewees consider that the score of the company in the financial performance is 3.41, which is just the “normal” score.
Descriptive statistics
Social performance.
The employee interviewed con-sider that the overall average perform-ance of the company in the social per-formance is 3.71, so they tend to agree the item. The top 3 questions most rec-ognized by the employees about the social performance are: “3. The com-pany keeps developing novel tech-nologies.” (M = 4.91, SD = .57), “17. The company always honestly pays the tax every year.” (M = 4.88, SD = .61), and “16. All employees of the com-pany are on the basis of fair competi-tiveness” (M = 4.79, SD = .44). The questions which the employee inter-viewed are the salary problems (M = 2.92, SD = .79); they hope that com-pany can keep giving raise. Regarding the reliability analysis, the overall reli-ability of the social performance is .901. Environment performance.
The employee interviewed con-sider that the overall average environ-mental performance of the company is 3.69, so they tend to agree the item. The top 3 questions most recognized by the employees about the environ-ment performance are: “18. The com-pany has established the department
for implementing the environmental protection policies and behaviors” (M = 3.88, SD = .56), “19. The company tries hard to promote the environ-mental policies and behaviors” (M = 3.68, SD = 49), and the third one is “22. The company is devoted to de-velop the products benefiting the envi-ronmental protection” (M = 3.61, SD = .56). Regarding the reliability analysis, the overall reliability of the environ-ment performance is .924.
Financial performance.
The employee interviewed con-sider that the overall average financial performance of the company is 3.56, so they tend to agree the item. Regard-ing the comparison order of the ques-tions, the employees interviewed most recognize “25. The financial perform-ance of the company is great” (M = 3.62, SD = .51), and the next is “24. The financial management system of the company is great” (M = 3.55, SD = .61), and the third one is “23. The fi-nancial policies of the company are great” (M = 3.50 SD = 1.39). Regard-ing the reliability analysis, the overall reliability of the financial performance is .914. Business performance.
The employee interviewed con-sider that the overall average business performance of the company is 3.74, so they tend to agree the item. Regard-ing the comparison order of the ques-tions, the employees interviewed most recognize “26. The company can better the corporate business performance by promoting the CSR.” (M = 3.89, SD = .61); the other questions are orderly “29. The company can increase the customers’ purchase intention by pro-moting the CSR.” (M = 3.81, SD = .48), “27. The company can better the

The International Journal of Organizational Innovation Vol 10 Num 4 April 2018
182
corporate image by promoting the CSR” (M = 3.76, SD = .63), “30. The company can increase the centripetal force of the employees by promoting the CSR” (M = 3.66, SD = .58), and “28. The company can better the prod-uct image by promoting the CSR” (M = 3.57, SD = .67). Regarding the reli-ability analysis, the overall reliability of the corporate business performance is .925.
Multiple Regression Analysis
The social performance can bet-ter several indicators, such as business performance, corporate image, product image and purchase intention; the envi-ronment performance can positively increase the centripetal force of the employees. According to the multi regression analysis result, if the employees inter-viewed feel that the social performance of the company is higher, the company will also have higher business per-
formance, corporate image, product image, purchase intention, and envi-ronment performance index. It means that if the company has higher per-formance in the employee right, ethics responsibility, legal regulations, stake-holders, community participation, and supplier relation, the company can be better in the above business perform-ance index (please refer to Tables 1, 2, 3, and 4). Further, if the employees interviewed consider that the environ-mental performance will increase the centripetal force of the employees. The representative of the employees inter-viewed considers that if the company can have higher performance in the environmental protection policies, en-vironmental behaviors, announcing environmental information about the company, providing the products with higher environmental protection effect, and developing more products benefit-ing environmental protection, the cen-tripetal force of the employees can be stronger (please refer to Table 5.).
Table 1. Factors To Influence Business Performance
Unstandardized Coefficients Standardized Coefficients
t Sig.
B Std. Error Beta
Constant -1.077 .712 -1.513 .143 Social perform-ance
.975 .435 .598 2.243 .034*
Environment performance
.230 .217 .218 1.058 .301
Financial per-formance
.109 .238 .097 .456 .653
R Square .583
Adjusted R Square
.555
F 28.791
Sig. .000***
Durbin-Watson 2.359 * p <.05, *** p <.000

The International Journal of Organizational Innovation Vol 10 Num 4 April 2018
183
Table 2. Factors To Influence Corporate Image
Unstandardized Coefficients Standardized Coefficients
t Sig.
B Std. Error Beta
Constant -1.761 .690 -2.551 .018 Social perform-ance
.541 .422 .472 5.313 .000***
Environment performance
-.283 .211 -.288 -1.345 .191
Financial per-formance
-.443 .231 -.423 -1.915 .067
R Square .565
Adjusted R Square
.536
F 26.056
Sig. .000***
Durbin-Watson 1.632
*** p <.000
Table 3. Factors To Influence Product Image
Unstandardized Coeffi-cients
Standardized Coefficients
t Sig.
B Std. Error Beta
Constant -2.090 .700 -2.985 .006 Social per-formance
.377 .428 .410 5.556 .000***
Environment performance
-.319 .214 -.313 -1.494 .148
Financial performance
-.474 .234 -.438 -2.023 .054
R Square .574 Adjusted R Square .546 F 27.419 Sig. .000*** Durbin-Watson 2.120
*** p <.00
Correlation analysis
According to the relevant analy-sis results, the employees interviewed consider that the social performance, environment performance and financial performance have positive and strong relation with the business performance, and the social performance, environ-ment performance, and financial per-formance are also strongly and posi-tively related to one another; in other words, if the company promotes one of
the CSR indicators, the viewpoints and generations of the employees for other CSR performances will also generate (Table 6).
Discussion
According to the result of the questionnaire survey of the study, the employees consider that the company can improve the corporate business performance, corporate image, product image and purchase intention. This

The International Journal of Organizational Innovation Vol 10 Num 4 April 2018
184
result is the same as the result of the researches of Leonardo, Stefania & Damiano (2008), Becker-Olsen, and Cudmore & Hill (2006) – the effect of an enterprise bearing the social respon-sibility is higher than its cost; the com-pany adopting the CSR can have better performance. Further, if the company emphasizes on the environment per-formance, the employees will have higher centripetal force; this result is the same as that of the research of Tur-ban & Greening (1997) – if an enter-prise can provide great and safe work-ing environments, its production will also increase. In addition, it is worthy to point out that we can understand that if an enterprise promotes one of the CSR performance indicators, the busi-ness performance and other perform-ance indicators of the enterprise will also increase; this result is similar to that of the researches of Cornell & Shapiro (1987) and Preston & O'Ban-non (1997), etc. If an enterprise can satisfy the anticipation from stake-holders, the financial performance of the enterprise can also be better; higher social performance will result in higher financial performance. However, the difference between the study and re-search of Cornell et al is that the em-ployees interviewed also consider that the social, financial and business per-formances will be increased by pro-moting the environment performance. Obviously, all items of the CSR are positively and strongly related to one another; once a company starts to in-troduce one indicators of the CSR, all aspects of the company will also be influenced. According to the in-depth inter-view of the directors, the directors in-terviewed indicate that the welfare policies, community services and fi-
nancial performance of 10 promoted CSR items are relatively weak (M < 3.71). Regarding the satisfaction of the employees interviewed in the promo-tion of the CSR, the scores 4 indicators are lower than 3.75 (social, environ-ment, financial and business perform-ance). It is obvious that the viewpoint of the directors interviewed is different from that of the employees interviewed in the promotion of the CSR; however, some directors have mentioned that the salaries are quite low; the above view-point is the same as that of the em-ployees; the question with low satisfac-tion of the employees is salary (M = 2.92). The problem of improving sal-ary involves the whole development of the economy of Taiwan, which cannot be improved in a short time; however, the result of the study seems to provide a method capable of increasing the mo-rale of employees and business per-formance without increasing salaries. The study suggests enhancing the so-cial and environment performance first, and the improvement of the other CSR indicators can also increase the morality and business performance of employees. For example, designing, producing and recycling products based on the viewpoints of environ-mental protection and green color can win not only good corporate reputation for enterprises, but also can avoid that employees are polluted toxic sub-stances when the enterprises adopt green raw materials and equipment, which can naturally increase the cen-tripetal force of employees. Alterna-tively, the enterprises can establish the departments in charge of managing and implementing environmental policies and behaviors to announce that the en-terprises try hard to make a contribu-tion to and improve the environmental protection; in this way, employees can

The International Journal of Organizational Innovation Vol 10 Num 4 April 2018
185
Table 4. Factors To Influence Customer Purchase Intention
Unstandardized Coefficients Standardized Coefficients
t Sig.
B Std. Error Beta
Constant -1.332 .558 -2.388 .025 Social per-formance
.655 .341 .577 4.854 .000***
Environment performance
.015 .170 .017 .091 .929
Financial per-formance
-.324 .187 -.335 -1.733 .096
R Square .520
Adjusted R Square
.598
F 36.475
Sig. .000***
Durbin-Watson
2.501
*** p <.000
Table 5. Factors To Influence Internal Cohesion
Unstandardized Coefficients Standardized Coefficients
t Sig.
B Std. Error Beta
Constant -.505 .556 -.910 .372 Social perform-ance
.687 .340 .466 2.023 .054
Environment performance
.377 .170 .395 2.224 .036*
Financial per-formance
.090 .186 .088 .481 .635
R Square .538
Adjusted R Square
.517
F 41.269
Sig. .000***
Durbin-Watson 1.911
* p <.05, *** p <.00
Table 6. Correlation Analysis Matrix
Environment per-formance
Financial perform-ance
Business performance
Social performance .885*** .893*** .919*** Environment per-
formance .885*** .812*** .810***
Financial perform-ance
.893*** .815*** .778***
N=128, *** p <.000

The International Journal of Organizational Innovation Vol 10 Num 4 April 2018
186
take part in the promotion of the CSR in person. In addition, the social par-ticipation of the social performance can increase not only the financial per-formance, but also can better the cor-porate image and viewpoints of differ-ent cycles in the society to the enter-prises, so it is worthy for the enter-prises to keep increasing their contri-bution to the society. For example, the enterprises can provide the motivations for the employees to participate the public community affairs; the employ-ees can participate in the community environmental protection volunteer teams, community volunteers, public-welfare beach cleansing, public- wel-fare road running, community elderly care, and donate second-hand books to nearby communities and schools, etc.
Reference
Alexander, G. J. & Bucholtz, R. A. (1978). Corporate Social Per-formance and Stock Market Per-formance. Academy of Manage-
ment Journal, 21, 479-486. Arrow, K. J. (1973). Social Responsi-
bility and Economic Efficiency. Public Policy, 21, 303-317.
Becker-Olsen, K., Cudmore, B. A., &
Hill, R. P. (2006). The Impact of Perceived Corporate Social Re-sponsibility on Consumer Behav-ior. Journal of Business Re-
search, 59 (1), 46-53. Bowen, H. R. (1953). Social Respon-
sibilities of the Businessman. New York: Harper and Brothers.
Bowman, E. H. & Haire, M. (1975). A
Strategic Posture toward Corpo-
rate Social Responsibility. Cali-fornia Management Review, 18, 49-58.
Cornell, B. & Shapiro, A. C. (1987).
Corporate Stakeholder and Cor-porate Finance. Financial Man-
agement, 16, 5-14. Fombrun, C. J., Gardberg, N. A., &
Bamett, M. L. (2000). Opportu-nity Platforms and Safety Nets: Corporate Citizenship and Repu-tational Risk. Business and Soci-
ety Review, 105, 85-106.Werther, W. & Chandler, D. (2005). Stra-tegic Corporate Social Responsi-bility as Global Brand Insurance. Business Horizons, 48, 317-324.
Hillman, A. & Keim, G. D. (2001).
Shareholder Value, Stakeholder Management, and Social Issues: What's the Bottom Line? Strate-
gic Management Journal, 22(2), 125-146.
Leonardo, B. Stefania, D. G., &
Damiano, P. (2008). Corporate Social Responsibility and corpo-rate performance: evidence from a panel of US listed companies. Applied Economics, 40(5), 541-567.
Lin, Yi-Zhun & Gao, Xi-Jun (2008).
Corporate Social Responsibility Handbook. Taipei: Common-Wealth.
McWilliams A., & Siegel, D. (2001).
Corporate social responsibility and financial performance: corre-lation or misspecification? Stra-
tegic Management Journal, 21(5), 603-609.

The International Journal of Organizational Innovation Vol 10 Num 4 April 2018
187
Porter, M. E. & Linde, C. van der. (1995). Green and Competitive; Ending the Stalemate. Harvard
Business Review, September-October, 120-135.
Preston, L. E. & O'Bannon, P. (1997).
The Corporate Social-Financial Performance Relationship. Busi-
ness and Society, 36, 419-429. Preston, L., & O’Bannon D. (1997).
The corporate social-financial performance relationship. Busi-ness and Society, 36(1), 5-31.
Ruf, B. M., Muralidhar, K., Brown, R.
M., Janney, J. J., & Paul, K. (2001). An Empirical Investiga-tion of the Relationship Between Change in Corporate Social Per-formance and Financial Perform-
ance: A Stakeholder Theory Per-spective. Journal of Business Ethics, 32, 143-156.
Simpson W.G. and Kohers T., (2002).
The Link Between Corporate So-cial and Financial Performance: Evidence from the Banking In-dustry. Journal of Business Eth-
ics, 35, 97-109. Tsoutsoura, M. (2004). Corporate So-
cial Responsibility and Financial Performance. Working Paper, University of California.
Turban, D. B. & Greening, D.W.
(1997). Corporate Social Per-formance and Organizational At-tractiveness to Prospective Em-ployees. Academy of Manage-
ment Journal, 40, 658- 672. EDITORS' NOTE: TO VIEW THE REST OF THIS ISSUE, GO TO THE LINK EN-
TITLED VOL 10 NUM 4 APRIL 2018 SECTION C. IT STARTS WITH PAGE 200.