the interpretation of classically quantified sentences: a...
TRANSCRIPT

The Interpretation of Classically Quantified Sentences:A Set-Theoretic Approach
Guy Politzera, Jean-Baptiste Van der Henstb, Claire Delle Luchec,Ira A. Noveckb
aCentre National de la Recherche Scientifique, Institut Jean-Nicod, Paris, FrancebCentre National de la Recherche Scientifique, Institut des Sciences Cognitives, Lyon, France
cUniversité Lyon II, France
Received 13 December 2003; received in revised form 22 March 2006; accepted 4 April 2006
Abstract
We present a set-theoretic model of the mental representation of classically quantified sentences (All Pare Q, Some P are Q, Some P are not Q, and No P are Q). We take inclusion, exclusion, and their negationsto be primitive concepts. We show that although these sentences are known to have a diagrammatic expres-sion (in the form of the Gergonne circles) that constitutes a semantic representation, these concepts canalso be expressed syntactically in the form of algebraic formulas. We hypothesized that the quantified sen-tences have an abstract underlying representation common to the formulas and their associated sets of dia-grams (models). We derived 9 predictions (3 semantic, 2 pragmatic, and 4 mixed) regarding people’s as-sessment of how well each of the 5 diagrams expresses the meaning of each of the quantified sentences. Wereport the results from 3 experiments using Gergonne’s (1817) circles or an adaptation of Leibniz (1903/1988) lines as external representations and show them to support the predictions.
Keywords: Psychology; Linguistics; Language understanding; Semantics; Pragmatics;Representation; Human experimentation; Logic; Knowledge representation; Quantifiers; Setdiagrams; Conversion
1. Introduction
Quantifiers are an essential component of natural and artificial languages, and conse-quently, they constitute an important topic in linguistics and in logic. In contrast, the number ofpsychological investigations of quantifier comprehension, particularly among adults, is morelimited. Although important contributions such as Moxey and Sanford’s (1993, 2000) studieshave investigated quantifiers and especially nonclassical quantifiers (e.g., few, most, many,
Cognitive Science 30 (2006) 691–723Copyright © 2006 Cognitive Science Society, Inc. All rights reserved.
Correspondence should be addressed to Guy Politzer, Centre National de la Recherche Scientifique, InstitutJean-Nicod, 1 bis avenue Lowendal, 75007 Paris, France. E-mail: [email protected]

etc.), classical Aristotelian quantifiers (all, some, and no), which are not strongly context de-pendent and whose meanings could be assumed to be easy to investigate, have not received theattention they deserve. Of course, there have been many studies of reasoning with quantifiers,for example, in syllogistic reasoning, but these generally take the meaning of quantifiers forgranted and aim to explain the overall process leading to the production or the evaluation ofconclusions. Unlike these studies of reasoning, in this work, we aimed to directly investigatethe way quantified sentences are understood. The work is inspired by a detailed analysis of thesystem of circle diagrams that is familiar to most people from their early mathematics classes.
The four Aristotelian quantified sentences—A = all P are Q, E = no P are Q, I = some P areQ, and O = some P are not Q—can be mapped onto a set of five circle diagrams defined by allthe possible combinations of two circles representing the extension of two sets P and Q. Thiswas first introduced by Gergonne (1817).1 The mapping is given in Fig. 1. From here forward,we refer to the five diagrams as OVERLAP (where the two circles intersect), SUPERSET (where Q
692 G. Politzer, J.-B. Van der Henst, C. Delle Luche, I. A. Noveck/Cognitive Science 30 (2006)
Fig. 1. The mapping of the four classical quantified sentences onto Gergonne (1817) circles.
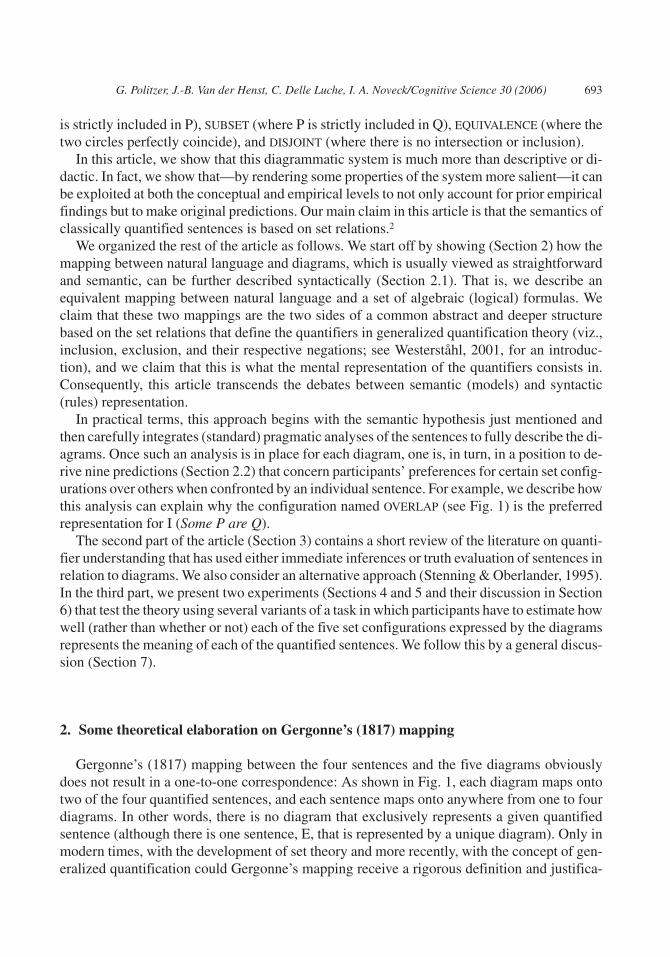
is strictly included in P), SUBSET (where P is strictly included in Q), EQUIVALENCE (where thetwo circles perfectly coincide), and DISJOINT (where there is no intersection or inclusion).
In this article, we show that this diagrammatic system is much more than descriptive or di-dactic. In fact, we show that—by rendering some properties of the system more salient—it canbe exploited at both the conceptual and empirical levels to not only account for prior empiricalfindings but to make original predictions. Our main claim in this article is that the semantics ofclassically quantified sentences is based on set relations.2
We organized the rest of the article as follows. We start off by showing (Section 2) how themapping between natural language and diagrams, which is usually viewed as straightforwardand semantic, can be further described syntactically (Section 2.1). That is, we describe anequivalent mapping between natural language and a set of algebraic (logical) formulas. Weclaim that these two mappings are the two sides of a common abstract and deeper structurebased on the set relations that define the quantifiers in generalized quantification theory (viz.,inclusion, exclusion, and their respective negations; see Westerståhl, 2001, for an introduc-tion), and we claim that this is what the mental representation of the quantifiers consists in.Consequently, this article transcends the debates between semantic (models) and syntactic(rules) representation.
In practical terms, this approach begins with the semantic hypothesis just mentioned andthen carefully integrates (standard) pragmatic analyses of the sentences to fully describe the di-agrams. Once such an analysis is in place for each diagram, one is, in turn, in a position to de-rive nine predictions (Section 2.2) that concern participants’ preferences for certain set config-urations over others when confronted by an individual sentence. For example, we describe howthis analysis can explain why the configuration named OVERLAP (see Fig. 1) is the preferredrepresentation for I (Some P are Q).
The second part of the article (Section 3) contains a short review of the literature on quanti-fier understanding that has used either immediate inferences or truth evaluation of sentences inrelation to diagrams. We also consider an alternative approach (Stenning & Oberlander, 1995).In the third part, we present two experiments (Sections 4 and 5 and their discussion in Section6) that test the theory using several variants of a task in which participants have to estimate howwell (rather than whether or not) each of the five set configurations expressed by the diagramsrepresents the meaning of each of the quantified sentences. We follow this by a general discus-sion (Section 7).
2. Some theoretical elaboration on Gergonne’s (1817) mapping
Gergonne’s (1817) mapping between the four sentences and the five diagrams obviouslydoes not result in a one-to-one correspondence: As shown in Fig. 1, each diagram maps ontotwo of the four quantified sentences, and each sentence maps onto anywhere from one to fourdiagrams. In other words, there is no diagram that exclusively represents a given quantifiedsentence (although there is one sentence, E, that is represented by a unique diagram). Only inmodern times, with the development of set theory and more recently, with the concept of gen-eralized quantification could Gergonne’s mapping receive a rigorous definition and justifica-
G. Politzer, J.-B. Van der Henst, C. Delle Luche, I. A. Noveck/Cognitive Science 30 (2006) 693

tion. From this point of view, if one considers relations between subsets P and Q of the uni-verse, then the four classical quantifiers are defined by
All P are Q: P ⊆ QNo P are Q: P ∩ Q = ∅Some P are Q: P ∩ Q ≠ ∅Some P are not Q: not (P ⊆ Q)
In the remainder of the paper, we designate these four abstract concepts by inclusion, exclu-sion, nonexclusion, and noninclusion, respectively, and we abbreviate them by the correspond-ing letters in square brackets. These formal foundations, which are part and parcel of currentlogical and semantic accounts (e.g., Chierchia & McConnell-Ginet, 2000), allow us to positGergonne’s (1817) system as a normative model for the meaning of classical quantified sen-tences. We now elaborate on Gergonne’s mapping, which enables us to make the novel predic-tions that provide a severe test of the psychological plausibility of the set relation hypothesis.
2.1. An algebraic version of Gergonne’s (1817) mapping
Consider the mapping of Fig. 1 in which several diagrams correspond to one sentence (atleast for I, O, and A sentences). We refer to the set of diagrams that correspond to an individualsentence as a family. We now ask the following question: What feature(s) are necessary to dif-ferentiate between the members of a family? We begin with the simplest case, the A sentencethat has two diagrams: In one case (SUBSET) there is a strict inclusion of P in Q, and in the othercase (EQUIVALENCE), the inclusion is nonstrict. There is no way to express this difference byusing any one of the four sentences (I is true of both diagrams, whereas O and E are false ofboth diagrams) or any combination of them. That is, as it stands, the system cannot alwayscharacterize what distinguishes two distinct members from one another. However, the differ-entiation can be obtained by introducing the converse of O (some Q are not P, noted as O′) andthe converse of A (all Q are P, noted as A′): O′ is true of SUBSET but false of EQUIVALENCE,whereas A′ is false of SUBSET but true of EQUIVALENCE; this is the only contrasting feature thatis necessary to differentiate between SUBSET and EQUIVALENCE. This leads to the notion of acharacteristic formula for each diagram: This is the conjunctive list of the sentences, direct orconverse, that are true of a diagram. In the this case, SUBSET can be defined as A & O′ & I,whereas EQUIVALENCE has the characteristic formula A & A′ & I.3 The sentence I′ need not beincluded in the formula because it is equivalent to I: There is no situation in which I′ is true andI false.
Similarly, consider now the O sentence whose family has three members (OVERLAP,SUPERSET, and DISJOINT). The first two are differentiated by the same opposition as in the pre-ceding case, the A′/O′ opposition, because some Q are not P is true in the OVERLAP case butfalse in the SUPERSET case in which all Q are P is true; this yields the characteristic formulasOVERLAP = I & O & O′ and SUPERSET = I & O & A′. The reader can verify that the third mem-ber of the O family (DISJOINT) is differentiated from the first member (OVERLAP) by the E/Icontrast and from the second member (SUPERSET) by two contrasts, E/I and A′/O′, hence thefollowing characteristic formula for DISJOINT: E & O & O′ (given that E′ is equivalent to E, it
694 G. Politzer, J.-B. Van der Henst, C. Delle Luche, I. A. Noveck/Cognitive Science 30 (2006)

need not be included). We have now identified the formulas of all five diagrams; they appear inFig. 2 in which the A′ and O′ sentences have been added to the mapping.
Each of the five diagrams has a characteristic formula that consists of a conjunction of threeterms out of six possible terms (A, A′, O, O′, I, E). As it should be, each term is invariant acrossall the members of its family; for instance, I appears in the formula of all four members of the Ifamily, and so forth.
Notice that although three symbols are sufficient to define each diagram unambiguously,they are not all necessary: Whenever a universal term appears in a formula, its particular coun-terpart (the so-called subaltern) also appears as is logically demanded within the classicalframework of quantification that postulates that the domain of universal sentences is nonemptyso that a universal sentence implies its subaltern. This is reflected in the notations of Fig. 2 in
G. Politzer, J.-B. Van der Henst, C. Delle Luche, I. A. Noveck/Cognitive Science 30 (2006) 695
Fig. 2. The mapping of the classical quantified sentences and of their converses onto Gergonne (1817) circles. A =all P are Q; A′ = all Q are P; I = some P are Q; E = no P are Q; O = some P are not Q; O′ = some Q are not P. Theconverses of I and E sentences do not appear, as they are equivalent to I and E, respectively.

which only the terms that are necessary (and sufficient) to identify a diagram are underlined,and we henceforth refer to them as primitive terms. These abridged formulas (those that con-tain only primitive terms) can be used to express the mapping in syntactic form: Instead of say-ing that A maps onto either SUBSET or EQUIVALENCE; that O maps onto either OVERLAP orSUPERSET or DISJOINT; that I maps onto either OVERLAP, or SUPERSET, or SUBSET, or EQUIVA-
LENCE; and that E maps onto DISJOINT (semantic mapping), one may equivalently use the fol-lowing expressions made of the disjunctions of the appropriate formulas (syntactic mapping),respectively:
A ⇔ A&O′ ∨ A&A′O ⇔ I&O&O′ ∨ O&A′ ∨ EI ⇔ I&O&O′ ∨ O&A′ ∨ A&O′ ∨ A&A′, and trivially,E ⇔ E
which are logical truths, as can easily be verified.4
The foregoing formulas have been derived from the diagrams, which seems to give prece-dence to the semantic description over the syntactic one; but this was done for expository rea-sons. In fact, given the set of the four basic sentences—augmented with the two converses—defined in set-theoretic terms as previously, the standard logical relations of Aristotle’s squareof opposition still obtain. Now, in this system of six sentences, if one tries to identify all thepossible “disjunctive normal forms” that are logical truths, one arrives at the four precedingformulas.5 This means that from a purely syntactic viewpoint, a term such as, for example, A,has two and only two possible occurrences: one in A&O′, the other in A&A′, and so forth. Soone can arrive at the same formulas without making use of the diagrams. Even more remark-ably, it can be shown that the set of the longest noncontradictory conjunctive sequences ofterms comprises exactly the five characteristic formulas, a result that syntactically is equiva-lent to asserting that there are only five possible relations among the two circles.6 In brief, it canbe verified that the Gergonne (1817) set relations as expanded here with the converses can beexpressed in a syntactic, as well as a semantic, form and that it generates all five characteristicformulas (or equivalently, all five diagrams). In other words, there is perfect correspondencebetween the semantic component (the diagrams) and the syntactic component (the formulas);we refer to both components taken as a whole as the Gergonne system.
It is also important to specify the relative status of the representations and systems that havebeen considered so far. We have hypothesized that quantification—considered at the concep-tual or propositional level—has a deep representation in terms of set relations, which in turnhas a “shallow” level of representation in terms of the Gergonne (1817) system in which eachabstract quantifier can be realized by one instance (for [E]) or several instances (for [A], [I] and[O]). In addition, within the Gergonne system, each instance has two versions: one syntacticand one semantic. Consequently, we do not adopt the point of view that the Gergonne relationsrelate two descriptions, one syntactic (the natural language) and the other semantic (the dia-grams). For one thing, the relation from natural language to diagrams is, as we have just seen,fairly indirect. More important, the semantic character of diagrams is defined within theGergonne system by opposition to the syntactic character of the logical formulas. Externally,diagrams are not intrinsically semantic in nature as shown by the fact that they have their own
696 G. Politzer, J.-B. Van der Henst, C. Delle Luche, I. A. Noveck/Cognitive Science 30 (2006)

syntactic description as well (the circles and their labels being primitive terms and the way tocombine them being the syntax proper).
One more remark about natural language and the Gergonne (1817) system is in order. TheGergonne diagrams are endowed with a high degree of iconicity, and it is worth wonderingwhere this transparent character comes from. As psychological investigations (which we re-view later) have shown, most people have no difficulty understanding the rationale of thegraphical representation without explanation. That the graphical representation of set theoreticconcepts such as inclusion, intersection, and exclusion are easily understood is one thing thatcan be explained straightforwardly by the analogy between the points on a closed surface andset membership; that quantifiers are as easily interpreted by diagrams is quite another thing,which can be explained, as it so happens, by the hypothesis that posits that quantifiers are setrelations of inclusion, intersection, and exclusion. Only then is the iconicity of Gergonne dia-grams understandable. In brief, the diagrammatic representation of natural language quanti-fied sentences is so intuitive that it generally is taken for granted and prevents any interrogationabout where this naturalness comes from. The set relation hypothesis answers this question,which is an important support for it. This can be investigated further in an experimental way aswe show.
Finally, we need to dispel a possible misunderstanding. As we have just seen, the theoreticalmodel can be described by the Gergonne (1817) system that has a semantic and a syntacticcomponent. Our hypothesis is situated at the deep level of the set relations that encompassesboth components and need not separate them. That individuals have an internal representationof quantifiers in the form of Gergonne diagrams (or any other sort) is an additional, more speci-fied hypothesis and to that extent, different from the one we test. This is an important point be-cause we make use of the diagrams and ask participants to match them with sentences. Anycompetence exhibited by participants in such a task need not be taken as evidence that dia-grams are an internal representation of sentences (although it is compatible with this hypothe-sis). Rather, it is designed to support the notion that the theorist’s abstract model (classicalquantifiers viewed as set relations) coincides with the participants’. That is, should participantsshow that they are proficient in interpreting the diagrams in the task, this would only be takenas evidence for the adequacy of the abstract model.
2.2. Derivation of the hypotheses
We are now in a position to derive a number of predictions. Before doing so, we point outthat any study concerned with the comprehension of quantified sentences must integrate apragmatic component to accommodate interpretive phenomena that the sentences give rise to.Logicians in the 19th century had already noticed and discussed that the two particular sen-tences I and O often receive an interpretation that excludes their universal counterparts, A andE, respectively, so that, for example, some P are Q seems to reject all P are Q, which goescounter to the logical definition of some that is compatible with all (and against the I–SUBSET
and the I–EQUIVALENCE links in Fig. 1). Only after Grice’s (1975) foundational work did thisphenomenon start to receive a coherent theoretical pragmatic explanation in terms of scalarimplicature (Horn, 1972, 1989; Levinson, 1983). In a nutshell, some and all being two itemspositioned on a quantitative scale, the use of some in an utterance implicates, by exploitation of
G. Politzer, J.-B. Van der Henst, C. Delle Luche, I. A. Noveck/Cognitive Science 30 (2006) 697
Grice’s first maxim of quantity, that the speaker is not in a position to use the stronger item all:hence, the some but not all interpretation. The same applies, mutatis mutandis, to the negativecase with some … not and no/none. Subsequently, this pragmatic analysis has been refined,and theorists in the field do not always agree on the detailed mechanism by which the scalar in-ference is produced7 and on the terminology used to designate such an inference: Some theo-rists use the expression “generalized conversational implicature” (Horn, 1972; Levinson,2000), whereas others would prefer the term explicature (Carston, 2004; Sperber & Wilson,1995). However, all theorists agree that the not all pragmatic inference is an additional compo-nent of meaning that goes beyond the linguistic (lexical) meaning of some. This minimal pro-posal is sufficient for our purposes, and we use the noncontroversial expression “scalar infer-ences” to refer to such pragmatic phenomena.
In making the hypothesis that people comprehend classical quantified sentences in accor-dance with the normative abstract, set-theoretical model, we commit ourselves to its propertiesthat we just expounded. There is a straightforward series of consequences of the five formulasin Fig. 2. Consider first the A sentence together with its two diagrams and the two formulas as-sociated with them. One may ask the question, “Do the two diagrams have the same logical sta-tus ?“ It is easy to answer in the affirmative, for A is a necessary conjunct in the characteristicformula of SUBSET (A&O′&I) and of EQUIVALENCE (A&A′&I). That is, A cannot be sup-pressed or inferred, which means that the two diagrams or their two associated formulas areequivalent realizations of the concept of inclusion. Operationally, we predict that ceterisparibus, people will accept one member of the A family (SUBSET, EQUIVALENCE) as aninstantiation of the universal affirmative quantification as readily as they accept the othermember.
Similarly, take the existential negative quantifier [O]. Two of its characteristic formulas,OVERLAP (I&O&O′) and SUPERSET (O&A′&I), have a necessary O conjunct that leads to thesame type of prediction: OVERLAP should be treated as readily as SUPERSET as an instantiationof the existential negative quantifier. However, this state of indifference between formulas isnot always the case: Take the third diagram for noninclusion [O], namely DISJOINT
(E&O&O′). In its associated characteristic formula, O is not a necessary conjunct. In fact, it isinferrable from the E conjunct; it is some kind of a by-product of the DISJOINT formula. There-fore, this diagram should be viewed as less fundamental for, or less characteristic of, the con-cept of noninclusion than the other two (OVERLAP and SUPERSET). There is, of course, an addi-tional reason that should influence any comparative evaluation of meaning for the O case: Thepragmatic component of the interpretation of the O sentence countermands the acceptance ofDISJOINT as a felicitous exemplar because the E sentence is also true of it. In brief, both the se-mantic and the pragmatic component of language act in the same direction to disqualify DIS-
JOINT as a good instantiation of the O sentence.Consider now the existential affirmative quantifier [I]. There is only one characteristic for-
mula that has a necessary I conjunct: It corresponds to OVERLAP (I&O&O′), and for this rea-son, it can be predicted that people should prefer this instantiation of nonexclusion over theother three in which I is not a necessary conjunct. However, in turn, a distinction can be madeamong these latter three due to the pragmatic component: SUBSET (A&O′&I) and EQUIVA-
LENCE (A&A′&I) have an A conjunct; therefore, their use as instantiations of [I] is counter-manded, whereas this is not the case for SUPERSET (O&A′&I), which consequently is a better
698 G. Politzer, J.-B. Van der Henst, C. Delle Luche, I. A. Noveck/Cognitive Science 30 (2006)

instantiation of [I] than SUBSET and EQUIVALENCE. In other words, both the semantic and thepragmatic components of language contribute to dismiss SUBSET and EQUIVALENCE as appro-priate representations of the I sentence: In contrast, only the semantic component contributesto exclude SUPERSET as the most appropriate representation of I. In brief, this model gives riseto nine predictions we repeat in Section 4. Before presenting experimental work devoted to thetest of these predictions, we review a number of relevant studies. As this investigation isfocused on adults, we do not review the developmental studies of the comprehension ofquantifiers.
3. A review of the literature
3.1. The main tasks
A number of tasks have been used to investigate the comprehension of classical quantifiers:One, in the Piagetian tradition (Piaget & Inhelder, 1964), consists of using materials such aschips that have dichotomic attributes (e.g., round or square and red or blue) and asking ques-tions such as “Are all the round chips blue ?” or to “make it in such a way that all the roundchips are blue,” and so forth (Bucci, 1978). A second kind of task uses factual information.This can be done either by exploiting encyclopedic knowledge, in which case participants areasked questions such as “Do all elephants have trunks?” (Noveck, 2001; Smith, 1980; see alsoMeyer, 1970) or by referring to a picture showing, for example, four clowns in a wagon andasking “Are all the clowns in the wagon?” (Hanlon, 1987; see also Brooks & Braine, 1996;Drozd, 2001). A third kind of task is the immediate inference paradigm that uses one-premisearguments. A last kind of task makes use of the Gergonne (1817) diagrams. Although the firsttwo tasks could in principle be used to test our semantic predictions, they have their own diffi-culties because in the first case, there are possible confounding variables such as number ofitems, saillance of categories, and so forth, and in the second case, world knowledge makes ithard to manipulate the abstract properties of interest.
The third kind of task (immediate inference) allows in principle a test of the semantic pre-dictions, but the relevant data have not been reported (with the exception of Fisher, 1981). Wenevertheless mention these studies because they yield unambiguous results regarding scalar in-ferences linked to particular quantifiers. In Fisher’s (1981) study (Experiment 1), participantsreceived the four sentences (of the type “[quantifier] doctors are Kuls”) and eight conclusions(the four sentences and their converses) and were instructed to indicate, for each conclusion,whether the conclusion was possibly true or necessarily false. By considering the pattern ofresponses to the eight conclusions, Fisher could infer each participant’s interpretation of eachsentence (which can thus be described in terms of our characteristic formulas).
Newstead and Griggs (1983) and Stenning and Cox (1995, 2006) have used a similar pre-sentation (but with letters of the alphabet standing for subject and predicate); the conclusionhad to be evaluated in terms of true, false or maybe/can’t tell. Evans, Handley, Harper andJohnson-Laird (1999) used the same kind of materials and asked participants in two conditionsto decide about the necessity or the possibility of the conclusion. Politzer (1990) presented pre-mises consisting of each of the four sentences followed by conclusions consisting of one of the
G. Politzer, J.-B. Van der Henst, C. Delle Luche, I. A. Noveck/Cognitive Science 30 (2006) 699
other three sentences or one of the four converse sentences and asked participants to indicatewhether the conclusion necessarily followed by responding true, false or cannot know (to-gether with a degree of certainty). Two kinds of materials were used: thematic (people’s pro-fession and their civil status particulars) and nonthematic (marbles supposed to be in two col-ors and two sizes) with similar results. The same nonthematic material was used in across-linguistic study (Politzer, 1991) that did not show significant differences across lan-guages (English and Malay).
Regarding the scalar inferences, the results are clear-cut: The predicted responses are al-ways observed; the results differ only by their frequency, which can be anywhere between 15%and 90% depending on the inference concerned (that is, between A and O, or E and I, or O andI, and in which direction) but depending also on the study, with a few important differences be-tween studies (within language) for the same inference. We do not elaborate on the question ofthe scalar inferences, which is not the main focus of this study.
All of these studies have also reported two response tendencies. One indicates that partici-pants (invalidly) endorse the converse for A as well as for O sentences about half the time(when one averages across studies). The other, which has been documented by the same stud-ies, indicates that participants refuse (incorrectly) to endorse the converses of I and E sentencesabout one fourth of the time. Stenning and Cox (1995, 2006) have shown that each trend is par-ticularly marked for one subgroup of participants. We consider these observations later.
3.2. Studies using Gergonne (1817) diagrams
For this last kind of task, we indicate first the procedures and the instructions, and then wesummarize the results. In most studies, participants are presented with a sentence and asked toidentify the diagrams that represent the sentence; this was done using abstract content, that is,letters standing for subject and predicate, with the following instructions. Select each of the al-ternatives described by the sentence (Neimark & Chapman, 1975); choose the correct dia-grams for the sentence (Griggs & Warner, 1982); choose the diagrams that are correctly (forone group) or incorrectly (for another group) described by the sentence (Newstead,1989, Ex-periment 1); and choose the diagram(s) that the sentence is true of (Stenning and Cox, 1995).
Johnson-Laird (1970) and Wason and Johnson-Laird (1972) have asked participants to sortdiagrams into two categories: those that are truthfully versus falsely described by the sentenceusing meaningful content. Erikson (1978) reported an unpublished study in which participantswere asked to draw diagrams.
Finally, Begg and Harris (1982) described two experiments, both with abstract content. Inthe first one, participants were first presented with the four sentences and the five diagrams in amatrix form and asked, for each sentence, to share 100 points among the five diagrams, givingmore points to those they felt were better interpretations. In a second experiment, each of thefour sentences were presented followed by the five diagrams with the instructions to classifythe diagrams as true, false, or indeterminate; the same participants were also presented witheach of the five diagrams and asked to decide whether each sentence was true, false, or indeter-minate.
We now summarize the findings, considering the pragmatic and the semantic predictions inturn. Pragmatically, all the studies have indicated participants’ reluctance to associate a partic-
700 G. Politzer, J.-B. Van der Henst, C. Delle Luche, I. A. Noveck/Cognitive Science 30 (2006)
ular sentence with a diagram representing universality (that is, SUBSET and EQUIVALENCE withI sentences and DISJOINT with O sentences). This occurred even in the studies in which partici-pants were instructed that some means at least one and possibly all, which attests to thestrength of the tendency to draw the scalar inferences among a part of the participants.
Regarding the semantic predictions, we summarize the findings for each sentence in turnwhenever the relevant data are available. For A sentences, there is an absence of any clear pref-erence between EQUIVALENCE and SUBSET in Neimark and Chapman’s (1975) and Fisher’s(1981) data in either direction; given Erikson’s (1978) report of a trend that is opposite to Beggand Harris’s (1982) observations, the results as a whole are compatible with an absence of pref-erence between EQUIVALENCE and SUBSET, in agreement with our semantic hypothesis. For Osentences, results are inconclusive, as the semantic hypothesis of no preference between OVER-
LAP and SUPERSET has been supported by Begg and Harris’s (1982) first experiment andNeimark and Chapman’s (1975) observations but not by Fisher’s (1981) and Johnson-Laird’s(1970). Finally, for I sentences, the hypothesized preference for OVERLAP over SUPERSET is al-ways observed.
In brief, the semantically based pattern of responses that we predict seems, by and large,supported. Notice that we have sought this pattern based on the existing literature given that toour knowledge, there have not been any proposals of this kind let alone any systematic and in-tegrated explanation for it; that is, none of the studies just reviewed makes any prediction interms of pattern of preference for the three sentences that are of interest to us or even for anyone taken individually. There is, however, one theoretical approach that is relevant post hoc toour predictions and the related observations, namely, Stenning and Oberlander’s (1995) “char-acteristic diagrams” developed in connexion with syllogistic reasoning.
3.3. Stenning and Oberlander’s (1995) characteristic diagrams
Stenning and Oberlander (1995; henceforth S&O) claimed that the abstract process of rea-soning with quantified sentences consists in the construction of “individual descriptions,”which can be implemented, inter alia, in diagrams. Given a quantified sentence with subject Pand predicate Q, an individual type is defined as an individual characterized by one of the fourcombinations of properties: P, Q; P, not Q; not P, Q; and not P, not Q. Euler’s (1768/1960) fourpairs of circles are used to represent the four sentences in a one-to-one mapping and are calledcharacteristic diagrams. The regions determined by the intersecting lines represent the indi-vidual types, and each diagram is complemented by an x mark that indicates the region thatmust exist (as opposed to regions that are contingent). Each characteristic diagram has theproperty that it represents the greater number of types of individual consistent with the sen-tence (called the maximal model). For instance, for the A sentence, EQUIVALENCE defines onlyone (common) region, but SUBSET defines two regions, and therefore, it is the maximal model.It is assumed that at the underlying abstract level, people represent the maximal model. Somestraightforward predictions follow from this assumption, which we derive shortly and compareto our predictions.
The existing studies of the interpretation of classical quantifiers have not addressed the mainquestion we raised previously, which concerns preferred interpretations. Begg and Harris’s(1982) first experiment is an exception, but only 24 participants were involved, and the meth-
G. Politzer, J.-B. Van der Henst, C. Delle Luche, I. A. Noveck/Cognitive Science 30 (2006) 701

odology was not without problems. Also, given that existing data that has been reported in theliterature were not always convergent, it is worth testing our predictions with a differentmethod so that stable effects could emerge. The aim of our experiments was to obtain more re-liable and fine-grained data on preferences. We therefore used different kinds of diagrams inthe two experiments that comprise Experiment 1 (circles vs. straight lines in Experiments 1aand 1b, respectively), followed up by control studies involving different types of contents (ab-stract vs. concrete contents) and different directions of association (from one sentence to dia-grams and from one diagram to sentences). Finally, unlike in most earlier studies, we wanted toexplore how individual differences could affect the data.
4. Experiment 1a
We have argued earlier that determining whether a diagram will be considered an appropri-ate realization of a concept will depend on the explicit presence of a primitive term in a charac-teristic formula; and that if a primitive term is explicitly present in two characteristic formulasof a sentence, the associated diagrams will be regarded as equally appropriate realizations ofthe concept. The hypothesis that the presence of a primitive term should affect the willingnessof people to recognize a diagram as the expression of the quantifier under consideration can betested by presenting the diagrams together with a quantified sentence and asking participantshow well each diagram expresses the meaning of the sentence. In brief, we aim to reveal that tocapture the meaning of the quantifier under consideration, in some predictable cases, one of itsrealizations is more fundamental than another one; whereas in other predictable cases, its real-izations are indifferent. The following nine predictions follow from our theoretical model (seeSection 2.2). Preference is symbolized by “ > ” and indifference by “ ≈.”
For A, there is one semantic prediction: (1) EQUIVALENCE ≈ SUBSET.For O, there are three predictions. Prediction (2) is semantic, and predictions (3) and (4)
have both a semantic and a pragmatic motivation:
(2) OVERLAP ≈ SUPERSET; (3) OVERLAP > DISJOINT; (4) SUPERSET > DISJOINT.
For I, there are five predictions: (5) is purely semantic; (6) and (7) join semantic and prag-matic reasons; (8) and (9) are purely pragmatic:
(5) OVERLAP > SUPERSET; (6) OVERLAP > EQUIVALENCE; (7) OVERLAP > SUBSET;(8) SUPERSET > EQUIVALENCE; (9) SUPERSET > SUBSET.8
These predictions can be compared to those derived from S&O’s (1995) model that predictsthat to be a maximal model, the preferred diagram should have the greater number of regions.For parity of treatment, we add predictions linked to scalar inferences as we have done for ourown model. To help comparison, we keep the same numbering as we make predictions for theirmodel.
For the A sentence, the maximal model is SUBSET so that the prediction is
(1) SUBSET > EQUIVALENCE.
702 G. Politzer, J.-B. Van der Henst, C. Delle Luche, I. A. Noveck/Cognitive Science 30 (2006)

For the O sentence, the maximal model is OVERLAP so that the predictions are (2) OVERLAP
> SUPERSET and (3) OVERLAP > DISJOINT. (One can add (4) SUPERSET > DISJOINT for purelypragmatic reasons).
For the I sentence, the maximal model is OVERLAP so that the predictions are (5) OVERLAP >SUPERSET; (6) OVERLAP > EQUIVALENCE; (7) OVERLAP > SUBSET.
Then, we have (8) SUPERSET > EQUIVALENCE because the former has more regions (besidespragmatic reasons). Next, SUPERSET and SUBSET have the same number of regions but (9)SUPERSET > SUBSET is expected for pragmatic reasons. Finally (10), SUBSET > EQUIVALENCE
because the former has more regions.In summary, comparing our predictions with S&O’s (1995) predictions, (1) for A and (2) for
O, differ; predictions (3) to (9) are identical; prediction (10) is specific to S&O.
4.1. Method
4.1.1. ParticipantsA total of 35 undergraduate psychology students from the University of Lyon II participated
in this experiment. All participants were French native speakers.
4.1.2. Materials and designWe presented participants with a booklet containing 20 stimuli (i.e., each quantified state-
ment was presented five times) each provided on a separate page. A stimulus was composed ofa quantified sentence, presented on the top of the page, and of the five diagrams displayed ver-tically below the sentence. We provided a 7-point scale ranging from –3 (not at all) to +3 (verymuch) on the right of each diagram for participants to express their estimate of how well the di-agram expressed the meaning of the sentence. For all statements, the subject and predicate al-ways referred to letters, respectively, A and Z (i.e., all A are Z, etc.). We presented each of thefour quantified sentences (A, E, I, O) five times in five different blocks. (The French quantifierscorresponding to all, none, some, and some … not were, respectively, tous, aucun, certains andcertains … ne … pas). We ordered the stimuli in such way that two identical sentences neveroccurred consecutively and that I and O sentences never occurred consecutively more thanonce for each participant. We adopted two presentation orders.
4.1.3. ProcedureOn the first page of the booklet, participants received the instructions. We provided partici-
pants with the four quantified sentences they would have to consider and told them that themeaning of those sentences could be illustrated by combining two circles. Thus, we presentedthem with the five possible diagrams. We explicitly indicated that a sentence could possibly becompatible with several diagrams.
The task consisted in assessing how well each of the five diagrams expressed the meaning ofthe sentence. Participants had to answer by circling a position on the 7-point scale. The nega-tive endpoint of the scale (i.e., –3) was labelled “not at all” (French pas du tout), whereas thepositive endpoint (i.e. +3) was labelled “very much” (French tout à fait). We tested participantsin groups of about 15 to 20 individuals.
G. Politzer, J.-B. Van der Henst, C. Delle Luche, I. A. Noveck/Cognitive Science 30 (2006) 703
4.2. Results and discussion
Before analyzing the data, we consider what counts as a correct or an incorrect answer andexplain how we use the rating scale. We consider an answer “erroneous” for any one given trialwhen the answer is incompatible with a logical or a pragmatic interpretation of the sentence.For instance, considering DISJOINT as a proper representation of A is an error. However, con-sidering SUBSET as an inappropriate representation of I was not regarded as an error becausesuch a choice is pragmatically justified. We decided to eliminate participants who erred onmore than 20% of the trials.9 Four participants had a percentage of erroneous answers thatranged between 30% and 45%. Such values are high enough to indicate that the task had notbeen understood or taken seriously. The remaining 31 participants were below 20% (the meanfrequency of errors was 5.9% and the median 4%). There were strong between-participant dif-ferences; the top 20% committed no error, and the bottom 20% were responsible for one half ofall the errors (with a mean error rate of 11.8%). We say more in the discussion regarding theseerrors and individual differences.
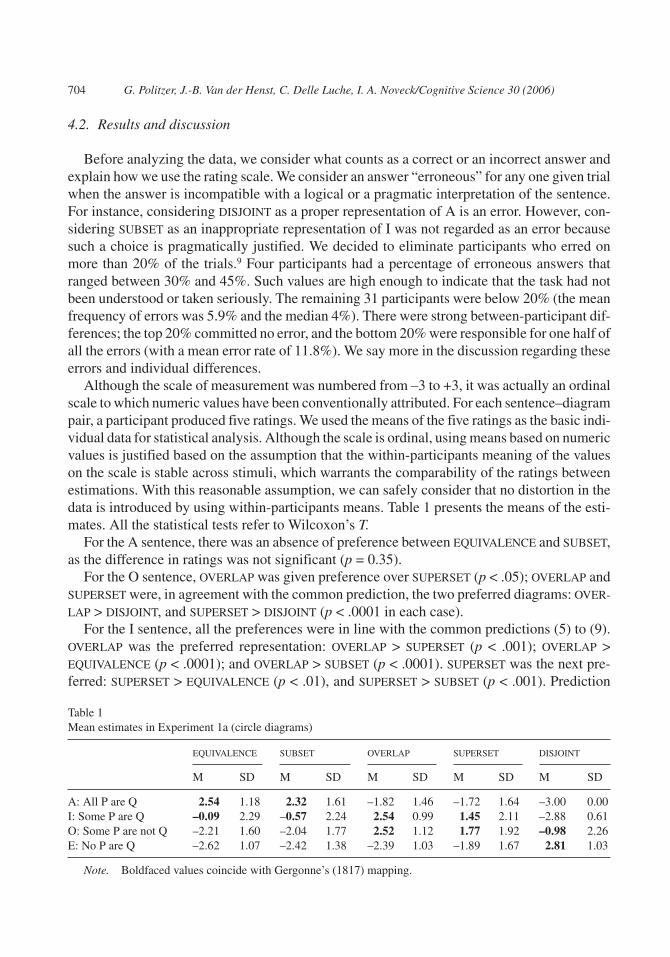
Although the scale of measurement was numbered from –3 to +3, it was actually an ordinalscale to which numeric values have been conventionally attributed. For each sentence–diagrampair, a participant produced five ratings. We used the means of the five ratings as the basic indi-vidual data for statistical analysis. Although the scale is ordinal, using means based on numericvalues is justified based on the assumption that the within-participants meaning of the valueson the scale is stable across stimuli, which warrants the comparability of the ratings betweenestimations. With this reasonable assumption, we can safely consider that no distortion in thedata is introduced by using within-participants means. Table 1 presents the means of the esti-mates. All the statistical tests refer to Wilcoxon’s T.
For the A sentence, there was an absence of preference between EQUIVALENCE and SUBSET,as the difference in ratings was not significant (p = 0.35).
For the O sentence, OVERLAP was given preference over SUPERSET (p < .05); OVERLAP andSUPERSET were, in agreement with the common prediction, the two preferred diagrams: OVER-
LAP > DISJOINT, and SUPERSET > DISJOINT (p < .0001 in each case).For the I sentence, all the preferences were in line with the common predictions (5) to (9).
OVERLAP was the preferred representation: OVERLAP > SUPERSET (p < .001); OVERLAP >EQUIVALENCE (p < .0001); and OVERLAP > SUBSET (p < .0001). SUPERSET was the next pre-ferred: SUPERSET > EQUIVALENCE (p < .01), and SUPERSET > SUBSET (p < .001). Prediction
704 G. Politzer, J.-B. Van der Henst, C. Delle Luche, I. A. Noveck/Cognitive Science 30 (2006)
Table 1Mean estimates in Experiment 1a (circle diagrams)
EQUIVALENCE SUBSET OVERLAP SUPERSET DISJOINT
M SD M SD M SD M SD M SD
A: All P are Q 2.54 1.18 2.32 1.61 –1.82 1.46 –1.72 1.64 –3.00 0.00I: Some P are Q –0.09 2.29 –0.57 2.24 2.54 0.99 1.45 2.11 –2.88 0.61O: Some P are not Q –2.21 1.60 –2.04 1.77 2.52 1.12 1.77 1.92 –0.98 2.26E: No P are Q –2.62 1.07 –2.42 1.38 –2.39 1.03 –1.89 1.67 2.81 1.03
Note. Boldfaced values coincide with Gergonne’s (1817) mapping.
(10) was not supported, as the difference between the SUBSET and EQUIVALENCE ratings wasnot significant (p = .182).
Finally, participants most clearly estimated DISJOINT as a near perfect and unique represen-tation of E.
Overall, the two models fared fairly well, as most of their predictions were satisfied. How-ever, for purpose of comparison, the findings are not completely determinate because consid-ering the two contradictory semantic predictions (1) and (2), our model was correct for (1) butincorrect for (2), whereas the reverse obtains for S&O’s (1995) model. More data are needed.Furthermore, methodologically, it might be objected that using circle diagrams to assess themeaning of expressions of quantity faces a problem of validity: Participants might be respon-sive to diagrams’ specific features that are significant for the visual system but orthogonal tological and semantic value. Results will be all the more robust, as they will resist variation inessential visual characteristics of the diagrams such as dimensionality: Gergonne (1817) dia-grams exploit two-dimensional representation, but what about one-dimensional representa-tion?
To take this objection into account, in a twin experiment, we used another set of five dia-grams—five line diagrams adapted from Leibniz’s (1903/1980) lines (see Fig. 2A in AppendixA), which are no longer bidimensional like Gergonne (1817) circles but unidimensional. Asthe two are logically isomorphic to each other, consistent results would speak against visual ef-fects and support the validity of our method. On the contrary, important and chaotic differenceswould detract from the validity of the method, whereas differences in the results that could besystematically correlated with visual features could help identify such visual effects withoutdetracting from the validity of the method. Finally, if one believes that manipulating the draw-ings’ dimensionality is not essential, then the experiment will be useful as a replication study.
5. Experiment 1b
5.1. Design and procedure
The design and the procedure were practically identical to Experiment 1a; that is, partici-pants received the material in booklet form, and they acted as their own controls. The only dif-ference is that we replaced each circle diagram with a line diagram. Participants were 31 stu-dents from the same pool as in the first experiment.
5.2. Results
As in the previous experiment, we discarded participants who answered erroneously morethan 20% of the time (i.e., 5 participants). Overall, the error rates and the characteristics of theirdistribution over participants were similar to those observed in Experiment 1a (mean percent-age of errors was 6.5%; median was 5.5%). Table 2 presents the means of the estimates.
For the A sentence, contrary to the previous experiment, participants preferred EQUIVA-
LENCE to SUBSET (p < .01), which differs from our prediction of indifference and furthermore,is in the opposite direction to S&O’s (1995) prediction.
G. Politzer, J.-B. Van der Henst, C. Delle Luche, I. A. Noveck/Cognitive Science 30 (2006) 705
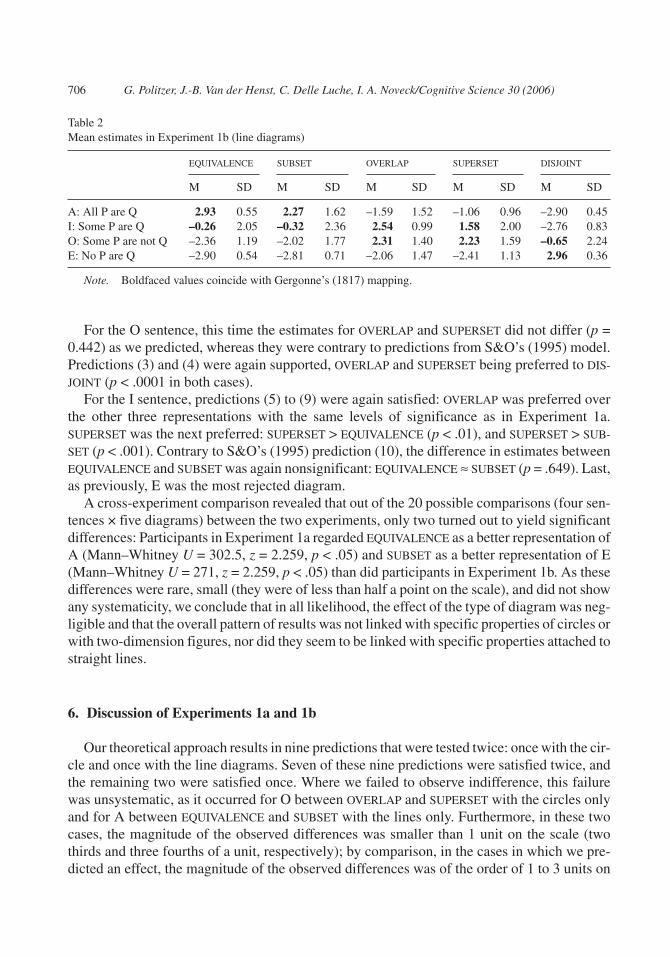
For the O sentence, this time the estimates for OVERLAP and SUPERSET did not differ (p =0.442) as we predicted, whereas they were contrary to predictions from S&O’s (1995) model.Predictions (3) and (4) were again supported, OVERLAP and SUPERSET being preferred to DIS-
JOINT (p < .0001 in both cases).For the I sentence, predictions (5) to (9) were again satisfied: OVERLAP was preferred over
the other three representations with the same levels of significance as in Experiment 1a.SUPERSET was the next preferred: SUPERSET > EQUIVALENCE (p < .01), and SUPERSET > SUB-
SET (p < .001). Contrary to S&O’s (1995) prediction (10), the difference in estimates betweenEQUIVALENCE and SUBSET was again nonsignificant: EQUIVALENCE ≈ SUBSET (p = .649). Last,as previously, E was the most rejected diagram.
A cross-experiment comparison revealed that out of the 20 possible comparisons (four sen-tences × five diagrams) between the two experiments, only two turned out to yield significantdifferences: Participants in Experiment 1a regarded EQUIVALENCE as a better representation ofA (Mann–Whitney U = 302.5, z = 2.259, p < .05) and SUBSET as a better representation of E(Mann–Whitney U = 271, z = 2.259, p < .05) than did participants in Experiment 1b. As thesedifferences were rare, small (they were of less than half a point on the scale), and did not showany systematicity, we conclude that in all likelihood, the effect of the type of diagram was neg-ligible and that the overall pattern of results was not linked with specific properties of circles orwith two-dimension figures, nor did they seem to be linked with specific properties attached tostraight lines.
6. Discussion of Experiments 1a and 1b
Our theoretical approach results in nine predictions that were tested twice: once with the cir-cle and once with the line diagrams. Seven of these nine predictions were satisfied twice, andthe remaining two were satisfied once. Where we failed to observe indifference, this failurewas unsystematic, as it occurred for O between OVERLAP and SUPERSET with the circles onlyand for A between EQUIVALENCE and SUBSET with the lines only. Furthermore, in these twocases, the magnitude of the observed differences was smaller than 1 unit on the scale (twothirds and three fourths of a unit, respectively); by comparison, in the cases in which we pre-dicted an effect, the magnitude of the observed differences was of the order of 1 to 3 units on
706 G. Politzer, J.-B. Van der Henst, C. Delle Luche, I. A. Noveck/Cognitive Science 30 (2006)
Table 2Mean estimates in Experiment 1b (line diagrams)
EQUIVALENCE SUBSET OVERLAP SUPERSET DISJOINT
M SD M SD M SD M SD M SD
A: All P are Q 2.93 0.55 2.27 1.62 –1.59 1.52 –1.06 0.96 –2.90 0.45I: Some P are Q –0.26 2.05 –0.32 2.36 2.54 0.99 1.58 2.00 –2.76 0.83O: Some P are not Q –2.36 1.19 –2.02 1.77 2.31 1.40 2.23 1.59 –0.65 2.24E: No P are Q –2.90 0.54 –2.81 0.71 –2.06 1.47 –2.41 1.13 2.96 0.36
Note. Boldfaced values coincide with Gergonne’s (1817) mapping.

the scale: Such a small effect in size relativizes very much the importance of the two negativefindings. By comparison, the predictions made by S&O’s (1995) approach were not so suc-cessful because its prediction (1) for A was not supported either with the circles or with thelines. The same obtains for the I sentence.
Although the overall results seem to nicely support our predictions, we consider two issuesrelevant to the generality of the results, namely, individual differences and the validity of thetask; these issues might also bear on the comparison between the two theoretical approaches.
6.1. Individual differences
We have presented the results aggregated over all the participants. In principle, this is objec-tionable, as there might be some subgroups of participants who behave differently. Quite sometime ago, Newell (1981) warned against what he called the “fixed method fallacy.” In an inves-tigation of the immediate inference task, Stenning (2002) and Stenning and Cox (1995, 2006)have cogently demonstrated the interest of analyzing data in terms of patterns of error. Accord-ingly, we determine whether such patterns of answers exist in our data and then check that theratings that we have predicted and observed are not due to effects in opposite directions (e.g.,the result of cancelling out two extremes in the case of equal ratings).
6.1.1. Processing errorsWe now investigate in some detail why some participants commit more errors than others.
The two results showing a slight, unpredicted (by us) but also labile difference may suggestthat additional factors to those postulated by both models and whose effect is smaller in sizecan also be involved in the processing of quantified sentences. There is one factor that might af-fect the encoding of the diagrams and lead to possible errors, namely, the symmetry status ex-hibited by the constituents (i.e., the two circles or the two lines) of the diagram. For some dia-grams, the two constituents are symmetrical, that is, they can be replaced by each other: This isthe case for EQUIVALENCE, OVERLAP, and DISJOINT; the other two diagrams (SUBSET andSUPERSET) are asymmetrical so that their constituents cannot be exchanged without turning thediagram into its counterpart (SUBSET into SUPERSET and vice versa). Now, one important logi-cal property is linked to this graphical property. Whenever the subject and predicate are ex-changed, the sentence’s truth status is invariant for symmetrical diagrams but not for asymmet-rical diagrams. More precisely, for the EQUIVALENCE, OVERLAP, and DISJOINT diagrams, A′and O′ sentences keep the truth value of their A and O counterparts just as E′ and I′ sentencesdo with respect to E and I. In contrast, for the SUBSET and SUPERSET diagrams, whereas E′ andI′ still keep the same truth value as their counterparts E and I when converted, A′ and O′ changetruth value when converted. This property enables one to formulate the following hypothesis.As occasional lapses of attention or drop in motivation seem unavoidable among some partici-pants, one likely result of this is confusion in working memory between subject and predicate(recall that the sentences had letters as subject and predicate). This will have no consequencefor symmetrical diagrams whatever the sentence that is being processed or for asymmetricaldiagrams with E and I sentences. In contrast, for asymmetrical diagrams with A and O sen-tences, this will result in a systematic error. In brief, according to this analysis, we can expect asystematic increase in errors for the evaluation of A and O sentences applied to SUBSET and
G. Politzer, J.-B. Van der Henst, C. Delle Luche, I. A. Noveck/Cognitive Science 30 (2006) 707

SUPERSET diagrams. Interestingly, a few studies of A sentences using a sentence–picture veri-fication task or a truth judgment task have reported a greater rate of errors for SUPERSET (Just,1974, Experiment 3; Meyer, 1970) or for both SUPERSET and SUBSET (Just, 1974, Experiment1; Revlin & Leirer, 1980) than for the other set relations. In fact, this kind of error is pervasivein all the relevant literature; it is sometimes much higher than for the other relations and canreach 25%. In our experiments, the confusion of subject and predicate will result in a propor-tion of evaluations of SUPERSET for O sentences to be negative instead of positive, contributingto a decrease in the value of SUPERSET relative to OVERLAP. Similarly, a proportion of evalua-tions of SUBSET for A sentences will be negative, which will contribute to a decrease in thevalue of SUBSET relative to EQUIVALENCE.
As large-scale errors are documented for SUBSET and SUPERSET relations, it becomes essen-tial to reexamine these results in this respect and consider how the data in Tables 1 and 2 mightbe affected. Two sentence–diagram pairs are of special interest with regard to the semantic pre-dictions, namely, all P are Q for SUBSET and some P are not Q for SUPERSET. Because they arelogically true, they should be evaluated positively; therefore, processing errors will turn theirratings into negative values. This remark provides the rationale that we followed to identifyand eliminate these errors. The precise criterion that we used is detailed in Appendix B.
Table 3 presents the mean estimates for A and O sentences after correction. For the fourcomparisons, the estimates were very close, and even the OVERLAP versus SUPERSET differ-ence for the O sentence with the circles was nonsignificant (Wilcoxon test, p > .05). We con-clude that the failure to confirm two of the semantic predictions with one of the two types of di-agrams (the indifference between SUBSET and EQUIVALENCE for A with the line diagrams andthe indifference between OVERLAP and SUPERSET for O with the circles) was, in all likelihood,due to errors that were attributable to a subgroup of participants. These participants did nothave erratic behavior overall (unlike those whose answers were discarded right away becausethey could give nonlogical answers to any of the 20 sentence–diagram pairs). Rather, their rat-ings were inconsistent within the series of five ratings (in accordance with the criterion definedin Appendix B), specifically for the SUBSET and SUPERSET diagrams. It is important to under-stand that this inconsistency does not refer to fluctuations in the strength of positive ratings butin sheer changes in the polarity of the rating from positive to negative. These participants com-mitted these processing errors much more often than other participants did. In sum, when only
708 G. Politzer, J.-B. Van der Henst, C. Delle Luche, I. A. Noveck/Cognitive Science 30 (2006)
Table 3Mean estimates after correction for processing errors for Experiments 1a (circles)and 1b (lines)
EQUIVALENCE SUBSET
A: All P are QCircles 2.55 2.61Lines 2.97 2.76
OVERLAP SUPERSET
O: Some P are not QCircles 2.56 2.27Lines 2.41 2.57
those participants who were consistent on their ratings were considered, the two exceptions tothe predictions vanished. Actually, the fact that these two unexpected absences of differencewere not consistent across experiments already points to a nonessential factor that had a lim-ited impact.
A last result concerns the I sentence. The difference in mean ratings between SUBSET andEQUIVALENCE was in the direction opposite to the one expected based on prediction (10) forthe circles (–.68 vs. +.28) and for the lines (–1.05 vs. –.88).
The error analysis has one important consequence for the comparison between the two theo-ries because the two contentious comparisons now follow our predictions, which confirms ourapproach but disconfirms S&O’s (1995). However, before drawing a firm conclusion, there isone additional precaution to take.
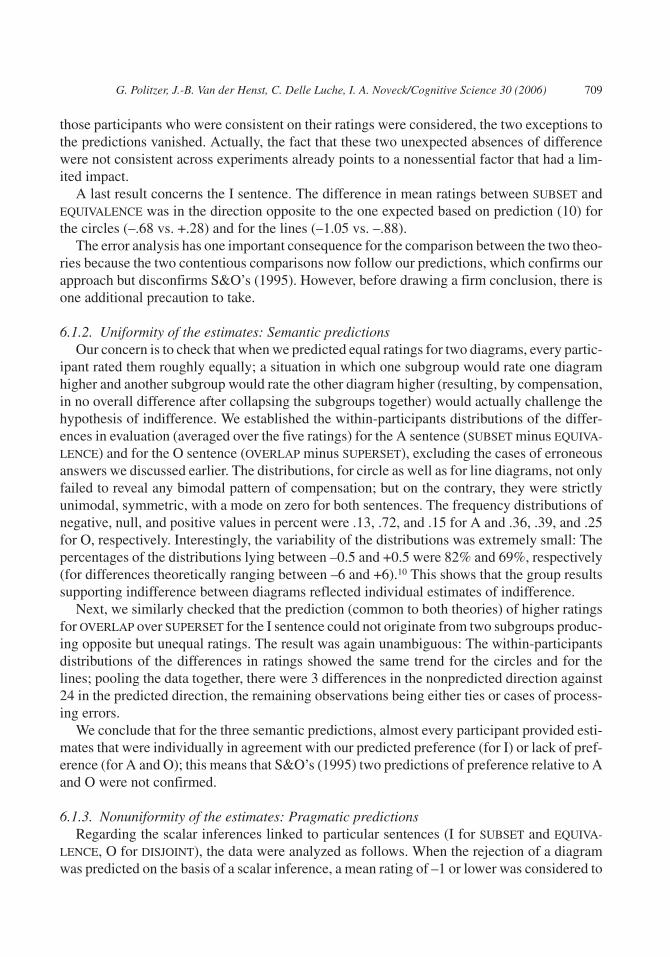
6.1.2. Uniformity of the estimates: Semantic predictionsOur concern is to check that when we predicted equal ratings for two diagrams, every partic-
ipant rated them roughly equally; a situation in which one subgroup would rate one diagramhigher and another subgroup would rate the other diagram higher (resulting, by compensation,in no overall difference after collapsing the subgroups together) would actually challenge thehypothesis of indifference. We established the within-participants distributions of the differ-ences in evaluation (averaged over the five ratings) for the A sentence (SUBSET minus EQUIVA-
LENCE) and for the O sentence (OVERLAP minus SUPERSET), excluding the cases of erroneousanswers we discussed earlier. The distributions, for circle as well as for line diagrams, not onlyfailed to reveal any bimodal pattern of compensation; but on the contrary, they were strictlyunimodal, symmetric, with a mode on zero for both sentences. The frequency distributions ofnegative, null, and positive values in percent were .13, .72, and .15 for A and .36, .39, and .25for O, respectively. Interestingly, the variability of the distributions was extremely small: Thepercentages of the distributions lying between –0.5 and +0.5 were 82% and 69%, respectively(for differences theoretically ranging between –6 and +6).10 This shows that the group resultssupporting indifference between diagrams reflected individual estimates of indifference.
Next, we similarly checked that the prediction (common to both theories) of higher ratingsfor OVERLAP over SUPERSET for the I sentence could not originate from two subgroups produc-ing opposite but unequal ratings. The result was again unambiguous: The within-participantsdistributions of the differences in ratings showed the same trend for the circles and for thelines; pooling the data together, there were 3 differences in the nonpredicted direction against24 in the predicted direction, the remaining observations being either ties or cases of process-ing errors.
We conclude that for the three semantic predictions, almost every participant provided esti-mates that were individually in agreement with our predicted preference (for I) or lack of pref-erence (for A and O); this means that S&O’s (1995) two predictions of preference relative to Aand O were not confirmed.
6.1.3. Nonuniformity of the estimates: Pragmatic predictionsRegarding the scalar inferences linked to particular sentences (I for SUBSET and EQUIVA-
LENCE, O for DISJOINT), the data were analyzed as follows. When the rejection of a diagramwas predicted on the basis of a scalar inference, a mean rating of –1 or lower was considered to
G. Politzer, J.-B. Van der Henst, C. Delle Luche, I. A. Noveck/Cognitive Science 30 (2006) 709
indicate this pragmatic response, a mean rating of +1 or higher indicated the absence of scalarinference, whereas a rating in the midscale (between –1 and +1) indicated indeterminacy. Wecompared the frequencies of ratings defined by this partition (scalar inference present, absent,indeterminate) for each of the three sentence–diagram pairings. Across participants, for eachpairing, the scalar inference was drawn about two thirds of the time. With respect to individualdifferences, we considered that a participant was consistent in drawing the scalar inferencewhenever he or she did so on at least two of the three pairings and on the third one, he or she ei-ther also made a scalar inference, or it was undetermined. These participants constituted onehalf of the sample. A similar criterion, mutatis mutandis, was taken to define those who did notmake a scalar inference: They constituted 21% of the sample. The remaining 30% were unde-cided: They gave either two undetermined ratings or three different ratings. Although these re-sults taken globally were in agreement with the literature reviewed, the individual distributionhas seldom been found in the same literature.
6.2. The validity of the diagram task
6.2.1. To what extent is the inference task relevant?We mentioned earlier that participants tend to convert A and O sentences and to omit con-
version of E and I sentences with the immediate inference task. However, this trend did not ap-pear in our task. This raises the following question: Does the absence of these trends indicate afailure on the part of the diagram task to reveal a semantic phenomenon? If so, this could lenddoubt to the validity of the diagram task. We argue that on the contrary, it is the immediate in-ference task whose validity is questionable for studying the interpretation of quantifiers. Inother words, both conversion tendencies could be regarded as evidence of nonlogical interpre-tations and against both our hypothesis and S&O’s (1995). We believe, however, that the twokinds of nonlogical conclusions have a pragmatic origin linked to the immediate inferencetask; that is, they do not stem from the semantics of quantifiers proper.
We consider an immediate inference task that requires an evaluation stemming from all Pare Q. A correct answer requires that participants be aware that all Q are P may be true or false.This essentially is a test of metacognitive abilities. Across their life span, people encounter nu-merous instances of A sentences that may be of the following two types:
1. In one, the sentence all P are Q can be envisaged in a context in which there are instancesof Q that are not P so that A is compatible with O′ (some Q are not P) but not with A′ (all Q areP). For example, consider the sentence all dogs are animals. Considering the existence of ani-mals that are not dogs leads to suppressing the first disjunct in the formula for [A]: A&A′ ∨A&O′.
2. In the other type of interpretation, all P are Q can be envisaged in a context where thereare no instances of Q that are not P so that A is compatible with A′ (but not with O′). This lattercase tends to be relatively frequent because of the common cases in which the predicate can beapplied only to the subject set for presuppositional or definitional reasons. In such contexts, theconverse A′ is consistent with the direct A sentence; for example, all the children were below 5years of age is typical of this kind of use that seems pervasive in daily communication of regu-
710 G. Politzer, J.-B. Van der Henst, C. Delle Luche, I. A. Noveck/Cognitive Science 30 (2006)
lations or descriptions. This leads to suppressing the second disjunct in the formula for [A]:A&A′ ∨ A&O′.
With high metacognitive abilities, participants are aware of these two contradictory possi-bilities (either through implicit learning or through formal learning); this means that they neednot process the premise and conclusion at any depth, as they possess a metarule of the type « allP are Q does not mean the same as all Q are P ». With lower metacognitive abilities, peoplehave to process the premise (all P are Q) and the conclusion (all Q are P), ideally as A&A′ ∨A&O′ and A′&A ∨ A′&O, respectively. If, for the reasons just mentioned, only the firstdisjunct remains in each case, they will provide an answer that indicates that the inferencefollows.
The preceding applies to O sentences as well. A similar analysis can be performed, mutatismutandis, where [O] can be construed in such a way that one of the disjuncts in the formulawill be missing. In the interest of space limitations, we do not present this analysis here.
Whereas we have characterized the origin of the conversion of A and O sentences aspragmatic (by referring in general to encyclopedic knowledge) and as being compounded byprocessing load, we regard the reluctance to convert I and E sentences as pragmatic in itsmore narrow sense, that is, in relation to language and more specifically to grammar. Unlikethe case of A and O sentences, world knowledge does not separate contexts in which theconverse is true and others in which it is false: For I and E, the conversion is always valid.This should facilitate the metacognitive awareness of the validity: Indeed, participants cor-rectly accepted the conversion three fourths of the time. Again, we must consider the case ofthose who were not aware of this conversion’s validity and consider how they interpretedand carried out the task.
A psycholinguistic point of view suggests an answer based on the role of the grammaticalsubject and predicate in relation with the concepts of topic and focus (for a review, see Gundel& Fretheim, 2004). The exchange between subject and predicate is likely to suggest a changein topic (as opposed to focus): Asserting some Q are P instead of some P are Q may definitelyalter the point of an argument so that participants (even among those who are aware of theirlogical equivalence) may be reluctant to accept the inference of I to I′ and E to E′. Participantswho represent the task as an inquiry about common sense reasoning (rather than about formallogic) are likely to be sensitive to such pragmatic determinants of sentence comprehension(Politzer, 1997, 2004a; Politzer & Macchi, 2000). In summary, the inference task requiresmore processing than just a semantic appreciation of the quantified sentences; the task often al-lows for a range of interpretations. This undermines the validity of the immediate inferencetask as a way of determining the fundamental meaning of quantified sentences.
To what extent does one find conversions in the diagram task? This question is important be-cause one might want to know whether or not conversion can be identified as a semantic phe-nomenon. If so, then one would want to know if there was evidence of conversion in our experi-ments.
Conversion of the A sentence can be understood as either (a) conversion by addition inwhich any one of the two sets P and Q is included in the other, in which case SUPERSET is addedto SUBSET and EQUIVALENCE; or as (b) conversion by elimination in which there is no strict in-clusion, in which case SUBSET is eliminated, and only EQUIVALENCE remains. The diagram
G. Politzer, J.-B. Van der Henst, C. Delle Luche, I. A. Noveck/Cognitive Science 30 (2006) 711
task can easily identify such configurations by inspecting the choice of these two sets of dia-grams for the A sentence.
Although using a very conservative criterion as an indication for conversion by addition (anaverage rating ≥ +1 on each of the three diagrams), we found only 1 case out of 57 that sup-ported this pattern. Taking a similar criterion for conversion by elimination (an average rating≥ +1 on EQUIVALENCE together with an average rating ≤ 0 on both SUPERSET and SUBSET, wefound again only 1 case out of 57. For the O sentence, for which conversion can also be under-stood in the same two ways, we found ratings indicating that three participants converted byaddition and two by elimination, with similar conservative criteria. Overall, we found 7 casesof conversion (2 for A and 5 for O) out of 228 (57 × 4) judgements, that is, 3%.
Not surprisingly, one finds few cases of invalid conversion of semantic origin with the dia-gram task. In contrast, the immediate inference task is beset by invalid conversion stemmingfrom pragmatic enrichments; this task reveals itself a weak test for determining the semanticsof quantifiers.
6.2.2. Scope of the hypothesis: The concrete caseOne might wonder whether the findings generalize beyond abstract sentences. To answer
this question, the circle task was administered with concrete materials, replacing the subject(A) and the predicate (Z) of the sentences with nouns of professions (e.g., doctors) or socialstatus (e.g., bachelors) or physical characteristics (e.g., bearded men); we labeled the dia-grams accordingly with nouns instead of letters. A total of 26 students served as partici-pants, with a procedure identical to that of Experiments 1a and 1b in which none had partici-pated. The results were strikingly similar. Five participants again committed more than 20%of errors and we discarded them. The application of the foregoing error analysis led us toidentify another three participants who gave erroneous answers specifically located on SUB-
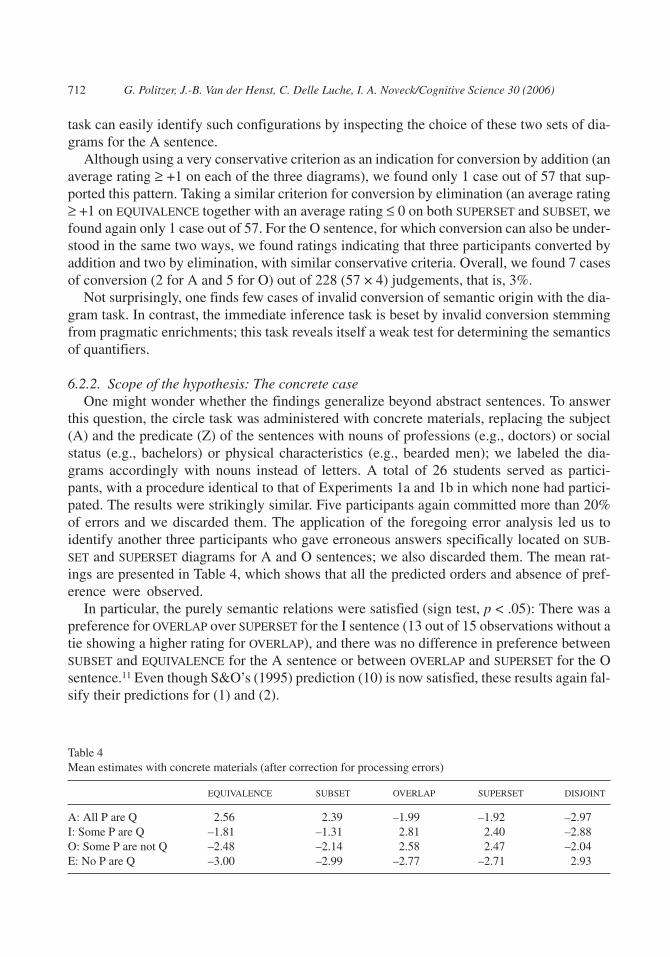
SET and SUPERSET diagrams for A and O sentences; we also discarded them. The mean rat-ings are presented in Table 4, which shows that all the predicted orders and absence of pref-erence were observed.
In particular, the purely semantic relations were satisfied (sign test, p < .05): There was apreference for OVERLAP over SUPERSET for the I sentence (13 out of 15 observations without atie showing a higher rating for OVERLAP), and there was no difference in preference betweenSUBSET and EQUIVALENCE for the A sentence or between OVERLAP and SUPERSET for the Osentence.11 Even though S&O’s (1995) prediction (10) is now satisfied, these results again fal-sify their predictions for (1) and (2).
712 G. Politzer, J.-B. Van der Henst, C. Delle Luche, I. A. Noveck/Cognitive Science 30 (2006)
Table 4Mean estimates with concrete materials (after correction for processing errors)
EQUIVALENCE SUBSET OVERLAP SUPERSET DISJOINT
A: All P are Q 2.56 2.39 –1.99 –1.92 –2.97I: Some P are Q –1.81 –1.31 2.81 2.40 –2.88O: Some P are not Q –2.48 –2.14 2.58 2.47 –2.04E: No P are Q –3.00 –2.99 –2.77 –2.71 2.93
6.2.3. The nature of the taskIt might be the case that in asking to estimate the aptness of the diagrams to express the sen-
tence, we compelled participants to carry out an ambiguous task. That is, there could be twoconstruals of the task from the participants’ viewpoint: (a) the sentence being true, to what ex-tent does the diagram represent it?, and (b) the diagram representing the actual situation of in-terest, is the sentence true of it? Our theoretical analysis led us to regard the Gergonne (1817)relations as reversible, that is, whenever there is a link between a sentence and a diagram, thislink can be read in both directions: A diagram (or its formula) is one of the possible realizationsof the concept associated to the sentence, whereas the sentence is one of the possible expres-sions that are true of the diagram. Consequently, we do not think that any slant toward one in-terpretation of the task or the other should affect the validity of the results, as both elicit the par-ticipants’ judgment of semantic equivalence between sentences and diagrams.12
To ascertain that the participants’ semantic judgment was not affected by the direction of thepresentation (from sentence to diagram), we conducted a control experiment from diagram tosentence with the same materials (using circle and line diagrams) in which, following each dia-gram on each page of the booklets, we asked the participants (who were 150 students from thesame pool that served in the previous experiments) the logically classic question, that is,whether the sentence was true of the diagram, to be answered by yes or no. The percentage oftrue answers for each sentence–diagram pair for 123 participants (that is, after eliminatingthose who were incorrect more that 20% of the time, with the same criterion as earlier) were inremarkable agreement with the preceding results. The semantically based predictions were re-produced identically with the same pattern of results, and all the pragmatically based predic-tions were satisfied. In brief, the diagram-to-sentence question format strikingly reproducedall the trends and differences of interest observed with the sentence-to-diagram questionformat.
The type of errors that occurred in Experiments 1a and 1b was observed, possibly with evengreater frequency (for instance, for SUPERSET, in which A includes Z, up to 15% of the partici-pants judged all A are Z to be true). We carried out an analysis based on the same rationale aswe described previously: We performed an analysis based on data obtained from the partici-pants who were not subject to committing such processing errors on the two pairings of maininterest, namely, A SUBSET or O SUPERSET. These were identified after we eliminated thosewho committed an error on A SUPERSET or O SUBSET or both (because they are the most likelyto have had difficulty with A SUBSET or O SUPERSET). There remained 83 participants. Wecompared the percentages of true answers using sign tests at the level of .05. The prediction ofindifference (between SUBSET and EQUIVALENCE) was satisfied for the A sentence with circlesand lines; it was also satisfied (between SUPERSET and OVERLAP) for the O sentence with thelines but not with the circles (for which OVERLAP was preferred to SUPERSET, which this timeconformed to S&O’s [1995] prediction). This is the only result that is at variance with the cor-rected results obtained in the sentence-to-diagram format of Experiments 1a and 1b. In fact,throughout this study, the result of the comparison between OVERLAP and SUPERSET for O withthe circles seemed to oscillate between disconfirmation (uncorrected data of Experiment 1a,corrected data of this diagram-to-sentence experiment) and confirmation (corrected data ofExperiment 1a and concrete materials), whereas it has provided perfect confirmation with thelines in all the data sets; this speaks in favor of our hypothesis but raises the question of what is
G. Politzer, J.-B. Van der Henst, C. Delle Luche, I. A. Noveck/Cognitive Science 30 (2006) 713

specific in this unique interaction between O sentence and circle representation, a question thatfurther experimentation will be necessary to answer. Finally, for the I sentence, the frequencyof true evaluations of SUBSET was almost equal to that of EQUIVALENCE with the circles (37%and 38%, respectively), but it was significantly higher with the lines (54% against 30%, p <.01, MacNemar test for change).
In summary, both question formats generally trigger and capture the same cognitive activity,namely, judging the fit between a set-theoretic concept and several of its instances: Our investi-gations yielded the same results when participants were required to determine the extent towhich a diagram exemplifies a given concept well or to judge whether a concept correctly ap-plies to a given diagram. However, the sentence-to-diagram format has the added advantage ofproviding a graded answer that enables one to perform a fine-grained analysis leading to theobservation of the individual errors of treatment. This in turn allows the identification of thesource of the few apparent discrepancies between predictions and observations.
7. General discussion
In this work, we proposed that in agreement with the theory of generalized quantifiers, peo-ple mentally represent the four classically quantified sentences in set-theoretic terms; that is,each sentential symbol occurs in a number of characteristic formulas (or equivalently, is true ofa number of diagrams), which yields, as is well known, one representation for E, two for A,three for O, and four for I. However, due to the implication relations from A to I and from E toO, these numbers reduce to one (for I) or two (for O) preferred representations followed by lesspreferred representations defined on the basis of pragmatic principles. The model proposedhas received strong support from the results of these experiments. We have compared ourmodel with the S&O (1995) model and clearly found that ours makes better predictions. Thepredictions have been tested on five occasions, that is, with two types of diagrams in two exper-iments (sentence to diagram, diagram to sentence) and with the circles in one experiment (con-crete sentences). After correction for errors, the preference orders and the frequencies ofchoice support our semantic predictions every time for the A sentence and (with one excep-tion) for the O sentence. On the contrary, S&O’s model consistently failed to get support for A,and it was supported only once for O. This model, admittedly, is more simple; also, it is morefalsifiable because it makes one additional prediction for I. However, this prediction was sup-ported only twice out of the five tests.
The view that a quantifier has a basic, necessary, and sufficient semantic component that canthen be augmented by pragmatic information is already widely accepted: We do not claim thatthe pragmatic results that we report are new, whether theoretically or empirically, nor that thethree semantic effects have never been observed before. On the contrary, the review of the liter-ature that we have presented foreshadows these observations. Rather, our claim is that no the-ory has been proposed so far that can predict or explain, as we have done, the semantic resultsand that no theoretical approach has attempted an integration of the semantics and thepragmatics of the comprehension of quantified sentences of the kind we offer. Take, for exam-ple, the preference for OVERLAP over SUPERSET to represent I sentences. Although consistentlypresent in the data, no one has tried to explain it as we do here. Another more important result
714 G. Politzer, J.-B. Van der Henst, C. Delle Luche, I. A. Noveck/Cognitive Science 30 (2006)
concerns the indifference between SUBSET and EQUIVALENCE for A sentences, which has oftenbeen observed but never explained. It is important because it sheds new light on the thornyquestion of the conversion of A sentences.
In effect, the conversion of A propositions has been frequently described (see Begg &Denny, 1969; Revlin & Leirer, 1980; and studies of immediate inference). We believe that theview that [A] is represented by SUBSET while it may be represented by EQUIVALENCE as a lim-iting case is normatively incorrect and descriptively wrong. It is not necessarily illicit to as-sume that the A sentence is symmetric: The inference A′ may be pragmatically invited. How-ever, our approach suggests that it would be mistaken to assume that in contrast to theEQUIVALENCE interpretation, the correct interpretation of the A sentence is SUBSET. This is nomore and no less licit than the EQUIVALENCE interpretation: The SUBSET interpretation also re-sults from an additional assumption, an O′ assumption this time, which may have various ori-gins such as a scalar inference, a presupposition, or a definition. It should be clear that the cor-rect literal meaning of the A sentence encompasses both EQUIVALENCE and SUBSET so that theA sentence can be described as indeterminate between the two disjuncts of the formula A&A′∨ A&O′. One of the components A′ or O′ may be suppressed by contextual assumptions. In thefirst case, there is strict inclusion, and in the second case, apparent conversion. That is, there isno representational process that leads an individual to a converse, but there is a pragmaticmechanism that may lead to this result if the context dictates that A′ is the case (or O′ not thecase). Finally, there are true errors due to lapse of attention or excess load in working memorythat may lead the individual to exchange the subject and the predicate and result in a converseindeterminate representation A&A′ ∨ A′&O.
In addition to the phenomena on which we have been focused in this study (summarized inthe nine predictions), there are other semantic effects that are worth considering post hoc. Forthe universal sentences, when a diagram is evaluated negatively, there is a very clean-cut trendin the values of the ratings that applies to all the data that have been reported. For the E sen-tence, EQUIVALENCE and SUBSET were rated more negatively than OVERLAP and SUPERSET.Similarly for the A sentence, DISJOINT was rated more negatively (and very much more so)than were OVERLAP and SUPERSET. This defines 6 inequalities (4 for E and 2 for A). They arealways satisfied for Experiments 1a, 1b, and their concrete replication (18 inequalities). A sim-ilar trend obtains for the diagram-to-sentence experiment in which the percentages of falsejudgments were also higher for these diagrams (10 out of 12 inequalities are satisfied). This ex-tremely robust phenomenon requires an explanation, which we propose along the followinglines. Consider the E sentence first: EQUIVALENCE and SUBSET are not models of E (no), andthey are models of A (all); however, OVERLAP and SUPERSET, which are not models of E, aremodels of O (some not). That the first two are viewed as worst representations of no than arethe last two suggests that OVERLAP and SUPERSET act as situations that exhibit individuals(some P that are not Q) that are still compatible with the target sentence E, unlike theexceptionless situations of EQUIVALENCE and SUBSET in which no such individuals exist (all Pare Q). The same applies, mutatis mutandis, to the diagrams evaluated as not representative ofthe A sentence: DISJOINT offers no individuals P as candidates to be Q, as none of them are;whereas OVERLAP and SUPERSET, which are models of I, offer such cases (some P are Q). Inbrief, this phenomenon illustrates again that psychological truth operates by degree: Psycho-logically, some models are “more true” than others. People are sensitive to the existence (and
G. Politzer, J.-B. Van der Henst, C. Delle Luche, I. A. Noveck/Cognitive Science 30 (2006) 715

possibly the number) of cases in the nonmodels of the sentence that are compatible with it. Theworst models of the sentence (or the best of the negated sentence) are those for which there areno such cases; models that have such cases are regarded as less remote representations of thesentence.
This hypothesis can explain in turn data pertaining to immediate inferences: In every study,the falsity of the inference from A to E or from E to A has been recognized more accurately(and with greater certainty when data are available) than are the inferences between A and Oand between E and I in both directions. In other words, people are better at evaluating contrarypropositions than they are at evaluating contradictory propositions, and we suggest that this re-flects the property of representational distance between models that we have uncovered, themodels of A and E being farther apart from each other than they are from some of the models ofI or O. In sum, this semantic approach has allowed us not only to predict three relations be-tween models in terms of goodness of representation; it allows the description of more rela-tions in terms of “badness” of representation.
To conclude, we summarize the novelty of our model and findings in contrast with estab-lished knowledge. Although Gergonne’s (1817) mapping between sentences and diagrams hasalready been used to study the meaning of classically quantified sentences, this has been doneon intuitive bases and has not been justified; we offer this justification by appealing to general-ized quantifier theory that defines the four quantified sentences in terms of relations betweentwo sets. The standard mapping exhibits the well-known ambiguity of the sentences but doesnot reveal its origin: We characterize this origin in terms of two converse sentences and offer acomprehensive mapping that accommodates these sentences, allowing the explicit representa-tion of the source of the ambiguity. Although the foregoing representation is diagrammatic, weprovide an entirely independent equivalent formulation of it in terms of logical formulas,which constitutes a syntactic formalism with respect to which the diagrammatic representationcan be viewed as a semantic counterpart. We consider these two formalisms as two variants ofone single deeper abstract system of relations between two sets, which we posit as a psycho-logical model for the representation of quantified sentences. From one of the subsystems (thealgebraic formalism), we derive predictions in terms of preferred representations that we testvia the other subsystem (the diagrams). There are three purely semantic, novel predictions(whereas another two join pragmatic considerations to the semantic analysis, and yet anotherfour are made in accordance with standard Gricean, 1975, analysis). Focusing on the three se-mantic predictions that concern the some, all, and some … not sentences, one can reanalyze theexperimental literature and find data in their favor (although such predictions have never beenmade). The three reported experiments confirm the novel semantic predictions (as well as theother predictions).
Notes
1. The five Gergonne (1817) diagrams are often called, and confused with, Euler (1768/1960) circles. In Appendix A, we give a brief historical note that aims to correct thesomewhat erratic common denominations of set diagrams.
716 G. Politzer, J.-B. Van der Henst, C. Delle Luche, I. A. Noveck/Cognitive Science 30 (2006)
2. As becomes clear later, in this article, we do not test and are not committed to the notionthat people have internal representations in the form of Gergonne (1817) diagrams.
3. In writing these expressions, we now use the letters A, A′, I, O, E, and E′ as sententialconstants of logical formulas to be distinguished from abbreviations of natural languagesentences.
4. The proof exploits the fact that expressions such as A∨O, I∨O, and E∨I are tautologies.5. Here is the gist of an informal proof: Any other conjunction of two or more symbols that
contains A results in a contradiction (such as A&O, A&E) or in a simplification chang-ing A&I into A.
6. An informal proof can be outlined with an example. Take the symbol E: It can be ob-served that the longest, noncontradictory, conjunctive expression that it is possible towrite in conjunction with it is E&O&O′ (hence, one of the five formulas). This is be-cause all conjunctions such as E&A, E&A′, and E&I are contradictions so that there re-mains only E&O and E&O′, which can be conjoined into E&O&O′. A similar situationobtains for the other symbols.
7. For two diverging views, see Levinson (2000) and Sperber and Wilson (1995); and forsome experimental work on the topic, see Noveck (2001), Noveck and Posada (2003),Bott and Noveck (2004), and Noveck (2004).
8. For E, we also predict that DISJOINT will be the preferred diagram, but this prediction istrivial because DISJOINT is the only diagram compatible with E and does not really fol-low from our theoretical account that can be tested when several diagrams are compati-ble with a given statement.
9. A close examination of their pattern of answers shows that those errors were systematicwithin a given sentence–diagram pair; most of the time, they occurred on at least four ofthe five trials. Also, the absolute values of the ratings was generally high, that is, no par-ticipants were discarded because they gave an unusually high number of –1 ratings tologically correct sentence–diagram pairings; this could just have reflected a conserva-tive use of the scale to convey a judgment of inappropriateness, not necessarily one offalsehood.
10. To help appraise the significance of this result, a participant who would consistentlygive the highest rating to one diagram (+3) and the lowest to the other (–3) would have adifferential score of +6.
11. Comparison of Tables 1 and 4 shows that the majority of the values are close but thatthere are cases in which the values differ by an order of magnitude of about 1 point onthe scale. These cases coincide either with the SUBSET or SUPERSET columns and reflectthe correction for errors or with the pragmatically countermanded positive answers.This latter case is interesting, as the data observed with the concrete materials alwayscorresponded to a shift to a negative value or to a more negative value than with the ab-stract materials. It so appears that participants were more inclined to draw the scalar in-ference with the concrete sentences than they were with the abstract sentences, presum-ably because the former but not necessarily the latter suggested that the literal meaningis optimally relevant.
12. One example might be helpful: Given the sentence this is a rectangle, people might beasked to which extent each of three rectangles whose length to width ratios are, respec-
G. Politzer, J.-B. Van der Henst, C. Delle Luche, I. A. Noveck/Cognitive Science 30 (2006) 717
tively, 20, 3, and 1, are good instances. Conversely, given the same rectangles, peoplemight be asked to say whether the sentence is true or false of each figure. Whichever theinterpretation of the question in any of the two ways, an individual who believes that asquare is not a rectangle (or is an inappropriate example of a rectangle) will rate thesquare negatively in the first case and answer “false” in the second case. What is impor-tant is that naïve individuals be given a way to express their judgment of semantic con-gruence between the sentence and the diagram.
Acknowledgments
We thank Keith Stenning for very helpful comments on previous versions of this article.
References
Begg, I., & Denny, J. P. (1969). Empirical reconciliation of atmosphere and conversion interpretations of syllogisticreasoning errors. Journal of Experimental Psychology, 81, 351–354.
Begg, I., & Harris, G. (1982). On the interpretation of syllogisms. Journal of Verbal Learning and Verbal Behavior,21, 595–620.
Bochenski, I. M. (1970). A history of formal logic. New York: Chelsea Publishing Co.Bott, L., & Noveck, I. A. (2004). Some utterances are underinformative: The onset and time course of scalar infer-
ences. Journal of Memory and Language, 51, 437–457.Brooks, P. J., & Braine, M. D. S. (1996). What do children know about the universal quantifiers all and each? Cog-
nition, 60, 235–268.Bucci, W. (1978). The interpretation of universal affirmative propositions. Cognition, 6, 55–77.Carston, R. (2004). Relevance theory and the saying/implicating distinction. In L. R. Horn & G. Ward (Eds.), The
handbook of pragmatics (pp. 633–656). Oxford, England: Blackwell.Chierchia, G., & McConnell-Ginet, S. (2000). Meaning and grammar. An introduction to semantics. Cambridge,
MA: MIT Press.Drozd, K. F. (2001). Children’s weak interpretations of universally quantified questions. In M. Bowerman & S. C.
Levinson (Eds.), Language acquisition and conceptual development (pp. 340–376). Cambridge, England: Cam-bridge University Press.
Erickson, J. R. (1978). Research on syllogistic reasoning. In R. Revlin & R. E. Mayer (Eds.), Human reasoning (pp.39–50). Washington, DC: Winston.
Euler, L. (1960). Lettres à une Princesse d’Allemagne sur divers sujets de physique et de philosophie [Letters to aprincess of Germany on various subjects in physics and philosophy] (Vol. 11, A. Speiser, Ed.). Zurich: OrellFüssli. (Original work published 1768)
Evans, J. St. B. T., Handley, S. J., Harper, C. N. J., & Johnson-laird, P. N. (1999). Reasoning about necessity andpossibility: A test of the mental model theory of deduction. Journal of Experimental Psychology: Learning,Memory, and Cognition, 25, 1495–1513.
Fisher, D. L. (1981). A three-factor model of syllogistic reasoning: The study of isolable stages. Memory and Cog-nition, 9, 496–514.
Gergonne, J. (1817). Essai de dialectique rationnelle. [Essay on rational dialectic]. Annales de MathématiquesPures et Appliquées, 7, 189–228.
Grice, H. P. (1975). Logic and conversation. In P. Cole & J. L. Morgan (Eds.), Syntax and semantics: Vol 3. Speechacts (pp. 41–58). New York: Academic.
Griggs, R. A., & Warner, S. A. (1982). Processing artificial set inclusion relations: Educing the appropriate schema.Journal of Experimental Psychology: Learning, Memory and Cognition, 8, 51–65.
718 G. Politzer, J.-B. Van der Henst, C. Delle Luche, I. A. Noveck/Cognitive Science 30 (2006)
Gundel, J. K., & Fretheim, T. (2004). Topic and focus. In L. N. Horn & G. Ward (Eds.), The handbook of pragmatics(pp. 175–196). Oxford, England: Blackwell.
Hanlon, C. C. (1987). Acquisition of set-relational quantifiers in early childhood. Genetic, Social and General Psy-chology Monographs, 113, 215–264.
Horn, L. R. (1972). On the semantic properties of logical operators in English. Bloomington: Indiana UniversityLinguistics Club.
Horn, L. R. (1989). A natural history of negation. Chicago: University of Chicago Press.Johnson-Laird, P. N. (1970). The interpretation of quantified sentences. In G. B. Flores d’Arçais & W. J. M. Levelt
(Eds.), Advances in psycholinguistics (pp. 347–372). Amsterdam: North-Holland.Just, M. A. (1974). Comprehending quantified sentences: The relation between sentence-picture and semantic
memory verification. Cognitive Psychology, 6, 216–236.Leibniz, G. W. (1988). Opuscules et fragments inédits [Opuscula and unpublished fragments]. Hildesheim, Ger-
many: Georg Olms Verlag. (Original work published 1903)Levinson, S. C. (1983). Pragmatics. Cambridge, England: Cambridge University Press.Levinson, S. C. (2000). Presumptive meanings. Cambridge, MA: MIT Press.Meyer, D. E. (1970). On the representation and retrieval of stored semantic information. Cognitive Psychology, 1,
242–300.Moxey, L. M., & Sanford, A. J. (1993). Communicating quantities. Hove, England: Lawrence Erlbaum Associates,
Inc.Moxey, L. M., & Sanford, A. J. (2000). Communicating quantities: A review of psycholinguistic evidence of how
expressions determine perspectives. Applied Cognitive Psychology, 14, 237–255.Neimark, E. D., & Chapman, R. H. (1975). Development of the comprehension of logical quantifiers. In R. J.
Falmagne (Ed.), Reasoning: Representation and process in children and adults (pp. 135–151). Hillsdale, NJ:Lawrence Erlbaum Associates, Inc.
Newell, A. (1981). Reasoning, problem solving and decision processes: The problem space as a fundamental cate-gory. In R. Nickerson (Ed.), Attention and performance (Vol. 8, pp. 693–718). Hillsdale, NJ: Lawrence ErlbaumAssociates, Inc.
Newstead, S. E. (1989). Interpretational errors in syllogistic reasoning. Journal of Memory and Language, 28,78–91.
Newstead, S. E., & Griggs, R. A. (1983). Drawing inferences from quantified statements: A study of the square ofopposition. Journal of Verbal Learning and Verbal Behavior, 22, 535–546.
Noveck, I. A. (2001). When children are more logical than adults: Investigations of scalar implicature. Cognition,78, 165–188.
Noveck, I. (2004). Pragmatic inferences related to logical terms. In I. A. Noveck & D. Sperber (Eds.), Experimentalpragmatics (pp. 301–321). Basingstoke, England: Palgrave.
Noveck, I. A., & Posada, A. (2003). Characterizing the time course of an implicature: An evoked potentials study.Brain and Language, 85, 203–210.
Piaget, J., & Inhelder, B. (1964). The early growth of logic in the child: Classification and seriation. London:Routledge & Kegan Paul.
Politzer, G. (1990). Immediate deduction between quantified sentences. In K. J. Gilhooly, M. T. G. Keane, R. H.Logie, & G. Erdos (Eds.), Lines of thinking. Reflections on the psychology of thought (pp.85–97). London:Wiley.
Politzer, G. (1991). Comparison of deductive abilities across language. Journal of Cross-Cultural Psychology, 22,389–402.
Politzer, G. (1997). Rationality and pragmatics. Current Psychology of Cognition/Cahiers de Psychologie Cogni-tive, 16, 190–195.
Politzer, G. (2004a). Reasoning, judgement and pragmatics. In I. N. Noveck & D. Sperber (Eds.), Experimentalpragmatics (pp. 94–115). Basingstoke, England: Palgrave.
Politzer, G. (2004b). Some precursors of current theories of syllogistic reasoning. In K. Manktelow & M.-C. Chung(Eds.), Psychology of reasoning: Theoretical and historical perspectives (pp. 213–240). Hove, England: Psy-chology Press.
Politzer, G., & Macchi, L. (2000). Reasoning and pragmatics. Mind and Society, 1, 73–93.
G. Politzer, J.-B. Van der Henst, C. Delle Luche, I. A. Noveck/Cognitive Science 30 (2006) 719

Revlin, R., & Leirer, V. O. (1980). Understanding quantified categorical expressions. Memory & Cognition, 8,447–458.
Scholz, H. (1961). Concise history of logic. New York: Philosophical Library. (Original work published 1931)Smith, C. L. (1980). Quantifiers and question answering in young children. Journal of Experimental Child Psychol-
ogy, 30, 191–205.Sperber, D., & Wilson, D. (1995). Relevance: Communication and cognition (2nd ed.). London: Blackwell.Stenning, K. (2002). Seeing reason: Image and language in learning to think. Oxford, England: Oxford University
Press.Stenning, K., & Cox, R. (1995). Attitudes to logical independence: Traits in quantifier interpretation. In J. D. Moore
& J. F. Lehman (Eds.), Proceedings of the Seventeenth Conference of the Cognitive Science Society (pp.742–747). Mahwah, NJ: Lawrence Erlbaum Associates, Inc.
Stenning, K., & Cox, R. (in press). Reconnecting interpretation to reasoning through individual differences.Quarterly Journal of Experimental Psychology.
Stenning, K., & Oberlander, J. (1995). A cognitive theory of graphical and linguistic reasoning: Logic and imple-mentation. Cognitive Science, 19, 97–140.
Stenning, K., & Yule, P. (1997). Image and language in human reasoning: A syllogistic illustration. Cognitive Psy-chology, 34, 109–159.
Venn, J. (1971). Symbolic logic. Bronx, NY: Chelsea Pub. Co. (Original work published 1886)Wason, P. C., & Johnson-Laird, P. N. (1972). Psychology of reasoning. Structure and content. London: Batsford.Westerståhl, D. (2001). Quantifiers. In L. Goble (Ed.), The Blackwell guide to philosophical logic (pp. 437–460).
Oxford, England: Blackwell.Wetherick, N. E. (1993). Psychology and syllogistic reasoning: Further considerations. Philosophical Psychology,
6, 423–440.
Appendix A. Historical Background of Set Diagrams
The systematic use of diagrams to represent classical quantified sentences is generally asso-ciated with Euler’s (1768/1960) name, but in fact, it dates back to Leibniz (1903/1988), about acentury earlier. Bochenski (1970) mentions that Alstedt (Alstedius) used diagrams as early as1614. According to Scholz (1931/1961), their use can be found even earlier (in 1584) in thewritings of Giulio Pace (Julius Pacius) who interestingly does not present them as a novelty.Leibniz and Euler have defined the same circle diagrams and made essentially the same use ofthem: To each of the four Aristotelian subject–predicate sentences, A = all P are Q, E = no Pare Q, I = some P are Q, and O = some P are not Q, they associated one and only one diagram(see Fig. 1A). In addition, Leibniz also defined another kind of diagram, the line diagrams (Fig.2A), which are isomorphic to the circle diagrams.
Such diagrams were designed to help solve categorical syllogisms; their usage can be quali-fied as figurative in the sense that they were only graphical tools to help mentally encode thepremises and to illustrate the conclusion of the syllogism. Furthermore, Leibniz (1903/1988)and Euler (1768/1960) diagrams make sense with regard to the specific syllogism that they areillustrating but are not suited to exhibit the meaning of the quantified sentences in general: In-deed, the conventions applied to label the various parts of the diagrams, even though intuitivelyappealing, lead to incoherence. Consider the representation of the I sentence some P are Q inwhich the label P indicates, as it should be, the existence of a region common to P and Q. Con-sider now the representation of the O sentence some P are not Q: The same convention cor-rectly indicates the existence of a region of P outside Q. However, this leads to the unfortunate
720 G. Politzer, J.-B. Van der Henst, C. Delle Luche, I. A. Noveck/Cognitive Science 30 (2006)
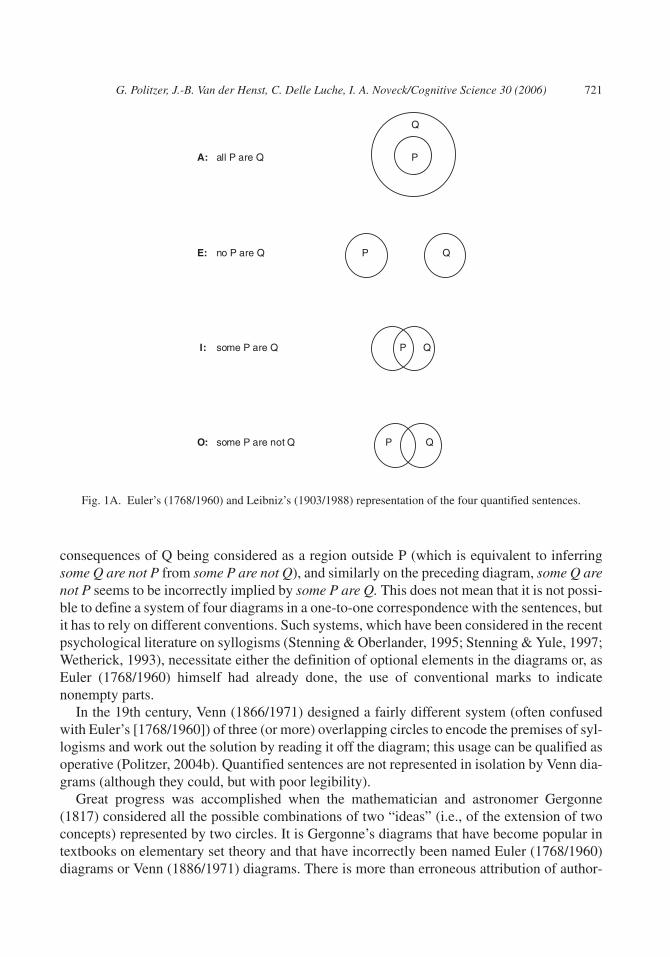
consequences of Q being considered as a region outside P (which is equivalent to inferringsome Q are not P from some P are not Q), and similarly on the preceding diagram, some Q arenot P seems to be incorrectly implied by some P are Q. This does not mean that it is not possi-ble to define a system of four diagrams in a one-to-one correspondence with the sentences, butit has to rely on different conventions. Such systems, which have been considered in the recentpsychological literature on syllogisms (Stenning & Oberlander, 1995; Stenning & Yule, 1997;Wetherick, 1993), necessitate either the definition of optional elements in the diagrams or, asEuler (1768/1960) himself had already done, the use of conventional marks to indicatenonempty parts.
In the 19th century, Venn (1866/1971) designed a fairly different system (often confusedwith Euler’s [1768/1960]) of three (or more) overlapping circles to encode the premises of syl-logisms and work out the solution by reading it off the diagram; this usage can be qualified asoperative (Politzer, 2004b). Quantified sentences are not represented in isolation by Venn dia-grams (although they could, but with poor legibility).
Great progress was accomplished when the mathematician and astronomer Gergonne(1817) considered all the possible combinations of two “ideas” (i.e., of the extension of twoconcepts) represented by two circles. It is Gergonne’s diagrams that have become popular intextbooks on elementary set theory and that have incorrectly been named Euler (1768/1960)diagrams or Venn (1886/1971) diagrams. There is more than erroneous attribution of author-
G. Politzer, J.-B. Van der Henst, C. Delle Luche, I. A. Noveck/Cognitive Science 30 (2006) 721
Fig. 1A. Euler’s (1768/1960) and Leibniz’s (1903/1988) representation of the four quantified sentences.

ship in this denomination: It is also unfortunate because as we have seen, although the threetypes of diagrams (viz., Leibniz, 1903/1988, and/or Euler, 1768/1960; Venn, 1886/1971; andGergonne, 1817) share the intuitive analogy between a closed area and the extension of a con-cept, they result in different conventions, representations, and, as importantly, different uses; inaddition, the first type is defective. The expression “Euler diagrams” is appropriate only to re-fer to systems that make use of four diagrams, one for each quantified sentence.
Appendix B. The Criterion Used to Identify Inconsistent Ratings
At first sight, one could envisage a straightforward revision of the data based on the claimthat any negative evaluation of a logically true sentence can be considered as an indication of aprocessing error; this would lead to discarding such observations. However, this claim is objec-tionable because one does not know exactly how each individual is calibrated on the scale.That is, a negative rating on some specific pairings might, in principle, reflect reluctance to ac-cept the relation instead of being an erroneous answer. We prefer to use a more conservativeprinciple to eliminate errors based on the notion that errors introduce inconsistency within theset of five ratings made by each participant on each sentence–diagram pair. We eliminated theseries of five ratings that met a criterion of inconsistency based on these considerations. Con-sider, for example, a participant who correctly gives a +3 rating on four of the five trials andgives a –3 rating on the remaining trial. It is very doubtful that the exceptional rating reflects a
722 G. Politzer, J.-B. Van der Henst, C. Delle Luche, I. A. Noveck/Cognitive Science 30 (2006)
Fig. 2A. Leibniz’s (1903/1988) line diagrams.
motivated change in evaluation; rather, we take this to be, in all likelihood, a typical case of aprocessing error. Accordingly, we decided to suppress from the data the negative values whenthey appeared in a set that contained at least two positive values and provided the range of thedistribution was equal to at least four points on the scale (for a maximum possible of six: Thislast criterion helps maintain the notion of inconsistency; a distribution such as, e.g., +1, +1, +1,+1, and –1 whose range equals 2, suggests fluctuations around the midpoint of the scale ratherthan genuine inconsistency). Notice that the criterion that has been chosen is conservative inthe sense that it leads one to maintain negative observations that could in fact be erroneous.(The trend in any change in the results that would follow from the suppression of data couldonly increase if more data were discarded). The opposite could also be true: We might removenegative observations that do not originate from the subject–predicate confusion (even thoughthe two criteria tend to also eliminate this possibility). There is a way to control for this becausewe are interested in a comparison of means, not in their values in isolation. Assuming thatsome negative evaluations that are not due to the subject–predicate confusion could occur forall logically true sentence–diagram associations with the same probability, we may also applythe correction just defined to the other member of the experimental comparison, that is, toEQUIVALENCE for the A sentence (compared to SUBSET) and to OVERLAP for the O sentence(compared to SUPERSET). Using this differential method, a change in the difference betweenmeans could not be attributed to a factor that affects both sentence–diagram pairs but to the fac-tor that affects only one of them. The application of the criterion that has just been defined re-sulted in the suppression of 31% of the means (series of five ratings) associated with this cor-rection process.
G. Politzer, J.-B. Van der Henst, C. Delle Luche, I. A. Noveck/Cognitive Science 30 (2006) 723