the influence of increased prepregnancy body mass index and
TRANSCRIPT

healthcare
Article
The Influence of Increased Prepregnancy Body MassIndex and Excessive Gestational Weight Gain onPregnancy Course and Fetal and MaternalPerinatal Outcomes
Milan Lackovic 1,2, Dejan Filimonovic 2,3, Sladjana Mihajlovic 1,2, Biljana Milicic 4,Ivana Filipovic 1, Marija Rovcanin 2,3, Dejan Dimitrijevic 2,3 and Dejan Nikolic 2,5,*
1 Clinical Hospital Center “Dr. Dragiša Mišovic”, 11000 Belgrade, Serbia;[email protected] (M.L.); [email protected] (S.M.);[email protected] (I.F.)
2 Faculty of Medicine, University of Belgrade, 11000 Belgrade, Serbia; [email protected] (D.F.);[email protected] (M.R.); [email protected] (D.D.)
3 Obstetrics/Gynecology Clinic “Narodni front”, 11000 Belgrade, Serbia4 Faculty of Dental Medicine, University of Belgrade, 11000 Belgrade, Serbia; [email protected] Physical Medicine and Rehabilitation Department, University Children’s Hospital, Tirsova 10,
11000 Belgrade, Serbia* Correspondence: [email protected]
Received: 28 August 2020; Accepted: 23 September 2020; Published: 24 September 2020�����������������
Abstract: Background: The aim of our study was to assess the influence of prepregnancy Body MassIndex (BMI) changes as well as excessive gestational weight gain (GWG) on maternal and fetalperinatal parameters. Furthermore, we aimed to analyze the influence of increased prepregnancyBMI values and excessive GWG on neonatal early motoric development. Methods: The 203 eligiblefemale participants were evaluated. Prepregnancy Body Mass Index (BMI) and excessive gestationalweight gain (GWG) defined according to Institute of Medicine 2009 guidelines in the USA wereassessed with tested maternal and fetal perinatal parameters and infants early motoric development(Alberta Infant Motor Scale—AIMS). Results: Significant predictors of increased prepregnancy BMIin perinatal period include: weight at delivery (p = 0.001), GWG (p = 0.002) and BMI at delivery(p < 0.001), while significant predictors of excessive GWG in perinatal period are: prepregnancyBMI (p = 0.029) and BMI at delivery (p < 0.001). In the group of participants with both increasedprepregnancy BMI and excessive GWG versus others, significant predictors were: hypertension(HTA) (p = 0.019), amniotic fluid index (AFI) (p = 0.047), Pronation (AIMS) (p = 0.028) and Supination(AIMS) (p = 0.029). Conclusion: Increased prepregnancy BMI and excessive GWG are significantlyassociated with numerous perinatal factors that could alter the pregnancy course, pregnancy outcomeand early motoric development of newborn. Moreover, increased prepregnancy BMI is shown to be asignificant predictor of excessive GWG; thus, early selection of pregnant women for close monitoringof weight gain during pregnancy will have positive effects on reducing the risk of less favorablepregnancy course and early motoric development of newborn.
Keywords: obesity; weight gain; pregnancy; perinatal outcome; early motor development
1. Introduction
Obesity and overweight are significant public health issues. According to the World HealthOrganization (WHO) in 2016, more than 1.9 billion adults aged 18 years and older were overweight.The worldwide prevalence of obesity nearly tripled between 1975 and 2016 [1]. The number of obese
Healthcare 2020, 8, 362; doi:10.3390/healthcare8040362 www.mdpi.com/journal/healthcare

Healthcare 2020, 8, 362 2 of 15
and overweight mothers is also increasing, especially in urban areas. Several definitions concerningmaternal obesity have been proposed including Body Mass Index (BMI) categories, increased waistcircumference and waist-to-hip ratio as well as absolute measures such as gravid weight above 200lb,but final consensus has not been adopted yet [2,3].
Maternal obesity and perinatal outcomes are also determined with gestational weight gain(GWG). Excessive GWG potentially increases perinatal complications such as Cesarean delivery,large-for-gestational-age, macrosomia and childhood overweight or obesity for the offspring. This isdefined according to the Institute of Medicine 2009 gestational weight gain guideline in the USA [4].Increased prepregnancy BMI and excessive (GWG) are potentially modifiable risk factors. Preventionof or reduction in these factors may decrease unfavorable perinatal and neonatal outcomes, supportingthe Development Origin of Health and Disease (DOHaD) hypothesis. This hypothesis emphases anunfavorable in utero environment on fetal and neonatal development, pointing to the greater risk ofthe disease development in the adulthood period [5].
Obesity is considered as a systemic inflammatory condition that might affect insulin resistance,type II diabetes and hypertension among other conditions [6].
Increased prepregnancy BMI and excessive GWG increase the risk of numerous pregnancycomplications [7–10]. Increased maternal BMI is considered as an important predictor of maternaland newborn health, including but not limited to the increased risk of poor neurodevelopmentalnewborn disorders, leading to various degrees of cognitive disability, developmental delay, impairedlanguage skills as well as the cerebral palsy [11–13]. Moreover, higher weight gain during pregnancypredicts a neonate that is large for the gestational age, which could be marker of neonatal morbidity.However previous studies suggested that GWG is not associated with child Peabody score and Ravenscore [4,14].
Previous reports stated that various prenatal maternal factors including but not limited togestational or pregestational diabetes, and overweight and obesity, might prolong child motormilestone achievements and cause neurodevelopmental delay [15,16]. The importance of earlyrecognition of these factors along with preconceptual interventions could be effective in reducing theless favorable outcomes in the early motoric development of children.
We hypothesized that changes in prepregnancy BMI and excessive GWG are potential risk factorsassociated with less favorable pregnancy and neonatal outcome. Therefore, the aim of our study was toassess the influence of increased prepregnancy BMI changes as well as excessive GWG on maternal andfetal perinatal parameters. Furthermore, we aimed to analyze the influence of increased prepregnancyBMI and excessive GWG on neonatal early motoric development.
2. Methods
2.1. Study Group
The prospective study included 203 eligible female participants that were admitted to the Obstetricsward for delivery between 1 August 2019 and 31 January 2020. Eligible female participants were definedas singleton pregnancies that were not conceived using assisted reproductive techniques (ART). Allpregnant women in this study had low risk of chromosomal disorders based on noninvasive prenataltesting. The selection of study participants was described in a flow chart (Figure 1). To minimizethe possibility of bias in the study, we established inclusion and exclusion criteria, since for pregnantwomen who underwent ART, several parameters might influence the possibility of the bias. Accordingto Serbian National Regulation defining artificial reproductive technique (ART) procedures, increasedBMI is considered as an exclusion criteria for ART procedures [17]. More frequent pregnancyrelated complications associated with frequency of advanced maternal age, multifetal pregnancies,Cesarean delivery as a more frequent delivery mode are well known complications associated withART procedures. Due to increased adverse pregnancy and perinatal outcomes associated with ART

Healthcare 2020, 8, 362 3 of 15
procedures in comparison with naturally conceived pregnancies, those women were excluded fromthe study [18–23].
Prior inclusion in the study, participants were informed about the study protocol, and consent wasobtained. The study followed the principles of good clinical practice and was approved by InstitutionalReview Board (01-14706/19).
The study group was randomly selected from the computer data base at the Obstetric ward of theHospital where delivery was performed. Every fifth admitted women to the Hospital for deliverywas selected.
Regarding the sample size for this study, we estimated that the hypertension (HTA) wassignificantly more frequent in pregnant women with excessive GWG and increased BMI than inpregnant women without excessive GWG (70.6% vs. 29.4%). Additionally, analysis of diabetes mellitus(DM), showed that DM was more prevalent in pregnant women with excessive GWG and increasedBMI than in the group of pregnant women without excessive GWG (64.0% vs. 36.0%). Enrolment of200 pregnant women (where frequency of pregnant women with excessive GWG is 34%) will achieve97.2% power to detect a significant difference in the development of DM. Additionally, this simple sizewill achieve 99.3% power to detect a significant difference in HTA.
The study sample might be considered as a representative, since the maternity ward wherethe samples were collected is among the five most frequent in the country dealing with all types ofpathology of pregnancy, where patients come from all parts of Serbia; so, in that sense, the sample isassumed to be homogeneous.
To reduce the possibility of nonrespondent bias for the design of the study, our survey wasaccessible, well explained and understandable, while for the study implementation, eligible participantswere told that collecting data and samples for testing were mandatory, and a satisfactory response ratewas achieved.
Figure 1. Flow chart of study participants selection.
2.2. Evaluated Parameters
The values of prepregnancy height, weight and BMI, positive family history and presence ofallergies and thrombophilia were collected from health data reports from primary health centers(women that were checked up to 3 months prior to pregnancy) where participants were regularlyscreened and followed-up.
Based on the WHO ranges, pregnant women were allocated in four different groups dependingon their pregestational BMI: underweight, normal weight, overweight and obese. Underweightwas defined as BMI bellow 18.5 kg/m2, normal weight as BMI between 18.5–24.9 kg/m2, overweight(preobesity) as BMI between 25.0–29.9 kg/m2 and obesity as BMI 30.0 kg/m2 and above [24]. Ultrasound

Healthcare 2020, 8, 362 4 of 15
(US) was used to evaluate fetal biparietal diameter (BPD), head circumference (HC), abdominalcircumference (AC), femoral length (FL), estimated fetal weight (EFW) and amniotic fluid index (AFI)on admission to the hospital up to three days prior to delivery. All US measurements were performed bythe same sonographer on the same model of US (The Voluson™ E8 ultrasound system (GE HealthcareDharmacon, Inc., Chicago, IL, USA)). Based on BPD, AC, HC and FL, EFW was calculated usinga US software system. The premature rupture of membranes (PROM) was defined as a rupture ofthe amniotic sac after 37 gestational weeks before the beginning of the delivery [25]. Pregnancyrelated hypertension (HTA) was defined as blood pressure above 140/90 mmHg, gestational diabetesmellitus (DM) as pathological values of oral glucoses tolerance test or postprandial glycaemia values.Gestational week was calculated by Naegele’s rule and transferred into days for adequate calculationin this study. The GWG is mathematically expressed as maternal prepregnancy and at delivery weightdifference. During pregnancy, averagely 3.5 kg of weight gain counts as fetal weight, 0.5 kg as placenta,amniotic fluid is up to 1 kg and remaining weight gain counts as adipose tissue accumulation andextravascular fluid [26]. Excessive GWG was defined according to further parameters: depending onprepregnancy BMI values, recommended total weight gain for singleton pregnancies is 12.5–18.0 kg forunderweight (BMI < 18.5 kg/m2), 11.5–16.0 kg for normal weight (BMI 18.5–24.9 kg/m2), 7.0–11.5 kgfor overweight (BMI 25.0–29.9 kg/m2) and 5.0–9.0 kg for obese (BMI ≥ 30 kg/m2) [4]. All values abovethese ranges for weight category were considered as excessive GWG.
The blood was drawn twice: before delivery (up to 24 h before labor) and after delivery (24 h afterlabor). Leucocytes, hemoglobin (HGB), thrombocytes, glucose, D dimer and blood type (BT) (rhesusnegative versus positive) were assessed. During the labor, complications at delivery and deliverymode (vaginal, Cesarean Section (SC), instrumental, induced) were assessed. At the beginning ofdelivery, three types of delivery mode were defined: spontaneous, induced and planned CesareanSection. At the end of delivery, five types of delivery modes were defined: spontaneous, induced,assisted (instrumental), planned and emergency Cesarean Section.
Additionally, drug use in pregnancy and at delivery, positive urine culture (UC), presence ofgroup B streptococcus (GBS) and APGAR score in the first and fifth minute were evaluated.
Early motoric development of infants was assessed by Alberta infant motor scale (AIMS) at the ageof 3 months. Pronation and supination points were calculated separately. The AIMS is a nonreferencedmeasure with high sensitivity and specificity for detection of motor deficits. It is composed of 58 items,where pronation has 21, supination 9, sitting 12 and standing 16. Since tested newborns were aged3 months, only pronation and supination were analyzed [27].
2.3. Statistical Analysis
Statistical Package for Social Science (SPSS software package, version 26.0; SPSS Inc., Chicago, IL,USA) was used for all the data analyses. Descriptive data for all groups and variables were expressedas the mean value (MV) and standard deviation (SD) (MV ± SD) for continuous measures, or absolutenumber (N) and percent (%) of a group for discrete measures. Comparation categorical data betweengroups with and without GWG were analyzed using the Pearson chi-square test. A normal distributionof all numeric data was tested using the Koglomorov–Smirnov test. If the data were normallydistributed, the t-test was used to compare data between observed groups. Nonparametric data wereanalyzed using the Mann–Whitney U test. Multiple linear regression analysis was performed to measurethe influence of all observed factors as independent to prepregnancy BMI as a dependent variable.
The association of observed parameters with GWG was analyzed using univariate andmultivariable binary logistic regression methods. Differences were considered significant whenp value was <0.05.
3. Results
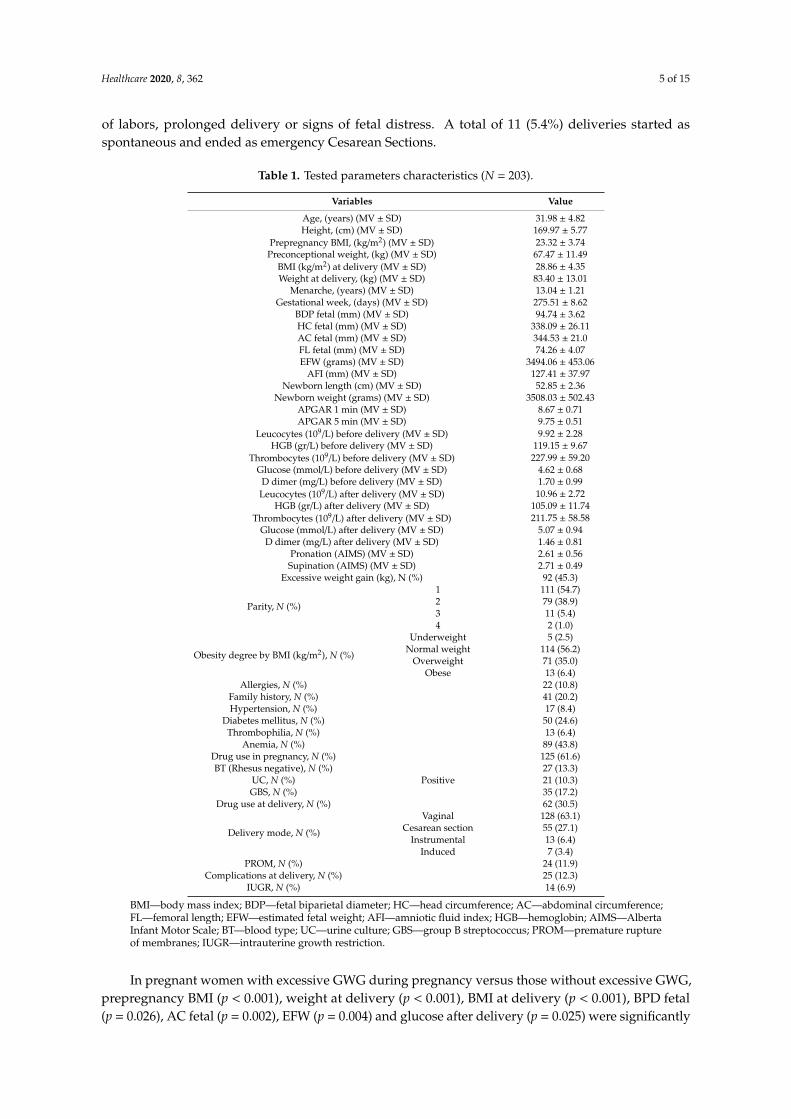
In Table 1, tested parameter characteristics were presented. Seven (3.4%) deliveries at the beginningof delivery were induced, but ended as emergency Cesarean Section because of unsuccessful induction
Healthcare 2020, 8, 362 5 of 15
of labors, prolonged delivery or signs of fetal distress. A total of 11 (5.4%) deliveries started asspontaneous and ended as emergency Cesarean Sections.
Table 1. Tested parameters characteristics (N = 203).
Variables Value
Age, (years) (MV ± SD) 31.98 ± 4.82Height, (cm) (MV ± SD) 169.97 ± 5.77
Prepregnancy BMI, (kg/m2) (MV ± SD) 23.32 ± 3.74Preconceptional weight, (kg) (MV ± SD) 67.47 ± 11.49
BMI (kg/m2) at delivery (MV ± SD) 28.86 ± 4.35Weight at delivery, (kg) (MV ± SD) 83.40 ± 13.01
Menarche, (years) (MV ± SD) 13.04 ± 1.21Gestational week, (days) (MV ± SD) 275.51 ± 8.62
BDP fetal (mm) (MV ± SD) 94.74 ± 3.62HC fetal (mm) (MV ± SD) 338.09 ± 26.11AC fetal (mm) (MV ± SD) 344.53 ± 21.0FL fetal (mm) (MV ± SD) 74.26 ± 4.07EFW (grams) (MV ± SD) 3494.06 ± 453.06
AFI (mm) (MV ± SD) 127.41 ± 37.97Newborn length (cm) (MV ± SD) 52.85 ± 2.36
Newborn weight (grams) (MV ± SD) 3508.03 ± 502.43APGAR 1 min (MV ± SD) 8.67 ± 0.71APGAR 5 min (MV ± SD) 9.75 ± 0.51
Leucocytes (109/L) before delivery (MV ± SD) 9.92 ± 2.28HGB (gr/L) before delivery (MV ± SD) 119.15 ± 9.67
Thrombocytes (109/L) before delivery (MV ± SD) 227.99 ± 59.20Glucose (mmol/L) before delivery (MV ± SD) 4.62 ± 0.68
D dimer (mg/L) before delivery (MV ± SD) 1.70 ± 0.99Leucocytes (109/L) after delivery (MV ± SD) 10.96 ± 2.72
HGB (gr/L) after delivery (MV ± SD) 105.09 ± 11.74Thrombocytes (109/L) after delivery (MV ± SD) 211.75 ± 58.58
Glucose (mmol/L) after delivery (MV ± SD) 5.07 ± 0.94D dimer (mg/L) after delivery (MV ± SD) 1.46 ± 0.81
Pronation (AIMS) (MV ± SD) 2.61 ± 0.56Supination (AIMS) (MV ± SD) 2.71 ± 0.49
Excessive weight gain (kg), N (%) 92 (45.3)
Parity, N (%)
1 111 (54.7)2 79 (38.9)3 11 (5.4)4 2 (1.0)
Obesity degree by BMI (kg/m2), N (%)
Underweight 5 (2.5)Normal weight 114 (56.2)
Overweight 71 (35.0)Obese 13 (6.4)
Allergies, N (%) 22 (10.8)Family history, N (%) 41 (20.2)Hypertension, N (%) 17 (8.4)
Diabetes mellitus, N (%) 50 (24.6)Thrombophilia, N (%) 13 (6.4)
Anemia, N (%) 89 (43.8)Drug use in pregnancy, N (%) 125 (61.6)BT (Rhesus negative), N (%) 27 (13.3)
UC, N (%) Positive 21 (10.3)GBS, N (%) 35 (17.2)
Drug use at delivery, N (%) 62 (30.5)
Delivery mode, N (%)
Vaginal 128 (63.1)Cesarean section 55 (27.1)
Instrumental 13 (6.4)Induced 7 (3.4)
PROM, N (%) 24 (11.9)Complications at delivery, N (%) 25 (12.3)
IUGR, N (%) 14 (6.9)
BMI—body mass index; BDP—fetal biparietal diameter; HC—head circumference; AC—abdominal circumference;FL—femoral length; EFW—estimated fetal weight; AFI—amniotic fluid index; HGB—hemoglobin; AIMS—AlbertaInfant Motor Scale; BT—blood type; UC—urine culture; GBS—group B streptococcus; PROM—premature ruptureof membranes; IUGR—intrauterine growth restriction.
In pregnant women with excessive GWG during pregnancy versus those without excessive GWG,prepregnancy BMI (p < 0.001), weight at delivery (p < 0.001), BMI at delivery (p < 0.001), BPD fetal(p = 0.026), AC fetal (p = 0.002), EFW (p = 0.004) and glucose after delivery (p = 0.025) were significantly

Healthcare 2020, 8, 362 6 of 15
higher, while Apgar in 1 min (p = 0.013) and in 5 min (p = 0.007), HGB after delivery (p < 0.001) aswell as pronation score (p < 0.001) and supination score (p < 0.001) of AIMS were significantly lower(Table 2). Those with excessive GWG had significantly frequent positive family history (p = 0.024),present HTA (p = 0.001), DM (p < 0.001) anemia (p = 0.001), drug use in pregnancy (p = 0.003) andcomplications at delivery (p = 0.045).
Table 2. Parameters characteristics due to the presence of weight gain (N = 203).
VariablesExcessive GWG p
Yes No
Age (years), (MV ± SD) 32.57 ± 4.77 31.50 ± 4.82 0.115 **Prepregnancy BMI (kg/m2) 25.86 ± 3.44 21.21 ± 2.45 <0.001 ***
Preconceptional weight (kg), (MV ± SD) 93.73 ± 9.99 74.85 ± 8.08 <0.001 ***
Obesity degree by BMI (kg/m2), N (%)
Underweight 1 (20)
<0.001 ****Normal weight 19 (16.7)
Overweight 61 (85.9)Obesity 11 (84.6)
BMI (kg/m2) at delivery 32.26 ± 3.58 26.05 ± 2.53 <0.001 ***
Parity, N (%)
1 55 (49.5)
0.591 ****2 32 (40.5)3 4 (36.4)4 1 (50.0)
Allergies 1, N (%) 11 (50) 11 (50) 0.641 ****Family history 2, N (%) 25 (61) 16 (39) 0.024 ****
HTA 1, N (%) 14 (82.4) 3 (17.6) 0.001 ****DM 1, N (%) 36 (72.0) 14 (28.0) <0.001 ****
Thrombophilia 1, N (%) 8 (61.5) 5 (38.5) 0.225 ****Anemia 1, N (%) 52 (58.4) 37 (41.6) 0.001 ****
Drug use in pregnancy 1, N (%) 67 (53.6) 58 (46.4) 0.003 ****Menarche, (years), (MV ± SD) 12.97 ± 0.94 13.11 ± 1.38 0.711 ***
BT 1, N (%) 11 (40.7) 16 (59.3) 0.608 ****UC 2, N (%) 8 (38.1) 13 (61.9) 0.482 ****GBS 2, N (%) 12 (34.3) 23 (65.7) 0.149 ****
Drug use at delivery, N (%) 34 (54.8) 28 (45.2) 0.071 ****
Delivery mode, N (%)
Vaginal 51 (39.8)
0.239 ****Cesarean section 30 (54.5)
Instrumental 7 (53.8)Induced 4 (57.1)
PROM 1, N (%) 15 (62.5) 9 (37.5) 0.067 ****Complications at delivery 1, N (%) 16 (64) 9 (36) 0.045 ****
Gestational week, (MV ± SD) 275.17 ± 9.32 275.79 ± 8.02 0.820 ***BPD fetal (mm), (MV ± SD) 95.32 ± 3.77 94.27 ± 3.43 0.026 ***HC fetal (mm), (MV ± SD) 337.68 ± 14.95 338.42 ± 32.67 0.407 ***AC fetal (mm), (MV ± SD) 348.48 ± 22.60 341.25 ± 19.24 0.002 ***FL fetal (mm), (MV ± SD) 74.64 ± 3.48 73.95 ± 4.49 0.144 ***EFW (grams), (MV ± SD) 3585.38 ± 481.19 3418.38 ± 415.49 0.004 ***
AFI (mm), (MV ± SD) 132.93 ± 44.70 122.84 ± 30.78 0.096 ***IUGR 1, N (%) 5 (35.7) 9 (64.3) 0.454 ****
Newborn length (cm), (MV ± SD) 53.09 ± 2.56 52.65 ± 2.17 0.208 ***Newborn weight (grams), (MV ± SD) 3576.41 ± 542.90 3451.35 ± 461.06 0.077 *
Apgar 1 min, (MV ± SD) 8.55 ± 0.78 8.76 ± 0.64 0.013 ***Apgar 5 min, (MV ± SD) 9.65 ± 0.56 9.83 ± 0.45 0.007 ***
Leucocytes (109 g/L) before delivery, (MV ± SD) 10.21 ± 2.49 9.68 ± 2.06 0.069 ***HGB (gr/L) before delivery, (MV ± SD) 117.38 ± 10.11 120.64 ± 9.07 0.017 *
Thrombocytes (109 g/L) before delivery, (MV ± SD) 232.84 ± 60.47 223.89 ± 58.06 0.363 ***Glucose (mmol/L) before delivery, (MV ± SD) 4.67 ± 0.67 4.58 ± 0.68 0.233 ***
D dimer (mg/L) before delivery, (MV ± SD) 1.70 ± 0.90 1.71 ± 1.06 0.859 ***Leucocytes (109 g/L) after delivery, (MV ± SD) 11.20 ± 2.75 10.75 ± 2.69 0.158 ***
HGB (gr/L) after delivery, (MV ± SD) 102.57 ± 11.14 107.23 ± 11.86 <0.001 ***Thrombocytes (109 g/L) after delivery, (MV ± SD) 212.71 ± 60.80 210.94 ± 56.91 0.935 ***
Glucose (mmol/L) after delivery, (MV ± SD) 5.26 ± 1.06 4.91 ± 0.79 0.025 ***D dimer (mg/L) after delivery, (MV ± SD) 1.51 ± 0.85 1.42 ± 0.77 0.529 ***
Pronation (AIMS), (MV ± SD) 2.40 ± 0.65 2.75 ± 0.46 <0.001 ***Supination (AIMS), (MV ± SD) 2.49 ± 0.58 2.86 ± 0.35 <0.001 ***
GWG—gestational weight gain; BMI—body mass index; HTA—hypertension; DM—diabetes mellitus; BT—bloodtype; UC—urine culture; GBS—group B streptococcus; PROM—premature rupture of membranes; BDP—fetalbiparietal diameter; HC—head circumference; AC—abdominal circumference; FL—femoral length; EFW—estimatedfetal weight; AFI—amniotic fluid index; IUGR—intrauterine growth restriction; HGB—hemoglobin; AIMS—AlbertaInfant Motor Scale; ** Independent Samples t Test; *** Mann–Whitney U Test; **** Chi-Square Test; 1 Present;2 Positive.

Healthcare 2020, 8, 362 7 of 15
Increased prepregnancy BMI was significantly positively associated with: weight at delivery,GWG and BMI at delivery, HTA, DM (p < 0.001), positive family anamnesis (p = 0.006), anemia(p = 0.030), drug use in pregnancy (p = 0.015), AC fetal (p = 0.015), EFW (p = 0.016), AFI (p = 0.019) andglucose after delivery (p = 0.026). The significant negative association of prepregnancy BMI was withmenarche (p = 0.023), pronation score (p = 0.002) and supination score (p < 0.001) of AIMS (Table 3).
The excessive GWG was significantly associated with: prepregnancy BMI, BMI at delivery, obesitydegree, DM, AIMS pronation and supination scores (p < 0.001), positive family anamnesis (p = 0.026),HTA (p = 0.004), anemia (p = 0.001), drug use in pregnancy (p = 0.003), complications at delivery(p = 0.050), BPD fetal (p = 0.043), AC fetal (p = 0.017), EFW (p = 0.010), Apgar score in 1 min (p = 0.047)and 5 min (p = 0.016), HGB before delivery (p = 0.019), HGB after delivery (p = 0.006) and glucose afterdelivery (p = 0.009) (Table 3).
The presence of both increased prepregnancy BMI and excessive GWG were significantly associatedwith: family anamnesis (p = 0.010), HTA (p = 0.002), DM (p < 0.001), Thrombophilia (p = 0.039), Anemia(p = 0.004), drug use in pregnancy (p = 0.010), AC fetal (p = 0.035), AFI (p = 0.002), HGB after delivery(p = 0.013), glucose after delivery (p = 0.010), D dimer after delivery (p = 0.039), Pronation (AIMS)(p < 0.001) and Supination (AIMS) (p < 0.001) (Table 3).
Significant predictors of increased prepregnancy BMI in perinatal period include: weight atdelivery (p = 0.001), GWG (p = 0.002) and BMI at delivery (p < 0.001), while significant predictors ofexcessive GWG in perinatal period are: prepregnancy BMI (p = 0.029) and BMI at delivery (p < 0.001).In the group of participants with both increased prepregnancy BMI and excessive GWG versus others,significant predictors were: HTA (p = 0.019), AFI (p = 0.047), Pronation (AIMS) (p = 0.028) andSupination (AIMS) (p = 0.029) (Table 4).

Healthcare 2020, 8, 362 8 of 15
Table 3. Regression analysis of perinatal parameters for increased prepregnancy BMI and excessive GWG.
Parameters
Linear Regression AnalysisIncreased Prepregnancy BMI
Logistic Regression AnalysisExcessive GWG
Logistic Regression AnalysisIncreased Prepregnancy BMI and
Excessive GWG
B 95% CI p Exp(B) 95% CI p Exp(B) 95% CI p
Age (years) 0.112 0.006–0.219 0.039 1.048 0.988–1.111 0.116 1.042 0.980–1.108 0.193Weight at delivery (kg) 0.250 0.231–0.270 <0.001 - - - - - -
Prepregnancy BMI (kg/m2) - - - 1.607 1.419–1.821 <0.001 - - -GWG (kg) 4.653 3.836–5.471 <0.001 - - - - - -
BMI (kg/m2) at delivery 0.793 0.746–0.840 <0.001 1.802 1.551–2.092 <0.001 - - -Parity −0.584 −1.384–0.216 0.152 0.766 0.494–1.186 0.232 0.702 0.436–1.131 0.146
Obesity degree - - - 15.721 7.769–31.811 <0.001 - - -Allergies 0.860 −0.806–2.525 0.310 1.235 0.509–2.993 0.641 1.124 0.447–2.826 0.804
Family anamnesis 1.775 0.506–3.045 0.006 2.215 1.099–4.466 0.026 2.494 1.239–5.017 0.010HTA 5.179 3.449–6.909 <0.001 6.462 1.796–23.252 0.004 5.432 1.828–16.136 0.002DM 2.641 1.493–3.788 <0.001 4.454 2.213–8.965 <0.001 5.574 2.807–11.066 <0.001
Thrombophilia 2.025 −0.076–4.127 0.059 2.019 0.637–6.399 0.233 3.384 1.063–10.773 0.039Anemia 1.143 0.109–2.177 0.030 2.600 1.469–4.601 0.001 2.393 1.322–4.331 0.004
Drug use in pregnancy 1.304 0.252–2.356 0.015 2.449 1.356–4.424 0.003 2.297 1.216–4.340 0.010Menarche −0.496 −0.924–−0.069 0.023 0.906 0.716–1.146 0.409 0.851 0.658–1.100 0.218
BT −1.159 −2.679–0.361 0.134 0.806 0.354–1.836 0.608 0.644 0.258–1.606 0.345UC 0.929 −0.771–2.628 0.283 0.718 0.284–1.815 0.484 1.221 0.480–3.103 0.675GBS −0.763 −2.133–0.608 0.274 0.574 0.268–1.228 0.153 0.623 0.274–1.416 0.259
Drug use at delivery 0.039 −1.088–1.166 0.946 1.738 0.952–3.173 0.072 1.490 0.801–2.769 0.208Delivery mode 0.589 −0.084–1.263 0.086 1.398 0.966–2.022 0.075 1.352 0.934–1.957 0.111
PROM 0.860 −0.746–2.467 0.292 2.237 0.930–5.383 0.072 2.179 0.921–5.150 0.076Complications at delivery 0.320 −1.259–1.899 0.690 2.386 1.001–5.689 0.050 1.626 0.695–3.802 0.262
Gestational week at delivery −0.019 −0.080–0.041 0.529 0.992 0.960–1.024 0.610 0.982 0.950–1.015 0.285BPD fetal (mm) 0.116 −0.027–0.259 0.111 1.088 1.003–1.180 0.043 1.017 0.937–1.103 0.691HC fetal (mm) 0.000 −0.020–0.020 0.992 0.999 0.988–1.010 0.841 0.998 0.986–1.010 0.731AC fetal (mm) 0.030 0.006–0.055 0.015 1.018 1.003–1.032 0.017 1.016 1.001–1.032 0.035FL fetal (mm) 0.089 −0.038–0.217 0.168 1.048 0.970–1.133 0.237 1.063 0.972–1.162 0.182EFW (grams) 0.001 0.000–0.003 0.016 1.001 1.000–1.002 0.010 1.001 1.000–1.001 0.090
AFI (mm) 0.016 0.003–0.030 0.019 1.007 1.000–1.015 0.065 1.014 1.005–1.023 0.002

Healthcare 2020, 8, 362 9 of 15
Table 3. Cont.
Parameters
Linear Regression AnalysisIncreased Prepregnancy BMI
Logistic Regression AnalysisExcessive GWG
Logistic Regression AnalysisIncreased Prepregnancy BMI and
Excessive GWG
B 95% CI p Exp(B) 95% CI p Exp(B) 95% CI p
IUGR −0.021 −2.070–2.027 0.984 0.651 0.210–2.016 0.457 0.763 0.230–2.528 0.658Newborn length (cm) 0.100 −0.120–0.321 0.370 1.084 0.961–1.222 0.189 1.065 0.939–1.208 0.329
Newborn weight (grams) 0.001 0.000–0.002 0.255 1.001 1.000–1.001 0.080 1.000 1.000–1.001 0.313APGAR 1 min −0.523 −1.255–0.208 0.160 0.661 0.439–0.995 0.047 0.813 0.546–1.211 0.308APGAR 5 min −0.872 −1.888–0.145 0.092 0.494 0.277–0.878 0.016 0.630 0.362–1.097 0.102
Leucocytes (109/L) before delivery 0.074 −0.155–0.302 0.526 1.111 0.980–1.258 0.100 1.106 0.974–1.256 0.119HGB (gr/L) before delivery −0.042 −0.096–0.011 0.121 0.965 0.936–0.994 0.019 0.972 0.942–1.002 0.064
Thrombocytes (109/L) before delivery 0.006 −0.003–0.014 0.206 1.003 0.998–1.007 0.286 1.005 1.000–1.010 0.068Glucose (mmol/L) before delivery 0.144 −0.628–0.916 0.713 1.229 0.812–1.858 0.329 1.233 0.804–1.891 0.337
D dimer (mg/L) before delivery 0.234 −0.294–0.762 0.384 0.988 0.745–1.310 0.932 1.155 0.866–1.541 0.327Leucocytes (109/L) after delivery 0.046 −0.145–0.238 0.634 1.062 0.959–1.177 0.249 1.044 0.939–1.161 0.426
HGB (gr/L) after delivery −0.057 −0.100–−0.013 0.012 0.965 0.941–0.990 0.006 0.968 0.944–0.993 0.013Thrombocytes (109/L) after delivery 0.002 −0.007–0.011 0.712 1.001 0.996–1.005 0.831 1.001 0.997–1.006 0.555
Glucose (mmol/L) after delivery 0.650 0.100–1.201 0.021 1.513 1.109–2.063 0.009 1.511 1.103–2.071 0.010D dimer (mg/L) after delivery 0.533 −0.109–1.175 0.103 1.145 0.811–1.617 0.442 1.458 1.020–2.086 0.039
Pronation (AIMS) −1.510 −2.476–−0.543 0.002 0.320 0.180–0.569 <0.001 0.217 0.116–0.406 <0.001Supination (AIMS) −3.040 −4.090–−1.990 <0.001 0.188 0.093–0.378 <0.001 0.173 0.086–0.348 <0.001
GWG—gestational weight gain; BMI—body mass index; HTA—hypertension; DM—diabetes mellitus; BT—blood type; UC—urine culture; GBS—group B streptococcus; PROM—prematurerupture oft membranes; BDP—fetal biparietal diameter; HC—head circumference; AC—abdominal circumference; FL—femoral length; EFW—estimated fetal weight; AFI—amniotic fluidindex; IUGR—intrauterine growth restriction; HGB—hemoglobin; AIMS—Alberta Infant Motor Scale.

Healthcare 2020, 8, 362 10 of 15
Table 4. Perinatal predictors for increased prepregnancy BMI and excessive GWG.
Parameters
Multiple Linear Regression AnalysisIncreased Prepregnancy BMI
Multivariate Logistic Regression AnalysisExcessive GWG
Multivariate Logistic Regression AnalysisIncreased Prepregnancy BMI and
Excessive GWG
B 95% CI p Exp(B) 95% CI p Exp(B) 95% CI p
Age (years) −0.025 −0.070–0.019 0.264 - - - - - -Weight at delivery (kg) 0.069 0.030–0.108 0.001 - - - - - -
Prepregnancy BMI (kg/m2) - - - 0.571 0.345–0.945 0.029 - - -GWG (kg) −1.007 −1.64–0.377 0.002 - - - - - -
BMI (kg/m2) at delivery 0.725 0.611–0.840 <0.001 2.535 1.664–3.862 <0.001 - - -Parity - - - - - - - - -
Obesity degree - - - 2.862 0.327–25.058 0.342 - - -Allergies - - - - - - - - -
Family anamnesis 0.280 −0.282–0.843 0.326 0.895 0.246–3.254 0.867 0.724 0.225–2.333 0.589HTA −0.184 −1.083–0.715 0.687 0.456 0.051–4.043 0.481 7.349 1.396–38.691 0.019DM −0.413 −1.042–0.217 0.198 0.791 0.168–3.725 0.767 2.962 0.976–8.987 0.055
Thrombophilia - - - - - - 2.704 0.504–14.505 0.246Anemia −0.557 −1.073–−0.040 0.035 1.068 0.244–4.680 0.930 1.824 0.645–5.161 0.257
Drug use in pregnancy 0.352 −0.122–0.827 0.145 1.752 0.504–6.095 0.378 0.901 0.334–2.431 0.837Menarche 0.067 −0.113–0.247 0.462 - - - - - -
BT - - - - - - - - -UC - - - - - - - - -GBS - - - - - - - - -
Drug use at delivery - - - - - - - - -Delivery mode - - - - - - - - -
PROM - - - - - - - - -Complications at delivery - - - 1.475 0.236–9.231 0.678 - - -
Gestational week at delivery - - - - - - - - -BPD fetal (mm) - - - 1.124 0.869–1.454 0.373 - - -HC fetal (mm) - - - - - - - - -AC fetal (mm) 0.009 −0.011–0.028 0.384 1.003 0.962–1.046 0.892 1.002 0.980–1.024 0.882FL fetal (mm) - - - - - - - - -EFW (grams) 0.000 −0.001–0.001 0.382 1.000 0.997–1.002 0.864 - - -

Healthcare 2020, 8, 362 11 of 15
Table 4. Cont.
Parameters
Multiple Linear Regression AnalysisIncreased Prepregnancy BMI
Multivariate Logistic Regression AnalysisExcessive GWG
Multivariate Logistic Regression AnalysisIncreased Prepregnancy BMI and
Excessive GWG
B 95% CI p Exp(B) 95% CI p Exp(B) 95% CI p
AFI (mm) 0.002 −0.004–0.008 0.560 - - - 1.013 1.000–1.027 0.047IUGR - - - - - - - - -
Newborn length (cm) - - - - - - - - -Newborn weight (grams) - - - - - - - - -
APGAR 1 min - - - 1.096 0.122–9.853 0.935 - - -APGAR 5 min - - - 0.580 0.030–11.340 0.719 - - -
Leucocytes (109/L) before delivery - - - - - - - - -HGB (gr/L) before delivery - - - 0.952 0.868–1.043 0.287 - - -
Thrombocytes (109/L) before delivery - - - - - - - - -Glucose (mmol/L) before delivery - - - - - - - - -
D dimer (mg/L) before delivery - - - - - - - - -Leucocytes (109/L) after delivery - - - - - - - - -
HGB (gr/L) after delivery 0.016 −0.006–0.037 0.156 1.055 0.984–1.132 0.133 0.990 0.950–1.032 0.636Thrombocytes (109/L) after delivery - - - - - - - - -
Glucose (mmol/L) after delivery 0.285 0.031–0.538 0.028 1.516 0.763–3.011 0.235 0.992 0.607–1.622 0.975D dimer (mg/L) after delivery - - - - - - 1.446 0.928–2.255 0.103
Pronation (AIMS) −0.099 −0.527–0.328 0.646 0.448 0.155–1.294 0.138 0.397 0.174–0.905 0.028Supination (AIMS) −0.258 −0.788–0.272 0.338 0.670 0.180–2.495 0.551 0.369 0.151–0.904 0.029
GWG—gestational weight gain; BMI—body mass index; HTA—hypertension; DM—diabetes mellitus; BT—blood type; UC—urine culture; GBS—group B streptococcus; PROM—prematurerupture of membranes; BDP—fetal biparietal diameter; HC—head circumference; AC—abdominal circumference; FL—femoral length; EFW—estimated fetal weight; AFI—amniotic fluidindex; IUGR—intrauterine growth restriction; HGB—hemoglobin; AIMS—Alberta Infant Motor Scale.
Healthcare 2020, 8, 362 12 of 15
4. Discussion
In our study, we have shown that increased prepregnancy BMI or excessive GWG were significantlyassociated with BMI at delivery, HTA, DM, positive family history, anemia, drug use in pregnancy,ultrasound parameters (AC and EFW) as well as pronation and supination score of AIMS. Furthermore,only increased prepregnancy BMI was significantly associated with weight at delivery, AFI, glucoselevels after delivery and menarche. This is to the certain degree in line with previous reports, wherewomen with increased prepregnancy BMI tend to gain weight [28,29]. In the study of Dong et al.,elevated prepregnancy BMI and excessive GWG in first trimester of pregnancy were associated withgestational DM [30]; however, Yong et al., reported that GWG nor in the first neither in the secondtrimester of pregnancy was independently associated with the risk for gestational DM [31]. In ourstudy, only excessive GWG was significantly associated with obesity degree, complications at delivery,ultrasound BPD parameter, Apgar scores in 1 and 5 min, HGB levels bout before and after delivery andglucose levels after delivery. Moreover, both increased prepregnancy BMI and excessive GWG weresignificantly associated with family history, HTA, DM, thrombophilia, anemia, drug use in pregnancy,AC fetal, AFI, HGB, glucose and D dimer after delivery as well as pronation and supination scoreof AIMS.
These findings clearly point to the fact that both increased prepregnancy BMI and/or excessiveGWG are associated with numerous factors that can influence the course of pregnancy as well as earlyinfant motoric development. However both parameters should be assessed individually along withtheir synergistic effects, since some of the tested perinatal parameters are found to be influenced byone or another variable.
In previous reports, both obesity and GWG are shown to have associations with pregnancyoutcomes [32–35], bearing in mind that their mechanisms are still unclear particularly for GWG [32].Additionally, it should be pointed that both obesity and GWG might have individual as well ascumulative effects not only on various pregnancy outcome factors but on their severity degree aswell [36–38]. Our findings have shown that participants with increased prepregnancy BMI had 14 timesmore chance of weight gain at delivery, over one and a half times more chance of being anemic andover three and a half times more chance of increased glucose levels. Furthermore, participants withboth increased prepregnancy BMI and excessive GWG have over seven times more chance of havingHTA, as well as over two and a half times more chance of lower scores for pronation and supination ofAIMS. Thus, the importance of weight gain control in pregnant woman that are obese could positivelyalter pregnancy outcomes [38].
Furthermore, we have shown multidimensional effects of both increased prepregnancy BMI andexcessive GWG on the tested perinatal parameters as well as early motoric development. Previousreports demonstrated unfavorable obesity effects on pregnancy, pregnancy outcome as well aslabor [32,39,40]. This might imply the possible assumption that various physiological and regulatorymechanisms might be affected by these two tested variables and in different capacities, thus affectingnot only pregnancy course but its outcome.
Furthermore, our findings point to the fact that tested obese women are more prone to have anincreased chance of excessive GWG, thus emphasizing the need for regular checkups during the entirecourse of pregnancy not only for early detection of possible complications but also to treat and preventprogression. In the study of Groth et al., potential genetic association with high GWG was noticed inobese black women [41].
There are several limitations to this study. The tested participants belong to the Serbian population.Given the fact that specific socio-economic variations and genetic dispositions could exist amongdifferent populations, further studies are needed. In this study, for the estimation of the obesitydegree, waist circumference (WC) and waist to hip ratio (WHR) of pregnant women were not analyzed.Additionally, nonalcoholic fatty liver disease (NAFLD) that might be associated with obesity [42]along with liver function parameters should be evaluated. Another limiting factor refers to thenumber of participants; thus, additional studies on larger samples are advised. The need for a larger

Healthcare 2020, 8, 362 13 of 15
number of patients would lead to the better understanding and detection of interindividual variabilityof individual parameters, or detection of variability in a larger proportion of eligible participants.Furthermore, the accuracy of ultrasound scan should be taken into consideration.
5. Conclusions
Increased prepregnancy BMI and excessive GWG are significantly associated with numerousperinatal risk factors that could alter the pregnancy course, pregnancy outcome and early motoricdevelopment of newborn. Moreover, increased prepregnancy BMI is shown to be significant predictorof excessive GWG; thus, early selection of pregnant women for close monitoring of weight gain duringpregnancy will have positive effects on reducing the risk of less favorable pregnancy course and earlymotoric development of newborn.
Finally, these findings will additionally contribute to the better understanding of the potentialrole of increased prepregnancy BMI and excessive GWG on perinatal risk factors and early motoricdevelopment of newborn, adding additional knowledge to practitioners in clinical and primary healthcare settings for establishing appropriate clinical decision-making strategies. Therefore, maternalobesity could be a significant public health burden; thus, preventive and educational programs alongwith continuous monitoring during pregnancy will have a positive impact on adverse maternal andfetal outcomes.
Additionally, the strength of the study refers to the fact that a wide range of parameters wereanalyzed and the influence of pregnant women BMI and GWG on them. Moreover, the study samplewas drawn from general population including all socioeconomic statuses.
Author Contributions: M.L., D.F., D.N. and S.M., conceptualization, data curation, methodology, supervision,writing original draft; B.M., I.F. and M.R., formal analysis, investigation; D.D. formal analysis, writing originaldraft. All authors have read and agreed to the published version of the manuscript.
Funding: This research received no external funding.
Conflicts of Interest: The authors declare no conflict of interest.
References
1. World Health Organization (Updated March 2013). Obesity and Overweight: Key Facts. Available online:https://www.who.int/news-room/fact-sheets/detail/obesity-and-overweight (accessed on 30 May 2020).
2. McDonnold, M.; Mele, L.; Myatt, L.; Hauth, J.; Leveno, K.; Reddy, U.; Mercer, M.; Kennedy, E. Waist-to-hipratio versus body mass index as predictor of obesity-related pregnancy outcomes. Am. J. Perinatol. 2016, 33,618–624. [PubMed]
3. Zavalza-Gómez, A.B. Obesity and oxidative stress: A direct link to preeclampsia? Arch. Gynecol. Obstet.2011, 283, 415–422. [CrossRef] [PubMed]
4. Institute of Medicine (US); National Research Council (US); Committee to Reexamine IOM PregnancyWeight Guidelines. Consequences of Gestational Weight Gain for the Child. In Weight Gain duringPregnancy: Reexamining the Guidelines; Rasmussen, K.M., Yaktine, A.L., Eds.; National Academies Press (US):Washington, DC, USA, 2009. Available online: https://www.ncbi.nlm.nih.gov/books/NBK32816/ (accessed on24 September 2020).
5. McKerracher, L.; Moffat, T.; Barker, M.; McConnell, M.; Atkinson, S.A.; Murray-Davis, B.; McDonald, S.D.;Sloboda, D.M. Knowledge about the Developmental Origins of Health and Disease is independentlyassociated with variation in diet quality during pregnancy. Matern. Child Nutr. 2020, 16, e12891. [CrossRef][PubMed]
6. Zhang, Y.; Liu, J.; Yao, J.; Ji, G.; Qian, L.; Wang, J.; Zhang, G.; Tian, J.; Nie, Y.; Zhang, Y.E.; et al. Obesity:Pathophysiology and intervention. Nutrients 2014, 6, 5153–5183. [CrossRef]
7. Lynch, C.M.; Sexton, D.J.; Hession, M.; Morrison, J.J. Obesity and mode of delivery in primigravid andmultigravid women. Am. J. Perinatol. 2008, 25, 163–167. [CrossRef] [PubMed]
8. Siega-Riz, A.M.; Gray, G.L. Gestational weight gain recommendations in the context of the obesity epidemic.Nutr. Rev. 2013, 71, 26–30. [CrossRef] [PubMed]

Healthcare 2020, 8, 362 14 of 15
9. Moussa, H.N.; Alrais, M.A.; Leon, M.G.; Abbas, E.L.; Sibai, B.M. Obesity epidemic: Impact from preconceptionto postpartum. Future Sci. 2016, 2. [CrossRef]
10. Huda, S.S.; Brodie, L.E.; Sattar, N. Obesity in pregnancy: Prevalence and metabolic consequences. Semin.Fetal Neonatal Med. 2010, 15, 70–76. [CrossRef]
11. Krakowiak, P.; Walker, C.K.; Bremer, A.A.; Baker, A.S.; Ozonoff, S.; Hansen, R.L.; Hertz-Picciotto, I. Maternalmetabolic conditions and risk for autism and other neurodevelopmental disorders. Pediatrics 2012, 129,1121–1128. [CrossRef]
12. Edlow, A.G. Maternal obesity and neurodevelopmental and psychiatric disorders in offspring. Prenat. Diagn.2017, 37, 95–110. [CrossRef]
13. Van der Burg, J.; Sen, S.; Chomitz, V.; Seidell, J.; Leviton, A.; Dammann, O. The role of systemic inflammationlinking maternal BMI to neurodevelopment in children. Pediatr. Res. 2016, 79, 3–12. [CrossRef] [PubMed]
14. Widen, E.M.; Kahn, L.G.; Cirillo, P.; Cohn, B.; Kezios, K.L.; Factor-Litvak, P. Prepregnancy overweightand obesity are associated with impaired child neurodevelopment. Matern. Child Nutr. 2018, 14, e12481.[CrossRef] [PubMed]
15. Ghassabian, A.; Sundaram, R.; Wylie, A.; Bell, E.; Bello, S.C.; Yeung, E. Maternal medical conditions duringpregnancy and gross motor development up to age 24 months in the Upstate KIDS study. Dev. Med. ChildNeurol. 2016, 58, 728–734. [CrossRef] [PubMed]
16. Girchenko, P.; Tuovinen, S.; Lahti-Pulkkinen, M.; Lahti, J.; Savolainen, K.; Heinonen, K.; Pyhälä, R.;Reynolds, R.M.; Hämäläinen, E.; Villa, P.M.; et al. Maternal early pregnancy obesity and related pregnancyand pre-pregnancy disorders: Associations with child developmental milestones in the prospective PREDOStudy. Int. J. Obes. 2018, 42, 995–1007. [CrossRef]
17. Zakon o Lecenju Neplodnosti Postupcima Biomedicinski Potpomognutog Oplodenja. Available online:https://www.rfzo.rs/download/zakoni/Zakon_vto.pdf (accessed on 14 September 2020).
18. American College of Obstetricians and Gynecologists; Society for Maternal-Fetal Medicine. ACOG PracticeBulletin No. 144: Multifetal gestations: Twin, triplet, and higher-order multifetal pregnancies. Obstet.Gynecol. 2014, 123, 1118–1132.
19. Moaddab, A.; Chervenak, F.A.; Mccullough, L.B.; Sangi-Haghpeykar, H.; Shamshirsaz, A.A.; Schutt, A.;Arian, S.E.; Fox, K.A.; Dildy, G.A.; Shamshirsaz, A.A. Effect of advanced maternal age on maternal andneonatal outcomes in assisted reproductive technology pregnancies. Eur. J. Obstet. Gynecol. Reprod. Biol.2017, 216, 178–183. [CrossRef]
20. Wennberg, A.L.; Opdahl, S.; Bergh, C.; Aaris Henningsen, A.K.; Gissler, M.; Romundstad, L.B.; Pinborg, A.;Tiitinen, A.; Skjærven, R.; Wennerholm, U.B. Effect of maternal age on maternal and neonatal outcomes afterassisted reproductive technology. Fertil. Steril. 2016, 106, 1142.e14–1149.e14. [CrossRef]
21. Gharacheh, M.; Yasemi, R.; Ave, V. Increased rate of elective cesarean delivery following assisted reproductivetechnology: A letter to the editor. Int. J. Reprod. Biomed. 2020, 18, 145–146.
22. Declercq, E.; Luke, B.; Belanoff, C.; Cabral, H.; Diop, H.; Gopal, D.; Hoang, L.; Kotelchuck, M.; Stern, J.E.;Hornstein, M.D. Perinatal outcomes associated with assisted reproductive technology: The MassachusettsOutcomes Study of Assisted Reproductive Technologies (MOSART). Fertil. Steril. 2015, 103, 888–895.[CrossRef]
23. Stern, J.E.; Luke, B.; Tobias, M.; Gopal, D.; Hornstein, M.D.; Diop, H. Adverse pregnancy and birth outcomesassociated with underlying diagnosis with and without assisted reproductive technology treatment. Fertil.Steril. 2015, 103, 1438–1445. [CrossRef]
24. World Health Organization. Body Mass Index. Available online: http://www.euro.who.int/en/health-topics/disease-prevention/nutrition/a-healthy-lifestyle/body-mass-index-bmi (accessed on 31 May 2020).
25. Schmitz, T.; Sentilhes, L.; Lorthe, E.; Gallot, D.; Madar, H.; Doret-Dion, M.; Beucher, G.; Charlier, C.;Cazanave, C.; Delorme, P.; et al. Preterm Premature Rupture of the Membranes: Guidelines for ClinicalPractice From the French College of Gynaecologists and Obstetricians (CNGOF). Eur. J. Obstet. Gynecol.Reprod. Biol. 2019, 236, 1–6. [CrossRef] [PubMed]
26. Resnik, R.; Lockwood, C.; Moore, T.; Greene, M.; Copel, J.; Silver, R. Creasy and Resnik’s Maternal-FetalMedicine: Principles and Practice, 8th ed.; Elsevier: Philadelphia, PA, USA, 2018.
27. Lackovic, M.; Nikolic, D.; Filimonovic, D.; Petronic, I.; Mihajlovic, S.; Golubovic, Z.; Pavicevic, P.; Cirovic, D.Reliability, Consistency and Temporal Stability of Alberta Infant Motor Scale in Serbian Infants. Children2020, 7, 16. [CrossRef] [PubMed]

Healthcare 2020, 8, 362 15 of 15
28. Nunnery, D.; Ammerman, A.; Dharod, J. Predictors and outcomes of excess gestational weight gain amonglow-income pregnant women. Health Care Women Int. 2018, 39, 19–33. [CrossRef] [PubMed]
29. Yong, H.Y.; Mohd Shariff, Z.; Mohd Yusof, B.N.; Rejali, Z.; Tee, Y.Y.S.; Bindels, J.; van der Beek, E.M.Pre-Pregnancy BMI Influences the Association of Dietary Quality and Gestational Weight Gain: The SECOSTStudy. Int. J. Environ. Res. Public Health 2019, 16, 3735. [CrossRef]
30. Dong, B.; Yu, H.; Wei, Q.; Zhi, M.; Wu, C.; Zhu, X.; Li, L. The effect of pre-pregnancy body mass index andexcessive gestational weight gain on the risk of gestational diabetes in advanced maternal age. Oncotarget2017, 8, 58364–58371. [CrossRef]
31. Simmons, D.; Devlieger, R.; van Assche, A.; Galjaard, S.; Corcoy, R.; Adelantado, J.M.; Dunne, F.; Desoye, G.;Kautzky-Willer, A.; Damm, P.; et al. Association between Gestational Weight Gain, Gestational DiabetesRisk, and Obstetric Outcomes: A Randomized Controlled Trial Post Hoc Analysis. Nutrients 2018, 10, 1568.[CrossRef]
32. Gaillard, R.; Durmus, B.; Hofman, A.; Mackenbach, J.; Steegers, E.; Jaddoe, V. Risk Factors and Outcomes ofMaternal Obesity and Excessive Weight Gain During Pregnancy. Obesity 2013, 21, 1046–1055. [CrossRef]
33. Sanchez, C.; Barry, C.; Sabhlok, A.; Russell, A.; Majors, A.; Kollins, S.; Fuemmeler, B. Maternal Pre-PregnancyObesity and Child Neurodevelopmental Outcomes: A Meta-Analysis. Obes. Rev. 2018, 19, 464–484.[CrossRef]
34. Stang, J.; Huffman, L. Position of the Academy of Nutrition and Dietetics: Obesity, Reproduction, andPregnancy Outcomes. J. Acad. Nutr. Diet. 2016, 116, 677–691. [CrossRef]
35. Howell, K.; Powell, T. Effects of Maternal Obesity on Placental Function and Fetal Development. Reproduction2017, 153, 97–108. [CrossRef]
36. Abdulmalik, M.A.; Ayoub, J.J.; Mahmoud, A.; Nasreddine, L.; Naja, F.; MINA collaborators. Pre-pregnancyBMI, Gestational Weight Gain and Birth Outcomes in Lebanon and Qatar: Results of the MINA Cohort.PLoS ONE 2019, 14, e0219248. [CrossRef] [PubMed]
37. Goldstein, R.; Abell, S.; Ranasinha, R.; Misso, M.; Boyle, J.; Harrison, C.; Black, M.H.; Li, N.; Hu, G.; Corrado, F.;et al. Gestational Weight Gain Across Continents and Ethnicity: Systematic Review and Meta-Analysis ofMaternal and Infant Outcomes in More Than One Million Women. BMC Med. 2018, 16, 153. [CrossRef][PubMed]
38. Kiel, D.; Dodson, E.; Artal, R.; Boehmer, T.; Tegan, K.; Leet, T. Gestational Weight Gain and PregnancyOutcomes in Obese Women: How Much Is Enough? Obstet. Gynecol. 2007, 10, 752–758. [CrossRef] [PubMed]
39. Raichel, L.; Sheiner, E. Maternal Obesity as a Risk Factor for Complications in Pregnancy, Labor andPregnancy Outcomes. Harefuah 2005, 144, 107–150.
40. Kominiarek, M.; Peaceman, A. Gestational Weight Gain. Am. J. Obstet. Gynecol. 2017, 217, 642–651. [CrossRef][PubMed]
41. Groth, S.; LaLonde, A.; Wu, T.; Fernandez, D. Obesity Candidate Genes, Gestational Weight Gain, and BodyWeight Changes in Pregnant Women. Nutrition 2018, 48, 61–66. [CrossRef]
42. Tarantino, G.; Citro, V.; Capone, D. Nonalcoholic Fatty Liver Disease: A Challenge from Mechanisms toTherapy. J. Clin. Med. 2020, 9, 15. [CrossRef]
© 2020 by the authors. Licensee MDPI, Basel, Switzerland. This article is an open accessarticle distributed under the terms and conditions of the Creative Commons Attribution(CC BY) license (http://creativecommons.org/licenses/by/4.0/).