the iot based environmental sensing platform
TRANSCRIPT
The IoT Based Environmental
Sensing Platform
by
Yansong Wang
B.Eng.
A thesis submitted in accordance with the requirements for the award of
the degree of Master of Philosophy of the University of Liverpool
June 2019
P a g e | ii
Declaration
I hereby declare that except where specific reference is made to the work of others, the
contents of this thesis are original and have not been submitted in whole or in part for
consideration for any other degree or qualification in this, or any other University. This
dissertation is the result of my own work and includes nothing which is the outcome of
work done in collaboration, except where specifically indicated in the text.
The copyright of this thesis rests with the author. Copies (by any means) either in full,
or of extracts, may not be made without prior written consent from the author.
Copyright © 2019 Yansong Wang. All rights reserved.
P a g e | iii
I would like to dedicate this thesis to my family and friends
P a g e | iv
Acknowledgements
Looking back to the two years of unforgeable and hard-working MPhil studies, I am
grateful to many people and many things. First and foremost, I would like to express
my sincere gratitude and thanks to my main supervisor Professor Yi Huang, who
provided me the precious opportunity to test myself at the highest level. You have
encouraged and helped me to grow up from a fresh graduate student to a young
researcher. I learned so much from you both academically and personally. Thank you
for the invaluable comments and advice on my research as well as my life and career.
It is a great honor for me to be one of your students, and I hope I have repaid the faith
you showed in me.
I would also like to thank my parents. They have always supported me with no
expectation of a reward. Their continuous help and understanding have made my life
full of love and I am grateful for everything you have done. I would also like to express
my appreciation to my girlfriend. I would never have succeeded without her love,
tolerance, support, encouragement and patience. This work is dedicated to you.
Special thanks are also paid to my brilliant and lovely colleagues and friends; in
particular to Dr Jiafeng Zhou, Dr. Chaoyun Song, Dr. Zhouxiang Fei, Dr. Yuan Zhuang,
Dr. Anqi Chen, Dr. Manoj Stanley, Dr Dajun Lei, Dr Zhenghua Tang as well as
Tianyuan Jia, Wenzhang Zhang, Chen Xu, Qiang Hua, Jingyuan Jiang, Lyuwei Chen,
Jinyao Zhang joseph Sumin, Ahmed Aliedin and Umniyyah Ulfa for many fruitful
discussions and enjoyable moments.
P a g e | v
Table of Contents
Contents
The IoT Based Environmental Sensing Platform ...................................................................... i
Table of Contents ......................................................................................................................... v
List of Figures ............................................................................................................................. vii
Acronyms .......................................................................................................................................ix
Abstract ........................................................................................................................................ xii
Chapter 1 Introduction .......................................................................................................... 1
1.1 Background: Internet of Things .................................................................................................1
1.2 IoT Applications: ...........................................................................................................................6
1.3 Motivation of this work: ........................................................................................................... 11
1.3.1 Motivations...................................................................................................................... 11
1.3.2 Challenges ....................................................................................................................... 12
1.3.3 Objectives ........................................................................................................................ 13
1.3.4 Original Contributions: ................................................................................................. 14
1.4 Thesis Outline: ............................................................................................................................ 15
References: ......................................................................................................................................... 16
Chapter 2 Literature Review ............................................................................................... 22
2.1 Review of Communication Protocols for IoT Applications .............................................. 22
2.1.1 Short-Range Communication Protocols .................................................................. 22
2.1.2 Low Power Wide Area Network (LPWAN) Protocols ............................................ 24
2.2 Review of Wireless Sensor Network ...................................................................................... 29
2.3 Review of Environmental Monitoring Activities ................................................................. 32
2.4 Summary ...................................................................................................................................... 35
References: ......................................................................................................................................... 36
Chapter 3 A Compact Anemometer with Ultra-low Energy Consumption............ 43
3.1 Introduction ................................................................................................................................ 43
3.2 Model Establishment and Theory .......................................................................................... 47
3.2.1 Sensor Design and Measuring Method ................................................................... 47
3.2.2 Model Establishment .................................................................................................... 50
3.3 Experimental Results and Discussions .................................................................................. 54
3.4 Summary ...................................................................................................................................... 60
References .......................................................................................................................................... 61
Chapter 4 An Environmental Sensing Platform with Self-powered Standalone
Weather Stations ....................................................................................................................... 65
4.1 Introduction .......................................................................................................................... 65
4.2 Hardware and Software ..................................................................................................... 67
4.2.1 Hardware ......................................................................................................................... 67
4.2.2 Software ........................................................................................................................... 73
P a g e | vi
4.3 Measurement and Discussion .......................................................................................... 76
4.3.1 Deployment .................................................................................................................... 76
4.3.2 Measurement Results ................................................................................................... 77
4.3.3 Coverage Analysis ......................................................................................................... 81
4.3.4 Energy Performance Analysis ..................................................................................... 83
4.3.5 Discussions ...................................................................................................................... 86
4.4 Summary ............................................................................................................................... 88
4.5 Reference: .................................................................................................................................... 88
Chapter 5 Conclusions and Future Work ........................................................................ 93
5.1 Summary ...................................................................................................................................... 93
5.2 Key Contributions and Limitations ........................................................................................ 94
5.3 Future Work .......................................................................................................................... 96
P a g e | vii
List of Figures
Fig. 1- 1The global IoT market growth [9].................................................................................... 1
Fig. 1- 2 The IoT architecture [2]. (a) Three-layer. (b) Five-layer. ......................................... 4
Fig. 1- 3 IoT application areas [17].................................................................................................. 6
Fig. 2- 1 Three classes of LoRaWAN end devices [26]. .......................................................... 27
Fig. 2- 2 The LoRaWAN architecture [27]. .................................................................................. 28
Fig. 2- 3 Five layers protocol stacks for wireless sensor network [29]. .............................. 29
Fig. 2- 4 A weather station mounted on the adjustable tripod [44]. ................................. 33
Fig. 3- 1 A cup-type anemometer. ............................................................................................... 44
Fig. 3- 2 An ultrasonic anemometer [11]. ................................................................................... 45
Fig. 3- 3 A hot-wire anemometer [16].. ...................................................................................... 45
Fig. 3- 4 The accelerometer, sensor case, and mounting structure.. ................................. 48
Fig. 3- 5 The 3D force analysis of the anemometer.. .............................................................. 52
Fig. 3- 6 The setup of the wind speed measurement. ............................................................ 54
Fig. 3- 7 The measured accelerations of two axes without data processing. ................. 55
Fig. 3- 8 The measured accelerations of two axes with data processing. ........................ 56
Fig. 3- 9 The comparison between the measured wind velocity and the actual wind
velocity. .......................................................................................................................................... 56
Fig. 3- 10 The comparison between the proposed anemometer and the
commercial cup-type anemometer. .................................................................................... 57
Fig. 3- 11 The wind speed measurements of the commerical anemometer and the
proposed anemometer. ........................................................................................................... 58
Fig. 3- 12 The wind direction measurements of the commerical anemometer and
the proposed anemometer..................................................................................................... 58
Fig.4- 1 The architecture of the weather station. ..................................................................... 67
Fig.4- 2 RN2483 LoRaWAN communication module. ............................................................ 70
Fig.4- 3 The inside look of the sensor node. ............................................................................. 70
Fig.4- 4 The outside look of the sensor node. .......................................................................... 72
Fig.4- 5 The LoRaWAN gateway. ................................................................................................... 72
Fig.4- 6 Software working diagram .............................................................................................. 74
Fig.4- 7 The architecture of the environmental sensing platform. ..................................... 75
Fig.4- 8 The deployment of sensor nodes and the LoRaWAN gateway.. ........................ 77
Fig.4- 9 The measured temperature over 5 days. .................................................................... 77
Fig.4- 10 The measured air pressure over 5 days. ................................................................... 78
Fig.4- 11 The measured humidity over 5 days.......................................................................... 78
Fig.4- 12 The measured loudness over 5 days. ........................................................................ 78
Fig.4- 13 The measured air quality over 5 days........................................................................ 79
Fig.4- 14 The measured results of three sensor nodes. ......................................................... 80
Fig.4- 15 The coverage test of LoRaWAN. ................................................................................. 80
Fig.4- 16 The coverage distance of the LoRaWAN gateway. ............................................... 82
P a g e | viii
Fig.4- 17 The current consumption of the sensor node. ....................................................... 84
Fig.4- 18 The change of the voltage level in 3 months.......................................................... 84
Fig.4- 19 The change of the voltage level in 1 month. .......................................................... 85
P a g e | iv
Acronyms
ABP Activating By Personalization
ABS Acrylonitrile Butadiene Styrene
ADR Adaptive Data Rate
API Application Programming Interface
BLE Bluetooth Low Energy
CR Code Rate
DBPSK Differential Encoding Binary Phase-Shift
Keying
FSK Frequency Shift Keying
GFSK Gaussian Frequency Shift Keying
GMSK Gaussian Minimum Shift Keying
GSM Global System for Mobile
HVAC Heating Ventilation and Air Conditioning
ICT Information and Communications
Technology
IMU Inertial Measurement Unit
P a g e | x
IoT Internet of Things
ISM Industrial, Scientific, and Medical
ISO International Organization for
Standardization
ISP In-System Programming
LPP Lowe Power Payload
LPWAN Low-Power Wide-Area Network
LTE Long-Term Evolution
MAC Media Access Control
MCU Microcontroller Unit
NB-IoT Narrowband Internet of Things
NFC Near-Field Communication
OSI Open Systems Interconnection
OTAA Over The Air Activation
PC Polycarbonate
PHY Physical
PMU Power Management Unit
PZT Piezoelectric Transducer
P a g e | xi
RFID Radio-Frequency Identification
RSSI Received Signal Strength Indicator
SC-FDMA Single Carrier Frequency Division
Multiple Access
SF Spreading Factor
SoC System on Chip
SRAM Static Random-Access Memory
TPH Temperature Pressure Humidity
TTN The Things Network
VOC Volatile Organic Compounds
Wi-Fi Wireless Fidelity
WSN Wireless Sensor Network
P a g e | xii
Abstract
Environmental monitoring defined as using sensors to detect the condition of the
ambient environment has attracted an upsurge of research interests. It can be applied in
many fields such as weather prediction, outdoor asset monitoring, structural health
monitoring, etc. IoT technologies act as an essential tool to realize the wireless
connection between weather stations and the real-time data collection from
environmental sensing nodes. One of the ultimate objectives of environmental
monitoring is to deploy sensing devices over a large area to obtain enough data samples
automatically for condition analysis and management. However, current weather
stations are constrained by their high energy consumption, bulky size, limited
accessibility, and high cost, which impedes the wide deployment of environmental
sensing devices. The purpose of this thesis is to develop a new environmental sensing
platform by adopting IoT technologies which could overcome many challenging design
problems in this field. There are two main contributions of this thesis.
The first contribution is the development of an ultra-low energy consumption
anemometer. There are different ways to measure the wind speed, using such as
ultrasonic sensors and hot-film resistors. However, the energy consumptions of those
anemometers are relatively high, and extra power lines need to be connected to power
the anemometer. A novel method to measure the wind speed and direction is developed
which uses a 6-axis accelerometer to measure the change of the acceleration induced
by the wind force and then to calculate the corresponding wind speed. The power
consumption of the proposed anemometer is only 3.42 mW, which is significantly
smaller than other anemometers, thus batteries can be used as the energy source to
power the proposed anemometer instead of the power line. The new design can make
an anemometer to be a standalone device powered by a battery only, which increases
the deployment flexibility of the sensor node. The proposed anemometer has low
energy consumption and compact size which also allows it to be easily integrated to be
P a g e | xiii
part of an environmental sensing platform.
The second contribution of this work is the development of an IoT based environmental
sensing platform which consists of wireless sensor nodes, a communication network,
data visualization and storage cloud. The environmental sensing platform has the ability
of collect, send, present, and store various environmental parameters and it has the
advantages of easy deployment, real-time accessibility, low deployment and
maintenance cost. The sensing device in the environmental platform is a true standalone
device which has wireless connection and can be powered by using a solar panel. The
data gathered by the sensor node can be transmitted to a data visualization platform
named Cayenne in real time, and the user can easily access the collected data from
sensors deployed in different areas.
This thesis has introduced and successfully demonstrated a number of novel methods
for environmental monitoring applications. An environmental sensing platform has
been developed with improved performance in terms of such as reducing the energy
consumption of the device, increasing the deployment flexibility of the end device, and
improving the connectivity of the sensor node. The proposed environmental sensing
platform is of great importance to future research and industry applications.
Chapter 1: Introduction
P a g e | 1
Chapter 1 Introduction
1.1 Background: Internet of Things
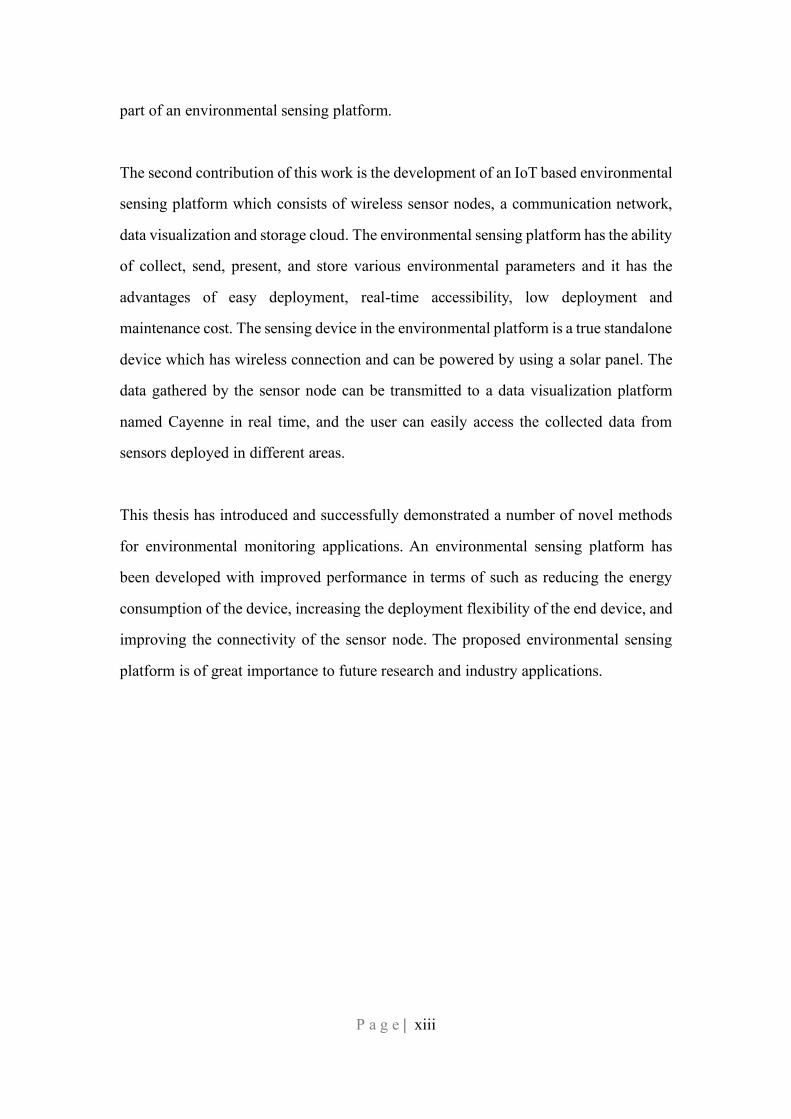
The Internet of Things (IoT) is a concept first introduced by Kevin Ashton at Procter &
Gamble (P&G) in 1999 who viewed Radio-Frequency Identification (RFID) as an
essential technology to the Internet of Things [1]. With the rapid development of
advanced communication technologies in the last two decades, different short-range
and long-range communication protocols such as RFID, Wi-Fi, Bluetooth, Bluetooth
Low Energy (BLE), Zigbee, LoRaWAN, and Narrow Band Internet of Things (NB-IoT)
have been widely used to connect a vast number of devices. Nowadays, The Internet of
Things has become one of the hottest emerging technologies which could
fundamentally change the way how people interact with things. IoT can be defined as
things and sensors being connected to the Internet to achieve the interchange of data
and message to realize smart control and management [2]. The Machine-to-Machine
(M2M) traffic volume in the U.S. has a 250 % growth in 2011, and 45 % of the total
internet traffic flows will be constituted by M2M communications by 2022 [3-7]. IoT
has become national strategies of some countries[8].
Fig. 1- 1 The global IoT market growth [9].
Chapter 1: Introduction
P a g e | 2
Different technologies such as information and communications technology (ICT),
wireless sensor network (WSN), radio-frequency identification (RFID), system on chip
(SoC), machine learning, big data, and cloud computing contribute to the development
of IoT. Some latest communication methods like LoRaWAN and NB-IoT were specially
designed for machine-type communication with low energy consumption, wide
coverage, and strong robustness against noise. It provides reliable channels for things
to be connected to the Internet. The wireless sensor network (WSN) is a large number
of sensors connected to form a network. The sensors can provide useful information
about the ambient environment or the conditions of the monitored devices. RFID is a
foundational technology for IoT, which is widely used in logistics, retailing, and supply
chain to identify, track and monitor objects attached with RFID tags. To realize smart
control and management, we need to process and analyze the gathered data by using
machine learning algorithms.
IoT architecture can generally be viewed as a centralized architecture, where a
heterogeneous and dense set of devices deployed over a wide area generate a large
amount of data delivered by using suitable communication technologies to a control
center [10]. Then, the data will be stored and processed for further decision making,
smart control, and other purposes. A key characteristic of an IoT architecture is its
capability of integrating different devices, systems, and technologies into the same
existed centralized platform to support the progressive evolution of the IoT. Also, for a
centralized network, the data should be transferred by using a reliable channel to reduce
the latency and packet errors to provide reliable information in time. There are other
design criteria that need to be concerned, such as security, real-time interaction,
interoperability, and energy consumption to improve the overall performance of the
centralized platform.
Since it is very challenging to design a centralized platform consisting of millions of
devices deployed over a wide range, and some researchers propose new decentralized

Chapter 1: Introduction
P a g e | 3
IoT architectures based on blockchain or fog computing. By adopting the blockchain
technology, it provides the access control policies to improve the mobility, accessibility,
scalability, security, and the transparency of IoT platforms [11]. Instead of transmitting
the data to the cloud to be further processed, the fog computing allows to do the
calculation and make decisions in local to avoid generating a huge volume of data to be
transmitted and reduce the latency [12].
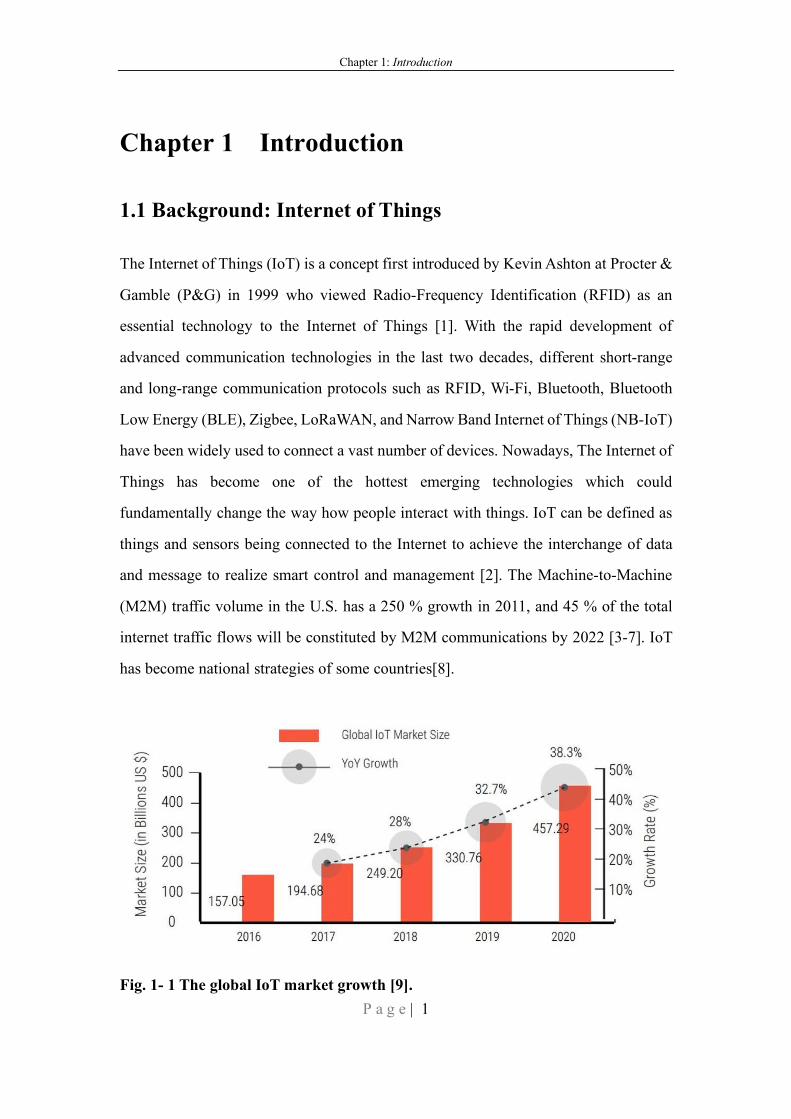
The International Standards Organization (ISO) developed the Open Systems
Interconnection (OSI) model to divide network communication into seven layers which
are the physical layer, the data link layer, the network layer, the transport layer, the
session layer, the presentation layer, and the application layer [13]. The IoT model is
very similar to the communication model, and the basic model is a 3-layer architecture
consisting of perception, network, and application layers [14]. Recently, more models
have been proposed to add more functions to the IoT architecture, and a five-layer
model has been summarized to deliver the full functionality of the IoT, which are the
objects layer, the object abstraction layer, the service management layer, the application
layer and the business layer [2]. IoT architecture can be explained in Fig. 1-2.
Chapter 1: Introduction
P a g e | 4
Fig. 1- 2 The IoT architecture [2]. (a) Three-layer. (b) Five-layer.
A. Objects Layer
The first layer can be viewed as the perception layer, where different sensors and
actuators are used together to sense data from the ambient environment and perform
operations. RFID tags can also be used to track and monitor things. It works as the
fundamental layer of the IoT to gather physical information like weight, motions,
vibrations, temperature, humidity, brightness, positions, and acceleration to be further
processed and analyzed. It provides data to be transferred in the object abstraction layer.
B. Object Abstraction Layer
In this layer, it allows collected data from the objects layer to be transmitted and shared
with other devices or central cloud to realize the interconnections of different things.
The object abstraction layer provides channels for the data to be transferred by using
some advanced communication technologies such as Bluetooth Low Energy (BLE),
Chapter 1: Introduction
P a g e | 5
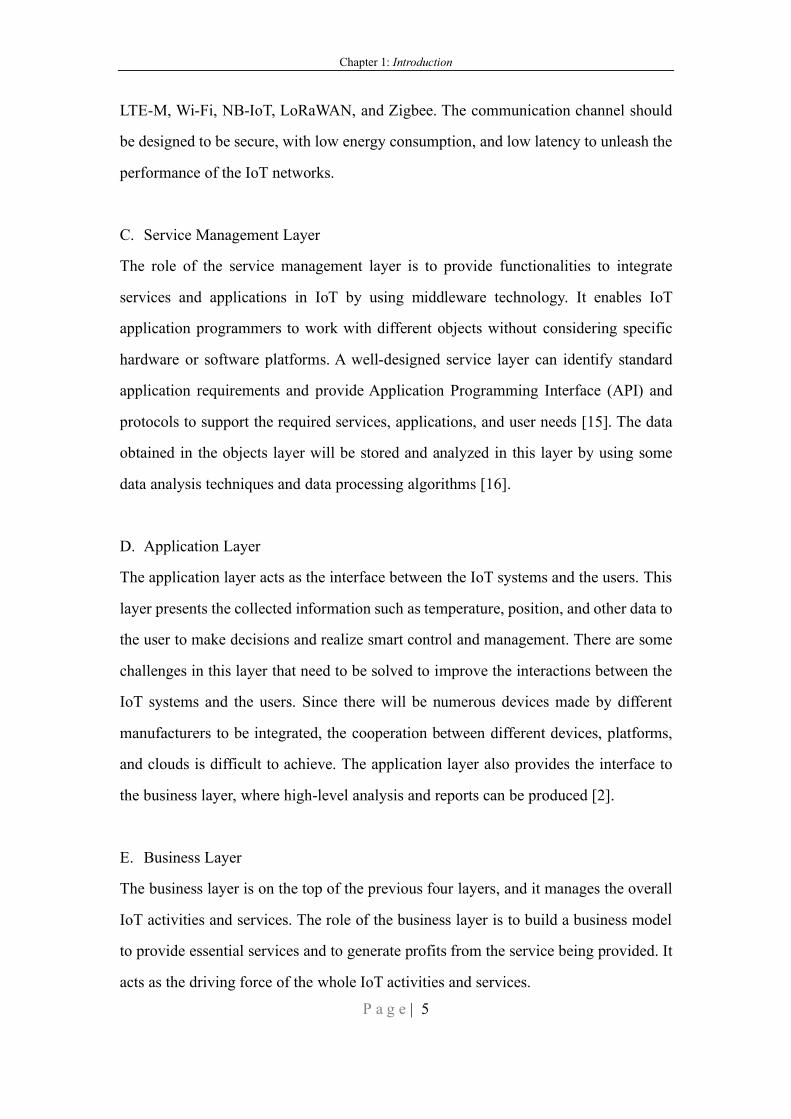
LTE-M, Wi-Fi, NB-IoT, LoRaWAN, and Zigbee. The communication channel should
be designed to be secure, with low energy consumption, and low latency to unleash the
performance of the IoT networks.
C. Service Management Layer
The role of the service management layer is to provide functionalities to integrate
services and applications in IoT by using middleware technology. It enables IoT
application programmers to work with different objects without considering specific
hardware or software platforms. A well-designed service layer can identify standard
application requirements and provide Application Programming Interface (API) and
protocols to support the required services, applications, and user needs [15]. The data
obtained in the objects layer will be stored and analyzed in this layer by using some
data analysis techniques and data processing algorithms [16].
D. Application Layer
The application layer acts as the interface between the IoT systems and the users. This
layer presents the collected information such as temperature, position, and other data to
the user to make decisions and realize smart control and management. There are some
challenges in this layer that need to be solved to improve the interactions between the
IoT systems and the users. Since there will be numerous devices made by different
manufacturers to be integrated, the cooperation between different devices, platforms,
and clouds is difficult to achieve. The application layer also provides the interface to
the business layer, where high-level analysis and reports can be produced [2].
E. Business Layer
The business layer is on the top of the previous four layers, and it manages the overall
IoT activities and services. The role of the business layer is to build a business model
to provide essential services and to generate profits from the service being provided. It
acts as the driving force of the whole IoT activities and services.
Chapter 1: Introduction
P a g e | 6
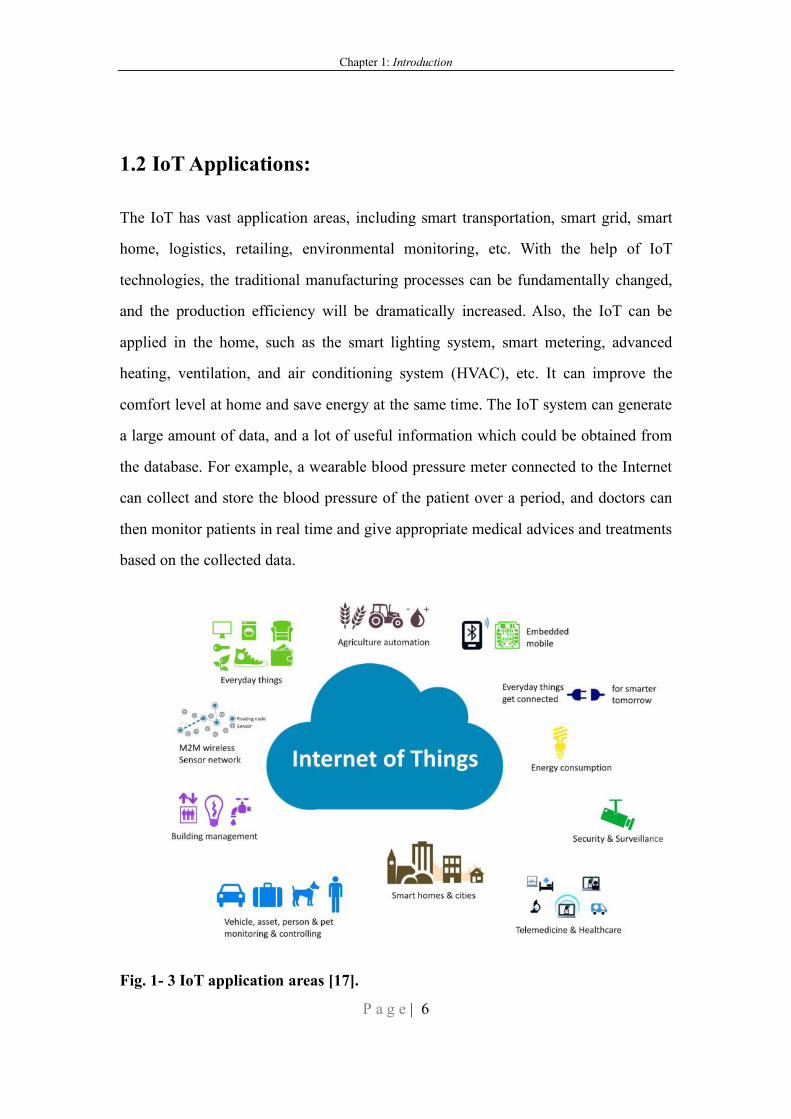
1.2 IoT Applications:
The IoT has vast application areas, including smart transportation, smart grid, smart
home, logistics, retailing, environmental monitoring, etc. With the help of IoT
technologies, the traditional manufacturing processes can be fundamentally changed,
and the production efficiency will be dramatically increased. Also, the IoT can be
applied in the home, such as the smart lighting system, smart metering, advanced
heating, ventilation, and air conditioning system (HVAC), etc. It can improve the
comfort level at home and save energy at the same time. The IoT system can generate
a large amount of data, and a lot of useful information which could be obtained from
the database. For example, a wearable blood pressure meter connected to the Internet
can collect and store the blood pressure of the patient over a period, and doctors can
then monitor patients in real time and give appropriate medical advices and treatments
based on the collected data.
Fig. 1- 3 IoT application areas [17].
Chapter 1: Introduction
P a g e | 7
1) Smart Home
An increasing number of home appliances like refrigerator, oven, and washing machine
are now becoming computing-enabled and can be connected to the internet by using
Wi-Fi or Bluetooth. Those Internet-connected devices in the home can provide to the
users with more reliable information about their current status, and the user can have
more convenient control of those home appliances. There are more advantages an IoT
system can bring in a smart home. The smart lighting system and the HVAC system can
offer a comfortable living space and save energy at the same time; some security
cameras, magnetic door, and window alarms, motion sensors, and smoke sensors can
guarantee a safe living space. Some smart speakers are now acting as the interfaces
between the users and home appliances, and users can talk with the smart speaker to
control some home appliances like light bulbs. However, there are some issues raised
by IoT technologies as well, and privacy and data security are vital concerns [18]. With
more devices in the home connected to the Internet, more secure, sophisticated, and
robust data and access protection systems should be designed to avoid cybersecurity
attack.
2) Elderly People Care
The life expectancy of people has continuously increased due to the advanced medical
treatments, and the percentage of the elderly people in total population keeps raising as
well [3, 19]. Some of the elderly people have to live alone, and they will be difficult to
take care of themselves, especially when emergencies happen. A fall-detection system
is vital for aged people to send alarming signals to the corresponding people to offer
help when a fall is detected [20]. The IoT technologies can be a very promising solution
to partially solve the elderly people care problem by deploying some Internet-connected
device to realize real-time monitoring and emergency warning. The design and
deployment of the IoT based elderly people care system are very challenging. Because
elderly people can be relatively difficult to learn new technologies, and the deployed
Chapter 1: Introduction
P a g e | 8
system should be noninvasive so that the new technologies will not change the living
style of the elderly people. Also, the collected data should also be kept safe and secure
to protect the privacy of the user. The upfront hardware investment of the system and
the total cost of the elderly people care service are still too high to achieve a large-scale
deployment [21]. A low cost, noninvasive, reliable and user-friendly elderly people care
system should be designed, and a replicable business model of the elderly people care
service should be developed as well.
3) Health Care
With the help of the wireless sensors and advanced communication technologies, IoT
is redesigning modern health with promising technological, economic, and social
prospects [22]. IoT based health care can be applied to glucose level sensing, oxygen
saturation monitoring, rehabilitation system, medication management, and wheelchair
management. RFID tags can be used to monitor and track the production and
distribution of medicine to guarantee the quality of each medicine. Different wearable
sensors like blood pressure sensors, body temperature sensors, electrocardiograms
sensors, and electromyography sensors can be used to collect vital data to support early
diagnosis, real-time monitoring, and medical emergencies. With the dramatical expends
of the application of wireless sensing technologies in medical treatment, a confined
hospital environment can be extended to the patient’s home to provide a quiet, familiar
and less stressful place for the patent [23]. Some start-up and large companies are
actively involved in the building of IoT medical cloud and database to transmit, store,
and present collected data. A Chinese firm has developed an all-in-one medical imaging
and information management platform supporting cloud-based image storage and
computation, 3-D image post-processing, and visualization [22]. More research and
development efforts should be put in this area to make health care more convenient,
affordable, and effective.
Chapter 1: Introduction
P a g e | 9
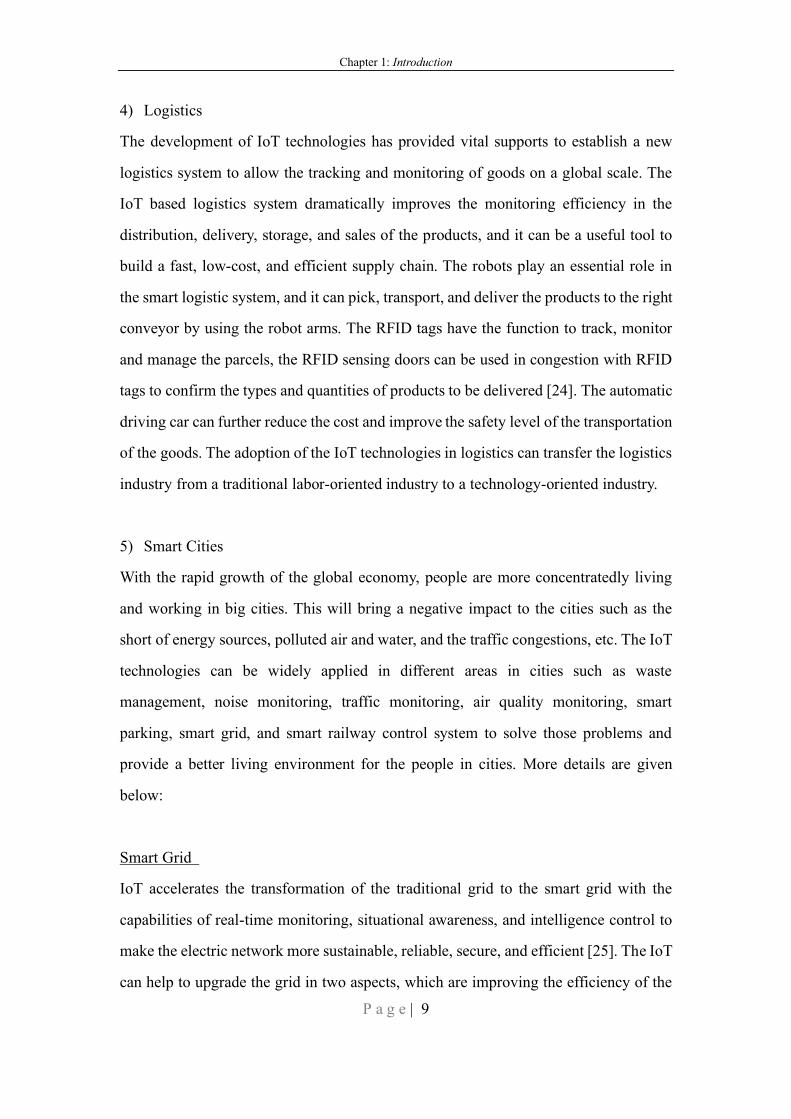
4) Logistics
The development of IoT technologies has provided vital supports to establish a new
logistics system to allow the tracking and monitoring of goods on a global scale. The
IoT based logistics system dramatically improves the monitoring efficiency in the
distribution, delivery, storage, and sales of the products, and it can be a useful tool to
build a fast, low-cost, and efficient supply chain. The robots play an essential role in
the smart logistic system, and it can pick, transport, and deliver the products to the right
conveyor by using the robot arms. The RFID tags have the function to track, monitor
and manage the parcels, the RFID sensing doors can be used in congestion with RFID
tags to confirm the types and quantities of products to be delivered [24]. The automatic
driving car can further reduce the cost and improve the safety level of the transportation
of the goods. The adoption of the IoT technologies in logistics can transfer the logistics
industry from a traditional labor-oriented industry to a technology-oriented industry.
5) Smart Cities
With the rapid growth of the global economy, people are more concentratedly living
and working in big cities. This will bring a negative impact to the cities such as the
short of energy sources, polluted air and water, and the traffic congestions, etc. The IoT
technologies can be widely applied in different areas in cities such as waste
management, noise monitoring, traffic monitoring, air quality monitoring, smart
parking, smart grid, and smart railway control system to solve those problems and
provide a better living environment for the people in cities. More details are given
below:
Smart Grid
IoT accelerates the transformation of the traditional grid to the smart grid with the
capabilities of real-time monitoring, situational awareness, and intelligence control to
make the electric network more sustainable, reliable, secure, and efficient [25]. The IoT
can help to upgrade the grid in two aspects, which are improving the efficiency of the
Chapter 1: Introduction
P a g e | 10
distribution of the energy and the quality of electricity. With the help of advanced
photovoltaic and battery technologies, the energy flow in the smart grid becomes
bidirectional. Thus, smart power meters need to be connected to measure the energy
flow in the grid to meet the users need and improve the efficiency of the energy
distribution in the electricity network. The real-time monitoring of the energy flow can
also guarantee high-quality energy and uninterrupted energy supply in the smart grid
[26].
Smart Parking
The parking spot can be equipped with smart parking meters by using RFID or Near
Field Communication (NFC) to realize the detections and identifications of the cars [10,
27]. There is a novel method to track the car in a parking spot, which is to obtain the
information of the car and the vehicle license plate by using digital camera imaging
sensors. The gathered information of the parking slot can be transmitted to central cloud,
and the user can be easier to find the available parking slots through the smart parking
system which could save the parking time, decrease the CO2 emission, and reduce the
traffic congestion [28].
Environment Monitoring
Environmental issues such as climate changes have received much attention recently,
making it an active and hot research area. The acquisition of the environmental data can
be achieved by a variety of technologies such as remote sensing, geographical
information system, and global positioning system [29]. Wireless Sensor Network can
be another promising technology to collect environmental data automatically, it can be
used together with the cloud computing to collect and analyze the received
environmental data to understand and react to the environment [30]. Internet of things
can provide support for the transmission, storage, and management of a large amount
of data to accurately record the trend of the climate change over the years [31].
Chapter 1: Introduction
P a g e | 11
1.3 Motivation of this work:
1.3.1 Motivations
In recent years, people increasingly draw attention to climate change and the
greenhouse effect. To statistically study the climate change and the impacts of the
human activities on the environment, we need to collect some basic environmental
parameters like rainfall, temperature, CO2, wind speed, and air quality [31]. Sensor
technologies and wireless network integrated with the IoT technology play essential
roles to gather information from the environment. An environmental sensing platform
is an essential tool to collect, transmit, and process environmental parameters to analyze
and monitor climate change. The environmental sensing platform can also be used in
other activities such as structural monitoring, smart agriculture, and asset monitoring.
A structural health monitoring system can be used to make sure the physical
configurations such as buildings and bridges are structurally safe [32]. Some sensors
such as accelerometers and piezoelectric transducers (PZT) can be densely mounted on
the structure to provide health level and spot the damage sites of the architecture [33].
Some signal processing method should be implemented and integrated with the IoT
system to remove the noise generated by the sensors to determine the actual condition
of the structure [34]. Smart farming is the implementation of different sensors and
communication methods to form a wireless sensor network to wirelessly collect
environmental data like temperature, soil humidity, and rainfall [35]. The collected data
can be sent to a cloud for further processing to realize precision farming. Utilizing the
smart farming wireless sensor network, the farmers can improve the production of the
crop and reduce the maintenance fee by adopting corresponding measures based on the
current condition of the land [36]. There are also some valuable assets such as
substations and wind turbines which are directly placed in the outdoor environment.
The surrounding conditions of these outdoor devices should be continuously monitored
Chapter 1: Introduction
P a g e | 12
by sensors to guarantee they are in a safe environment and are prevented from
malfunctions. IoT is the key enabling technology to achieve the monitoring of the
environment and provide useful data for further analyzation and decision making.
1.3.2 Challenges
However, some technical bottlenecks need to be overcome to fully meet the
requirements of the wide and dense deployments of the environmental sensing systems.
The coverage and the energy consumption of the sensor nodes are two main issues that
need to be solved. For some smart city applications such as traffic monitoring and
weather forecasting, the user would like to achieve city-scale monitoring, and the
design of a communication system to cover a whole city can be challenging. It will be
very inconvenient to use wire to form a communication network, and the deployment
cost can also be high. Thus, the wireless communication method will be chosen to build
a network. However, the coverage of the wireless sensor node is limited, and there are
two solutions to overcome this problem. The first is to use the multi-hop
communication technology where each sensor node can act as a vendor to both receive
and transmit the signal to other nodes, and the information can be transmitted to the
gateway in the end. Another option is to use the Low Power Wide Area Network
(LPWAN) technology such as LoRaWAN, the coverage of each gateway can be up to
15-30 km, and only a few gateways can provide coverage over a large region.
Since each node is a wireless sensor node, the battery is usually the primary energy
source to power the node. The energy consumption of the sensor node should be kept
low to prolong the lifespan of the node and guarantee the overall performance of the
whole sensor network. Also, the sensor node can be integrated with energy harvesting
technology to obtain energy from an ambient environment like solar energy, radio
frequency energy, and mechanical energy to become a self-powered device. There are
Chapter 1: Introduction
P a g e | 13
other technologies need to be used in conjunction with the IoT technology to achieve
the full functional environmental sensing platform. A central cloud should be used to
realize the presentation of the measured results of the sensors in real time and the
storage of the measured data. Wireless sensor network technologies should be used to
form a large communication network to collect data from different node deployed over
a wide region.
1.3.3 Objectives
This thesis is aimed to solve the aforementioned research problems with the following
main objectives:
1. To develop an accelerometer-based anemometer with low power consumption
which could be part of the weather station. The anemometer should have a compact
size and can be powered by using the battery to increase the deployment flexibility.
2. To investigate and compare different communication protocols, and to study the
advantages of selected LPWAN protocols in IoT applications. Then, we will build
the wireless sensor network for the environmental sensing platform by
implementing suitable communication technologies.
3. To develop compact, low cost, and robust environmental wireless sensing nodes
with low development and maintenance fee. The sensing node can be easily
deployed and integrated into an environmental wireless sensor network which can
communicate with other nodes or gateways to collect and transmit useful
information.
4. To utilize cloud and IoT based wireless sensor network to develop an environmental
Chapter 1: Introduction
P a g e | 14
sensing platform which could realize real-time monitoring, data presentation, and
data storage.
1.3.4 Original Contributions:
⚫ The first contribution is the development of an ultra-low energy consumption
anemometer. A novel method to measure the wind speed and direction is developed
which uses a 6-axis accelerometer to measure the change of the acceleration
induced by the wind force and then to calculate the corresponding wind speed. The
power consumption of the proposed anemometer is only 3.42 mW, which is
significantly smaller than other anemometers, thus batteries can be used as the
energy source to power the proposed anemometer instead of the power line. The
new design can make an anemometer to be a standalone device powered by a
battery only, which increases the deployment flexibility of the sensor node. The
proposed anemometer has low energy consumption and compact size which also
allows it to be easily integrated to be part of an environmental sensing platform.
⚫ The second contribution of this work is the development of an IoT based
environmental sensing platform which consists of wireless sensor nodes, a LPWA
communication network, data visualization and storage cloud. The environmental
sensing platform has the ability of collect, send, present, and store various
environmental parameters and it has the advantages of easy deployment, real-time
accessibility, low deployment and maintenance cost. The sensing device in the
environmental platform is a true standalone device which has wireless connection
and can be powered by using a solar panel. The data gathered by the sensor node
can be transmitted to a data visualization platform named Cayenne in real time, and
the user can easily access the collected data from sensors deployed in different
areas.
Chapter 1: Introduction
P a g e | 15
1.4 Thesis Outline:
This thesis consists of five chapters, and it aims to provide an environmental sensing
platform composed of different wireless sensor nodes by adopting the concept of IoT.
We aim to reduce the energy consumption of the sensor node to prolong the battery
lifetime of the end device and avoid replacing the battery too often to increase the
flexibility of the deployment of the sensor nodes. The structure of the thesis is organized
as follows.
⚫ Chapter 1 introduces the IoT and discusses the rapid development of IoT
technologies over recent years. It also introduces wide applications of IoT in
different areas and explore how IoT can help us to improve the living quality and
working efficiency. It stresses the importance of the environmental sensing
applications and the role that IoT can play in related fields. The main aims and the
structure of the thesis are also included in this chapter.
⚫ Chapter 2 introduces different types of communication protocols and how wireless
sensors can be connected by using these protocols to form a wireless sensor
network. Various communication protocols can be divided into two parts, which
are the short-range communication protocols and the LPWAN communication
protocols. LPWAN communication methods have merits of wide coverage and
consuming less energy, which is more suitable for IoT applications. WSN is a
sensor network composed of different sensors deployed in various places to gather
useful information for users, and it can be used to construct the environmental
sensing platform.
⚫ Chapter 3 proposes a compact anemometer with low energy consumption which
could be integrated to an environmental sensing platform. The anemometer can
measure both the wind speed and the wind direction by calculating the
Chapter 1: Introduction
P a g e | 16
accelerations obtained from a 6-axis accelerometer. The proposed anemometer has
a compact size and is designed to consume extremely low energy so that it can be
easily integrated into some power constrained weather stations.
⚫ Chapter 4 presents an environmental sensing platform consisted of self-powered
wireless sensor nodes, the wireless sensor network, and data storage cloud.
Different sensors can be easily integrated into the existing sensing platform. The
sensor node is designed to have a sleep mode, and the device can be put into the
sleep mode most of the time to save energy. A 3 W solar panel is used to charge the
battery to make the whole device to be self-powered.
⚫ Chapter 5 summaries major contributions of this thesis and provides future work
recommendations for this research topic.
References:
[1] K. Ashton, "That ‘internet of things’ thing," RFID journal, vol. 22, no. 7, pp.
97-114, 2009.
[2] A. Al-Fuqaha, M. Guizani, M. Mohammadi, M. Aledhari, and M. Ayyash,
"Internet of things: A survey on enabling technologies, protocols, and
applications," IEEE communications surveys & tutorials, vol. 17, no. 4, pp.
2347-2376, 2015.
[3] Lee, C., Park, S., Jung, Y., Lee, Y., & Mathews, M, "Internet of Things:
Technology to Enable the Elderly." In 2018 Second IEEE International
Conference on Robotic Computing (IRC), pp. 358-362, 2018.
Chapter 1: Introduction
P a g e | 17
[4] M. C. J. Thomas, M. Nassiri, D. K. Ismail, and D. K. Ismail, "Internet of things,"
Personal and Ubiquitous Computing, no. 2, pp. 59-61, 2016.
[5] J. Gantz and D. Reinsel, "The digital universe in 2020: Big data, bigger digital
shadows, and biggest growth in the far east," IDC iView: IDC Analyze the future,
vol. 2007, no. 2012, pp. 1-16, 2012.
[6] S. Taylor, "The next generation of the internet," CISCO Point of view, 2013.
[7] M. Z. Shafiq, L. Ji, A. X. Liu, J. Pang, and J. Wang, "A first look at cellular
machine-to-machine traffic: large scale measurement and characterization,"
ACM SIGMETRICS performance evaluation review, vol. 40, no. 1, pp. 65-76,
2012.
[8] S. Ezell, "IoT and smart manufacturing," Inform. Technology and Innovation
Found, 2016.
[9] "2017 Roundup Of Internet Of Things Forecasts.", 2017. [online]. Available:
https://www.forbes.com/sites/louiscolumbus/2017/12/10/2017-roundup-of-
internet-of-things-forecasts/#5f3918991480.
[10] A. Zanella, N. Bui, A. Castellani, L. Vangelista, and M. Zorzi, "Internet of things
for smart cities," IEEE Internet of Things journal, vol. 1, no. 1, pp. 22-32, 2014.
[11] O. Novo, "Blockchain meets IoT: An architecture for scalable access
management in IoT," IEEE Internet of Things Journal, vol. 5, no. 2, pp. 1184-
1195, 2018.
[12] J. Yuan and X. Li, "A Reliable and Lightweight Trust Computing Mechanism
for IoT Edge Devices Based on Multi-Source Feedback Information Fusion,"
IEEE Access, vol. 6, pp. 23626-23638, 2018.
Chapter 1: Introduction
P a g e | 18
[13] C. DeCusatis, Handbook of fiber optic data communication: a practical guide
to optical networking. Academic Press, 2013.
[14] Z. Yang, Y. Yue, Y. Yang, Y. Peng, X. Wang, and W. Liu, "Study and application
on the architecture and key technologies for IOT." In 2011 International
Conference on Multimedia Technology, pp. 747-751, 2011.
[15] L. D. Xu, W. He, and S. Li, "Internet of things in industries: A survey," IEEE
Transactions on industrial informatics, vol. 10, no. 4, pp. 2233-2243, 2014.
[16] L. Antão, R. Pinto, J. Reis, and G. Gonçalves, "Requirements for Testing and
Validating the Industrial Internet of Things." In 2018 IEEE International
Conference on Software Testing, Verification and Validation Workshops
(ICSTW), pp. 110-115, 2018.
[17] "Top Internet of Things Application Areas", 2017. [Online]. Available:
https://www.xtendiot.com/top-internet-things-application-areas/
[18] A. Sun, W. Gong, R. Shea, and J. Liu, "A Castle of Glass: Leaky IoT Appliances
in Modern Smart Homes," IEEE Wireless Communications, vol. 25, no. 6, pp.
32-37, 2018.
[19] R. Mulero et al., "An IoT-aware approach for elderly-friendly cities," IEEE
Access, vol. 6, pp. 7941-7957, 2018.
[20] J. K. Lee, S. N. Robinovitch, and E. J. Park, "Inertial sensing-based pre-impact
detection of falls involving near-fall scenarios," IEEE transactions on neural
systems and rehabilitation engineering, vol. 23, no. 2, pp. 258-266, 2015.
[21] D. Pal, B. Papasratorn, W. Chutimaskul, and S. Funilkul, "Embracing the Smart-
Home Revolution in Asia by the Elderly: An End-User Negative Perception
Chapter 1: Introduction
P a g e | 19
Modelling," IEEE Access, 2019.
[22] S. M. R. Islam, D. Kwak, M. D. H. Kabir, M. Hossain, and K.-S. Kwak, "The
internet of things for health care: a comprehensive survey," IEEE Access, vol.
3, pp. 678-708, 2015.
[23] G. Yang et al., "A health-IoT platform based on the integration of intelligent
packaging, unobtrusive bio-sensor, and intelligent medicine box," IEEE
transactions on industrial informatics, vol. 10, no. 4, pp. 2180-2191, 2014.
[24] C.-C. Lin and J.-W. Yang, "Cost-efficient deployment of fog computing systems
at logistics centers in industry 4.0," IEEE Transactions on Industrial
Informatics, vol. 14, no. 10, pp. 4603-4611, 2018.
[25] G. Bedi, G. K. Venayagamoorthy, R. Singh, R. R. Brooks, and K.-C. Wang,
"Review of Internet of Things (IoT) in electric power and energy systems,"
IEEE Internet of Things Journal, vol. 5, no. 2, pp. 847-870, 2018.
[26] R. Morello, C. De Capua, G. Fulco, and S. C. Mukhopadhyay, "A smart power
meter to monitor energy flow in smart grids: The role of advanced sensing and
IoT in the electric grid of the future," IEEE Sensors Journal, vol. 17, no. 23, pp.
7828-7837, 2017.
[27] X. Sun and N. Ansari, "Dynamic resource caching in the IoT application layer
for smart cities," IEEE Internet of Things Journal, vol. 5, no. 2, pp. 606-613,
2018.
[28] P. Sadhukhan. "An IoT-based E-parking system for smart cities." 2017
International Conference on Advances in Computing, Communications and
Informatics (ICACCI), pp. 1062-1066, 2017.
Chapter 1: Introduction
P a g e | 20
[29] S. Fang et al., "An integrated system for regional environmental monitoring and
management based on internet of things," IEEE Transactions on Industrial
Informatics, vol. 10, no. 2, pp. 1596-1605, 2014.
[30] M. T. Lazarescu, "Design of a WSN platform for long-term environmental
monitoring for IoT applications," IEEE Journal on emerging and selected topics
in circuits and systems, vol. 3, no. 1, pp. 45-54, 2013.
[31] G. Mois, S. Folea, and T. Sanislav, "Analysis of three IoT-based wireless sensors
for environmental monitoring," IEEE Transactions on Instrumentation and
Measurement, vol. 66, no. 8, pp. 2056-2064, 2017.
[32] J.-L. Lee, Y.-Y. Tyan, M.-H. Wen, and Y.-W. Wu, "Development of an IoT-based
bridge safety monitoring system," 2017 International Conference on Applied
System Innovation (ICASI), pp. 84-86, 2017.
[33] A. Myers, M. A. Mahmud, A. Abdelgawad, and K. Yelamarthi, "Toward
integrating structural health monitoring with internet of things (IoT)," 2016
IEEE International Conference on Electro Information Technology (EIT), pp.
0438-0441, 2016.
[34] M. A. Mahmud, A. Abdelgawad, K. Yelamarthi, and Y. A. Ismail, "Signal
processing techniques for IoT-based structural health monitoring," 2017 29th
International Conference on Microelectronics (ICM), pp. 1-5, 2017.
[35] K. A. Patil and N. R. Kale, "A model for smart agriculture using IoT," 2016
International Conference on Global Trends in Signal Processing, Information
Computing and Communication (ICGTSPICC), pp. 543-545, 2016.
[36] N. Gondchawar and R. S. Kawitkar, "IoT based smart agriculture,"
International Journal of advanced research in Computer and Communication
Chapter 1: Introduction
P a g e | 21
Engineering, vol. 5, no. 6, pp. 2278-1021, 2016.
Chapter 2: Literature Review
P a g e | 22
Chapter 2 Literature Review
2.1 Review of Communication Protocols for IoT Applications
2.1.1 Short-Range Communication Protocols
With the rapid development and wide applications of communication technologies in
the last two decades, it is estimated that more than 26 billion devices will be wirelessly
connected in 2020, and machine-to-machine (M2M) devices will account for nearly
half of the total number of the connected device [1]. Some short-range communication
protocols like Wi-Fi, Bluetooth Low Energy (BLE), and Zigbee play important roles to
realize the IoT vision. This section will give an introduction of the three most widely
used short-range communication protocols and analyze advantages and disadvantages
of these communication methods for IoT applications.
Wi-Fi
Wi-Fi is one of the radio technologies based on IEEE 802.11 family of standards
commonly used for Wireless Local Area Networking (WLAN) of devices promoted by
Wi-Fi Alliance. It operates at 2.4 and 5 GHz and is widely used in both business and
home environment [2]. Wi-Fi can offer supplementary connections for users to the
Internet when the cellular network cannot provide coverage. A typical Wi-Fi router can
provide a maximum 55 m coverage range, and the signal may be degraded by walls and
other complicated environmental factors [3]. Wi-Fi Alliance proposed a new IEEE
802.11ah wireless networking protocol called Wi-Fi HaLow to provide longer
transmission range and obtain better wall penetration performance [4].
Chapter 2: Literature Review
P a g e | 23
Bluetooth Low Energy (BLE)
BLE is also known as Bluetooth smart, which is designed and enhanced for short-range
communication with low bandwidth and low latency for IoT applications [5]. It operates
in the ISM bands ranging from 2.400 GHz to 2.4835 GHz and adopts 40 channels with
each having 2 MHz bandwidth [4]. Compared with classic Bluetooth, it has lower
power consumption, shorter setup time, and supporting star network topology with
unlimited numbers of nodes [6, 7]. The energy consumption of a BLE device used for
communication is 28.5 mW.
ZigBee
ZigBee is another short-range wireless network technology created by ZigBee Alliance
based on low-power wireless IEEE 802.15.4 networks standard. The protocol consists
of the physical layer, the Medium Access Control (MAC) layer, the network layer, and
the application layer [8]. There are three types of devices in the ZigBee network layer,
which are the router, the coordinator, and the end device. In a ZigBee network, the end
devices are used to generate the message, the routers have the routing capability, and
the coordinator manages the whole network.
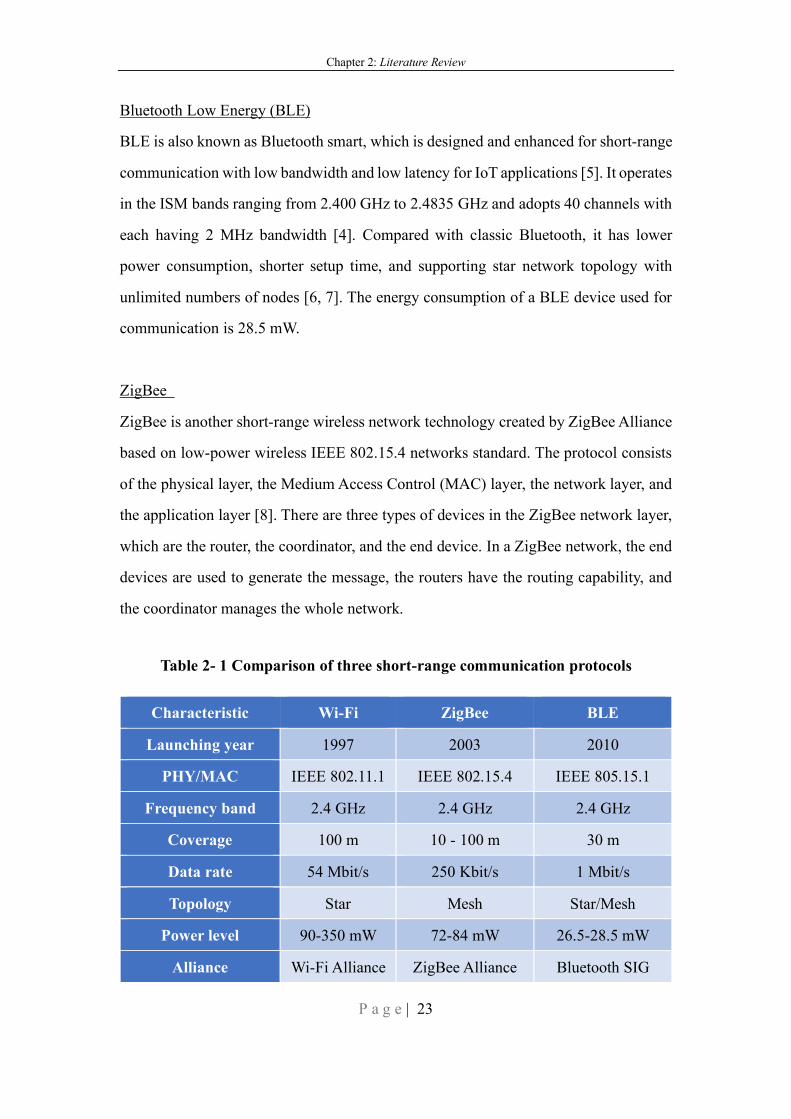
Table 2- 1 Comparison of three short-range communication protocols
Characteristic Wi-Fi ZigBee BLE
Launching year 1997 2003 2010
PHY/MAC IEEE 802.11.1 IEEE 802.15.4 IEEE 805.15.1
Frequency band 2.4 GHz 2.4 GHz 2.4 GHz
Coverage 100 m 10 - 100 m 30 m
Data rate 54 Mbit/s 250 Kbit/s 1 Mbit/s
Topology Star Mesh Star/Mesh
Power level 90-350 mW 72-84 mW 26.5-28.5 mW
Alliance Wi-Fi Alliance ZigBee Alliance Bluetooth SIG

Chapter 2: Literature Review
P a g e | 24
2.1.2 Low Power Wide Area Network (LPWAN) Protocols
LPWAN technologies combine both robust modulation and low data rate to achieve
long coverage and low energy consumption. A Low Power Wide Area (LPWA) base
station can cover up to 15 km in rural areas, and the maximum battery life of the LPWA
device can be up to 10 years [9, 10]. There are several LPWAN technologies, such as
SigFox, NB-IoT, and LoRaWAN. SigFox is a single operator network which plans to
offer coverage all over the world incorporation with member companies [11]. However,
it can only obtain a data rate up to 100 b/s in the uplink, and the maximum packet
payload is limited to 12 bytes, which also restricts the wide application of SigFox.
Narrow Band IoT (NB-IoT) is a cellular-based licensed technology introduced by the
3rd Generation Partnership Project (3GPP). NB-IoT can coexist with existed GSM and
LTE networks, and it is operated by telecommunication companies to provide reliable
wireless access for low-power devices. LoRaWAN is different from SigFox and NB-
IoT. LoRaWAN operates in the unlicensed band, which makes it can be used free of
charge. It also allows to set up the private network which can be integrated into different
global network platforms (e.g., The Things Network) [11] which could increase the
flexibility of deployments. The merits of the LoRaWAN put it in an advantage position
compared with other LPWAN technologies.
Table 2- 2 Comparison of three LPWAN communication protocols
Characteristics LoRaWAN SigFox NB-IoT
Frequency (MHz) 433/868/780/915 868 832-862 (Upload)
791-821 (download)
Bandwidth (kHz) 125/250 0.1 180
Data rate upload 0.25 kbps – 50
kbps
100 bps 200 kbps
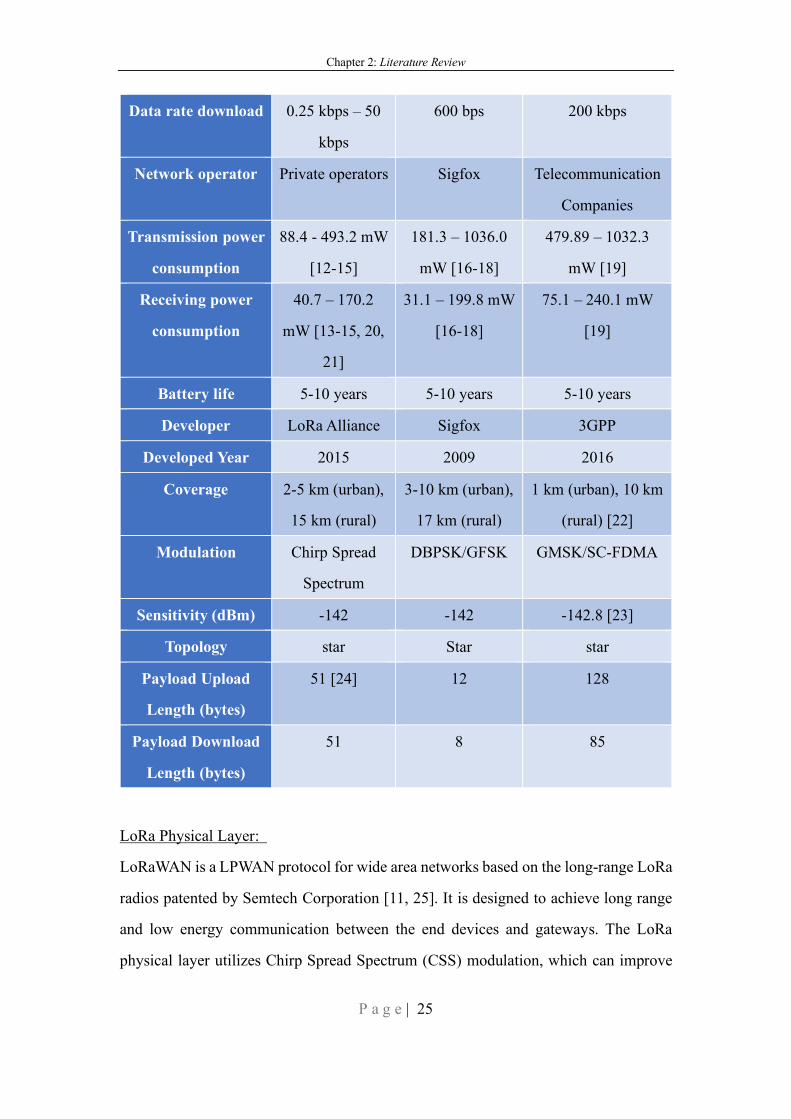
Chapter 2: Literature Review
P a g e | 25
Data rate download 0.25 kbps – 50
kbps
600 bps 200 kbps
Network operator Private operators Sigfox Telecommunication
Companies
Transmission power
consumption
88.4 - 493.2 mW
[12-15]
181.3 – 1036.0
mW [16-18]
479.89 – 1032.3
mW [19]
Receiving power
consumption
40.7 – 170.2
mW [13-15, 20,
21]
31.1 – 199.8 mW
[16-18]
75.1 – 240.1 mW
[19]
Battery life 5-10 years 5-10 years 5-10 years
Developer LoRa Alliance Sigfox 3GPP
Developed Year 2015 2009 2016
Coverage 2-5 km (urban),
15 km (rural)
3-10 km (urban),
17 km (rural)
1 km (urban), 10 km
(rural) [22]
Modulation Chirp Spread
Spectrum
DBPSK/GFSK GMSK/SC-FDMA
Sensitivity (dBm) -142 -142 -142.8 [23]
Topology star Star star
Payload Upload
Length (bytes)
51 [24] 12 128
Payload Download
Length (bytes)
51 8 85
LoRa Physical Layer:
LoRaWAN is a LPWAN protocol for wide area networks based on the long-range LoRa
radios patented by Semtech Corporation [11, 25]. It is designed to achieve long range
and low energy communication between the end devices and gateways. The LoRa
physical layer utilizes Chirp Spread Spectrum (CSS) modulation, which can improve
Chapter 2: Literature Review
P a g e | 26
the resilience and robustness against interference, Doppler effect, and multipath [9]. It
operates at 868 MHz in Europe and 915 MHz in the USA with a typical bandwidth of
125 and 250 kHz depending on different spreading factors (SF). An Adaptive Data Rate
(ADR) mechanism is adopted by LoRa to meet the needs of varying transmission
scenarios, and some parameters such as bandwidth, spreading factor and Code Rate
(CR) can be adapted to realize the customization of the LoRa modulation. Spreading
factor is used to adjust the bandwidth and data rate to achieve better coverage. The
spreading factors of the LoRa can also be changed from 7 to 12. Spreading Factor 7 has
the shortest coverage with the highest data rate, and the widest coverage can be
achieved by using spreading factor 12 with the lowest data rate. A detailed comparison
between different spreading factors can be found in Table 2-3.
Table 2- 3 The comparison between different LoRaWAN spreading factors based
on EU 868MHz band
Spreading factor Bandwidth(kHz) Air bit rate
(kbps)
Sensitivity (dBm)
7 250 10.936 -122
7 125 5.468 -124
8 125 3.125 -126
9 125 1.757 -129
10 125 0.976 -132
11 125 0.537 -134.5
12 125 0.293 -137
The data rate of the LoRaWAN transmission can be calculated based on Equation (2.1).
Rb = SF ∗B
2SF ∗ CR (2.1)
where Rb is the data rate, SF is the spreading factor, B is the bandwidth, and CR is the
Chapter 2: Literature Review
P a g e | 27
code rate.
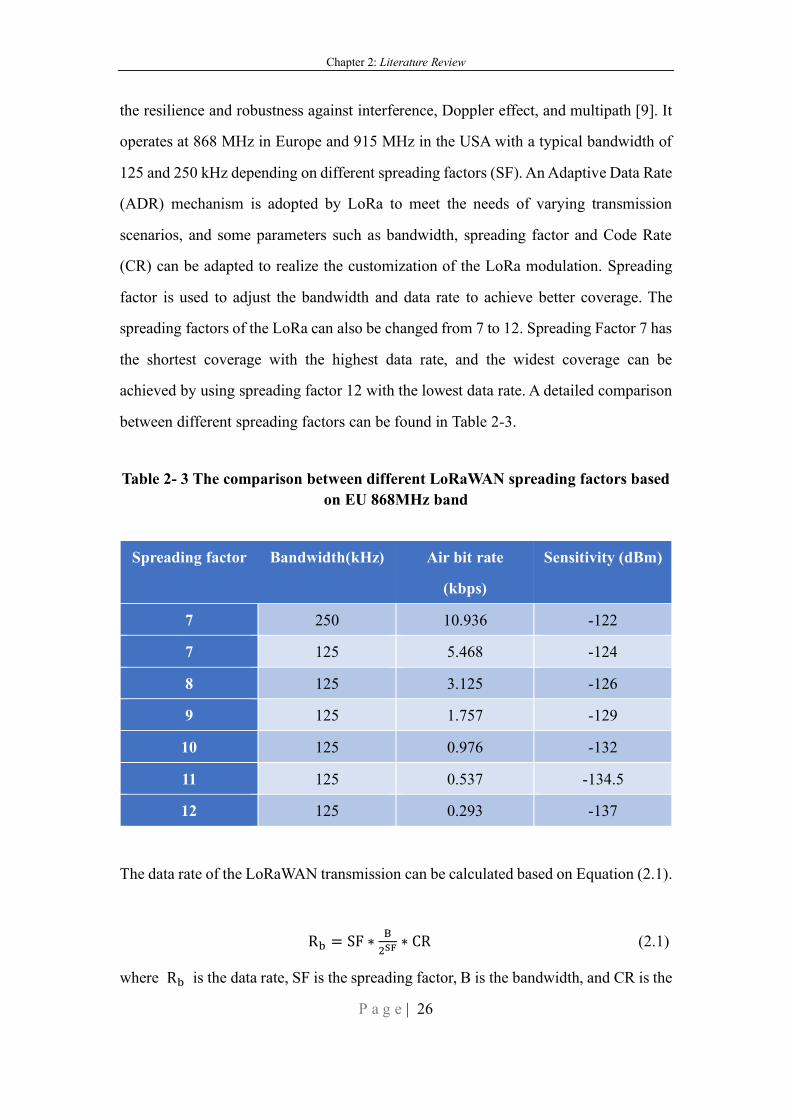
LoRaWAN MAC Layer and Network Architecture:
LoRaWAN MAC layer provides the medium access control mechanism on top of the
LoRa physical layer to enable communication between multiple devices and gateways
[11]. It has a star topology where each end nodes are connected to the gateway directly.
LoRaWAN defines three types of devices with different transmission mechanisms
namely Class A, Class B, and Class C. Class A is mandatory for all LoRaWAN devices,
it allows the bidirectional communication between the gateway and the end devices.
Two downlink receiving windows will only be scheduled after a successful uplink
signal interpreted by the gateway. The two downlink receiving windows start 1 and 2s
after the end of the uplink transmission. Class A devices have the lowest energy
consumption among all LoRaWAN devices. Class B devices are synchronized by using
periodic beacon sent by the gateway to arrange an additional receiving window for
downlink transmission. PNG stands for the ping-slot and BCN means the beacon. The
gateway can then be able to send a downlink signal to the end device without prior
successful transmissions. Class C devices will always listen to the gateway unless they
are in the uplink transmission periods. Since Class C devices are always on, they are
the most power-hungry devices compared with other LoRaWAN devices.
Fig. 2- 1 Three classes of LoRaWAN end devices [26].
Chapter 2: Literature Review
P a g e | 28
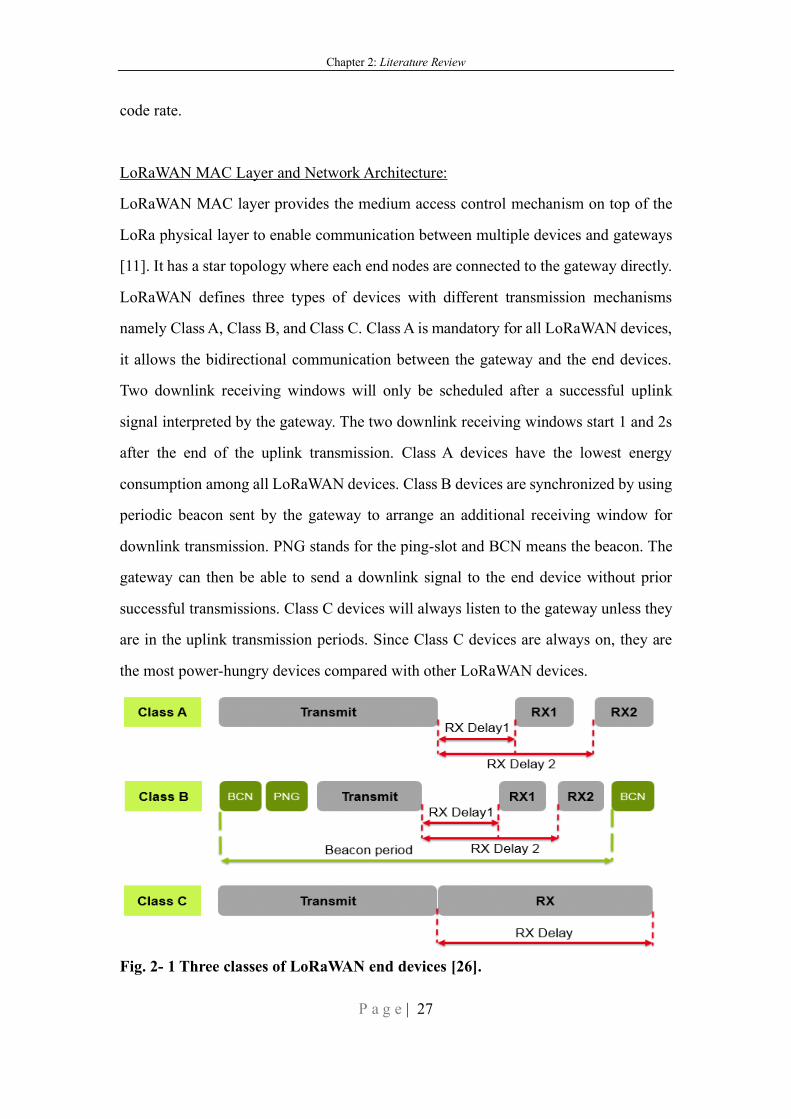
There are two ways to activate end devices in a LoRaWAN network, which are the
Activation By Personalization (ABP) and the Over The Air Activation (OTAA). Three
sets of security keys, namely Network Session Key (NwkSKey), Application Session
Key (AppSKey), and Application Key (AppKey) are used for activating devices during
transmission. All three keys have a length of 128 bits. Network Session Key and
Application Session Key are fixed for a device activated by ABP. OTAA utilizes
Application Key to dynamically derive Network Session Key and Application Session
Key to join the network on every activation. Thus, OTAA is a more secure activation
method compared with ABP. The LoRaWAN architecture (Fig. 2-2) is that the end
device transmits data to a gateway by using LoRaWAN protocol and the gateway is
responsible for furthering forwarding the received message to the network server by
using an IP-based protocol (e.g., Ethernet, Wi-Fi or cellular).
Fig. 2- 2 The LoRaWAN architecture [27].
Chapter 2: Literature Review
P a g e | 29
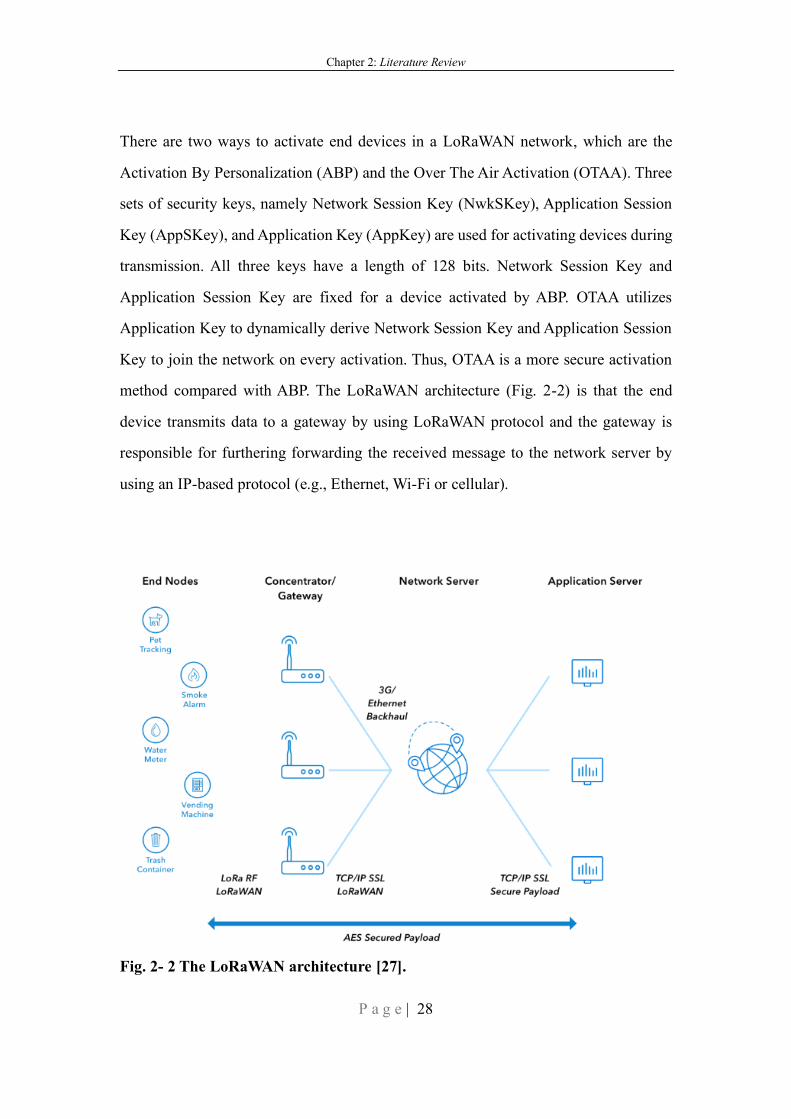
2.2 Review of Wireless Sensor Network
The drastic improvements in micro-electro-mechanical-system (MEMS) technology,
advanced wireless communication methods, and innovative networking protocols
enable forming a network of small, low-price, and powerful wireless sensor nodes. The
Wireless Sensor Network (WSN) can be defined as a network consists of a large number
of sensor nodes composed of the sensing unit, the data processing unit, and the
communication unit. The protocol stack used by the sinks and all sensor nodes is
composed of three planes and five layers, as shown in Fig. 2- 3. The WSN is an essential
IoT technology which can be applied in various areas like military applications,
environmental applications, health applications, smart home applications, and other
commercial applications [28].
Fig. 2- 3 Five layers protocol stacks for wireless sensor network [29].
Chapter 2: Literature Review
P a g e | 30
Some sensor nodes may be placed at places hard to reach, and therefore, it will be
difficult to change the battery of the sensor. The energy consumption and power
efficiency are the most important design criteria of a sensor node. Since the power
consumption of the sensor itself is very low, most of the energy is consumed during the
transmission of the signal. It is essential to design a power efficiency transmitting
protocol, which can also maintain the Quality of Service (QoS) and security at the same
time [30]. The deployment of sensor nodes can be formulated as a constrained multi-
objective optimization problem where the aim is to maximize the coverage and the
lifetime and minimize the power consumption and the number of the deployed nodes
[31]. Liu Jingxian proposed that the sensor node can harvest the RF energy from the
sink node by investing the optimal energy beamforming [32]. Samith Abeywickrama
improved this idea by using a novel scheme that facilitates energy beamforming by
utilizing the Received Signal Strength Indicator (RSSI) value to estimate the channel
[33]. Solar energy harvesting technology is a very mature energy harvesting method to
obtain energy in the outdoor environment. The solar energy can be a very promising
method to provide electricity to the sensor nodes due to its relatively high power density
[34]. Instead of gathering energy from other energy sources, some energy saving
techniques can be applied in the communication and networking of the wireless sensor
network. Networking Coding and Power Control based Routing is designed by X, Liu
which can reduce the number of packets transmitted by encoding multiple packages
which have the same destination into one packet and then less energy will be used in
the communication [35].
To provide a reliable and low energy consumption connection for the wireless sensor
node, which may be placed in lots of different places, a low power and long-range
machine-to-machine communication method should be used. The current low-power
and long-range M2M solutions can be basically divided into three parts, which are
LPWA network, IEEE 802.11ah, and cellular-based network infrastructure [36].
LoRaWAN is one of the most widely used LPWA networks especially in Europe. LTE-
Chapter 2: Literature Review
P a g e | 31
M and NB-IOT are two typical cellular-based M2M solutions. They can all cover a
wide area and consume less energy, but the data rate is relatively low in compensation.
For IEEE 802.11ah, although it has a higher data rate, it consumes more power and has
less communication coverage. LoRaWAN has a star connected network topology which
combines low data rate and robust modulation to achieve multi-kilometer
communication range, and it is a suitable communication method used to form a private
wireless sensor network [9].
The WSN has very wide applications, and it can be a very promising technology to
collect ambient environmental data, and further transmit, store and analyze the collected
data. It can be used in congestion with other communication technologies, networking
methods, and data processing techniques to improve the overall performance of the
sensing network. Murad Khan developed a smart home control system which not only
saves energy but also is aware of the interference of different wireless technologies
coexisting in the same ISM band [37]. A coordinator is used to receive the signal from
an isolated WSN and transfer those parameters to the management station via power
line communication (PLC) and the control signal for home appliances are also sent
through PLC as well to reduce the impact of wireless interferences [21]. An intelligent
controller by integrating internet of things with cloud computing and web services is
designed to control the heating ventilation and air conditioning (HVAC), the random
neural network is also implanted on the sensor node and base station in this case [38].
The occupancy status can be predicted by using the CO2 sensor measuring the
concentration of CO2 in the air and using some algorithms like machine learning to
predict the existence of people [39, 40].
There are some design criteria to be met to unleash the full functionality of the sensor
nodes in a wireless sensor network. The node should have a compact size, and the
battery will be the primary energy source so that it can be easily deployed without wired
connections [41]. The energy consumption of the end device should be kept low to
Chapter 2: Literature Review
P a g e | 32
increase the lifetime of both the node and the wireless sensor network. An energy
harvesting system can be added to the sensor node, and the end device can continuously
work without changing batteries to prolong the lifetime of the wireless sensor network
[42]. There are some restrictions on the size and the cost of the sensor node so that it
can be densely deployed. Also, each device should be easily connected to the cloud,
and the users can have access to the data in real time. The interoperability of the wireless
sensor network is another critical design criterion so that more functions and other
devices can be easily integrated into the existed sensing platforms.
2.3 Review of Environmental Monitoring Activities
Some essential environmental parameters such as temperature, humidity, brightness,
wind speeds, and wind directions are needed in different applications such as
environmental monitoring, asset monitoring, smart agriculture, weather forecasting,
aviation, and load prediction. 40 percent of the aviation accidents are due to the adverse
weather conditions, and therefore, some weather stations should be deployed near the
airport to know the real-time weather conditions [43]. To reduce the greenhouse effect
by using renewable energy to decrease the emission of CO2, the wind turbine can be a
sustainable replacement of the thermal power plant. The site selection of the wind farm
is very crucial to guarantee more energy can be obtained from the environment, and
wind sensors can be deployed in different sites to record the wind speeds and directions
over a long time. The wind turbines can then be installed in suitable places with
optimized facing directions which could maximize the energy extracted from the wind
[44]. Weather prediction is essential for our day by day life, especially in agribusiness,
and national weather data may not contain the precise information of some particular
areas [45]. It is essential to deploy weather stations to monitor and predict the weather
conditions near the farm to realize precision agriculture.
Chapter 2: Literature Review
P a g e | 33
The environmental monitoring system also plays an important role in the electricity
distribution system to improve the safety and stability of the power systems. The main
contribution of the environmental sensing platform to the power grid can be categorized
into two parts which are the condition monitoring of the outdoor devices in the grid and
the load predictions based on the weather conditions. Since some important assets in
the power grid such as transformers, substations, and power lines are directly placed in
the outdoor environment. The conditions of these devices should be continuously
monitored so that it will be easy to do the maintenance work and prevent them from
malfunctions to cause interruptions in the power supply [46-48]. Weather conditions
have an important influence on the generation, transmission, and the distribution of
electric power [48, 49]. The clean and environmentally friendly renewable energy such
as photovoltaic and wind power generation are now penetrating the power grid at an
accelerating speed [48, 50]. However, the randomness and volatility of renewable
energy also affect the safety and stability of the power system, and weather stations
should provide abundant, accurate and real-time metrological data to predict the load
and achieve the smart control in the modern power grid [46].
Currently, with the help of advanced communication methods and sensing technologies,
a weather station can be integrated with more functions which can collect, process, and
transmit various environmental parameters. By adopting the concept of the wireless
sensor network, the traditional weather station can be transformed from a standalone
device to be part of an environmental sensing platform. The weather stations can be
deployed in different places, including in harsh environments such as high mounts,
deserts, and Antarctica [51]. The data can be automatically uploaded to the central cloud
of the environmental sensing platform without the presence of the human. By using the
cloud computing technology, the environmental sensing platform can then present and
process the data, and the user can have real-time access to the measured data and make
decisions based on the collected information [52]. A large number of research projects
such as Smart Santander and URBAN GreenUP aims to continuously monitor
Chapter 2: Literature Review
P a g e | 34
environment by using advanced IoT technologies to provide environmental, social and
economic value.
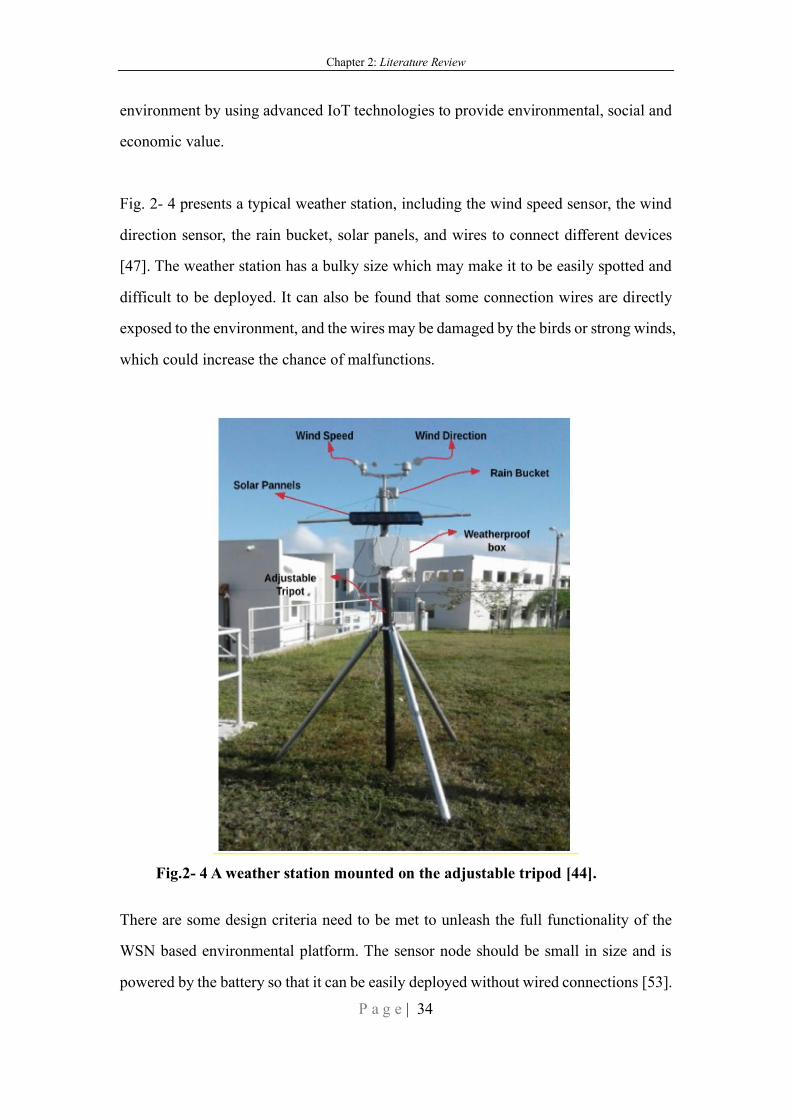
Fig. 2- 4 presents a typical weather station, including the wind speed sensor, the wind
direction sensor, the rain bucket, solar panels, and wires to connect different devices
[47]. The weather station has a bulky size which may make it to be easily spotted and
difficult to be deployed. It can also be found that some connection wires are directly
exposed to the environment, and the wires may be damaged by the birds or strong winds,
which could increase the chance of malfunctions.
Fig.2- 4 A weather station mounted on the adjustable tripod [44].
There are some design criteria need to be met to unleash the full functionality of the
WSN based environmental platform. The sensor node should be small in size and is
powered by the battery so that it can be easily deployed without wired connections [53].
Chapter 2: Literature Review
P a g e | 35
The energy consumption of the nodes should be kept low to increase the lifetime of
both the node and the wireless sensor network. An energy harvesting system can be
added to the sensor node, and the end device can continuously work without changing
batteries to prolong the lifetime of the whole environmental monitoring system [54].
There are some restrictions on the size and the cost of the weather station so that it can
be densely deployed. Also, the weather station should be easily connected to the cloud,
and the users can have access to the data in real time. The interoperability of the weather
station is another critical design criterion so that more functions and other devices can
be easily integrated into the existed sensing platforms.
2.4 Summary
A detailed introduction of the popular communication protocols, including both the
short-range communication protocols and the LPWAN protocols was given. The studies
and applications of the Wireless Sensor Network have been discussed as well. It can be
concluded that LPWAN protocols have the merits of wide coverage and low energy
consumption, which is more suitable to transmit data in an energy-constrained wireless
sensor network. Three popular LPWAN protocols, which are the LoRaWAN, SigFox,
and NB-IoT are studied, and the LoRaWAN has the advantages of flexible private
deployment and low energy consumption feature. The information in this chapter
provides basic knowledge of the communication protocols and the wireless sensor
networks which may be needed in the following sections of the thesis. This chapter also
spots the research gaps and challenges of the current weather stations for us to
overcome in this work.
Chapter 2: Literature Review
P a g e | 36
References:
[1] P. Burzacca, M. Mircoli, S. Mitolo, and A. Polzonetti, "“iBeacon” technology
that will make possible Internet of Things," 2014.
[2] P. S. Henry and H. Luo, "WiFi: what's next?," IEEE Communications Magazine,
vol. 40, no. 12, pp. 66-72, 2002.
[3] V. Radu, L. Kriara, and M. K. Marina, "Pazl: A mobile crowdsensing based
indoor WiFi monitoring system," Proceedings of the 9th International
Conference on Network and Service Management (CNSM 2013), pp. 75-83,
2013.
[4] N. Xia, H.-H. Chen, and C.-S. Yang, "Radio resource management in machine-
to-machine communications—A survey," IEEE Communications Surveys &
Tutorials, vol. 20, no. 1, pp. 791-828, 2018.
[5] S. Al-Sarawi, M. Anbar, K. Alieyan, and M. Alzubaidi, "Internet of Things (IoT)
communication protocols," 2017 8th International Conference on Information
Technology (ICIT), pp. 685-690, 2017.
[6] F. Samie, L. Bauer, and J. Henkel, "IoT technologies for embedded computing:
A survey," Proceedings of the Eleventh IEEE/ACM/IFIP International
Conference on Hardware/Software Codesign and System Synthesis, p. 8, 2016.
[7] T. Salman, "Internet of things protocols and standards," ed: Academic Press,
2015.
[8] L. Atzori, A. Iera, and G. Morabito, "The internet of things: A survey,"
Computer networks, vol. 54, no. 15, pp. 2787-2805, 2010.
[9] F. Adelantado, X. Vilajosana, P. Tuset-Peiro, B. Martinez, J. Melia-Segui, and
Chapter 2: Literature Review
P a g e | 37
T. Watteyne, "Understanding the limits of LoRaWAN," IEEE Communications
magazine, vol. 55, no. 9, pp. 34-40, 2017.
[10] Y. Song, J. Lin, M. Tang, and S. Dong, "An Internet of energy things based on
wireless LPWAN," Engineering, vol. 3, no. 4, pp. 460-466, 2017.
[11] J. Haxhibeqiri, E. De Poorter, I. Moerman, and J. Hoebeke, "A survey of
lorawan for iot: From technology to application," Sensors, vol. 18, no. 11, p.
3995, 2018.
[12] J. Petäjäjärvi, K. Mikhaylov, R. Yasmin, M. Hämäläinen, and J. Iinatti,
"Evaluation of LoRa LPWAN technology for indoor remote health and
wellbeing monitoring," International Journal of Wireless Information Networks,
vol. 24, no. 2, pp. 153-165, 2017.
[13] B. Kim and K.-i. Hwang, "Cooperative downlink listening for low-power long-
range wide-area network," Sustainability, vol. 9, no. 4, p. 627, 2017.
[14] G. Conus, G. Lilis, N. A. Zanjani, and M. Kayal, "An event-driven low power
electronics for loads metering and control in smart buildings," 2016 Second
International Conference on Event-based Control, Communication, and Signal
Processing (EBCCSP), pp. 1-7, 2016.
[15] P. Neumann, J. Montavont, and T. Noël, "Indoor deployment of low-power wide
area networks (LPWAN): A LoRaWAN case study," 2016 IEEE 12th
International Conference on Wireless and Mobile Computing, Networking and
Communications (WiMob), pp. 1-8, 2016.
[16] C. Gomez, J. C. Veras, R. Vidal, L. Casals, and J. Paradells, "A Sigfox energy
consumption model," Sensors, vol. 19, no. 3, p. 681, 2019.
Chapter 2: Literature Review
P a g e | 38
[17] E. Morin, M. Maman, R. Guizzetti, and A. Duda, "Comparison of the device
lifetime in wireless networks for the internet of things," IEEE Access, vol. 5, pp.
7097-7114, 2017.
[18] D. M. Hernandez, G. Peralta, L. Manero, R. Gomez, J. Bilbao, and C. Zubia,
"Energy and coverage study of LPWAN schemes for Industry 4.0," 2017 IEEE
International Workshop of Electronics, Control, Measurement, Signals and their
Application to Mechatronics (ECMSM), pp. 1-6, 2017.
[19] M. Lauridsen, R. Krigslund, M. Rohr, and G. Madueno, "An Empirical NB-IoT
Power Consumption Model for Battery Lifetime Estimation," 2018 IEEE 87th
Vehicular Technology Conference (VTC Spring), pp. 1-5, 2018..
[20] C. A. Socarrás Bertiz, J. J. Fernández Lozano, J. A. Gomez-Ruiz, and A. García-
Cerezo, "Integration of a Mobile Node into a Hybrid Wireless Sensor Network
for Urban Environments," Sensors, vol. 19, no. 1, p. 215, 2019.
[21] K. Mikhaylov and J. Petäjäjärvi, "Design and implementation of the plug&play
enabled flexible modular wireless sensor and actuator network platform," Asian
Journal of Control, vol. 19, no. 4, pp. 1392-1412, 2017.
[22] K. Mekki, E. Bajic, F. Chaxel, and F. Meyer, "Overview of Cellular LPWAN
Technologies for IoT Deployment: Sigfox, LoRaWAN, and NB-IoT," 2018
IEEE International Conference on Pervasive Computing and Communications
Workshops (PerCom Workshops), pp. 197-202, 2018.
[23] R. Ratasuk, B. Vejlgaard, N. Mangalvedhe, and A. Ghosh, "NB-IoT system for
M2M communication," 2016 IEEE wireless communications and networking
conference, pp. 1-5, 2016.
[24] B. Vejlgaard, M. Lauridsen, H. Nguyen, I. Z. Kovács, P. Mogensen, and M.
Chapter 2: Literature Review
P a g e | 39
Sorensen, "Coverage and capacity analysis of sigfox, lora, gprs, and nb-iot,"
2017 IEEE 85th vehicular technology conference (VTC Spring), pp. 1-5, 2017.
[25] M. Rizzi, P. Ferrari, A. Flammini, and E. Sisinni, "Evaluation of the IoT
LoRaWAN solution for distributed measurement applications," IEEE
Transactions on Instrumentation and Measurement, vol. 66, no. 12, pp. 3340-
3349, 2017.
[26] T. Bouguera, J.-F. Diouris, J.-J. Chaillout, R. Jaouadi, and G. Andrieux, "Energy
consumption model for sensor nodes based on LoRa and LoRaWAN," Sensors,
vol. 18, no. 7, p. 2104, 2018.
[27] "Background Information about LoRaWAN." [Online]. Available:
https://www.thethingsnetwork.org/docs/lorawan/
[28] E. H. Callaway Jr, Wireless sensor networks: architectures and protocols. CRC
press, 2003.
[29] I. F. Akyildiz, W. Su, Y. Sankarasubramaniam, and E. Cayirci, "Wireless sensor
networks: a survey," Computer networks, vol. 38, no. 4, pp. 393-422, 2002.
[30] M. Saikia, U. K. Das, and M. A. Hussain, "Secure energy aware multi-path
routing with key management in wireless sensor network," 2017 4th
International Conference on Signal Processing and Integrated Networks (SPIN),
pp. 310-315, 2017.
[31] S. Sengupta, S. Das, M. D. Nasir, and B. K. Panigrahi, "Multi-objective node
deployment in WSNs: In search of an optimal trade-off among coverage,
lifetime, energy consumption, and connectivity," Engineering Applications of
Artificial Intelligence, vol. 26, no. 1, pp. 405-416, 2013.
Chapter 2: Literature Review
P a g e | 40
[32] J. Liu, K. Xiong, P. Fan, and Z. Zhong, "RF energy harvesting wireless powered
sensor networks for smart cities," IEEE Access, vol. 5, pp. 9348-9358, 2017.
[33] S. Abeywickrama, T. Samarasinghe, and C. K. Ho, "Wireless energy
beamforming using signal strength feedback," 2016 IEEE Global
Communications Conference (GLOBECOM), pp. 1-6, 2016.
[34] C. Alippi and C. Galperti, "An adaptive system for optimal solar energy
harvesting in wireless sensor network nodes," IEEE Transactions on Circuits
and Systems I: Regular Papers, vol. 55, no. 6, pp. 1742-1750, 2008.
[35] X. Tian, Y.-H. Zhu, K. Chi, J. Liu, and D. Zhang, "Reliable and energy-efficient
data forwarding in industrial wireless sensor networks," IEEE Systems Journal,
vol. 11, no. 3, pp. 1424-1434, 2017.
[36] H. Wang and A. O. Fapojuwo, "A survey of enabling technologies of low power
and long range machine-to-machine communications," IEEE Communications
Surveys & Tutorials, vol. 19, no. 4, pp. 2621-2639, 2017.
[37] M. Khan, B. N. Silva, and K. Han, "Internet of things based energy aware smart
home control system," IEEE Access, vol. 4, pp. 7556-7566, 2016.
[38] A. Javed, H. Larijani, A. Ahmadinia, and D. Gibson, "Smart random neural
network controller for HVAC using cloud computing technology," IEEE
Transactions on Industrial Informatics, vol. 13, no. 1, pp. 351-360, 2017.
[39] S. H. Ryu and H. J. Moon, "Development of an occupancy prediction model
using indoor environmental data based on machine learning techniques,"
Building and Environment, vol. 107, pp. 1-9, 2016.
[40] T. H. Pedersen, K. U. Nielsen, and S. Petersen, "Method for room occupancy
Chapter 2: Literature Review
P a g e | 41
detection based on trajectory of indoor climate sensor data," Building and
Environment, vol. 115, pp. 147-156, 2017.
[41] A. Zanella, N. Bui, A. Castellani, L. Vangelista, and M. Zorzi, "Internet of things
for smart cities," IEEE Internet of Things journal, vol. 1, no. 1, pp. 22-32, 2014.
[42] S. Priya and D. J. Inman, Energy harvesting technologies. Springer, 2009.
[43] J. McCarthy, "Advances in weather technology for the aviation system,"
Proceedings of the IEEE, vol. 77, no. 11, pp. 1728-1734, 1989.
[44] D. A. Aponte-Roa, L. B. Montalvan, C. Velazquez, A. A. Espinoza, L. F.
Velazquez, and R. Serrano, "Evaluation of a low-cost, solar-powered weather
station for small-scale wind farm site selection," 2018 IEEE International
Instrumentation and Measurement Technology Conference (I2MTC), pp. 1-5.
IEEE, 2018.
[45] M. I. Haque, A. H. M. D. Shatil, A. N. Tusar, M. Hossain, and M. H. Rahman,
"Renewable Powered Portable Weather Update Station," 2019 International
Conference on Robotics, Electrical and Signal Processing Techniques
(ICREST), pp. 374-377, 2019.
[46] H. Li, M. K. Ochani, H. Zhang, and L. Zhang, "Design of micro-automatic
weather station for modern power grid based on STM32," The Journal of
Engineering, vol. 2017, no. 13, pp. 1629-1634, 2017.
[47] M. Kusriyanto and A. A. Putra, "Weather Station Design Using IoT Platform
Based On Arduino Mega," 2018 International Symposium on Electronics and
Smart Devices (ISESD), pp. 1-4, 2018.
[48] P. Dehghanian, B. Zhang, T. Dokic, and M. Kezunovic, "Predictive risk
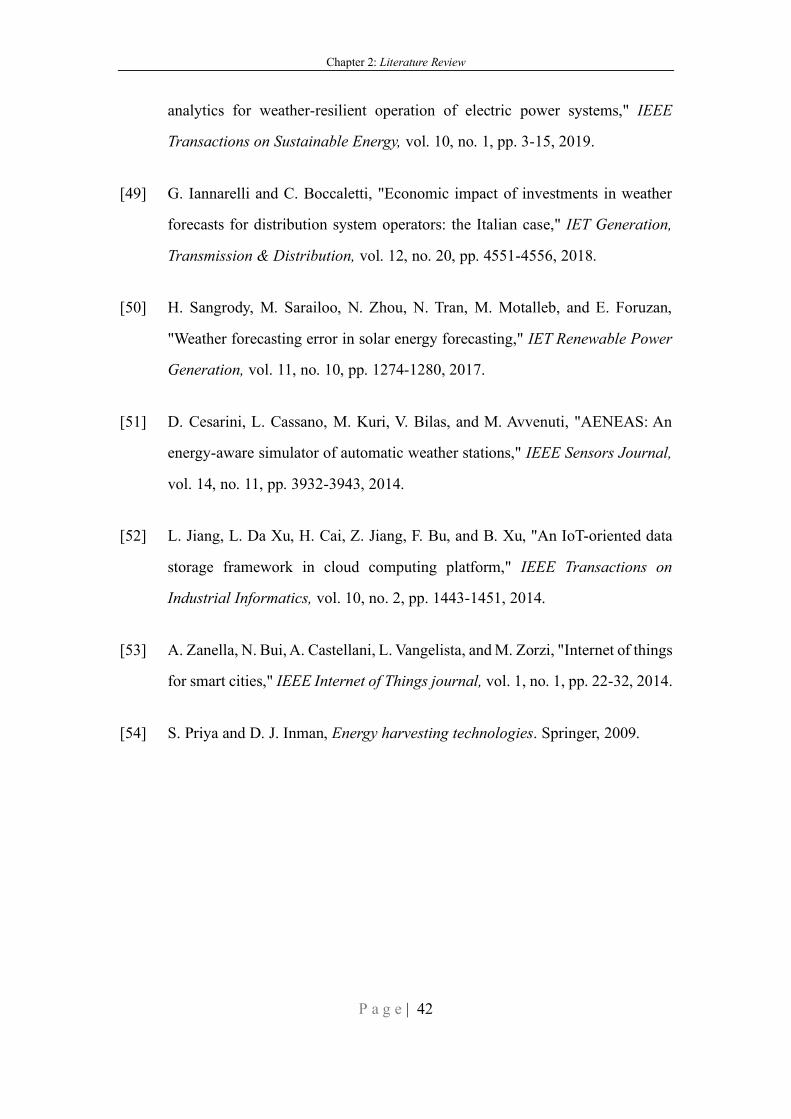
Chapter 2: Literature Review
P a g e | 42
analytics for weather-resilient operation of electric power systems," IEEE
Transactions on Sustainable Energy, vol. 10, no. 1, pp. 3-15, 2019.
[49] G. Iannarelli and C. Boccaletti, "Economic impact of investments in weather
forecasts for distribution system operators: the Italian case," IET Generation,
Transmission & Distribution, vol. 12, no. 20, pp. 4551-4556, 2018.
[50] H. Sangrody, M. Sarailoo, N. Zhou, N. Tran, M. Motalleb, and E. Foruzan,
"Weather forecasting error in solar energy forecasting," IET Renewable Power
Generation, vol. 11, no. 10, pp. 1274-1280, 2017.
[51] D. Cesarini, L. Cassano, M. Kuri, V. Bilas, and M. Avvenuti, "AENEAS: An
energy-aware simulator of automatic weather stations," IEEE Sensors Journal,
vol. 14, no. 11, pp. 3932-3943, 2014.
[52] L. Jiang, L. Da Xu, H. Cai, Z. Jiang, F. Bu, and B. Xu, "An IoT-oriented data
storage framework in cloud computing platform," IEEE Transactions on
Industrial Informatics, vol. 10, no. 2, pp. 1443-1451, 2014.
[53] A. Zanella, N. Bui, A. Castellani, L. Vangelista, and M. Zorzi, "Internet of things
for smart cities," IEEE Internet of Things journal, vol. 1, no. 1, pp. 22-32, 2014.
[54] S. Priya and D. J. Inman, Energy harvesting technologies. Springer, 2009.

Chapter 3: A Compact Anemometer with Ultra-low Energy Consumption
P a g e | 43
Chapter 3 A Compact Anemometer with Ultra-
low Energy Consumption
Wind speeds and directions are essential environmental parameters, and it is required
in different environmental monitoring applications such as the aviation, the site
selection of the wind farm, structural health monitoring, etc. However, the energy
consumption of the traditional wind sensors such as the ultrasonic wind sensors and the
hot-film wind sensors typically consumes a large amount of power. These wind sensors
are normally powered by using power lines, and it will be very challenging to use
batteries to power them. Since energy consumption is one of the constrained design
factors needs to be concerned in the development of wireless weather stations. In this
chapter, we would like to propose a novel wind sensor which can measure both the
wind speeds and the wind directions by using a 6-axis accelerometer. The proposed
wind sensor has a compact size and extremely low energy consumption so that it can
be easily deployed and powered by using batteries.
3.1 Introduction
Wind measurement has been widely used in different applications, such as weather
forecasting and outdoor asset monitoring [1]. With the development of advanced
communication technologies, an anemometer can act as a sensor node to be connected
to the internet so that all the measured data can be uploaded and visualized in real time.
To realize the concept of IoT, we need to pay more attention to the requirements of the
wind sensors such as miniaturized size, low cost, and low energy consumption [2, 3].
There are various types of traditional anemometers, such as cup-type anemometers,
ultrasonic anemometers, and thermistors-based anemometers as displayed in Fig. 3-1,
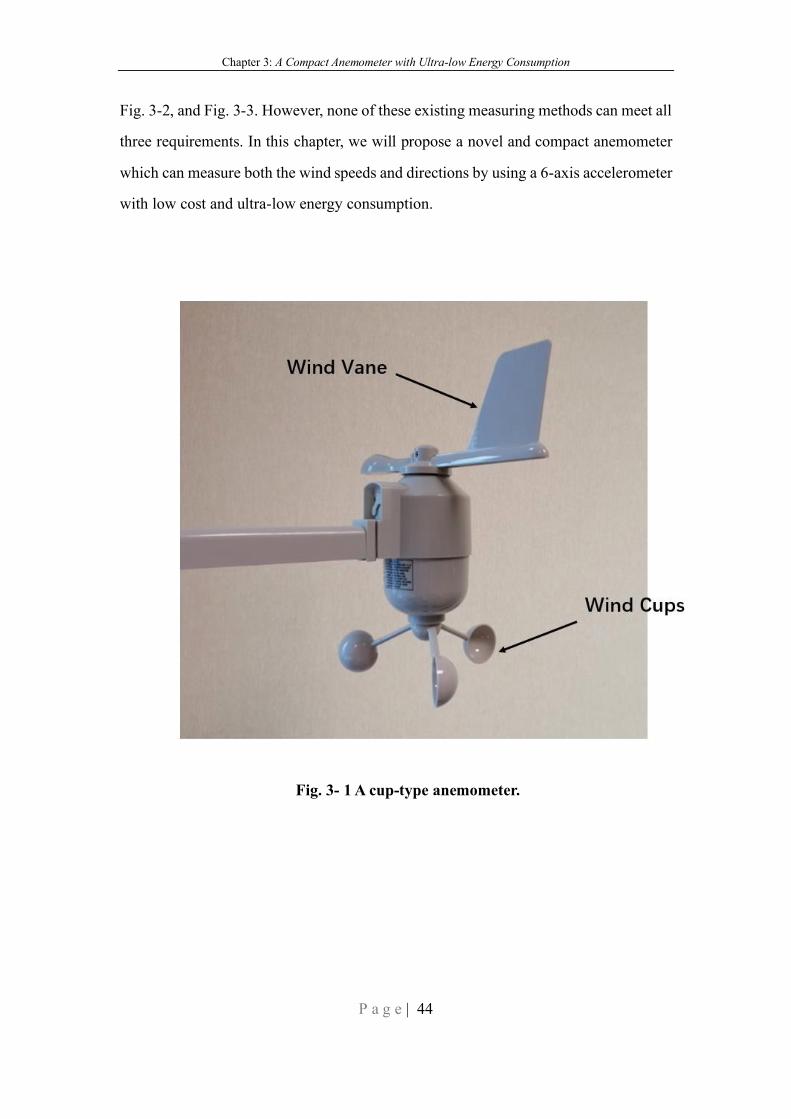
Chapter 3: A Compact Anemometer with Ultra-low Energy Consumption
P a g e | 44
Fig. 3-2, and Fig. 3-3. However, none of these existing measuring methods can meet all
three requirements. In this chapter, we will propose a novel and compact anemometer
which can measure both the wind speeds and directions by using a 6-axis accelerometer
with low cost and ultra-low energy consumption.
Fig. 3- 1 A cup-type anemometer.
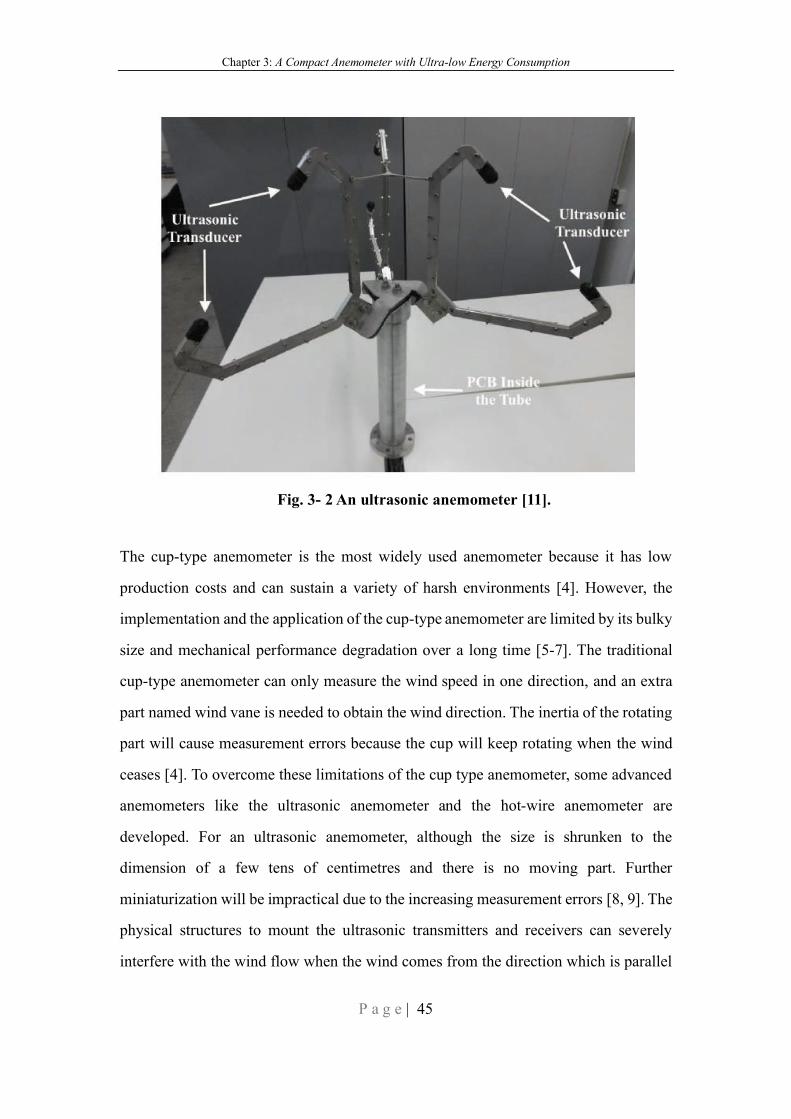
Chapter 3: A Compact Anemometer with Ultra-low Energy Consumption
P a g e | 45
Fig. 3- 2 An ultrasonic anemometer [11].
The cup-type anemometer is the most widely used anemometer because it has low
production costs and can sustain a variety of harsh environments [4]. However, the
implementation and the application of the cup-type anemometer are limited by its bulky
size and mechanical performance degradation over a long time [5-7]. The traditional
cup-type anemometer can only measure the wind speed in one direction, and an extra
part named wind vane is needed to obtain the wind direction. The inertia of the rotating
part will cause measurement errors because the cup will keep rotating when the wind
ceases [4]. To overcome these limitations of the cup type anemometer, some advanced
anemometers like the ultrasonic anemometer and the hot-wire anemometer are
developed. For an ultrasonic anemometer, although the size is shrunken to the
dimension of a few tens of centimetres and there is no moving part. Further
miniaturization will be impractical due to the increasing measurement errors [8, 9]. The
physical structures to mount the ultrasonic transmitters and receivers can severely
interfere with the wind flow when the wind comes from the direction which is parallel
Chapter 3: A Compact Anemometer with Ultra-low Energy Consumption
P a g e | 46
to the mounting structures [10, 11]. Also, the application of ultrasonic anemometer will
be restricted due to its high cost and high energy consumption [12, 13]. The temperature
of the air can also affect the travel speed of the ultrasonic wave and therefore affect the
wind speed measurement.
Fig. 3- 3 A hot-wire anemometer [16].
Hot-wire anemometers are developed to measure the drift of heat induced by the wind
and calculating the corresponding wind speed [14, 15]. Fig. 3-3 presents a typical hot-
wire anemometer including the sensing unit and the data processing unit. Although the
size of the sensor has been significantly miniaturized, there are still some limitations
such as the temperature of the ambient environment can affect the measuring results
[16]. Since the film should be heated, and a large amount of energy needs to be
dissipated to conduct the measurement [17, 18]. The energy consumption of a hot-wire
anemometer can be 2 W to elevate the temperature of the sensing head to a desirable
level [19]. There are other wind measuring methods such as remote sensing techniques
[20, 21]. Coherent Doppler LiDAR can be used to measure the wind speed remotely
over a large range without contact with the moving air [22, 23]. Lidar can emit laser
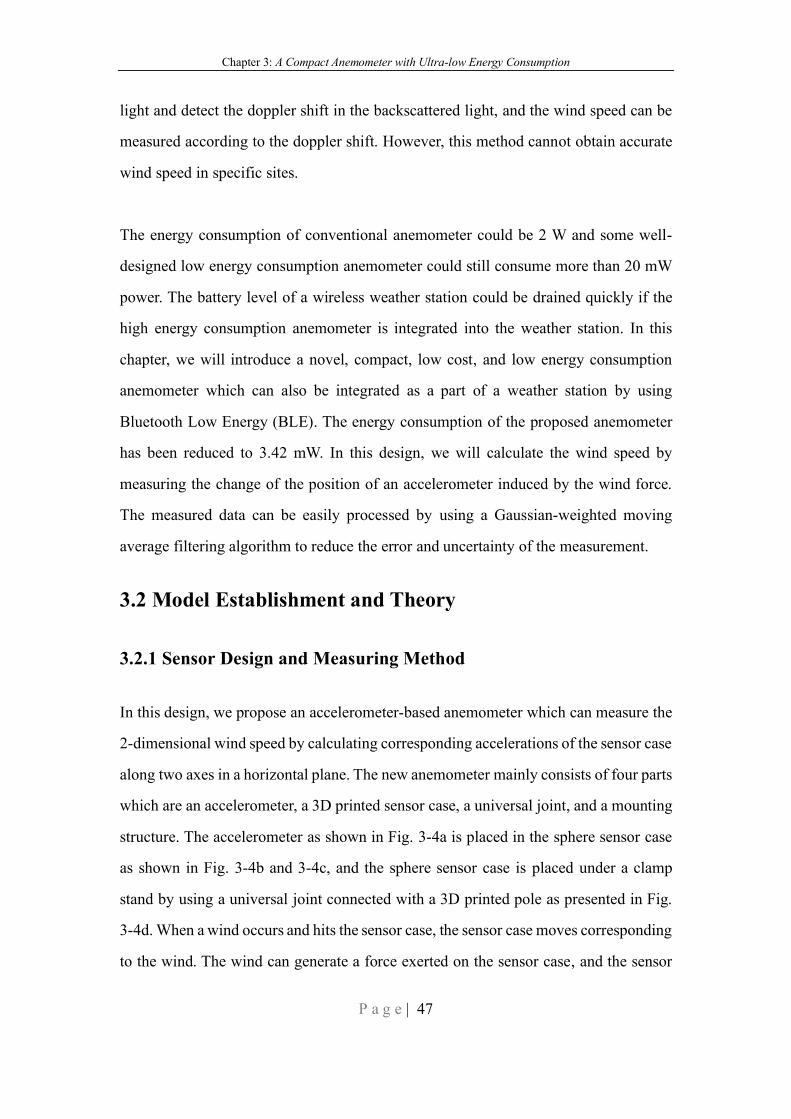
Chapter 3: A Compact Anemometer with Ultra-low Energy Consumption
P a g e | 47
light and detect the doppler shift in the backscattered light, and the wind speed can be
measured according to the doppler shift. However, this method cannot obtain accurate
wind speed in specific sites.
The energy consumption of conventional anemometer could be 2 W and some well-
designed low energy consumption anemometer could still consume more than 20 mW
power. The battery level of a wireless weather station could be drained quickly if the
high energy consumption anemometer is integrated into the weather station. In this
chapter, we will introduce a novel, compact, low cost, and low energy consumption
anemometer which can also be integrated as a part of a weather station by using
Bluetooth Low Energy (BLE). The energy consumption of the proposed anemometer
has been reduced to 3.42 mW. In this design, we will calculate the wind speed by
measuring the change of the position of an accelerometer induced by the wind force.
The measured data can be easily processed by using a Gaussian-weighted moving
average filtering algorithm to reduce the error and uncertainty of the measurement.
3.2 Model Establishment and Theory
3.2.1 Sensor Design and Measuring Method
In this design, we propose an accelerometer-based anemometer which can measure the
2-dimensional wind speed by calculating corresponding accelerations of the sensor case
along two axes in a horizontal plane. The new anemometer mainly consists of four parts
which are an accelerometer, a 3D printed sensor case, a universal joint, and a mounting
structure. The accelerometer as shown in Fig. 3-4a is placed in the sphere sensor case
as shown in Fig. 3-4b and 3-4c, and the sphere sensor case is placed under a clamp
stand by using a universal joint connected with a 3D printed pole as presented in Fig.
3-4d. When a wind occurs and hits the sensor case, the sensor case moves corresponding
to the wind. The wind can generate a force exerted on the sensor case, and the sensor
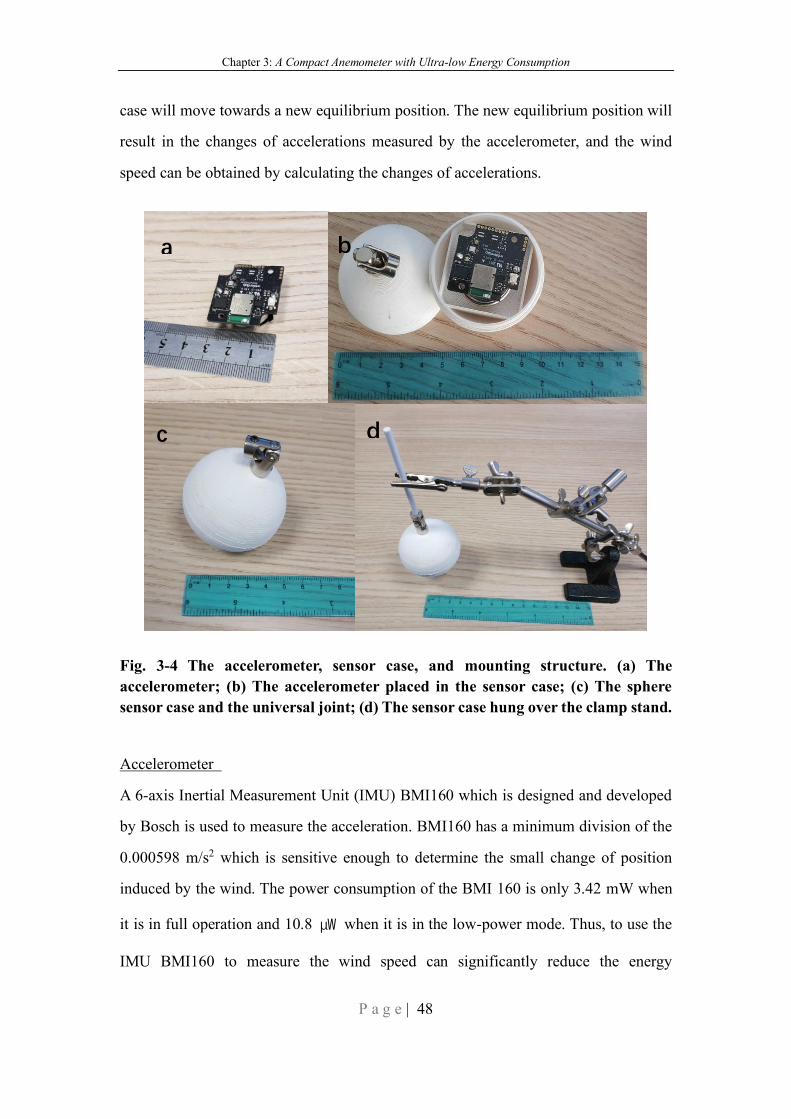
Chapter 3: A Compact Anemometer with Ultra-low Energy Consumption
P a g e | 48
case will move towards a new equilibrium position. The new equilibrium position will
result in the changes of accelerations measured by the accelerometer, and the wind
speed can be obtained by calculating the changes of accelerations.
Fig. 3-4 The accelerometer, sensor case, and mounting structure. (a) The
accelerometer; (b) The accelerometer placed in the sensor case; (c) The sphere
sensor case and the universal joint; (d) The sensor case hung over the clamp stand.
Accelerometer
A 6-axis Inertial Measurement Unit (IMU) BMI160 which is designed and developed
by Bosch is used to measure the acceleration. BMI160 has a minimum division of the
0.000598 m/s2 which is sensitive enough to determine the small change of position
induced by the wind. The power consumption of the BMI 160 is only 3.42 mW when
it is in full operation and 10.8 ㎼ when it is in the low-power mode. Thus, to use the
IMU BMI160 to measure the wind speed can significantly reduce the energy
a b
c d
Chapter 3: A Compact Anemometer with Ultra-low Energy Consumption
P a g e | 49
consumption compared with other conventional anemometers. The BMI160 is
integrated into a small Printed Circuit Board (PCB) with a size of 30mm * 30mm, as
shown in Fig. 3-4a and it will be placed flat into the sensor case as shown in Fig. 3-4b.
The board also has a central processing unit to process the data and Bluetooth module
to transmit the measured data wirelessly. It can measure three sets of accelerations along
three perpendicular axes. In this design, we only focus on the accelerations along two
perpendicular axes in the horizontal plane, namely Ax and Ay.
3D Printed Spherical Sensor Case
The sensor case is designed to be a sphere with a diameter of 5 cm so that it is perfectly
symmetrical in all directions. And the same amount of force can be exerted on the
sensor case when winds with same speeds from different directions hit the sensor case.
The sensor case is 3D printed by using Acrylonitrile Styrene Acrylate (ASA) which is
thermoplastic material. This material is suitable for outdoor weather applications due
to its high UV stability and chemical resistance. The sensor case consists of two parts
which are the base and the lid. There is a square container embedded in the base half
sphere, and it is used to hold the accelerometer. There is a hole with 3mm in diameter
in the lid which is used to connect with the universal joint. The picture of the base and
the lid can be found in Fig. 3-4b. The structure is designed to have no gaps between the
lid and the base so that the sensor case can prevent the rain and the dust.
Universal Joint and Mounting Structure
A stainless universal joint with low friction is chosen to connect the sensor case to the
mounting structure. It allows the sensor case to move freely along two perpendicular
axes in the horizontal plane. One side of the universal joint is connected to the lid of
the sensor case, and the other side of the joint is connected to a 3D printed pole. Then,
the 3D printed pole is clamped by the clamp stand to fix the anemometer. The main
body of the clamp stand is 15cm away from the anemometer to minimize the wind
interferences it may induce. The whole structure of the sensor case clamped by the
Chapter 3: A Compact Anemometer with Ultra-low Energy Consumption
P a g e | 50
clamp stand is shown in Fig. 3-4d. The anemometer can also be easily placed under
other places depends on the application and deployment.
3.2.2 Model Establishment
Wind Force Model:
The wind is the motion of the air, and it can generate a drag force on the object, namely
the wind force. Since the area of the contact surface is small, it can be assumed that
there is no turbulence, and the air pressure is evenly distributed across the contact
surface. Also, the average wind force acting on the sensor case within a short time can
be viewed as a stationary force [1, 2]. The wind speed can be calculated by measuring
the wind force exerted on the sensor case. The wind force F(t) can be expressed as a
function of wind speed varies with time which is proportional to the area of the contact
surface A as well as the density of the air ρ , and it is 1.226 kg/m3 at the standard
atmosphere. The geometry shape of the contact surface can also affect the wind force
generated on the object, and the shape factor is defined as μ. The wind force can be
expressed in the following equation.
F(t) = 1
2μρAV(t)2 (3.1)
where V(t) is the speed of the wind varying with time.
3D Dynamic Model of the Anemometer
1. Top View: Force Analysis
A wind force F(t) as a function of t is generated on the sphere sensor case as shown
in Figure. 3-5. θ(t) is defined as the direction of the wind, and the wind direction is
also a function that varies with time. The diagram of the force analysis from the top
view can be found in Figure. 3-5a. The wind force can then be divided into two parts
along the X-axis and Y-axis. The equations are shown below.
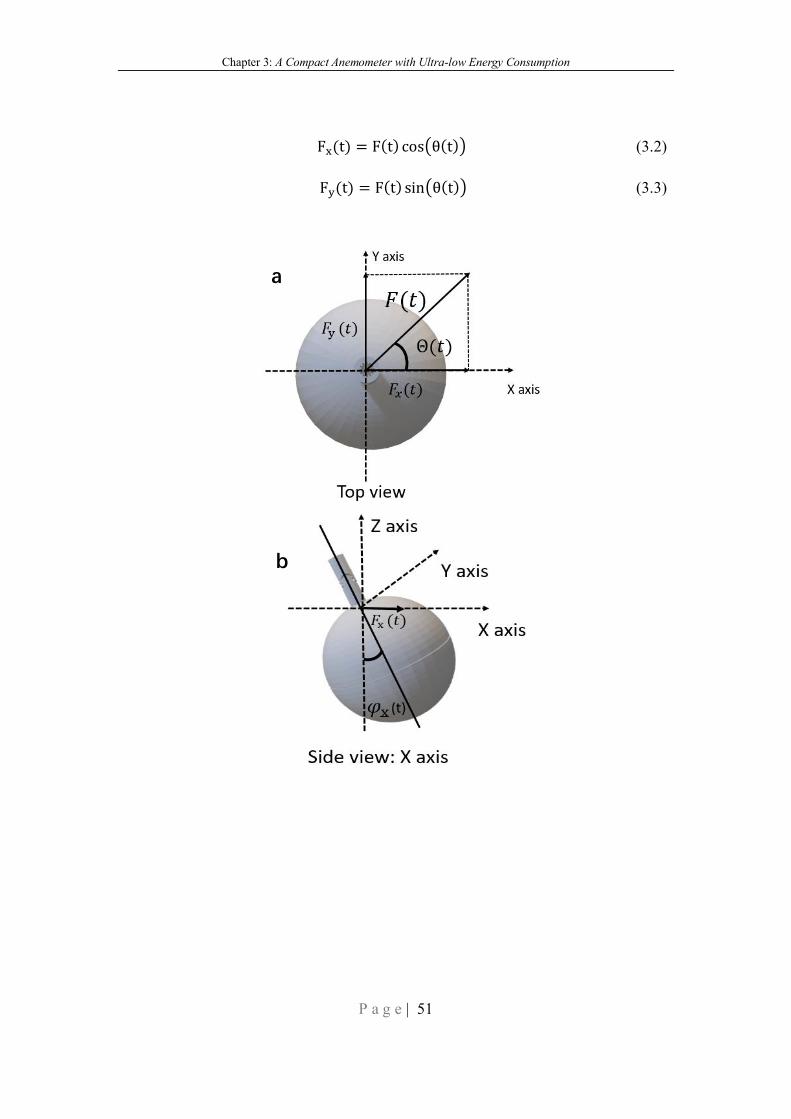
Chapter 3: A Compact Anemometer with Ultra-low Energy Consumption
P a g e | 51
Fx(t) = F(t) cos(θ(t)) (3.2)
Fy(t) = F(t) sin(θ(t)) (3.3)
a
b
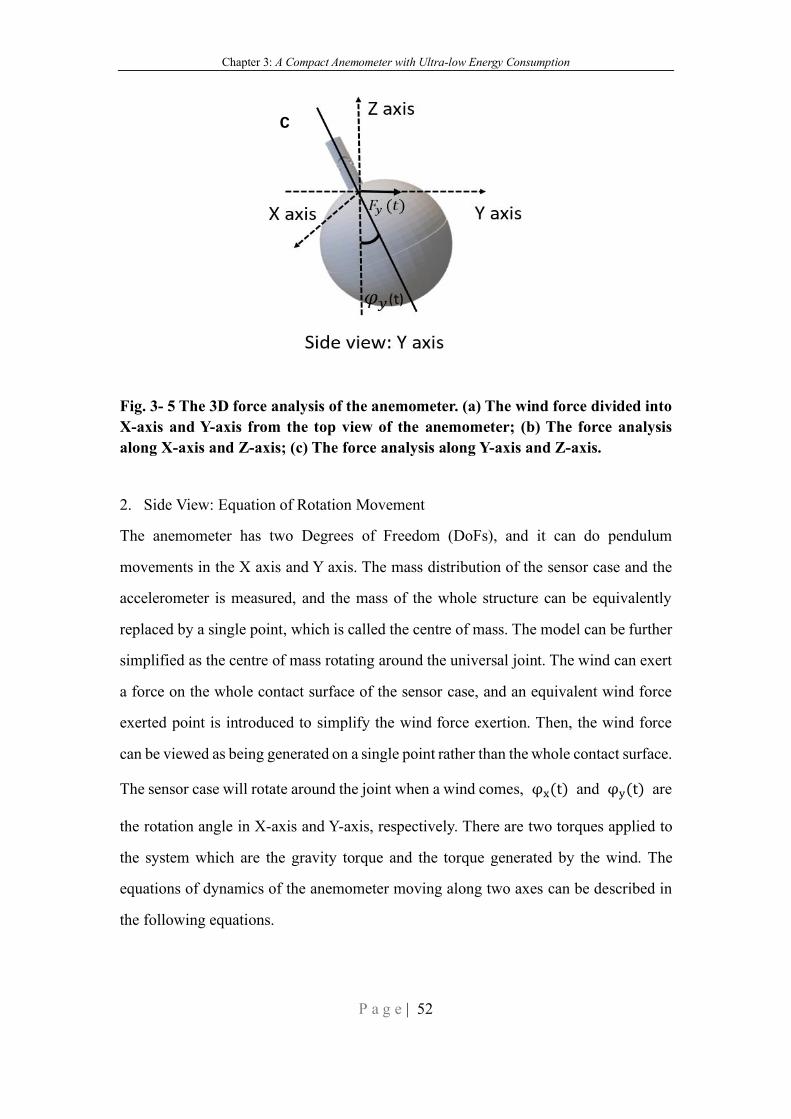
Chapter 3: A Compact Anemometer with Ultra-low Energy Consumption
P a g e | 52
Fig. 3- 5 The 3D force analysis of the anemometer. (a) The wind force divided into
X-axis and Y-axis from the top view of the anemometer; (b) The force analysis
along X-axis and Z-axis; (c) The force analysis along Y-axis and Z-axis.
2. Side View: Equation of Rotation Movement
The anemometer has two Degrees of Freedom (DoFs), and it can do pendulum
movements in the X axis and Y axis. The mass distribution of the sensor case and the
accelerometer is measured, and the mass of the whole structure can be equivalently
replaced by a single point, which is called the centre of mass. The model can be further
simplified as the centre of mass rotating around the universal joint. The wind can exert
a force on the whole contact surface of the sensor case, and an equivalent wind force
exerted point is introduced to simplify the wind force exertion. Then, the wind force
can be viewed as being generated on a single point rather than the whole contact surface.
The sensor case will rotate around the joint when a wind comes, φx(t) and φy(t) are
the rotation angle in X-axis and Y-axis, respectively. There are two torques applied to
the system which are the gravity torque and the torque generated by the wind. The
equations of dynamics of the anemometer moving along two axes can be described in
the following equations.
c
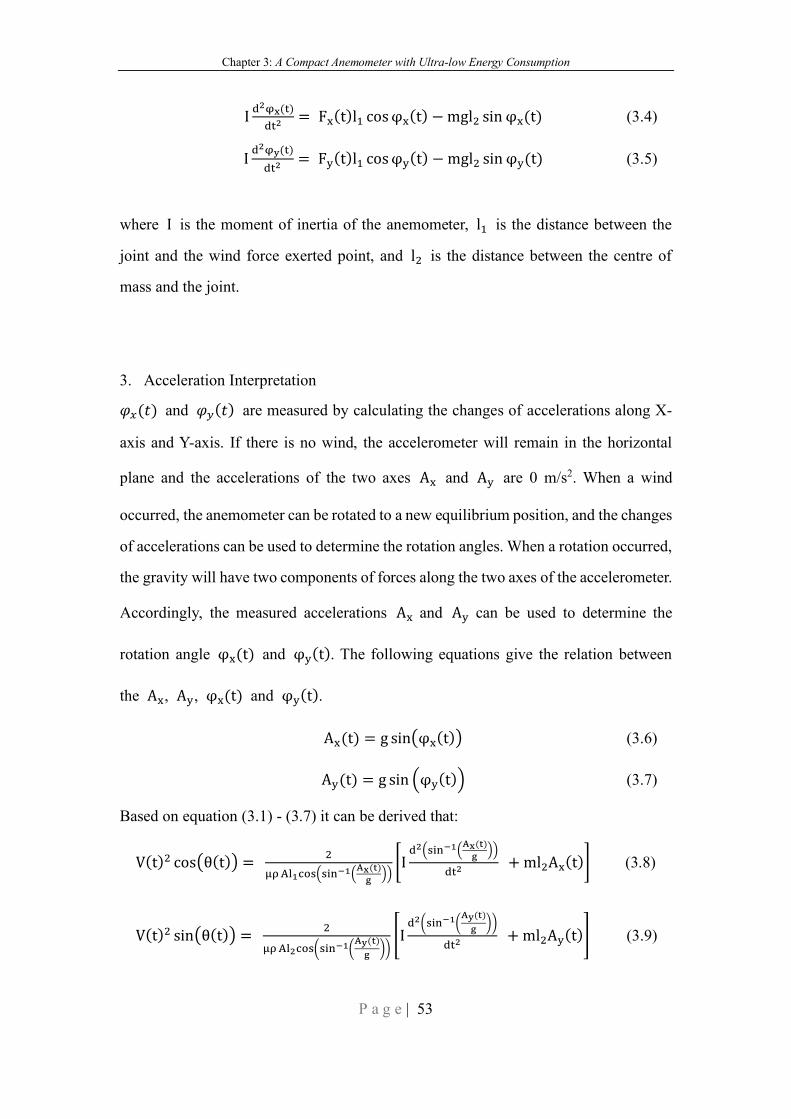
Chapter 3: A Compact Anemometer with Ultra-low Energy Consumption
P a g e | 53
Id2φx(t)
dt2 = Fx(t)l1 cos φx(t) − mgl2 sin φx(t) (3.4)
Id2φy(t)
dt2 = Fy(t)l1 cos φy(t) − mgl2 sin φy(t) (3.5)
where I is the moment of inertia of the anemometer, l1 is the distance between the
joint and the wind force exerted point, and l2 is the distance between the centre of
mass and the joint.
3. Acceleration Interpretation
𝜑𝑥(𝑡) and 𝜑𝑦(𝑡) are measured by calculating the changes of accelerations along X-
axis and Y-axis. If there is no wind, the accelerometer will remain in the horizontal
plane and the accelerations of the two axes Ax and Ay are 0 m/s2. When a wind
occurred, the anemometer can be rotated to a new equilibrium position, and the changes
of accelerations can be used to determine the rotation angles. When a rotation occurred,
the gravity will have two components of forces along the two axes of the accelerometer.
Accordingly, the measured accelerations Ax and Ay can be used to determine the
rotation angle φx(t) and φy(t). The following equations give the relation between
the Ax, Ay, φx(t) and φy(t).
Ax(t) = g sin(φx(t)) (3.6)
Ay(t) = g sin (φy(t)) (3.7)
Based on equation (3.1) - (3.7) it can be derived that:
V(t)2 cos(θ(t)) = 2
μρ Al1cos(sin−1(Ax(t)
g))
[Id2(sin−1(
Ax(t)
g))
dt2 + ml2Ax(t)] (3.8)
V(t)2 sin(θ(t)) = 2
μρ Al2cos(sin−1(Ay(t)
g))
[Id2(sin−1(
Ay(t)
g))
dt2 + ml2Ay(t)] (3.9)
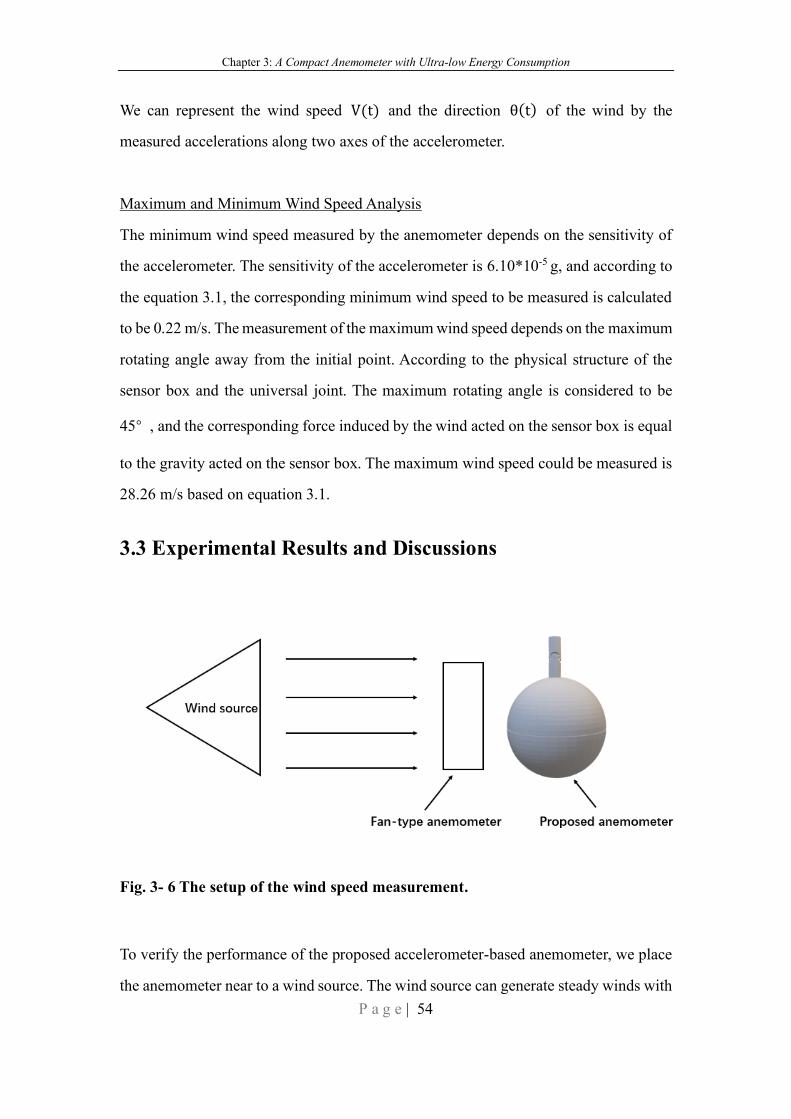
Chapter 3: A Compact Anemometer with Ultra-low Energy Consumption
P a g e | 54
We can represent the wind speed V(t) and the direction θ(t) of the wind by the
measured accelerations along two axes of the accelerometer.
Maximum and Minimum Wind Speed Analysis
The minimum wind speed measured by the anemometer depends on the sensitivity of
the accelerometer. The sensitivity of the accelerometer is 6.10*10-5 g, and according to
the equation 3.1, the corresponding minimum wind speed to be measured is calculated
to be 0.22 m/s. The measurement of the maximum wind speed depends on the maximum
rotating angle away from the initial point. According to the physical structure of the
sensor box and the universal joint. The maximum rotating angle is considered to be
45° , and the corresponding force induced by the wind acted on the sensor box is equal
to the gravity acted on the sensor box. The maximum wind speed could be measured is
28.26 m/s based on equation 3.1.
3.3 Experimental Results and Discussions
Fig. 3- 6 The setup of the wind speed measurement.
To verify the performance of the proposed accelerometer-based anemometer, we place
the anemometer near to a wind source. The wind source can generate steady winds with
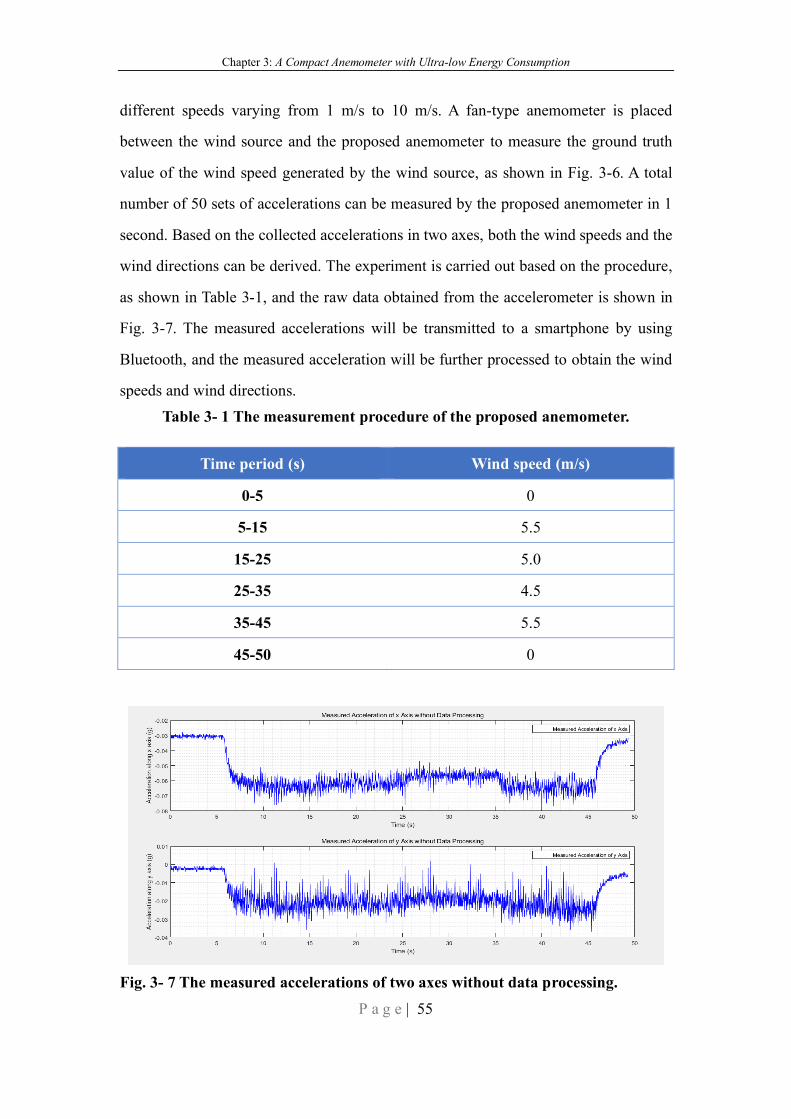
Chapter 3: A Compact Anemometer with Ultra-low Energy Consumption
P a g e | 55
different speeds varying from 1 m/s to 10 m/s. A fan-type anemometer is placed
between the wind source and the proposed anemometer to measure the ground truth
value of the wind speed generated by the wind source, as shown in Fig. 3-6. A total
number of 50 sets of accelerations can be measured by the proposed anemometer in 1
second. Based on the collected accelerations in two axes, both the wind speeds and the
wind directions can be derived. The experiment is carried out based on the procedure,
as shown in Table 3-1, and the raw data obtained from the accelerometer is shown in
Fig. 3-7. The measured accelerations will be transmitted to a smartphone by using
Bluetooth, and the measured acceleration will be further processed to obtain the wind
speeds and wind directions.
Table 3- 1 The measurement procedure of the proposed anemometer.
Time period (s) Wind speed (m/s)
0-5 0
5-15 5.5
15-25 5.0
25-35 4.5
35-45 5.5
45-50 0
Fig. 3- 7 The measured accelerations of two axes without data processing.
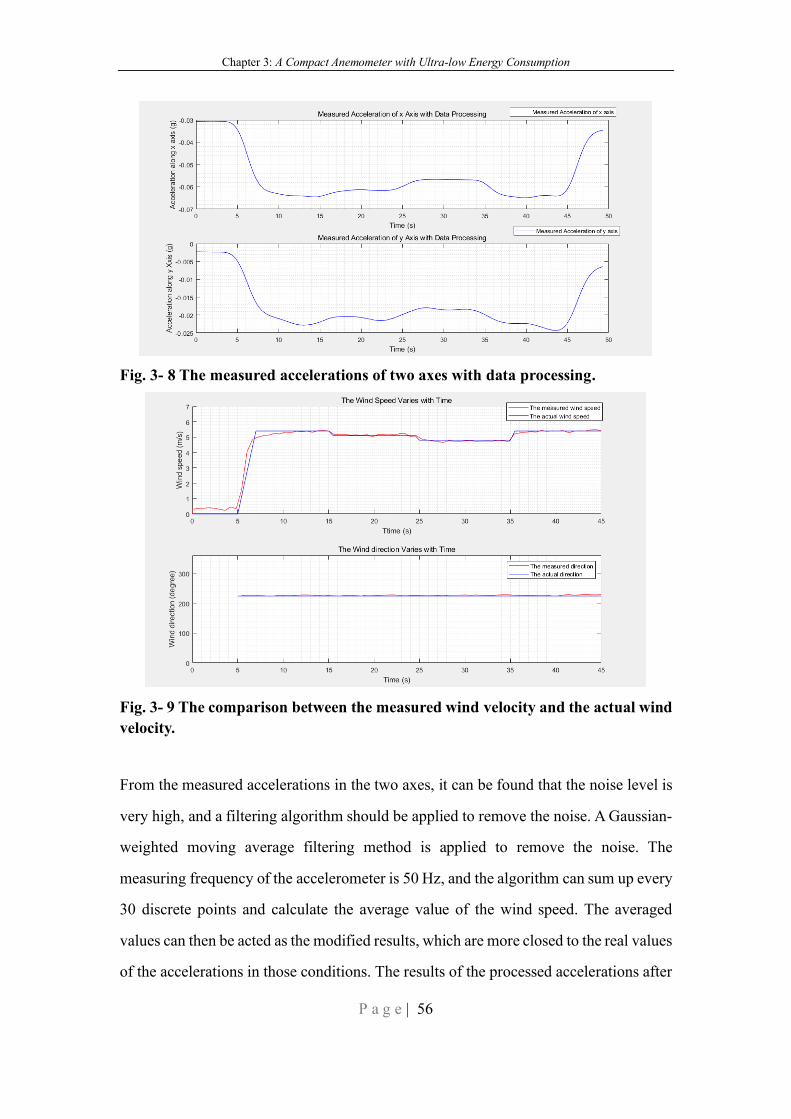
Chapter 3: A Compact Anemometer with Ultra-low Energy Consumption
P a g e | 56
Fig. 3- 8 The measured accelerations of two axes with data processing.
Fig. 3- 9 The comparison between the measured wind velocity and the actual wind
velocity.
From the measured accelerations in the two axes, it can be found that the noise level is
very high, and a filtering algorithm should be applied to remove the noise. A Gaussian-
weighted moving average filtering method is applied to remove the noise. The
measuring frequency of the accelerometer is 50 Hz, and the algorithm can sum up every
30 discrete points and calculate the average value of the wind speed. The averaged
values can then be acted as the modified results, which are more closed to the real values
of the accelerations in those conditions. The results of the processed accelerations after
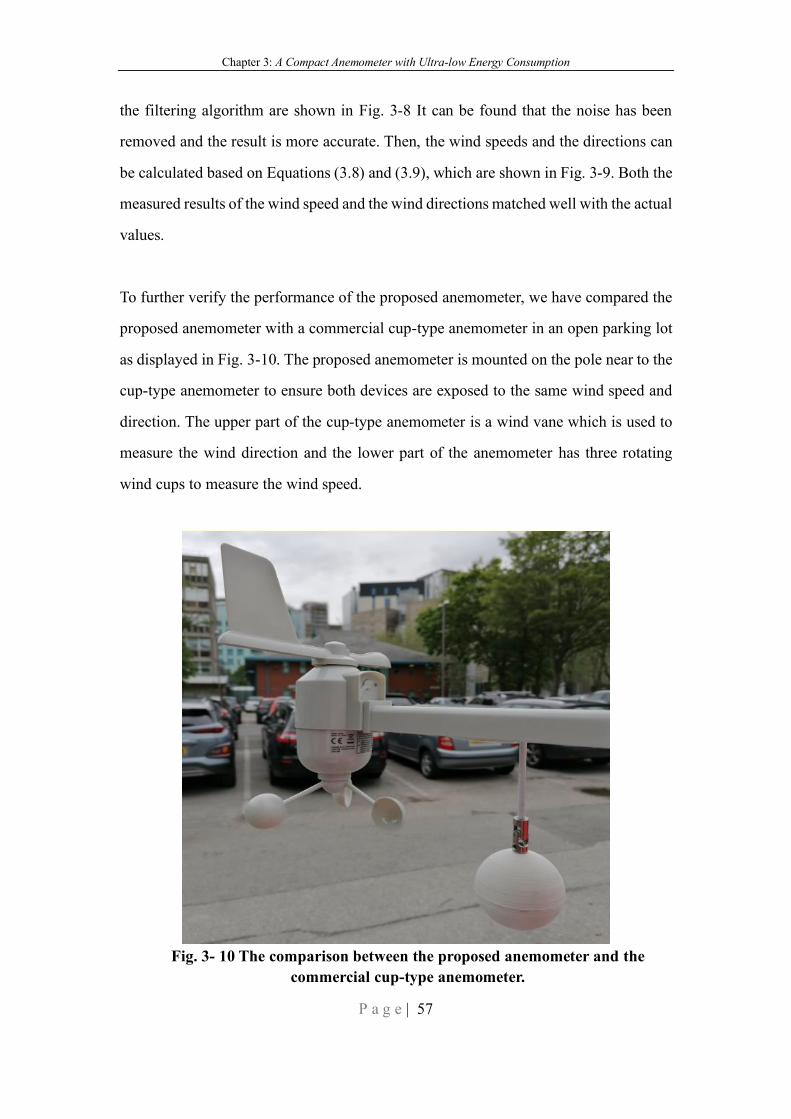
Chapter 3: A Compact Anemometer with Ultra-low Energy Consumption
P a g e | 57
the filtering algorithm are shown in Fig. 3-8 It can be found that the noise has been
removed and the result is more accurate. Then, the wind speeds and the directions can
be calculated based on Equations (3.8) and (3.9), which are shown in Fig. 3-9. Both the
measured results of the wind speed and the wind directions matched well with the actual
values.
To further verify the performance of the proposed anemometer, we have compared the
proposed anemometer with a commercial cup-type anemometer in an open parking lot
as displayed in Fig. 3-10. The proposed anemometer is mounted on the pole near to the
cup-type anemometer to ensure both devices are exposed to the same wind speed and
direction. The upper part of the cup-type anemometer is a wind vane which is used to
measure the wind direction and the lower part of the anemometer has three rotating
wind cups to measure the wind speed.
Fig. 3- 10 The comparison between the proposed anemometer and the
commercial cup-type anemometer.
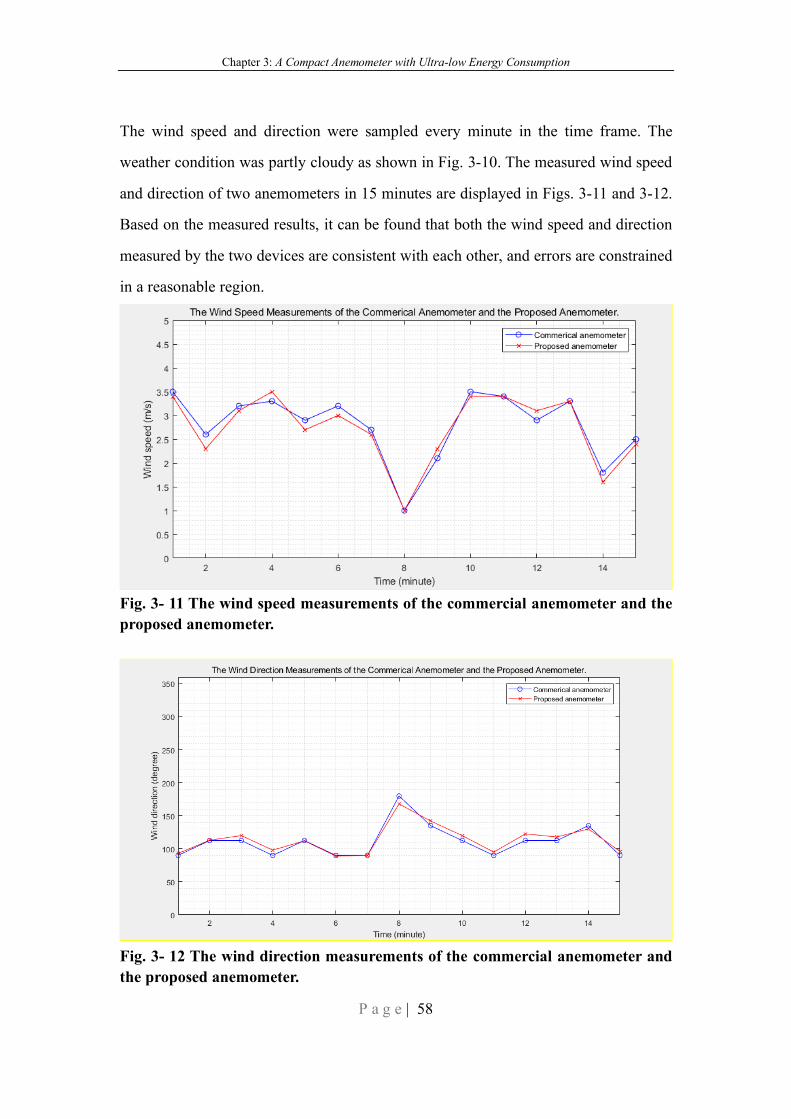
Chapter 3: A Compact Anemometer with Ultra-low Energy Consumption
P a g e | 58
The wind speed and direction were sampled every minute in the time frame. The
weather condition was partly cloudy as shown in Fig. 3-10. The measured wind speed
and direction of two anemometers in 15 minutes are displayed in Figs. 3-11 and 3-12.
Based on the measured results, it can be found that both the wind speed and direction
measured by the two devices are consistent with each other, and errors are constrained
in a reasonable region.
Fig. 3- 11 The wind speed measurements of the commercial anemometer and the
proposed anemometer.
Fig. 3- 12 The wind direction measurements of the commercial anemometer and
the proposed anemometer.
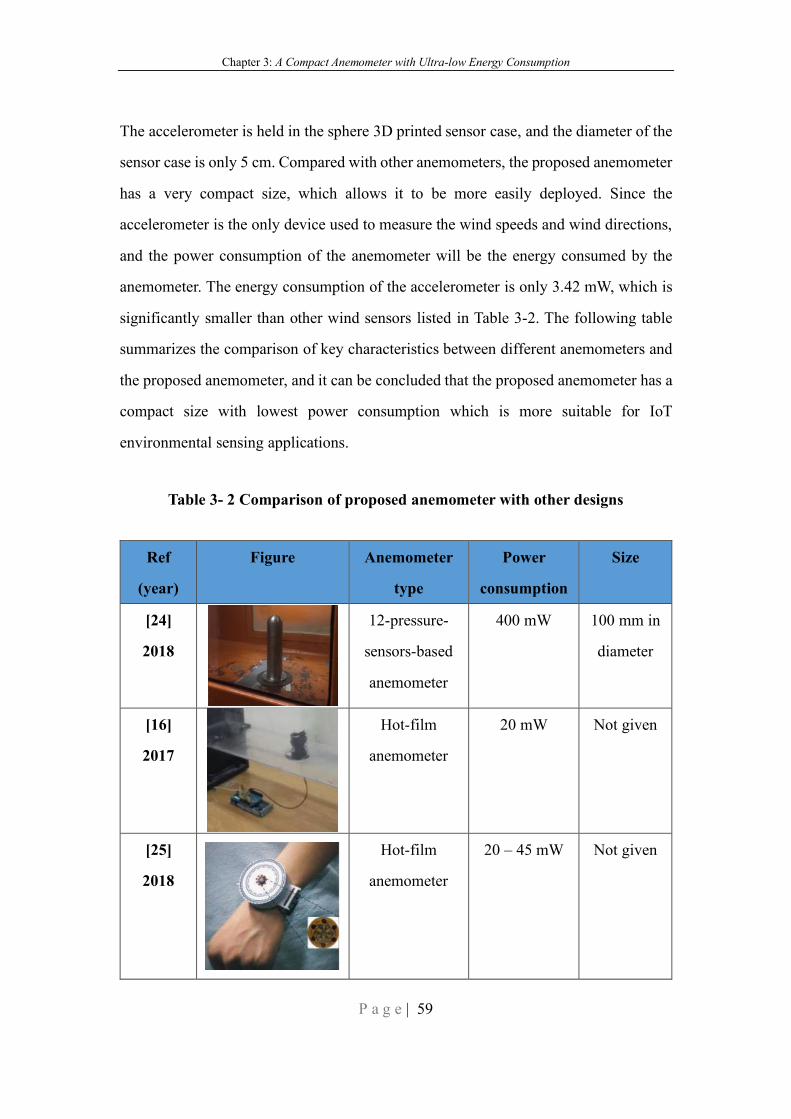
Chapter 3: A Compact Anemometer with Ultra-low Energy Consumption
P a g e | 59
The accelerometer is held in the sphere 3D printed sensor case, and the diameter of the
sensor case is only 5 cm. Compared with other anemometers, the proposed anemometer
has a very compact size, which allows it to be more easily deployed. Since the
accelerometer is the only device used to measure the wind speeds and wind directions,
and the power consumption of the anemometer will be the energy consumed by the
anemometer. The energy consumption of the accelerometer is only 3.42 mW, which is
significantly smaller than other wind sensors listed in Table 3-2. The following table
summarizes the comparison of key characteristics between different anemometers and
the proposed anemometer, and it can be concluded that the proposed anemometer has a
compact size with lowest power consumption which is more suitable for IoT
environmental sensing applications.
Table 3- 2 Comparison of proposed anemometer with other designs
Ref
(year)
Figure Anemometer
type
Power
consumption
Size
[24]
2018
12-pressure-
sensors-based
anemometer
400 mW 100 mm in
diameter
[16]
2017
Hot-film
anemometer
20 mW Not given
[25]
2018
Hot-film
anemometer
20 – 45 mW Not given
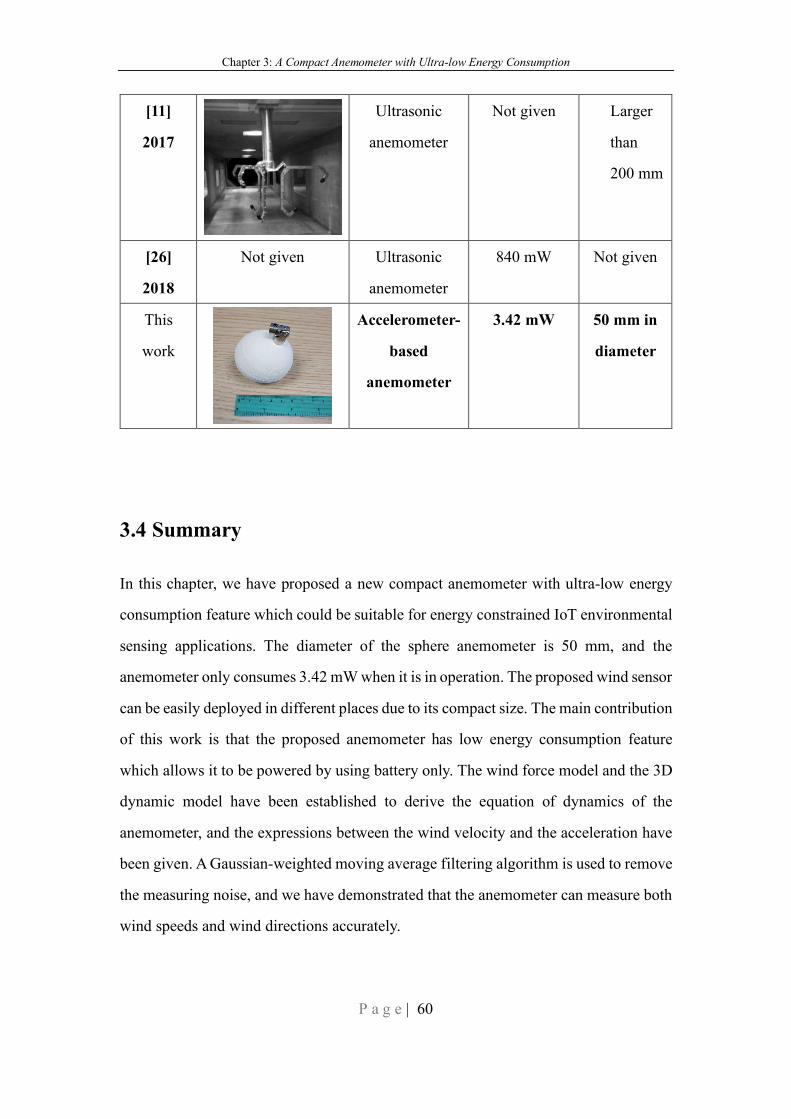
Chapter 3: A Compact Anemometer with Ultra-low Energy Consumption
P a g e | 60
[11]
2017
Ultrasonic
anemometer
Not given Larger
than
200 mm
[26]
2018
Not given Ultrasonic
anemometer
840 mW Not given
This
work
Accelerometer-
based
anemometer
3.42 mW 50 mm in
diameter
3.4 Summary
In this chapter, we have proposed a new compact anemometer with ultra-low energy
consumption feature which could be suitable for energy constrained IoT environmental
sensing applications. The diameter of the sphere anemometer is 50 mm, and the
anemometer only consumes 3.42 mW when it is in operation. The proposed wind sensor
can be easily deployed in different places due to its compact size. The main contribution
of this work is that the proposed anemometer has low energy consumption feature
which allows it to be powered by using battery only. The wind force model and the 3D
dynamic model have been established to derive the equation of dynamics of the
anemometer, and the expressions between the wind velocity and the acceleration have
been given. A Gaussian-weighted moving average filtering algorithm is used to remove
the measuring noise, and we have demonstrated that the anemometer can measure both
wind speeds and wind directions accurately.
Chapter 3: A Compact Anemometer with Ultra-low Energy Consumption
P a g e | 61
References
[1] Y. Zhu, B. Chen, M. Qin, and Q.-A. Huang, "2-D micromachined thermal wind
sensors—A review," IEEE Internet of Things Journal, vol. 1, no. 3, pp. 216-232,
2014.
[2] S. N. Daskalakis, G. Goussetis, S. D. Assimonis, M. M. Tentzeris, and A.
Georgiadis, "A uW backscatter-morse-leaf sensor for low-power agricultural
wireless sensor networks," IEEE Sensors Journal, vol. 18, no. 19, pp. 7889-
7898, 2018.
[3] N. Kumar and D. P. Vidyarthi, "A green routing algorithm for IoT-enabled
software defined wireless sensor network," IEEE Sensors Journal, vol. 18, no.
22, pp. 9449-9460, 2018.
[4] S. Mathew, Wind energy: fundamentals, resource analysis and economics.
Springer, 2006.
[5] S. Pindado, J. Cubas, and F. Sorribes-Palmer, "The cup anemometer, a
fundamental meteorological instrument for the wind energy industry. Research
at the IDR/UPM Institute," Sensors, vol. 14, no. 11, pp. 21418-21452, 2014.
[6] S. Pindado, J. Cubas, and F. Sorribes-Palmer, "On the harmonic analysis of cup
anemometer rotation speed: A principle to monitor performance and
maintenance status of rotating meteorological sensors," Measurement, vol. 73,
pp. 401-418, 2015.
[7] S. Pindado, A. Barrero-Gil, and A. Sanz, "Cup anemometers’ Loss of
performance due to ageing processes, and its effect on Annual Energy
Production (AEP) estimates," Energies, vol. 5, no. 5, pp. 1664-1685, 2012.
Chapter 3: A Compact Anemometer with Ultra-low Energy Consumption
P a g e | 62
[8] M. Piotto, M. Dei, G. Pennelli, and P. Bruschi, "A miniaturized 2D solid state
anemometer based on thermal flow sensors," Procedia Chemistry, vol. 1, no. 1,
pp. 1463-1466, 2009.
[9] P. Bruschi, M. Dei, and M. Piotto, "A low-power 2-D wind sensor based on
integrated flow meters," IEEE Sensors Journal, vol. 9, no. 12, pp. 1688-1696,
2009.
[10] A. Wieser, F. Fiedler, and U. Corsmeier, "The influence of the sensor design on
wind measurements with sonic anemometer systems," Journal of atmospheric
and oceanic technology, vol. 18, no. 10, pp. 1585-1608, 2001.
[11] G. M. G. Lopes et al., "Development of 3-D ultrasonic anemometer with
nonorthogonal geometry for the determination of high-intensity winds," IEEE
Transactions on Instrumentation and Measurement, vol. 66, no. 11, pp. 2836-
2844, 2017.
[12] G. Bucci, F. Ciancetta, E. Fiorucci, D. Gallo, C. Landi, and M. Luiso, "A low-
cost ultrasonic wind speed and direction measurement system," 2013 IEEE
International Instrumentation and Measurement Technology Conference
(I2MTC), pp. 505-510, 20
[13] B. Allotta, L. Pugi, T. Massai, E. Boni, F. Guidi, and M. Montagni, "Design and
calibration of an innovative ultrasonic, arduino based anemometer," 2017 IEEE
International Conference on Environment and Electrical Engineering and 2017
IEEE Industrial and Commercial Power Systems Europe (EEEIC/I&CPS
Europe), pp. 1-6, 2017.
[14] Y. Zhu, B. Chen, M. Qin and Q. Huang, "2-D Micromachined Thermal Wind
Sensors—A Review," in IEEE Internet of Things Journal, vol. 1, no. 3, pp. 216-
232, June 2014.
Chapter 3: A Compact Anemometer with Ultra-low Energy Consumption
P a g e | 63
[15] M.Laghrouchea, A.Adaneb, J.Bousseyc, S.Ameura, D.Meunierc, S.Tardud, "A
miniature silicon hot wire sensor for automatic wind speed measurements."
Renewable Energy 30.12(2005):1881-1896.
[16] B. Idjeri, M. Laghrouche, and J. Boussey, "Wind measurement based on MEMS
micro-anemometer with high accuracy using ANN technique," IEEE Sensors
Journal, vol. 17, no. 13, pp. 4181-4188, 2017.
[17] H.-B. Liu, N. Lin, S.-S. Pan, J. Miao, and L. K. Norford, "High sensitivity,
miniature, full 2-D anemometer based on MEMS hot-film sensors," IEEE
Sensors Journal, vol. 13, no. 5, pp. 1914-1920, 2013.
[18] S. Kim, T. Nam, and S. Park, "Measurement of flow direction and velocity using
a micromachined flow sensor," Sensors and Actuators A: Physical, vol. 114, no.
2-3, pp. 312-318, 2004.
[19] Z. Liu, F. Wang, Y. Zhang, Z. Jing, and W. Peng, "Low-Power-Consumption
Fiber-Optic Anemometer Based on Long-Period Grating With SWCNT
Coating," IEEE Sensors Journal, vol. 19, no. 7, pp. 2592-2597, 2019.
[20] H, Julian, "Wind speed measurements in an offshore wind farm by remote
sensing. A comparison of radar satellite TerraSAR-X and ground-based LiDAR
systems." (2015).
[21] C, Swift, "Passive Microwave Remote Sensing of Ocean Surface Wind Speed.
Surface Waves and Fluxes". Springer Netherlands, 1990.
[22] M. A. Mohandes and S. Rehman, "Wind Speed Extrapolation Using Machine
Learning Methods and LiDAR Measurements," in IEEE Access, vol. 6, pp.
77634-77642, 2018.
Chapter 3: A Compact Anemometer with Ultra-low Energy Consumption
P a g e | 64
[23] R. Frehlich and N. Kelley, "Measurements of Wind and Turbulence Profiles
With Scanning Doppler Lidar for Wind Energy Applications," in IEEE Journal
of Selected Topics in Applied Earth Observations and Remote Sensing, vol. 1,
no. 1, pp. 42-47, March 2008.
[24] B. Sun, W. Zhou, M.-Z. Yuan, E.-Q. Fang, and N. Gan, "A Cylindrical Vehicle-
Mounted Anemometer Based on 12 Pressure Sensors—Principle, Prototype
Design, and Validation," IEEE Sensors Journal, vol. 18, no. 17, pp. 6954-6961,
2018.
[25] G.-Z. Li, S. Zhao, and R. Zhu, "Wearable anemometer with multi-sensing of
wind absolute orientation, wind speed, attitude, and heading," IEEE Sensors
Journal, vol. 19, no. 1, pp. 297-303, 2018.
[26] H. B. Fan, J. L. Liu, and G. Z. Sun, "Design of Low-power Ultrasonic
Anemometer Based on STM32L476," IOP Conference Series: Materials
Science and Engineering, vol. 408, no. 1, p. 012036, 2018.
Chapter 5: Conclusions and Future Work
P a g e | 65
Chapter 4 An Environmental Sensing Platform
with Self-powered Standalone Weather Stations
Chapter 3 has proposed a novel and compact wind sensor with ultra-low energy
consumption feature which can be integrated into a weather station. In this chapter, we
will develop a weather station which can act as a wireless sensor node. The weather
station should be small in size and consume low energy to meet the requirements of IoT
applications. A solar energy harvesting system will be integrated into the sensor node
to make it to be self-powered. The weather station should have a stable wireless
connection, and different weather stations can be deployed in different places and
connected to build an environmental sensing platform.
4.1 Introduction
Real-time environmental data (e.g., temperature, humidity, lightness, wind speeds, and
wind directions) is needed in different applications such as weather monitoring/
forecasting, smart city, smart agriculture, air quality monitoring, and load prediction [1,
2]. Climate changes have received much attention recently, which makes it an active
and hot research area. To statistically study the climate change and the impacts of the
human activities on nature environment, we need to collect data like rainfall,
temperature, CO2, wind speed, and air quality from various places over the time [3].
Environmental monitoring can also be used in other applications. For example,
environmental sensors should provide accurate and real-time metrological data to
predict the load and the amount of energy generated from solar farm and wind turbine
to meet the requirements in the smart grid [4-6]. Additionally, to realize smart
agriculture, different sensors should be deployed over a wide region to monitor the crop
Chapter 5: Conclusions and Future Work
P a g e | 66
and environmental conditions in the farm [7-9].
Different sensors are widely deployed to realize environmental monitoring applications,
and how to connect those sensors to allow real-time data transmission is a challenging
problem. With the rapid growth of IoT technologies, some machine type
communication (MTC) protocols like NB-IoT, LoRaWAN and Sigfox have emerged
and gained wide attention from many researchers [10]. They have low energy
consumption and wide coverage, which is suitable for IoT applications. Among them,
LoRaWAN allows to set up a private network, which can be integrated into different
global network platforms (e.g., The Things Network) [11]. Thus, LoRaWAN has been
selected for this project.
The power consumption of the sensor node is another main design challenge, which is
important to determine the lifespan of the node and maintain the overall performance
of the whole sensor network [12]. However, few research has been focused on the
energy consumption of the sensor node [13, 14]. It will increase the cost and difficulty
of the deployment of the sensing system if power lines are used to power the end devices.
The sensor node could be designed to be powered by the battery to increase deployment
flexibility. Energy-saving techniques and energy harvesting methods should also be
implemented to reduce battery replacement frequency and save the maintenance cost.
Solar energy has a relatively high power density, and solar panel is used to provide
energy to the sensing device.
This chapter proposes a new design of smart environmental sensing system with self-
powered sensor nodes, LoRaWAN communication network, and real-time data
accessible cloud. The wireless sensor node is embedded with a sleep mode control to
save operating power. Moreover, a solar energy harvesting powering method is
developed for the sensor. By integrating the solar energy harvesting method, the sensor
node can become self-powered without the need of changing the battery. LoRaWAN is
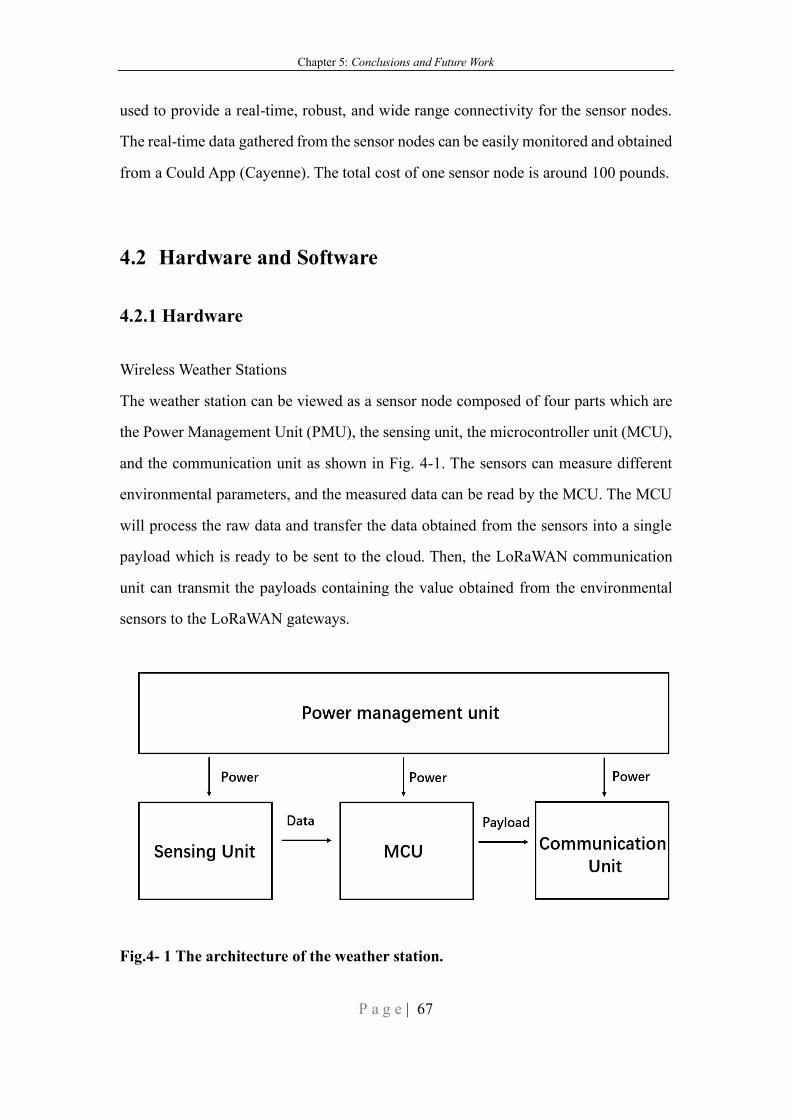
Chapter 5: Conclusions and Future Work
P a g e | 67
used to provide a real-time, robust, and wide range connectivity for the sensor nodes.
The real-time data gathered from the sensor nodes can be easily monitored and obtained
from a Could App (Cayenne). The total cost of one sensor node is around 100 pounds.
4.2 Hardware and Software
4.2.1 Hardware
Wireless Weather Stations
The weather station can be viewed as a sensor node composed of four parts which are
the Power Management Unit (PMU), the sensing unit, the microcontroller unit (MCU),
and the communication unit as shown in Fig. 4-1. The sensors can measure different
environmental parameters, and the measured data can be read by the MCU. The MCU
will process the raw data and transfer the data obtained from the sensors into a single
payload which is ready to be sent to the cloud. Then, the LoRaWAN communication
unit can transmit the payloads containing the value obtained from the environmental
sensors to the LoRaWAN gateways.
Fig.4- 1 The architecture of the weather station.
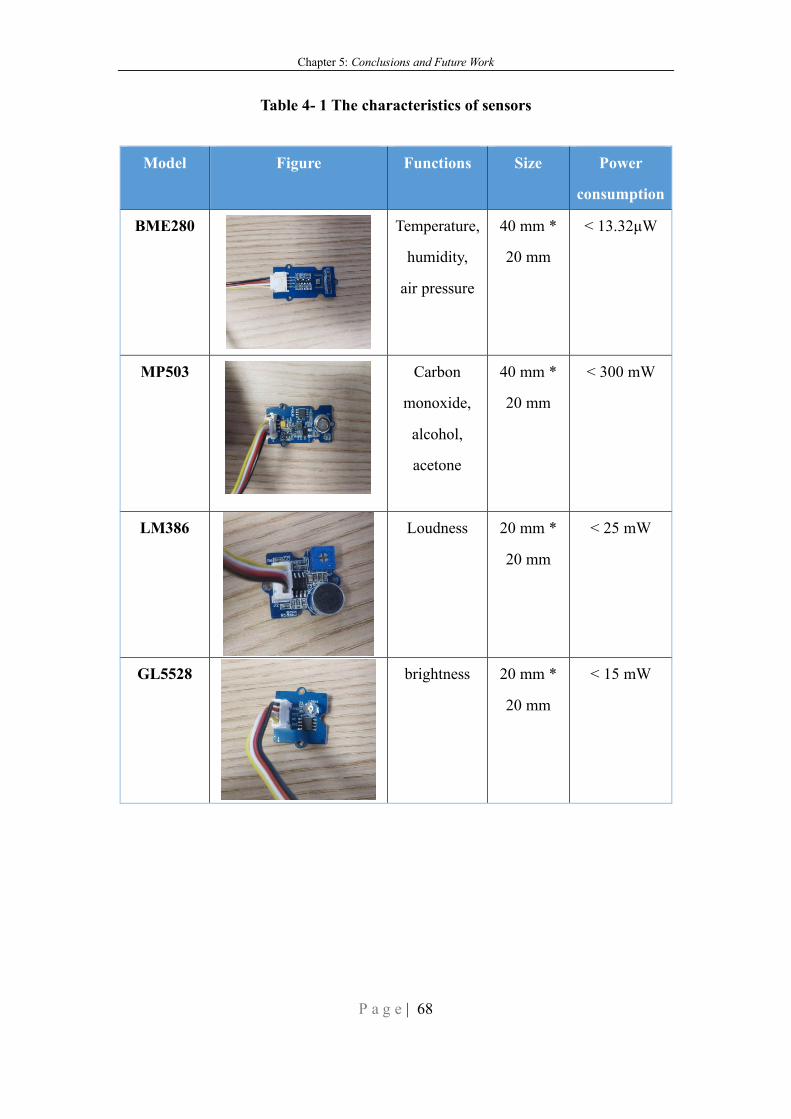
Chapter 5: Conclusions and Future Work
P a g e | 68
Table 4- 1 The characteristics of sensors
Model Figure Functions Size Power
consumption
BME280
Temperature,
humidity,
air pressure
40 mm *
20 mm
< 13.32μW
MP503
Carbon
monoxide,
alcohol,
acetone
40 mm *
20 mm
< 300 mW
LM386
Loudness 20 mm *
20 mm
< 25 mW
GL5528
brightness 20 mm *
20 mm
< 15 mW
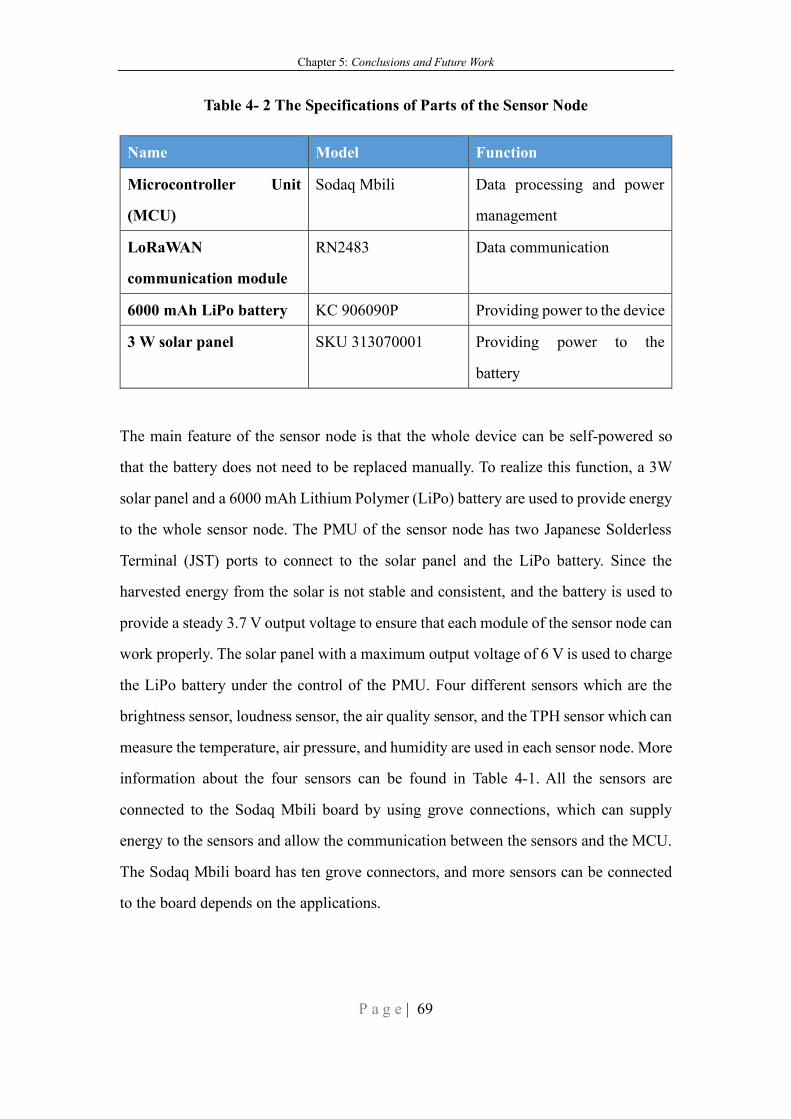
Chapter 5: Conclusions and Future Work
P a g e | 69
Table 4- 2 The Specifications of Parts of the Sensor Node
Name Model Function
Microcontroller Unit
(MCU)
Sodaq Mbili Data processing and power
management
LoRaWAN
communication module
RN2483 Data communication
6000 mAh LiPo battery KC 906090P Providing power to the device
3 W solar panel SKU 313070001 Providing power to the
battery
The main feature of the sensor node is that the whole device can be self-powered so
that the battery does not need to be replaced manually. To realize this function, a 3W
solar panel and a 6000 mAh Lithium Polymer (LiPo) battery are used to provide energy
to the whole sensor node. The PMU of the sensor node has two Japanese Solderless
Terminal (JST) ports to connect to the solar panel and the LiPo battery. Since the
harvested energy from the solar is not stable and consistent, and the battery is used to
provide a steady 3.7 V output voltage to ensure that each module of the sensor node can
work properly. The solar panel with a maximum output voltage of 6 V is used to charge
the LiPo battery under the control of the PMU. Four different sensors which are the
brightness sensor, loudness sensor, the air quality sensor, and the TPH sensor which can
measure the temperature, air pressure, and humidity are used in each sensor node. More
information about the four sensors can be found in Table 4-1. All the sensors are
connected to the Sodaq Mbili board by using grove connections, which can supply
energy to the sensors and allow the communication between the sensors and the MCU.
The Sodaq Mbili board has ten grove connectors, and more sensors can be connected
to the board depends on the applications.
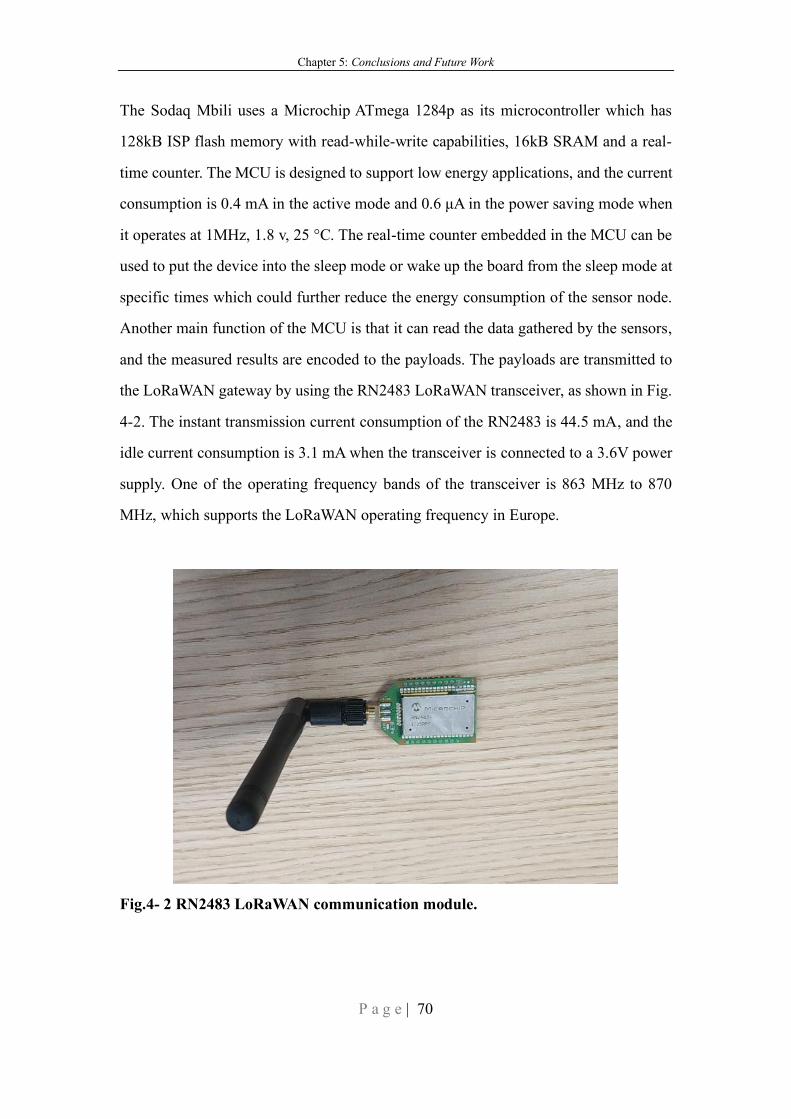
Chapter 5: Conclusions and Future Work
P a g e | 70
The Sodaq Mbili uses a Microchip ATmega 1284p as its microcontroller which has
128kB ISP flash memory with read-while-write capabilities, 16kB SRAM and a real-
time counter. The MCU is designed to support low energy applications, and the current
consumption is 0.4 mA in the active mode and 0.6 μA in the power saving mode when
it operates at 1MHz, 1.8 v, 25 °C. The real-time counter embedded in the MCU can be
used to put the device into the sleep mode or wake up the board from the sleep mode at
specific times which could further reduce the energy consumption of the sensor node.
Another main function of the MCU is that it can read the data gathered by the sensors,
and the measured results are encoded to the payloads. The payloads are transmitted to
the LoRaWAN gateway by using the RN2483 LoRaWAN transceiver, as shown in Fig.
4-2. The instant transmission current consumption of the RN2483 is 44.5 mA, and the
idle current consumption is 3.1 mA when the transceiver is connected to a 3.6V power
supply. One of the operating frequency bands of the transceiver is 863 MHz to 870
MHz, which supports the LoRaWAN operating frequency in Europe.
Fig.4- 2 RN2483 LoRaWAN communication module.
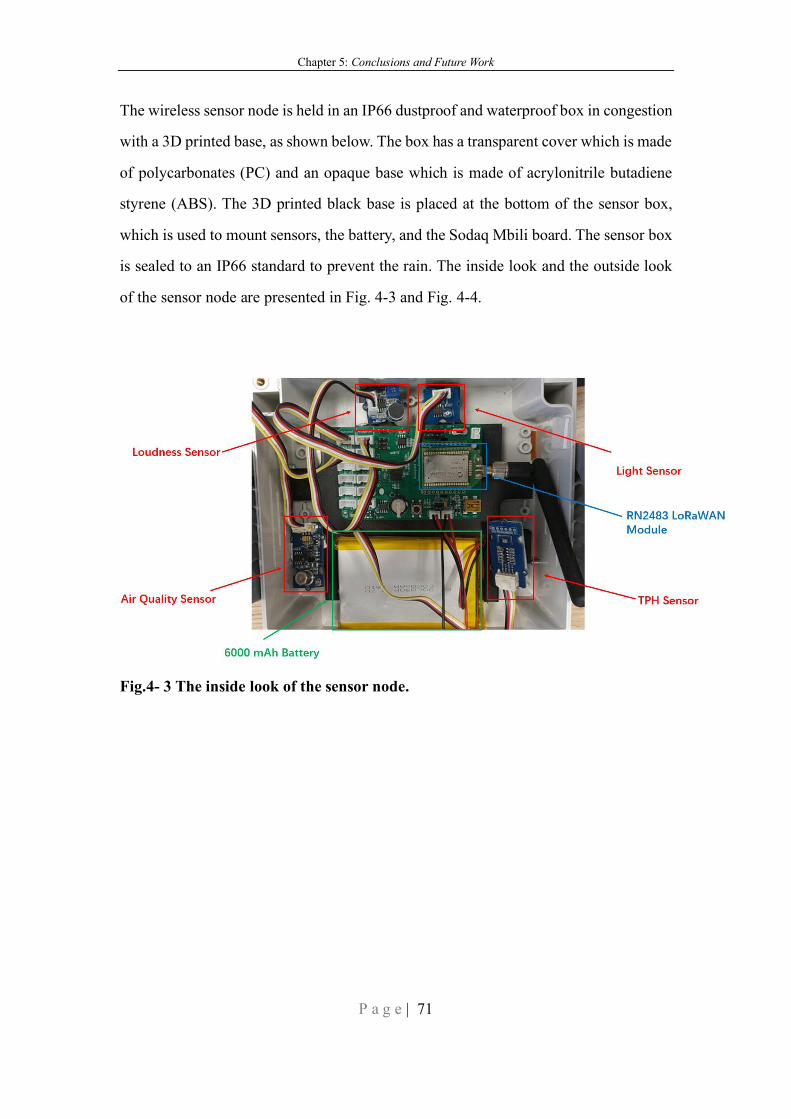
Chapter 5: Conclusions and Future Work
P a g e | 71
The wireless sensor node is held in an IP66 dustproof and waterproof box in congestion
with a 3D printed base, as shown below. The box has a transparent cover which is made
of polycarbonates (PC) and an opaque base which is made of acrylonitrile butadiene
styrene (ABS). The 3D printed black base is placed at the bottom of the sensor box,
which is used to mount sensors, the battery, and the Sodaq Mbili board. The sensor box
is sealed to an IP66 standard to prevent the rain. The inside look and the outside look
of the sensor node are presented in Fig. 4-3 and Fig. 4-4.
Fig.4- 3 The inside look of the sensor node.
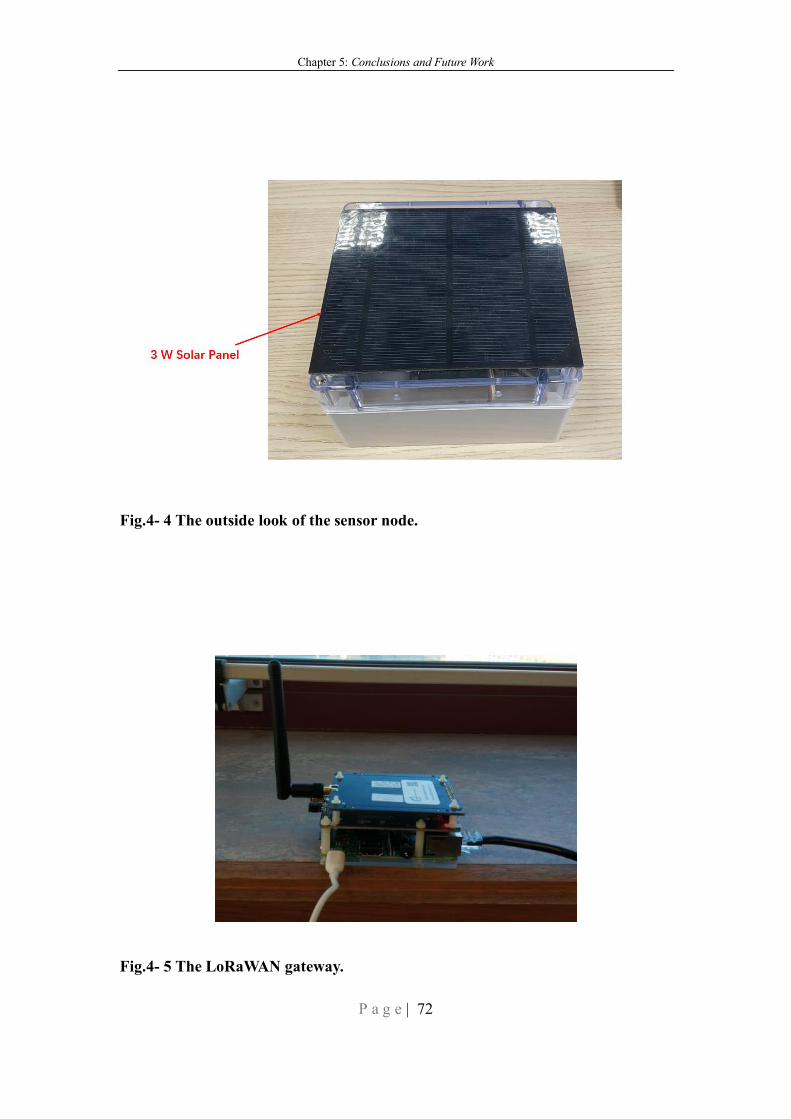
Chapter 5: Conclusions and Future Work
P a g e | 72
Fig.4- 4 The outside look of the sensor node.
Fig.4- 5 The LoRaWAN gateway.
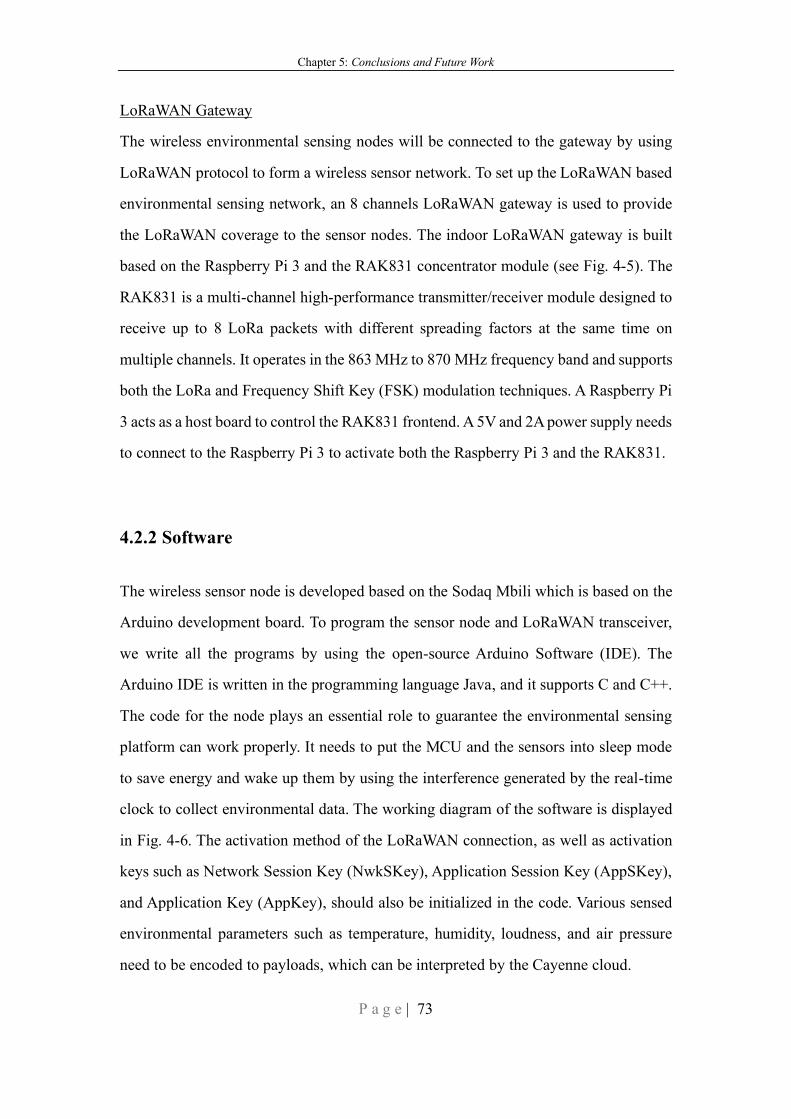
Chapter 5: Conclusions and Future Work
P a g e | 73
LoRaWAN Gateway
The wireless environmental sensing nodes will be connected to the gateway by using
LoRaWAN protocol to form a wireless sensor network. To set up the LoRaWAN based
environmental sensing network, an 8 channels LoRaWAN gateway is used to provide
the LoRaWAN coverage to the sensor nodes. The indoor LoRaWAN gateway is built
based on the Raspberry Pi 3 and the RAK831 concentrator module (see Fig. 4-5). The
RAK831 is a multi-channel high-performance transmitter/receiver module designed to
receive up to 8 LoRa packets with different spreading factors at the same time on
multiple channels. It operates in the 863 MHz to 870 MHz frequency band and supports
both the LoRa and Frequency Shift Key (FSK) modulation techniques. A Raspberry Pi
3 acts as a host board to control the RAK831 frontend. A 5V and 2A power supply needs
to connect to the Raspberry Pi 3 to activate both the Raspberry Pi 3 and the RAK831.
4.2.2 Software
The wireless sensor node is developed based on the Sodaq Mbili which is based on the
Arduino development board. To program the sensor node and LoRaWAN transceiver,
we write all the programs by using the open-source Arduino Software (IDE). The
Arduino IDE is written in the programming language Java, and it supports C and C++.
The code for the node plays an essential role to guarantee the environmental sensing
platform can work properly. It needs to put the MCU and the sensors into sleep mode
to save energy and wake up them by using the interference generated by the real-time
clock to collect environmental data. The working diagram of the software is displayed
in Fig. 4-6. The activation method of the LoRaWAN connection, as well as activation
keys such as Network Session Key (NwkSKey), Application Session Key (AppSKey),
and Application Key (AppKey), should also be initialized in the code. Various sensed
environmental parameters such as temperature, humidity, loudness, and air pressure
need to be encoded to payloads, which can be interpreted by the Cayenne cloud.
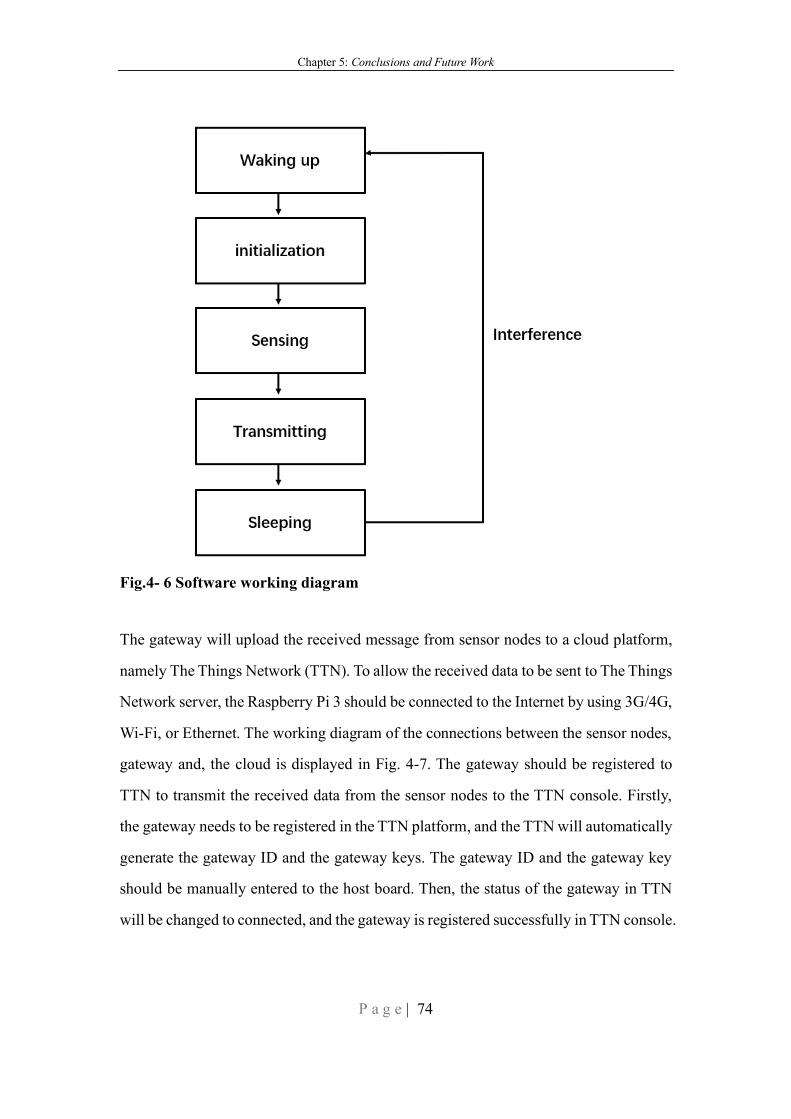
Chapter 5: Conclusions and Future Work
P a g e | 74
Fig.4- 6 Software working diagram
The gateway will upload the received message from sensor nodes to a cloud platform,
namely The Things Network (TTN). To allow the received data to be sent to The Things
Network server, the Raspberry Pi 3 should be connected to the Internet by using 3G/4G,
Wi-Fi, or Ethernet. The working diagram of the connections between the sensor nodes,
gateway and, the cloud is displayed in Fig. 4-7. The gateway should be registered to
TTN to transmit the received data from the sensor nodes to the TTN console. Firstly,
the gateway needs to be registered in the TTN platform, and the TTN will automatically
generate the gateway ID and the gateway keys. The gateway ID and the gateway key
should be manually entered to the host board. Then, the status of the gateway in TTN
will be changed to connected, and the gateway is registered successfully in TTN console.
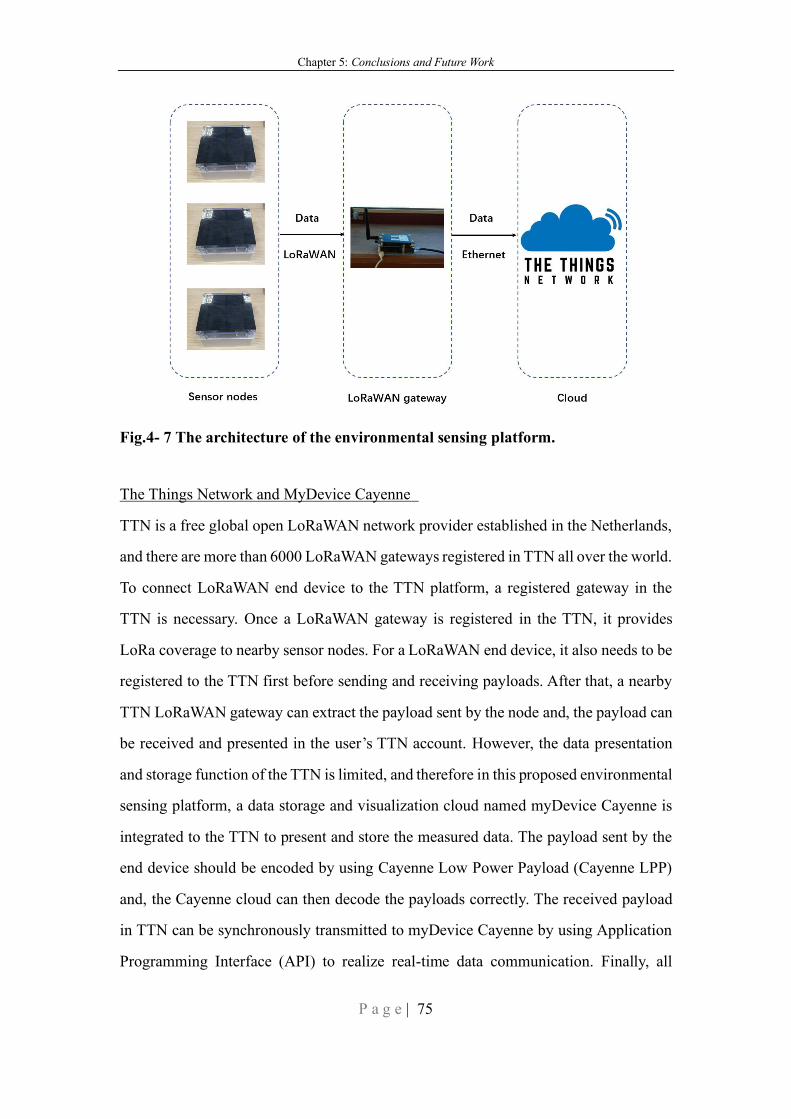
Chapter 5: Conclusions and Future Work
P a g e | 75
Fig.4- 7 The architecture of the environmental sensing platform.
The Things Network and MyDevice Cayenne
TTN is a free global open LoRaWAN network provider established in the Netherlands,
and there are more than 6000 LoRaWAN gateways registered in TTN all over the world.
To connect LoRaWAN end device to the TTN platform, a registered gateway in the
TTN is necessary. Once a LoRaWAN gateway is registered in the TTN, it provides
LoRa coverage to nearby sensor nodes. For a LoRaWAN end device, it also needs to be
registered to the TTN first before sending and receiving payloads. After that, a nearby
TTN LoRaWAN gateway can extract the payload sent by the node and, the payload can
be received and presented in the user’s TTN account. However, the data presentation
and storage function of the TTN is limited, and therefore in this proposed environmental
sensing platform, a data storage and visualization cloud named myDevice Cayenne is
integrated to the TTN to present and store the measured data. The payload sent by the
end device should be encoded by using Cayenne Low Power Payload (Cayenne LPP)
and, the Cayenne cloud can then decode the payloads correctly. The received payload
in TTN can be synchronously transmitted to myDevice Cayenne by using Application
Programming Interface (API) to realize real-time data communication. Finally, all
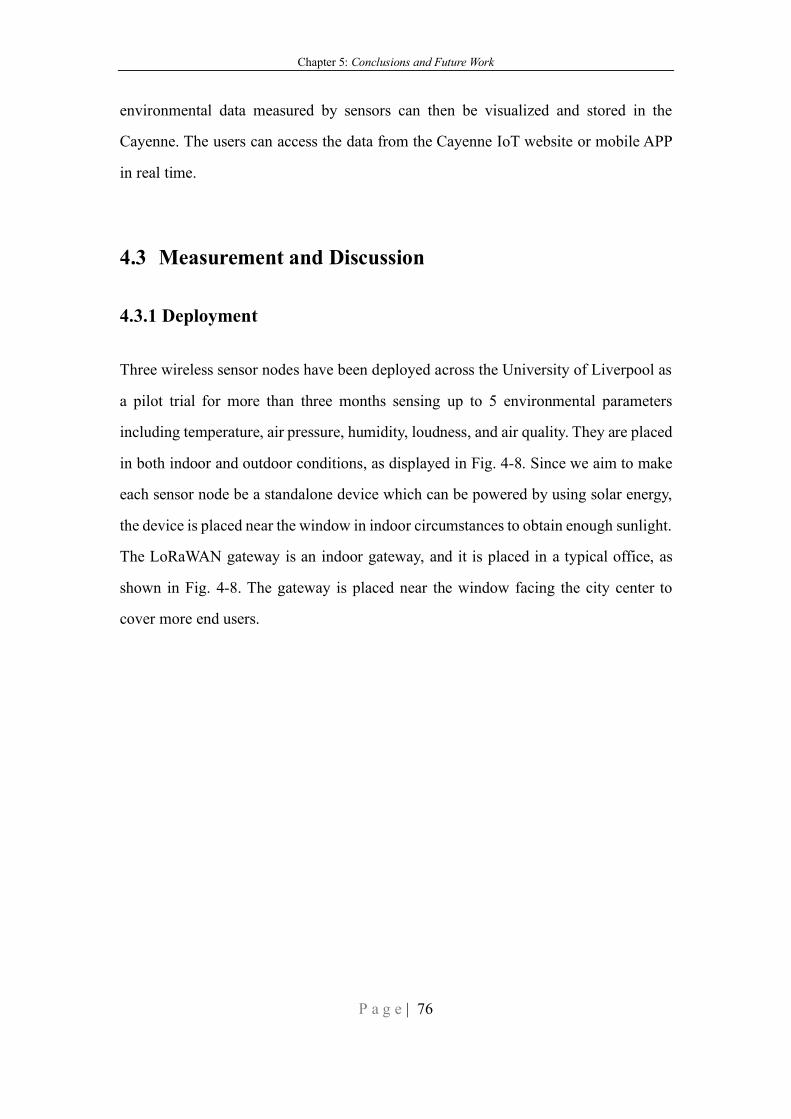
Chapter 5: Conclusions and Future Work
P a g e | 76
environmental data measured by sensors can then be visualized and stored in the
Cayenne. The users can access the data from the Cayenne IoT website or mobile APP
in real time.
4.3 Measurement and Discussion
4.3.1 Deployment
Three wireless sensor nodes have been deployed across the University of Liverpool as
a pilot trial for more than three months sensing up to 5 environmental parameters
including temperature, air pressure, humidity, loudness, and air quality. They are placed
in both indoor and outdoor conditions, as displayed in Fig. 4-8. Since we aim to make
each sensor node be a standalone device which can be powered by using solar energy,
the device is placed near the window in indoor circumstances to obtain enough sunlight.
The LoRaWAN gateway is an indoor gateway, and it is placed in a typical office, as
shown in Fig. 4-8. The gateway is placed near the window facing the city center to
cover more end users.
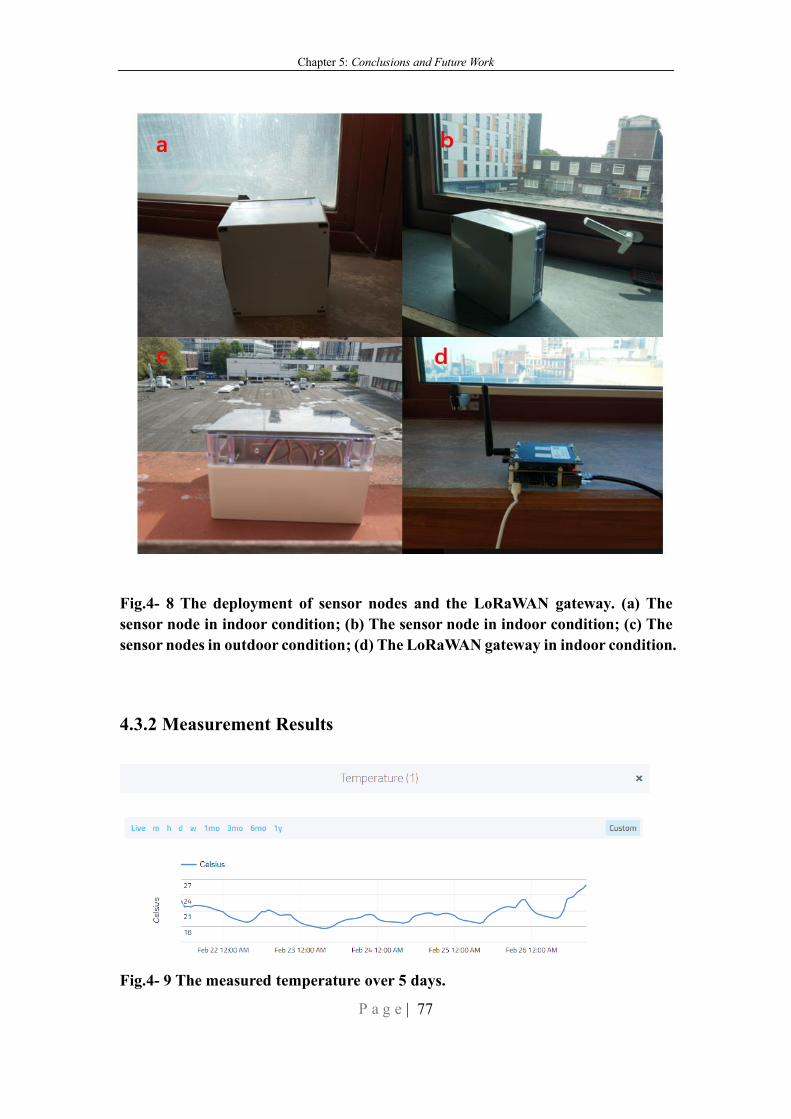
Chapter 5: Conclusions and Future Work
P a g e | 77
Fig.4- 8 The deployment of sensor nodes and the LoRaWAN gateway. (a) The
sensor node in indoor condition; (b) The sensor node in indoor condition; (c) The
sensor nodes in outdoor condition; (d) The LoRaWAN gateway in indoor condition.
4.3.2 Measurement Results
Fig.4- 9 The measured temperature over 5 days.
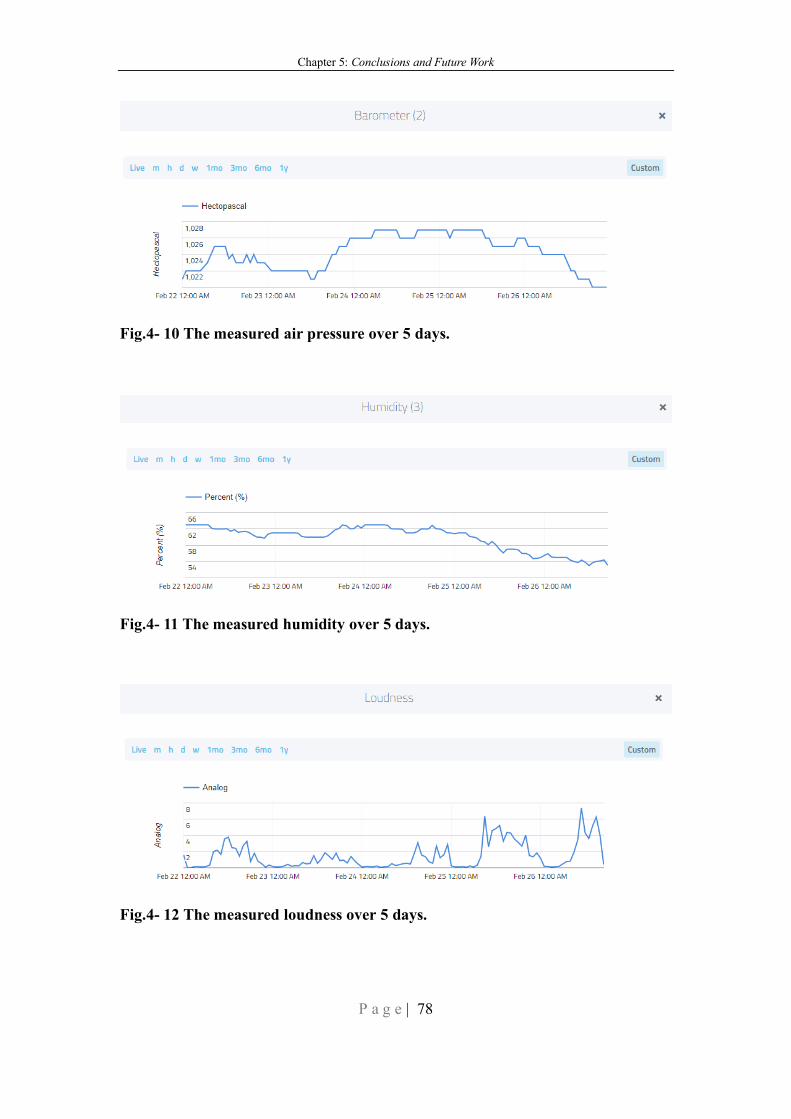
Chapter 5: Conclusions and Future Work
P a g e | 78
Fig.4- 10 The measured air pressure over 5 days.
Fig.4- 11 The measured humidity over 5 days.
Fig.4- 12 The measured loudness over 5 days.
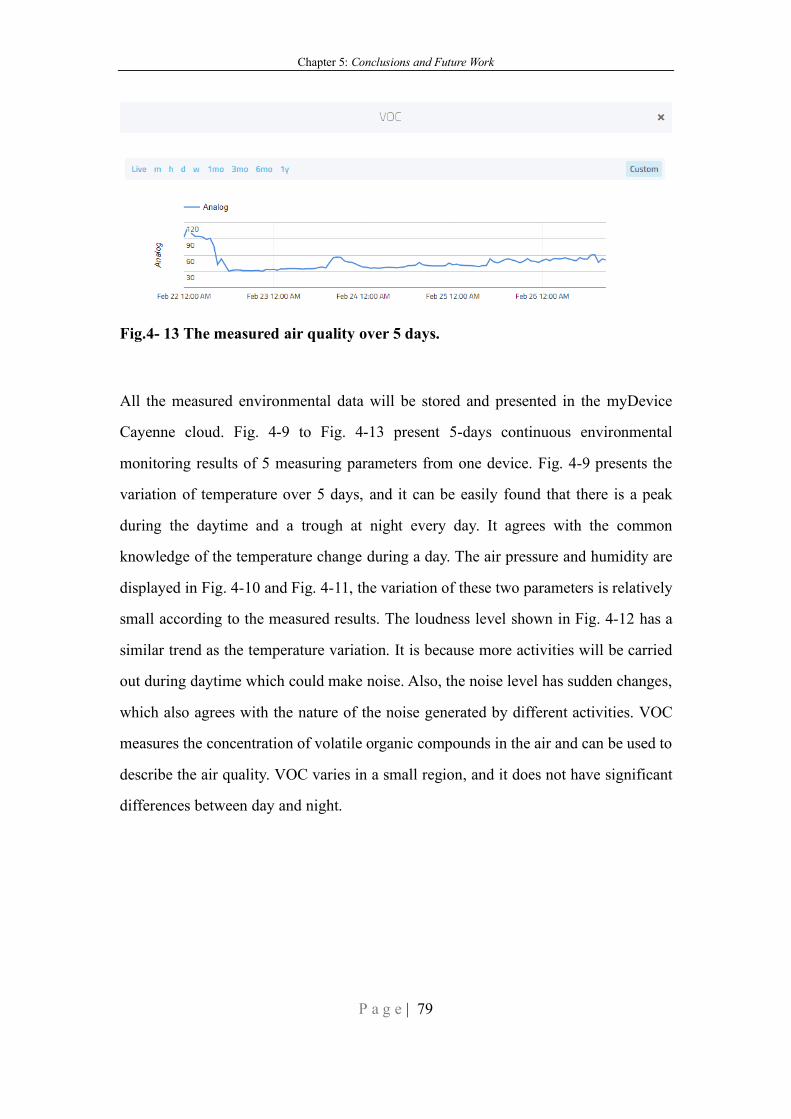
Chapter 5: Conclusions and Future Work
P a g e | 79
Fig.4- 13 The measured air quality over 5 days.
All the measured environmental data will be stored and presented in the myDevice
Cayenne cloud. Fig. 4-9 to Fig. 4-13 present 5-days continuous environmental
monitoring results of 5 measuring parameters from one device. Fig. 4-9 presents the
variation of temperature over 5 days, and it can be easily found that there is a peak
during the daytime and a trough at night every day. It agrees with the common
knowledge of the temperature change during a day. The air pressure and humidity are
displayed in Fig. 4-10 and Fig. 4-11, the variation of these two parameters is relatively
small according to the measured results. The loudness level shown in Fig. 4-12 has a
similar trend as the temperature variation. It is because more activities will be carried
out during daytime which could make noise. Also, the noise level has sudden changes,
which also agrees with the nature of the noise generated by different activities. VOC
measures the concentration of volatile organic compounds in the air and can be used to
describe the air quality. VOC varies in a small region, and it does not have significant
differences between day and night.
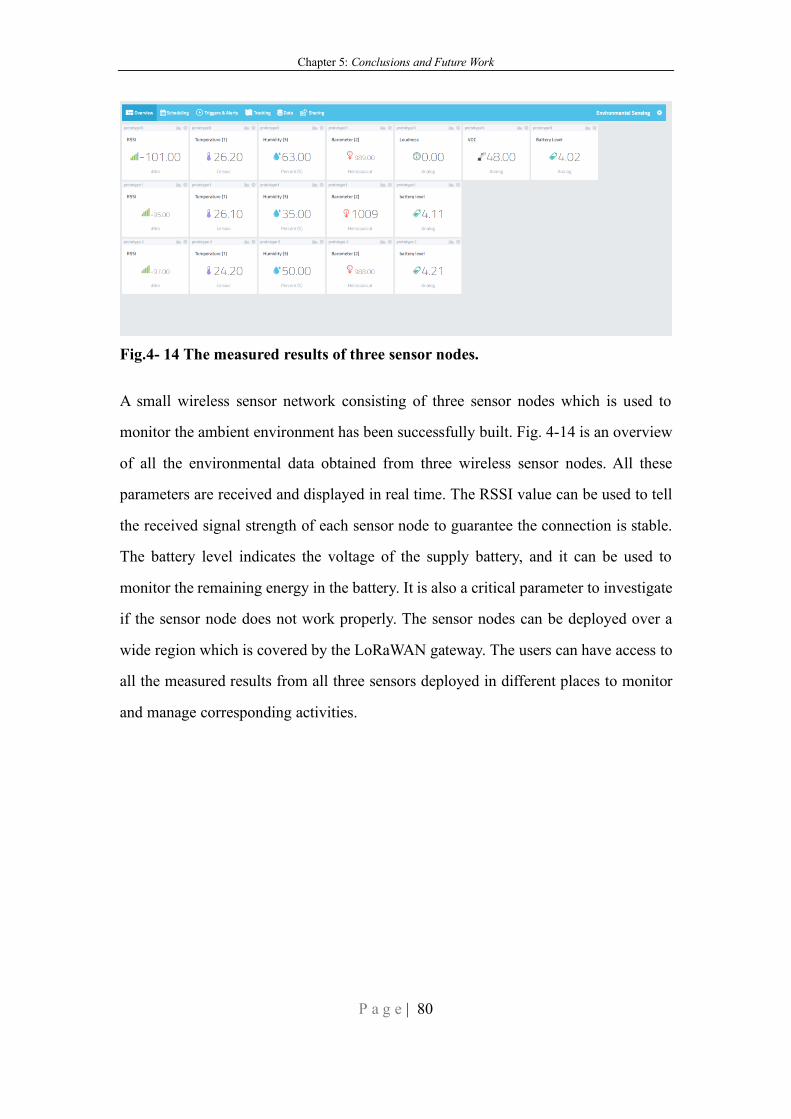
Chapter 5: Conclusions and Future Work
P a g e | 80
Fig.4- 14 The measured results of three sensor nodes.
A small wireless sensor network consisting of three sensor nodes which is used to
monitor the ambient environment has been successfully built. Fig. 4-14 is an overview
of all the environmental data obtained from three wireless sensor nodes. All these
parameters are received and displayed in real time. The RSSI value can be used to tell
the received signal strength of each sensor node to guarantee the connection is stable.
The battery level indicates the voltage of the supply battery, and it can be used to
monitor the remaining energy in the battery. It is also a critical parameter to investigate
if the sensor node does not work properly. The sensor nodes can be deployed over a
wide region which is covered by the LoRaWAN gateway. The users can have access to
all the measured results from all three sensors deployed in different places to monitor
and manage corresponding activities.
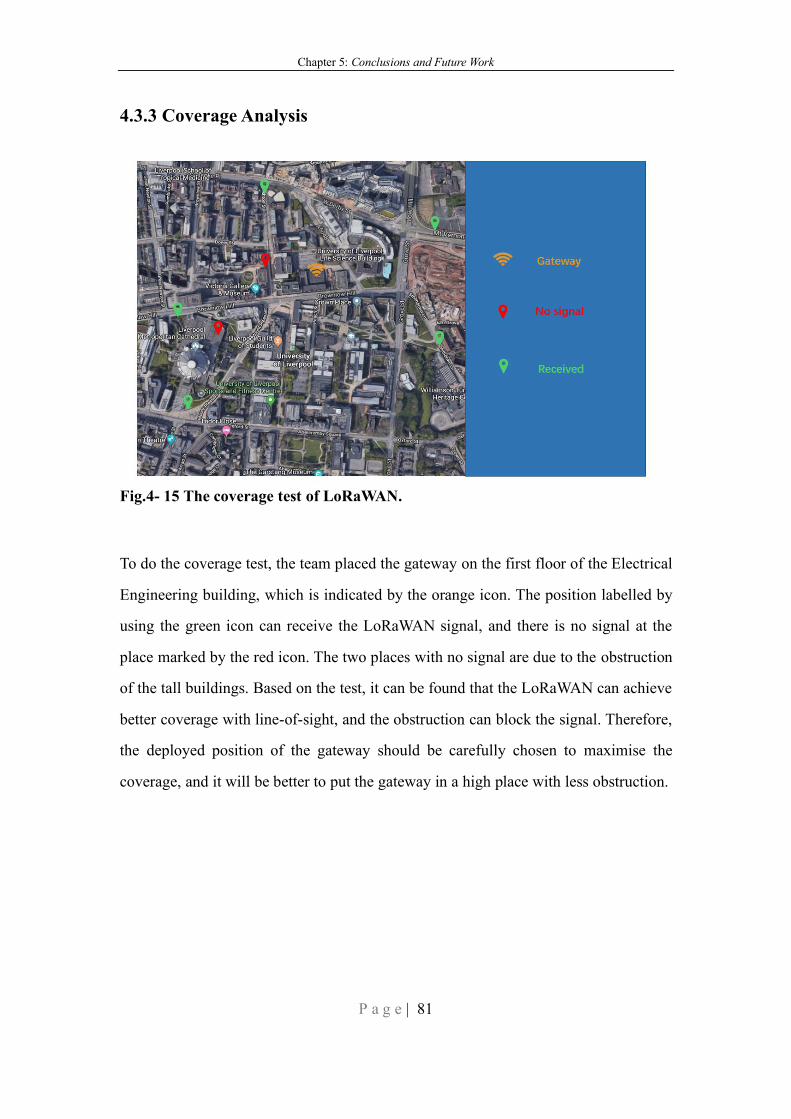
Chapter 5: Conclusions and Future Work
P a g e | 81
4.3.3 Coverage Analysis
Fig.4- 15 The coverage test of LoRaWAN.
To do the coverage test, the team placed the gateway on the first floor of the Electrical
Engineering building, which is indicated by the orange icon. The position labelled by
using the green icon can receive the LoRaWAN signal, and there is no signal at the
place marked by the red icon. The two places with no signal are due to the obstruction
of the tall buildings. Based on the test, it can be found that the LoRaWAN can achieve
better coverage with line-of-sight, and the obstruction can block the signal. Therefore,
the deployed position of the gateway should be carefully chosen to maximise the
coverage, and it will be better to put the gateway in a high place with less obstruction.
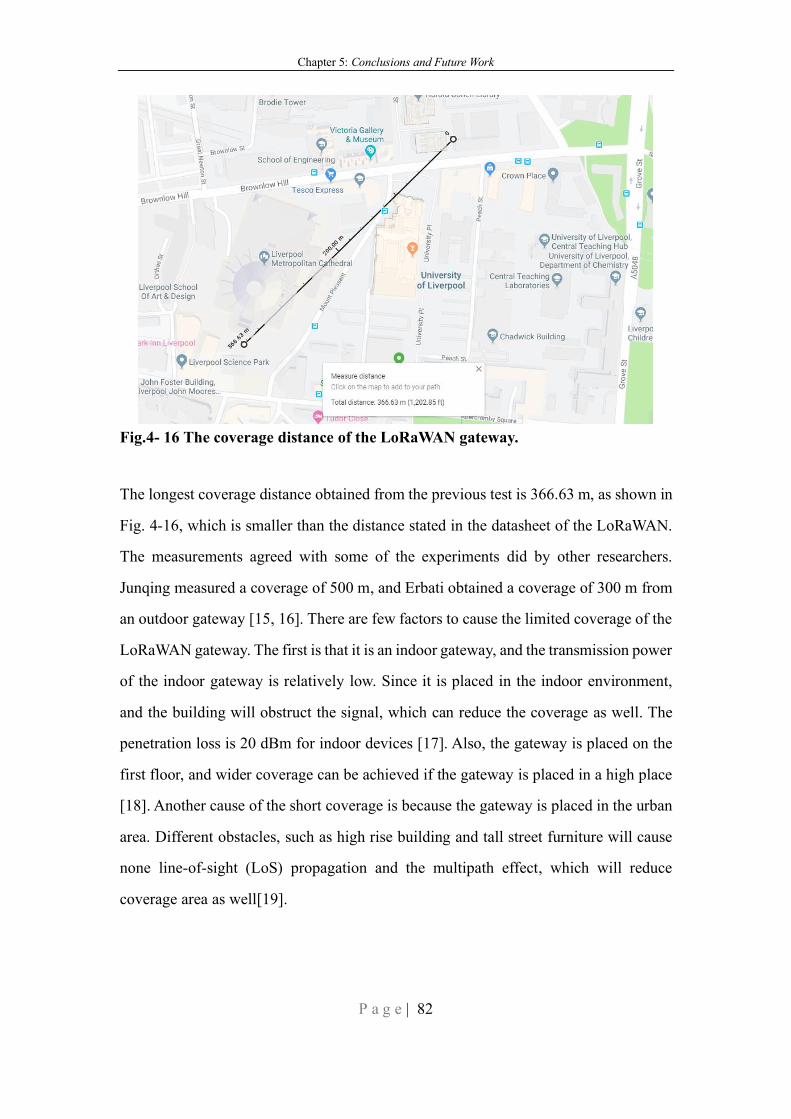
Chapter 5: Conclusions and Future Work
P a g e | 82
Fig.4- 16 The coverage distance of the LoRaWAN gateway.
The longest coverage distance obtained from the previous test is 366.63 m, as shown in
Fig. 4-16, which is smaller than the distance stated in the datasheet of the LoRaWAN.
The measurements agreed with some of the experiments did by other researchers.
Junqing measured a coverage of 500 m, and Erbati obtained a coverage of 300 m from
an outdoor gateway [15, 16]. There are few factors to cause the limited coverage of the
LoRaWAN gateway. The first is that it is an indoor gateway, and the transmission power
of the indoor gateway is relatively low. Since it is placed in the indoor environment,
and the building will obstruct the signal, which can reduce the coverage as well. The
penetration loss is 20 dBm for indoor devices [17]. Also, the gateway is placed on the
first floor, and wider coverage can be achieved if the gateway is placed in a high place
[18]. Another cause of the short coverage is because the gateway is placed in the urban
area. Different obstacles, such as high rise building and tall street furniture will cause
none line-of-sight (LoS) propagation and the multipath effect, which will reduce
coverage area as well[19].
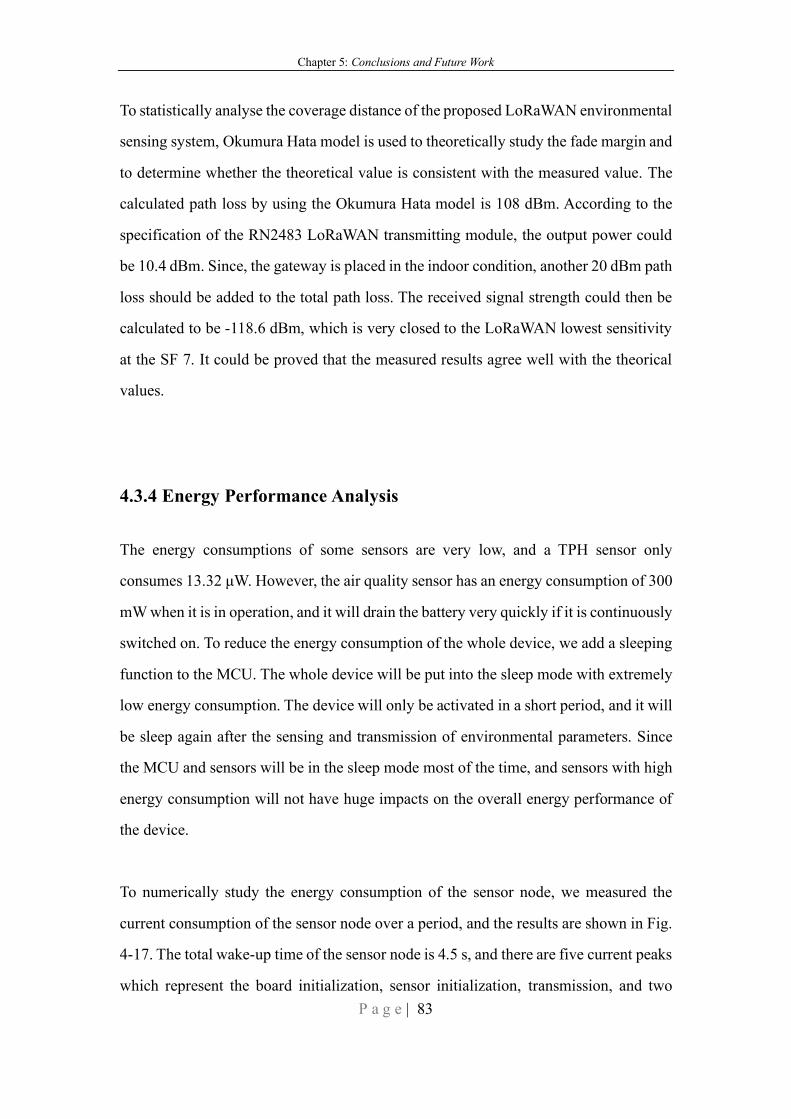
Chapter 5: Conclusions and Future Work
P a g e | 83
To statistically analyse the coverage distance of the proposed LoRaWAN environmental
sensing system, Okumura Hata model is used to theoretically study the fade margin and
to determine whether the theoretical value is consistent with the measured value. The
calculated path loss by using the Okumura Hata model is 108 dBm. According to the
specification of the RN2483 LoRaWAN transmitting module, the output power could
be 10.4 dBm. Since, the gateway is placed in the indoor condition, another 20 dBm path
loss should be added to the total path loss. The received signal strength could then be
calculated to be -118.6 dBm, which is very closed to the LoRaWAN lowest sensitivity
at the SF 7. It could be proved that the measured results agree well with the theorical
values.
4.3.4 Energy Performance Analysis
The energy consumptions of some sensors are very low, and a TPH sensor only
consumes 13.32 μW. However, the air quality sensor has an energy consumption of 300
mW when it is in operation, and it will drain the battery very quickly if it is continuously
switched on. To reduce the energy consumption of the whole device, we add a sleeping
function to the MCU. The whole device will be put into the sleep mode with extremely
low energy consumption. The device will only be activated in a short period, and it will
be sleep again after the sensing and transmission of environmental parameters. Since
the MCU and sensors will be in the sleep mode most of the time, and sensors with high
energy consumption will not have huge impacts on the overall energy performance of
the device.
To numerically study the energy consumption of the sensor node, we measured the
current consumption of the sensor node over a period, and the results are shown in Fig.
4-17. The total wake-up time of the sensor node is 4.5 s, and there are five current peaks
which represent the board initialization, sensor initialization, transmission, and two
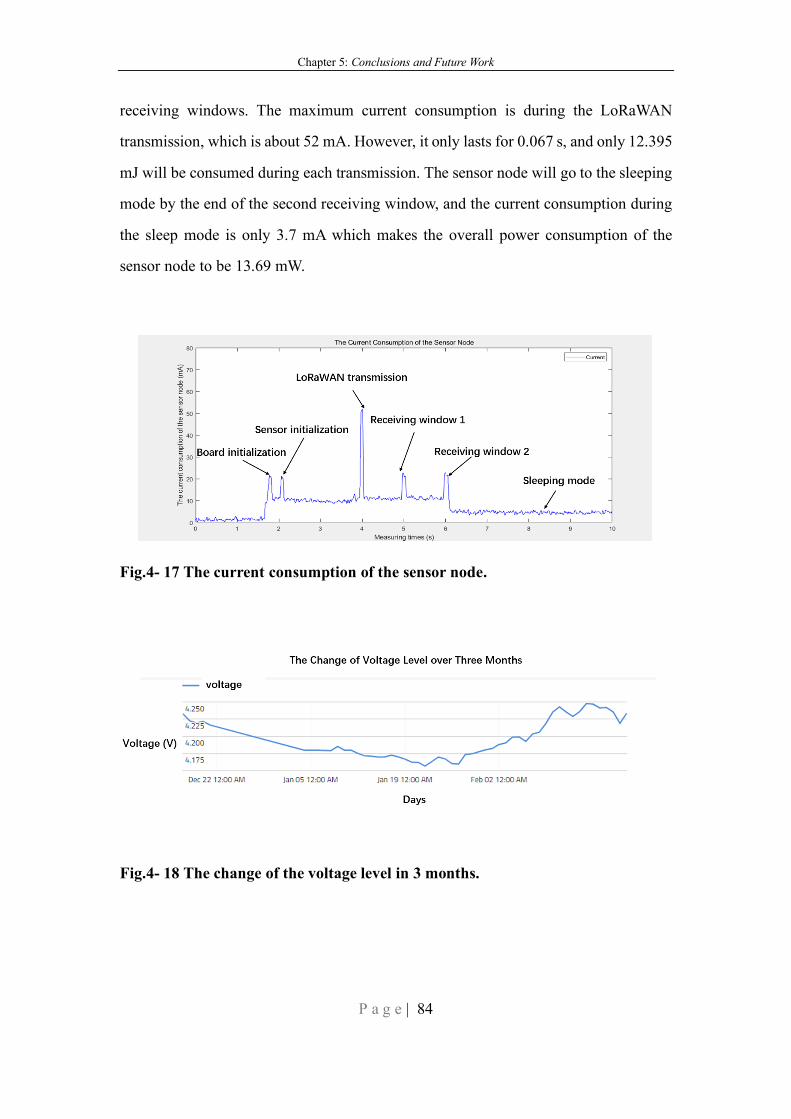
Chapter 5: Conclusions and Future Work
P a g e | 84
receiving windows. The maximum current consumption is during the LoRaWAN
transmission, which is about 52 mA. However, it only lasts for 0.067 s, and only 12.395
mJ will be consumed during each transmission. The sensor node will go to the sleeping
mode by the end of the second receiving window, and the current consumption during
the sleep mode is only 3.7 mA which makes the overall power consumption of the
sensor node to be 13.69 mW.
Fig.4- 17 The current consumption of the sensor node.
Fig.4- 18 The change of the voltage level in 3 months.
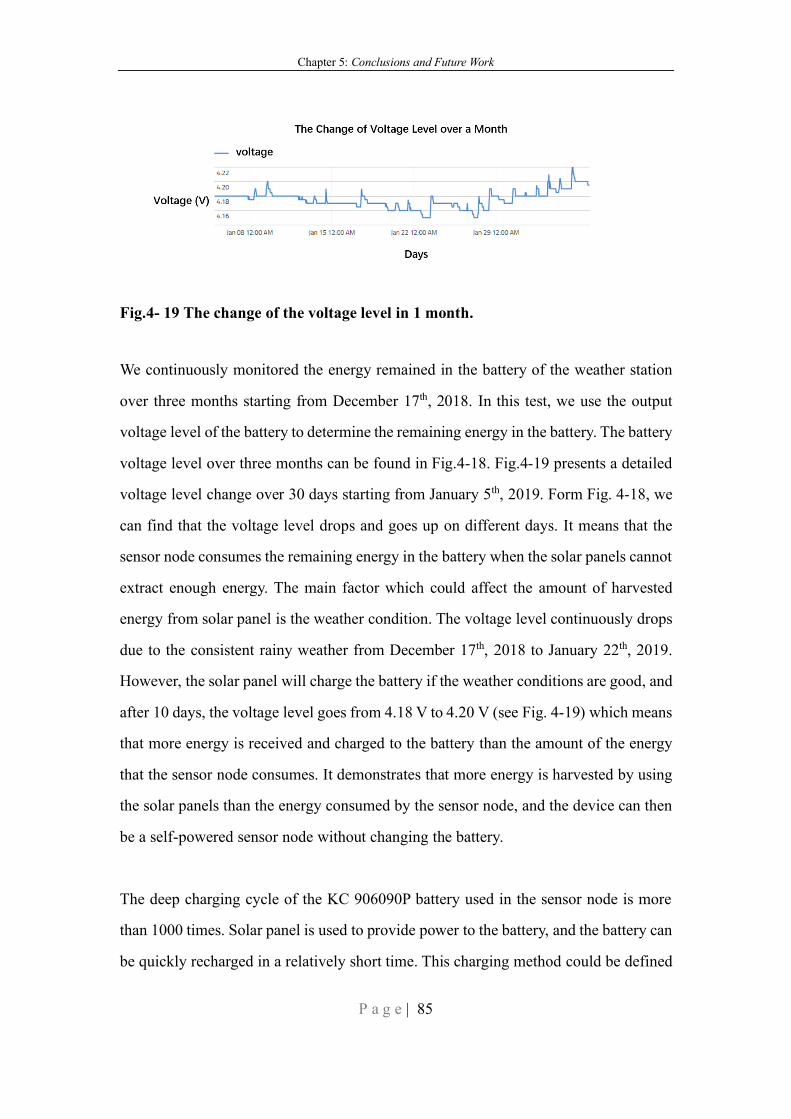
Chapter 5: Conclusions and Future Work
P a g e | 85
Fig.4- 19 The change of the voltage level in 1 month.
We continuously monitored the energy remained in the battery of the weather station
over three months starting from December 17th, 2018. In this test, we use the output
voltage level of the battery to determine the remaining energy in the battery. The battery
voltage level over three months can be found in Fig.4-18. Fig.4-19 presents a detailed
voltage level change over 30 days starting from January 5th, 2019. Form Fig. 4-18, we
can find that the voltage level drops and goes up on different days. It means that the
sensor node consumes the remaining energy in the battery when the solar panels cannot
extract enough energy. The main factor which could affect the amount of harvested
energy from solar panel is the weather condition. The voltage level continuously drops
due to the consistent rainy weather from December 17th, 2018 to January 22th, 2019.
However, the solar panel will charge the battery if the weather conditions are good, and
after 10 days, the voltage level goes from 4.18 V to 4.20 V (see Fig. 4-19) which means
that more energy is received and charged to the battery than the amount of the energy
that the sensor node consumes. It demonstrates that more energy is harvested by using
the solar panels than the energy consumed by the sensor node, and the device can then
be a self-powered sensor node without changing the battery.
The deep charging cycle of the KC 906090P battery used in the sensor node is more
than 1000 times. Solar panel is used to provide power to the battery, and the battery can
be quickly recharged in a relatively short time. This charging method could be defined
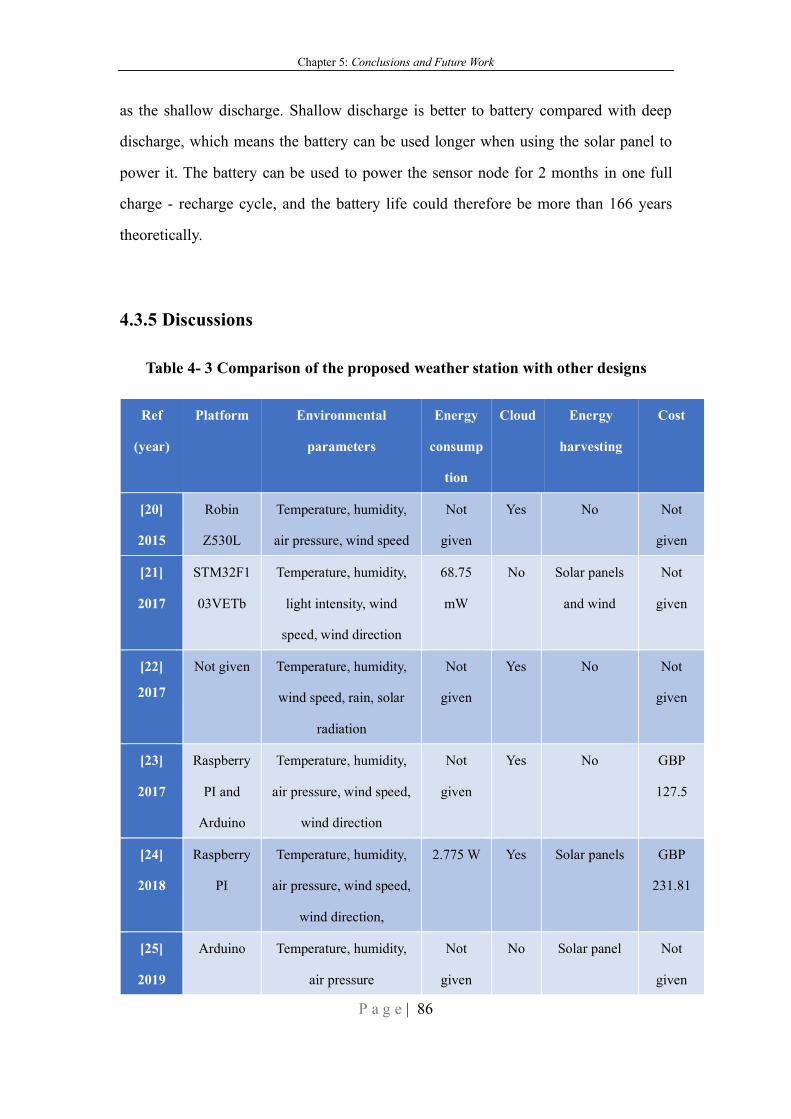
Chapter 5: Conclusions and Future Work
P a g e | 86
as the shallow discharge. Shallow discharge is better to battery compared with deep
discharge, which means the battery can be used longer when using the solar panel to
power it. The battery can be used to power the sensor node for 2 months in one full
charge - recharge cycle, and the battery life could therefore be more than 166 years
theoretically.
4.3.5 Discussions
Table 4- 3 Comparison of the proposed weather station with other designs
Ref
(year)
Platform Environmental
parameters
Energy
consump
tion
Cloud Energy
harvesting
Cost
[20]
2015
Robin
Z530L
Temperature, humidity,
air pressure, wind speed
Not
given
Yes No Not
given
[21]
2017
STM32F1
03VETb
Temperature, humidity,
light intensity, wind
speed, wind direction
68.75
mW
No Solar panels
and wind
Not
given
[22]
2017
Not given Temperature, humidity,
wind speed, rain, solar
radiation
Not
given
Yes No Not
given
[23]
2017
Raspberry
PI and
Arduino
Temperature, humidity,
air pressure, wind speed,
wind direction
Not
given
Yes No GBP
127.5
[24]
2018
Raspberry
PI
Temperature, humidity,
air pressure, wind speed,
wind direction,
2.775 W Yes Solar panels GBP
231.81
[25]
2019
Arduino Temperature, humidity,
air pressure
Not
given
No Solar panel Not
given
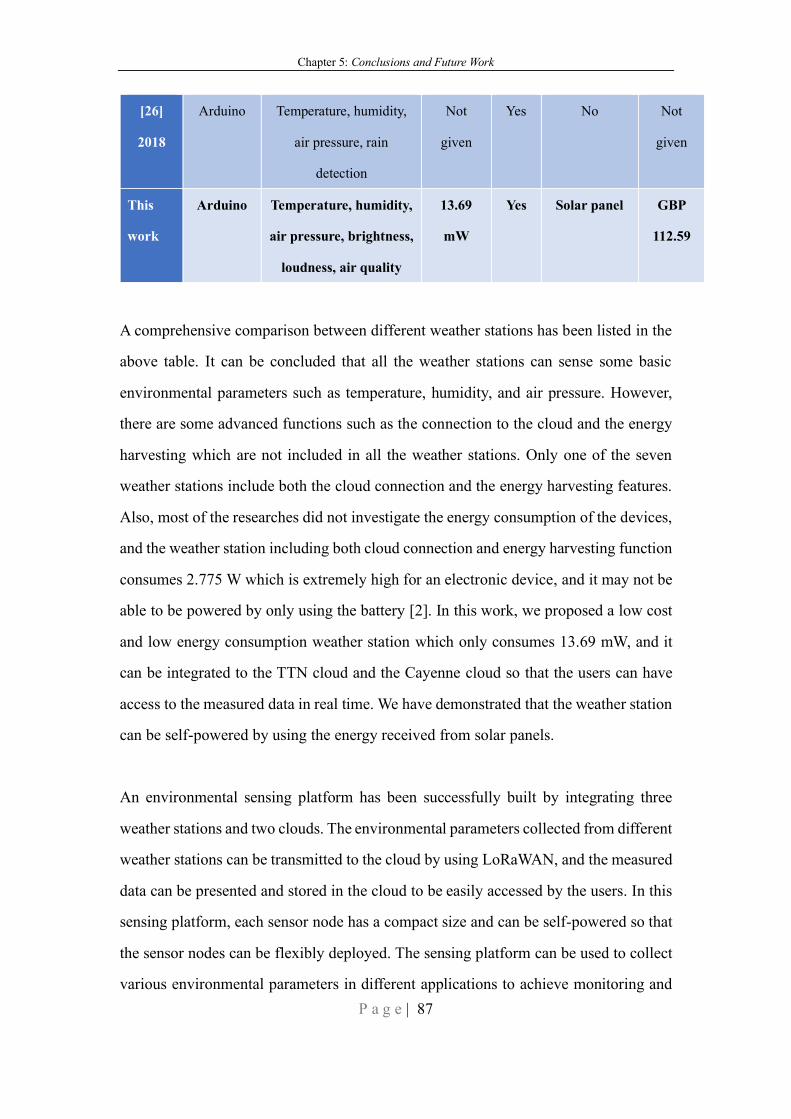
Chapter 5: Conclusions and Future Work
P a g e | 87
[26]
2018
Arduino Temperature, humidity,
air pressure, rain
detection
Not
given
Yes No Not
given
This
work
Arduino Temperature, humidity,
air pressure, brightness,
loudness, air quality
13.69
mW
Yes Solar panel GBP
112.59
A comprehensive comparison between different weather stations has been listed in the
above table. It can be concluded that all the weather stations can sense some basic
environmental parameters such as temperature, humidity, and air pressure. However,
there are some advanced functions such as the connection to the cloud and the energy
harvesting which are not included in all the weather stations. Only one of the seven
weather stations include both the cloud connection and the energy harvesting features.
Also, most of the researches did not investigate the energy consumption of the devices,
and the weather station including both cloud connection and energy harvesting function
consumes 2.775 W which is extremely high for an electronic device, and it may not be
able to be powered by only using the battery [2]. In this work, we proposed a low cost
and low energy consumption weather station which only consumes 13.69 mW, and it
can be integrated to the TTN cloud and the Cayenne cloud so that the users can have
access to the measured data in real time. We have demonstrated that the weather station
can be self-powered by using the energy received from solar panels.
An environmental sensing platform has been successfully built by integrating three
weather stations and two clouds. The environmental parameters collected from different
weather stations can be transmitted to the cloud by using LoRaWAN, and the measured
data can be presented and stored in the cloud to be easily accessed by the users. In this
sensing platform, each sensor node has a compact size and can be self-powered so that
the sensor nodes can be flexibly deployed. The sensing platform can be used to collect
various environmental parameters in different applications to achieve monitoring and
Chapter 5: Conclusions and Future Work
P a g e | 88
management purposes.
4.4 Summary
The environmental sensing platform consists of three wireless weather stations has been
proposed. We have demonstrated the excellent performance of the sensing platform
from three aspects, which are the real-time data presentation and storage in the Cayenne
cloud, the wide coverage, and the integration of self-powered weather stations. Since
we aim to densely deploy weather stations which could cover a wide area, the wireless
connection and the energy consumption of the sensor nodes are key design challenges
need to be overcome. In this design, we use the LoRaWAN communication method to
provide a wide wireless connection for the sensor nodes. The coverage of the
LoRaWAN gateway can be 366.63 m in the urban area. We reduce the energy
consumption of the weather station to 13.69 mW and use a 3 W solar panel to power
the device. Based on the tests, it can be proved that the solar panel can provide enough
energy to make the device to be self-powered.
4.5 Reference:
[1] D. A. Aponte-Roa, L. B. Montalvan, C. Velazquez, A. A. Espinoza, L. F.
Velazquez, and R. Serrano, "Evaluation of a low-cost, solar-powered weather
station for small-scale wind farm site selection," pp. 1-5, 2018.
[2] M. I. Haque, A. H. M. D. Shatil, A. N. Tusar, M. Hossain, and M. H. Rahman,
"Renewable Powered Portable Weather Update Station," pp. 374-377, 2019.
[3] G. Mois, S. Folea, and T. Sanislav, "Analysis of three IoT-based wireless sensors
Chapter 5: Conclusions and Future Work
P a g e | 89
for environmental monitoring," IEEE Transactions on Instrumentation and
Measurement, vol. 66, no. 8, pp. 2056-2064, 2017.
[4] P. Dehghanian, B. Zhang, T. Dokic, and M. Kezunovic, "Predictive risk
analytics for weather-resilient operation of electric power systems," IEEE
Transactions on Sustainable Energy, vol. 10, no. 1, pp. 3-15, 2019.
[5] H. Sangrody, M. Sarailoo, N. Zhou, N. Tran, M. Motalleb, and E. Foruzan,
"Weather forecasting error in solar energy forecasting," IET Renewable Power
Generation, vol. 11, no. 10, pp. 1274-1280, 2017.
[6] H. Li, M. K. Ochani, H. Zhang, and L. Zhang, "Design of micro-automatic
weather station for modern power grid based on STM32," The Journal of
Engineering, vol. 2017, no. 13, pp. 1629-1634, 2017.
[7] J. Liu, Y. Chai, Y. Xiang, X. Zhang, S. Gou, and Y. Liu, "Clean energy
consumption of power systems towards smart agriculture: roadmap, bottlenecks
and technologies," CSEE Journal of Power and Energy Systems, vol. 4, no. 3,
pp. 273-28, 2018.
[8] N. Ahmed, D. De, and I. Hussain, "Internet of Things (IoT) for Smart Precision
Agriculture and Farming in Rural Areas," IEEE Internet of Things Journal, vol.
5, no. 6, pp. 4890-4899, 2018.
[9] N. Gondchawar and R. S. Kawitkar, "IoT based smart agriculture," International
Journal of advanced research in Computer and Communication Engineering,
vol. 5, no. 6, pp. 2278-1021, 2016.
[10] X. Zhang, M. Zhang, F. Meng, Y. Qiao, S. Xu and S. Hour, "A Low-Power
Wide-Area Network Information Monitoring System by Combining NB-IoT
and LoRa," in IEEE Internet of Things Journal, vol. 6, no. 1, pp. 590-598, Feb.
Chapter 5: Conclusions and Future Work
P a g e | 90
2019.
[11] J. Haxhibeqiri, E. De Poorter, I. Moerman, and J. Hoebeke, "A survey of
lorawan for iot: From technology to application," Sensors, vol. 18, no. 11, p.
3995, 2018.
[12] S. Priya and D. J. Inman, Energy harvesting technologies. Springer, 2009.
[13] E. Kanagaraj, L. M. Kamarudin, A. Zakaria, R. Gunasagaran, and A. Y. M.
Shakaff, "Cloud-based remote environmental monitoring system with
distributed WSN weather stations," 2015 IEEE SENSORS, pp. 1-4, 2015.
[14] R. C. Brito, F. Favarim, G. Calin, and E. Todt, "Development of a low cost
weather station using free hardware and software," 2017 Latin American
Robotics Symposium (LARS) and 2017 Brazilian Symposium on Robotics
(SBR), pp. 1-6, 2017.
[15] M. M. Erbati, G. Schiele, and G. Batke, "Analysis of LoRaWAN technology in
an Outdoor and an Indoor Scenario in Duisburg-Germany," 2018 3rd
International Conference on Computer and Communication Systems (ICCCS),
pp. 273-277, 2018.
[16] J. Zhang, A. Marshall, and L. Hanzo, "Channel-Envelope Differencing
Eliminates Secret Key Correlation: LoRa-Based Key Generation in Low Power
Wide Area Networks," IEEE Transactions on Vehicular Technology, vol. 67, no.
12, pp. 12462-12466, 2018.
[17] B. Vejlgaard, M. Lauridsen, H. Nguyen, I. Z. Kovács, P. Mogensen, and M.
Sorensen, "Interference impact on coverage and capacity for low power wide
area IoT networks," 2017 IEEE Wireless Communications and Networking
Conference (WCNC), pp. 1-6, 2017.
Chapter 5: Conclusions and Future Work
P a g e | 91
[18] A. V. T. Bardram, M. D. Larsen, K. M. Malarski, M. N. Petersen, and S. Ruepp,
"LoRaWan capacity simulation and field test in a harbour environment," 2018
Third International Conference on Fog and Mobile Edge Computing (FMEC),
pp. 193-198, 2018.
[19] A. Ikpehai et al., "Low-Power Wide Area Network Technologies for Internet-
of-Things: A Comparative Review," IEEE Internet of Things Journal, 2018.
[20] E. Kanagaraj, L. M. Kamarudin, A. Zakaria, R. Gunasagaran, and A. Y. M.
Shakaff, "Cloud-based remote environmental monitoring system with
distributed WSN weather stations," 2015 IEEE SENSORS, pp. 1-4, 2015.
[21] H. Li, M. K. Ochani, H. Zhang, and L. Zhang, "Design of micro-automatic
weather station for modern power grid based on STM32," The Journal of
Engineering, vol. 2017, no. 13, pp. 1629-1634, 2017.
[22] A. Munandar, H. Fakhrurroja, M. I. Rizqyawan, R. P. Pratama, J. W. Wibowo,
and I. A. F. Anto, "Design of real-time weather monitoring system based on
mobile application using automatic weather station," 2017 2nd International
Conference on Automation, Cognitive Science, Optics, Micro Electro-
Mechanical System, and Information Technology (ICACOMIT), pp. 44-47, 2017.
[23] R. C. Brito, F. Favarim, G. Calin, and E. Todt, "Development of a low cost
weather station using free hardware and software," 2017 Latin American
Robotics Symposium (LARS) and 2017 Brazilian Symposium on Robotics (SBR),
pp. 1-6, 2017.
[24] D. A. Aponte-Roa, L. B. Montalvan, C. Velazquez, A. A. Espinoza, L. F.
Velazquez, and R. Serrano, "Evaluation of a low-cost, solar-powered weather
station for small-scale wind farm site selection," 2018 IEEE International
Instrumentation and Measurement Technology Conference (I2MTC), pp. 1-5.
Chapter 5: Conclusions and Future Work
P a g e | 92
IEEE, 2018.
[25] M. I. Haque, A. H. M. D. Shatil, A. N. Tusar, M. Hossain, and M. H. Rahman,
"Renewable Powered Portable Weather Update Station," 2019 International
Conference on Robotics, Electrical and Signal Processing Techniques
(ICREST), pp. 374-377, 2019.
[26] M. Kusriyanto and A. A. Putra, "Weather Station Design Using IoT Platform
Based On Arduino Mega," 2018 International Symposium on Electronics and
Smart Devices (ISESD), pp. 1-4, 2018
Chapter 5: Conclusions and Future Work
P a g e | 93
Chapter 5 Conclusions and Future Work
5.1 Summary
In this thesis, an accelerometer is used to detect wind speeds and wind directions. The
power consumption of the anemometer is only 3.42 mW. We have also applied some
latest IoT technologies to build an energy-saving anemometer and a modern
environmental sensing platform. LoRaWAN, as one of the state-of-art Low Power Wide
Area Network (LPWAN) communication methods has been used to transmit messages
between the sensor node and the gateway to achieve low energy consumption in the
sensor node and wide coverage. To increase the flexibility of the deployment of the
sensor nodes, we make the device to be self-powered by adopting energy saving
techniques and using a solar panel to charge the device. The energy consumption of the
proposed sensor node is only 13.69 mW, which is significantly smaller than other
weather stations. The environmental sensing platform integrates with two clouds which
are the The Things Network (TTN) and the Cayenne to achieve real-time data
presentation and data storage.
In chapter 2, we have surveyed two types of communication protocols, namely short-
range communication protocols and LPWAN protocols. It could be concluded that
LPWAN protocols have the merits of wide coverage and low energy consumption,
which is more suitable to transmit data in an energy-constrained wireless sensor
network. Three LPWAN communication methods which are LoRaWAN, SigFox, and
NB-IoT are discussed, and the LoRaWAN has the advantages of flexible private
deployment and low energy consumption feature which is more suitable to form a
private network. A brief introduction of the wireless sensor network is also discussed
in this chapter to provide basic knowledge about the architecture of the wireless sensor
network.
Chapter 5: Conclusions and Future Work
P a g e | 94
A compact anemometer with ultra-low energy consumption has been proposed in
chapter 3. The anemometer is composed of a sphere 3D printed sensor case and a 6-
axis accelerometer. The 3D dynamic model of the anemometer has been built, and the
equations of the dynamics of the wind sensor have been derived as well. The diameter
of the sphere anemometer is 50 mm, and the anemometer only consumes 3.42 mW
when it is in operation. The wind sensor can be easily deployed in different places and
can be powered by using batteries only, which could increase the flexibility of
deployment. A Gaussian-weighted moving average filtering algorithm is used to
remove the measuring noise, and we have demonstrated that the anemometer can
measure both the wind speeds and wind directions accurately.
In chapter 4, we have presented an environmental sensing platform, including both the
hardware and the software. The environmental sensing platform is consisted of three
wireless weather stations, and each of them is connected to the gateway to receive and
transmit data. In this design, we use the LoRaWAN communication method to provide
a wide wireless connection for the sensor nodes. The coverage of the LoRaWAN
gateway can be 366.63 m in the urban area. The information obtained from the weather
stations can be transmitted to the TTN and the Cayenne cloud where received data can
be presented and stored in real time. We have investigated the energy consumption of
the weather station, which is only 13.69 mW. It can be proved that the weather station
can be self-powered by harvesting solar energy based on the measurements over a
month.
5.2 Key Contributions and Limitations
This work has provided a thorough study on the environmental monitoring applications
from an individual wind sensor to the whole environmental monitoring system. The key
contributions and limitations are discussed as follows.
Chapter 5: Conclusions and Future Work
P a g e | 95
⚫ A Low Energy Consumption Anemometer
The most important contribution in this chapter is the development of an ultra-low
energy consumption anemometer. There are various ways to measure wind speeds
and directions. Some latest measuring methods like ultrasonic sensors and hot-film
sensors typically dissipate a large amount of power. A novel method to measure the
wind speeds and directions has been developed which are using a 6-axis
accelerometer to measure the changes of the accelerations induced by the wind
force and then to calculate the corresponding wind speed. The energy consumption
of the proposed anemometer is only 3.42 mW, which is significantly smaller than
other anemometers. However, the measurement accuracy of the anemometer
should be further improved. To increase the measurement accuracy of the
accelerometer-based anemometer, a Gaussian-weighted moving average filtering
algorithm is applied to remove the measuring noise.
⚫ The development of an environmental sensing platform
In this chapter, we have developed an environmental sensing platform including,
wireless sensor nodes, communication network, and the data visualization and
storage cloud. Most reported weather stations do not include cloud, and in this work,
we utilize two cloud servers to transmit, visualize, and store the measured data.
Also, many researchers do not investigate the energy performance of the weather
stations, which makes the energy consumptions of the designed weather stations to
be very high. We have implemented some energy saving techniques such as putting
the device into the sleep mode and using low energy consumption communication
module to reduce the overall energy consumption of the proposed device to be only
13.69 mW. We also integrate a 3 W solar panel to the weather station to make the
whole device to be self-powered. The performance of the real-field deployment of
the environment sensing platform including coverage and maximum data flow
needs to be further studied. More functions could be added to the sensing system
Chapter 5: Conclusions and Future Work
P a g e | 96
based on the needs of different applications. Also, the package design of the sensor
node needs to be improved to protect the sensing device in extreme weather
conditions.
5.3 Future Work
Based on the conclusions above and considering the limitations of the work existed,
future research could be carried out in the following areas.
⚫ The package design of sensors is a challenging topic. The size of the sensor node
should be designed to be compact to reduce the manufacturing cost and increase
deployment flexibility. Different modules, such as sensing modules,
communication modules, power management modules should be placed together
in a limited space. There are various deployment requirements on different modules.
For example, some environmental sensors like gas sensor and rain detection sensor
should be placed in contact with the outside environment. However, the batteries
should be placed in an enclosed environment to prevent damage from rain and short
circuits. The sensor box of the anemometer can be designed like a “golf ball” to
reduce the turbulence induced by the wind and improve the measuring accuracy
and sensitivity.
⚫ The proposed weather station can now measure 6 environmental parameters which
are the brightness, loudness, temperature, air pressure, humidity, and air quality. In
the future, more sensors with more functions should be added to the existed device
to meet more requirements from other applications. For example, to monitor the
structural health level, an accelerometer is used to measure the vibrations of
buildings and bridges. Also, the proposed anemometer can only transmit data to
Chapter 5: Conclusions and Future Work
P a g e | 97
the smartphone by using Bluetooth. The next step of the work can be integrating
the anemometer with the proposed weather station to measure the wind speeds and
wind direction。
⚫ Currently, we only collected basic environmental parameters for three months
around the campus. More data can be collected in different places such as city
centers, factories, and rural areas for a long-time span. The coverage of the
environmental system should be further tested to meet the requirement of IoT
applications. The collected data can provide sources to analyze the measured
environmental changes over the years across different places and study how human
activities can affect the environments. Currently, we only measure and present the
environmental parameters, and further studies can be carried out to analyze and
predict the condition of the ambient environment based on the collected results.
For example, some researchers found that the concentration of the CO2 level in a
room is related to the number of people inside the room, and then they use
measured CO2 level to predict the number of people in the room.