the it spending report - bus.umich.edu · the it spending report ... may be used to forecast the...
TRANSCRIPT

The
IT SpendingReportTM
November 2001
www.emarketer.com
This report is the property of eMarketer, Inc. and is protected under both the United States Copyright Act and by contract.Section 106 of the Copyright Act gives copyright owners the exclusive rights of reproduction, adaptation, publication,performance and display of protected works.
Accordingly, any use, copying, distribution, modification, or republishing of this report beyond that expressly permitted byyour license agreement is prohibited. Violations of the Copyright Act can be both civilly and criminally prosecuted andeMarketer will take all steps necessary to protect its rights under both the Copyright Act and your contract.
If you are outside of the United States: copyrighted United States works, including the attached report, are protected underinternational treaties. Additionally, by contract, you have agreed to be bound by United States law.

©2001 eMarketer, Inc. Reproduction of information sourced as eMarketer is prohibited without prior, written permission.Note: all data in this report (other than that sourced as eMarketer) was obtained from published, publicly available information.
3
The IT Spending Report
Table of Contents 3
Methodology 7
The eMarketer Methodology: Making Sense of the Numbers 8
The eMarketer Difference 8
What Benefits Do eMarketer Reports Provide? 9
I Worldwide IT Spending 11
A. Introduction 12
B. Worldwide IT Spending Forecasts 12
C. Worldwide IT Spending Growth Rates 18
D. Worldwide IT Spending by Category 21
Telecommunications Spending 25
Hardware Spending 27
Software Spending 32
IT Services Spending 36
E-Business/Internet Technology Spending 42
II North America 47
A. North American IT Spending Forecasts 48
B. Impact of the September 11th Terrorist Attacks 52
C. IT Budgeting in North America 55
D. Information Technology’s Place in the US Economy 56

©2001 eMarketer, Inc. Reproduction of information sourced as eMarketer is prohibited without prior, written permission.Note: all data in this report (other than that sourced as eMarketer) was obtained from published, publicly available information.
4
The IT Spending Report
III Europe 61
A. European IT Spending Forecasts 62
B. IT Spending Growth Rates in Europe 67
C. IT Budgeting in Europe 70
IV Asia-Pacific 73
A. Asia-Pacific IT Spending Forecasts 74
B. IT Spending Growth Rates in the Asia-Pacific Region 78
C. IT Budgeting in the Asia-Pacific Region 82
V Latin America 85
A. Latin American IT Spending Forecasts 86
B. IT Spending Growth Rates in Latin America 88
VI IT Spending by Industry 89
VII IT Spending by Business Size 101
VIII IT Budgeting and Spending Surveys 111
A. IT Budgeting and the ROI Focus 112
B. E-Business and IT Spending 120
C. Anticipating the Recovery in IT Spending 125
Index of Charts 135

©2001 eMarketer, Inc. Reproduction of information sourced as eMarketer is prohibited without prior, written permission.Note: all data in this report (other than that sourced as eMarketer) was obtained from published, publicly available information.
5
The IT Spending Report
November 2001
Welcome to eMarketer
Dear Reader,
The IT Spending ReportTM is the first eMarketer report to focus upon the major trends and spendingprojections for information technology goods and services throughout the world.
Along with its companion reports, the Telecommunications Spending ReportTM and the PC MarketReportTM, the IT Spending ReportTM provides readers with top-level data and comparative estimatesabout leading technology markets. Coverage of regional, national and industry-specific IT spending isincluded, as well as IT spending by business size.
And unique to eMarketer’s analysis, these reports also include extensive survey sections, whichprovide insight that covers the current thinking among technology users, as well as data on the latesttrends in technology spending.
As an entire package, the IT Spending SeriesTM is a useful tool for those decision-makers who have aninterest in monitoring the current and future performance of technology spending in the world today.
If you have any questions or comments concerning eMarketer or any of the material in this report,please call, fax or e-mail us.
Sincerely,Steve ButlerSenior Analyst
Steve ButlerSenior Analyst, [email protected]
eMarketer, inc.821 BroadwayNew York, NY 10003T: 212.677.6300F: 212.777.1172
Reuse of information in this document, without prior authorization,is prohibited. If you would like to license this report for yourorganization, please contact David Iankelevich [email protected], or 212.763.6037.
Written by Steve Butler
Also contributing to this report:Yael Marmon, researcherAndrew Raff, researcherTracy Tang, researcherMarius Meland, editorAllison Smith, senior editorDana Hill, production artistTerry King, production artistJames Ku, production


Methodology 7
I Worldwide IT Spending
II North America
III Europe
IV Asia-Pacific
V Latin America
VI IT Spending by Industry
VII IT Spending by Business Size
VIII IT Budgeting and Spending Surveys
Index of Charts
©2001 eMarketer, Inc. Reproduction of information sourced as eMarketer is prohibited without prior, written permission.Note: all data in this report (other than that sourced as eMarketer) was obtained from published, publicly available information.
7
The IT Spending Report

The eMarketer Methodology: MakingSense of the NumberseMarketer’s approach to market research is founded on a philosophy ofaggregating data from as many different sources as possible. Why? Becausethere is no such thing as a perfect research study and no single researchsource can have all the answers. Moreover, a careful evaluation andweighting of multiple sources will inevitably yield a more accurate picturethan any single source could possibly provide.
The eMarketer DifferenceeMarketer does not conduct primary research. Neither a research firm nor aconsultancy, eMarketer has no testing technique to defend, no research biasand no client contracts to protect.
eMarketer prepares each market report using a four-step process ofaggregating, filtering, organizing and analyzing data from leading researchsources worldwide.
Accessing information from the internet as well as a library ofelectronically-filed research reports, surveys and studies, the eMarketerresearch team first compiles publicly available e-business data fromhundreds of research sources. This information is filtered and organizedand then presented in the form of easy-to-read tables, charts and graphs.
To develop each report, eMarketer’s analysts evaluate the aggregateddata and conduct further research to understand the numbers behind thenumbers. Next, they provide concise analysis around the information tohelp make sense of the conflicting numbers and trends.
“I think eMarketer reports are extremely useful andset the highest standards for high quality,objective compilation of often wildly disparatesources of data. I rely on eMarketer’s researchreports as a solid and trusted source.”— Professor Donna L. Hoffman, Co-Director, eLab, Vanderbilt University
www.eMarketer.com©2001 eMarketer, Inc.
Analyze
Aggregate
Filter
Organize
©2001 eMarketer, Inc. Reproduction of information sourced as eMarketer is prohibited without prior, written permission.Note: all data in this report (other than that sourced as eMarketer) was obtained from published, publicly available information.
8
The IT Spending Report
Methodology
Worldwide IT Spending
North America
Europe
Asia-Pacific
Latin America
IT Spending by Industry
IT Spendingby Business Size
IT Budgeting andSpending Surveys
Index of Charts

What Benefits Do eMarketer Reports Provide?There are many benefits associated with eMarketer’s aggregation approachto research. The evaluation and presentation of multiple sources means that:
■ The information is more objective than that provided by any singleresearch source. eMarketer has no bias towards any particular internettechnology, e-business trend or market segment.
■ The information is more comprehensive — each set of findings reflectsthe collected wisdom of the leading research firms, consultancies andindustry analysts.
■ The information is all in one place, making it easy to locate, evaluateand compare. eMarketer reports assemble all the different data pointsand accompanying expert opinions into one easy-to-follow referencedocument.
■ The information is neatly organized and clearly presented to savepeople time and help them make better, faster and more informedbusiness decisions.
eMarketer reports also serve as a convenient guidebook or roadmap toother research sources for those wanting more drill-down or “how-to”information on a given topic of interest.
“When I need the latest trends and stats on e-business, I turn to eMarketer. eMarketer cutsthrough the hype and turns an overabundance ofdata into concise information that is sound anddependable.”— Mark Selleck, Business Unit Executive, DISU e-business Solutions, IBM
©2001 eMarketer, Inc. Reproduction of information sourced as eMarketer is prohibited without prior, written permission.Note: all data in this report (other than that sourced as eMarketer) was obtained from published, publicly available information.
9
The IT Spending Report
Methodology
Worldwide IT Spending
North America
Europe
Asia-Pacific
Latin America
IT Spending by Industry
IT Spendingby Business Size
IT Budgeting andSpending Surveys
Index of Charts


IMethodology
I Worldwide IT Spending 11
A. Introduction 12
B. Worldwide IT Spending Forecasts 12
C.Worldwide IT Spending Growth Rates 18
D. Worldwide IT Spending by Category 21
II North America
III Europe
IV Asia-Pacific
V Latin America
VI IT Spending by Industry
VII IT Spending by Business Size
VIII IT Budgeting and Spending Surveys
Index of Charts
©2001 eMarketer, Inc. Reproduction of information sourced as eMarketer is prohibited without prior, written permission.Note: all data in this report (other than that sourced as eMarketer) was obtained from published, publicly available information.
11
The IT Spending Report

©2001 eMarketer, Inc. Reproduction of information sourced as eMarketer is prohibited without prior, written permission.Note: all data in this report (other than that sourced as eMarketer) was obtained from published, publicly available information.
12
The IT Spending Report
Methodology
Worldwide IT Spending
North America
Europe
Asia-Pacific
Latin America
IT Spending by Industry
IT Spendingby Business Size
IT Budgeting andSpending Surveys
Index of Charts
A. IntroductionThe year 2001 has seen much uncertainty since companies began to pullback on their IT spending. Leading technology vendors claim that poorvisibility prevents them from forecasting future sales, while economistsand Wall Street analysts are trying – with poor results - to call a bottom ofthe economic slowdown in the United States.
Following the September 11th terrorist attacks on America, thiseconomic uncertainty has been exacerbated, with increased talk of apossible worldwide recession. The best that most analysts have been able todo is offer multiple scenarios for economic recovery, which by extensionmay be used to forecast the recovery in technology spending.
In this report, we include several surveys that attempt to gauge the ITspending climate over the short term and going into 2002. But it isimportant to underscore the point that IT spending is best consideredwithin the context of the long term.
The next three to ten years will see an extraordinary build-out ofinformation and telecommunications infrastructure that will truly move usinto the new, information-based economy. The deployment of e-businesssystems has only just begun, and the conclusion of the excessive dot comera will provide us with a clearer, more realistic view of what is to come.
Comparative estimates for IT spending, along with a variety of surveydata, will help readers put the technology landscape in perspective, andgain a better sense of the major trends that are shaping the New Economy.By using this information, decision-makers will be able to develop theirown strategies for both the short- and long-term.
B.Worldwide IT Spending ForecastsAccording to the World Information Technology and Services Alliance(WITSA), worldwide information and communication technology (ICT)spending will reach $3 trillion by 2003. As of 2000, the organizationestimated that ICT spending accounted for 6.6% percent of global GDP, and9% of US GDP.
Worldwide Information and CommunicationTechnology Spending, 1999 & 2003 (in billions)
1999 $2,100.00
2003 $3,000.00
Source: World Information Technology and Services Alliance (WITSA), International Data Corporation (IDC), 2000
033436 ©2001 eMarketer, Inc. www.eMarketer.com

©2001 eMarketer, Inc. Reproduction of information sourced as eMarketer is prohibited without prior, written permission.Note: all data in this report (other than that sourced as eMarketer) was obtained from published, publicly available information.
13
The IT Spending Report
Methodology
Worldwide IT Spending
North America
Europe
Asia-Pacific
Latin America
IT Spending by Industry
IT Spendingby Business Size
IT Budgeting andSpending Surveys
Index of Charts
New Zealand has the highest rate of ICT spending as a percent of nationalGDP, at 10.5%. It is followed by the United Kingdom, Sweden, the UnitedStates, Australia, Colombia, Canada, the Czech Republic, Hong Kong, andSingapore.
According to WITSA, the United States, Japan and Germany are theleading markets for ICT spending on an absolute basis. Other countries inthe top ten include the United Kingdom, France, Italy, Canada, China,Brazil and Australia. Since 1997, China had moved to eighth on the list, upfrom the tenth spot between Brazil and Australia.
Collectively, the top ten countries’ ICT spending accounts for 80% of theworld total, while the bottom ten countries’ spending accounts for less than1% of the global ICT market.
As for the top ten countries for ICT spending on a per capita basis,Switzerland and Japan lead the United States, which is followed byDenmark, Singapore, Sweden, Norway, the Netherlands, the UnitedKingdom, and Australia.
Top Three Countries for Information andCommunication Technology Spending, 1999 (inbillions)
US $762
Japan $362
Germany $139
Source: World Information Technology and Services Alliance (WITSA), International Data Corporation (IDC), 2000
033435 ©2001 eMarketer, Inc. www.eMarketer.com
Top Three Countries for Information andCommunication Technology Spending, 1999 (spendingper capita)Switzerland $3,335
Japan $2,854
United States $2,792
Source: World Information Technology and Services Alliance (WITSA), International Data Corporation (IDC), 2000
033448 ©2001 eMarketer, Inc. www.eMarketer.com

©2001 eMarketer, Inc. Reproduction of information sourced as eMarketer is prohibited without prior, written permission.Note: all data in this report (other than that sourced as eMarketer) was obtained from published, publicly available information.
14
The IT Spending Report
Methodology
Worldwide IT Spending
North America
Europe
Asia-Pacific
Latin America
IT Spending by Industry
IT Spendingby Business Size
IT Budgeting andSpending Surveys
Index of Charts
As might be expected, comparative estimates for the size of worldwideinformation technology spending vary by research firm or forecaster. Inmost cases, definitional differences account for disagreements between ITspending estimates, while differences over forecast growth rates oftenresult in discrepancies as well.
Since Gartner Dataquest includes the telecommunications market in itsIT spending forecast, the firm has put forward one of the largest estimatesfor the size of worldwide IT spending, predicting that the global market willgrow to almost $4.31 trillion by 2005. This latest revision to Gartner’sworldwide spending forecast was released in July of 2001.
Compared with Gartner’s $2.74 trillion estimate for the size of IT spendingin 2001, both the Aberdeen Group’s and Computer Economics’ estimatesare much lower, at $1.210 trillion and $1.185 trillion respectively.
Worldwide IT Spending Forecast, 1999-2005 (inbillions)
1999 $2,144.7
2000 $2,443.8
2001 $2,745.6
2002 $3,088.3
2003 $3,441.9
2004 $3,842.5
2005 $4,308.9
Source: Gartner Dataquest, July 2001
033760 ©2001 eMarketer, Inc. www.eMarketer.com
Worldwide IT Spending Forecast, 2001-2005 (inbillions)
2001 $1,210.80
2002 $1,324.15
2003 $1,452.17
2004 $1,591.40
2005 $1,746.83
Source: Aberdeen Group, 2001
033404 ©2001 eMarketer, Inc. www.eMarketer.com

©2001 eMarketer, Inc. Reproduction of information sourced as eMarketer is prohibited without prior, written permission.Note: all data in this report (other than that sourced as eMarketer) was obtained from published, publicly available information.
15
The IT Spending Report
Methodology
Worldwide IT Spending
North America
Europe
Asia-Pacific
Latin America
IT Spending by Industry
IT Spendingby Business Size
IT Budgeting andSpending Surveys
Index of Charts
In its comprehensive study of IT spending on a country-by-country basis,the Aberdeen Group estimates that the North American market accounts for40.6% global spending, followed by Western Europe at 24.5% and the Asia-Pacific region at 20.8%.
Breaking out worldwide IT spending by region, Computer Economicsestimates that the United States will account for 44.4% of global ITspending in 2001, while Europe is second with 25.9% of the global market,followed by the Asia-Pacific region and Latin America.
Worldwide IT Spending, by Region, 2001 (in billions)
North America
$492.29
Western Europe
$297.11
Asia/Pacific
$251.96
Latin America
$67.80
Middle East and North Africa
$23.25
Sub-Saharan Africa
$7.55
Rest of World
$70.83
Total
$1,210.80
Source: Aberdeen Group, May 2001
030027 ©2001 eMarketer, Inc. www.eMarketer.com
For Information
Technology Spending
forecasts broken down by
country, coverage of 73
countries is available from
the Aberdeen Study in the
eStat DatabaseEstimated Worldwide IT Spending, by Region, 2001 (inbillions and as a % of total spending)
US $525.66 (44.4%)
Europe $306.40 (25.9%)
Asia Pacific $252.50 (21.3%)
Latin America $44.45 (3.7%)
Rest of world $56.24 (4.7%)
Total $1,185.24 (100.0%)
Source: Computer Economics, 2001
032622 ©2001 eMarketer, Inc. www.eMarketer.com

©2001 eMarketer, Inc. Reproduction of information sourced as eMarketer is prohibited without prior, written permission.Note: all data in this report (other than that sourced as eMarketer) was obtained from published, publicly available information.
16
The IT Spending Report
Methodology
Worldwide IT Spending
North America
Europe
Asia-Pacific
Latin America
IT Spending by Industry
IT Spendingby Business Size
IT Budgeting andSpending Surveys
Index of Charts
Finally, a fourth comparative estimate by IDC forecasts that worldwide ITspending will reach $1.27 trillion by 2003, growing at a compound annualgrowth rate of 10.1% between 2000 and 2003. The fastest growing region isexpected to be the developing countries of the Asia-Pacific region,followed by Eastern Europe and the Middle East/Africa. IDC includesJapan, Australia, New Zealand, Hong Kong and Singapore among themature economies within the Asia-Pacific region, while Indonesia,Malaysia, South Korea, Thailand, Taiwan and India are listed as developingeconomies.
Worldwide IT Spending, by Region, 2000 & 2003 (inbillions)
North America
$443.68
$580.89
Western Europe
$283.30
$386.22
Asia Pacific (Mature)
$128.88
$154.91
Asia Pacific (Developing)
$37.55
$63.23
Latin America
$30.00
$42.19
Eastern Europe/Middle East & Africa
$26.51
$40.21
Total
$949.90
$1,267.64
2000 2003
Source: International Data Corporation (IDC), 2000
032962 ©2001 eMarketer, Inc. www.eMarketer.com

©2001 eMarketer, Inc. Reproduction of information sourced as eMarketer is prohibited without prior, written permission.Note: all data in this report (other than that sourced as eMarketer) was obtained from published, publicly available information.
17
The IT Spending Report
Methodology
Worldwide IT Spending
North America
Europe
Asia-Pacific
Latin America
IT Spending by Industry
IT Spendingby Business Size
IT Budgeting andSpending Surveys
Index of Charts
As per IDC’s calculations, the United States and Canada will account for45.8% of worldwide IT spending in 2003. Western Europe follows at 30.5%,while the advanced economies of the Asia Pacific region will account for12.2% of the global market for IT goods and services. The developingregions of the world will naturally be gaining market share at the expenseof the more mature IT markets over the next several years.
According to the Information Technology Association of America, theUnited States alone accounts for almost 35% of worldwide information andcommunications technology (ICT) spending.
Worldwide IT Spending, by Region, 2000 & 2003 (as a% of world total)
North America
46.7%
45.8%
Western Europe
29.8%
30.5%
Asia Pacific (Mature)
13.6%
12.2%
Asia Pacific (Developing)
4.0%
5.0%
Latin America
3.2%
3.3%
Eastern Europe/Middle East & Africa
2.8%
3.2%
2000 2003
Source: International Data Corporation (IDC), 2000
032963 ©2001 eMarketer, Inc. www.eMarketer.com

©2001 eMarketer, Inc. Reproduction of information sourced as eMarketer is prohibited without prior, written permission.Note: all data in this report (other than that sourced as eMarketer) was obtained from published, publicly available information.
18
The IT Spending Report
Methodology
Worldwide IT Spending
North America
Europe
Asia-Pacific
Latin America
IT Spending by Industry
IT Spendingby Business Size
IT Budgeting andSpending Surveys
Index of Charts
C.Worldwide IT Spending Growth RatesThe World Information Technology and Services Alliance (WITSA)estimates that US ICT spending grew at a compound annual growth rate of7.8% from 1992 to 1999, compared to a worldwide figure of 7.5% and aCAGR of 5.2% among G-8 countries for that same period. The sharpestgrowth in ICT spending was found in the Asia-Pacific region, whichexperienced a CAGR of 13.3%. It was closely followed by Latin America at13%, while Western Europe lagged farthest behind with a CAGR of 6.2%.
WITSA has gone on to list what it believes are the key drivers of growth inworldwide ICT spending. These continue to be the build-out of the internetand related telecommunications infrastructure, the adoption of e-businesstechnologies such as e-commerce or supply chain management softwaresystems, and the emergence of new ICT markets in countries such as China,India and Brazil.
Historical data reveal that the growth rate for IT spending correlates verystrongly with growth rates in GDP. During the last US recession in 1991, forexample, IT spending growth declined from 8.9% the previous year to a lowof 4.2%, while the US GDP contracted by 0.5%, down from a growth rate of1.8% for the previous year. By the following year, however, the USeconomy rebounded to a growth rate of 3.1% while IT spending recoveredto 9.0%.
Worldwide Information and CommunicationTechnology Spending Growth, 1992-1999
US 7.8%
Worldwide 7.5%
G-8 countries 5.2%
Source: World Information Technology and Services Alliance (WITSA), International Data Corporation (IDC), 2000
033437 ©2001 eMarketer, Inc. www.eMarketer.com

©2001 eMarketer, Inc. Reproduction of information sourced as eMarketer is prohibited without prior, written permission.Note: all data in this report (other than that sourced as eMarketer) was obtained from published, publicly available information.
19
The IT Spending Report
Methodology
Worldwide IT Spending
North America
Europe
Asia-Pacific
Latin America
IT Spending by Industry
IT Spendingby Business Size
IT Budgeting andSpending Surveys
Index of Charts
A similar pattern occurred among countries in the Asia-Pacific regionduring the 1998 currency crisis there, and most analysts expect to see thisrepeated with global IT spending during the current economic slowdown inthe United States.
But just as it is difficult to pre-determine the exact timing of a bottomand recovery within the overall economy, so too has it been difficult toforecast the timing of a bottom and recovery in technology spending.Nonetheless, as more information has become available, most leadingresearch firms have continued to adjust their IT spending forecastsaccording to their best read on the economy, as well as the business climatein general.
For example, after conducting a global survey of 589 companies duringthe second quarter of 2001, Gartner found that on average, respondentsplanned to increase their IT spending at a rate of 21.5% in 2001. Theresearch firm was careful to note, however, that it expects IT capitalspending will decrease during 2001. It is only when operating expenses andoutsourced services are included as a part of IT budgets, that the result willbe overall growth in IT spending.
As the year has progressed, most forecasts have become much lessoptimistic. Following its own read of economic trends, IDC noted in itsmid-2001 report that worldwide IT spending could be reduced by as muchas $150 billion through 2003. The research firm went on to indicate that asignificant $50 billion portion of that reduced spending would beaccounted for by a slowdown in IT spending in Europe.
8.9%
9.0%
11.9%
16.1% 16.5%
13.0%
10.5%
9.4%
11.1%
Historical US GDP and IT Spending Growth Rates,1989-2000
1989
3.5%
6.7%
1990
1.8%
1991
-0.5%
4.2%
1992
3.1%
1993
2.7%
1994
4.0%
1995
2.7%
1996
3.6%
1997
4.4%
1998
4.4%
1999
4.2%
2000
5.0%
15
0
GDP IT spending
Source: International Data Corporation (IDC), September 2001
032701 ©2001 eMarketer, Inc. www.eMarketer.com
9.0%

©2001 eMarketer, Inc. Reproduction of information sourced as eMarketer is prohibited without prior, written permission.Note: all data in this report (other than that sourced as eMarketer) was obtained from published, publicly available information.
20
The IT Spending Report
Methodology
Worldwide IT Spending
North America
Europe
Asia-Pacific
Latin America
IT Spending by Industry
IT Spendingby Business Size
IT Budgeting andSpending Surveys
Index of Charts
And as might be expected, an increasingly pessimistic outlook began totake shape by the end of the third quarter, as the possibility of a USrecession became more likely. IDC issued a forecast revision on October11th, projecting that worldwide IT spending would see just 2.4% growth in2001, and reach 6.1% growth in 2002.
Similarly, a September 2001 forecast revision by Merrill Lynch projectedthat worldwide IT spending will grow at a rate of just 2.6% in 2001, and4.6% in 2002. At about the same time, another downward revision wasissued by Credit Suisse First Boston as well, forecasting IT spending torange between 0% and 5% growth in 2002.
Revised Worldwide IT Spending Growth Rates,2000-2003
2000
10.0%
2001
2.4%
2002
6.1%
2003
10.5%
6
10
Note: revised 11 October 2001Source: International Data Corporation (IDC), October 11, 2001
033400 ©2001 eMarketer, Inc. www.eMarketer.com
Worldwide IT Spending Growth, 2001 & 2002
2001 2.6%
2002 4.6%
Source: Merrill Lynch, 2001
033438 ©2001 eMarketer, Inc. www.eMarketer.com

©2001 eMarketer, Inc. Reproduction of information sourced as eMarketer is prohibited without prior, written permission.Note: all data in this report (other than that sourced as eMarketer) was obtained from published, publicly available information.
21
The IT Spending Report
Methodology
Worldwide IT Spending
North America
Europe
Asia-Pacific
Latin America
IT Spending by Industry
IT Spendingby Business Size
IT Budgeting andSpending Surveys
Index of Charts
And finally, after examining the results of its 33-country IT spendingsurvey in October, the Meta Group has determined that non-US businesseshave increased their IT spending by 6% in 2001. The research firm has goneon to predict that spending growth will remain flat in 2002, while ITspending in the United States will contract for the first time, by 2%.
D.Worldwide IT Spending by CategoryIn an IT spending forecast published in 2000, research firm Gartner hasestimated that hardware spending as a portion of total IT spending was19.8% that year, but is expected to drop to 17.4% by 2003. By comparison,communications equipment spending continues to hold the greatest shareof the overall IT market at 49.2% in 2001, but will fall to a 47.5% shareover the next two years.
IT services spending accounts for 23.5% of total spending in 2001,according to Gartner’s forecast, while software takes an 8.5% share. Theselatter two categories are expected to take an increasingly greater portion ofthe worldwide IT market, accounting for 25.5% and 9.6% of total ITspending by 2003.
Worldwide IT Spending, by Category, 1999-2003 (inbillions)
1999 2000 2001 2002 2003
Hardware $415.5 $463.4 $501.2 $537.2 $572.5
Software $159.3 $187.6 $225.4 $264.1 $315.8
Communications $1,081.3 $1,196.4 $1,313.6 $1,431.5 $1,560.6
Services $475.0 $541.3 $625.4 $726.2 $839.0
Total $2,131.1 $2,338.7 $2,665.6 $2,959.0 $3,287.9
Source: Gartner Group, October 2000
033564 ©2001 eMarketer, Inc. www.eMarketer.com

©2001 eMarketer, Inc. Reproduction of information sourced as eMarketer is prohibited without prior, written permission.Note: all data in this report (other than that sourced as eMarketer) was obtained from published, publicly available information.
22
The IT Spending Report
Methodology
Worldwide IT Spending
North America
Europe
Asia-Pacific
Latin America
IT Spending by Industry
IT Spendingby Business Size
IT Budgeting andSpending Surveys
Index of Charts
In another comparative estimate that breaks down worldwide IT spendingfor 2001, Computer Economics has found that hardware represents thelargest category at 43.2% of IT spending, followed by personnel and thensoftware at 30.0% and 11.6% of total expenditures on IT.
Taking an even more comprehensive look at technology spending thatincludes the revenues of semiconductor manufacturers and electronicsdistribution, investment bank UBS Warburg estimates that global ITspending will reach $1.7 trillion in 2001. Communications equipmentmakes up the greatest share at 26.6% of total spending, followed byenterprise hardware and consumer electronics at 15.5% and 12.4%respectively.
Estimated Worldwide IT Spending, by Category, 2001(in billions and as a % of total spending)
Hardware
$512.01 (43.2%)
Staff
$356.08 (30.0%)
Software
$137.39 (11.6%)
Outside services
$88.53 (7.5%)
Facilities overhead
$50.61 (4.3%)
Consumable supplies
$40.61 (3.4%)
Total
$1,185.24 (100.0%)
Source: Computer Economics, 2001
032619 ©2001 eMarketer, Inc. www.eMarketer.com

©2001 eMarketer, Inc. Reproduction of information sourced as eMarketer is prohibited without prior, written permission.Note: all data in this report (other than that sourced as eMarketer) was obtained from published, publicly available information.
23
The IT Spending Report
Methodology
Worldwide IT Spending
North America
Europe
Asia-Pacific
Latin America
IT Spending by Industry
IT Spendingby Business Size
IT Budgeting andSpending Surveys
Index of Charts
UBS Warburg’s projections for IT spending growth by category show thatsemiconductor manufacturers have been hardest hit by the downturn.Overall IT spending is projected to contract by 5% for this year, comparedto an estimated 16% rate of growth in 2000. Software and IT servicesspending are expected to show the most positive growth rates.
Estimated Worldwide IT Revenues, by Category, 2001(in billions)Communications equipment $451.89
Enterprise hardware $263.51
Consumer electronics $210.78
PCs & peripherals $182.16
Semiconductors $168.19
Software $110.48
Components $91.19
IT services $90.07
Electronic manufacturers’ services $57.59
Semi equipment $45.52
Electronics distribution $29.10
Total $1,700.47
Source: UBS Warburg, 2001
032971 ©2001 eMarketer, Inc. www.eMarketer.com
Estimated Worldwide IT Revenue Growth, byCategory, 2001IT services 14%
Software 14%
Electronics distribution 13%
Electronics manufacturers’ services 5%
Enterprise hardware -3%
PCs and peripherals -3%
Communications equipment -8%
Components -9%
Consumer electronics -10%
Semi equipment -12%
Semiconductors -15%
Source: UBS Warburg, 2001
032972 ©2001 eMarketer, Inc. www.eMarketer.com

©2001 eMarketer, Inc. Reproduction of information sourced as eMarketer is prohibited without prior, written permission.Note: all data in this report (other than that sourced as eMarketer) was obtained from published, publicly available information.
24
The IT Spending Report
Methodology
Worldwide IT Spending
North America
Europe
Asia-Pacific
Latin America
IT Spending by Industry
IT Spendingby Business Size
IT Budgeting andSpending Surveys
Index of Charts
The investment bank is projecting a recovery by next year however, withan overall growth rate for IT revenues of 6% in 2002. Software and ITservices are once again set to lead the way.
Estimated Worldwide IT Revenue Growth, byCategory, 2002Software 15%
IT services 12%
Semiconductors 10%
Electronic manufacturers’ services 10%
Consumer electronics 8%
PCs and peripherals 6%
Components 6%
Electronic distribution 5%
Enterprise hardware 5%
Communications equipment 2%
Semi equipment -4%
Source: UBS Warburg, 2001
032973 ©2001 eMarketer, Inc. www.eMarketer.com
©2001 eMarketer, Inc. Reproduction of information sourced as eMarketer is prohibited without prior, written permission.Note: all data in this report (other than that sourced as eMarketer) was obtained from published, publicly available information.
25
The IT Spending Report
Methodology
Worldwide IT Spending
North America
Europe
Asia-Pacific
Latin America
IT Spending by Industry
IT Spendingby Business Size
IT Budgeting andSpending Surveys
Index of Charts
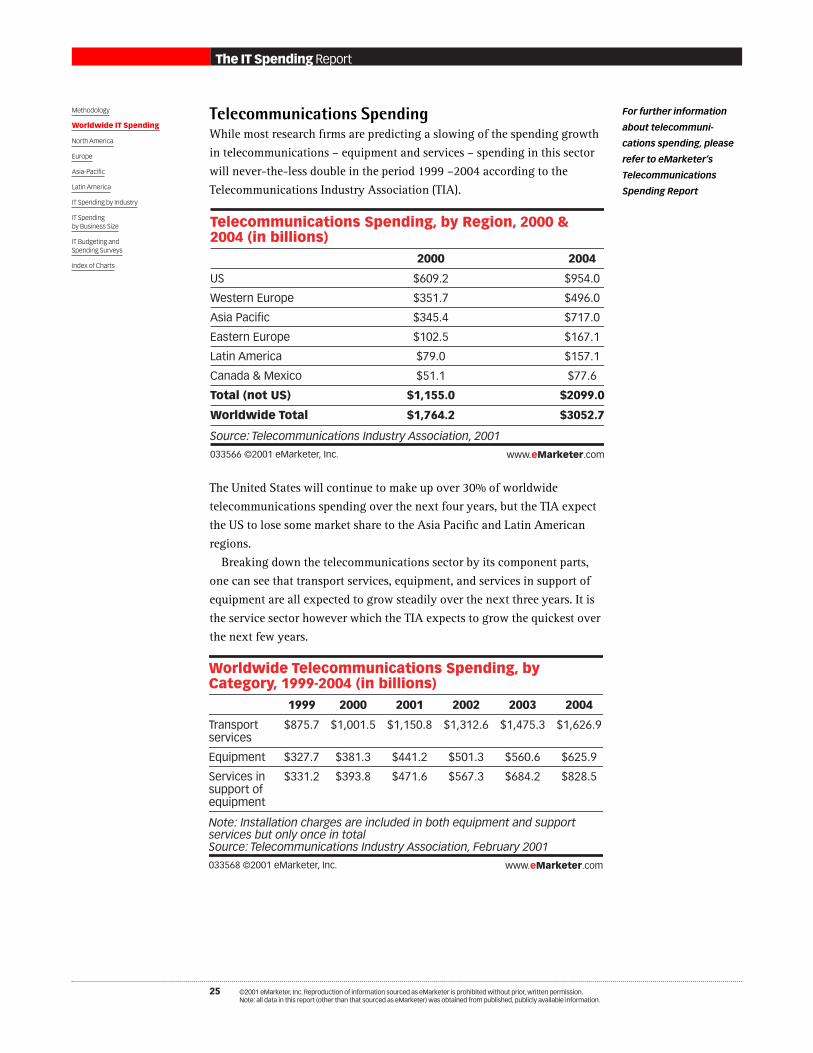
Telecommunications SpendingWhile most research firms are predicting a slowing of the spending growthin telecommunications – equipment and services – spending in this sectorwill never-the-less double in the period 1999 –2004 according to theTelecommunications Industry Association (TIA).
The United States will continue to make up over 30% of worldwidetelecommunications spending over the next four years, but the TIA expectthe US to lose some market share to the Asia Pacific and Latin Americanregions.
Breaking down the telecommunications sector by its component parts,one can see that transport services, equipment, and services in support ofequipment are all expected to grow steadily over the next three years. It isthe service sector however which the TIA expects to grow the quickest overthe next few years.
Telecommunications Spending, by Region, 2000 &2004 (in billions)
2000 2004
US $609.2 $954.0
Western Europe $351.7 $496.0
Asia Pacific $345.4 $717.0
Eastern Europe $102.5 $167.1
Latin America $79.0 $157.1
Canada & Mexico $51.1 $77.6
Total (not US) $1,155.0 $2099.0
Worldwide Total $1,764.2 $3052.7
Source: Telecommunications Industry Association, 2001
033566 ©2001 eMarketer, Inc. www.eMarketer.com
Worldwide Telecommunications Spending, byCategory, 1999-2004 (in billions)
1999 2000 2001 2002 2003 2004
Transportservices
$875.7 $1,001.5 $1,150.8 $1,312.6 $1,475.3 $1,626.9
Equipment $327.7 $381.3 $441.2 $501.3 $560.6 $625.9
Services insupport ofequipment
$331.2 $393.8 $471.6 $567.3 $684.2 $828.5
Note: Installation charges are included in both equipment and supportservices but only once in totalSource: Telecommunications Industry Association, February 2001
033568 ©2001 eMarketer, Inc. www.eMarketer.com
For further information
about telecommuni-
cations spending, please
refer to eMarketer’s
Telecommunications
Spending Report

©2001 eMarketer, Inc. Reproduction of information sourced as eMarketer is prohibited without prior, written permission.Note: all data in this report (other than that sourced as eMarketer) was obtained from published, publicly available information.
26
The IT Spending Report
Methodology
Worldwide IT Spending
North America
Europe
Asia-Pacific
Latin America
IT Spending by Industry
IT Spendingby Business Size
IT Budgeting andSpending Surveys
Index of Charts
Putting the US market aside for the moment reveals that within theinternational sector, wireless services are expected to be the fastest growingtelecommunications spending category above all others, rising to over$600 billion in 2004 from $153 billion in 1999. This of course wouldcoincide with the deployment of next-generation wireless networks, whichare being rolled out globally over the next three to five years. Other areasof significant spending include the enterprise equipment sector andtelecommunications support services.
Among those leaders in the telecommunications equipment space, Ciscoremains by far the largest in terms of market capitalization. Share prices forall of these companies have been hit hard over the past several months,following the headier days of the late 1990’s and 2000. But despite theirrecent troubles with short-term visibility, these firms will continue to play acritical role during the long-term build-out of telecommunicationsinfrastructure over the next five to ten years.
Top 10 Communications Equipment Companies, byMarket Capitalization, September 7, 2001 (in billions)
Cisco Systems
$105.91
Qualcomm Inc.
$41.29
Motorola Inc.
$39.35
NEC Corp.
$20.79
Fujitsu
$20.27
Lucent Technologies
$20.11
Nortel Networks
$19.39
Corning Inc.
$10.40
JDS Uniphase Corp.
$8.77
Mitsubishi Electric
$8.04
Source: UBS Warburg, 2001
032974 ©2001 eMarketer, Inc. www.eMarketer.com

©2001 eMarketer, Inc. Reproduction of information sourced as eMarketer is prohibited without prior, written permission.Note: all data in this report (other than that sourced as eMarketer) was obtained from published, publicly available information.
27
The IT Spending Report
Methodology
Worldwide IT Spending
North America
Europe
Asia-Pacific
Latin America
IT Spending by Industry
IT Spendingby Business Size
IT Budgeting andSpending Surveys
Index of Charts
Hardware SpendingResearch from Global Industry Analysts forecasts that worldwide ITequipment spending will increase at a CAGR of 6.43% between 1999 and2005. The United States, Japan, and Germany are the world’s three largestand most mature markets, while the strongest growth rates are expected tooccur in the Asia-Pacific region (excluding Japan) and Latin America.These latter two markets are projected to see CAGR’s of 11.68% and 9.94%over the 1999-2005 period.
Global Industry Analysts breaks down IT equipment spending into threeseparate categories, of which computer equipment holds a 63.6% share.Telecommunications equipment and then business equipment account forthe remaining 24.8% and 11.6% of the market.
In another look at the hardware market, Gartner has estimated thatbusiness spending on PC’s and servers grew 8% during 2000, down from12% growth in 1999. By comparison, UBS Warburg estimates thatworldwide hardware spending increased 12% in 1999, but will slow to agrowth rate of just 7% in 2001. The best growth year for hardwarespending, according to the investment bank, was in 1995 when sales grew30% over the previous year.
Breakdown of Worldwide IT Equipment Spending, byCategory, 1999 (in billions)
Computer equipment $626.51 (63.6%)
Telecom equipment $244.57 (24.8%)
Business equipment $114.31 (11.6%)
Total $985.39 (100.0%)
Source: Global Industry Analysts, 2001
032993 ©2001 eMarketer, Inc. www.eMarketer.com

©2001 eMarketer, Inc. Reproduction of information sourced as eMarketer is prohibited without prior, written permission.Note: all data in this report (other than that sourced as eMarketer) was obtained from published, publicly available information.
28
The IT Spending Report
Methodology
Worldwide IT Spending
North America
Europe
Asia-Pacific
Latin America
IT Spending by Industry
IT Spendingby Business Size
IT Budgeting andSpending Surveys
Index of Charts
But now that the hardware market has matured in regions such as NorthAmerica and Europe, PC and server manufacturers are pinning their hopeson growth in the Asia-Pacific region and Latin America. China and SouthKorea represent two of the most promising markets over the short term,while India will be a significant market over the longer-term, according toUBS Warburg.
As for the current share of the PC market by unit demand, UBS Warburgestimates that the United States accounts for 42% of the worldwide marketin 2001, ahead of Western Europe which has a 26% market share, andJapan which purchases 10% of PC units. The remaining countries in theAsia-Pacific region hold a 13% market share, while Latin America’s portionof the worldwide PC market is 4%.
With desktop PC’s reaching high penetration rates among householdsand businesses in developed countries, manufacturers are turning to laptopand handheld computing devices as alternate high growth areas. IDCpredicts that portable PC’s will experience a CAGR of 20.9% in the numberof units shipped between 1999 and 2004, compared with a CAGR of 14.2%for desktop PC’s during that same period.
According to Global Industry Analysts, the server market is led by fivecompanies, which together hold a 77% share of worldwide sales in 2000.Compaq is the leader with a 27% market share, followed by IBM and DellComputer, which each held 17% and 15% of the market. Hewlett Packardand Sun Microsystems rounded out the top five, with an 11% and 7% shareeach. The overall market for servers grew at a rate of 14% in 2000.
Salomon Smith Barney and IDC have a different view of the worldwideserver market in 2001, however, placing IBM on top with a 24.1% marketshare, followed by Compaq and Sun Microsystems accounting for 17.0%and 15.9% of global server sales. Taken together, the top five companieshold 78.4% of the total market for servers.
Worldwide PC Market Revenue Forecast, by Region,2001 (in billions)
United States $68.4
Western Europe $44.9
Japan $21.4
Asia/Pacific $18.1
Rest of World $27.3
Total $180.1
Source: UBS Warburg, 2001
033083 ©2001 eMarketer, Inc. www.eMarketer.com
For further information
about the PC industry and
markets, please refer to
eMarketer’s PC Market
Report

©2001 eMarketer, Inc. Reproduction of information sourced as eMarketer is prohibited without prior, written permission.Note: all data in this report (other than that sourced as eMarketer) was obtained from published, publicly available information.
29
The IT Spending Report
Methodology
Worldwide IT Spending
North America
Europe
Asia-Pacific
Latin America
IT Spending by Industry
IT Spendingby Business Size
IT Budgeting andSpending Surveys
Index of Charts
Top 10 Server Vendors, by Revenues, 2001 (in billionsand as a % of market share)
IBM
$14.81 (24.1%)
Compaq
$10.45 (17.0%)
Sun Microsystems
$9.77 (15.9%)
Hewlett-Packard
$9.18 (14.9%)
Dell Computer
$4.02 (6.5%)
Fujitsu
$2.13 (3.5%)
Siemens
$1.10 (1.8%)
NEC
$1.07 (1.7%)
Hitachi
$0.98 (1.6%)
SGI
$0.77 (1.3%)
Source: International Data Corporation (IDC), Salomon Smith Barney, 2001
033439 ©2001 eMarketer, Inc. www.eMarketer.com

©2001 eMarketer, Inc. Reproduction of information sourced as eMarketer is prohibited without prior, written permission.Note: all data in this report (other than that sourced as eMarketer) was obtained from published, publicly available information.
30
The IT Spending Report
Methodology
Worldwide IT Spending
North America
Europe
Asia-Pacific
Latin America
IT Spending by Industry
IT Spendingby Business Size
IT Budgeting andSpending Surveys
Index of Charts
Focusing upon the enterprise hardware market, UBS Warburg has selectedthe top ten vendors by their market capitalization as of September 7th,2001. Not unexpectedly, IBM is by far the largest company, followed byHewlett-Packard and Sun Microsystems.
Defined by their core product offerings and placed in a separate category,UBS Warburg has ranked the leading PC and peripherals manufacturers bymarket capitalization as of September 7th.
Top 10 Enterprise Hardware Equipment Companies,by Market Capitalization, September 7, 2001 (inbillions)
IBM Corp.
$178.69
Hewlett-Packard
$37.33
Sun Microsystems Inc.
$35.24
EMC Corp.
$32.64
Hitachi
$25.17
Secom Co. Ltd.
$11.17
Brocade Communications Systems
$5.21
Network Appliance Inc.
$3.86
NCR Corp.
$3.64
Unisys Corp.
$3.52
Source: UBS Warburg, 2001
032985 ©2001 eMarketer, Inc. www.eMarketer.com

©2001 eMarketer, Inc. Reproduction of information sourced as eMarketer is prohibited without prior, written permission.Note: all data in this report (other than that sourced as eMarketer) was obtained from published, publicly available information.
31
The IT Spending Report
Methodology
Worldwide IT Spending
North America
Europe
Asia-Pacific
Latin America
IT Spending by Industry
IT Spendingby Business Size
IT Budgeting andSpending Surveys
Index of Charts
In a separate ranking of desktop PC vendors by market share in 2000,Salomon Smith Barney places Compaq Computer at the top with 13% ofthe worldwide market, followed by Dell Computer at 11.1% and Hewlett-Packard at 8.8% market share.
Top 10 PC and Peripherals Manufacturers, by MarketCapitalization, September 7, 2001 (in billions)
Dell Computer
$56.49
Canon
$27.60
Compaq Computer Corp.
$18.84
Pitney Bowes Inc.
$10.94
Ricoh Company Ltd.
$10.73
Xerox Corp.
$6.20
Lexmark International Group Inc.
$6.10
Apple Computer Inc.
$5.97
Quanta
$4.95
CDW Computer Centers Inc.
$3.52
Source: UBS Warburg, 2001
032986 ©2001 eMarketer, Inc. www.eMarketer.com
©2001 eMarketer, Inc. Reproduction of information sourced as eMarketer is prohibited without prior, written permission.Note: all data in this report (other than that sourced as eMarketer) was obtained from published, publicly available information.
32
The IT Spending Report
Methodology
Worldwide IT Spending
North America
Europe
Asia-Pacific
Latin America
IT Spending by Industry
IT Spendingby Business Size
IT Budgeting andSpending Surveys
Index of Charts
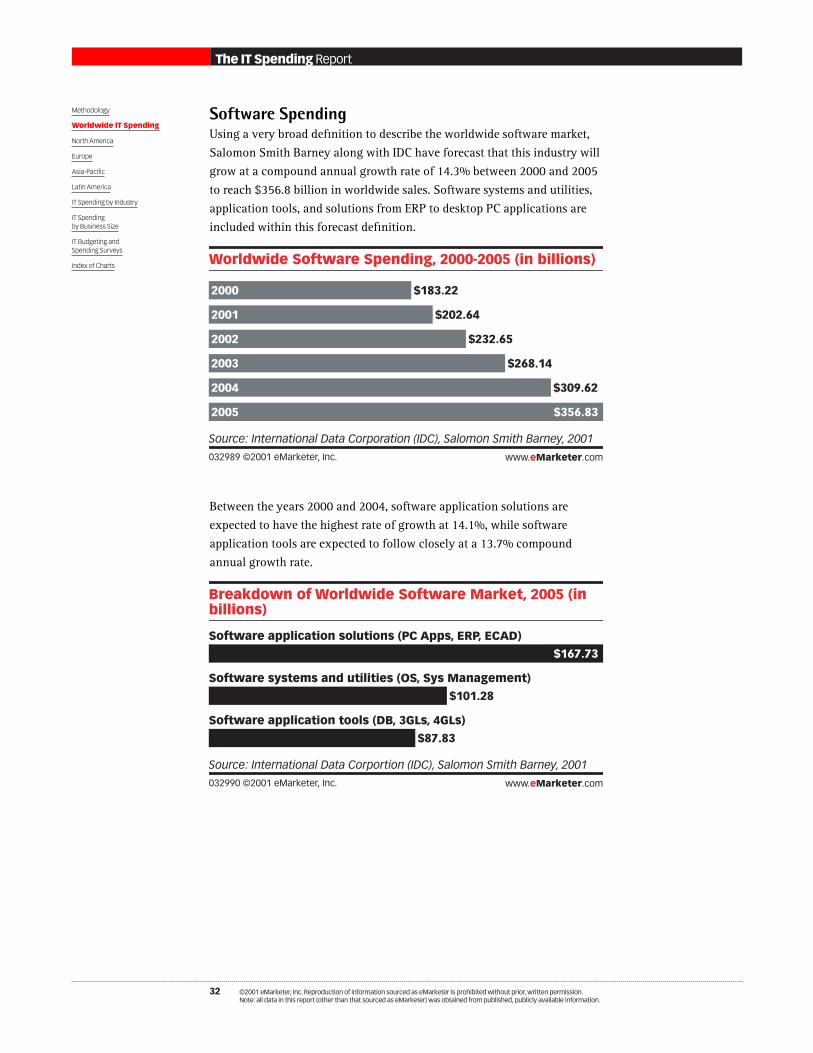
Software SpendingUsing a very broad definition to describe the worldwide software market,Salomon Smith Barney along with IDC have forecast that this industry willgrow at a compound annual growth rate of 14.3% between 2000 and 2005to reach $356.8 billion in worldwide sales. Software systems and utilities,application tools, and solutions from ERP to desktop PC applications areincluded within this forecast definition.
Between the years 2000 and 2004, software application solutions areexpected to have the highest rate of growth at 14.1%, while softwareapplication tools are expected to follow closely at a 13.7% compoundannual growth rate.
Worldwide Software Spending, 2000-2005 (in billions)
2000 $183.22
2001 $202.64
2002 $232.65
2003 $268.14
2004 $309.62
2005 $356.83
Source: International Data Corporation (IDC), Salomon Smith Barney, 2001
032989 ©2001 eMarketer, Inc. www.eMarketer.com
Breakdown of Worldwide Software Market, 2005 (inbillions)
Software application solutions (PC Apps, ERP, ECAD)
$167.73
Software systems and utilities (OS, Sys Management)
$101.28
Software application tools (DB, 3GLs, 4GLs)
$87.83
Source: International Data Corportion (IDC), Salomon Smith Barney, 2001
032990 ©2001 eMarketer, Inc. www.eMarketer.com

©2001 eMarketer, Inc. Reproduction of information sourced as eMarketer is prohibited without prior, written permission.Note: all data in this report (other than that sourced as eMarketer) was obtained from published, publicly available information.
33
The IT Spending Report
Methodology
Worldwide IT Spending
North America
Europe
Asia-Pacific
Latin America
IT Spending by Industry
IT Spendingby Business Size
IT Budgeting andSpending Surveys
Index of Charts
In the Global Industry Analysts’ forecast for worldwide software sales, theapplications market is also expected to see the strongest increase, growingat an average annual growth rate of 21.4% between 1999 and 2005. Bycomparison, software infrastructure sales are set to grow at an averageannual rate of 17.1%, while software tools are forecast to have a 12.6%average annual growth rate.
In its historical analysis of corporate software spending, IDC has found thatsoftware accounted for 20% of total business IT spending between theyears 1995 and 2000. Software solutions formed the largest market at $110billion in aggregate sales over that period. As a category, software salesgrew at a CAGR of 18% between 1995 and 2000, compared to an estimated10% to 11% CAGR for total corporate IT spending during the same time.
Worldwide Software Market, by Category, 2000-2005(in billions)
2000 2001 2002 2003 2004 2005
Applications $78.4 $90.1 $106.5 $129.7 $164.9 $220.4
Infrastructure $50.2 $57.2 $66.2 $77.7 $93.2 $114.6
Tools $39.2 $44.4 $50.1 $56.1 $63.1 $71.2
Total $167.8 $191.7 $222.8 $263.5 $321.2 $406.2
Source: Global Industry Analysts, 2001
033080 ©2001 eMarketer, Inc. www.eMarketer.com
Worldwide Software Market, by Category andPlatform, 2001 (in billions)
Host Desktop Client/server Internet Total
Applications $13.2 $35.1 $35.0 $6.8 $90.1
Infrastructure $16.2 $10.8 $19.0 $11.2 $57.2
Tools $10.8 $5.8 $19.1 $8.7 $44.4
Source: Global Industry Analysts, 2001
033081 ©2001 eMarketer, Inc. www.eMarketer.com
Breakdown of Aggregate Worldwide CorporateSoftware Spending, by Category, 1995-2000 (inbillions)
Solutions $101.0
System/utilities $39.0
Application tools $37.0
Total $177.0
Source: International Data Corporation (IDC), 2001
033147 ©2001 eMarketer, Inc. www.eMarketer.com

©2001 eMarketer, Inc. Reproduction of information sourced as eMarketer is prohibited without prior, written permission.Note: all data in this report (other than that sourced as eMarketer) was obtained from published, publicly available information.
34
The IT Spending Report
Methodology
Worldwide IT Spending
North America
Europe
Asia-Pacific
Latin America
IT Spending by Industry
IT Spendingby Business Size
IT Budgeting andSpending Surveys
Index of Charts
A narrower forecast from AMR Research indicates that the market forenterprise software will grow at a compound annual growth rate of 15%over the next four years, led by strong sales growth in Asia and LatinAmerica. North America will form the largest market, accounting for 44%of sales by 2004, while Europe is projected to take a 36% market share,followed by Asia at 12% of worldwide software sales. Latin America isforecast to account for 6% of enterprise software sales.
Within the enterprise software market, supply chain management (SCM)and e-commerce applications are projected by AMR Research to have evenhigher growth rates, at CAGR’s of 54% and 79% respectively.
According to most industry observers, whenever there has been adownturn in technology spending, software spending typically lagshardware and other IT categories by six to nine months. In anticipation of adecline in software sales, Morgan Stanley noted that through the first halfof 2001 annualized software spending was off only 5%, compared with adecline of 31% for the wider IT industry.
A similar warning of an approaching decline in software sales was issuedby Gartner Dataquest in late September of 2001, as the research firm notedthat new software sales had grown at a rate of 6% during the first half ofthe year. Gartner went on to forecast that total worldwide sales for the yearwould top off at 7% growth, well below the 18% growth rate of theprevious year.
Among those industries expected to reduce their software spending themost were airlines, travel, automobiles, insurance, and consumer PCvendors, according to Gartner. Business-to-consumer e-commerceapplications were also expected to see a drop-off in sales, asimplementation or upgrades of online retailing applications have becomeless urgent following the dot com boom.
Salomon Smith Barney has put together the following list of leadingsoftware companies with the help of data from IDC. Microsoft, IBM andOracle are the largest vendors, holding a 23.4% market share between thethree of them. The software industry is rather diverse compared to othersegments of the IT industry, in which as much as 80% of the total market isconcentrated among the top five players.

©2001 eMarketer, Inc. Reproduction of information sourced as eMarketer is prohibited without prior, written permission.Note: all data in this report (other than that sourced as eMarketer) was obtained from published, publicly available information.
35
The IT Spending Report
Methodology
Worldwide IT Spending
North America
Europe
Asia-Pacific
Latin America
IT Spending by Industry
IT Spendingby Business Size
IT Budgeting andSpending Surveys
Index of Charts
Top 15 Software Companies, by Revenues, 2000 (inbillions and as a % of market share)
Microsoft
$19.46 (11.1%)
IBM
$13.66 (7.8%)
Oracle
$7.89 (4.5%)
Computer Associates
$7.34 (4.2%)
SAP AG
$3.34 (1.9%)
Hewlett-Packard
$3.25 (1.9%)
Sun Microsystems
$1.79 (1.0%)
Fujitsu
$1.77 (1.0%)
BMC Software
$1.70 (1.0%)
Hitachi
$1.58 (0.9%)
Siebel Systems
$1.31 (0.7%)
Peoplesoft
$1.19 (0.7%)
Siemens
$1.16 (0.7%)
Adobe
$1.13 (0.6%)
Veritas
$1.13 (0.6%)
Source: International Data Corporation (IDC), Salomon Smith Barney, 2001
032988 ©2001 eMarketer, Inc. www.eMarketer.com

©2001 eMarketer, Inc. Reproduction of information sourced as eMarketer is prohibited without prior, written permission.Note: all data in this report (other than that sourced as eMarketer) was obtained from published, publicly available information.
36
The IT Spending Report
Methodology
Worldwide IT Spending
North America
Europe
Asia-Pacific
Latin America
IT Spending by Industry
IT Spendingby Business Size
IT Budgeting andSpending Surveys
Index of Charts
IT Services SpendingIn May of 2001, the Gartner Group revised its forecast for the size of theworldwide IT services market, which the research firm had initiallyestimated was $541.3 billion in 2000. The May revision now finds that ITservices spending had reached $665 billion in 2000, and is set to grow to$1.4 trillion by 2005. Gartner estimates that the market grew at a rate of9.7% in 2000, and will grow by 12.5% in 2001.
North America accounts for the largest share of IT services spending, at$345 billion in 2000. This 52% share is expected to remain constantthrough 2005, when North American spending will reach $712 billion.
Breaking down the IT services market, Gartner has found that the largestsegment is represented by development and integration services, which isprojected to reach $368.5 billion in revenues by 2005. Much of theanticipated growth in this area is expected to come from the need to linkbusinesses’ internal legacy systems and software to new e-businesssoftware, and to the external systems of their trading partners.
Worldwide Information Technology ServicesSpending, 2000 & 2005 (in billions)
2000 $665
2005 $1,400
Source: Gartner Group, 2001
031270 ©2001 eMarketer, Inc. www.eMarketer.com
Worldwide Technology Development & IntergrationServices Spending, 2000 & 2005 (in billions)
2000 $169.4
2005 $368.5
Source: Gartner Group, 2001
031271 ©2001 eMarketer, Inc. www.eMarketer.com

©2001 eMarketer, Inc. Reproduction of information sourced as eMarketer is prohibited without prior, written permission.Note: all data in this report (other than that sourced as eMarketer) was obtained from published, publicly available information.
37
The IT Spending Report
Methodology
Worldwide IT Spending
North America
Europe
Asia-Pacific
Latin America
IT Spending by Industry
IT Spendingby Business Size
IT Budgeting andSpending Surveys
Index of Charts
The next largest segment is business process management services, whichby Gartner’s definition includes outsourcing services. This market isforecast to reach $345.5 billion by 2005.
Compared to Gartner’s forecasts, IDC has estimated that worldwide spendingon IT services will grow at a compound annual growth rate of 12% from2000 to 2005, to reach $700 billion. In 2001, the United States represents a47% share of the world market according to IDC, while Western Europe hasa 29% share, and Japan accounts for 12% of global spending.
Worldwide Technolgy Business Process ManagementServices Spending, 2000 & 2005 (in billions)
2000 $148.2
2005 $345.5
Source: Gartner Group, 2001
031272 ©2001 eMarketer, Inc. www.eMarketer.com
Breakdown of Worldwide IT Services Market, byRegion, 2001 (in billions)
United States $206.9
Western Europe $127.5
Japan $53.2
Rest of world $52.5
Total $440.1
Source: International Data Corp. (IDC), 2001
031342 ©2001 eMarketer, Inc. www.eMarketer.com

©2001 eMarketer, Inc. Reproduction of information sourced as eMarketer is prohibited without prior, written permission.Note: all data in this report (other than that sourced as eMarketer) was obtained from published, publicly available information.
38
The IT Spending Report
Methodology
Worldwide IT Spending
North America
Europe
Asia-Pacific
Latin America
IT Spending by Industry
IT Spendingby Business Size
IT Budgeting andSpending Surveys
Index of Charts
Similar to the Gartner Group, IDC expects the United States’ share of theworldwide IT services market to remain constant over the next severalyears, rising marginally to 48% by 2005. The market share for WesternEurope and Japan is expected to see modest declines to 27.4% and 10.7%,as other regions of the world increase their IT services spending.
Breakdown of Worldwide IT Services Market, 2005 (inbillions)
US $335.0
Western Europe $192.4
Japan $75.2
Rest of World $97.7
Total $700.3
Source: International Data Corp. (IDC), 2001
031343 ©2001 eMarketer, Inc. www.eMarketer.com

©2001 eMarketer, Inc. Reproduction of information sourced as eMarketer is prohibited without prior, written permission.Note: all data in this report (other than that sourced as eMarketer) was obtained from published, publicly available information.
39
The IT Spending Report
Methodology
Worldwide IT Spending
North America
Europe
Asia-Pacific
Latin America
IT Spending by Industry
IT Spendingby Business Size
IT Budgeting andSpending Surveys
Index of Charts
The entire IT services market is forecast to grow at a compound annualgrowth rate of 12% between 2000 and 2005, with 11% growth in 2001. TheAsia-Pacific region is expected to be the fastest-growing market, increasingat a CAGR of 23% through the next five years.
Breaking down the IT services market by spending category, IDC expectssystems integration services to be a $142 billion market by 2005.
Breakdown of Worldwide IT Services Market, byService, 2001
Hardware and support
21%
Systems integration
18%
Processing services
18%
IS outsourcing
15%
Network integration and management
10%
Application development and outsourcing
7%
IT training and education
6%
IT consulting
5%
Source: International Data Corp. (IDC), 2001
031344 ©2001 eMarketer, Inc. www.eMarketer.com

©2001 eMarketer, Inc. Reproduction of information sourced as eMarketer is prohibited without prior, written permission.Note: all data in this report (other than that sourced as eMarketer) was obtained from published, publicly available information.
40
The IT Spending Report
Methodology
Worldwide IT Spending
North America
Europe
Asia-Pacific
Latin America
IT Spending by Industry
IT Spendingby Business Size
IT Budgeting andSpending Surveys
Index of Charts
Compared to other segments within the technology industry, the worldwideIT services market is highly fragmented. According to Gartner Dataquest,there are more than 15,000 services companies operating in the UnitedStates alone. The top 400 IT services vendors account for less than 50% oftotal market revenues, while the top 10 account for less than 20% ofrevenues. IBM leads the way, bringing in almost $33.2 billion in servicesrevenues in 2000 as it grew to hold a 5% market share.
Top 10 Worldwide IT Services Vendors, by RevenueEstimates, 1999 & 2000 (in billions)
1999Revenue
2000Revenue
2000 MarketShare
IBM $32.16 $33.15 5.0%
EDS $18.62 $19.22 2.9%
Fujitsu $12.57 $13.30 2.0%
Computer Sciences Corp. (CSC) $9.20 $10.45 1.6%
Accenture $9.12 $10.00 1.5%
Cap Gemini Ernst & Young $8.16 $7.77 1.1%
Xerox $8.05 $7.72 1.1%
Hewlett-Packard $6.16 $7.29 1.1%
Compaq $7.06 $6.70 1.1%
NTT Data $5.71 $6.69 1.1%
Others $490.18 $543.59 81.6%
Total Market $606.98 $665.87 100.1%
Source: Gartner Dataquest, 2001
032694 ©2001 eMarketer, Inc. www.eMarketer.com

©2001 eMarketer, Inc. Reproduction of information sourced as eMarketer is prohibited without prior, written permission.Note: all data in this report (other than that sourced as eMarketer) was obtained from published, publicly available information.
41
The IT Spending Report
Methodology
Worldwide IT Spending
North America
Europe
Asia-Pacific
Latin America
IT Spending by Industry
IT Spendingby Business Size
IT Budgeting andSpending Surveys
Index of Charts
Investment bank UBS Warburg has compiled its list of leading IT servicescompanies by selecting those businesses whose core focus is uponinformation technology services. When ranked according to marketcapitalization, EDS comes out on top, followed closely by Wipro, Sungardand CSC.
Top 10 IT Services Companies, by MarketCapitalization, September 7, 2001 (in billions)
Electronic Data Services Corp.
$27.77
Wipro Ltd.
$7.41
Sungard Data Systems Inc.
$6.71
Computer Sciences Corp.
$6.31
DST Systems Inc.
$6.08
Infosys Technologies Ltd.
$4.80
Affiliated Computer Svcs. Inc.
$4.19
CGI Group Inc.
$2.02
Datacraft Asia Ltd.
$1.70
HCL Technologies
$1.40
Source: UBS Warburg, 2001
032987 ©2001 eMarketer, Inc. www.eMarketer.com

©2001 eMarketer, Inc. Reproduction of information sourced as eMarketer is prohibited without prior, written permission.Note: all data in this report (other than that sourced as eMarketer) was obtained from published, publicly available information.
42
The IT Spending Report
Methodology
Worldwide IT Spending
North America
Europe
Asia-Pacific
Latin America
IT Spending by Industry
IT Spendingby Business Size
IT Budgeting andSpending Surveys
Index of Charts
E-Business/Internet Technology SpendingAlthough not traditionally broken out as a segment of IT spending, there isa significant interest in the portion of technology spending that isdedicated to e-business or internet-related initiatives. Many companieshave begun to dedicate significant portions of their IT budgets to suchprojects, and several researchers are now considering the contribution thate-business initiatives are making to overall IT spending growth.
However, e-business spending forecasts do vary considerably, due in partto the fact that it is almost impossible for technology vendors to break outtheir product sales by intended customer use. Furthermore, sometechnologies may have multiple uses that make it difficult to define them asinternet-specific. And finally, definitional differences between forecastsresult in different projections, as some researchers include just hardware,software and telecommunications equipment, while others include servicesas well.
In one of the earlier attempts to isolate and forecast internet-relatedspending, UK-based research firm Frost & Sullivan has estimated thatspending on technology used specifically for internet initiatives reached$40 billion in 1999, and will grow to $80 billion by 2004.
According to research firm Strategy Analytics, worldwide spending ondedicated hardware, software and services that were targeted at e-businessgrew at a rate of 73% and totaled $36 billion during the year 2000. Butfollowing the extraordinary burst of spending that year, Strategy Analyticsestimates that e-business spending will fall by 12.5% in 2001, withbusinesses spending just $31 billion by the end of this year.
Estimated Worldwide Spending on InternetTechnologies, 1999 & 2004 (in billions)
1999 $40.00
2004 $80.00
Source: Frost & Sullivan, 2000
033440 ©2001 eMarketer, Inc. www.eMarketer.com
Worldwide IT Spending on Dedicated E-BusinessTechnology, 2000 & 2001 (in billions)
2000 $36.00
2001 $31.00
Source: Strategy Analytics, 2001
032698 ©2001 eMarketer, Inc. www.eMarketer.com

©2001 eMarketer, Inc. Reproduction of information sourced as eMarketer is prohibited without prior, written permission.Note: all data in this report (other than that sourced as eMarketer) was obtained from published, publicly available information.
43
The IT Spending Report
Methodology
Worldwide IT Spending
North America
Europe
Asia-Pacific
Latin America
IT Spending by Industry
IT Spendingby Business Size
IT Budgeting andSpending Surveys
Index of Charts
Another estimate by Cahner’s In-Stat has put the figure for IT spending oninternet initiatives by US businesses at $80 billion in 2000. By Cahner’sdefinition, internet spending includes technology, software and services forinternet-specific projects. Total spending is expected to reach $197 billionin the United States alone by 2004.
After conducting an extensive global survey of e-business spending in 27countries, IDC has estimated that aggregate worldwide spending on e-business projects will exceed $5 trillion over the next four years, between2001 and 2004. Leading the way on the global stage will be the UnitedStates, followed by Japan and the United Kingdom.
Estimated Spending on Internet-Specific Initiatives byUS Businesses, 2000 & 2004 (in billions)
2000 $80.0
2004 $197.0
Source: Cahners In-Stat, 2001
033398 ©2001 eMarketer, Inc. www.eMarketer.com

©2001 eMarketer, Inc. Reproduction of information sourced as eMarketer is prohibited without prior, written permission.Note: all data in this report (other than that sourced as eMarketer) was obtained from published, publicly available information.
44
The IT Spending Report
Methodology
Worldwide IT Spending
North America
Europe
Asia-Pacific
Latin America
IT Spending by Industry
IT Spendingby Business Size
IT Budgeting andSpending Surveys
Index of Charts
The research firm has gone on to point out that online trading initiativesand integration costs will be the primary expenditures behind future e-business investment.
Top 10 Countries' Aggregate Spending on E-BusinessTechnology, 2001-2004 (in billions)
US
$2,397.60
Japan
$361.80
UK
$285.80
France
$285.80
Germany
$228.61
Canada
$193.89
Italy
$77.41
Spain
$76.11
Australia
$67.85
Sweden
$67.85
Source: International Data Corporation (IDC), 2001
033592 ©2001 eMarketer, Inc. www.eMarketer.com

©2001 eMarketer, Inc. Reproduction of information sourced as eMarketer is prohibited without prior, written permission.Note: all data in this report (other than that sourced as eMarketer) was obtained from published, publicly available information.
45
The IT Spending Report
Methodology
Worldwide IT Spending
North America
Europe
Asia-Pacific
Latin America
IT Spending by Industry
IT Spendingby Business Size
IT Budgeting andSpending Surveys
Index of Charts
Through the end of 2001, it is estimated that American companies will havealready spent $495.6 billion over the past several years, with Germanyfollowing as an early adopter, having spent $73.97 billion by then. Chinahas already invested a considerable amount in e-business technologyaccording to IDC, while Japan is off to a slow start, although it is expectedto be a leader through the long term.
Top 10 Countries' Aggregate Spending on E-BusinessTechnology by Year-End , 2001 (in billions)
US
$495.68
Germany
$73.97
UK
$65.72
France
$53.98
Canada
$30.62
Italy
$26.35
China
$19.81
Japan
$19.81
Netherlands
$17.38
Australia
$16.89
Source: International Data Corporation (IDC), 2001
033397 ©2001 eMarketer, Inc. www.eMarketer.com

©2001 eMarketer, Inc. Reproduction of information sourced as eMarketer is prohibited without prior, written permission.Note: all data in this report (other than that sourced as eMarketer) was obtained from published, publicly available information.
46
The IT Spending Report
Methodology
Worldwide IT Spending
North America
Europe
Asia-Pacific
Latin America
IT Spending by Industry
IT Spendingby Business Size
IT Budgeting andSpending Surveys
Index of Charts
Investment bank Salomon Smith Barney has broken out the leaders in theentry- or appliance-server market – vendors of those servers that areprimarily used as web servers or for network access purposes and webcaching. Note that this is only a small portion of the web hardware market.
As an indication of the leaders in the e-business software market, IDC hasbroken out the $2.2 billion market for Java application server software, byleading vendor. This software is typically used on high-end servers thathandle e-commerce and other website transactions. In 2000, BEA Systemswas the leader with an 18% market share, followed by IBM at 15% and Sunand Oracle, each with an approximate 8% share.
Leading Vendors in the Entry Server Market*, byRevenues, 2001 (in billions and as a % of marketshare)
Sun Microsystems
$4.86 (44.4%)
Hewlett-Packard
$2.08 (18.9%)
IBM
$1.49 (13.6%)
Compaq
$1.20 (10.9%)
Fujitsu
$0.25 (2.2%)
NCR
$0.08 (0.7%)
Data General
$0.05 (0.5%)
NEC
$0.01 (0.1%)
Others
$0.92 (8.4%)
Total
$10.94 (99.8%)
Note: *including PCsSource: International Data Corporation (IDC), Salomon Smith Barney, 2001
033441 ©2001 eMarketer, Inc. www.eMarketer.com

IIMethodology
I Worldwide IT Spending
II North America 47
A. North America IT Spending forecasts 48
B. Impact of the September 11th Terrorist Atttacks 52
C. IT Budgeting in North America 55
D. Information Technology’s Place in the US Economy 56
III Europe
IV Asia-Pacific
V Latin America
VI IT Spending by Industry
VII IT Spending by Business Size
VIII IT Budgeting and Spending Surveys
Index of Charts
©2001 eMarketer, Inc. Reproduction of information sourced as eMarketer is prohibited without prior, written permission.Note: all data in this report (other than that sourced as eMarketer) was obtained from published, publicly available information.
47
The IT Spending Report

©2001 eMarketer, Inc. Reproduction of information sourced as eMarketer is prohibited without prior, written permission.Note: all data in this report (other than that sourced as eMarketer) was obtained from published, publicly available information.
48
The IT Spending Report
Methodology
Worldwide IT Spending
North America
Europe
Asia-Pacific
Latin America
IT Spending by Industry
IT Spendingby Business Size
IT Budgeting andSpending Surveys
Index of Charts
A. North American IT Spending ForecastsThe Aberdeen Group has forecast that North American IT spending willgrow from $492.29 billion in 2001 to $681.78 billion by 2005.
A comparative estimate by Global Industry Analysts forecasts NorthAmerican IT spending on the equipment market alone will be $521.86billion in 2001 and $656.03 billion by 2005. Growth in the US market isexpected to be 8.04% in 2001, down from 9.38% in 2000. In 2002, ITequipment spending is forecast to grow 7.0% in the United States.
IT Spending Forecast for North America, 2001-2005 (inbillions)
2001
$30.29
$462.00
2002
$32.66
$501.27
2003
$35.27
$545.13
2004
$38.27
$590.10
2005
$41.52
$640.26
Canada US
Source: Aberdeen Group, May 20001
030030 ©2001 eMarketer, Inc. www.eMarketer.com

©2001 eMarketer, Inc. Reproduction of information sourced as eMarketer is prohibited without prior, written permission.Note: all data in this report (other than that sourced as eMarketer) was obtained from published, publicly available information.
49
The IT Spending Report
Methodology
Worldwide IT Spending
North America
Europe
Asia-Pacific
Latin America
IT Spending by Industry
IT Spendingby Business Size
IT Budgeting andSpending Surveys
Index of Charts
In 2001, Canada’s share of North American IT spending was 6.15% of thetotal market, according to the Aberdeen Group’s forecast. By comparison,Global Industry Analysts’ estimate for the IT equipment market placesCanada’s share at 6.88%. The research firm has gone on to predict thatCanada will experience a growth rate of 4.98% in IT equipment spending in2002, down from a rate of 5.76% in 2001.
Citing personnel reductions as the leading segment of technologyspending impacted by IT budget cuts, the Meta Group projects US corporatetechnology spending will fall to $798 billion in 2002, declining by 2% from$811.7 billion in 2001. On the positive side, the Meta Group has noted thataccording to its surveys, the low point of IT spending cuts passed in thespring of 2001, and has been trending upward since.
IT Spending Forecast for North America, 2001-2005 (inbillions)
2001
$35.92
$485.94
2002
$37.71
$519.93
2003
$39.47
$551.95
2004
$41.01
$582.04
2005
$42.53
$613.50
Canada US
Source: Global Industry Analysts, 2001
032994 ©2001 eMarketer, Inc. www.eMarketer.com

©2001 eMarketer, Inc. Reproduction of information sourced as eMarketer is prohibited without prior, written permission.Note: all data in this report (other than that sourced as eMarketer) was obtained from published, publicly available information.
50
The IT Spending Report
Methodology
Worldwide IT Spending
North America
Europe
Asia-Pacific
Latin America
IT Spending by Industry
IT Spendingby Business Size
IT Budgeting andSpending Surveys
Index of Charts
A fourth estimate by Forrester Research projects that under its “most likely”IT spending scenario, US technology spending will grow from $506 billionin 2001 to $634 billion in 2004. According to Forrester’s best case scenario,IT spending could reach $713 billion by 2004, while on the downside itcould be as low as $564 billion.
Breaking down the IT equipment market by segment, most spending wenttoward computer equipment in 1999, at 60.8% of total spending accordingto Global Industry Analysts. Telecom equipment accounted for asubstantial 26.9% of the total market at $119.23 billion.
US IT Spending Forecast, "Most Likely" Scenario,2001-2004 (in billions)
2001 $506.0
2002 $517.0
2003 $567.0
2004 $634.0
Source: Forrester Research, 2001
033783 ©2001 eMarketer, Inc. www.eMarketer.com
Breakdown of IT Equipment Spending in NorthAmerica, by Category, 1999 (in billions and as a % oftotal)
Computer equipment $269.46 (60.8%)
Telecom equipment $119.23 (26.9%)
Business equipment $54.31 (12.3%)
Total $443.00 (100.0%)
Source: Global Industry Analysts, 2001
033007 ©2001 eMarketer, Inc. www.eMarketer.com

©2001 eMarketer, Inc. Reproduction of information sourced as eMarketer is prohibited without prior, written permission.Note: all data in this report (other than that sourced as eMarketer) was obtained from published, publicly available information.
51
The IT Spending Report
Methodology
Worldwide IT Spending
North America
Europe
Asia-Pacific
Latin America
IT Spending by Industry
IT Spendingby Business Size
IT Budgeting andSpending Surveys
Index of Charts
Computer Economics’ 2001 IT spending estimate breakdown includesstaffing, software, and services, as well as overhead costs, in addition tohardware spending. By this assessment, hardware accounts for 40.9% of ITspending in the United States, while staffing takes a significant 29.4% share.
Estimated US IT Spending, by Category, 2001 (inbillions and as a % of total spending)
Hardware
$214.86 (40.9%)
Staff
$154.47 (29.4%)
Software
$66.15 (12.6%)
Outside services
$47.34 (9.0%)
Facilities overhead
$23.38 (4.4%)
Consumable supplies
$19.46 (3.7%)
Total
$525.65 (100.0%)
Source: Computer Economics, 2001
032624 ©2001 eMarketer, Inc. www.eMarketer.com

©2001 eMarketer, Inc. Reproduction of information sourced as eMarketer is prohibited without prior, written permission.Note: all data in this report (other than that sourced as eMarketer) was obtained from published, publicly available information.
52
The IT Spending Report
Methodology
Worldwide IT Spending
North America
Europe
Asia-Pacific
Latin America
IT Spending by Industry
IT Spendingby Business Size
IT Budgeting andSpending Surveys
Index of Charts
B. Impact of the September 11th TerroristAttacksFollowing the September 11th terrorist attacks on the United States, therehas been much discussion about the impact of these events on the USeconomy as a whole, and the technology industry in particular. By mid-October, three different research firms had produced estimates for the costof replacing the damaged IT and telecommunications equipment in NewYork City.
Computer Economics was quick to publish its high-end estimate onSeptember 14th, assessing the total impact of the damage at $15.8 billion.The California-based research firm breaks down its assessment of thedamage by calculating that the immediate costs of disruption and recoverytotaled $1.7 billion, while an additional $8.1 billion in spending will berequired in order to replace businesses’ hardware, software andtelecommunications equipment.
Hardest hit by the damage were banking and financial servicescompanies, with Computer Economics noting that as many as 100,000information intensive workers have been displaced by the damage.Rounding out its $15.8 billion estimate, Computer Economics forecasts thatthe separate cost of replacing New York City’s damaged communicationsinfrastructure will be $6 billion.
Another assessment by the TowerGroup has placed the impact of thedamage in New York City at $3.2 billion. The research firm believes thatapproximately 16,000 trading desks, 34,000 PC workstations, and 13,000servers were destroyed in the World Trade Center and adjacent buildings.Including printers, hubs, and networking equipment, the TowerGroup hasestimated the cost of replacing the destroyed hardware technology at $1.7billion. An additional $1.5 billion is projected to be spent on software andIT services as part of the cost of recovery.
Estimated Cost of Replacing IT Equipment Followingthe Attack on the World Trade Center, September2001 (in billions)Hardware $1.70
Software and services $1.50
Total $3.20
Source: TowerGroup, 2001
033451 ©2001 eMarketer, Inc. www.eMarketer.com

©2001 eMarketer, Inc. Reproduction of information sourced as eMarketer is prohibited without prior, written permission.Note: all data in this report (other than that sourced as eMarketer) was obtained from published, publicly available information.
53
The IT Spending Report
Methodology
Worldwide IT Spending
North America
Europe
Asia-Pacific
Latin America
IT Spending by Industry
IT Spendingby Business Size
IT Budgeting andSpending Surveys
Index of Charts
Finally, a third estimate released on October 11th by IDC has placed the costof replacing destroyed computer systems in New York City at between $500million and $700 million.
Since the terrorist attacks on New York and Washington, IDC has twicerevised its IT spending forecast for the United States, and has said that itsforecast is subject to further revision, should its assumptions of a steadyreturn to normalcy prove to be wrong.
Shortly after September 11th, IDC moved to its worst-case scenario for ITspending in the United States. The research firm estimated that IT spendingwould grow at a rate of just 3% in 2001, with the possibility of 5% growth in2002. Depending upon the general pace of economic recovery in the UnitedStates, IDC forecast an increase to 10% growth in IT spending by 2003.
On October 11th, IDC lowered its IT spending forecast for North Americaagain. IDC believes that IT spending will actually contract by 0.7% during2001, but will rebound to 4.3% growth in 2002 if there are no furtherdestabilizing shocks to the US economy. Software and IT services spendingare expected to lead the way to recovery, while price competition has led tolowered forecasts for hardware spending.
US "Worst Case Scenario" IT Spending Growth,2000-2003
2000 11.1%
2001 3.0%
2002 5.0%
2003 10.0%
Note: *After 9/11/2001 AttacksSource: International Data Corporation (IDC), September 2001
032699 ©2001 eMarketer, Inc. www.eMarketer.com
Revised IT Spending Growth Rates for North America,2000-20032000 12%
2001 -0.7%
2002 4.3%
2003 10.8%
Note: revised 11 October 2001Source: International Data Corporation (IDC), October 11, 2001
033399 ©2001 eMarketer, Inc. www.eMarketer.com

©2001 eMarketer, Inc. Reproduction of information sourced as eMarketer is prohibited without prior, written permission.Note: all data in this report (other than that sourced as eMarketer) was obtained from published, publicly available information.
54
The IT Spending Report
Methodology
Worldwide IT Spending
North America
Europe
Asia-Pacific
Latin America
IT Spending by Industry
IT Spendingby Business Size
IT Budgeting andSpending Surveys
Index of Charts
IDC had originally noted in its mid-year forecast that IT spending wouldgrow at a rate of about 10% in Canada during 2001, after finding thatbusinesses there had not slowed their IT spending as drastically as theirAmerican counterparts during the first half of the year. Approximately 70%of Canadian business respondents to an April 2001 survey said that theywere maintaining or increasing their IT budgets during the current year,while 30% said that they had plans to decrease spending. In its Octoberforecast revision, IDC once again noted that Canadian IT spending wouldexperience less of a downturn than that of the United States.
In its “most likely” scenario for US IT spending, Forrester Researchpredicts that the only annual decline in technology spending will occur in2001, with a drop of 13.8% compared to the previous year. Modest growth isexpected to occur in 2002, at just 2.2%, while Forrester’s worst case scenarioprojects IT spending will fall 3.2% in 2002 after dropping 15.2% in 2001. Onthe positive side, Forrester sees a best-case 12% decline in US IT spending in2000, followed by 7.6% growth in 2002 and 14.3% growth by 2004.
Finally, an IT spending forecast issued by the Aberdeen Group in Octoberestimates that technology spending in the United States will decrease bybetween 6% and 12% during the fourth quarter of 2001. Subject to itsassumption of a moderate economic recovery in 2002, the research firmpredicts that IT spending will grow between 4% and 7% next year.
US IT Spending Growth Forecast, "Most Likely"Scenario, 2001-20042001 -13.8%
2002 2.2%
2003 9.7%
2004 11.8%
Source: Forrester Research, 2001
033784 ©2001 eMarketer, Inc. www.eMarketer.com

©2001 eMarketer, Inc. Reproduction of information sourced as eMarketer is prohibited without prior, written permission.Note: all data in this report (other than that sourced as eMarketer) was obtained from published, publicly available information.
55
The IT Spending Report
Methodology
Worldwide IT Spending
North America
Europe
Asia-Pacific
Latin America
IT Spending by Industry
IT Spendingby Business Size
IT Budgeting andSpending Surveys
Index of Charts
C. IT Budgeting in North AmericaInformation technology services company Computer Sciences Corporation(CSC) finds in its annual survey of more than 800 IT executives that the year2000 saw a historically high amount of company revenues spent on IT. WithIT budgets normally accounting for about 2.0% to 2.5% of gross revenues,spending increased significantly to 4.9% of company revenues in 2000.
CSC also finds that North American IT budgets have been growing athistorically high rates since 1995, reflecting investments in internalcorporate networks, year-2000 preparations, and internet initiatives.
North American Companies' Information SystemsBudget, 1991-2000 (as a % of revenues)
1991
2.2%
1992
2.4%
1993
2.0%
1994
2.0%
1995
2.1%
1996
1.9%
1997
1.5%
1998
2.4%
1999
2.2%
2000
4.9%
3
5
Source: Computer Sciences Corporation (CSC), 2001
032710 ©2001 eMarketer, Inc. www.eMarketer.com
7.1%
6.3%5.4%
7.9%7.6%
4.6%
North American Companies' Information SystemsBudget Growth Rates, 1991-2000
1991
5.3%
1992
3.5%
1993
2.5%
1994
2.3%
1995 1996 1997 1998 1999 2000
5
8
Source: Computer Sciences Corporation (CSC), 2001
032706 ©2001 eMarketer, Inc. www.eMarketer.com

©2001 eMarketer, Inc. Reproduction of information sourced as eMarketer is prohibited without prior, written permission.Note: all data in this report (other than that sourced as eMarketer) was obtained from published, publicly available information.
56
The IT Spending Report
Methodology
Worldwide IT Spending
North America
Europe
Asia-Pacific
Latin America
IT Spending by Industry
IT Spendingby Business Size
IT Budgeting andSpending Surveys
Index of Charts
Hardware and software expenditures are followed closely by staffing coststo account for 23% and 21% of North American firms’ IT budgets,respectively.
D. Information Technology’s Place in theUS EconomyWhile much has been made of the contribution of technology to the successof the US economy through the late 1990’s and into 2001, there remainssome uncertainty about the exact size of technology’s impact as well as itscontinued influence. Taken together, several separate studies provide abetter picture of information technology’s place within the US economy.
In its Digital Economy 2000 report, the US Census Bureau estimates thatIT industries accounted for approximately 8.3% of the US economy’s totaloutput in 2000, up from 6.3% in 1994.
In a separate examination of the contribution that informationtechnology has made to the reduction of inflation in the United States, theCommerce Department notes that while industrial equipment prices havegone up an average 1.5% per year over the period from 1995 to 1999, ITequipment prices have fallen at an average rate of 6.7% during that sameperiod.
This, in turn, has had a significant impact on the return on businesscapital investment. As a portion of business capital spending by Americancompanies, IT equipment and software accounted for 44% of all equipmentspending in 1992 and 46% in 1999. By comparison, industrial equipmentaccounted for 32% of total spending in 1999, while transportationequipment accounted for 21% of total spending.
Other 3%
User upport 15%
Telecommunications 19%
Application development/ maintenance 19%
Human resources 21%
Hardware/ software 23%
North American Companies' Information SystemsBudget Allocation, 2000
Source: Computer Sciences Corporation (CSC), 2001
032702 ©2001 eMarketer, Inc. www.eMarketer.com

©2001 eMarketer, Inc. Reproduction of information sourced as eMarketer is prohibited without prior, written permission.Note: all data in this report (other than that sourced as eMarketer) was obtained from published, publicly available information.
57
The IT Spending Report
Methodology
Worldwide IT Spending
North America
Europe
Asia-Pacific
Latin America
IT Spending by Industry
IT Spendingby Business Size
IT Budgeting andSpending Surveys
Index of Charts
As a portion of capital spending on IT, software grew the most between1995 and 1999 to obtain a 35% market share. The largest category of ITequipment spending remained the “other” category, which includescommunications equipment. However, in light of the decline intelecommunications and hardware equipment spending, during the thirdquarter of 2001 Business Week noted that American business spending onsoftware accounted for 43.6% of all IT spending.
Transportation equipment
21%
Industrial equipment
32%
IT equipment, including software 46%
US IT Spending (as a % of total business capital spending), 1999
Source: Bureau of Economic Analysis, 2000
033442 ©2001 eMarketer, Inc. www.eMarketer.com
Source: Bureau of Economic Analysis, 2000
Software 35%
Computers 24%
Other IT equipment (including telecom) 41%
Breakdown of US Business IT Spending, 1999 (in billions)
033443 ©2001 eMarketer, Inc. www.eMarketer.com

©2001 eMarketer, Inc. Reproduction of information sourced as eMarketer is prohibited without prior, written permission.Note: all data in this report (other than that sourced as eMarketer) was obtained from published, publicly available information.
58
The IT Spending Report
Methodology
Worldwide IT Spending
North America
Europe
Asia-Pacific
Latin America
IT Spending by Industry
IT Spendingby Business Size
IT Budgeting andSpending Surveys
Index of Charts
According to very general estimates, corporations account forapproximately 80% of IT spending in the United States. Research by Inputplaces this figure at $457 billion in 2001, forecasting that commercial ITspending will reach $831 billion by 2005.
As for the government’s share of technology spending, Input places thevalue of federal government spending on IT in the United States at $40.1billion in 2001, while the federal government itself has announced an ITbudget of $44.9 billion for 2002.
By Input’s definition, IT spending includes capital investment inhardware, software and telecommunications equipment, as well as supportservices and personnel that are required to run IT systems.
State and local governments are estimated to have spent $23.2 billion on ITin 2000, and are expected to increase their spending to $33.6 billion by2005. Using Input’s figures along with the Aberdeen Group’s forecast forUS IT spending in 2005, the combined government share of IT spendingwill account for approximately 12.9% of total IT spending in the UnitedStates.
US Commercial IT Spending, 2001 & 2005 (in billions)
2001 $457
2005 $831
Source: Input, 2001
033444 ©2001 eMarketer, Inc. www.eMarketer.com
US Federal Government IT Spending, 2001-2005 (inbillions)
2001 $40.10
2002 $42.00
2003 $44.10
2004 $46.50
2005 $49.10
Source: Input, 2001
032617 ©2001 eMarketer, Inc. www.eMarketer.com
US State and Local Government IT Spending, 2001 &2005 (in billions)
2001 $23.20
2005 $33.60
Source: Input, 2001
033445 ©2001 eMarketer, Inc. www.eMarketer.com

©2001 eMarketer, Inc. Reproduction of information sourced as eMarketer is prohibited without prior, written permission.Note: all data in this report (other than that sourced as eMarketer) was obtained from published, publicly available information.
59
The IT Spending Report
Methodology
Worldwide IT Spending
North America
Europe
Asia-Pacific
Latin America
IT Spending by Industry
IT Spendingby Business Size
IT Budgeting andSpending Surveys
Index of Charts
A comparative estimate by Gartner found that the federal government spent$35 billion on IT during 2000, while state and local governments spent anadditional $42.6 billion. Federal government IT spending is forecast to growat an annual rate of just 2%, compared with state and local IT spendingwhich is expected to grow at a rate of 7% between 2001 and 2003.
Gartner has gone on to estimate that state and local government spendingon e-government or internet-based initiatives will grow from $1.9 billionin 2001 to $6.5 billion by 2005. In particular, the research firm has notedthat government procurement via the internet is set to take off, with almost60% of local, state and federal government agencies conducting theirpurchasing online by 2003.
Spending on E-Government Initiatives in the US,2000-2005 (in billions)
2000 $1.4
2001 $1.9
2002 $2.6
2003 $3.6
2004 $4.8
2005 $6.5
Note: aggregate expenditures on hardware, software, internal and externalservicesSource: Gartner Dataquest, 2001
031630 ©2001 eMarketer, Inc. www.eMarketer.com
US State and Local Government IT Spending, 2001 &2003 (in billions)
2001 $45.62
2003 $52.23
Source: Gartner Dataquest, 2001
033841 ©2001 eMarketer, Inc. www.eMarketer.com


IIIMethodology
I Worldwide IT Spending
II North America
III Europe 61
A. European IT Spending Forecasts 62
B. IT Spending Growth Rates in Europe 67
C. IT Budgeting in Europe 70
IV Asia-Pacific
V Latin America
VI IT Spending by Industry
VII IT Spending by Business Size
VIII IT Budgeting and Spending Surveys
Index of Charts
©2001 eMarketer, Inc. Reproduction of information sourced as eMarketer is prohibited without prior, written permission.Note: all data in this report (other than that sourced as eMarketer) was obtained from published, publicly available information.
61
The IT Spending Report

©2001 eMarketer, Inc. Reproduction of information sourced as eMarketer is prohibited without prior, written permission.Note: all data in this report (other than that sourced as eMarketer) was obtained from published, publicly available information.
62
The IT Spending Report
Methodology
Worldwide IT Spending
North America
Europe
Asia-Pacific
Latin America
IT Spending by Industry
IT Spendingby Business Size
IT Budgeting andSpending Surveys
Index of Charts
A. European IT Spending ForecastsThe Aberdeen Group forecasts that IT spending in Western Europe willgrow from $297.11 billion in 2001 to $422.35 billion by 2005. Second onlyto the United States among world regions, the countries of Western Europeare expected to account for 24.5% of worldwide technology spending in2001 compared to the United States’ 38.2% share.
Not unexpectedly, the leading economies of Europe are the leaders in ITspending as well. In 2001, the United Kingdom accounts for 15.5% ofWestern European IT spending, following Germany at 23.4% and France at15.9%. Taken together, the top five markets for information technologyhold 73.9% of the Western European market in 2001, and will have a 73.1%share in 2005.
IT Spending Forecast for Western Europe, 2001-2005(in billions)
2001 $297.11
2002 $324.50
2003 $354.45
2004 $386.99
2005 $422.35
Western Europe
Source: Aberdeen Group, 2001
030035 ©2001 eMarketer, Inc. www.eMarketer.com
Information Technology Spending in LeadingEuropean Markets, 2001-2005 (in billions)
2001 2002 2003 2004 2005Spain $18.79 $20.78 $23.07 $25.38 $27.84
Italy $38.44 $41.13 $44.10 $47.20 $50.74
UnitedKingdom
$45.91 $49.81 $54.12 $58.72 $63.86
France $47.14 $51.27 $55.82 $60.85 $66.26
Germany $69.56 $76.33 $83.58 $91.52 $99.99
Source: Aberdeen Group, May 2001
030036 ©2001 eMarketer, Inc. www.eMarketer.com

©2001 eMarketer, Inc. Reproduction of information sourced as eMarketer is prohibited without prior, written permission.Note: all data in this report (other than that sourced as eMarketer) was obtained from published, publicly available information.
63
The IT Spending Report
Methodology
Worldwide IT Spending
North America
Europe
Asia-Pacific
Latin America
IT Spending by Industry
IT Spendingby Business Size
IT Budgeting andSpending Surveys
Index of Charts
Computer Economics breaks down European IT spending in 2001 bycategory, showing that hardware takes up 42.8% of total IT expenditures,followed by IT staff at 33.8%. Compared with the United States, Europeansoftware spending in 2001 is lower at 9.0% of total expenditures, versus12.9% in the US.
Global Industry Analysts’ forecast for the narrower IT equipment marketprojects that spending in Europe will reach $431.7 billion by 2005. Europewill account for 30.25% of the world market by then, with spending set togrow at a rate of 5.99% in 2002, down from 6.96% growth in 2001.
Estimated European IT Spending by Category, 2001 (inbillions and as a % of total spending)
Hardware
$131.11 (42.8%)
Staff
$103.67 (33.8%)
Software
$27.44 (9.0%)
Outside services
$22.84 (7.5%)
Facilities overhead
$12.20 (4.0%)
Consumable supplies
$9.15 (3.0%)
Total
$306.40 (100.0%)
Source: Computer Economics, 2001
032667 ©2001 eMarketer, Inc. www.eMarketer.com
IT Equipment Spending in Europe, 2001-2005 (inbillions)
2001 $350.78
2002 $371.80
2003 $391.99
2004 $411.60
2005 $431.77
Source: Global Industry Analysts, 2001
032998 ©2001 eMarketer, Inc. www.eMarketer.com

©2001 eMarketer, Inc. Reproduction of information sourced as eMarketer is prohibited without prior, written permission.Note: all data in this report (other than that sourced as eMarketer) was obtained from published, publicly available information.
64
The IT Spending Report
Methodology
Worldwide IT Spending
North America
Europe
Asia-Pacific
Latin America
IT Spending by Industry
IT Spendingby Business Size
IT Budgeting andSpending Surveys
Index of Charts
Computer equipment forms the largest share of the European IT equipmentmarket at 65.3%, followed by telecommunications equipment at 23.3%. Asa percent of the worldwide market for each of these categories, Europeaccounted for 31.6% of computer equipment sales in 1999, compared with28.9% of telecommunications equipment sales and 30.1% of businessequipment sales, according to data from Global Industry Analysts.
The World Information Technology and Services Alliance (WITSA) notes inits latest report that between the years 1992 and 1999, European countrieshave lost their share of the worldwide information and communicationtechnology (ICT) market to other countries such as China and Brazil, whichare catching up with their spending. Nonetheless, Germany still held a 6.5%share in 1999, while France accounted for a significant 4.8% of global ICTspending.
Breakdown of IT Equipment Spending in Europe, byCategory, 1999 (in billions and as a % of total)
Computer equipment $197.85 (65.3%)
Telecom equipment $70.75 (23.3%)
Business equipment $34.43 (11.4%)
Total $303.03 (100.0%)
Source: Global Industry Analysts, 2001
033008 ©2001 eMarketer, Inc. www.eMarketer.com
Select European Countries' Share of WorldwideInformation and Communication TechnologySpending, 1992 & 1999
1992 1999
Germany 8.2% 6.5%
France 5.9% 4.8%
Italy 3.5% 2.6%
Source: World Information Technology and Services Alliance (WITSA),International Data Corporation. (IDC), 2000
033447 ©2001 eMarketer, Inc. www.eMarketer.com

©2001 eMarketer, Inc. Reproduction of information sourced as eMarketer is prohibited without prior, written permission.Note: all data in this report (other than that sourced as eMarketer) was obtained from published, publicly available information.
65
The IT Spending Report
Methodology
Worldwide IT Spending
North America
Europe
Asia-Pacific
Latin America
IT Spending by Industry
IT Spendingby Business Size
IT Budgeting andSpending Surveys
Index of Charts
Global Industry Analysts estimates that Germany will account for 23.78%of the European market for IT equipment in 2005, down from its 1999 shareat 24.16%. Nonetheless, it is expected to spend $102.68 billion by then andtake a 7.17% share of the world market. IT equipment spending in Germanyis projected to grow by 5.76% in 2002, down from 6.43% growth in 2001.
The United Kingdom is expected to have a 15.69% share of the European ITequipment market in 2005, down from its 16.72% share in 1999. At $67.74billion in spending by 2005, the UK will have a 4.73% share of the globalmarket. IT equipment spending in the UK is projected by Global IndustryAnalysts to slow to 3.98% growth in 2002, down sharply from 6.17%growth in 2001.
IT Equipment Spending in Germany, 2001-2005 (inbillions)
2001 $84.27
2002 $89.12
2003 $93.57
2004 $97.96
2005 $102.68
Source: Global Industry Analysts, 2001
032999 ©2001 eMarketer, Inc. www.eMarketer.com
IT Equipment Spending in the United Kingdom,2001-2005 (in billions)
2001 $57.10
2002 $59.38
2003 $62.25
2004 $65.13
2005 $67.74
Source: Global Industry Analysts, 2001
033000 ©2001 eMarketer, Inc. www.eMarketer.com

©2001 eMarketer, Inc. Reproduction of information sourced as eMarketer is prohibited without prior, written permission.Note: all data in this report (other than that sourced as eMarketer) was obtained from published, publicly available information.
66
The IT Spending Report
Methodology
Worldwide IT Spending
North America
Europe
Asia-Pacific
Latin America
IT Spending by Industry
IT Spendingby Business Size
IT Budgeting andSpending Surveys
Index of Charts
By 2005, France will account for 14.49% of the European market for ITequipment, falling from its 16.16% share in 1999. France’s share of theglobal market will be 4.37% in 2005. IT equipment spending is expected togrow 4.76% in 2002, down only slightly from 4.79% growth in 2001.
Italy’s spending on IT equipment will reach $49.55 billion in 2005,accounting for 11.48% of the European market and 3.46% of the worldmarket by then. In 1999, Italy represented 11.84% of European ITequipment spending. The market is projected to grow by 5.45% in 2002compared with a growth rate of 6.26% in 2001.
IT Equipment Spending in France, 2001-2005 (inbillions)
2001 $54.34
2002 $56.93
2003 $59.27
2004 $60.77
2005 $62.58
Source: Global Industry Analysts, 2001
033005 ©2001 eMarketer, Inc. www.eMarketer.com
IT Equipment Spending in Italy, 2001-2005 (in billions)
2001 $41.10
2002 $43.34
2003 $45.42
2004 $47.41
2005 $49.55
Source: Global Industry Analysts, 2001
033006 ©2001 eMarketer, Inc. www.eMarketer.com

©2001 eMarketer, Inc. Reproduction of information sourced as eMarketer is prohibited without prior, written permission.Note: all data in this report (other than that sourced as eMarketer) was obtained from published, publicly available information.
67
The IT Spending Report
Methodology
Worldwide IT Spending
North America
Europe
Asia-Pacific
Latin America
IT Spending by Industry
IT Spendingby Business Size
IT Budgeting andSpending Surveys
Index of Charts
B. IT Spending Growth Rates in EuropeLooking at past technology growth rates in Europe, WITSA estimates thatICT spending grew at a rate of 5.7% in Western Europe between 1998 and1999. Global Industry Analysts estimates that overall European ITequipment spending grew at a rate of 8.24% in 2000.
At the midpoint of 2001, IDC estimated that overall IT spending inWestern Europe would grow by 11% for the year, with a worst-casescenario growth rate of 7.4%. As part of its analysis, the research firmnoted that Germany and Italy would have the greatest downward impacton European spending, while PC and networking equipment spending hadalready been significantly reduced in Europe. Looking to the future, IDCpredicted that software sales would lead the IT market out of the downturn,growing at a rate of 15% over the next four years.
Government spending on information technology was also anticipated tohave a positive effect on the European IT market. In a study conducted byComputer Weekly in mid-2001, it was found that government spending oninformation technology in the UK was expected to grow at a rate of 13%through 2003. The healthcare sector was expected to see the greatestamount of government support.
Immediately following the terrorist attacks on the United States, IDCwent to its worst case scenario for IT spending in Europe, projecting that itwould grow at a rate of 7.4% in 2001, and decline to 6.5% growth in 2002.Recovery was expected to occur sharply however, as IT spending wasforecast to jump from 8% to 11.5% growth between 2003 and 2004.
"Worst Case Scenario" IT Spending Growth in Europe,2000-2004
2000 12.0%
2001 7.4%
2002 6.5%
2003 8.0%
2004 11.5%
Note: *After 9/11/2001 AttacksSource: International Data Corporation (IDC), September 2001
032700 ©2001 eMarketer, Inc. www.eMarketer.com

©2001 eMarketer, Inc. Reproduction of information sourced as eMarketer is prohibited without prior, written permission.Note: all data in this report (other than that sourced as eMarketer) was obtained from published, publicly available information.
68
The IT Spending Report
Methodology
Worldwide IT Spending
North America
Europe
Asia-Pacific
Latin America
IT Spending by Industry
IT Spendingby Business Size
IT Budgeting andSpending Surveys
Index of Charts
After its initial decision to go with its worst-case scenario forecast, IDC hasrevised its forecast for Europe again. IT spending is now expected toincrease at a lower 5.7% growth rate in 2001, and recover to 6.4% growthin 2002. IDC has improved its growth forecast for 2003 to 8.6%, althoughthe research firm has warned that its estimates are subject to revision in theevent of further economic decline.
Revised IT Spending Growth Rates for WesternEurope, 2000-2003
2000 12.0%
2001 5.7%
2002 6.4%
2003 8.6%
Source: International Data Corp. (IDC), October 11, 2001
033485 ©2001 eMarketer, Inc. www.eMarketer.com

©2001 eMarketer, Inc. Reproduction of information sourced as eMarketer is prohibited without prior, written permission.Note: all data in this report (other than that sourced as eMarketer) was obtained from published, publicly available information.
69
The IT Spending Report
Methodology
Worldwide IT Spending
North America
Europe
Asia-Pacific
Latin America
IT Spending by Industry
IT Spendingby Business Size
IT Budgeting andSpending Surveys
Index of Charts
On the positive side, e-business initiatives are expected to make asignificant contribution to overall IT spending in Europe, with countriesprojected to spend billions of dollars over the next four years. IDC hasidentified the leading European countries that will spend the most over the2001 to 2004 period, with the UK, France and Germany taking the lead.
Leading European Countries' Aggregate Spending onE-Business Technology, 2001-2004 (in billions)
UK
$361.80
France
$285.80
Germany
$285.80
Italy
$193.89
Spain
$77.41
Sweden
$67.85
Netherlands
$66.35
Denmark
$44.80
Norway
$41.28
Belgium
$40.36
Source: International Data Corporation (IDC), 2001
033593 ©2001 eMarketer, Inc. www.eMarketer.com

©2001 eMarketer, Inc. Reproduction of information sourced as eMarketer is prohibited without prior, written permission.Note: all data in this report (other than that sourced as eMarketer) was obtained from published, publicly available information.
70
The IT Spending Report
Methodology
Worldwide IT Spending
North America
Europe
Asia-Pacific
Latin America
IT Spending by Industry
IT Spendingby Business Size
IT Budgeting andSpending Surveys
Index of Charts
C. IT Budgeting in EuropeHistorical data collected from Computer Sciences Corporation’s (CSC)annual IT executive surveys show that IT spending has stayed relativelyconstant over the past several years in Europe. In contrast to their NorthAmerican counterparts, whose budgets have rarely exceeded 3% ofcompany revenues, European companies’ IT budgets are slightly higher,according to CSC’s surveys.
2.0%
2.6%
2.2%
3.1%
3.5%
2.7%
2.0%
3.4%
2.4%
3.7%
European Companies' Information Systems Budgets,1991-2000 (as a % of revenues)
1991 1992 1993 1994 1995 1996 1997 1998 1999 2000
3.5
2.5
Source: Computer Sciences Corporation (CSC), 2001
032711 ©2001 eMarketer, Inc. www.eMarketer.com

©2001 eMarketer, Inc. Reproduction of information sourced as eMarketer is prohibited without prior, written permission.Note: all data in this report (other than that sourced as eMarketer) was obtained from published, publicly available information.
71
The IT Spending Report
Methodology
Worldwide IT Spending
North America
Europe
Asia-Pacific
Latin America
IT Spending by Industry
IT Spendingby Business Size
IT Budgeting andSpending Surveys
Index of Charts
A combination of economic growth and pre-Y2K preparations led to asignificant jump in IT budget growth rates in 1998 and 1999. However, bythe year 2000 IT budget growth rates had moderated to more typicalhistorical levels, apparently less-affected by the dot com-inducedacceleration of expenditures that was experienced in the United States.
Breaking down IT budget allocations, European budgets have followed ITspending patterns in other regions, with hardware and staffing needscomprising the greater part of spending. Compared with North Americanbusinesses, European allocations toward telecommunications are lower at13%, versus 19% in the United States and Canada.
9.1%
3.9%
5.8%
9.0%
3.7%
European Companies' Information Systems BudgetGrowth Rates, 1991-2000
1991 1992
5.2%
1993
0.4%
1994
1.2%
1995
3.1%
1996
3.7%
1997 1998 1999 2000
5
10
Source: Computer Sciences Corporation (CSC), 2001
032707 ©2001 eMarketer, Inc. www.eMarketer.com
Other 4%
User support
11%
Telecommunications 13%
Application development/ maintenance
23%
Human resources 22%
Hardware/ software 27%
European Companies' Information Systems BudgetAllocation, 2000
Source: Computer Sciences Corporation (CSC), 2001
032703 ©2001 eMarketer, Inc. www.eMarketer.com


IVMethodology
I Worldwide IT Spending
II North America
III Europe
IV Asia-Pacific 73
A. Asia-Pacific IT Spending Forecasts 74
B. IT Spending Growth Rates in the Asia-Pacific Region 78
C. IT Budgetting in the Asia-Pacific Region 82
V Latin America
VI IT Spending by Industry
VII IT Spending by Business Size
VIII IT Budgeting and Spending Surveys
Index of Charts
©2001 eMarketer, Inc. Reproduction of information sourced as eMarketer is prohibited without prior, written permission.Note: all data in this report (other than that sourced as eMarketer) was obtained from published, publicly available information.
73
The IT Spending Report

©2001 eMarketer, Inc. Reproduction of information sourced as eMarketer is prohibited without prior, written permission.Note: all data in this report (other than that sourced as eMarketer) was obtained from published, publicly available information.
74
The IT Spending Report
Methodology
Worldwide IT Spending
North America
Europe
Asia-Pacific
Latin America
IT Spending by Industry
IT Spendingby Business Size
IT Budgeting andSpending Surveys
Index of Charts
A.Asia-Pacific IT Spending ForecastsIT spending in the Asia-Pacific region is estimated by the Aberdeen Groupto grow from $255.03 billion in 2001 to $392.64 billion by 2005. The Asia-Pacific region, including Japan, accounts for 20.8% of worldwidetechnology spending in 2001. It is expected to significantly increase itsshare to 22.5% by 2005.
Among the top five countries in the region, Japan is by far the IT spendingleader with a 57.6% share of the Asia-Pacific market in 2001, and a 12.1%share of global IT spending. China is a strong and rapidly-growing secondmarket, however, and is expected to increase its share of Asia-Pacific ITspending from 12.9% in 2001 to 29.3% in 2005. In 2001, India and SouthKorea account for 6.0% and 5.3% of the Asia-Pacific market, respectively.
IT Spending Forecast for the Asia-Pacific Region,2001-2005 (in billions)
2001 $255.03
2002 $282.32
2003 $314.28
2004 $350.98
2005 $392.64
Source: Aberdeen Group, 2001
030046 ©2001 eMarketer, Inc. www.eMarketer.com
Information Technology Spending in LeadingAsia-Pacific Markets, 2001-2005 (in billions)
2001 2002 2003 2004 2005
Australia $13.0 $14.7 $16.7 $18.9 $21.2
Republic of Korea $13.6 $15.1 $16.7 $18.4 $20.4
India $15.4 $19.5 $24.4 $30.4 $37.7
China $33.1 $40.9 $50.7 $62.3 $74.7
Japan $146.9 $155.7 $165.4 $176.2 $188.5
Source: Aberdeen Group, 2001
033082 ©2001 eMarketer, Inc. www.eMarketer.com
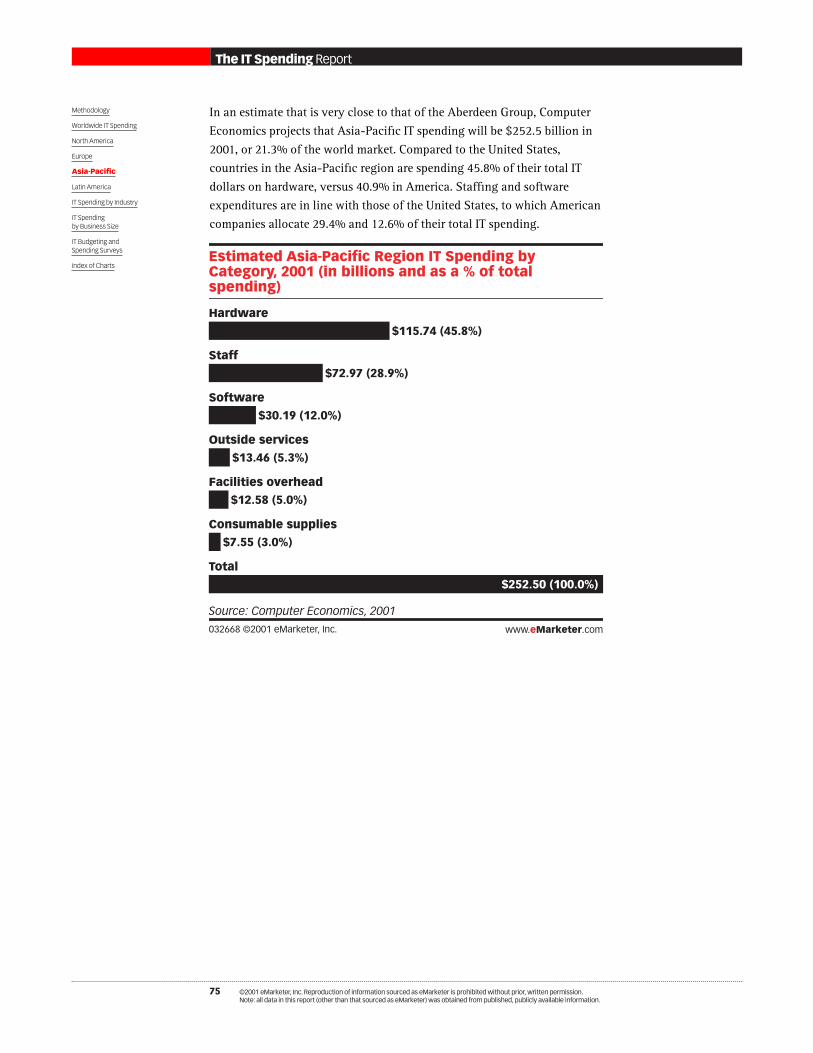
©2001 eMarketer, Inc. Reproduction of information sourced as eMarketer is prohibited without prior, written permission.Note: all data in this report (other than that sourced as eMarketer) was obtained from published, publicly available information.
75
The IT Spending Report
Methodology
Worldwide IT Spending
North America
Europe
Asia-Pacific
Latin America
IT Spending by Industry
IT Spendingby Business Size
IT Budgeting andSpending Surveys
Index of Charts
In an estimate that is very close to that of the Aberdeen Group, ComputerEconomics projects that Asia-Pacific IT spending will be $252.5 billion in2001, or 21.3% of the world market. Compared to the United States,countries in the Asia-Pacific region are spending 45.8% of their total ITdollars on hardware, versus 40.9% in America. Staffing and softwareexpenditures are in line with those of the United States, to which Americancompanies allocate 29.4% and 12.6% of their total IT spending.
Estimated Asia-Pacific Region IT Spending byCategory, 2001 (in billions and as a % of totalspending)
Hardware
$115.74 (45.8%)
Staff
$72.97 (28.9%)
Software
$30.19 (12.0%)
Outside services
$13.46 (5.3%)
Facilities overhead
$12.58 (5.0%)
Consumable supplies
$7.55 (3.0%)
Total
$252.50 (100.0%)
Source: Computer Economics, 2001
032668 ©2001 eMarketer, Inc. www.eMarketer.com

©2001 eMarketer, Inc. Reproduction of information sourced as eMarketer is prohibited without prior, written permission.Note: all data in this report (other than that sourced as eMarketer) was obtained from published, publicly available information.
76
The IT Spending Report
Methodology
Worldwide IT Spending
North America
Europe
Asia-Pacific
Latin America
IT Spending by Industry
IT Spendingby Business Size
IT Budgeting andSpending Surveys
Index of Charts
A third estimate by Global Industry Analysts forecasts that the morenarrowly-defined IT equipment market in the Asia Pacific region will see$75.41 billion in sales in 2001. When spending in Japan is added, thismarket is estimated to be worth $180.98 billion in 2001, growing to reach$256.78 billion by 2005.
IT equipment spending in the Asia-Pacific region (excluding Japan) isexpected to grow at an 11.68% compound annual rate between 1999 and2005, versus a 9.02% CAGR in Japan. Compared to the United States andEurope where computer equipment accounts for 60.8% and 65.3% of totalIT equipment spending, spending on computer equipment in Asia is higherat 69.8%.
IT Equipment Spending in Asia-Pacific Region*,2001-2005 (in billions)
2001 $75.41
2002 $83.74
2003 $92.79
2004 $102.18
2005 $111.85
Note: *excluding JapanSource: Global Industry Analysts, 2001
032997 ©2001 eMarketer, Inc. www.eMarketer.com
IT Equipment Spending in Japan, 2001-2005 (inbillions)
2001 $105.57
2002 $114.83
2003 $124.11
2004 $133.79
2005 $144.93
Source: Global Industry Analysts, 2001
032995 ©2001 eMarketer, Inc. www.eMarketer.com

©2001 eMarketer, Inc. Reproduction of information sourced as eMarketer is prohibited without prior, written permission.Note: all data in this report (other than that sourced as eMarketer) was obtained from published, publicly available information.
77
The IT Spending Report
Methodology
Worldwide IT Spending
North America
Europe
Asia-Pacific
Latin America
IT Spending by Industry
IT Spendingby Business Size
IT Budgeting andSpending Surveys
Index of Charts
Asian companies spent just 21.0% of their IT equipment budgets ontelecommunications in 1999, versus 23.3% in Europe and 26.9% in theUnited States.
Using another narrow definition of IT spending that excludes labor costsand overhead, IDC has estimated that technology spending in the Asia-Pacific region (excluding Japan) will grow from $66.2 billion in 2000 to$106.34 billion by 2003.
IDC breaks down IT spending by showing that hardware accounts for thelargest portion of spending on IT in the Asia-Pacific region, and is expectedto grow at a CAGR of approximately 50% over the next two years through2003. Software and services form the other two segments of IDC’sbreakdown of IT spending, with the services market projected to grow at aCAGR of almost 23% through 2005.
Breakdown of IT Equipment Spending in Asia, byCategory, 1999 (in billions and as a % of total)
Computer equipment $100.43 (69.8%)
Telecom equipment $30.21 (21.0%)
Business equipment $13.29 (9.2%)
Total $143.93 (100.0%)
Source: Global Industry Analysts, 2001
033009 ©2001 eMarketer, Inc. www.eMarketer.com
Breakdown of IT Spending in the Asia-Pacific Region*,by Category, 2000 & 2003 (in billions)
Hardware
$44.70
$66.74
Software
$7.20
$13.90
Services
$14.30
$25.70
Total
$66.20
$106.34
2000 2003
Note: *excluding JapanSource: International Data Corporation (IDC), 2001
032955 ©2001 eMarketer, Inc. www.eMarketer.com
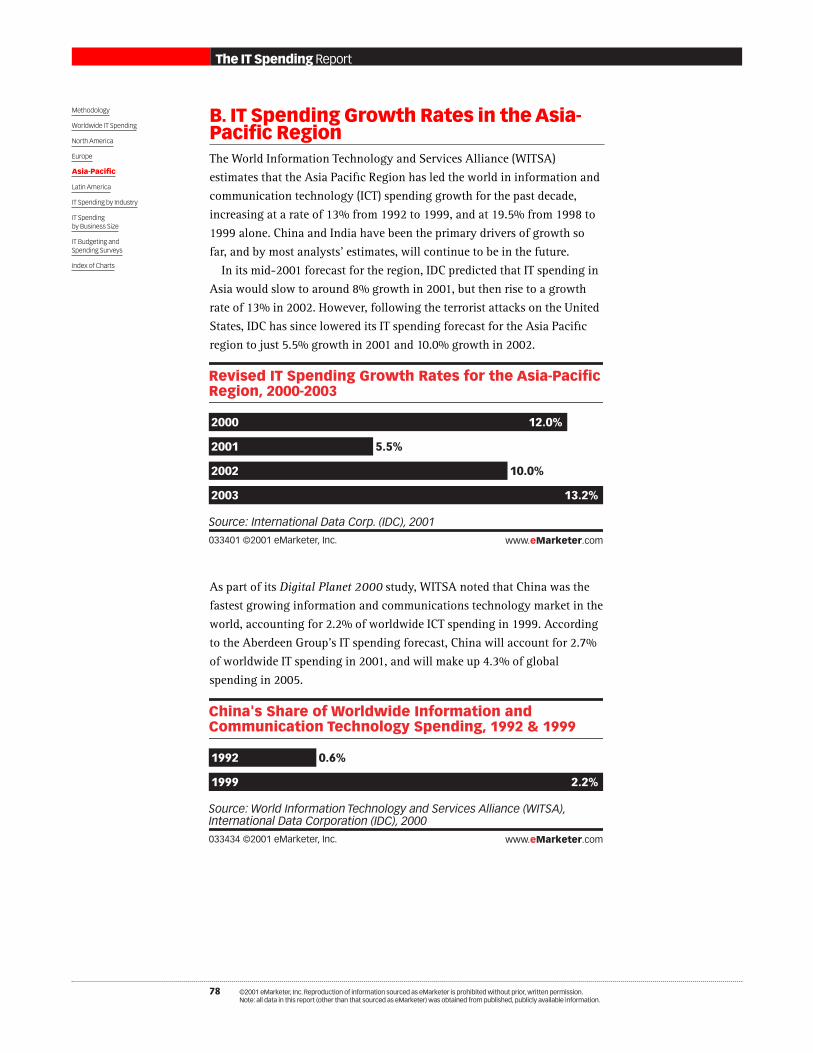
©2001 eMarketer, Inc. Reproduction of information sourced as eMarketer is prohibited without prior, written permission.Note: all data in this report (other than that sourced as eMarketer) was obtained from published, publicly available information.
78
The IT Spending Report
Methodology
Worldwide IT Spending
North America
Europe
Asia-Pacific
Latin America
IT Spending by Industry
IT Spendingby Business Size
IT Budgeting andSpending Surveys
Index of Charts
B. IT Spending Growth Rates in the Asia-Pacific RegionThe World Information Technology and Services Alliance (WITSA)estimates that the Asia Pacific Region has led the world in information andcommunication technology (ICT) spending growth for the past decade,increasing at a rate of 13% from 1992 to 1999, and at 19.5% from 1998 to1999 alone. China and India have been the primary drivers of growth sofar, and by most analysts’ estimates, will continue to be in the future.
In its mid-2001 forecast for the region, IDC predicted that IT spending inAsia would slow to around 8% growth in 2001, but then rise to a growthrate of 13% in 2002. However, following the terrorist attacks on the UnitedStates, IDC has since lowered its IT spending forecast for the Asia Pacificregion to just 5.5% growth in 2001 and 10.0% growth in 2002.
As part of its Digital Planet 2000 study, WITSA noted that China was thefastest growing information and communications technology market in theworld, accounting for 2.2% of worldwide ICT spending in 1999. Accordingto the Aberdeen Group’s IT spending forecast, China will account for 2.7%of worldwide IT spending in 2001, and will make up 4.3% of globalspending in 2005.
Revised IT Spending Growth Rates for the Asia-PacificRegion, 2000-2003
2000 12.0%
2001 5.5%
2002 10.0%
2003 13.2%
Source: International Data Corp. (IDC), 2001
033401 ©2001 eMarketer, Inc. www.eMarketer.com
China's Share of Worldwide Information andCommunication Technology Spending, 1992 & 1999
1992 0.6%
1999 2.2%
Source: World Information Technology and Services Alliance (WITSA), International Data Corporation (IDC), 2000
033434 ©2001 eMarketer, Inc. www.eMarketer.com

©2001 eMarketer, Inc. Reproduction of information sourced as eMarketer is prohibited without prior, written permission.Note: all data in this report (other than that sourced as eMarketer) was obtained from published, publicly available information.
79
The IT Spending Report
Methodology
Worldwide IT Spending
North America
Europe
Asia-Pacific
Latin America
IT Spending by Industry
IT Spendingby Business Size
IT Budgeting andSpending Surveys
Index of Charts
IDC’s independent analysis strongly supports WITSA’s findings, with theresearch firm predicting that spending on IT services in China will grow ata staggering rate of 350% between 2000 and 2003. Software spending willalso grow at a significantly high rate of 190%.
By the year 2003, IDC predicts that the second largest market for IT productsand services in the Asia-Pacific region (excluding Japan) will be SouthKorea. IT spending was $12.3 billion in South Korea in the year 2000.
Breakdown of IT Spending in China, by Category ,2000 & 2003 (in billions)
Hardware
$14.30
$26.85
Software
$1.06
$3.08
Services
$0.94
$3.90
Total
$16.30
$33.83
2000 2003
Source: International Data Corporation (IDC), 2001
032956 ©2001 eMarketer, Inc. www.eMarketer.com
Breakdown of IT Spending in South Korea, byCategory, 2003 (in billions)
Hardware $12.00
Software $1.60
Services $4.70
Total $18.30
Source: International Data Corporation (IDC), 2001
032958 ©2001 eMarketer, Inc. www.eMarketer.com
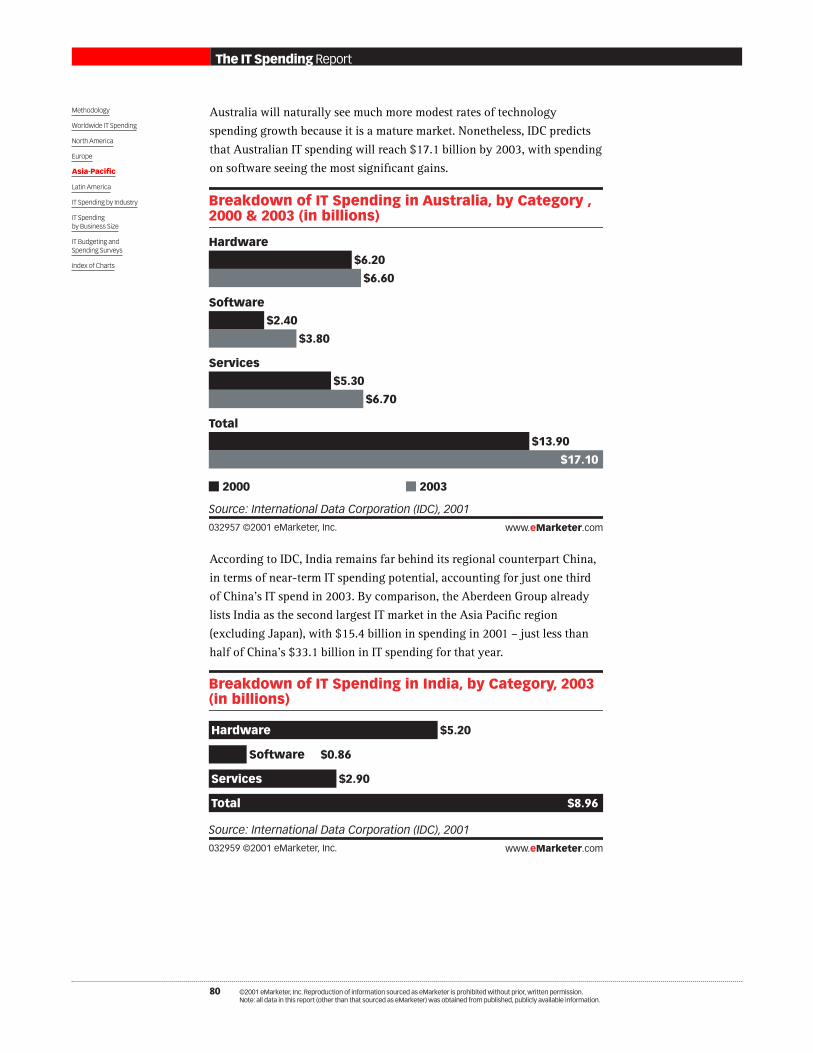
©2001 eMarketer, Inc. Reproduction of information sourced as eMarketer is prohibited without prior, written permission.Note: all data in this report (other than that sourced as eMarketer) was obtained from published, publicly available information.
80
The IT Spending Report
Methodology
Worldwide IT Spending
North America
Europe
Asia-Pacific
Latin America
IT Spending by Industry
IT Spendingby Business Size
IT Budgeting andSpending Surveys
Index of Charts
Australia will naturally see much more modest rates of technologyspending growth because it is a mature market. Nonetheless, IDC predictsthat Australian IT spending will reach $17.1 billion by 2003, with spendingon software seeing the most significant gains.
According to IDC, India remains far behind its regional counterpart China,in terms of near-term IT spending potential, accounting for just one thirdof China’s IT spend in 2003. By comparison, the Aberdeen Group alreadylists India as the second largest IT market in the Asia Pacific region(excluding Japan), with $15.4 billion in spending in 2001 – just less thanhalf of China’s $33.1 billion in IT spending for that year.
Breakdown of IT Spending in Australia, by Category ,2000 & 2003 (in billions)
Hardware
$6.20
$6.60
Software
$2.40
$3.80
Services
$5.30
$6.70
Total
$13.90
$17.10
2000 2003
Source: International Data Corporation (IDC), 2001
032957 ©2001 eMarketer, Inc. www.eMarketer.com
Breakdown of IT Spending in India, by Category, 2003(in billions)
Hardware $5.20
Software $0.86
Services $2.90
Total $8.96
Source: International Data Corporation (IDC), 2001
032959 ©2001 eMarketer, Inc. www.eMarketer.com

©2001 eMarketer, Inc. Reproduction of information sourced as eMarketer is prohibited without prior, written permission.Note: all data in this report (other than that sourced as eMarketer) was obtained from published, publicly available information.
81
The IT Spending Report
Methodology
Worldwide IT Spending
North America
Europe
Asia-Pacific
Latin America
IT Spending by Industry
IT Spendingby Business Size
IT Budgeting andSpending Surveys
Index of Charts
Singapore and Hong Kong are by many standards considered to be matureinformation technology markets. Although they both have high PCpenetration rates and developed telecommunications infrastructures, IDCexpects Hong Kong and Singapore to continue to significantly increasetheir IT spending through 2005.
IT spending in Singapore is projected to grow at a CAGR of 13.2%between 2000 and 2005, to reach $6.1 billion, while Hong Kong will see aCAGR of 9.8% over the same period, with IT spending reaching $4.9 billion.As the largest of the three markets, technology spending in Taiwan willhave already surpassed $6.4 billion in IT spending by 2003.
Estimated IT Spending in Taiwan, Singapore and HongKong, 2000 & 2003 (in billions)
Taiwan
$4.50
$6.40
Singapore
$3.30
$4.80
Hong Kong
$3.10
$4.00
2000 2003
Source: International Data Corporation (IDC), 2001
032961 ©2001 eMarketer, Inc. www.eMarketer.com

©2001 eMarketer, Inc. Reproduction of information sourced as eMarketer is prohibited without prior, written permission.Note: all data in this report (other than that sourced as eMarketer) was obtained from published, publicly available information.
82
The IT Spending Report
Methodology
Worldwide IT Spending
North America
Europe
Asia-Pacific
Latin America
IT Spending by Industry
IT Spendingby Business Size
IT Budgeting andSpending Surveys
Index of Charts
C. IT Budgeting in the Asia-Pacific RegionThe Computer Sciences Corporation’s (CSC) annual survey of IT executiveshas found that, on average, Asian companies dedicated a substantial 5.7%share of company revenues to their information technology budgets in2000. This compares with 4.9% of revenues for North American companiesand 3.7% of revenues for European firms in 2000. As with other worldregions, year-2000 preparations and internet initiatives explain theincrease in spending for 1999 and 2000.
While the Asian economic crisis clearly had a significant impact on ITspending in 1998, even more astonishing is the 26.4% growth rate for ITbudgets in 2000 by Asian companies. By comparison, IT budgets grew at arate of 7.7% in Australia and New Zealand during the year 2000, whileNorth American companies’ IT budgets grew at a rate of 7.1%.
3.4%
3.5%
4.7%
5.7%
Asian Companies' Information Systems Budgets,1997-2000 (as a % of revenues)
1997 1998 1999 2000
4
6
Source: Computer Sciences Corporation (CSC), 2001
032712 ©2001 eMarketer, Inc. www.eMarketer.com
For additional information
about IT budgeting trends
in Australia and New
Zealand, additional charts
are available from the CSC
Study in the eStat
Database

©2001 eMarketer, Inc. Reproduction of information sourced as eMarketer is prohibited without prior, written permission.Note: all data in this report (other than that sourced as eMarketer) was obtained from published, publicly available information.
83
The IT Spending Report
Methodology
Worldwide IT Spending
North America
Europe
Asia-Pacific
Latin America
IT Spending by Industry
IT Spendingby Business Size
IT Budgeting andSpending Surveys
Index of Charts
Looking at the numbers behind IT spending in the Asia-Pacific region, it isapparent that Asian companies are aggressively working to catch up totheir global competitors by building out their IT infrastructure. Hardwareand software spending as a portion of IT budgets was much higher in Asiaat 36% of total spending in 2000, compared with 27% in Europe and 23%in North America.
IDC goes on to estimate that in the year 2000, hardware productsaccounted for as much as 50% of total IT spending in Singapore, and 70%of IT spending in Hong Kong.
5.0%
12.4%
26.4%
Asian Companies' Information Systems BudgetGrowth Rates, 1997-2000
1997 1998 1999 2000
25
15
Source: Computer Sciences Corporation (CSC), 2001
032708 ©2001 eMarketer, Inc. www.eMarketer.com
14.5%
Other 2%
User support
9%
Telecommunications 12%
Application development/ maintenance 24%
Human resources 17%
Hardware/ software 36%
Asian Companies' Information Systems BudgetAllocation, 2000
Source: Computer Sciences Corporation (CSC), 2001
032704 ©2001 eMarketer, Inc. www.eMarketer.com

©2001 eMarketer, Inc. Reproduction of information sourced as eMarketer is prohibited without prior, written permission.Note: all data in this report (other than that sourced as eMarketer) was obtained from published, publicly available information.
84
The IT Spending Report
Methodology
Worldwide IT Spending
North America
Europe
Asia-Pacific
Latin America
IT Spending by Industry
IT Spendingby Business Size
IT Budgeting andSpending Surveys
Index of Charts
The determined build-out of IT systems in Asia is expected to continue aswell, with Japanese companies set to increase IT spending, despitepersistent economic trouble in Japan. Almost two-thirds of the 87 largeJapanese enterprises surveyed by the Nihon Keizai Shimbun in mid-2001said that they were raising their IT spending during the current fiscal year,while just 17% said they were reducing their budgets.
Compared with an overall business capital spending growth rate of 5%, ITspending was expected to grow by 14.2%. During the previous fiscal year,IT spending increased 18.5%, and accounted for 14% of total businesscapital spending. For the current year, IT was expected to account for 16%of capital spending in Japan.
A full 69% of survey respondents cited the need for internationalcompetitiveness as the primary reason for continued increases in their ITbudgets. Several companies planned on implementing business softwaresolutions, focusing upon supply chain management (SCM) or customerrelationship management (CRM) systems.
Decrease IT Spending
20%
Maintain IT Spending
17%
Increase IT Spending 62%
Japanese Companies' IT Spending Intentions, July2001
Source: The Nihon Keizai Shimbun, 2001
032618 ©2001 eMarketer, Inc. www.eMarketer.com

V
Methodology
I Worldwide IT Spending
II North America
III Europe
IV Asia-Pacific
V Latin America 85
A. Latin American IT Spending Forecasts 86
B. IT Spending Growth Rates in Latin America 88
VI IT Spending by Industry
VII IT Spending by Business Size
VIII IT Budgeting and Spending Surveys
Index of Charts
©2001 eMarketer, Inc. Reproduction of information sourced as eMarketer is prohibited without prior, written permission.Note: all data in this report (other than that sourced as eMarketer) was obtained from published, publicly available information.
85
The IT Spending Report

©2001 eMarketer, Inc. Reproduction of information sourced as eMarketer is prohibited without prior, written permission.Note: all data in this report (other than that sourced as eMarketer) was obtained from published, publicly available information.
86
The IT Spending Report
Methodology
Worldwide IT Spending
North America
Europe
Asia-Pacific
Latin America
IT Spending by Industry
IT Spendingby Business Size
IT Budgeting andSpending Surveys
Index of Charts
A. Latin American IT Spending ForecastsAfter the Asia Pacific region, Latin America is the most rapidly-growinginformation technology market in the world. In 2001, Latin American ITspending accounted for 5.6% of the global IT market, while it is set to reach6.1% by 2005.
Brazil is the largest IT market in Latin America with a 37.5% share in 2001,accounting for 2.1% of global IT spending, according to the AberdeenGroup. Brazil is followed by Mexico at 23.4% of the Latin American marketand Argentina with a 13.9% share in 2001. By 2005, Mexico is expected torapidly catch up and account for 28.5% of Latin American IT spending,behind Brazil at 34.5% of the market and ahead of Argentina at 13.1%.
IT Spending Forecast for Latin America, 2001-2005 (inbillions)
2001 $67.80
2002 $75.53
2003 $84.73
2004 $95.23
2005 $107.43
Source: Aberdeen Group, 2001
030031 ©2001 eMarketer, Inc. www.eMarketer.com
Information Technology Spending in Selected LatinAmerican Countries, 2001-2005 (in billions)
2001 2002 2003 2004 2005
Peru $1.91 $2.13 $2.37 $2.62 $2.89
Chile $2.38 $2.82 $3.34 $3.92 $4.59
Colombia $2.96 $3.07 $3.20 $3.39 $3.59
Venezuela $3.47 $3.77 $4.20 $4.58 $5.06
Argentina $9.42 $10.34 $11.36 $12.61 $14.06
Mexico $15.88 $18.65 $22.06 $26.03 $30.65
Brazil $25.41 $27.76 $30.47 $33.52 $37.04
Source: Aberdeen Group, May 2001
030032 ©2001 eMarketer, Inc. www.eMarketer.com

©2001 eMarketer, Inc. Reproduction of information sourced as eMarketer is prohibited without prior, written permission.Note: all data in this report (other than that sourced as eMarketer) was obtained from published, publicly available information.
87
The IT Spending Report
Methodology
Worldwide IT Spending
North America
Europe
Asia-Pacific
Latin America
IT Spending by Industry
IT Spendingby Business Size
IT Budgeting andSpending Surveys
Index of Charts
In a comparative estimate of IT spending in Latin America, ComputerEconomics estimates that $44.45 billion will be spent in the region during2001. Broken down by technology category, hardware will make up asignificant 48.9% of IT spending, followed by staffing at 25.9% of IT-related expenditures. This is in line with hardware spending in Asia, whichaccounts for 45.8% of total IT spending there.
Looking at Global Industry Analysts’ narrower forecast for the IT equipmentmarket, Latin America is expected to spend $33.94 billion in 2005 andaccount for a 2.37% share of global spending by then – up from a 1.95%share in 1999. After the Asia Pacific region’s 11.68% CAGR, Latin America isprojected to be the fastest-growing region for IT equipment spending in theworld with a CAGR of 9.94% between the years 1999 and 2005.
Estimated Latin American IT Spending by Category,2001 (in billions and as a % of total spending)
Hardware
$21.72 (48.9%)
Staff
$11.52 (25.9%)
Software
$5.76 (13.0%)
Outside services
$1.90 (4.3%)
Facilities overhead
$1.33 (3.0%)
Consumable supplies
$2.22 (5.0%)
Total
$44.45 (100.0%)
Source: Computer Economics, 2001
032669 ©2001 eMarketer, Inc. www.eMarketer.com
IT Equipment Spending in Latin America, 2001-2005 (inbillions)
2001 $24.18
2002 $26.81
2003 $29.25
2004 $31.47
2005 $33.94
Source: Global Industry Analysts, 2001
032996 ©2001 eMarketer, Inc. www.eMarketer.com

©2001 eMarketer, Inc. Reproduction of information sourced as eMarketer is prohibited without prior, written permission.Note: all data in this report (other than that sourced as eMarketer) was obtained from published, publicly available information.
88
The IT Spending Report
Methodology
Worldwide IT Spending
North America
Europe
Asia-Pacific
Latin America
IT Spending by Industry
IT Spendingby Business Size
IT Budgeting andSpending Surveys
Index of Charts
As a percent of the world market for telecommunications equipment in1999, Latin America held a 2.5% share. The region had a 1.7% portion ofthe world market for computer equipment, with this category accountingfor the greatest share of the overall IT equipment market in Latin Americaat 55.2%.
B. IT Spending Growth Rates in LatinAmericaAccording to estimates from the World Information Technology andServices Alliance (WITSA), information and communications technology(ICT) spending in Latin America grew at a rate of 12.7% from 1998 to 1999.
At the mid-point of 2001, IDC estimated that IT spending in LatinAmerica would grow at a rate of 11% in 2001, however this has since beenscaled back to a best-case scenario growth rate of 6% for the year. Theeconomic slowdown in the United States has had a particularly strongimpact on most Latin American economies and subsequently upon ITspending.
Survey data show that spending on internet initiatives is one of themajor drivers for IT spending in Latin America. As a percent of IT budgets,e-business spending has gone from 16.2% in 2000 to almost 21% in 2001.According to IDC, the leading vertical market that is spending the most oninternet initiatives is the manufacturing industry, accounting for anaverage 25% of most companies’ IT budgets.
Breakdown of IT Equipment Spending in LatinAmerica, by Category, 1999 (in billions and as a % oftotal)
Computer equipment $10.65 (55.2%)
Telecom equipment $6.11 (31.7%)
Business equipment $2.52 (13.1%)
Total $19.28 (100.0%)
Source: Global Industry Analysts, 2001
033010 ©2001 eMarketer, Inc. www.eMarketer.com
Percent of Latin American Companies' IT BudgetsSpent on Internet Initiatives, 2000 & 2001
2000 16.2%
2001 20.9%
Source: International Data Corporation (IDC), 2001
032970 ©2001 eMarketer, Inc. www.eMarketer.com

VI
Methodology
I Worldwide IT Spending
II North America
III Europe
IV Asia-Pacific
V Latin America
VI IT Spending by Industry 89
VII IT Spending by Business Size
VIII IT Budgeting and Spending Surveys
Index of Charts
©2001 eMarketer, Inc. Reproduction of information sourced as eMarketer is prohibited without prior, written permission.Note: all data in this report (other than that sourced as eMarketer) was obtained from published, publicly available information.
89
The IT Spending Report

©2001 eMarketer, Inc. Reproduction of information sourced as eMarketer is prohibited without prior, written permission.Note: all data in this report (other than that sourced as eMarketer) was obtained from published, publicly available information.
90
The IT Spending Report
Methodology
Worldwide IT Spending
North America
Europe
Asia-Pacific
Latin America
IT Spending by Industry
IT Spendingby Business Size
IT Budgeting andSpending Surveys
Index of Charts
Coverage of IT spending by industry reveals that definitional differencesfor industry categories can have a significant impact on the ranking of ITspending estimates. However, patterns do emerge that typically placefinancial services, telecommunications, discrete manufacturing andgovernment at the top of most IT spending forecasts. By contrast, thenatural resources, construction, and utilities industries are typically nearthe bottom of most industry rankings.
Data on US industries is much more robust and readily available thanthat for other world markets, and it should be noted that in many global ITspending forecasts, American spending will often be given the heaviestweighting.
IDC breaks out worldwide IT spending by industry, finding that discretemanufacturing, banking, and government are the three largest verticalmarkets for technology products. In 2003, discrete manufacturing isexpected to account for 14.4% of global IT spending, with banking taking a12.7% share and government representing 9.7% of the market.
Consumer spending is estimated to have accounted for 5.46% of globalIT spending in 2000, and is expected to remain constant, holding 5.5% ofthe world market in 2003.
Worldwide IT Spending, by Industry, 2000 & 2003 (inbillions)
2000 2003
Discrete manufacturing $136.44 $181.56
Banking $119.90 $160.39
Government $93.61 $123.04
Communications & media $78.72 $103.88
Process manufacturing $74.32 $101.92
Services industry $73.59 $99.93
Retail $55.10 $72.74
Consumers $51.89 $70.09
Insurance $44.23 $60.17
Financial $39.44 $55.18
Wholesale trade $38.72 $50.26
Transportation $29.96 $40.04
Utilities $29.25 $38.48
Education $27.13 $35.11
Healthcare $25.88 $34.34
Resources industry $19.45 $25.31
Construction $12.29 $15.21
Total $949.90 $1,267.65
Source: International Data Corporation (IDC), 2000
032964 ©2001 eMarketer, Inc. www.eMarketer.com

©2001 eMarketer, Inc. Reproduction of information sourced as eMarketer is prohibited without prior, written permission.Note: all data in this report (other than that sourced as eMarketer) was obtained from published, publicly available information.
91
The IT Spending Report
Methodology
Worldwide IT Spending
North America
Europe
Asia-Pacific
Latin America
IT Spending by Industry
IT Spendingby Business Size
IT Budgeting andSpending Surveys
Index of Charts
According to analysis by the Precursor Group, the financial servicesindustry in the United States spent $70 billion on IT products and servicesin 1999, compared with $61.7 billion by the communications servicesindustry and $56.9 billion by US manufacturing companies. However,transportation and business services industries have posted the highestrates of growth in IT spending, according to the research firm.
US IT Spending, by Industry, 1999 (in billions)
Financial services $70.0
Communications services $61.7
Manufacturing $56.9
Wholesale $50.1
Business services $41.2
Retail $18.7
Real estate $17.1
Transportation $16.8
Source: The Precursor Group, 2001
033486 ©2001 eMarketer, Inc. www.eMarketer.com

©2001 eMarketer, Inc. Reproduction of information sourced as eMarketer is prohibited without prior, written permission.Note: all data in this report (other than that sourced as eMarketer) was obtained from published, publicly available information.
92
The IT Spending Report
Methodology
Worldwide IT Spending
North America
Europe
Asia-Pacific
Latin America
IT Spending by Industry
IT Spendingby Business Size
IT Budgeting andSpending Surveys
Index of Charts
A more comprehensive forecast by Computer Economics includes data on17 different industry segments of the US economy, with federalgovernment IT spending broken out along with data for state and localgovernment as well. Taken together, all three levels of government accountfor 20.9% of US non-consumer IT spending, according to ComputerEconomics.
Financial services and process manufacturing are the two other leadingindustries, followed by retail distribution and discrete manufacturing.
Estimated US IT Spending, by Industry, 2001 (inbillions and as a % of total spending)Industry Spending % of total
spending
Federal government $64.01 17.8%
Financial services $58.98 16.4%
Process manufacturing $55.35 15.4%
Retail distribution $33.85 9.4%
Discrete manufacturing $31.84 8.9%
Professional services $27.37 7.6%
Health services $20.93 5.8%
Wholesale distribution $17.94 5.0%
State and local government $11.06 3.1%
Insurance $9.66 2.7%
Communications $7.17 2.0%
Construction $5.82 1.6%
Utilities $5.14 1.4%
Transportation $4.87 1.4%
Hotels & lodging $3.42 1.0%
Natural resources $1.58 0.4%
Agriculture $0.21 0.03%
Total $359.08 100.0%
Source: Computer Economics, 2001
032666 ©2001 eMarketer, Inc. www.eMarketer.com
For IT Spending forecasts
by product category,
broken down by US
industry, an additional 17
charts are available from
the Computer Economics
study in the eStat
Database

©2001 eMarketer, Inc. Reproduction of information sourced as eMarketer is prohibited without prior, written permission.Note: all data in this report (other than that sourced as eMarketer) was obtained from published, publicly available information.
93
The IT Spending Report
Methodology
Worldwide IT Spending
North America
Europe
Asia-Pacific
Latin America
IT Spending by Industry
IT Spendingby Business Size
IT Budgeting andSpending Surveys
Index of Charts
In a survey of 300 companies that was conducted in the spring of 2001,investment bank Adams, Harkness & Hill attempted to gauge theanticipated change in IT budgets for several leading industries. Ranked byexpected growth for 2001, the retail industry surprisingly came in on top,with an average 10% increase anticipated for IT budgets over 2000. At thebottom of the list, telecommunications firms expected to see the slowestgrowth in their IT budgets, at just 2% for the year.
On September 20th 2001, the Meta Group published findings from itscomprehensive and ongoing IT spending survey of global 2000 companies.The research firm ranked average IT spending by industry, as a percent ofcompany revenues for 2000 and 2001. It should be noted that the 2001figures are for spending as of September 17th, and that spending estimatesfor 2001 and 2002 are very much subject to revision.
Average Percentage Change in IT Budgets Over PriorYear, by Industry, 2000 & 2001
2000 2001
Retail 11% 10%
Technology 11% 10%
Finance 12% 8%
Transportation 5% 8%
Other 7% 7%
Government 14% 6%
Manufacturing 14% 6%
Healthcare 15% 4%
Utilities 1% 4%
Telecommunications 7% 2%
Overall average 11% 7%
Source: Adams, Harkness & Hill, 2001
033454 ©2001 eMarketer, Inc. www.eMarketer.com

©2001 eMarketer, Inc. Reproduction of information sourced as eMarketer is prohibited without prior, written permission.Note: all data in this report (other than that sourced as eMarketer) was obtained from published, publicly available information.
94
The IT Spending Report
Methodology
Worldwide IT Spending
North America
Europe
Asia-Pacific
Latin America
IT Spending by Industry
IT Spendingby Business Size
IT Budgeting andSpending Surveys
Index of Charts
Consistent with the Meta Group’s 1999 data, financial institutions andtelecommunications companies remained the most IT-intensive industriesin 2000, spending an average 6.76% and 5.79% of company revenues oninformation technology. Both industries have slipped in 2001, however,with professional services firms spending the greatest portion of theirbudgets on IT so far.
Ranked by IT spending forecasts for 2002, the financial services andtelecommunications industries are expected to return to their top placeamong IT-spending leaders. However, only three industries are forecast topost year over year IT spending increases between 2002 and 2001 –financial institutions at 7% growth, transportation companies at 4%growth, and IT companies with 3% growth.
Global 2000 Company IT Spending, 2001 (as a % oftotal company spending)Financial institutions 6.76%
Telecommunications 5.79%
Professional services 5.11%
Healthcare 4.33%
Information technology 4.13%
Transportation 3.79%
Insurance 3.78%
Media 3.66%
Utilities 3.61%
Energy 3.56%
Consumer products manufacturers 3.52%
Electronics 3.14%
Chemicals 3.09%
Food and beverage processing 2.31%
Metals and natural resources 1.84%
Hospitality and travel 1.71%
Retail 1.64%
Construction and engineering 1.55%
Overall average 3.50%
Source: Meta Group, 2001
033452 ©2001 eMarketer, Inc. www.eMarketer.com

©2001 eMarketer, Inc. Reproduction of information sourced as eMarketer is prohibited without prior, written permission.Note: all data in this report (other than that sourced as eMarketer) was obtained from published, publicly available information.
95
The IT Spending Report
Methodology
Worldwide IT Spending
North America
Europe
Asia-Pacific
Latin America
IT Spending by Industry
IT Spendingby Business Size
IT Budgeting andSpending Surveys
Index of Charts
As noted by the Precursor Group, the transportation industry has shown asteady trend of increased IT spending over the past several years, althoughthis may change in light of the difficulties that airlines have experiencedthrough the latter part of 2001. As of September 17th, however, the MetaGroup was continuing to predict a 4% increase in transportation industryIT spending for 2002, while it expected a 19% reduction in IT spending forthe hospitality and travel industry.
Information technology companies constitute one of the few otherindustries to show a steady trend of increased IT spending, while energy,construction, and utility companies are expected to post the mostsignificant declines in technology spending from 2001 to 2002. The threeindustries are expected to see their IT spending as a share of revenues fall43%, 41% and 28% respectively. The retail industry is expected to holdsteady with its IT spending, maintaining budgets at 1.7% of revenues, butreducing IT spending as a portion of revenues by 6% in 2002.
Estimated Global 2000 Company IT Spending, 2001 &2002 (as a % of total company revenues)
2001 2002
Financial institutions 6.09% 6.50%
Telecommunications 5.88% 5.70%
Professional services 6.39% 5.10%
Information Technology 4.68% 4.80%
Healthcare 4.81% 4.20%
Transportation 3.93% 4.10%
Consumer products manufacturers 4.33% 3.90%
Media 3.95% 3.80%
Insurance 4.11% 3.60%
Utilities 3.90% 2.80%
Electronics 3.20% 2.80%
Energy 4.71% 2.70%
Chemicals 3.51% 2.60%
Food and beverage processing 2.56% 2.40%
Metals and natural resouces 2.30% 1.90%
Retail 1.80% 1.70%
Hospitality and travel 1.72% 1.40%
Construction and engineering 2.03% 1.20%
Overall average 3.84% 3.40%
Source: Meta Group, 2001
033453 ©2001 eMarketer, Inc. www.eMarketer.com

©2001 eMarketer, Inc. Reproduction of information sourced as eMarketer is prohibited without prior, written permission.Note: all data in this report (other than that sourced as eMarketer) was obtained from published, publicly available information.
96
The IT Spending Report
Methodology
Worldwide IT Spending
North America
Europe
Asia-Pacific
Latin America
IT Spending by Industry
IT Spendingby Business Size
IT Budgeting andSpending Surveys
Index of Charts
InformationWeek’s annual survey of 500 technology leaders predicts thattechnology spending among US firms will decline in 2001, falling to anaverage 3.9% of company sales, compared to a 4.3% average in 2000. Thetop 100 firms in the survey planned to spend an average 4.9% of their totalsales revenues on IT.
IT spending estimates from the InformationWeek survey show asubstantially higher proportion of IT spending among firms in its surveycompared with those of the Meta Group study. This is largely due to thefocus by InformationWeek surveys upon technology leaders – those firmsthat are among the biggest technology spenders within their respectiveindustries. The InformationWeek study is also focused upon Americancompanies with more than $1 billion in revenues, whereas the MetaGroup’s research considers a greater proportion of mid-size firms, and ismore international in scope.
IT Budget, by Industry, 2000 (as a % of projectedrevenue)Telecommunications 17%
Financial services 14%
Banking 8%
Insurance 6%
Retail: specialty 6%
Biotechnology and pharmaceuticals 5%
Information technology 5%
Logistics and transportation 5%
Consulting and business services 4%
Electronics 4%
Overall average 4%
Source: InformationWeek, 2000
033597 ©2001 eMarketer, Inc. www.eMarketer.com

©2001 eMarketer, Inc. Reproduction of information sourced as eMarketer is prohibited without prior, written permission.Note: all data in this report (other than that sourced as eMarketer) was obtained from published, publicly available information.
97
The IT Spending Report
Methodology
Worldwide IT Spending
North America
Europe
Asia-Pacific
Latin America
IT Spending by Industry
IT Spendingby Business Size
IT Budgeting andSpending Surveys
Index of Charts
Leading industries that invest heavily in IT continue to betelecommunications firms and financial services companies, while retail,utilities and metals industries companies reinvest the lowest amount oftheir incomes in IT.
As might be expected, telecommunications firms have substantiallyreduced their IT spending in 2001 to 10.6% of revenues, down from 17% in2000. Financial services companies have done the same, cutting back ITspending from 14% of revenues in 2000 to 8.8% in 2001.
US Companies' Average Annual IT Budget, by Industry,2001 (as a % of estimated company worldwide sales)Telecommunications 10.6%
Financial services 8.8%
Banking 8.4%
Consulting and business services 6.8%
Health care & medical services 4.8%
Media & entertainment 4.5%
Chemicals 4.3%
Biotechnology & pharmaceuticals 4.1%
Insurance 4.0%
Logistics & transportation 3.9%
Information technology 3.5%
Manufacturing 3.1%
Electronics 2.8%
Consumer goods 2.7%
Distribution 2.7%
Hospitality & travel 2.7%
Utilities 2.5%
Construction & engineering 2.1%
Food & beverage processing 2.1%
Automotive 2.0%
Retail:specialty merchandising 2.0%
Retail: general mercandising 1.8%
Energy 1.7%
Metals & natural resources 1.5%
Source: InformationWeek, 2001
033488 ©2001 eMarketer, Inc. www.eMarketer.com

©2001 eMarketer, Inc. Reproduction of information sourced as eMarketer is prohibited without prior, written permission.Note: all data in this report (other than that sourced as eMarketer) was obtained from published, publicly available information.
98
The IT Spending Report
Methodology
Worldwide IT Spending
North America
Europe
Asia-Pacific
Latin America
IT Spending by Industry
IT Spendingby Business Size
IT Budgeting andSpending Surveys
Index of Charts
Despite the decline in IT spending as a percent of revenues, IT budgetsactually rose an average 9.4% among InformationWeek surveyrespondents, with consulting firms and chemicals industry companiesincreasing their budgets the most over 2000. Once again,telecommunications firms led in the average dollar-value of their ITspending, while banking and financial services rounded out the leadingthree industries.
US Companies' Average Annual IT Budget, by Industry,2001 (in millions)Telecommunications $1,194.26
Banking $953.01
Financial services $720.68
Biotechnology & pharmaceuticals $691.32
Retail: general merchandising $499.41
Energy $498.12
Automotive $487.72
Distribution $434.31
Information technology $416.76
Logistics & transportation $348.80
Insurance $343.39
Manufacturing $290.62
Consulting & business services $284.21
Electronics $266.37
Hospitality & travel $240.80
Chemicals $221.68
Health care & medical services $208.18
Utilities $198.62
Consumer goods $194.84
Food & beverage processing $140.07
Media & entertainment $124.02
Retail: specialty merchandising $118.98
Metals & natural resources $105.99
Construction & engineering $90.48
Total $354.89
Source: InformationWeek, 2001
033489 ©2001 eMarketer, Inc. www.eMarketer.com

©2001 eMarketer, Inc. Reproduction of information sourced as eMarketer is prohibited without prior, written permission.Note: all data in this report (other than that sourced as eMarketer) was obtained from published, publicly available information.
99
The IT Spending Report
Methodology
Worldwide IT Spending
North America
Europe
Asia-Pacific
Latin America
IT Spending by Industry
IT Spendingby Business Size
IT Budgeting andSpending Surveys
Index of Charts
In a survey of 589 corporate and government organizations conductedbetween March and June of 2001, Gartner found that the governmentsector had the most positive outlook for IT spending, expecting to see anincrease in budgets by 18% between 2000 and 2002.
Hardest hit were companies in the utilities industry, which planned ondecreasing their IT capital spending the most, with expected reductions ofas much as 15%. Utilities were followed by construction industry firms,which planned reductions averaging 13.5%. By contrast, firms in the healthcare and financial services industries planned IT capital spending increases.
Cited as the two most promising IT spending categories, software andservices are expected to contribute the most to IT spending growth over thenext several years. IDC’s worldwide forecast for the software marketpredicts that discrete manufacturing and services industries will spend themost on software through 2003. Other leading economic sectors includeprocess manufacturing, government, and banking.
Worldwide Software Spending, by Industry, 2000 &2003 (in billions and as a % of total)
2000 2003
Spending % of total Spending % of total
Discrete manufacturing $28.68 16.2% $43.19 15.9%
Services industry $17.38 9.8% $28.06 10.3%
Process manufacturing $15.48 8.7% $24.13 8.9%
Government $15.23 8.6% $22.50 8.3%
Banking $14.21 8.0% $21.53 7.9%
Consumers $12.20 6.9% $19.15 7.0%
Communications & media $11.40 6.4% $17.53 6.4%
Retail $9.14 5.2% $14.47 5.3%
Insurance $7.90 4.5% $12.50 4.6%
Wholesale trade $7.97 4.5% $11.76 4.3%
Financial $7.45 4.2% $11.46 4.2%
Healthcare $7.38 4.2% $11.46 4.2%
Education $6.72 3.8% $9.70 3.6%
Transportation $5.81 3.3% $8.78 3.2%
Utilities $4.46 2.5% $7.11 2.6%
Resources industry $3.05 1.7% $4.42 1.6%
Construction $2.50 1.4% $3.47 1.3%
Total $176.93 100.0% $272.18 100.0%
Source: International Data Corporation (IDC), 2000
032966 ©2001 eMarketer, Inc. www.eMarketer.com

©2001 eMarketer, Inc. Reproduction of information sourced as eMarketer is prohibited without prior, written permission.Note: all data in this report (other than that sourced as eMarketer) was obtained from published, publicly available information.
100
The IT Spending Report
Methodology
Worldwide IT Spending
North America
Europe
Asia-Pacific
Latin America
IT Spending by Industry
IT Spendingby Business Size
IT Budgeting andSpending Surveys
Index of Charts
IDC breaks out IT outsourcing revenues by industry in the United States,finding that, once again, the big-spenders are information-intensiveservice industry firms in the banking and financial industries. Takentogether, these two industries will account for 27.7% of US IT outsourcingspending by 2005, compared to a 17.5% share for federal, state, and localgovernment.
US IT Outsourcing Spending, by Industry, 2001 & 2005(in billions)
2001 2005
Banking $5.70 $8.83
Federal government $2.80 $4.77
Other financial services $2.36 $3.47
Communications $2.04 $3.02
Insurance $1.93 $2.68
Utilities $1.90 $2.75
Retail $1.87 $2.60
Healthcare $1.76 $2.81
State and local government $1.75 $2.98
Discrete manufacturing $1.70 $2.68
Process manufacturing $1.66 $2.70
Other $3.58 $5.05
Total $29.04 $44.34
Source: International Data Corporation (IDC), 2001
033491 ©2001 eMarketer, Inc. www.eMarketer.com

VII
Methodology
I Worldwide IT Spending
II North America
III Europe
IV Asia-Pacific
V Latin America
VI IT Spending by Industry
VII IT Spending by Business Size 101
VIII IT Budgeting and Spending Surveys
Index of Charts
©2001 eMarketer, Inc. Reproduction of information sourced as eMarketer is prohibited without prior, written permission.Note: all data in this report (other than that sourced as eMarketer) was obtained from published, publicly available information.
101
The IT Spending Report

©2001 eMarketer, Inc. Reproduction of information sourced as eMarketer is prohibited without prior, written permission.Note: all data in this report (other than that sourced as eMarketer) was obtained from published, publicly available information.
102
The IT Spending Report
Methodology
Worldwide IT Spending
North America
Europe
Asia-Pacific
Latin America
IT Spending by Industry
IT Spendingby Business Size
IT Budgeting andSpending Surveys
Index of Charts
One of the few companies to break down global IT spending among smalland medium-sized businesses is AMI-Partners. The New York-basedresearch firm estimates that North America and Western Europe eachaccount for about one third of all IT spending by small and mediumbusinesses, while the Asia Pacific region has a 22% market share. In total,AMI-Partners estimates that in 1999, the total IT spend by small andmedium-sized firms was $801 billion worldwide.
Of the six leading national economies that AMI-Partners has studied, theUnited States accounts for 50%, or $250 billion of the $500 billion spent oninformation technology between those six countries. Japan spent thesecond-most at $77.5 billion, followed by the UK and Germany, whichspent $57.1 billion and $55.1 billion, respectively.
Asia/Pacific Rim$177.9 (22%)
Total = 801.0
Latin America$44.4 (6%)
North America$267.5 (33%)
Eastern Europe,Middle East,
Africa$46.8 (6%)
Western Europe$264.4 (33%)
Source: AMI-Partners, 2000
Small/Medium–Sized Business Spending onInformation Technology, Internet, andTelecommunications, by Region, 1999 (in billions)
www.eMarketer.com006710 ©2001 eMarketer, Inc.
$57.1 (7%)
$20.8 (3%)
United States
Japan
United Kingdom
Australia
Germany
France
$55.1 (7%)
$39.7 (5%)
Source: AMI-Partners, 2000
Small/Medium–Sized Business Spending onInformation Technology, Internet, andTelecommunications, by Country 1999 (in billions)
www.eMarketer.com006711 ©2001 eMarketer, Inc.
$250.0 (31%)
$77.5 (10%)

©2001 eMarketer, Inc. Reproduction of information sourced as eMarketer is prohibited without prior, written permission.Note: all data in this report (other than that sourced as eMarketer) was obtained from published, publicly available information.
103
The IT Spending Report
Methodology
Worldwide IT Spending
North America
Europe
Asia-Pacific
Latin America
IT Spending by Industry
IT Spendingby Business Size
IT Budgeting andSpending Surveys
Index of Charts
AMI-Partners has used a very broad definition of IT spending that includesbasic telephony costs, in addition to computer hardware and software,networking equipment, and IT services. By far, the largest category fortechnology spending is telephony. However, AMI-Partners estimates thatby 2001, much of these expenses will be replaced by internet access andnetworking-related costs.
Breakdown of Small/Medium-Sized BusinessSpending on IT, Internet & Telecommunications, byCategory, 2000 (in billions and as a % of total)
Basic telephony (local & long distance)
$298.50 (34.0%)
PC hardware, software
$243.10 (27.7%)
Networking hardware, software
$90.50 (10.3%)
Mobile wireless
$84.90 (9.7%)
Internet access (web sites, ASPs, intranet)
$83.90 (9.6%)
IT services
$76.50 (8.7%)
Total Market
$877.40 (100.0%)
Source: AMI-Partners, 2000
032695 ©2001 eMarketer, Inc. www.eMarketer.com

©2001 eMarketer, Inc. Reproduction of information sourced as eMarketer is prohibited without prior, written permission.Note: all data in this report (other than that sourced as eMarketer) was obtained from published, publicly available information.
104
The IT Spending Report
Methodology
Worldwide IT Spending
North America
Europe
Asia-Pacific
Latin America
IT Spending by Industry
IT Spendingby Business Size
IT Budgeting andSpending Surveys
Index of Charts
Another study conducted by ResearchPortal.com has estimated that smallbusiness spending on IT grew at a rate of 19% in 2000. By 2001, theresearch group estimated that small businesses in the United States wouldspend $147.15 billion on information technology, with hardwareaccounting for a substantial 72.6% of that total. The largest portion ofsmall business spending was anticipated to come from non-home basedbusinesses, or those businesses that have between 1 and 20 employees butdo not operate from a residence.
Breakdown of Small/Medium-Sized BusinessSpending on IT, Internet & Telecommunications, byCategory, 2001 (in billions and as a % of total)
Basic telephony (local & long distance)
$293.70 (30.5%)
PC hardware, software
$263.60 (27.4%)
Internet access (web sites, ASPs, intranet)
$116.40 (122.9%)
Networking hardware, software
$102.90 (10.7%)
Mobile wireless
$94.70 (9.8%)
IT services
$90.60 (9.4%)
Total Market
$961.90 (100.0%)
Source: AMI-Partners, 2000
032696 ©2001 eMarketer, Inc. www.eMarketer.com
US Small Business IT Spending, by Category, 2001 (inbillions)
Hardware $106.93
Services $25.70
Software $14.53
Total $147.15
Source: ResearchPortal.com, 2000
032991 ©2001 eMarketer, Inc. www.eMarketer.com

©2001 eMarketer, Inc. Reproduction of information sourced as eMarketer is prohibited without prior, written permission.Note: all data in this report (other than that sourced as eMarketer) was obtained from published, publicly available information.
105
The IT Spending Report
Methodology
Worldwide IT Spending
North America
Europe
Asia-Pacific
Latin America
IT Spending by Industry
IT Spendingby Business Size
IT Budgeting andSpending Surveys
Index of Charts
A comparative estimate by Computer Economics puts total IT spending byUS small businesses at $104.49 billion in 2001. When small office/homeoffice IT spending is included, the total market for US small companies isestimated to be worth $140.11 billion. Hardware spending accounts for42.7% of total IT spending according to Computer Economics’ estimate,although it should be noted that ResearchPortal.com has used a narrowerdefinition of IT spending to arrive at its forecast.
US Small Business IT Spending, by Business Size, 2001(in billions)Home business (1-5 employees, home-based) $17.79
Minor small business (1-20 employees) $76.54
Mid-size small business (21-50 employees) $17.81
Major small business (55-100 employees) $35.01
Total 147.15
Source: ResearchPortal.com, 2000
033403 ©2001 eMarketer, Inc. www.eMarketer.com
Estimated US Small Business IT Spending, byCategory, 2001 (in billions and as a % of totalspending)
Hardware
$44.6 (42.7%)
Staff
$31.2 (29.8%)
Software
$14.5 (13.9%)
Outside services
$9.0 (8.6%)
Facilities overhead
$2.1 (2.0%)
Consumable supplies
$3.1 (3.0%)
Total
$104.5 (100.0%)
Note: small business defined as 10 to 100 employeesSource: Computer Economics, 2001
032646 ©2001 eMarketer, Inc. www.eMarketer.com

©2001 eMarketer, Inc. Reproduction of information sourced as eMarketer is prohibited without prior, written permission.Note: all data in this report (other than that sourced as eMarketer) was obtained from published, publicly available information.
106
The IT Spending Report
Methodology
Worldwide IT Spending
North America
Europe
Asia-Pacific
Latin America
IT Spending by Industry
IT Spendingby Business Size
IT Budgeting andSpending Surveys
Index of Charts
Small and medium businesses account for the largest portion of PC unitsales, at 36% of the total market. Large businesses are projected by UBSWarburg to take a 22% share in 2001, versus a 32% share by consumers.
Estimated US Small Office/Home Office IT Spending,by Category, 2001 (in billions and as a % of totalspending)
Hardware $29.64 (47.7%)
Staff $12.77 (20.6%)
Software $10.32 (16.6%)
Outside services $6.10 (9.8%)
Facilities overhead $1.20 (1.9%)
Consumable supplies $2.06 (3.3%)
Total $62.09 (100.0%)
Source: Computer Economics, 2001
032665 ©2001 eMarketer, Inc. www.eMarketer.com
Education/govern-
ment10%
Large businesses22%
Small/medium businesses36%
Consumers32%
Breakdown of Worldwide PC Unit Demand, by MarketSegment, 2001
Source: UBS Warburg, 2001
033402 ©2001 eMarketer, Inc. www.eMarketer.com

©2001 eMarketer, Inc. Reproduction of information sourced as eMarketer is prohibited without prior, written permission.Note: all data in this report (other than that sourced as eMarketer) was obtained from published, publicly available information.
107
The IT Spending Report
Methodology
Worldwide IT Spending
North America
Europe
Asia-Pacific
Latin America
IT Spending by Industry
IT Spendingby Business Size
IT Budgeting andSpending Surveys
Index of Charts
In the spring of 2001, investment bank Adams, Harkness & Hill conducted aweb-based survey examining how businesses had established their ITbudgets for the year. Among the 194 respondents, the mean rate of ITbudget growth was 7.7% for 2001. Medium-sized businesses had increasedtheir budgets slightly more than large companies, while small businessesappeared to have most drastically cut back on the growth of their ITbudgets compared to the previous year.
Gartner finds that small businesses spend the smallest portion of theiroverall revenues on IT, while mid-size companies spend the most. Onaverage, large companies were expected to dedicate 5.40% of their totalrevenues to their IT budgets in 2001, versus a range of between 1.5% and4.5% for small companies.
Anticipated Business IT Budget Growth, by BusinessSize, 2000 & 2001
Small(0-499)
Medium(500-4,999)
Large(5,000-9,999)
Enterprise(10,000 +)
Total
Mean growth2001
7.1% 8.5% 8.0% 7.0% 7.7%
Mean growth2000
12.9% 9.7% 8.8% 12.1% 11.1%
% difference -44.9% -12.3% -9.1% -42.1% -30.6%
Source: Adams, Harkness & Hill, 2001
033458 ©2001 eMarketer, Inc. www.eMarketer.com
Company Revenues Spent on IT, by Business Size,20011-100 employees 1.50%-4.50%
100-250 employees 5.10%
250-500 employees 6.73%
500-1000 employees 5.40%
Source: Gartner Group, 2001
033446 ©2001 eMarketer, Inc. www.eMarketer.com

©2001 eMarketer, Inc. Reproduction of information sourced as eMarketer is prohibited without prior, written permission.Note: all data in this report (other than that sourced as eMarketer) was obtained from published, publicly available information.
108
The IT Spending Report
Methodology
Worldwide IT Spending
North America
Europe
Asia-Pacific
Latin America
IT Spending by Industry
IT Spendingby Business Size
IT Budgeting andSpending Surveys
Index of Charts
As a result of the slowdown in the US economy, in October of 2001Cahner’s In-Stat lowered its forecast for IT spending by US businesses byan average 12% from 2000 levels. The research group estimates that largeenterprises will spend an average $19 million in 2001, down 18% from theprevious year. Mid-size firms are expected to spend an average $846,000on IT in 2001, compared with small businesses which are expected to spendjust $70,000.
With e-business spending expected to continue as a significant driver oftechnology spending over the long term, Cahners In-Stat has projected thatlarge and mid-size companies in the United States will account for 55.8%of internet-related IT spending in 2004. Their spending on e-businessinitiatives is expected to grow to $110 billion by 2004, up from $49 billionin 2000.
As for the small business and small office/home market, Cahner’s In-Statestimates that these companies will account for 44.2% of e-businesstechnology spending in the United States by 2004. The entire market for USinternet technology spending - which includes hardware, software,services, and personnel by Cahner’s definition – is expected to reach almost$200 billion in three years.
Estimated US Company IT Spending, by Business Size,2001Enterprises (1000+ employees) $19 million
Mid-size firms (100 to 999 employees) $846,000
Small businesses (5 to 99 employees) $70,000
Small office/home office (less than 5 employees) $6,000
Source: Cahners In-Stat, 2001
033459 ©2001 eMarketer, Inc. www.eMarketer.com
Estimated Spending on Internet Technology, by USMedium and Large Sized Businesses, 2000 & 2004 (inbillions)
2000 $49
2004 $110
Source: Cahners In-Stat, 2001
027807 ©2001 eMarketer, Inc. www.eMarketer.com
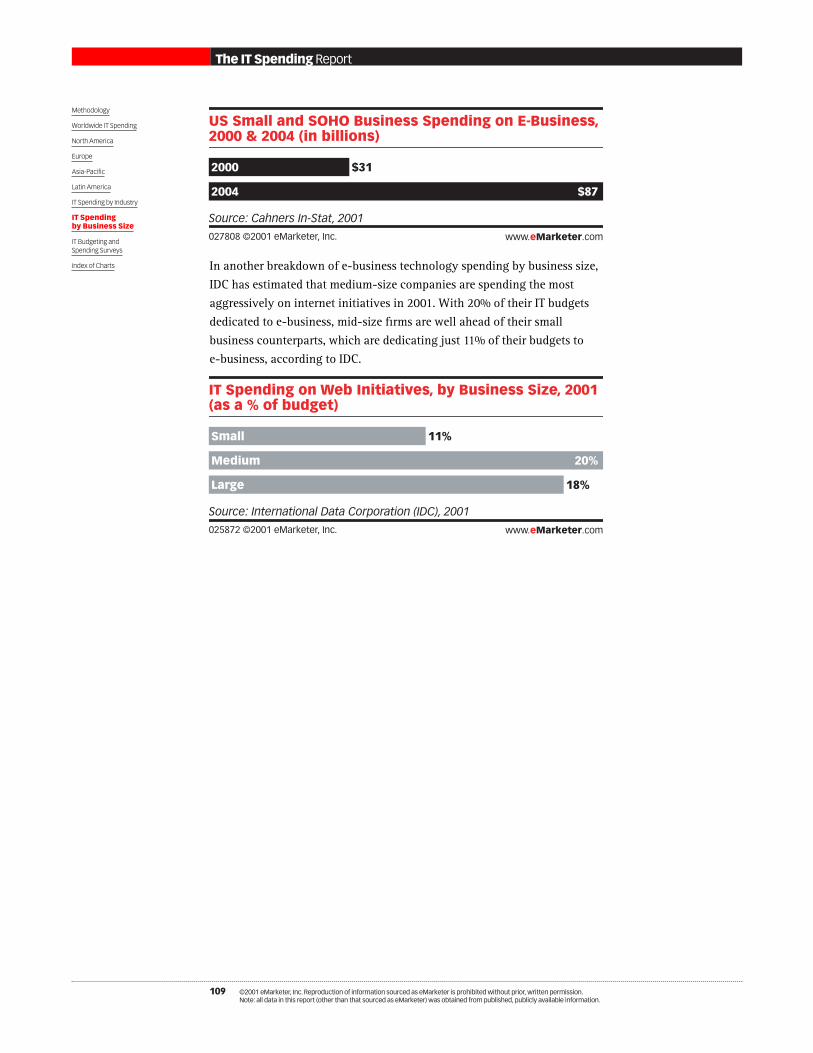
©2001 eMarketer, Inc. Reproduction of information sourced as eMarketer is prohibited without prior, written permission.Note: all data in this report (other than that sourced as eMarketer) was obtained from published, publicly available information.
109
The IT Spending Report
Methodology
Worldwide IT Spending
North America
Europe
Asia-Pacific
Latin America
IT Spending by Industry
IT Spendingby Business Size
IT Budgeting andSpending Surveys
Index of Charts In another breakdown of e-business technology spending by business size,IDC has estimated that medium-size companies are spending the mostaggressively on internet initiatives in 2001. With 20% of their IT budgetsdedicated to e-business, mid-size firms are well ahead of their smallbusiness counterparts, which are dedicating just 11% of their budgets toe-business, according to IDC.
US Small and SOHO Business Spending on E-Business,2000 & 2004 (in billions)
2000 $31
2004 $87
Source: Cahners In-Stat, 2001
027808 ©2001 eMarketer, Inc. www.eMarketer.com
IT Spending on Web Initiatives, by Business Size, 2001(as a % of budget)
Small 11%
Medium 20%
Large 18%
Source: International Data Corporation (IDC), 2001
025872 ©2001 eMarketer, Inc. www.eMarketer.com


VIII
Methodology
I Worldwide IT Spending
II North America
III Europe
IV Asia-Pacific
V Latin America
VI IT spending by Industry
VII IT spending by Business Size
VIII IT Budgeting and Spending Surveys 111
A. IT Budgeting and the ROI Focus 112
B. E-Business and IT Spending 120
C. Anticipating the Recovery in IT Spending 125
Index of Charts
©2001 eMarketer, Inc. Reproduction of information sourced as eMarketer is prohibited without prior, written permission.Note: all data in this report (other than that sourced as eMarketer) was obtained from published, publicly available information.
111
The IT Spending Report

©2001 eMarketer, Inc. Reproduction of information sourced as eMarketer is prohibited without prior, written permission.Note: all data in this report (other than that sourced as eMarketer) was obtained from published, publicly available information.
112
The IT Spending Report
Methodology
Worldwide IT Spending
North America
Europe
Asia-Pacific
Latin America
IT Spending by Industry
IT Spendingby Business Size
IT Budgeting andSpending Surveys
Index of Charts
A. IT Budgeting and the ROI FocusWith IT spending decisions becoming an increasingly important part of acompany’s overall competitive strategy, high-level executives have begunto take a more active role in guiding their companies’ technologyinitiatives. Morgan Stanley found that of the 225 CIOs that it surveyed inJuly of 2001, a significant 65% said that their CEO had at least played asupporting role for major IT projects.
But although CEO’s may be taking a greater interest in supporting ITinitiatives, Ziff Davis found in a survey of US companies that the majorityof IT spending decisions were still primarily being made by IT managers. C-level executives were responsible for buying technology in just 9% ofcompanies, compared with IT managers at 41% of surveyed respondents.
Supporting role 45%
None 36%
Primary role 19%
CEO Involvement in Major IT Projects during the LastTwo Years, July 2001
Source: Morgan Stanley, July 2001
031466 ©2001 eMarketer, Inc. www.eMarketer.com
Percent of Firms in Which IT Department InitiatesE-Business Solutions Purchasing, by Business Size,2001
Less than 100 employees 40%
100-499 employees 36%
500-999 employees 44%
1000+ employees 47%
All 41%
Source: Ziff Davis Media, 2001
033492 ©2001 eMarketer, Inc. www.eMarketer.com

©2001 eMarketer, Inc. Reproduction of information sourced as eMarketer is prohibited without prior, written permission.Note: all data in this report (other than that sourced as eMarketer) was obtained from published, publicly available information.
113
The IT Spending Report
Methodology
Worldwide IT Spending
North America
Europe
Asia-Pacific
Latin America
IT Spending by Industry
IT Spendingby Business Size
IT Budgeting andSpending Surveys
Index of Charts
When it comes to understanding how flexible most CIOs annual budgetsare – and how sensitive they might be to spending cuts - Morgan Stanleyfound that 27% of companies had fixed annual IT budgets, while only asmall fraction had variable budgets that were adjusted according tocompany revenues.
In another study, several large firms have said that although their ITbudgets allow for some discretionary spending, they see IT spending as afixed, rather than variable cost.
Other method
63%
As a fixed cost 27%
As a % of total revenues (variable) 10%
How CIOs Establish Their Company's Annual ITBudgets, 2001
Source: Morgan Stanley, 2001
032672 ©2001 eMarketer, Inc. www.eMarketer.com

©2001 eMarketer, Inc. Reproduction of information sourced as eMarketer is prohibited without prior, written permission.Note: all data in this report (other than that sourced as eMarketer) was obtained from published, publicly available information.
114
The IT Spending Report
Methodology
Worldwide IT Spending
North America
Europe
Asia-Pacific
Latin America
IT Spending by Industry
IT Spendingby Business Size
IT Budgeting andSpending Surveys
Index of Charts
The Computer Science Corporation’s (CSC) annual survey of more than 800IT managers found that, on average, the greatest portion of IT budgets wentto hardware and software purchases, followed by application developmentand ongoing maintenance. Staffing costs accounted for an average onefifth of IT spending, while telecommunications equipment and servicestook a 14% share of IT budgets.
As for CIOs opinions about whether or not they had overspent ontechnology during the past three years, a surprisingly high 74% repliedwith a resounding “no”. Although some admitted to overspending, themajority of CIOs apparently do not buy-in to the perception that the pastthree years were a time of indiscriminate technology spending.
IT Managers' Allocation of Their IT Budgets, 2000
Hardware and software purchases
28.8%
25.0%
Application development and maintenance
22.7%
20.0%
Human resources
20.7%
20.0%
Telecommunications
14.0%
10.0%
User support
11.0%
10.0%
Other
2.8%
0.0%
Mean Median
Source: Computer Sciences Corporation (CSC), 2001
033493 ©2001 eMarketer, Inc. www.eMarketer.com

©2001 eMarketer, Inc. Reproduction of information sourced as eMarketer is prohibited without prior, written permission.Note: all data in this report (other than that sourced as eMarketer) was obtained from published, publicly available information.
115
The IT Spending Report
Methodology
Worldwide IT Spending
North America
Europe
Asia-Pacific
Latin America
IT Spending by Industry
IT Spendingby Business Size
IT Budgeting andSpending Surveys
Index of Charts
According to its monthly survey of approximately 220 CIOs, CIO Magazinein partnership with Deutsche Bank finds that there are three primary factorsthat have a negative affect on IT spending. Weak corporate profits are thenumber one deterrent cited by the majority of CIOs, followed by financingpressures and satisfaction levels with current IT resources.
It is this latter point that may perhaps be the most distressing to ITvendors, as potential customers will be slow to invest in new technology ifthey feel that they can continue to obtain value from IT systems that areserving them well. Extended replacement cycles for technology productssuch as personal computers are therefore cutting into future growth foroverall IT spending, and at the very least are delaying a return to theformer high levels of IT spending.
CFO says yes, but CIO says no 1%
Yes 11%
Probably 14%
No 74%
Percent of CIO's Who Believe That Their OrganizationHas Overspent on Technology during the Past 3 Years, September, 2001
Source: Morgan Stanley, September, 2001
032674 ©2001 eMarketer, Inc. www.eMarketer.com
Not sure 8.3%
Less pressure to keep up withcompetitors 2.3%
Current IT systems are sufficient 20.6%
Financing conditions are tight 28.9%
Profits are weak 39.9%
CIOs' Number One Negative Factor that Will Affect ITSpending Over the Next 12 Months, August 2001
Source: CIO Magazine, Deutsche Bank, 2001
032692 ©2001 eMarketer, Inc. www.eMarketer.com

©2001 eMarketer, Inc. Reproduction of information sourced as eMarketer is prohibited without prior, written permission.Note: all data in this report (other than that sourced as eMarketer) was obtained from published, publicly available information.
116
The IT Spending Report
Methodology
Worldwide IT Spending
North America
Europe
Asia-Pacific
Latin America
IT Spending by Industry
IT Spendingby Business Size
IT Budgeting andSpending Surveys
Index of Charts
But in light of these disincentives to spend on IT, there are in fact severalcompanies that have seen the economic downturn and subsequent pricecompetition among hardware and software vendors as a buyingopportunity. This has been especially helpful for small and mid-size firms,as technology companies have reduced prices in order to remaincompetitive or clear out inventories.
Another factor that continues to encourage some IT spending iscompetitive pressure. Several businesses believe that they must stay currentwith technology that may be deployed by other companies within theirindustry. In March of 2001, VARBusiness found that the majority ofbusinesses thought that their competitors would either increase, or at thevery least maintain their IT spending through the next twelve months, inspite of the economic downturn.
Through the second half of 2001, this pressure has arguably abated by aconsiderable amount, however, as most businesses certainly feel lessurgency to rush out and buy new technology. Now that many companiessee e-business initiatives within a long-term context, they are taking thetime to evaluate and implement solutions that best meet their needs andrequired return on investment.
It is interesting to note that up until 2001 many CIOs had not been veryconcerned about determining the ROI of their company’s technologyinvestments. For example, the Computer Science Corporation’s (CSC) year2000 survey of global IT managers found that more than half of the CIOssurveyed did not have any idea of the ROI that their companies werereceiving from IT investments. Among those that did offer a guess, mostestimated an ROI of greater than 10%.
Don't know/ did not answer 4.8%
Will decrease general IT spending 10.5%
Will maintain general IT spending
33.2%
Will increase general IT spending 51.5%
Expectations of US Businesses of Competitors' ITSpending for the Next 12 Months, 2001
Source: VARBusiness, 2001
027798 ©2001 eMarketer, Inc. www.eMarketer.com

©2001 eMarketer, Inc. Reproduction of information sourced as eMarketer is prohibited without prior, written permission.Note: all data in this report (other than that sourced as eMarketer) was obtained from published, publicly available information.
117
The IT Spending Report
Methodology
Worldwide IT Spending
North America
Europe
Asia-Pacific
Latin America
IT Spending by Industry
IT Spendingby Business Size
IT Budgeting andSpending Surveys
Index of Charts
This uncertainty about technology ROI expectations was found to becommon across all regions of the world, with respondents in NorthAmerica, Europe and Asia all having little idea about the returns theircompanies should expect from their IT investments.
Source: Computer Sciences Corporation (CSC), 2001
Unkown 50.1%
Negative 1.8%
Low <10% 12.3%
Medium >10% 27.4%
High >15% 8.4%
IT Managers' Estimated IT ROI, 2000
033494 ©2001 eMarketer, Inc. www.eMarketer.com
North America Europe
Unknown 47.6%
Unknown 55.3%
Unknown 43.4%
Low<10% 13.8%
Low <10%8.7%
Negative6.3%
Low <10%13.2%
Negative 0.4%
Medium>10% 28.1%
Medium>10% 21.8%
Medium>10% 37.2%
High>15% 10.5%
High>15% 7.8%
High>15% 5.8%
Source: Computer Sciences Corporation, 2001
Companies' IT ROI, by Region, 2000
Asia
www.eMarketer.com027800 ©2001 eMarketer, Inc.

©2001 eMarketer, Inc. Reproduction of information sourced as eMarketer is prohibited without prior, written permission.Note: all data in this report (other than that sourced as eMarketer) was obtained from published, publicly available information.
118
The IT Spending Report
Methodology
Worldwide IT Spending
North America
Europe
Asia-Pacific
Latin America
IT Spending by Industry
IT Spendingby Business Size
IT Budgeting andSpending Surveys
Index of Charts
But as the current economic slowdown has deepened, many technologyvendors note that ROI is now very much on the mind of their customers in2001. A significant 80% of respondents to an IT manager’s surveyconducted by InformationWeek indicated that the importance of measuringROI had increased in 2001, while 17% of respondents said that it hadremained the same over the previous year.
In response to the greater number of CIOs that are required to do an ROIassessment prior to making a technology purchase, several IT vendors havebegun to offer to do ROI studies on their customers’ behalf, or havepresented ROI studies in support of their own products.
However, in InformationWeek’s mid-year survey of 200 IT managers, themagazine found that despite vendors’ efforts to demonstrate their products’ROI, very few buyers take these assessments at full value. The majority of ITmanagers use them only as a rough guide at best.
Decreased 3%
Remained the same
17%
Increased 80%
Year over Year Change in Importance of Measuring ITROI, 2001
Source: InformationWeek, 2001
033495 ©2001 eMarketer, Inc. www.eMarketer.com
Are guided by vendors' claims
8%
Are somewhat influenced
54%
Are not influenced 38%
Percent of IT Managers Influenced by IT Vendors' ROI Claims, 2001
Source: InformationWeek, 2001
033496 ©2001 eMarketer, Inc. www.eMarketer.com

©2001 eMarketer, Inc. Reproduction of information sourced as eMarketer is prohibited without prior, written permission.Note: all data in this report (other than that sourced as eMarketer) was obtained from published, publicly available information.
119
The IT Spending Report
Methodology
Worldwide IT Spending
North America
Europe
Asia-Pacific
Latin America
IT Spending by Industry
IT Spendingby Business Size
IT Budgeting andSpending Surveys
Index of Charts
Part of the skepticism that customers have toward ROI studies comes fromthe fact that they are difficult to do, and many have been proven to beinaccurate. When it comes to measuring the ROI on their own IT projects,most IT managers have found it to be an inexact science.
In many instances, intangible benefits such as increased customersatisfaction or employee productivity make ROI for IT implementationsdifficult to quantify. A lack of historical data or measurement of formermanual processes may make ROI difficult to document as well. And formany IT professionals, there is simply not enough time for them to monitorROI, while they and their staff have other more pressing priorities.
For the majority of IT managers, some kind of reliance on informalmeasurement is used to determine the ROI that they are getting from theirIT investments. InformationWeek’s study found that just 24% of ITmanagers were using formal measurement techniques to track IT ROI.
Neither 11%
Formal 24%
Combination of informal and formal 30%
Informal measurement 35%
How IT Managers Measure ROI on Their ITInvestments, 2001
Source: InformationWeek, 2001
033510 ©2001 eMarketer, Inc. www.eMarketer.com

©2001 eMarketer, Inc. Reproduction of information sourced as eMarketer is prohibited without prior, written permission.Note: all data in this report (other than that sourced as eMarketer) was obtained from published, publicly available information.
120
The IT Spending Report
Methodology
Worldwide IT Spending
North America
Europe
Asia-Pacific
Latin America
IT Spending by Industry
IT Spendingby Business Size
IT Budgeting andSpending Surveys
Index of Charts
B. E-Business and IT SpendingWith e-business taking on a more significant role in IT planning,technology research firms have begun to focus on the specific impact thatinternet initiatives are having on broader IT spending.
In a web-based survey of more than 900 businesses with internetoperations, IDC found that internet projects had already begun to accountfor a significant portion of companies’ IT budgets in the year 2000. Largebusinesses expected to spend the most on internet initiatives in 2001, with21.2% of firms allocating more than one quarter of their IT budgets to suchprojects. Not surprisingly, smaller companies that typically operate less-complex e-business systems devoted a lower portion of their budgets tothese activities.
In total, IDC found that the mean percentage of IT budgets that weredirected toward internet projects was 10.1% for all companies in 2000, andforecast to rise to 10.6% by 2001.
Broken down by country, respondents to the IDC survey show thatFrench companies are surprisingly spending the greatest portion of their ITbudgets on e-business projects. They are followed by Japanese andCanadian companies, which are allocating about 18% of IT resources toweb initiatives.
Percent of Businesses Spending More Than 26% of ITBudgets on Internet Initiatives, 2000 & 2001
Large businesses
17.3%
21.2%
Medium-sized businesses
14.7%
19.3%
Small businesses
12.7%
13.1%
2000 2001
Source: International Data Corporation (IDC), 2001
033511 ©2001 eMarketer, Inc. www.eMarketer.com

©2001 eMarketer, Inc. Reproduction of information sourced as eMarketer is prohibited without prior, written permission.Note: all data in this report (other than that sourced as eMarketer) was obtained from published, publicly available information.
121
The IT Spending Report
Methodology
Worldwide IT Spending
North America
Europe
Asia-Pacific
Latin America
IT Spending by Industry
IT Spendingby Business Size
IT Budgeting andSpending Surveys
Index of Charts
By comparison, the Gartner Group estimates that e-business spending willaccount for a 15.5% portion of IT budgets in 2001, up from a 12.7% share in2000. Forrester Research had originally issued the highest estimate for e-business spending as a percent of IT budgets at 17% in 2000, while the MetaGroup had forecast that e-business spending would take 14.6% of IT dollars.
In May of 2001, VARBusiness published the results of its survey of morethan 400 IT and networking professionals, finding that most companiesspent less than 20% of their IT budgets on e-business initiatives in 2000.There was a clear trend toward increased e-business budgets through 2002,however, as 45.2% of respondents indicated that they expected to spendmore than 20% of their IT dollars on e-business projects by that year.
IT Spending on Web Initiatives in Selected Countries,2001 (as a % of IT budget)
US 15%
Japan 18%
Germany 10%
France 20%
Canada 18%
Australia 15%
UK 16%
Source: International Data Corporation (IDC), 2001
025871 ©2001 eMarketer, Inc. www.eMarketer.com
Worldwide E-Business Spending, 2000 & 2001 (as a %of total IT Spending)
2000 12.7%
2001 15.5%
Source: Gartner Group, 2001
027792 ©2001 eMarketer, Inc. www.eMarketer.com

©2001 eMarketer, Inc. Reproduction of information sourced as eMarketer is prohibited without prior, written permission.Note: all data in this report (other than that sourced as eMarketer) was obtained from published, publicly available information.
122
The IT Spending Report
Methodology
Worldwide IT Spending
North America
Europe
Asia-Pacific
Latin America
IT Spending by Industry
IT Spendingby Business Size
IT Budgeting andSpending Surveys
Index of Charts
And CIOs plan to spend a significant amount of their IT budgets on internetsystems, according to another survey by CIO Magazine and Deutsche Bank.While the majority of companies expect to spend between 1% and 9% oftheir IT budgets on internet systems, a further one quarter of CIOs plannedon spending as much as 19% of their budgets on internet initiatives.
US Companies' IT Budgets Allocated towardE-Business, 2000-2002
Less than 10%
33.0%
21.2%
12.8%
10% to 19%
23.8%
27.2%
22.0%
20% to 29%
13.5%
18.8%
19.8
30% to 39%
8.2%
10.8%
10.8%
40% to 49%
3.0%
3.8%
4.8%
50% or more
6.0%
8.0%
9.8%
Did not reply/don’t know
12.5%
10.2%
20.2%
2000 2001 2002
Source: VARBusiness, 2001
027794 ©2001 eMarketer, Inc. www.eMarketer.com

©2001 eMarketer, Inc. Reproduction of information sourced as eMarketer is prohibited without prior, written permission.Note: all data in this report (other than that sourced as eMarketer) was obtained from published, publicly available information.
123
The IT Spending Report
Methodology
Worldwide IT Spending
North America
Europe
Asia-Pacific
Latin America
IT Spending by Industry
IT Spendingby Business Size
IT Budgeting andSpending Surveys
Index of Charts
But in contrast to many of the more optimistic forecasts from earlier in theyear, InternetWeek magazine has noticed a steady decrease in IT managers’optimism during its quarterly internet spending surveys that it conductsthroughout the year. Respondents with a positive outlook for their ownspending on internet technology have fallen from 40% to 28% within sixmonths. A full 44% of respondents said that their companies had reducede-business spending as a result of poor economic conditions.
However, other respondents indicated that their spending reductions aremore closely related to how their particular industry is doing, rather thanthe economy in general. For businesses in industries that are faring betterthan others, internet and IT spending has stayed steady, or even increased.
In a separate survey of 1000 IT managers and corporate departmentmanagers, InternetWeek found that just 41% of respondents said thatinternet initiatives had led to an increase in their overall IT budgets in2001, with a surprising 59% saying that e-business projects had notresulted in increased IT spending.
80% to 100% 2.3%
50% to 79% 5.5%
30% to 49% 9.7%
20% to 29% 12.0%
10% to 19% 25.3%
1% to 9% 36.4%
0% 8.8%
Percent of IT Budget that CIOs Expect to Spend onDeveloping Internet Systems Over the Next 12Months, August 2001 (as a % of respondents)
Source: CIO Magazine & Deutsche Bank, 2001
032691 ©2001 eMarketer, Inc. www.eMarketer.com
US IT Managers' Expectations for Internet TechnologySpending Increases, 2001 (% increase over previousyear)
January 40%
March 33%
June 28%
Source: InternetWeek, 2001
033512 ©2001 eMarketer, Inc. www.eMarketer.com

©2001 eMarketer, Inc. Reproduction of information sourced as eMarketer is prohibited without prior, written permission.Note: all data in this report (other than that sourced as eMarketer) was obtained from published, publicly available information.
124
The IT Spending Report
Methodology
Worldwide IT Spending
North America
Europe
Asia-Pacific
Latin America
IT Spending by Industry
IT Spendingby Business Size
IT Budgeting andSpending Surveys
Index of Charts
InternetWeek went on to find that a greater proportion of US companieshad separate business units that were responsible for e-business initiativesin 2001, increasing to 47% of respondents from 32% in 2000.
Return on investment analysis for e-business projects has been neglected,in a similar fashion as it has for wider IT spending. Exactly two thirds, or66% of survey respondents said that they had not developed an ROI modelto measure the success of their internet strategies.
Among the reasons given for not tracking ROI, a preference for informalmeasuring techniques, along with time and resources constraints were theleading reasons given. A further 12% of e-business managers said that theinternet was simply too strategic to warrant some kind of measurement.
Most IT managers indicated that they justified the adoption of e-businessinitiatives by citing competitive pressures, while several respondents saidthat these projects were directed by upper management and thereforeexecuted on their behalf. Other companies cited market entry strategies orthe pursuit of continued new revenue growth as justification of theirinternet initiatives.
Percent of US Companies with a Separate BusinessGroup Responsible for E-Business, 2000 & 2001
2000 32%
2001 47%
Source: InternetWeek.com, October 15, 2001
033405 ©2001 eMarketer, Inc. www.eMarketer.com
Reasons Why US Companies Do Not Measure ROI forE-Business Initiatives, 2001
Using less formal measures of payback instead
27%
No time or budget to measure ROI
25%
Available metrics are not satisfactory
19%
Does not apply (nonprofit, etc.)
13%
E-Business/internet are considered too strategic
12%
Source: InternetWeek, 2001
033406 ©2001 eMarketer, Inc. www.eMarketer.com

©2001 eMarketer, Inc. Reproduction of information sourced as eMarketer is prohibited without prior, written permission.Note: all data in this report (other than that sourced as eMarketer) was obtained from published, publicly available information.
125
The IT Spending Report
Methodology
Worldwide IT Spending
North America
Europe
Asia-Pacific
Latin America
IT Spending by Industry
IT Spendingby Business Size
IT Budgeting andSpending Surveys
Index of Charts
Among the 34% of survey respondents that said they are measuring e-business ROI, the majority is relying upon basic cost/benefit analysis.Others are looking at the broader economic value added by their e-businessprojects, while a narrower 26% of respondents have developed some kindof weighted scoring methods.
C.Anticipating the Recovery in IT SpendingHope for a recovery in technology spending has been steadily pushed backsince the beginning of 2001. Optimists originally anticipated a briefslowdown, with a recovery that would occur by the fourth quarter of theyear at the latest. But by June of this year, those who were most in tune withCIOs and their spending plans were already forecasting that a recovery in ITspending would not occur until the second quarter of 2002, at the earliest.
Indeed, it has been a mix of the economic downturn, and the uncertaintythat has occurred following the terrorist attacks on the United States thathave made the timing of both an economic recovery and an IT spendingrecovery difficult to predict. While most surveys taken through the summerof 2001 showed that CIOs had a negative outlook for IT spending through theend of the year, uncertainty about 2002 has begun to arise during the fourthquarter of 2001.
Reasons Used by US Companies to Justify the Pursuitof E-Business Initiatives, 2001
Competitive pressures 66%
Directed by corporate management 51%
Entry into new markets 27%
Based on revenue of growth 20%
Market capitalization of company 18%
Source: InternetWeek, 2001
033408 ©2001 eMarketer, Inc. www.eMarketer.com
Metrics Used by US Companies that Monitor the ROIof Their E-Business Initiatives, 2001
Cost/benefit analysis 72%
Economic value added 51%
Net present value 42%
Weighted scoring methods 26%
Other 5%
Source: InternetWeek, 2001
033407 ©2001 eMarketer, Inc. www.eMarketer.com

©2001 eMarketer, Inc. Reproduction of information sourced as eMarketer is prohibited without prior, written permission.Note: all data in this report (other than that sourced as eMarketer) was obtained from published, publicly available information.
126
The IT Spending Report
Methodology
Worldwide IT Spending
North America
Europe
Asia-Pacific
Latin America
IT Spending by Industry
IT Spendingby Business Size
IT Budgeting andSpending Surveys
Index of Charts
But although forecasters have begun to reduce their IT spending forecastsfor 2002, many CIOs remain optimistic that spending may recover alongwith the economy by the second quarter of next year.
Among those tracking the decline in CIO sentiment, InformationWeekmagazine found in its quarterly measurement of IT managers’ overalleconomic outlook, that by the middle of 2001 its Confidence Index haddropped 22% since the second quarter of 2000. Just 42% of CIOs said thatthey had a positive outlook for the US economy, compared with 64% whohad said they had a positive outlook the year before.
It is interesting to note, however, that despite these negative views of thewider economy, many CIOs were slightly more optimistic about theprospects for their own industry, and significantly more optimistic abouttheir own companies’ prospects. While 44% said they had a positiveoutlook for their industry, a significant 61% said that they had a positiveoutlook for their own company.
But two weeks after the September 11th attack on the United States, aseparate survey conducted by InformationWeek found that of the 150 ITmanagers it spoke with, 30% indicated that they had already seen a shift inIT priorities, while two thirds said that it was too soon to be certain aboutthe impact of the attacks. Among the new priorities, 61% of respondentssaid that they were reassessing overall security measures, while 57%specified that they had shifted their focus to network security issues.
In a survey conducted in June of 2001, Merrill Lynch found that in asmall sample of 50 US and European CIOs, 72% of respondents replied thatthey did not expect their IT spending to loosen up during the second half ofthe year. In total, CIOs saw an average 3.8% growth in their IT budgets,while European CIOs anticipated a contraction in their IT spending.
In a separate survey of 589 large companies conducted by the GartnerGroup in July of 2001, the research firm found that despite the economicdownturn, businesses planned to increase their IT spending by an average10% in 2001. But while more than half of respondents said that they wouldincrease their IT budgets, a significant 43% said that their budgets wouldeither remain flat or be reduced in 2001.
US and European CIOs' Expected IT Budget Growth,2001
US 5.5%
Europe-1.7%
Total 3.8%
Source: Merrill Lynch, June 2001
033513 ©2001 eMarketer, Inc. www.eMarketer.com

©2001 eMarketer, Inc. Reproduction of information sourced as eMarketer is prohibited without prior, written permission.Note: all data in this report (other than that sourced as eMarketer) was obtained from published, publicly available information.
127
The IT Spending Report
Methodology
Worldwide IT Spending
North America
Europe
Asia-Pacific
Latin America
IT Spending by Industry
IT Spendingby Business Size
IT Budgeting andSpending Surveys
Index of Charts
Among those firms planning to increase their IT budgets, the averageincrease was estimated to be 21.5%, while those firms that intended todecrease their budgets said that on average they would go down by 12.7%.
Yet another survey conducted at the midpoint of 2001 by MorganStanley seems to confirm the fact that many businesses were planning tohold steady on their IT budgets during 2001. Of the 225 CIOs that weresurveyed, a significant 33% said that they had not yet made any changes orreductions in IT spending.
Further results show that IT budgets were not expected to grow faster thancapital spending at 63% of firms, while 19% of CIOs said that their ITbudgets were growing faster.
Business IT Spending Intentions for 2001, July 2001
Increase IT spending 56%
Keep spending flat 21%
Reduce IT spending 22%
Source: Gartner Group, 2001
033514 ©2001 eMarketer, Inc. www.eMarketer.com
Effects of Slowing Economy on US Companies’ ITSpending Plans, July 2001
Doing deals that are smaller in size
3%
Senior management requesting cutback in spending
14%
Planning to spend less
19%
Planning to spend more slowly, with more in second half oncepicture is clearer
12%
No change but monitoring situation / evaluating whether toreduce or delay spending
19%
No change yet
33%
Source: Morgan Stanley, 2001
033523 ©2001 eMarketer, Inc. www.eMarketer.com

©2001 eMarketer, Inc. Reproduction of information sourced as eMarketer is prohibited without prior, written permission.Note: all data in this report (other than that sourced as eMarketer) was obtained from published, publicly available information.
128
The IT Spending Report
Methodology
Worldwide IT Spending
North America
Europe
Asia-Pacific
Latin America
IT Spending by Industry
IT Spendingby Business Size
IT Budgeting andSpending Surveys
Index of Charts
As of August, however, the percent of CIOs planning to spend more on ITproducts and services during the second half of 2001 than in the first halfof the year decreased. In July, 34% had said that they planned to spendmore, but one month later that percentage had fallen to 26%.
Areas that were most likely to see spending increases during the secondhalf of 2001 included Microsoft Office upgrades and e-commerceinitiatives. Not surprisingly, network equipment, security software andstorage hardware have all remained at the top of the Morgan Stanley’ssurvey, where they have been among the leading priorities for CIOs all year.
Uncertain 18%
Yes 19%
No 63%
CIOs Who Expect Their IT Budgets to Grow FasterThan Their Enterprise’s Overall Capital Spending, July 2001
Source: Morgan Stanley, July 2001
031440 ©2001 eMarketer, Inc. www.eMarketer.com
No change 1%
Uncertain 7%
Planning to spend more
26% Not planning to spend more 66%
CIOs Planning to Spend More on Technology Productsand Services during the Second Half of 2001, August2001
Source: Morgan Stanley, 2001
032670 ©2001 eMarketer, Inc. www.eMarketer.com

©2001 eMarketer, Inc. Reproduction of information sourced as eMarketer is prohibited without prior, written permission.Note: all data in this report (other than that sourced as eMarketer) was obtained from published, publicly available information.
129
The IT Spending Report
Methodology
Worldwide IT Spending
North America
Europe
Asia-Pacific
Latin America
IT Spending by Industry
IT Spendingby Business Size
IT Budgeting andSpending Surveys
Index of Charts
As for the expected timing for deployment of Windows XP for the desktop,67% of CIOs said in August that they were unsure, while just 1% plannedon implementing it before the end of 2001.
According to a CIO Magazine/Deutsche Bank survey that was conducted inmid-September, the majority of CIOs expected to see some kind of anincrease in their IT budgets during the next year, with 45.4% saying thatthey expected their IT budgets to increase by between 1% and 30%.
Sentiment had certainly become more negative by the latter half ofSeptember, however, as 53.4% had said that they believed their budgets wouldincrease by as much as 30% in the previous month’s survey. A significant31.8% indicated in September that their IT budgets would decrease over thenext twelve months, compared with 21.9% in the August survey.
Top 10 IT Areas Likely to See the Biggest SpendingIncreases during the Second Half of 2001, August 2001
Microsoft Office upgrade 28.9%
E-Commerce initiatives 27.1%
Network equipment 23.6%
Security software 23.6%
Windows 2000 upgrade - server 21.8%
Windows 2000 upgrade - desktop 21.3%
Wireless initiatives 21.3%
UNIX servers 20.4%
Storage hardware 19.6%
PCs 18.2%
Source: Morgan Stanley, 2001
032673 ©2001 eMarketer, Inc. www.eMarketer.com

©2001 eMarketer, Inc. Reproduction of information sourced as eMarketer is prohibited without prior, written permission.Note: all data in this report (other than that sourced as eMarketer) was obtained from published, publicly available information.
130
The IT Spending Report
Methodology
Worldwide IT Spending
North America
Europe
Asia-Pacific
Latin America
IT Spending by Industry
IT Spendingby Business Size
IT Budgeting andSpending Surveys
Index of Charts
As for the expected timing of an increase in their own IT spending, a full29.2% of respondents to the CIO Magazine/Deutsche Bank survey said thatthey did not expect to increase spending until sometime after the firstquarter of 2002. This is in-line with several other IT spending surveys,which do not predict a recovery until at least the second quarter of 2002.
Most interestingly, a significant 22.8% of survey respondents said thattheir IT spending had not slowed down at all, while another 22.8% repliedthat they expected their spending to increase in the first quarter of 2002.
CIOs' Expected Change in IT Budgets over the Next 12Months, September 2001
Decrease by 50% to 100%
5.6%
Decrease by 30% to 49%
4.5%
Decrease by 20% to 29%
4.0%
Decrease by 10% to 19%
9.6%
Decrease by 1% to 9%
8.1%
No change
11.1%
Increase by 1% to 9%
24.7%
Increase by 10% to 19%
14.1%
Increase by 20% to 29%
6.6%
Increase by 30% to 49%
3.5%
Increase by 50% to 100%
8.1%
Increase by more than 100%
0.0%
Note: Survey respondents are CIOs from global Fortune 500 companiesSource: CIO Magazine, Deutsche Bank, 2001
033146 ©2001 eMarketer, Inc. www.eMarketer.com

©2001 eMarketer, Inc. Reproduction of information sourced as eMarketer is prohibited without prior, written permission.Note: all data in this report (other than that sourced as eMarketer) was obtained from published, publicly available information.
131
The IT Spending Report
Methodology
Worldwide IT Spending
North America
Europe
Asia-Pacific
Latin America
IT Spending by Industry
IT Spendingby Business Size
IT Budgeting andSpending Surveys
Index of Charts
Merrill Lynch published the latest edition of its CIO survey in mid-October,finding that 32% of American and European CIOs planned to increase theirIT spending in the second quarter of 2002. This is down from 45% of CIOswho had expected to increase their technology spending by the middle of2002, in a survey that was conducted prior to September 11th. The mostrecent Merrill Lynch study went on to find that 17% of CIOs did not believethat IT spending would pick up until 2003, while CIOs predicted that onaverage, their budgets would grow just 2.2% in 2002.
Along the lines of the Morgan Stanley study, the CIO Magazine/DeutscheBank survey confirms that storage systems, networking equipment and e-business applications will all remain as priorities for CIOs during the nexttwelve months.
However, in light of the added economic uncertainty that had arisen bymid-September, many CIOs appear to be scaling back increases intechnology spending in all categories. Hardest hit will be computerhardware and telecommunications equipment, while storage systemsspending has held steady.
CIO's Expectations for a Pickup in Their Own ITSpending, August & September 2001
Note: Survey respondents are CIOs from global Fortune 500 companiesSource: CIO Magazine, Deutsche Bank, 2001
033140 ©2001 eMarketer, Inc. www.eMarketer.com
ITspendingneversloweddown22.8%
IT spendingnever slowed down21.8%
Beyond FirstQuarter 2002
29.1%
Beyond FirstQuarter 2002
29.4%
FirstQuarter
200222.8%
FirstQuarter
200224.9%
FourthQuarter
20018.7%
Third quarter 20014.1%
Not sure1.5%IT
spendinghas already picked up5.5%
August
September
Third quarter20011.5%Fourth
Quarter2001
10.7%
Not sure4.6%
ITspendinghas already picked up7.1%

©2001 eMarketer, Inc. Reproduction of information sourced as eMarketer is prohibited without prior, written permission.Note: all data in this report (other than that sourced as eMarketer) was obtained from published, publicly available information.
132
The IT Spending Report
Methodology
Worldwide IT Spending
North America
Europe
Asia-Pacific
Latin America
IT Spending by Industry
IT Spendingby Business Size
IT Budgeting andSpending Surveys
Index of Charts
Decrease16.5%
Increase48.6%
Not sure1.8%
Not sure1.5%
Same34.8%
Same33.0%
Decrease15.2%
Increase48.5%
CIOs' Planned Spending on Storage Systems Over theNext 12 Months, August & September 2001
Note: Survey respondents are CIOs from global Fortune 500 companiesSource: CIO Magazine, Deutche Bank, 2001
033145 ©2001 eMarketer, Inc. www.eMarketer.com
August September
August September
Increase 44.7%
Decrease 22.4%
Same 32.4%
Not Sure 0.5%
Same 31.5%
Decrease 28.4%
Increase 39.6%
Note: Survey respondents are CIOs from global Fortune 500 companies Source: CIO Magazine, Deutsche Bank, 2001
CIOs' Planned Spending on Data Networking Equipment over the Next 12 Months, August & September, 2001
www.eMarketer.com033141 ©2001 eMarketer, Inc.

©2001 eMarketer, Inc. Reproduction of information sourced as eMarketer is prohibited without prior, written permission.Note: all data in this report (other than that sourced as eMarketer) was obtained from published, publicly available information.
133
The IT Spending Report
Methodology
Worldwide IT Spending
North America
Europe
Asia-Pacific
Latin America
IT Spending by Industry
IT Spendingby Business Size
IT Budgeting andSpending Surveys
Index of Charts
August September
Increase 45.2%
Decrease 15.1%
Same 35.2%
Not sure 4.6%
Not sure 7.1%
Same 36.4%
Decrease 15.1%
Increase 39.4%
Note: Survey respondents are CIOs from global Fortune 500 companiesSource: CIO Magazine, Deutsche Bank, 2001
CIOs' Planned Spending on E-Commerce Software* over the Next 12 Months, August & September, 2001
www.eMarketer.com033142 ©2001 eMarketer, Inc.
August September
Increase 42.9%
Decrease 22.8%
Decrease 30.5%
Same 34.2%
Not sure 0.1%
Not sure 2.5%
Same 33.5% Increase
33.5%
Note: Survey respondents are CIOs from global Fortune 500 companiesSource: CIO Magazine, Deutsche Bank, 2001
CIOs' Planned Spending on Telecommunications Equipment over the Next 12 Months, August & September, 2001
www.eMarketer.com033139 ©2001 eMarketer, Inc.

©2001 eMarketer, Inc. Reproduction of information sourced as eMarketer is prohibited without prior, written permission.Note: all data in this report (other than that sourced as eMarketer) was obtained from published, publicly available information.
134
The IT Spending Report
Methodology
Worldwide IT Spending
North America
Europe
Asia-Pacific
Latin America
IT Spending by Industry
IT Spendingby Business Size
IT Budgeting andSpending Surveys
Index of Charts
August September
Increase 41.6%
Decrease 27.9%
Same 29.7%
Not sure 0.9%
Not sure 1.5%
Same 39.7%
Decrease 30.3%
Increase 30.3%
Note: Survey respondents are CIOs from global Fortune 500 companies Source: CIO Magazine, Deutsche Bank, 2001
CIOs' Planned Spending on Computer Hardware* over the Next 12 Months, August & September 2001
www.eMarketer.com033143 ©2001 eMarketer, Inc.

Methodology
I Worldwide IT Spending
II North America
III Europe
IV Asia-Pacific
V Latin America
VI IT spending by Industry
VII IT spending by Business Size
VIII IT Budgeting and Spending Surveys
Index of Charts 135
©2001 eMarketer, Inc. Reproduction of information sourced as eMarketer is prohibited without prior, written permission.Note: all data in this report (other than that sourced as eMarketer) was obtained from published, publicly available information.
135
The IT Spending Report

©2001 eMarketer, Inc. Reproduction of information sourced as eMarketer is prohibited without prior, written permission.Note: all data in this report (other than that sourced as eMarketer) was obtained from published, publicly available information.
136
The IT Spending Report
Index of ChartsWorldwide Information and Communication Technology Spending, 1999 &2003 (in billions) 12
Top 3 Countries for Information and Communication Technology Spending,1999 (in billions) 13
Top 3 Countries for Information and Communication Technology Spending,1999 (spending per capita) 13
Worldwide IT Spending Forecast, 1999 - 2005 (in billions) 14
Worldwide IT Spending Forecast, 2001-2005 (in billions) 14
Worldwide IT Spending by Region, 2001 (in billions) 15
Estimated Worldwide IT Spending by Region, 2001 (in billions and as a % oftotal spending) 15
Worldwide IT Spending by Region, 2000 - 2003 (in billions) 16
Worldwide IT Spending by Region as a Percent of World Total, 2000 & 2003 17
Worldwide Information and Communications Technology Spending Growth,1992-1999 18
Historical US GDP and IT Spending Growth Rates, 1989-2000 19
Revised Worldwide IT Spending Growth Rates, 2000 - 2003, October 11th 2001 20
Worldwide IT Spending Growth 2001 & 2002 20
Worldwide IT Spending by Category, 1999 - 2003 (in billions) 21
Estimated Worldwide IT Spending by Category, 2001 (in billions and as a % oftotal spending) 22
Estimated Worldwide IT Revenues by Category, 2001 (in billions) 23
Estimated Worldwide IT Revenue Growth by Category, 2001 23
Estimated Worldwide IT Revenue Growth by Category, 2002 24
Telecommunications Spending by Region, 2000 & 2004 (in billions) 25
Telecommunications Spending by Category - Summary, Worldwide, 1999 -2004 (in billions) 25
Top 10 Communications Equipment Companies by Market Capitalization,September 7th 2001 (in billions) 26
Breakdown of Worldwide IT Equipment Spending by Category, 1999 (in billions) 27
Worldwide PC Market Revenue Forecast by Region, 2001 (in billions) 28
Top 10 Server Vendors by Revenues, 2001 (in billions and as a % of marketshare) 29
Top 10 Enterprise Hardware Equipment Companies by Market Capitalization,September 7th 2001 (in billions) 30
Top 10 PC’s and Peripherals Manufacturers by Market Capitalization,September 7th 2001 (in billions) 31
Worldwide Software Spending, 2000 - 2005 (in billions) 32
Breakdown of Worldwide Software Market, 2005 (in billions) 32
Worldwide Software Market by Category, 2000 - 2005 (in billions) 33
Worldwide Software Market by Category and Platform, 2001 (in billions) 33
Breakdown of Worldwide Corporate Software Spending by Category,1995 - 2000 (in billions) 33

©2001 eMarketer, Inc. Reproduction of information sourced as eMarketer is prohibited without prior, written permission.Note: all data in this report (other than that sourced as eMarketer) was obtained from published, publicly available information.
137
The IT Spending Report
Index of ChartsTop 15 Software Companies by Revenues, 2000 (in billions and as a % ofmarket share) 35
Worldwide IT Services Spending, 2000 & 2005 (in billions) 36
Worldwide Technology Development & Integration Services Spending, 2000 &2005 (in billions) 36
Worldwide Technology Business Process Management Services Spending,2000 & 2005 (in billions) 37
Worldwide IT Services Market by Region, 2001 (in billions) 37
Breakdown of Worldwide IT Services Market, 2005 (in billions) 38
Breakdown of Worldwide IT Services Market by Service, 2001 39
Top 10 Worldwide IT Services Vendors by Revenue Estimates, 1999 & 2000 (inbillions) 40
Top 10 IT Services Companies by Market Capitalization, September 7th 2001(in billions) 41
Estimated Worldwide Spending on Internet Technologies, 1999 & 2004 (inbillions) 42
Worldwide IT Spending on Dedicated E-Business Technology, 2000 & 2001 (inbillions) 42
Estimated Spending on Internet Technology by US Businesses, 2000 & 2004 (inbillions) 43
Top 10 Countries’ Aggregate Spending on E-Business Technology 2001 - 2004(in billions) 44
Top 10 Countries’ Aggregate Spending on E-Business Technology by Year-End2001, (in billions) 45
IT Spending Forecast for North America, 2001-2005 (in billions) 48
IT Spending Forecast for North America, 2001-2005 (in billions) 49
Breakdown of IT Equipment Spending in North America by Category, 1999 (inbillions and as a % of total) 50
Estimated US IT Spending by Category, 2001 (in billions and as a % of totalspending) 51
Estimated Cost of Replacing IT Equipment Following the Attack on the WorldTrade Center, September 2001 52
US “Worst Case Scenario” IT Spending Growth 2000 - 2003 53
Revised IT Spending Growth Rates for North America, 2000 - 2003, October11th 2001 53
North American Companies’ Information Systems Budgets as a Percent ofRevenues, 1991-2000 55
North American Companies’ Information Systems Budget Growth Rates,1991-2000 55
North American Companies Information Systems Budget Allocation,2000 56
US IT Spending as a Portion of Total Business Capital Spending, 1999 57
Breakdown of US Business Spending on IT, 1999 (in billions) 57
US Commercial Spending on IT, 2001 & 2005 (in billions) 58
US Federal Government Spending on IT, 2001-2005 (in billions) 58
US State and Local Government Spending on IT, 2001 & 2005 (in billions) 58
US State and Local Government IT Spending, 2001 & 2005 (in billions) 59

©2001 eMarketer, Inc. Reproduction of information sourced as eMarketer is prohibited without prior, written permission.Note: all data in this report (other than that sourced as eMarketer) was obtained from published, publicly available information.
138
The IT Spending Report
Index of ChartsIT Spending Forecast for Western Europe, 2001-2005 (in Billions) 62
Estimated European IT Spending by Category, 2001 (in billions and as a % oftotal spending) 63
IT Equipment Spending in Europe, 2001 - 2005 (in billions) 63
Breakdown of IT Equipment Spending in Europe by Category, 1999 (in billionsand as a % of total) 64
Select European Countries’ Share of Worldwide Information andCommunications Technology Spending, 1992 & 1999 64
IT Equipment Spending in Germany, 2001 - 2005 (in billions) 65
IT Equipment Spending in the United Kingdom, 2001 - 2005 (in billions) 65
IT Equipment Spending in France, 2001 - 2005 (in billions) 66
IT Equipment Spending in Italy, 2001 - 2005 (in billions) 66
“Worst Case Scenario” IT Spending Growth in Europe 2000 – 2004 67
Revised IT Spending Growth Rates for Western Europe, 2000 - 2003, October11th 2001 68
Leading European Countries’ Aggregate Spending on E-Business Technology2001 - 2004 (in billions) 69
European Companies’ Information Systems Budgets as a Percent ofRevenues, 1991-2000 70
European Companies’ Information Systems Budget Growth Rates,1991-2000 71
European Companies’ Information Systems Budget Allocation, 2000 71
IT Spending Forecast for the Asia-Pacific Region, 2001-2005 (in billions) 74
Information Technology Spending in Top Asia-Pacific Countries, 2001-2005(in billions) 74
Estimated Asia-Pacific Region IT Spending by Category, 2001 (in billions and asa % of total spending) 75
IT Equipment Spending in Asia-Pacific Region (excluding Japan), 2001 - 2005 (in billions) 76
IT Equipment Spending in Japan, 2001 - 2005 (in billions) 76
Breakdown of IT Equipment Spending in Asia by Category, 1999 (in billions andas a % of total) 77
Breakdown of IT Spending in the Asia-Pacific Region (excluding Japan) byCategory, 2000 & 2003 (in billions) 77
Revised IT Spending Growth Rates for the Asia-Pacific Region, 2000 - 2003,October 11th 2001 78
China’s Share of Worldwide Information and Communication TechnologySpending, 1992 & 1999 78
Breakdown of IT Spending in China, by Category 2000 & 2003 (in billions) 79
Breakdown of IT Spending in South Korea by Category, 2003 (in billions) 79
Breakdown of IT Spending in Australia, by Category 2000 & 2003(in billions) 80
Breakdown of IT Spending in India by Category, 2003 (in billions) 80
Estimated IT Spending in Taiwan, Singapore and Hong Kong, 2000 & 2003 (inbillions) 81
Asian Companies’ Information Systems Budgets as a Percent of Revenues,1997-2000 82

©2001 eMarketer, Inc. Reproduction of information sourced as eMarketer is prohibited without prior, written permission.Note: all data in this report (other than that sourced as eMarketer) was obtained from published, publicly available information.
139
The IT Spending Report
Index of ChartsAsian Companies’ Information Systems Budget Growth Rates,1997-2000 83
Asian Companies’ Information Systems Budget Allocation, 2000 83
Japanese Companies’ IT Spending Intentions, July 2001 84
IT Spending Forecast for the Latin America, 2001-2005 (in Billions) 86
Estimated Latin American IT Spending by Category, 2001 (in billions and as a %of total spending) 87
IT Equipment Spending in Latin America, 2001 - 2005 (in billions) 87
Breakdown of IT Equipment Spending in Latin America by Category, 1999 (inbillions and as a % of total) 88
Percent of Latin American Companies’ IT Budgets Spent on Internet Initiatives,2000 & 2001 88
Worldwide IT Spending by Industry, 2000 & 2003 (in billions) 90
US IT Spending by Industry, 1999 (in billions) 91
Estimated US IT Spending by Industry, 2001 (in billions and as a % of totalspending) 92
Average Percentage Change in Technology Budget Over Prior Year, by Industry2000 & 2001 93
Global 2000 Company IT Spending as a % of Total Company Revenues,2000 94
Estimated Global 2000 Company IT Spending as a % of Total CompanyRevenues, 2001 & 2002 95
US Companies’ Average Annual IT Budget by Industry, 2001 (as a % ofestimated company worldwide sales) 97
US Companies’ Average Annual IT Budget by Industry, 2001 (in millions) 98
Worldwide Software Spending by Industry, 2000 & 2003 (in billions and as a %of total) 99
US IT Outsourcing Spending by Industry, 2001 & 2005 (in billions) 100
Breakdown of Small/Medium-Sized Business Spending on IT, Internet &Telecommunications, by Category 2000 (in billions and as a % of total) 103
Breakdown of Small/Medium-Sized Business Spending on IT, Internet &Telecommunications, by Category 2001 (in billions and as a % of total) 104
US Small Business Spending on IT by Category, 2001 (in billions) 104
US Small Business IT Spending by Business Size, 2001 (in billions) 105
Estimated US Small Business IT Spending by Category, 2001 (in billions and asa % of total spending) 105
Estimated US Small Office/Home Office IT Spending by Category, 2001 (inbillions and as a % of total spending) 106
Breakdown of Worldwide PC Unit Demand by Market Segment, 2001 106
Anticipated Business IT Budget Growth by Business Size, 2000 & 2001 107
Percent of Company Revenues Spent on IT, by Business Size, 2001 107
Estimated US Company IT Spending by Business Size, 2001 108
Estimated Spending on Internet Technology by US Medium and Large SizedBusinesses, 2000 & 2004 (in billions) 108
CEO Involvement in Major IT Projects During the Last Two Years,July 2001 112

©2001 eMarketer, Inc. Reproduction of information sourced as eMarketer is prohibited without prior, written permission.Note: all data in this report (other than that sourced as eMarketer) was obtained from published, publicly available information.
140
The IT Spending Report
Index of ChartsPercent of Firms in Which IT Department Initiates E-Business SolutionsPurchase, 2001 (by business size) 112
How CIOs Establish Their Company’s Annual IT Budgets, August 2001 113
How IT Managers Allocate Their IT Budgets, 2000 114
Percent of CIOs Who Believe That Their Organization Has Overspent onTechnology During the Past 3 Years 115
CIOs Number One Negative That Will Affect IT Spending Over the Next 12Months, August 2001 115
IT Managers’ Estimated IT ROI, 2000 117
Companies’ IT ROI by Region, 2000 117
Year Over Year Change in Importance of Measuring IT ROI, 2001 118
Percent of IT Managers Influenced by IT Vendor ROI Claims, 2001 118
How IT Managers Measure ROI on Their IT Investments, 2001 119
Percent of Businesses Spending More Than 26% of IT Budgets on InternetInitiatives, 2000 & 2001 120
Percent of IT Budget That CIOs Expect to Spend on Developing InternetSystems Over the Next 12 Months, August 2001(as a % of respondents) 123
US IT Managers’ Expectations for Internet Technology Spending Increases,2001 (% increase over previous year) 123
Percent of US Companies With a Separate Business Group Responsible for E-Business, 2000 & 2001 124
Reasons Why US Companies Do Not Measure ROI for E-Business Initiatives,2001 124
Reasons Used by US Companies to Justify The Pursuit of E-Business Initiatives,2001 125
Metrics Used by US Companies That Monitor the ROI of Their E-BusinessInitiatives, 2001 125
US and European CIOs Expected IT Budget Growth for 2001 126
IT Spending Intentions for 2001, July 2001 127
Effects of Slowing Economy on US Companies’ IT Spending Plans,July 2001 127
CIO Expectation That IT Budgets Would Grow Faster Than Overall CompanyCapital Spending, July 2001 128
CIOs Planning to Spend More on Technology Products and Services During theSecond Half of 2001, August 2001 128
Top 10 IT Areas Likely to See the Biggest Spending Increases During theSecond Half of 2001, August 2001 129
CIOs’ Expected Change in IT Budgets Over the Next 12 Months, September2001 130
CIOs Expectations for a Pickup in Their Own IT Spending, August & September2001 131
CIOs Planned Spending on Storage Systems Over the Next 12 Months, August& September 2001 132
CIOs Planned Spending on Data Networking Equipment Over the Next 12Months, August & September 2001 132
CIOs Planned Spending on E-Business Software (CRM, SCM, Procurement,Content Management) Over the Next 12 Months, August & September 2001 133

©2001 eMarketer, Inc. Reproduction of information sourced as eMarketer is prohibited without prior, written permission.Note: all data in this report (other than that sourced as eMarketer) was obtained from published, publicly available information.
141
The IT Spending Report
Index of ChartsCIOs Planned Spending on Telecommunications Equipment Over the Next 12Months, August & September 2001 133
CIOs Planned Spending on Computer Hardware (Desktops, Laptops, Servers)Over the Next 12 Months, August & September 2001 134

©2001 eMarketer, Inc. Reproduction of information sourced as eMarketer is prohibited without prior, written permission.Note: all data in this report (other than that sourced as eMarketer) was obtained from published, publicly available information.
142
The IT Spending Report
Also Available from eMarketer
Asia Online: Demographics, Infrastructure, Usage Patterns andeCommerce Trends
■ Economy & infrastructure■ Internet users & demographics■ eCommerce, E-Finance & E-Advertising■ Country profiles
ASPs■ Market size & growth■ Industry leaders■ Usage patterns■ Customer satisfaction
Brazil Online: Demographics, Usage Patterns and E-CommerceTrends
■ Economy & infrastructure■ Internet users & demographics■ E-Commerce, E-Finance & E-Advertising
Broadband■ Users by access method (dial-up, fiber, DSL, cable, satellite,
wireless)■ Residential and business usage■ Access revenues■ User demographics■ Country profiles
CRM■ Market size & growth■ Leading vendors■ Budgeting & implementation
eBanking■ Online banking around the world (US, Europe, Asia)■ Mobile banking■ Electronic bill presentment and payment
eCanada■ Economy & infrastructure■ Internet users & demographics■ E-Commerce, E-Finance & E-Advertising
eCommerce: B2B■ E-Commerce: B2B revenues around the world, country by country■ E-Commerce: B2B by industry■ Internet penetration among businesses■ Online marketplaces, auctions and exchanges
eCommerce: B2C■ E-Commerce: B2C revenues worldwide■ Top B2C categories■ Online shoppers, buying frequency and size of transactions■ E-Consumer attitudes and behaviors

©2001 eMarketer, Inc. Reproduction of information sourced as eMarketer is prohibited without prior, written permission.Note: all data in this report (other than that sourced as eMarketer) was obtained from published, publicly available information.
143
The IT Spending Report
eDemographics■ User demographics worldwide■ Age, gender and race■ Income, education and occupation■ Usage patterns
eGlobal■ Internet infrastructure, by region■ Users and usage, by region■ E-Demographics, by region■ E-Commerce, by region
eHealth■ Consumer demographics and attitudes■ Healthcare personnel, demographics and usage■ B2C spending■ B2B spending
eInvesting■ Online brokerages■ Online mutual funds■ Online asset management■ Online investment advice
eMail Marketing■ E-Mail marketing revenues worldwide■ E-Mail users and user demographics■ Permission, opt-in and opt-out■ E-Mail marketing techniques and strategies
ePoland■ Economy & infrastructure■ Internet users & demographics■ E-Commerce, E-Finance & E-Advertising
ePrivacy & Security■ Consumer attitudes & behavior toward online privacy■ Online fraud■ Credit card security■ Corporate security (hacking and denial-of-service attacks)■ Virus attacks
Europe Online■ Economy & infrastructure■ Internet users & demographics■ E-Commerce, E-Finance & E-Advertising■ Country profiles
eWireless■ Mobile internet use around the world, country by country■ M-Commerce■ M-Finance■ M-Advertising

©2001 eMarketer, Inc. Reproduction of information sourced as eMarketer is prohibited without prior, written permission.Note: all data in this report (other than that sourced as eMarketer) was obtained from published, publicly available information.
144
The IT Spending Report
Interactive Television■ User forecast■ Revenue forecast■ Business attitudes & behavior■ User attitudes & behavior
Japan Online: Demographics, Usage Patterns and E-CommerceTrends
■ Economy & infrastructure■ Internet users & demographics■ E-Commerce, E-Finance & E-Advertising
Latin America Online: Demographics, Infrastructure, UsagePatterns and E-Commerce Trends
■ Economy & infrastructure■ Internet users & demographics■ E-Commerce, E-Finance & E-Advertising■ Country profiles
Marketing Online to Kids & Teens■ Demographics■ Advertising & marketing■ E-Commerce■ Special considerations
Online Advertising: Statistics, Strategies, Tools and Trends■ eAdvertising revenues worldwide■ Spending by ad format (banner ads, sponsorships, e-mail, etc.)■ Spending by industry category■ Measurements and standards (click-through rates, CPMs, ROI)
Online Marketing■ Viral marketing■ Direct marketing vs. Branding■ Search engine optimization■ Affiliate programs■ Classifieds■ Coupons
For more information, or to order a copy, contact eMarketer at:
Phone: 212.677.6300 Fax: 212.777.1172
eMail: [email protected] Web: www.emarketer.com
For media inquiries:Terry Chabrowe, [email protected]
For inquiries about this report or other eMarketer reports:Nick Fainelli, New Business Development, [email protected]