the journal of chemistry in c.s crystal structure … · crystal structure and electron transfer...
TRANSCRIPT
T H E JOURNAL OF BIOLOGICAL CHEMISTRY Vol. 257, No. 23, Issue of December 10, pp. 14341-14348, 1982 Printed in C.S A .
Crystal Structure and Electron Transfer Properties of Cytochrome c3*
(Received for publication, January 25, 1982)
Marcel Pierrot, Richard Haser$, Michel Frey, Franqoise Payan, and Jean-Pierre Astier From the CRMC2, Centre National de la Recherche Scientifique, Campus de Luminy, Case 913, 13288 Marseille Cedex 09, France
The crystal structure of cytochrome c3 from the sul- fate-reducing bacteria Desulfovibrio desulfuricans, Norway strain, has been determined through the fitting of the recently completed primary structure to a 2.5 A resolution electron density map. The phase calculations were based on three mercurial derivatives; anomalous scattering data were used to refine the four heme iron positions. A preliminary refinement of the molecular model has led to a conventional crystallographic R factor of 34%. Cytochrome c3 is folded in two structural domains with one heme in each, the two other heme moieties lying in a large groove dividing the molecule. The core of the protein is the compact four-heme cluster which presents a relatively high degree of solvent ex- posure. The structural pattern of redox centers sug- gests that electron transfer might occur through direct contacts between some of the heme groups, via the overlapping system of T oribitals or via intervening amino acid side chains or both,
The metabolism of anaerobic bacteria of the genus Desul- fovibrio has been intensively studied (Ref. 1 and references therein). These bacteria use either molecular hydrogen or organic substrates as initial electron donors and sulfate ions (or in some cases even elemental sulfur) as terminal electron acceptors within a complex electron transport chain. The ultimate product of these reactions is hydrogen sulfide. Mo- lecular hydrogen enters the system via an enzyme, hydrogen- ase (hydrogen:ferricytochrome oxidoreductase, EC 1.12.2.1) which specifically reduces the low potential cytochrome c:~, which in turn reduces ferredoxin. In this transport chain cytochrome c3 appears to play a key role. It can accept electrons from hydrogenase, but also from a system (coupled to NADH) at a more negative or positive potential than the H2/H+ couple, and then can act as an electron donor for hydrogenase (2). The specific interactions between these two proteins have also been clearly shown in the reduction of colloidal sulfur (3) and the results confirm that cytochrome c3 has a sulfur reductase activity: hydrogenase and cytochrome c3 form a soluble complex able to transfer electrons from molecular hydrogen to So, which then is reduced to H,S. In Desulfovibrio species, this enzyme is specific for cytochrome c3, the presence of which is strictly required for further reduc- tion of ferredoxin, flavodoxin, rubredoxin, etc.
The properties of c3-type cytochromes are far from being fully understood. According to NMR (7 , B), EPR (9), and
* This work has been supported by the Centre National de la Recherche Scientifique and the Delegation Generale a la Recherche Scientifique et Technique. The costs of publication of this article were defrayed in part by the payment of page charges. This article must therefore be hereby marked “aduertisernent” in accordance with 18 U.S.C. Section 1734 solely to indicate this fact.
$. Recipient of an European Molecular Biology Organization Fel- lowship. To whom correspondence should be addressed.
electrochemical (10, 11) studies, it appeared that the four hemes are in nonequivalent sites and act at different redox potentials. A number of speculations on the electron transfer properties of these cytochromes have also been put forward. In conjunction with these studies, structural investigations, based on x-ray diffraction data were clearly needed for a better approach to the functional roles of these multiredox center proteins.
The folding of cytochrome cs (DesuZfovibrio desulfuricans, Norway strain) has already been published (12). The molecule consists of a single polypeptide chain wrapped around a com- pact core of four nonparallel hemes. I t was emphasized (12, 13) that the three-dimensional model was in serious disa- greement with the structure proposed earlier for a homolo- gous cytochrome CR (Desulfouibrio vulgaris, Hildenborough strain). Furthermore, it was then suggested that the spatial arrangement found for cytochrome c3 (D. desulfuricans, Nor- way strain) is representative of the cytochrome cg molecule generally.
In the present paper we describe the atomic model of cytochrome cQ (D. desulfuricans, Norway strain) which results from the interpretation of a 2.5 A resolution electron density map with the aid of the recently completed sequence (14). Along with the description of the structural features which are thought to be relevant for cytochrome c:? function, we put forward proposals for electron transfer routes within these proteins.
EXPERIMENTAL PROCEDURES
Crystals, Heavy Atom Derivatives, and Data Collection-An ac- count of the crystallization procedure has previously been given (15). The space group is P3, (or P31) and the unit cell dimensions are a = b = 43.72 A; c = 64.45 A with I molecule/asymmetric unit.
Soaking conditions for successful heavy atom derivatives are sum- marized in Table I. These derivatives did not show any significant deviation in all cell dimensions from the native crystals. Native and derivative data sets including symmetry- and Friedel-related reflex- ions were collected on an Enraf-Nonius CAD-4 diffractometer using CuK,, radiation (Ni-fdter).
For both native and derivative crystals, every set of data was measured with a unique crystal of about 0.4 X 0.4 X 0.8 mm which generally showed a loss of intensity due to radiation damage of less than 20% on average. The measured intensities were corrected for background, Lorentz polarization, and absorption (16). During data collection, 6 standard reflections were monitored every 100 reflections. In addition, a block of 50 reflections was measured before starting the data collection and at the end. These reflections, randomly distributed in the reciprocal space, were used to apply a radiation damage correction as a function of both time and resolution (17). Some statistical results are summarized in Table 11.
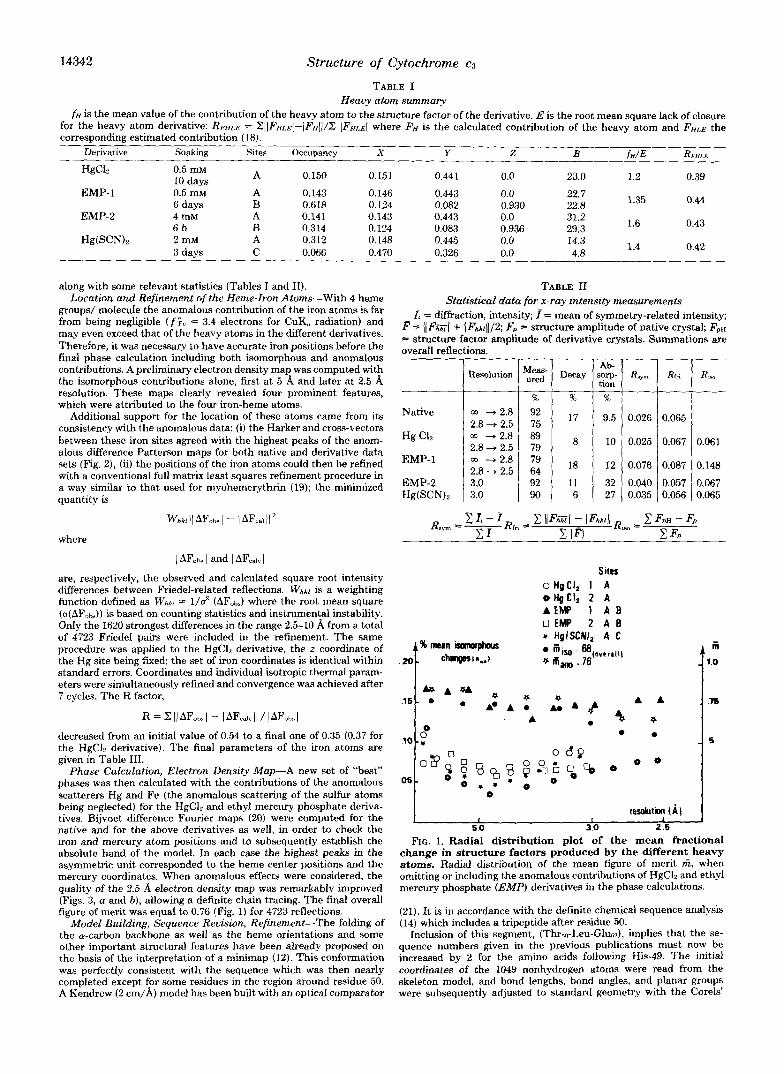
The radial distribution plot of the fractional changes in structure factors produced by each derivative is shown in Fig. 1. Heavy atom sites were located for each derivative from isomorphous and anoma- lous difference Patt.erson maps. Mercury chloride which produced the smallest isomorphous change corresponds to a single binding site A which is common to ethyl mercury phosphate and Hg(SCN)p deriv-
carried out using FHLE coefficients (18). Final parameters are reported atives. Least squares refinement of heavy atom parameters was
14341
14342 Structure of Cytochrome c3
TABLE I Heavy atom summary
f~ is the mean value of the contribution of the heavy atom to the structure factor of the derivative. E is the root mean square lack of closure for the heavy atom derivative: RFHLE = ZIIFHLEI-JFHII/Z ~ F H L E ~ where FH is the calculated contribution of the heavy atom and FHLE the corresponding estimated contribution (18).
Derivative Soaking Sites Occupancy X Y z B fH/E Rw1.P;
HgCL 0.5 mM 10 days
6 days B 0.618 0.124 0.082 0.930 22.8
6 h B 0.314 31.2
0.124 0.083 0.936 29.3 Hg(SCN)2 2 mM A 0.312 0.148 0.445 0.0 14.3
3 days C 0.066 0.470 0.326 0.0 4.8
A 0.150 0.151 0.441 0.0 23.0 1.2 0.39
EMP-I 0.5 mM A 0.143 0.146 0.443 0.0 22.7 1.35 0.44
1.6 0.43
1.4 0.42
EMP-2 4 mM A 0.141 0.143 0.443 0.0
along with some relevant statistics (Tables I and 11). Location and Refinement of the Heme-Iron Atoms-With 4 heme
groups/ molecule the anomalous contribution of the iron atoms is far from being negligible ( fa , = 3.4 electrons for CuK, radiation) and may even exceed that of the heavy atoms in the different derivatives. Therefore, it was necessary to have accurate iron positions before the final phase calculation including both isomorphous and anomalous contributions. A preliminary electron density map was computed with the isomorphous contributions alone, fust at 5 A and later at 2.5 A resolution. These maps clearly revealed four prominent features, which were attributed to the four iron-heme atoms.
Additional support for the location of these atoms came from its consistency with the anomalous data: (i) the Harker and cross-vectors between these iron sites agreed with the highest peaks of the anom- alous difference Patterson maps for both native and derivative data sets (Fig. 2), (ii) the positions of the iron atoms could then he refined with a conventional full matrix least squares refinement procedure in a way similar to that used for myohemerythrin (19); the minimized quantity is
W h k / 1 1 AF,I,, I - 1 AF,.I 1 1 where
I AFoh.; I and I AFrde I are, respectively, the observed and calculated square root intensity differences between Friedel-related reflections. WW is a weighting function defined as Wm 5 1/02 ( A F d where the root mean square (o(AF,b)) is based on counting statistics and instrumental instability. Only the 1620 strongest differences in the range 2.5-10 A from a total of 4723 FriedeI pairs were included in the refinement. The same procedure was applied to the HgC12 derivative, the z coordinate of the Hg site being fixed the set of iron coordinates is identical within standard errors. Coordinates and individual isotropic thermal param- eters were simultaneously refined and convergence was achieved after 7 cycles. The R factor,
R = I: 1 1 AF,I, 1 - I AFcdc ( 1 / I AFut,b I decreased from an initial value of 0.54 to a final one of 0.35 (0.37 for the HgC12 derivative). The final parameters of the iron atoms are given in Table 111.
Phase Calculation, Electron Density Map-A new set of "best" phases was then calculated with the contributions of the anomalous scatterers Hg and Fe (the anomalous scattering of the sulfur atoms being neglected) for the HgClz and ethyl mercury phosphate deriva- tives. Bijvoet difference Fourier maps (20) were computed for the native and for the above derivatives as well, in order to check the iron and mercury atom positions and to subsequently establish the absolute hand of the model. In each case the highest peaks in the asymmetric unit corresponded to the heme center positions and the mercury coordinates. When anomalous effects were considered, the quality of the 2.5 electron density map was remarkably improved (Figs. 3, a and b), allowing a definite chain tracing. The final overall figure of merit was equal to 0.76 (Fig. 1) for 4723 reflections.
Model Building, Sequence Revision, Refinement-The folding of the a-carbon backbone as well as the heme orientations and some other important structural features have been already proposed on the basis of the interpretation of a minirnap (12). This conformation was perfectly consistent with the sequence which was then nearly completed except for some residues in the region around residue 50. A Kendrew (2 cm/A) model has been built with an optical comparator
TABLE I1 Statistical data for x-ray intensity measurements
I, = diffraction, intensity; I= mean of symmetry-related intensity; F - IIF,iil + I F,&2; F, = structure amplitude of native crystal; F P ~ = structure factor amplitude of derivative crystals. Summations are overall reflections. -
Resolution R , Rm Ray,,, sorp- Decay %s- Ab-
tion % % %
Native m + 2.8 92 I 2.8 + 2.5 I 75 ! I7 ! 9'5 ! o.026 I 0'065 I Hg CL
0.148 0.087 0.076 18 12 79 "f 2'8 EMP-I
0.061 0.067 0.025
8 1 10
89 rn 2.8 2.8 "* 2.5
64 2.8 - 2.5
79
EMP-2 3 0 Hg(SCN)2 I 3:O 1 90 1 6 1 27 1 0.035 1 0.056 10.065
92 11 32 0.040 0.057 0.067
r e d t i o n (A) I I 1
5.0 30 2.6 FIG. 1. Radial distribution plot of the mean fractional
change in structure factors produced by the different heavy atoms. Radial distribution of the mean figure of merit f i , when omitting or including the anomalous contributions of HgC12 and ethyl mercury phosphate (EMF') derivatives in the phase calculations.
(21). It is in accordance with the definite chemical sequence analysis (14) which includes a tripeptide after residue 50.
Inclusion of this segment, (Thrm-Leu-Glued, implies that the se- quence numbers given in the previous publications must now he increased by 2 for the amino acids following His-49. The initial coordinates of the 1049 nonhydrogen atoms were read from the skeleton model, and bond lengths, bond angles, and planar groups were subsequently adjusted to standard geometry with the Corels'
Structure of Cytochrome CR 14343
m=' h 3- f i l
/ -a i Frl -hl
1.m
z= 0 . l l l
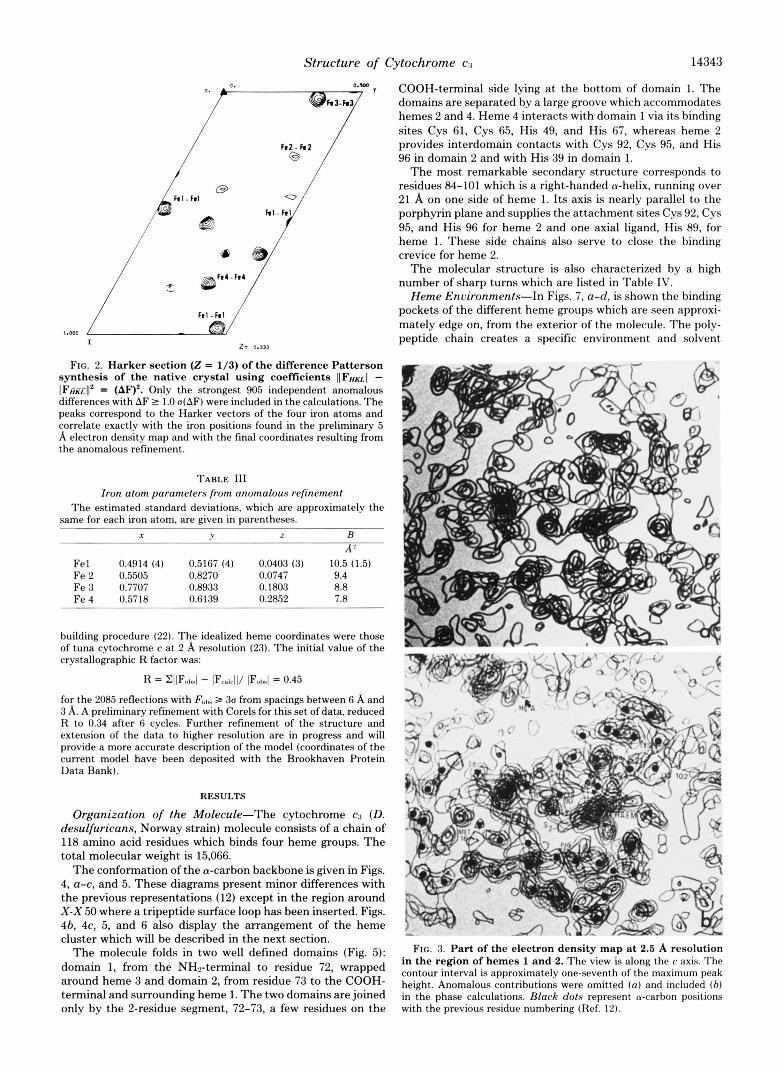
FIG. 2. Harker section (2 = 1/3) of the difference Patterson synthesis of the native crystal using coefficients I(FHU( - IFfi&-jI* = (AF)'. Only the strongest 905 independent anomalous differences with AF 2 1.0 a(AF) were included in the calculations. The peaks correspond to the Harker vectors of the four iron atoms and correlate exactly with the iron positions found in the preliminary 5 A electron density map and with the final coordinates resulting from the anomalous refinement.
TABLE 111 Iron atom parameters from anomalous refinement
The estimated standard deviations, which are approximately the same for each iron atom, are given in parentheses.
X Y z B A'
Fel 0.4914 (4) 0.5167 (4) 0.0403 (3) 10.5 (1.5) Fe 2 0.5505 0.8270 0.0747 9.4 Fe 3 0.7707 0.8933 0.1803 8.8 F e 4 0.5718 0.6 139 0.2852 7.8
building procedure (22). The idealized heme coordinates were those of tuna cytochrome c a t 2 A resolution (23). The initial value of the crystallographic R factor was:
R = E l l F ~ l - lFca~cll/ 1F.h.l = 0.45
for the 2085 reflections with F,,,,. P 30 from spacings between 6 A and 3 A. A preliminary refinement with Corels for this set of data, reduced R to 0.34 after 6 cycles. Further refinement of the structure and extension of the data to higher resolution are in progress and will provide a more accurate description of the model (coordinates of the current model have been deposited with the Brookhaven Protein Data Bank).
RESULTS
Organization of the Molecule-The cytochrome c:) (D. desulfuricans, Norway strain) molecule consists of a chain of 118 amino acid residues which binds four heme groups. The total molecular weight is 15,066.
The conformation of the a-carbon backbone is given in Figs. 4, a-C, and 5. These diagrams present minor differences with the previous representations (12) except in the region around X-X 50 where a tripeptide surface loop has been inserted. Figs. 4b, 4c, 5, and 6 also display the arrangement of the heme cluster which will be described in the next section.
The molecule folds in two well defined domains (Fig. 5): domain 1, from the NHn-terminal to residue 72, wrapped around heme 3 and domain 2, from residue 73 to the COOH- terminal and surrounding heme 1. The two domains are joined only by the 2-residue segment, 72-73, a few residues on the
COOH-terminal side lying at the bottom of domain 1. The domains are separated by a large groove which accommodates hemes 2 and 4. Heme 4 interacts with domain 1 via i t s binding sites Cys 61, Cys 65, His 49, and His 67, whereas heme 2 provides interdomain contacts with Cys 92, Cys 95, and His 96 in domain 2 and with His 39 in domain 1.
The most remarkable secondary structure corresponds to residues 84-101 which is a right-handed a-helix, running over 21 A on one side of heme 1. Its axis is nearly parallel to the porphyrin plane and supplies the attachment sites Cys 92, Cys 95, and His 96 for heme 2 and one axial ligand, His 89, for heme 1. These side chains also serve to close the binding crevice for heme 2.
The molecular structure is also characterized by a high number of sharp turns which are listed in Table IV.
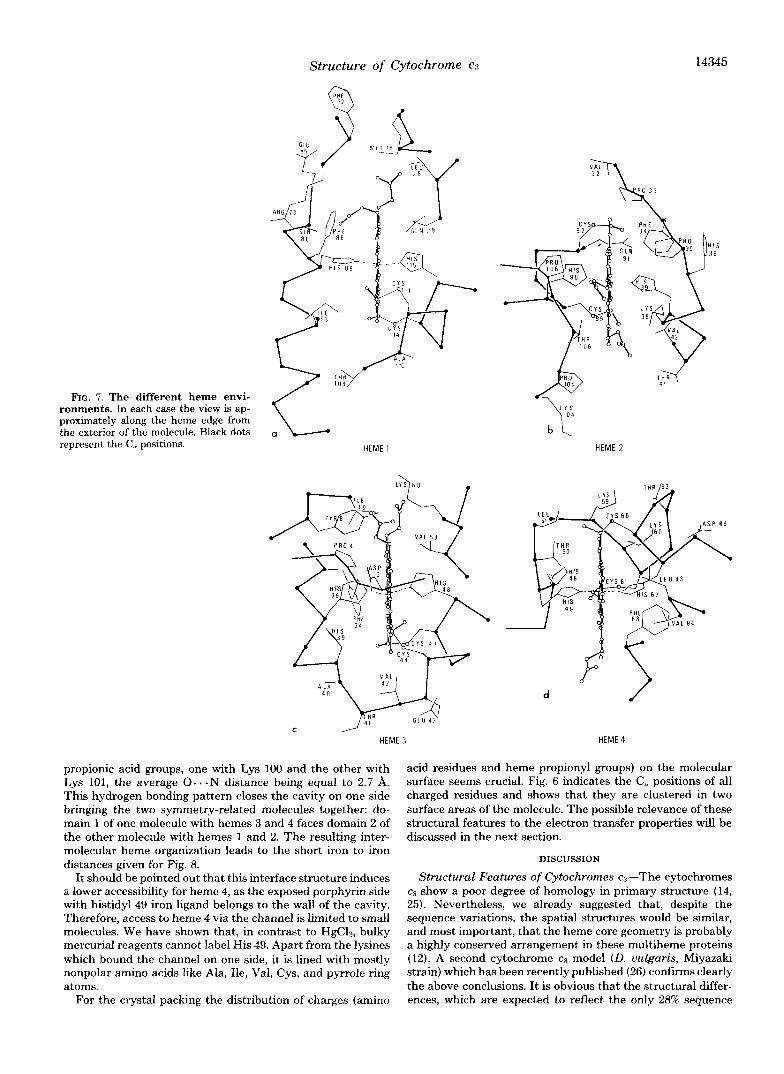
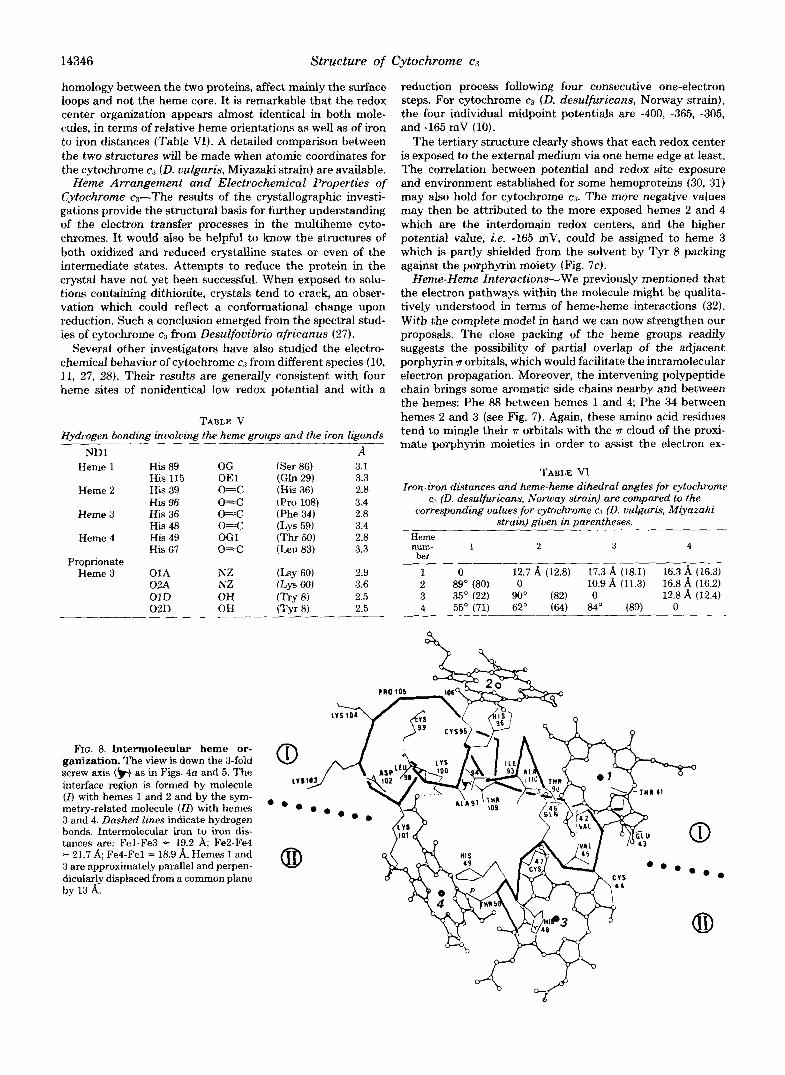
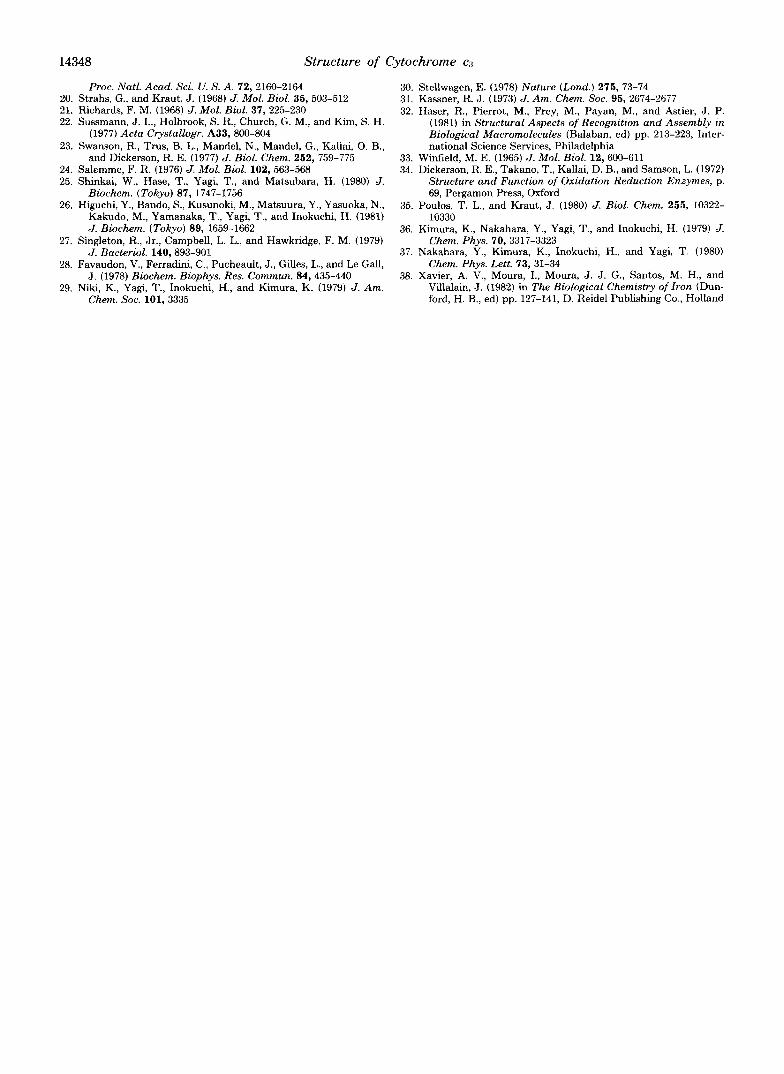
Heme Environments-In Figs. 7, a-d, is shown the binding pockets of the different heme groups which are seen approxi- mately edge on, from the exterior of the molecule. The poly- peptide chain creates a specific environment and solvent
FIG. 3. Part of the electron density map at 2.5 A resolution in the region of hemes 1 and 2. The view is along the c axis. The contour interval is approximately one-seventh of the maximum peak height. Anomalous contributions were omitted ( a ) and included ( 6 ) in the phase calculations. Black dots represent a-carbon positions with the previous residue numbering (Ref. 12).
14344 Structure of Cytochrome c:(
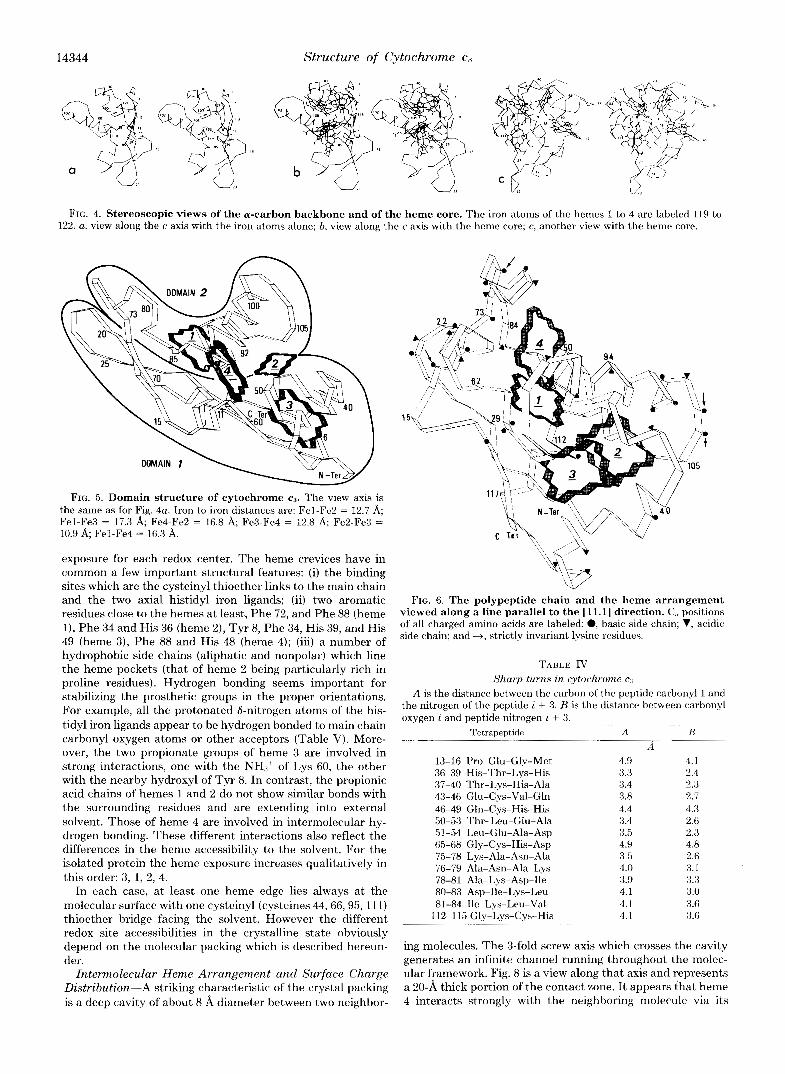
FIG. 4. Stereoscopic views of the a-carbon backbone and of the heme core. The iron atoms of the hemes 1 to 4 are labeled 119 to 122. a, view along the c axis with the iron atoms alone; b, view along the c axis with the heme core; c, another view with the heme core.
FIG. 5. Domain structure of cytochrome c8. The view axis is the same as for Fig. 4a. Iron to iron distances are: Fel-Fe2 = 12.7 A; Fel-Fe3 = 17.3 A; Fe4-Fe2 = 16.8 A; Fe3-Fe4 = 12.8 A; Fe2-Fe3 = 10.9 A; Fel-Fe4 = 16.3 A.
exposure for each redox center. The heme crevices have in common a few important structural features: (i) the binding sites which are the cysteinyl thioether links to the main chain and the two axial histidyl iron ligands; (ii) two aromatic residues close to the hemes at least, Phe 72, and Phe 88 (heme l), Phe 34 and His 36 (heme a) , Tyr 8, Phe 34, His 39, and His 49 (heme 3), Phe 88 and His 48 (heme 4); (iii) a number of hydrophobic side chains (aliphatic and nonpolar) which line the heme pockets (that of heme 2 being particularly rich in proline residues). Hydrogen bonding seems important for stabilizing the prosthetic groups in the proper orientations. For example, all the protonated &nitrogen atoms of the his- tidy1 iron ligands appear to be hydrogen bonded to main chain carbonyl oxygen atoms or other acceptors (Table V). More- over, the two propionate groups of heme 3 are involved in strong interactions, one with the NH.l+ of 1,ys 60, the other with the nearby hydroxyl of Tyr 8. In contrast, the propionic acid chains of hemes 1 and 2 do not show similar bonds with the surrounding residues and are extending into external solvent. Those of heme 4 are involved in intermolecular hy- drogen bonding. These different interactions also reflect the differences in the heme accessibility to the solvent. For the isolated protein the heme exposure increases qualitatively in this order: 3, 1, 2 , 4.
In each case, at least one heme edge lies always at the molecular surface with one cysteinyl (cysteines 44, 66,95, 111) thioether bridge facing the solvent. However the different redox site accessibilities in the crystalline state obviously depend on the molecular packing which is described hereun- der.
Intermolecular Heme Arrangement and Surface Charge Distrihution-A striking characteristic of the crystal packing is a deep cavity of about 8 A diameter between two neighbor-
FIG. 6. The polypeptide chain and the heme arrangement viewed along a line parallel to the 111.11 direction. C,, positions of all charged amino acids are labeled: 0, basic side chain; V, acidic side chain; and 4, strictly invariant lysine residues.
TABLE IV Sharp turns in cytochrome
A is the distance between the carbon of the peptide carbonyl 1 and the nitrogen of the peptide i + 3. H is the distance between carbonyl oxygen i and peptide nitrogen i + 3.
~. ~~~ ~~~~~ ~
Tetrapeptide ~ ..
A n ~. ~~ ~~ ~~
A 13-16 Pro-Glu-Gly-Met 4.9 4. 1 36-39 His-l'hr-Lys-His 3.3 2.4 37-40 Thr-Lys-His-Ala 3.4 2.3 43-46 Glu-Cys-Val-Gln 3.8 2.7 46-49 Gln-Cys-His-His 4.4 4.3 50-53 Thr-Leu-Glu-Ala 3.4 2.6 51-54 Leu-Glu-Ala-Asp 3.5 2.3 65-68 Gly-Cys-His-Asp 4.9 4.8 75-78 Lys-Ala-Asn-Ala 3.5 2.6 76-79 Ala-Asn-Ala-Lys 4.0 3.1 78-81 Ala-Lys-Asp-lie 3.9 3.3 80-83 Asp-Ile-Lys-Leu 4.1 3.0 81 -84 Ile-Lys-Leu-Val 4.1 3.6
3.6 112-115 Gly-Lys-Cys-His 4.1 ~~~ ~ ~~ ~ ~ ~~~~ ~~
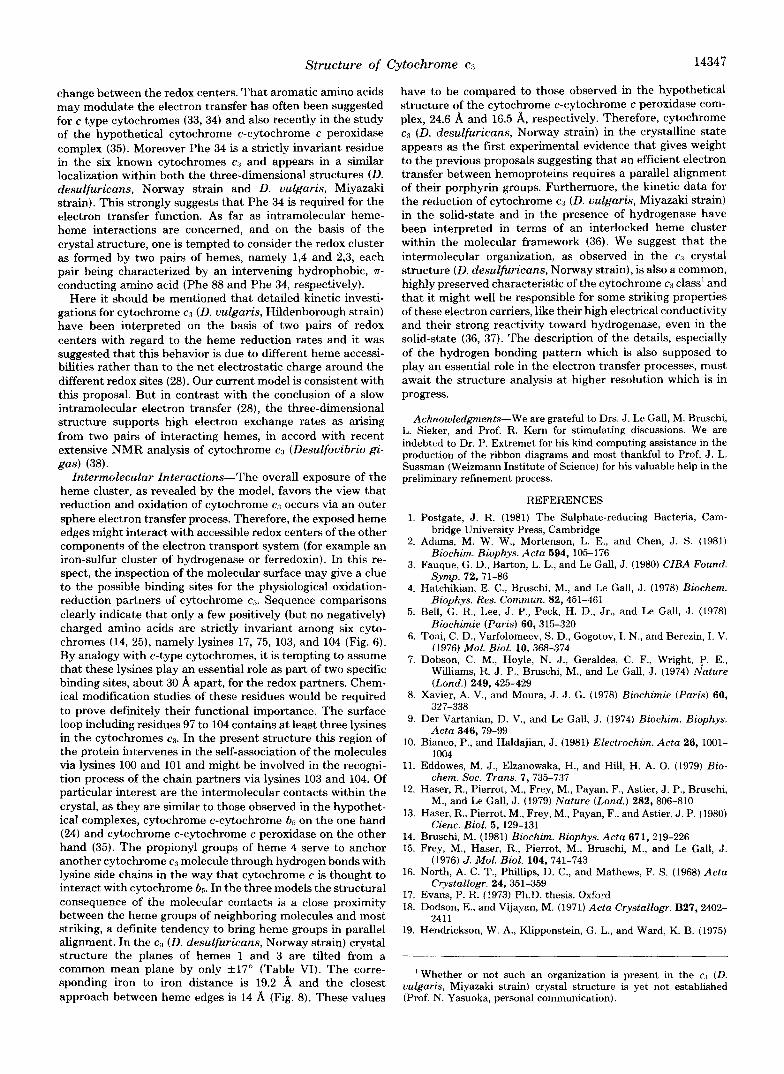
ing molecules. The 3-fold screw axis which crosses the cavity generates an infinite channel running throughout the molec- ular framework. Fig. 8 is a view along that axis and represents a 20-A thick portion of the contact zone. It appears that heme 4 interacts strongly with the neighboring molecule via its
Structure of Cytochrome cs 14345
FIG. 7. The different heme envi- ronments. In each case the view is ap- proximately along the heme edge from the exterior of the molecule. Black dots represent the C,, positions.
a b HEME 1
G l U 4'1
C HEME 3
propionic acid groups, one with Lys 100 and the other with Lys 101, the average 0. . - N distance being equal to 2.7 A. This hydrogen bonding pattern closes the cavity on one side bringing the two symmetry-related molecules together: do- main l of one molecule with hemes 3 and 4 faces domain 2 of the other molecule with hemes 1 and 2. The resulting inter- molecular heme organization leads to the short iron to iron distances given for Fig. 8.
It should be pointed out that this interface structure induces a lower accessibility for heme 4, as the exposed porphyrin side with histidyl 49 iron ligand belongs to the wall of the cavity. Therefore, access to heme 4 via the channel is limited to small molecules. We have shown that, in contrast to HgC12, bulky mercurial reagents cannot label His 49. Apart from the lysines which bound the channel on one side, it is lined with mostly nonpolar amino acids like Ala, Ile, Val, Cys, and pyrrole ring atoms.
For the crystal packing the distribution of charges (amino
b L HEME 2
d
HEME 4
acid residues and heme propionyl groups) on the molecular surface seems crucial. Fig. 6 indicates the C, positions of all charged residues and shows that they are clustered in two surface areas of the molecule. The possible relevance of these structural features to the electron transfer properties will be discussed in the next section.
DISCUSSION
Structural Features of Cytochromes cn-The cytochromes c3 show a poor degree of homology in primary structure (14, 25). Nevertheless, we already suggested that, despite the sequence variations, the spatial structures would be similar, and most important, that the heme core geometry is probably a highly conserved arrangement in these multiheme proteins (12). A second cytochrome c:3 model (D. vulgaris, Miyazaki strain) which has been recently published (26) confwms clearly the above conclusions. It is obvious that the structural differ- ences, which are expected to reflect the only 28% sequence
14346 Structure of Cytochrome cg
homology between the two proteins, affect mainly the surface loops and not the heme core. It is remarkable that the redox center organization appears almost identical in both mole- cules, in terms of relative heme orientations as well as of iron to iron distances (Table VI). A detailed comparison between the two structures will be made when atomic coordinates for the cytochrome c3 (D. uulgaris, Miyazaki strain) are available.
Heme Arrangement and Ekctrochemical Properties of Cytochrome c3-The results of the crystallographic investi- gations provide the structural basis for further understanding of the electron transfer processes in the multiheme cyto- chromes. It would also be helpful to know the structures of both oxidized and reduced crystalline states or even of the intermediate states. Attempts to reduce the protein in the crystal have not yet been successful. When exposed to solu- tions containing dithionite, crystals tend to crack, an obser- vation which could reflect a conformational change upon reduction. Such a conclusion emerged from the spectral stud- ies of cytochrome c3 from Desulfouibrio africanus (27).
Several other investigators have also studied the electro- chemical behavior of cytochrome c3 from different species (10, 11, 27, 28). Their results are generally consistent with four heme sites of nonidentical low redox potential and with a
TABLE V Hydrogen bonding involving the heme groups and the iron ligands
ND1 A Heme 1 His 89
His 115 Heme 2 His 39
His 96 Heme 3 His 36
His 48 Heme 4 His 49
His 67 Proprionate
Heme 3 01A 02A 01D 02D
OG OE 1 o=c o=c o=c o=c OG 1 o=C
NZ NZ OH OH
FIG. 8. Intermolecular heme or- ganization. The view is down the 3-fold screw axis (k) as in Figs. 4a and 5. The interface region is formed by molecule (I) with hemes 1 and 2 and by the sym- metry-related molecule (14 with hemes 3 and 4. Dashed lines indicate hydrogen bonds. Intermolecular iron to iron dis- tances are: Fel-Fe3 = 19.2 A; Fe2-Fe4 = 21.7 A; Fe4-Fel = 18.9 A. Hemes 1 and 3 are approximately parallel and perpen-
by 13 A. dicularly displaced from a common plane
3.1 3.3 2.8 3.4 2.8 3.4 2.8 3.3
2.9 3.6 2.5 2.5 __
reduction process following four consecutive one-electron steps. For cytochrome c3 (D. desulfuricans, Norway strain), the four individual midpoint potentials are -400, -365, -305, and -165 mV (10).
The tertiary structure clearly shows that each redox center is exposed to the external medium via one heme edge at least. The correlation between potential and redox site exposure and environment established for some hemoproteins (30, 31) may also hold for cytochrome c:+ The more negative values may then be attributed to the more exposed hemes 2 and 4 which are the interdomain redox centers, and the higher potential value, i.e. -165 mV, could be assigned to heme 3 which is partly shielded from the solvent by Tyr 8 packing against the porphyrin moiety (Fig. 7c).
Heme-Heme Interactions-We previously mentioned that the electron pathways within the molecule might be qualita- tively understood in terms of heme-heme interactions (32). With the complete model in hand we can now strengthen our proposals. The close packing of the heme groups readily suggests the possibility of partial overlap of the adjacent porphyrin n orbitals, which would facilitate the intramolecular electron propagation. Moreover, the intervening polypeptide chain brings some aromatic side chains nearby and between the hemes: Phe 88 between hemes 1 and 4; Phe 34 between hemes 2 and 3 (see Fig. 7 ) . Again, these amino acid residues tend to mingle their n orbitals with the 71 cloud of the proxi- mate porphyrin moieties in order to assist the electron ex-
TABLE VI Iron-iron distances and heme-heme dihedral angles for cytochrome
c3 (0. desulfuricans, Norway strain) are compared to the corresponding values for cytochrome c3 (R. vulgaris, Miyazaki
strain) given in parentheses. Heme num- 1 2 3 4 ber
1 0 12.7 A (12.8) 17.3 8, (18.1) 16.3 8, (16.3) 2 89" (80) 0 10.9 A (11.3) 16.8 8, (16.2) 3 35" (22) 90" (82) 0 12.8 A (12.4) 4 55" (71) 62" (64) 84' (89) 0
Structure of Cytochrome cs 14347
change between the redox centers. That aromatic amino acids may modulate the electron transfer has often been suggested for c type cytochromes (33,34) and also recently in the study of the hypothetical cytochrome c-cytochrome c peroxidase complex (35). Moreover Phe 34 is a strictly invariant residue in the six known cytochromes c3 and appears in a similar localization within both the three-dimensional structures (D. desulfuricans, Norway strain and D. vulgaris, Miyazaki strain). This strongly suggests that Phe 34 is required for the electron transfer function. As far as intramolecular heme- heme interactions are concerned, and on the basis of the crystal structure, one is tempted to consider the redox cluster as formed by two pairs of hemes, namely 1,4 and 2,3, each pair being characterized by an intervening hydrophobic, 71-
conducting amino acid (Phe 88 and Phe 34, respectively). Here it should be mentioned that detailed kinetic investi-
gations for cytochrome cR (D. uulgaris, Hildenborough strain) have been interpreted on the basis of two pairs of redox centers with regard to the heme reduction rates and it was suggested that this behavior is due to different heme accessi- bilities rather than to the net electrostatic charge around the different redox sites (28). Our current model is consistent with this proposal. But in contrast with the conclusion of a slow intramolecular electron transfer (28), the three-dimensional structure supports high electron exchange rates as arising from two pairs of interacting hemes, in accord with recent extensive NMR analysis of cytochrome cg (Desulfouibrio gi- gas) (38).
Intermolecular Interactions-The overall exposure of the heme cluster, as revealed by the model, favors the view that reduction and oxidation of cytochrome c g occurs via an outer sphere electron transfer process. Therefore, the exposed heme edges might interact with accessible redox centers of the other components of the electron transport system (for example an iron-sulfur cluster of hydrogenase or ferredoxin). In this re- spect, the inspection of the molecular surface may give a clue to the possible binding sites for the physiological oxidation- reduction partners of cytochrome cg. Sequence comparisons clearly indicate that only a few positively (but no negatively) charged amino acids are strictly invariant among six cyto- chromes (14, 25), namely lysines 17, 75, 103, and 104 (Fig. 6). By analogy with C-type cytochromes, it is tempting to assume that these lysines play an essential role as part of two specific binding sites, about 30 8, apart, for the redox partners. Chem- ical modification studies of these residues would be required to prove definitely their functional importance. The surface loop including residues 97 to 104 contains at least three lysines in the cytochromes cg. In the present structure this region of the protein intervenes in the self-association of the molecules via lysines 100 and 101 and might be involved in the recogni- tion process of the chain partners via lysines 103 and 104. Of particular interest are the intermolecular contacts within the crystal, as they are similar to those observed in the hypothet- ical complexes, cytochrome c-cytochrome bs on the one hand (24) and cytochrome c-cytochrome c peroxidase on the other hand (35). The propionyl groups of heme 4 serve to anchor another cytochrome cn molecule through hydrogen bonds with lysine side chains in the way that cytochrome c is thought to interact with cytochrome bs. In the three models the structural consequence of the molecular contacts is a close proximity between the heme groups of neighboring molecules and most striking, a definite tendency to bring heme groups in parallel alignment. In the cB (D. desulfuricans, Norway strain) crystal structure the planes of hemes 1 and 3 are tilted from a common mean plane by only + 1 7 O (Table VI). The corre- sponding iron to iron distance is 19.2 8, and the closest approach between heme edges is 14 8, (Fig. 8). These values
have to be compared to those observed in the hypothetical structure of the cytochrome c-cytochrome c peroxidase com- plex, 24.6 8, and 16.5 A, respectively. Therefore, cytochrome c3 (D. desulfuricans, Norway strain) in the crystalline state appears as the fist experimental evidence that gives weight to the previous proposals suggesting that an efficient electron transfer between hemoproteins requires a parallel alignment of their porphyrin groups. Furthermore, the kinetic data for the reduction of cytochrome c3 (D. uulgaris, Miyazaki strain) in the solid-state and in the presence of hydrogenase have been interpreted in terms of an interlocked heme cluster within the molecular framework (36). We suggest that the intermolecular organization, as observed in the c:$ crystal structure (D. desulfuricans, Norway strain), is also a common, highly preserved characteristic of the cytochrome c : ~ class' and that it might well be responsible for some striking properties of these electron carriers, like their high electrical conductivity and their strong reactivity toward hydrogenase, even in the solid-state (36, 37). The description of the details, especially of the hydrogen bonding pattern which is also supposed to play an essential role in the electron transfer processes, must await the structure analysis at higher resolution which is in progress.
Acknowledgments-We are grateful to Drs. J. Le Gall, M. Bruschi, L. Sieker, and Prof. R. Kern for stimulating discussions. We are indebted to Dr. P. Extremet for his kind computing assistance in the production of the ribbon diagrams and most thankful to Prof. J . L. Sussman (Weizmann Institute of Science) for his valuable help in the preliminary refinement process.
1.
2.
3.
4.
5.
6.
7.
8.
9.
10.
11.
12.
13.
14. 15.
16.
17. 18.
19.
-
REFERENCES Postgate, J . R. (1981) The Sulphate-reducing Bacteria, Cam-
Adams, M. W. W., Mortenson, L. E., and Chen, J. S. (1981)
Fauque, G. D., Barton, L. L., and Le Gall, J. (1980) CZBA Found.
Hatehikian, E. C., Bruschi, M., and Le Gall, J . (1978) Biochem.
Bell, G . R., Lee, d. P., Peck, H. D., Jr., and Le Gall, J . (1978)
Toai, C. D., Varfolomeev, S . D., Gogotov, I. N., and Berezin, I. V.
Dobson, C. M., Hoyle, N. J., Geraldes, C. F., Wright, P . E., Williams, R. J . P., Bruschi, M., and Le Gall, J . (1974) Nature
Xavier, A. V., and Moura, J. J. G. (1978) Biochimie (Paris) 60,
Der Vartanian, D. V., and Le Gall, J. (1974) Biochim. Biophys.
Bianco, P., and Haldajian, J. (1981) Electrochim. Acta 26, 1001-
Eddowes, M. J., Elzanowska, H., and Hill, H. A. 0. (1979) Bio-
Haser, R., Pierrot, M., Frey, M., Payan, F., Astier, J. P., Bruschi,
Haser, R., Pierrot, M., Frey, M., Payan, F., and Astier, J. P. (1980)
Bruschi, M. (1981) Biochim. Biophys. Acta 671, 219-226 Frey, M., Haser, R., Pierrot, M., Bruschi, M., and Le Gall, J .
North, A. C. T., Phillips, D. C., and Mathews, F. S. (1968) Acta
Evans, P. R. (1973) Ph.D. thesis, Oxford Dodson, E., and Vijayan, M. (1971) Acta Crystallogr. B27,2402-
Hendrickson, W. A., Klippenstein, G. L., and Ward, K. B. (1975)
bridge University Press, Cambridge
Biochim. Biophys. Acta 594, 105-176
Symp. 72, 71-86
Biophys. Res. Commun. 82,451-461
Biochimie (Paris) 60, 315-320
(1976) Mol. Biol. 10, 368-374
(Land.) 249,425-429
327-338
Acta 346, 79-99
1004
chem. SOC. Trans. 7,735-737
M., and Le Gall, J. (1979) Nature (Lond.) 282, 806-810
Cienc. Biol. 5, 129-131
(1976) J. Mol. Biol. 104, 741-743
Crystallogr. 24,351-359
2411
' Whether or not such an organization is present in the c3 (D. uulgaris, Miyazaki strain) crystal structure is yet not established (Prof. N. Yasuoka, personal communication).
14348 Structure of Cytochrome c.1
Proc. Natl. Acad. Sci. U. S. A . 72, 2160-2164 20. Strahs, G., and Kraut, J. (1968) J. Mol. Biol. 35, 503-512 21. Richards, F. M. (1968) J . Mol. Biol. 37, 225-230 22. Sussmann, J . L., Holbrook, S. R., Church, G. M., and Kim, S. H.
(1977) Acta Crystallogr. A33, 800-804 23. Swanson, R., Trus, B. L., Mandel, N., Mandel, G., Kallai, 0. B.,
and Dickerson, R. E. (1977) J. Biol. Chem. 252, 759-775 24. Salemme, F. R. (1976) J. Mol. Biol. 102, 563-568 25. Shinkai, W., Hase, T., Yagi, T., and Matsubara, H. (1980) J.
Biochem. (Tokyo) 87, 1747-1756 26. Higuchi, Y., Bando, S., Kusunoki, M., Matsuura, Y., Yasuoka, N.,
Kakudo, M., Yamanaka, T., Yagi, T., and Inokuchi, H. (1981) J. Biochem. (Tokyo) 89,1659-1662
27. Singleton, R., Jr., Campbell, L. L., and Hawkridge, F. M. (1979) J. Bacteriol. 140,893-901
28. Favaudon, V., Ferradini, C., Pucheault, J., Gilles, L., and Le Gall, J. (1978) Biochem. Biophys. Res. Commun. 84,435-440
29. Niki, K., Yagi, T., Inokuchi, H., and Kimura, K. (1979) J. Am. Chem. SOC. 101,3335
30. Stellwagen, E. (1978) Nature (Lond.) 275, 73-74 31. Kassner, R. J . (1973) J. Am. Chem. SOC. 95, 2674-2677 32. Haser, R., Pierrot, M., Frey, M., Payan, M., and Astier, J . P.
(1981) in Structural Aspects of Recognition and Assembly in Biological Macromolecules (Balaban, ed) pp. 213-223, Inter- national Science Services, Philadelphia
33. Winfield, M. E. (1965) J. Mol. Biol. 12, 600-611 34. Dickerson, R. E., Takano, T., Kallai, D. B., and Samson, L. (1972)
Structure and Function of Oxidation Reduction Enzymes, p. 69, Pergamon Press, Oxford
35. Poulos, T. L., and Kraut, J. (1980) J. Biol. Chem. 255, 10322- 10330
36. Kimura, K., Nakahara, Y., Yagi, T., and Inokuchi, H. (1979) J. Chem. Phys. 70,3317-3323
37. Nakahara, Y., Kimura, K., Inokuchi, H., and Yagi, T. (1980) Chem. Phys. Lett. 73,31-34
38. Xavier, A. V., Moura, I., Mowa, J . J . G., Santos, M. H., and Villalain, J. (1982) in The Biological Chemism of Iron (Dun- ford, H. B., ed) pp. 127-141, D. Reidel Publishing Co., Holland