the kenya national micronutrient survey 2011...appendix 2 97 appendix 2a: sources of dietary energy...
TRANSCRIPT

The Kenya National Micronutrient Survey 2011
Ministry of Health

The Kenya National Micronutrient Survey 2011
PartnersKenya Medical Research Institute (KEMRI)
Kenya National Bureau of Statistics (KNBS)
Ministry of Health (MoH) – Nutrition and Dietetics Unit (NDU)
National Public Health Laboratory Services (NPHLS)
United Nations Children’s Fund (UNICEF)
Micronutrient Initiative (MI)
Global Alliance for Improved Nutrition (GAIN)
World Food Programme (WFP)
Centre for Disease Control (CDC)
World Health Organisation (WHO)
Ministry of Health

i
The Kenya National Micronutrient Survey 2011
Acknowledgements
the Ministry of Health, KEMRI and KNBS as well as local administration in the various Counties.
Our sincere gratitude goes to partners, including UNICEF, MI, GAIN, WFP, CDC, WHO and Save the
late Usha Mudava of CDC who was instrumental in setting up the laboratories and ensuring SOPs were
undertook analyses of blood specimens for Haemoglobinopathies as well as Division of Vaccines and Immunization who provided invaluable support through supply of some of the Nitrogen tanks used in
We appreciate the role played by the former Provincial Directors of Public Health and Sanitation as well
Chiefs and Assistant Chiefs for ensuring security and mobilization of communities, provision of motor
Unit (formerly Division of Nutrition), MoH and those of Kenya National Bureau of Statistics. Other
success of this survey are also appreciated.
Most importantly, we wish to recognise and thank the many women, men and children who willingly participated in this study without whom there would be no results to report about. We also give special thanks to all those who participated in the data analysis and report writing processes not forgetting the
A special thanks to the external peer reviewer, Dr James A Berkeley, Centre for Tropical Medicine &
Gladys Mugambi,Head, Nutrition and Dietetics Unit,Ministry of Health

ii
The Kenya National Micronutrient Survey 2011
ForewordIn Kenya, like in many developing countries, malnutrition continues to contribute to morbidity and mortality concerns. More than half of the morbidity and mortality cases in children are attributable
the Government of Kenya, through the then Ministry of Public Health and Sanitation (currently Ministry of Health), to institute the Kenya National Micronutrient Survey (KNMS) in 2011 to generate data on
factors.
from the Ministry of Health, Kenya Medical Research Institute (KEMRI) and Kenya National Bureau
Micronutrient Initiative, Global Alliance For Improved Nutrition, World Food Programme, Centre for Disease Control and World Health Organization. Due to the nature of KNMS, covering both medical and socio-demographic/economic investigations, KEMRI and KNBS as the government lead institutions of the two types of surveys spearheaded its implementation.
establishing the prevalence of micronutrient malnutrition and selected infectious diseases related to
micronutrient interventions.
Dr. Yeri Kombe,Principal Investigator,KEMRI

iii
The Kenya National Micronutrient Survey 2011
Preface
surveys are necessary to understand the changes in the nutrition situation and accommodate new information on dietary intake and micronutrients status of the population. Ideally, it is supposed to be
result of the interventions which have been put in place by the Ministry of Health and other supporting
A steering committee led by MoH Nutrition Unit and comprising of KEMRI, KNBS and key development and implementing partners as lead members was constituted to plan for a national micronutrient survey and ensure that it was properly implemented. In addition, the steering committee was charged with fundraising for the survey. Alongside this committee, a technical committee led by KEMRI was established which comprised of the technical personnel from MoH, KEMRI and KNBS, in collaboration with UNICEF, MI, CDC, GAIN, WFP and WHO to design and implement the Kenya National Micronutrient Survey.
collection, laboratory analysis and quality control and data analysis. Chapter three is on response rates
anaemia and associated factors. Vitamin A status is presented in chapter six while Iodine status and zinc status results are presented in chapter seven and eight respectively. Chapter 9 discusses results on folate and vitamin B12
recommendations for the report are presented in Chapter 11.
Dr. Jackson Kioko, Dr. Gerald Mkoji,Director of Medical Services, Ag. Director,Ministry of Health KEMRI

iv
The Kenya National Micronutrient Survey 2011
Report prepared by:Dr. Yeri Kombe Kenya Medical Research Institute (KEMRI)
Dr. Lydia Kaduka Kenya Medical Research Institute (KEMRI)
Mrs. Zipporah Bukania-Apungu Kenya Medical Research Institute (KEMRI)
Mr. Moses Mwangi Kenya Medical Research Institute (KEMRI)
Mr. Erastus Muniu Kenya Medical Research Institute (KEMRI)
Mr. Richard Mutisya Kenya Medical Research Institute (KEMRI)
Mr. Philip Ndemwa Kenya Medical Research Institute (KEMRI)
Mrs. Gladys Mugambi HNDU Ministry of Health (MoH)
Mr. John Mwai, HNDU Ministry of Health (MoH)
Mrs. Lucy Gathigi-Maina HNDU Ministry of Health (MoH)
Mr. Benson Musau Ministry of Health (MoH)
Mr. Silas Mulwa Kenya National Bureau of Statistics (KNBS)
Mr. James Ng’ang’a Kenya National Bureau of Statistics (KNBS)
Mr. John Njihia National Public Health Laboratory Services (NPHLS)
Ms. Louise Mwirigi United Nations Children’s Fund (UNICEF)
Mr. Ismail Arte United Nations Children’s Fund (UNICEF)
Mr Edward Kutondo United Nations Children’s Fund (UNICEF)
Dr. Jacqueline Kung’u Micronutrient Initiative (MI)
Ms. Lucy Murage Micronutrient Initiative (MI)
Prof Frits van der Haar Micronutrient Initiative (MI)
Mr. James Wirth Global Alliance for Improved Nutrition (GAIN)
Mr. Mutua Mutuku Global Alliance for Improved Nutrition (GAIN)
Dr. Catherine Macharia-Mutie Global Alliance for Improved Nutrition (GAIN)

v
The Kenya National Micronutrient Survey 2011
Table of contentsAcknowledgements iForeword iiPreface iiiTable of contents vList of Tables xList of Tables xiiiAbbreviations and Acronyms xiv
EXECUTIVE SUMMARY xviiBackground xviiMethodology xviiiSocio-demographic and Economic Characteristics xixNutritional Status xixAnaemia, Iron Deficiency and Iron Deficiency Anaemia xxVitamin A Deficiency xxIodine Deficiency xxZinc Deficiency xxiFolate and Vitamin B12 Deficiency among women xxiiBreastfeeding patterns xxiiMicronutrient Supplementation xxiiDietary and Nutrient Intake xxiiiConclusions and Recommendations xxiii
CHAPTER 1: INTRODUCTION 11.1. Introduction 11.2. Malnutrition in Kenya 11.3. Interventions to combat malnutrition in Kenya 21.4. Survey Rationale and Objectives 3
1.4.1. General Objective 31.4.2. Specific Objectives 4
CHAPTER TWO: STUDY METHODS 52.1. Study design, sample size and sampling processes 52.2. Ethical considerations 52.3. Training and piloting 52.4. Data collection 62.5. Adjustment of Haemoglobin Levels for Altitude 72.6. Correction of RBP, Serum Zinc and Serum Ferritin for Inflammation 72.7. Body Mass Index (BMI) for Adult Men and Non-pregnant Women 82.8. Anthropometry Computation 82.9. Calculation of Wealth index 82.10. Limitations of the Report 8

vi
The Kenya National Micronutrient Survey 2011
CHAPTER THREE: RESPONSE RATES AND DEMOGRAPHIC CHARACTERISTICS OF HOUSEHOLDS 10
3.1. Response rates 103.2. Demographic characteristics 11
3.2.1. Residence, Household size, Age and sex 113.2.2. Household Head Education level 11
CHAPTER FOUR: NUTRITIONAL STATUS 124.1. Overview 124.2. Nutritional Status of Children aged 6-59 months 12
4.2.1. Levels of Stunting 134.2.2. Levels of Wasting 144.2.3. Levels of Underweight 154.2.4. Social Economic Status and Nutritional Status of Children 15
4.3. Nutritional status in adults 154.3.1. Levels of Malnutrition in Non-pregnant Women 164.3.2. Levels of Malnutrition in Men 174.3.3. Nutrition Status of Pregnant Women by Mid Upper Arm Circumference 18
CHAPTER FIVE: ANAEMIA, IRON DEFICIENCY, IRON DEFICIENCY ANAEMIA AND ASSOCIATED FACTORS 19
5.1. Introduction 195.2.
in Pre-School Aged Children (6-59 months) 205.2.1. Anaemia in children aged 6-59 months 215.2.2. 225.2.3. 22
5.3. 225.3.1. Anaemia in School age children 235.3.2. 235.3.3. Iron D 24
5.4. 245.4.1. Anaemia in non-pregnant women 255.4.2. 255.4.3. 26
5.5. 265.5.1. Anaemia in pregnant women 275.5.2. 285.5.3. 28
285.6.1. Anaemia in men 295.6.2. 295.6.3. 30

vii
The Kenya National Micronutrient Survey 2011
5.7. Factors that contribute to anaemia 305.7.1. Infection of pre-school children with helminths 315.7.2. Helminths in relation to anaemia in preschool children 325.7.3. Helminths among school age children 325.7.4. Helminths in relation to Anaemia in School Age Children 335.7.5. Helminths among non-pregnant women 345.7.6. Helminths in relation to anaemia in non-pregnant women 355.7.7. Helminths among pregnant women 35
5.8. Malaria and HIV Infections in the Study Population 355.8.1. Malaria and HIV infection in relation to anaemia in the study population 36
5.9. Haemoglobinopathies in the study population 365.9.1. Sickle Cell Disease 365.9.2. Thalassemia 365.9.3. Haemoglobinopathies in relation to anaemia in preschool children 375.9.4. Haemoglobinopathies in relation to anaemia among school age children 375.9.5 Haemoglobinopathies in relation to anaemia among pregnant women 385.9.6. Haemoglobinopathies in relation to anaemia among non-pregnant women 385.9.7. Haemoglobinopathies in relation to anaemia among men 38
5.10. Nutrient Intake and anaemia in the study population 385.10.1. Nutrient intake in relation to anaemia, ID and IDA among preschool children 385.10.2. Nutrient intake in relation to anaemia among pregnant women 395.10.3. Nutrient intake in relation to anaemia among non-pregnant women 39
CHAPTER SIX: VITAMIN A DEFICIENCY 406.1. Introduction 406.2. Vitamin A Deficiency in Pre-School Children (6-59 months) 406.3. Vitamin A Deficiency in School Age Children (5-14 years) 426.4. Vitamin A deficiency in pregnant and nonpregnant women 436.5. Vitamin A Deficiency in Men 446.6. Relating Dietary and biochemical data 44
CHAPTER SEVEN: IODINE 467.1. Introduction 467.2. Iodine Nutrition in Kenya 467.3. Methods 477.4. Statistical Analysis 477.5. Urinary Iodine Concentration (UIC) 487.6. Urinary Sodium Concentration (UNaC) 507.7 Iodine Content in Consumer Salt 53

viii
The Kenya National Micronutrient Survey 2011
CHAPTER EIGHT: ZINC DEFICIENCY 558.1. Introduction 558.2. 558.3. 568.4. 578.5. 58
58 58
59
CHAPTER NINE: FOLATE AND VITAMIN B12 DEFICIENCY IN PREGNANT AND NON-PREGNANT WOMEN 60
9.1. Introduction 609.2. Folate and B12 609.3. Folate and B12 61
9.3.1. Folate and B12 61
CHAPTER TEN: FOOD CONSUMPTION PATTERNS, DIETARY PRACTICES NUTRIENT INTAKES 63
10.1. Infant Feeding Practices 6310.1.1. Breast Feeding 63
10.2. Micronutrient Supplementation 6310.2.1. Vitamin A Supplementation in Children 6-59 months 6310.2.2. Iron and folic acid use and de-worming in Children 6410.2.3. Iron Supplementation in Women of Reproductive Age 64
10.3. Dietary diversity 6510.4. Nutrient adequacy of women and children using the 24 hour recall 7010.5. Determinants of variation in energy intake 7110.6. Relationship of dietary and biochemical data 7410.7. Dietary sources of micronutrients 74
74 75
76
CHAPTER ELEVEN: CONCLUSIONS AND RECOMMENDATIONS 8411.1. Conclusions 8411.2. Recommendations 85
References 88
Appendix 1: Dietary Reference Intakes (DRI’s) for Minerals and Vitamins 95Appendix 1a: Minerals 95Appendix 1b: Vitamins 96

ix
The Kenya National Micronutrient Survey 2011
Appendix 2 97Appendix 2a: Sources of dietary energy by food group and age group. When source contributes more than
10% of total energy the value is shown in red text. 97Appendix 2b: Sources of dietary lipid by food group and age group. When source contributes more than
10% of total energy the value is shown in red text. 97Appendix 2c: Sources of dietary iron by food group and age group. When source contributes more than
10% of total energy the value is shown in red text. 97Appendix 2d: Sources of dietary zinc by food group and age group. When source contributes more than
10% of total energy the value is shown in red text. 98Appendix 2e: Sources of dietary calcium by food group and age group. When source contributes more
than 10% of total energy the value is shown in red text. 98Appendix 2f: Sources of dietary vitamin A by food group and age group. When source contributes more
than 10% of total energy the value is shown in red text. 98
Appendix 3: Dietary Reference Intakes (DRI’s) for Minerals and Vitamins 99Appendix 3a: Minerals 99Appendix 3b: Vitamins 100
Appendix 4 101Appendix 4a: Sources of dietary energy by food group and age group. When source contributes more than
10% of total energy the value is shown in red text. 101Appendix 4b: Sources of dietary lipid by food group and age group. When source contributes more than
10% of total energy the value is shown in red text. 101Appendix 4c: Sources of dietary iron by food group and age group. When source contributes more than
10% of total energy the value is shown in red text. 101Appendix 4d: Sources of dietary zinc by food group and age group. When source contributes more than
10% of total energy the value is shown in red text. 102Appendix 4e: Sources of dietary vitamin A by food group and age group. When source contributes more
than 10% of total energy the value is shown in red text. 102
Appendix 5: Summary of key findings in Kenya National Micronutrient Survey 2011 103
Appendix 6: Dietary Reference Intakes (DRI’s) for Minerals and Vitamins 104Appendix 6a: Minerals 104Appendix 6b: Vitamins 105
Appendix 7: Population groups and the key measurement variables. 106
Appendix 8: Sample sizes and precision for maximum sample size for each target group 107
Appendix 9: KEMRI ERC Approvals 108
Appendix 10: A map of Kenya showing clusters covered in KNMS 2011 109
Appendix 11: Sampling Errors 110Appendix 11a: Sampling Errors for Rural Kenya 110Appendix 11b: Sampling Errors for Urban areas of Kenya 114
Appendix 12: LIST OF INVESTIGATORS AND INSTITUTIONAL AFFILIATIONS 118
Appendix 13: Survey Field Team 119

x
The Kenya National Micronutrient Survey 2011
List of TablesTable S: 1: Summary of Key Findings in Kenya National Micronutrient Survey 2011 xxivTable 1. 1: Data on Micronutrient Deficiencies among children 6-59 months old,
women of reproductive age and school-age children in Kenya from 1994-2007 2Table 2. 1: KNMS 2011 sample allocation 5Table 2. 2 Biological markers assessed per study population 7Table 2. 3: Cut-off points for various key indicators 9Table 3. 1: Response rates for various indicators by study group 10Table 3. 2 Characteristics of participating households, kenya 2011 11Table 4. 1 Nutritional status of children aged 6-59 months by height-for-age, weight-for-height,
and weight-for-age 14Table 4. 2: Factors associated with nutritional status in non-pregnant women 16Table 4. 3: Status of non-pregnant women (nprg) and men using bmi 17Table 4. 4: Factors associated with nutritional status in men 18Table 4. 5: Nutrition status of pregnant women by mid upper arm circumference 18Table 5. 1 Proposed classification of public health significance of anaemia in populations 19Table 5. 2: Prevalence of anaemia, Iron Deficiency (ID) and Iron Deficiency Anaemia (IDA)
in the study population 19Table 5. 3: Anaemia, Iron Deficiency (ID), and Iron Deficiency Anaemia (IDA) among pre-
school age children (6-59 months) in relation to selected demographic and economic characteristics 20
Table 5. 4: Anaemia, Iron Deficiency (ID), and Iron Deficiency Anaemia (IDA) among school age children (5– 14 years) in relation to selected demographic and economic characteristics 23
Table 5. 5: Anaemia, Iron Deficiency (ID), and Iron Deficiency Anaemia among school age children (5– 14 years) in relation to selected demographic and economic characteristics 25
Table 5. 6: Anaemia, iron deficiency, and iron deficiency anaemia among pregnant women (15–49 years) in relation to selected demographic and economic characteristics 27
Table 5. 7: Anaemia, iron deficiency, and iron deficiency anaemia among men (15– 54 years) in relation to selected demographic and economic characteristics 29
Table 5. 8: Helminths among pre-school age children (6-59 months) in relation to selected demographic and economic characteristics 31
Table 5. 9: Anaemia among pre-school age children (6-59 months) in relation to infection with helminths 32
Table 5. 10: Helminths among school age children (5-14 years) in relation to selected demographic and economic characteristics 33
Table 5. 11: Anaemia, iron deficiency, and iron deficiency anaemia among school age children (5-14 yrs) in relation to infection with helminths 33
Table 5. 12: Helminths among non-pregnant women (15-49 years) in relation to selected demographic and socio-economic characteristics 34
Table 5. 13: Anaemia, iron deficiency, and iron deficiency anaemia among non-pregnant women (15– 49 years) in relation to infection with helminths 35
Table 5. 14: Percentage of helminths in pregnant women by residence 35Table 5. 16: Hiv and malaria infection in the study population by residence 35Table 5. 17: Sickle cell and thalassaemia in the study population by residence 37

xi
The Kenya National Micronutrient Survey 2011
Table 5. 18: Anaemia among pre-school age children (6-59 months) in relation to haemoglobinopathies 37
Table 5. 19: Anaemia among school age children (5-14 years) in relation to haemoglobinopathies 37Table 5. 20: Anaemia among non-pregnant women (15– 49 years) in relation to
haemoglobinopathies 38Table 5. 21: Anaemia among men (15– 64 years) in relation to haemoglobinopathies 38Table 5. 22: Anaemia among pre-school age children (6-59 months) in relation to adequacy
in rdi of macro and micronutrients 38Table 5. 23: Anaemia among non-pregnant women (15– 49 years) in relation to adequacy
in rdi of macro and micronutrients 39Table 6. 1: National prevalence of vitamin a deficiency corrected for inflammation 41Table 6. 2: Distribution of VAD in Pre-School Children (PSC) by demographic characteristics 42Table 6. 3: Distribution of VAD in school age children (sac) by demographics 42Table 6. 4: Distribution of VAD in non-pregnant women by demographic characteristics 44Table 6. 5: Levels of vitamin a deficiency among pre-school children (6-59 months) and non-
pregnant women (15-49 years) in relation to adequacy in rdi of micronutrients 45Table 7. 1A: Urinary Iodine Concentration in school age children, KNMS 2011 48Table 7. 1B: Urinary Iodine Concentration in non-pregnant women, KNMS 2011 49Table 7. 2A: Urinary Sodium Concentration in school-age children, KNMS 2011 51Table 7. 2B: Urinary Sodium Concentration in non-pregnant women, KNMS 2011 52Table 7. 3: Distribution of salt iodine by demographic characteristics and brands 54Table 8. 1: Cut-offs for serum zinc concentration (µg/dl*) for morning and non-fasting 55Table 8. 2: Distribution of plasma zinc concentration for pre-school age children (Pre-SAC) 56Table 8. 3: Prevalence of serum zinc concentration for school aged children (SAC) 57Table 8. 4: Distribution of serum zinc concentration for pregnant women (PW) 57Table 8. 5: Distribution of serum zinc concentration for non-pregnant women (NPW) 58Table 8. 6: Distribution of serum zinc concentration for men 58Table 8. 7: Distribution of low serum zinc concentration by study group, uncorrected
and corrected for inflammation 58Table 9. 1: Distribution of folate and B12 deficiency among pregnant women (15-49 years)
by residence 60Table 9. 3: Distribution of folate and vitamin B12 deficiency among non-pregnant women
(15-49 years) by selected demographic and economic characteristics 61Table 9. 4: Folate and vitamin B12 deficiency among non-pregnant women (15– 49 years)
in relation to adequacy in rdi of micronutrients 62Table 10. 1: Micronutrient supplementation among the pre school children 64Table 10. 2: Mean percent of energy intake by food group in children 6-59 months
overall and by age group 1 (n=264) 66Table 10. 3: Mean percent of energy intake by food group in children 6-59 months
by area of residence1 (n=264) 66Table 10. 4: Mean number of food groups consumed and proportion with low dietary diversity
(dds<4) among children 6-59 month, by child characteristic (n=279) 67Table 10. 5: Description of number of food items consumed per day among children,
by age group 67Table 10. 6: Percentage intake of food groups among children 5-59 months by different
characteristics 69Table 10. 7: Number of meals per day and food items consumed among women 15-49 years
by age group and physiological status 70

xii
The Kenya National Micronutrient Survey 2011
Table 10. 8: Percentage intake of food groups among women by different characteristics 70Table 10. 9: Average (SD) energy and macronutrients intake among women 72Table 10. 10: Average (SD) energy and macronutrients intake among children 6-59 months 72Table 10. 11: Average (SD) micronutrients intake among women 73Table 10. 12: Average (SD) micronutrients among children 6-59 months 73Table 10. 13: Prevalence of dietary inadequacy of macro and micro-nutrients among women
and children 73Table 10. 14: Of consumption levels of food candidates for fortification. 76Table 10. 15: Questions asked in household survey about quantity of consumption of maize flour,
wheat flour, sugar and oil, the categories of answers for each food, and the amount used for each category in calculation of daily intakes. The final column shows the percent 77
Table 10. 16: Quantity of salt usually purchased, and frequency of salt purchase in households 78Table 10. 17: Estimated consumption of salt per day 78Table 10. 18: Five parameters that an ideal monitoring tool could measure, the ability of 24 hour
dietary recalls and hces to measure these parameters, and the meaning of this for tool validation 79
Table 10. 19: Summary of the comparisons between the intake estimates from HCES and 24 hour dietary recall for maize flour, salt, wheat flour, sugar and oil. 83

xiii
The Kenya National Micronutrient Survey 2011
List of FigureFigure: 7. 1: Iodine content in household salt samples by salt brand and category 53Figure 10. 1: The intake of salt (grams per day) as estimated by the hces-like questions in the
household survey and by the 24 hour dietary recalls for different age groups (age boundaries of group shown in horizontal axis labels, m is for males and f for females). 80
Figure 10. 2a: The intake of wheat flour (grams per day) as estimated by the hces-like questions in the household survey and by the 24 hour dietary recalls for different age groups (age boundaries of group shown in horizontal axis labels, m is for males and f for females). 81
Figure 10. 2b: The intake of sugar (grams per day) as estimated by the hces-like questions in the household survey and by the 24 hour dietary recalls for different age groups (age boundaries of group shown in horizontal axis labels, m is for males and f for females). 82
Figure 10. 2c: The intake of oil (grams per day) as estimated by the hces-like questions in the household survey and by the 24 hour dietary recalls for different age groups (age boundaries of group shown in horizontal axis labels, m is for males and f for females). in the case of oil, the 24 hour recall intakes are calculated for oil only, and oil plus vegetable fat. 82

xiv
The Kenya National Micronutrient Survey 2011
Abbreviations and AcronymsB12 Vitamin B12
B6 Vitamin B6
BMI Body Mass Index
CDC Centre for Disease Control
CPHR Centre for Public Health Research
CRP C-Reactive protein
DBS Dry Blood Spot
DC District Commissioner
DO District Officer
DON Division of Nutrition
DRIs Daily Recommended Intakes
DSO District Statistics Officer
EAs Enumeration Areas
EDA Exploratory Data Analysis
EPSEM Equal Probability Selection Method
ERC Ethical Review Committee
FD Folate Deficiency
GAIN Global Alliance for Improved Nutrition
GDP Gross Domestic Product
GOK Government of Kenya
Hb Haemoglobin
HhH Household head
Hhs Households
HIV Human Immunodeficiency Virus
HPLC High Performance liquid chromatography
Id Identity
ID Iron deficiency
IDA Iron Deficiency Anaemia
IQ Intelligent Quotient
IQR Inter Quartile range
ITNs Insecticide Treated Nets
KDHS Kenya Demographic Health Survey

xv
The Kenya National Micronutrient Survey 2011
KIE Kenya Institute of Education
KIHBS Kenya Integrated Household Budget Survey
KMIS Kenya Malaria Indicator Survey
KNBS Kenya National Bureau of Statistics
KNMS Kenya National Micronutrient Survey
LSC Laboratory Sub-Committee
LSSC Logistics, Training, and Supplies Sub-Committee
MCH Mother Child Health
MDGs Millennium Development Goals
MI Micronutrient Initiative
MOH Ministry of Health
MOPHS Ministry of Public Health and Sanitation
MOS Measure Of Size
MOU Memorandum of Understanding
MUAC Mid Upper Arm Circumference
NASCOP National AIDS & STI Control Programme
NASSEP National Sample Survey and Evaluation Programme
NPHLS National Public Health Laboratory Services
NPL Non-Pregnant Lactating
NPNL Non-Pregnant Non Lactating
NPW Non-pregnant Women
NSC National Survey Coordinator
PC Provincial Commissioner
PCA Principal Components Analysis
PCR Polymerase Chain Reaction
PDSC Protocol Development Sub-Committee of the Scientific Committee
PI Principal Investigator
PPMOS Probability Proportional to Measure Of Size
PSC Pre-School Children
PSUs Primary Sampling Units
PW Pregnant Women
QA/QC Quality Assurance/Quality Control
RBC Red Blood Cells
RBP Retinol Binding Proteins

xvi
The Kenya National Micronutrient Survey 2011
RDTs Rapid Diagnostic Test
SAC School Age Children
SD Standard Deviation
SF Serum Ferritin
SOPs Standard Operating Procedure
sTfR Serum Transferritins
SVI Swiss Vitamin Institute
UIE Urinary Iodine Excretion
UNICEF United Nations Children’s Fund
VA Vitamin A
VAD Vitamin A Deficiency
VCT Voluntary Counseling and Testing
WFP World Food Programme
WRA Women of Reproductive Age

xvii
The Kenya National Micronutrient Survey 2011
EXECUTIVE SUMMARY
Background
Malnutrition associated with micronutrient deficiencies (vitamins and minerals) is a major cause of morbidity and mortality, and negatively affects human productivity and economic growth, especially in developing countries. About 45 percent of child deaths and 10 percent of total global disease burden is attributed to maternal and child under nutrition. It is for this reason that improving nutrition has been indicated as the precondition to achieving a number of the Millennium Development Goals. Studies have shown that investing in nutrition can increase a country’s Gross Domestic Product (GDP) by at least 2-3 percent each year. Nutrition science in general, and micronutrient science in particular, have continued to gain visibility and to draw attention locally, regionally and internationally. This has continued to shape policies and interventional programs towards improving nutrition in communities. Despite notable nutrition science achievements, many nations in the developing world continue to register grim statistics; many children worldwide die daily from malnutrition while others live through their childhood in a state of chronic malnourishment resulting in unhealthy growth and poor brain development, poor immunity to disease, low IQ, resulting in poor educational performance and reduced quality of life.
In Kenya, like in many developing countries, malnutrition continues to raise morbidity and mortality concerns. Kenya does not have representative micronutrient data at either national or sub-national levels. This position prompted the Government of Kenya, through the Ministry of Public Health and Sanitation (currently Ministry of Health) to institute the Kenya National Micronutrient Survey (KNMS) in 2011to generate data on the magnitude and
distribution of micronutrient malnutrition, including nutritional status and a number of related diseases. The aim of the survey was to establish the prevalence of micronutrient deficiencies, protein-energy malnutrition, and infectious diseases among the Kenyan population in order to provide policy makers and programme managers with the information they need to effectively plan and implement micronutrient interventions. Specifically, the survey set out:
(i) To determine the prevalence of wasting, stunting and underweight among children 6-59 months of age and prevalence of thinness and overweight/obesity of women in Kenya;
(ii) To establish the prevalence of anaemia, iron deficiency and iron deficiency anaemia among all population groups in Kenya,
(iii) To determine the magnitude of infection (malaria, parasites, hemoglobinopathies, HIV) and its relation to anaemia among all population groups.
(iv) To determine prevalence of vitamin A deficiency among all population groups in Kenya;
(v) To determine the prevalence of Folate and vitamin B12 deficiencies in pregnant and non-pregnant women;
(vi) To determine the prevalence of zinc deficiency in the study population.
(vii) To assess the micronutrient supplementation coverage in Kenya;
(viii) To assess the patterns of household and/or individual dietary consumption and nutrient intake
(ix) To establish the relative roles of salt in ready-to-eat processed foods and of salt consumed in households on the Iodine status of survey respondents;
(x) To determine the prevalence of iodine deficiency in school age children and non-pregnant women

xviii
The Kenya National Micronutrient Survey 2011
Methodology
The design of KNMS 2011was cross sectional using a two-stage stratified cluster sampling methodology that produced representative estimates for the following three domains: (i) Kenya as a whole; (ii) Rural areas of Kenya; and (iii) Urban areas of Kenya. The sampling frame for the 2011 KNMS was based on the National Sample Survey and Evaluation Programme (NASSEP IV) master sampling frame maintained by the Kenya National Bureau of Statistics (KNBS). The KNMS sample was selected using a stratified two-stage cluster design consisting of 296 clusters, 123 in the urban and 173 in the rural areas. Urban areas were defined as Cities, Municipalities, Town Councils, Urban Councils and all District Headquarters. Rural areas were defined as an isolated large area of an open country in reference to open fields with peoples whose main economic activity was farming. From each cluster 10 households were selected using systematic sampling.
Information related to household characteristics, demographics, socio-economic status, and fortified food consumption was collected at the household level. Salt samples were also collected at the household level. Biological specimens, in the form of venous blood samples were collected from pre-school children aged 6-59 months, children aged 5-14 years, pregnant and non-pregnant women aged 15 to 49 years, and men 15-54 years old within the household. Stool samples were collected from children 6 to 59 months old, children aged 5-14 years, pregnant and non-pregnant women 15 to 49 years old. Urine samples were collected from children 5-14 years old, pregnant and non-pregnant women aged 15 to 49 years. Dietary intake data using the multiple pass 24-hour recall method was conducted in a 20 percent random sub-sample of the households selected for the (2 households in every cluster of 10 KNMS households). The two recall-households were selected only from the households among the 10 KNMS samples that essentially had children between ages 6-59 months and a woman of reproductive age. Where two children of the same category were available, the youngest child was selected.
The sample size required for each stratum was based on the estimated prevalence for each nutritional indicator, the desired precision for each indicator, an assumed design effect of 2.0, and a non-response of 10 percent (including refusals) at the household level, and 10 percent at the individual levels for children 6-59 months of age and non-pregnant women. An additional non-response rate of 10 percent (for a total 30 percent non-response rate) was assumed for the men and school age children (SAC) 5-14 years old. The sample size was determined based on the parameters that required the highest sample size (Zinc, Iodine, Anaemia) for each target group. Fisher’s formula for estimating the minimum sample size for prevalence descriptive studies was used. The KNMS survey protocol was reviewed and approved by the KEMRI Scientific and the National/Ethical Review Committee (ERC). As per the national research policies, informed written consent was received from all individuals participating in the survey.
Fourteen teams were involved in KNMS data collection process. Each team comprised of one team leader, one nurse/counsellor, three laboratory technicians, three enumerators and one 24-hour recall research personnel. The teams were trained and the piloting exercise undertaken prior to fieldwork.
The fieldwork for this survey was conducted in 2011 between September and December using various sets of data collection tools. The tools included, household questionnaire, age group specific individual questionnaires, laboratory and anthropometry questionnaire, Kenya Integrated Household Budget Survey (KIHBS) questionnaire and a multiple pass 24-hour dietary intake module. Anthropometric assessments were undertaken on all the study participants followed by collection of biological specimens. The amount of blood collected varied between the subject groups. These samples were processed and stored in line with standard operating procedures for each analyte before being transported to the central laboratory in KEMRI. Strict cold chain procedures were adhered to during the

xix
The Kenya National Micronutrient Survey 2011
entire sample collection, processing, storage and transportation periods. The multiple pass 24-hr recall survey was undertaken on 20 percent of pre-school children paired up with their non-pregnant mothers/caretakers aged 15-49 years. To ensure data quality, continuous supervision and review of information was undertaken in-order to identify and correct challenges in real-time. Steps were taken at the central and field level laboratories to improve data quality by implementing quality control procedures and monitoring proficient laboratory analyses.
Field questionnaires were double entered, cleaned and validated prior to analysis. Data comparison was done using Epi-info version 7.0. The datasets were exported into a Statistical Package format (IBM® SPSS® Statistics version 20.0) for analysis. Data merging exercise was systematically conducted using four datasets i.e. household characteristics, individual characteristics, anthropometrics measurements, and laboratory results. CS Dietary (Dietary System Rel 1.11, developed by Harvestplus and SERPRO S.A., Jan 2010) was used to enter the dietary intake data, which were then integrated with the food composition table, recipes database and conversion factors database to yield nutrient intake from each food. The data were exported as a CSV file, and imported into SAS. In SAS the nutrient intake data were summed over each day, for each individual, to give their intakes on the one day. Data merging was conducted in defined steps and the master-files backed-up for safekeeping. All the questionnaires and laboratory forms were filed and stored in lockable drawers, in line with meeting the safety, privacy and confidentiality requirements.
Exploratory data analysis techniques were employed at the initial stage to uncover the distribution structure of the study variables as well as identify outliers or unusually entered values. Distribution of continuous variables was tested for normality using Shapiro-Wilk test. Depending on the distribution, parametric or non-parametric statistical analysis methods were
used. Chi-squared or Fisher exact tests were used to test for independence in distribution of different indicators across different categorical variables (demographic characteristics).
Socio-demographic and Economic Characteristics
The average household size was 4.0 + 2 (SD) persons. This compared well with the national findings by KDHS 2008 - 2009 of 4.2 persons per household. When the ages of the household heads (HhH) were grouped into 10 year age categories, the age group of 30 – 39 years contributed the highest proportion (29.0 percent) of HhHs. The sex distribution of household heads showed a significant male dominance (72.4 percent vs. 27.6 percent). Education level of the household head has long been associated with the quality of life. The majority of the household heads (42.4 percent) had attained and completed primary education level with 1.2 percent of the heads having not gone to school at all. From the participating households, the wealth distribution among the five categories showed that 23.2 percent of households were in the highest wealth quintiles. A summary of the results are indicated in table 1.
Nutritional Status
Nationally, the prevalence of stunting, underweight and wasting in the pre-school children was 26.3 percent, 12.7 percent and 6.3 percent respectively. The mean Z score (-1.04 SD) shows an improvement in stunting compared to the means of -1.4 and -1.1 reported in the KDHS 2008-2009 and KDHS 2014.The prevalence of severe stunting was 8.2 percent, higher in rural (9.9 percent) than in urban (3.7 percent) areas. Severe stunting (8.1 percent) was similar to the KDHS 2014 findings. With respect to being overweight and or obese, the overall prevalence among women was 23.9 percent and significantly differed between rural (16.1 percent) and urban (35.1 percent) women.

xx
The Kenya National Micronutrient Survey 2011
Anaemia, Iron Deficiency and Iron Deficiency Anaemia
In the study population, the highest prevalence of anaemia, iron deficiency and iron deficiency anaemia was observed in pregnant women at 41.6 percent, 36.1 percent and 26 percent respectively, and lowest in men (9.3 percent, 3.6 percent and 2.9 percent respectively).
Pre-school children had a higher prevalence of anaemia, iron deficiency and iron deficiency anaemia (26.3 percent, 21.8 percent, and 13.3 percent respectively) than school-age children (16.5 percent, 9.4 percent and 4.9 percent respectively). Non-pregnant women on the other hand had a prevalence of 21.9 percent for anaemia, 21.3 percent for iron deficiency and 14.0 percent for iron deficiency anaemia comparable to that of preschool children.
Differences in prevalence of anaemia, iron deficiency and iron deficiency anaemia were noted in different age groups of pre-school children. Level of education of the household head and wealth quintile of the household were found to have a relationship with the anaemia status. While Iron deficiency and anaemia was affected by worm infestation and iron intake.
In school age children, prevalence of anaemia status was affected by residence, while education level of household head and the wealth quintile of households had an effect on anaemia, iron deficiency and iron deficiency anaemia. Anaemia and iron deficiency anaemia were affected by age in non-pregnant women. In pregnant women, anaemia, iron deficiency and iron deficiency anaemia was affected by residence of the respondent.
Vitamin A Deficiency
Vitamin A deficiency (<0.70 μmol/L) was based on retinol-binding protein values in the study population. The crude national prevalence of
Vitamin A deficiency (considering the combined sub-populations studied) was 4.1 percent. Pre-school children (PSC) had the highest (9.2 percent) prevalence of Vitamin A deficiency (VAD) compared with all other groups. The marginal VAD (0.7 - <1.05 μmol/L) in PSC was 52.6 percent. Prevalence of overall marginal Vitamin A deficiency was 24.4 percent. The observed prevalence of VAD is also lower compared to the global estimates of 33.3 percent in pre-school children. In pre-schoolers, residence of the children was a main factor associated with occurrence of VAD. Children in rural areas were less likely to be Vitamin A deficient compared to urban residents (prevalence of 8.1percent and 12.1 percent, respectively). Furthermore, sex, level of education and wealth quintiles were not important determinants of VAD in pre-school children.
The prevalence of VAD and marginal VAD among school-aged children was 3.6 percent and 33.9 percent respectively. As observed in Pre-school children, the majority (one third) of children in this age group with marginal deficiency are at risk of VAD. Unlike in the PSC, residence was not a determining factor for VAD but prevalence of VAD decreased with level of education and wealth quintile.
Among pregnant and non-pregnant women, the highest VAD prevalence (5.4 percent) was observed among pregnant women and reduced significantly in the non-pregnant women (1.1 percent). The prevalence of marginal VAD in pregnant and non-pregnant women was 21.6 percent and 8.1 percent respectively. When VAD was considered by the residence of the pregnant women, those in urban areas had a significantly much higher (14.0 percent) deficiency than in those of rural residence (0.0 percent).
Iodine Deficiency
The national iodine deficiency prevalence was 22.1 percent among school age children and 25.6

xxi
The Kenya National Micronutrient Survey 2011
percent among non-pregnant women. Female children (25.2 percent) had significantly higher levels of iodine deficiency compared to the male (19.1 percent), with 25.0 percent of iodine deficient children in rural areas. Iodine deficiency among non-pregnant women was higher (30.1 percent) in rural than urban (17.9 percent) areas. On the other hand, 30.4 percent of school age children and 25.2 percent of non-pregnant women had excessive iodine levels (more than 300ug/L).
A major source of iodine is iodized salt. Based on the Kenya Salt Iodization Standard (KS 2009) of 30-50ppm, less than a half (48.3 percent) of the salt samples analysed were optimally iodized. Both rural and urban areas had salt with iodine levels less than 30ppm (rural 31.8 percent; urban 25 percent) and above 50ppm (rural 20.9 percent; urban 25 percent). Among school age children, significant differences were found in the mean urinary sodium concentrations by age categories, gender, residence and household wealth status. The older school age children (9 to 14 years) had higher mean urinary sodium concentrations (81.4milimol/L) compared to the younger population at 71.2milimol/L. The mean urinary sodium concentration was higher in male (83.6 percent) than female children (70.3 percent), and among children residing in urban (88.2%) than rural (72.7 percent) areas. Sodium concentrations varied with household wealth quintile, where high sodium concentrations were observed in households from higher wealth quintiles (94.5 percent and 87.0 percent) compared to lower wealth quintiles (72.0 percent and 65.5 percent). Among the non-pregnant women, the younger age group (15 to 19 years) had higher mean urinary sodium concentrations (87.3 percent) compared to women above twenty years (71.2 percent). Non-pregnant women in urban areas had significantly high (81.4 percent) sodium concentrations compared to women in rural areas (69.8%), and so did those in the highest wealth quintile (90.4 percent) compared to the lowest (74.3%) quintile.
Zinc Deficiency
The 2011 National Micronutrient Survey established that pre-school children had the highest prevalence of zinc deficiency (83.3 percent) among all the population subgroups. This was followed by non-pregnant women with a prevalence of 82.3 percent, school age children (80.2 percent), men (74.8 percent) and finally pregnant women (68.3 percent) with the lowest prevalence. The prevalence of zinc deficiency among preschool children, school age children and men was consistently higher among rural dwellers (86 percent, 82.5 percent and 79.7 percent respectively) compared to their urban counterparts (76.4 percent, 73.6 percent and 70 percent respectively). The picture among pregnant women was different, where urban and rural dwellers did not differ significantly in prevalence of zinc deficiency. Prevalence of zinc deficiency was also noted to vary with household wealth quintiles in some of the survey sub-groups in particular pre-schoolers and school age children where lower prevalence’s of zinc deficiency were seen in households of higher wealth quintiles (75 percent and 67.7 percent respectively) and higher prevalence’s (89 percent and 85.5 percent respectively) in households in the low wealth quintiles. Gender differences in zinc deficiency among school age children were noted where males had higher (83.0 percent) prevalence than females (77.2 percent). The prevalence of zinc deficiency in pregnant women showed an increasing trend with increasing trimester of pregnancy, where women in their 2nd and 3rd trimesters had higher prevalence (69 percent) of zinc deficiency than those in their first trimester (60.7 percent).
It is important to note here that even after correcting for inflammation using the computation procedure described in chapter 2, the prevalence of zinc deficiency showed marginal (largest was 1.4 percent) decreases across all survey groups. Although pregnant women had the lowest prevalence of low serum zinc concentration in

xxii
The Kenya National Micronutrient Survey 2011
this study, men in general had a higher median serum zinc concentration than the rest of the population groups.
Folate and Vitamin B12 Deficiency among women
The national prevalence of folate deficiency in pregnant women was 32.1 percent and 30.9 percent in non-pregnant women. Distribution of folate deficiency in pregnant women showed no significant variability by residence. Pregnant women that dwell in urban areas had a prevalence of 25.0 percent compared to those in rural areas of 36.0 percent. In non-pregnant women, there was no significant difference in the distribution of folate deficiency in terms of age, level of education and wealth quintile. However, significant difference was noted in the prevalence of folate deficiency according to area of residence of non-pregnant women. Non-pregnant women in urban areas had a higher prevalence of folate deficiency (40.6 percent than non-pregnant in rural areas (25.1 percent).
Vitamin B12 deficiency in pregnant women was 7.7 percent and 34.7 percent in non-pregnant women. The pregnant women that dwell in rural areas had a higher (8.0 percent) prevalence of Vitamin B12 deficiency compared to pregnant women in urban areas (7.1percent). There was no significant difference in the distribution of Vitamin B12 deficiency in terms of area of residence and wealth quintile. However, significant difference was noted in the prevalence of folate deficiency according to age, with the highest prevalence observed in women of 15 – 19 years (47 percent) and lowest in women 20 - 49 years (31.5 percent). Significant difference was also noted in the distribution of prevalence of Vitamin B12 by level of education with women who have no education having the highest prevalence of Vitamin B12 deficiency (45.8 percent) and women with post primary level of education having the lowest prevalence (26.0 percent).
Breastfeeding patterns
Assessment of household patterns and/or individual dietary consumption found that 95.9 percent of the children aged 6-11 months; 61.9 percent aged 12-23 months; 10.7 percent aged 24-35 and 24 percent aged 36-47 months were breastfed the day preceding the survey. The expectation that children be breastfed up to the age of two years was only being achieved among two thirds of the children in that age category. Mothers and caregivers reported that 91.1 percent of the children were ever breastfed. 35.8 percent children were breastfed immediately after delivery, 23.1 percent within an hour, 26 percent after one hour, and 10.9 percent after one day while 4.2 percent did not know. Early initiation of breastfeeding is associated with improved immunity for the child due intake of colostrum.
Micronutrient Supplementation
Information gathered on micronutrient supplementation revealed that at least 84.3 percent of all the children under the age of five years had ever received Vitamin A supplementation while 53.1 percent had received the supplementation 6 months prior to our survey. In 2010, Vitamin A coverage in Kenya (Vitamin A supplementation refers to the percentage of children ages 6-59 months old who received at least two doses of Vitamin A in the previous year) was at 62 percent (KNBS AND ICF Macro, 2010 2010). Among the women of reproductive age with regards to the most recent birth, 34.9 percent were supplemented with Vitamin A immediately after delivery. Care givers reported that 4.7 percent pre-schoolers and 2.4 percent school aged children had received or bought iron tablets or pills. However, 29.0 percent of the pre-schoolers and 6.5 percent school aged children were reported as current consumers of soil or earth. 38.1 percent preschool children and 33.5 percent school aged children had received medication for intestinal worms while only 2.8 percent were diagnosed with anaemia.

xxiii
The Kenya National Micronutrient Survey 2011
Dietary and Nutrient Intake
The mean DDS in children was below the recommended cut-off for minimum dietary diversity of at least 4 of the 7 food groups which is associated with better quality for both breastfed and non-breastfed children. Meat based-meals are least consumed by the households in the poorest socio-economic index but the limited protein source appears to be compensated by consumption of more beans and nuts among the poor. Grains were, in fact, important sources of all the micronutrients studied except for vitamin A. Grains are the leading source of iron and zinc, milk and dairy is the leading source of calcium, and vegetables are the leading source of vitamin A.
Notably, high salt consumption was noted by about 90 percent of adults, and two-thirds of children and the amounts were greater in adults than children. Salt consumption appears similar between urban and rural areas compared to sugar where urban individuals consumed more sugar than rural.
Conclusions and Recommendations
Compared to the previous national micronutrient survey results, there is a considerable improvement in the micronutrient status in Kenyan population except for zinc deficiency whose prevalence was higher. This may be attributed to the combined impact of the programs implemented by the Ministry of Health and partners. What requires to be done now is the scaling up of the implementation of high impact nutrition interventions so that further gains can be realized.

xxiv
The Kenya National Micronutrient Survey 2011
Table S: 1: Summary of Key Findings in Kenya National Micronutrient Survey 2011
Indicators National Prevalence n % 95% CI
Nutritional statusPre-School Children (Stunting) (children 6-59 months) Height-for-age <-2 SD (Stunting)
1130 26.3 23.7 28.9
Pregnant Women (MUAC <23 cm) 117 11.7 5.9 17.5
Pre-School Children 827 26.3 23.3 29.3School Age Children (Children 5-14 years) 872 16.5 14.0 19.0Pregnant Women 104 41.6 32.1 51.1Non-pregnant Women 592 21.9 18.57 25.23Men 240 9.3 5.87 13.33
Pre-School Children
(Serum zinc corrected for in�ammation)
918 21.8 19.1 24.5School Age Children 942 9.4 7.5 11.3Pregnant Women 111 36.1 27.2 45.0Non-pregnant Women 633 21.3 18.11 24.49Men 247 3.6 1.28 5.92
Pre-School Children 827 13.3 11.0 15.6School Age Children 942 4.9 3.5 6.3Pregnant Women 104 26.0 17.6 34.4Non-pregnant Women 592 14.0 11.20 16.80Men 243 2.9 0.79 5.01
Pre-School Children 918 9.2 7.3 11.1School Age Children 942 4.7 3.4 6.1Pregnant Women 111 5.4 1.2 9.6Non-pregnant Women 632 2.0 0.9 3.1Men 111 0.0 0 0
Pregnant Women 78 32.1 21.7 42.5Non-pregnant Women 445 30.9 26.6 35.2
Pregnant Women 78 7.7 1.8 13.6Non-pregnant Women 445 34.7 30.3 39.1
Pre-School Children 711 81.6 78.8 84.5School Age Children 901 79.0 76.3 81.7Pregnant Women 109 67.9 59.1 76.7Non-pregnant Women 617 79.9 76.7 83.1Men 239 77.4 72.1 82.7
School age Children 951 22.1 19.5 24.7Non-pregnant Women 623 25.6 22.2 29.0
V 12

1
The Kenya National Micronutrient Survey 2011
CHAPTER 1: INTRODUCTION
1.1 Introduction
Malnutrition is a serious problem affecting over two billion people worldwide. It increases susceptibility to infections and exacerbates their severity. It is thus the most important risk factor for illness and death in developing countries. The underlying determinants of malnutrition are multi-factorial (e.g., the political and economic environment, level of education and sanitation, food intake and breast-feeding habits, prevalence of infectious diseases, availability and quality of health services).
Malnutrition, specifically under nutrition, is typically classified as protein-energy malnutrition and micronutrient deficiency. Although sometimes not apparent, micronutrient deficiency, or “hidden hunger”, is regarded as a significant contributor to the global burden of disease. Specifically, micronutrient deficiencies of Vitamin A, Zinc, Iodine and Iron are recognized worldwide as of public health concern (Bhutta ZA, et al 2008). Research has shown that deficiencies of vitamins and minerals have important health consequences, both through their direct effects, such as iron deficiency anaemia, xerophthalmia due to vitamin A deficiency, and iodine deficiency disorders, and because they increase the risk of serious infectious (Lancet 2013) Micronutrients are essential for human health but currently, there is scarce data in countries faced with high-burden of deficiencies.
1.2 Malnutrition in Kenya
In Kenya, Iron, Vitamin A, Iodine, Folate, B12, and Zinc are micronutrients known to be of public health importance, though recent national data are scarce. According to the IDA report of 1999, 48 percent of women of reproductive age (15- 49
years), 55.1 percent of pregnant women, 69 percent of children, and 31.4 percent of men and school age boys were found to be anaemic (either mild, moderate or severe) (Dary, 2009). Iron deficiency in children was 19.5 percent (serum ferritin <12µg/L), which is most likely an underestimate because inflammation was not accounted for in the analysis. In women, 28.6 percent had serum ferritin levels below 12µg/L and an additional 14.6 percent had a level between 12-20µg/L. Among children and women, severe Vitamin A deficiency (serum retinol <0.35µmol/L) was 24.2 percent and 10.3 percent respectively. Additionally, marginal vitamin A deficiency (levels of 0.7 to <1.05µmol/L) was 60.2 percent in children and 40.4 percent in women. Approximately 50 percent of both children and women had serum Zinc levels below 65µg/L. It should be noted that the national data estimates were based on purposive rather than a randomly selected sample (Benoist et al., 2002). Little is known about vitamin B12 and Folate deficiencies in the Kenya population.
Iodine deficiency surveys undertaken in 1994 and 2004 show that the prevalence of goitre among children aged 8-10 years had decreased from 16 percent to 6 percent respectively (Stoltzfus, 2003; Dror and Allen., 2008). Though the reduction in prevalence of goitre is attributed to the consumption of iodized salt by over 90 percent of Kenyan households (Sazawal, et al 1995), the 2004 survey showed that 25 percent of children had inadequate intake based on their Urinary Iodine Concentration rates (UIC) whilst a large proportion (34 percent) had excess rates above expert recommendations, suggesting a risk of adverse health consequences (Stoltzfus, 2003). Until 2009, the standard for iodine fortification in salt (100ppm) in Kenya was among the highest in the world and was only reduced to 30-50 ppm in 2012 after years of deliberation and regional recommendations.

2
The Kenya National Micronutrient Survey 2011
Local studies have also provided insight into the
Baseline data from a multi-nutrient powder
6-35 months conducted in Western Kenya in March 2007 by Black et al., (2008) showed that 67 percent of children were anaemic, 44 percent
2007.
Nutrition indicator 1994 1999 2004 2007
Anemia (%) - 69 - 67*
- 20 - 44*
- 24 - 13*
- 50 - -
Women of Reproductive age
Anemia (%) - 48 - -
- 29 - -
- 10 - -
School Age Children
Inadequate Urinary Iodine Excretion (%) - - 24 -
Goiter (%) 16 - 6 -
*Children 6-35 months of age in Western Kenya
Under nutrition is a public health problem in Kenya. According to the 2008 Kenya Demographic Health Survey (KNBS AND ICF Macro, 2010),
of age were stunted. Trends show that there has been an increase in the national stunting rates of children from 30 percent in 2003 to 35 percent in 2008, but declined to 26 percent as per the recent
among children between the ages of 18-35 months. At the sub-national level, Nairobi had the lowest (28.5 percent), while Eastern Province had the highest prevalence (41.9 percent); Coast Province recorded prevalence of 39.1 percent, and Western Province, 34.2 percent. At the national level the prevalence of wasting in children was 6.7 percent, and mostly so in the North Eastern Province (19.5
percent). Each of these nutritional indicators was slightly higher among boys than girls and more in rural compared to urban children. In women, the prevalence of obesity (BMI > 25) was higher than thinness (BMI <18.5), (25.1 percent and 12.3 percent, respectively) according to the 2008-2009 KDHS. In North Eastern Province, a reverse pattern was observed with a prevalence of (11.4 percent) obesity and (26.4 percent) thinness.
younger women and obesity in older women.
1.3 Interventions to combat malnutrition in Kenya
has been made in increasing food production and reducing food insecurity in the country over the last thirty years, achieving sustainable food security, for all, remains a challenge. In recognition that malnutrition remains a problem and an obstacle to overall development, the Government of Kenya (GOK) developed a National Food Security and Nutrition Policy and Strategy with the objective of “ensuring that all Kenyans throughout their life-cycle enjoy, at all
to satisfy their nutritional needs for optimal
Table 1.1: Data on micronutrient de�ciencies among children 6-59 months old, women of reproductive age and school-age children in Kenya from 1994-2007

3
The Kenya National Micronutrient Survey 2011
health” (Mburu ASW et al., 2010). The policy provides an overarching framework covering all the four dimensions of food security (availability, accessibility, stability and meeting nutritional requirements) and addresses the synergy linking food and nutrition security with poverty reduction. Key strategic interventions related to nutrition include; a) Supplementation of children with vitamin A and expectant women with Iron, and Folate, b) Fortification of salt, wheat flour, maize meal, and vegetable oil, c) Promotion of consumption of nutrient-rich foods.
In supplementation efforts, there have been both routine and accelerated vitamin A supplementation activities for children 6 to 59 months of age and postpartum women within 4 weeks after delivery. Iron and folate supplementation have been implemented in the maternal and child health (MCH) clinic and other health service delivery outlets for pregnant women. With respect to the fortification of staple foods, Kenya has made concrete steps over the past few years to expand the number of food vehicles that are fortified and to expand the production of fortified foods. In 2007, the National Fortification Standards and Food Fortification Logo were launched, prompting the voluntary fortification of wheat flour, maize meal, and vegetable oil by producers. Salt Iodization Standards were revised in 2009; the mandated iodine concentration in salt was decreased based on the evidence that the population was at risk of excessive iodine intake. The largest sugar producer in Kenya began fortifying majority of its sugar with Vitamin A and in 2012; legislation was passed by the Kenyan parliament making it mandatory for industrial producers to fortify wheat flour, maize meal, vegetable oil, and sugar. A reduction of the current micronutrient deficiencies in Kenya would accelerate achievements in key developmental areas of child survival, maternal health and universal primary education, which underlie achievement of the Millennium Development Goals (MDGs).
1.4 Survey Rationale and Objectives
Kenya does not have current representative data at the national level on the prevalence of anaemia and deficiencies of iron, vitamin A, iodine, folate/folic acid, zinc, and vitamin B12. The aim of the 2011 KNMS was to estimate micronutrient deficiencies and their underlying causes in Kenya. There is also a lack of quality monitoring data for large-scale micronutrient interventions and programmes that limits the ability to carry out evidence based programme management decisions. The survey provides baseline data for planning, monitoring and evaluation of fortification and micronutrient supplementation programmes in Kenya. In addition, it will identify how micronutrient deficiencies, infections and haemoglobinopathies contribute to anaemia, and provide direction for implementation of evidence-based interventions for anaemia, and other common nutritional problem in Kenya. Further, the high UIE rates found in 2004 were likely associated with the excessive amounts of iodine in salt, and with the recent reduction in the salt iodine standard, there is a clear need to assess the current iodine status of the Kenyan population and link this to the coverage of household salt iodization, as well as other sources of iodine in the diet (e.g. iodized salt in processed foods, etc.).
1.4.1 General Objective
The general objective of the KNMS was to assess the prevalence of micronutrient deficiencies, under nutrition, associated infectious diseases, and the use of fortified food products by the Kenyan population in order to provide policy makers and programme managers with the information they need to effectively plan and implement micronutrient interventions.

4
The Kenya National Micronutrient Survey 2011
1.4.2 Specific Objectives
• To determine the prevalence of wasting,stunting and underweight among pre-school children (PSC) and prevalence of thinness and overweight/obesity (using BMI) of women in Kenya.
• To determine the prevalence of Anaemiaamong all population age groups in Kenya.
• To determine the prevalence of Irondeficiency in PSC aged 6-59 months, school age children (SAC) aged 5-14 years, non-pregnant women (NPW) and pregnant (PW) women aged 15-49 years old, and men aged 15-54 years old.
• Toestablishfactorscontributingtoanaemiaamong survey respondents.
• To determine the magnitude of infection(malaria, parasites, haemoglobinopathies, HIV) and its relation to anaemia among PSC, SAC, NPW, PW and men.
• Todetermine theprevalenceofVitaminAdeficiency in PSAC, NPW, PW and men.
• To determine the prevalence of Folatedeficiency in NPW and PW.
• TodeterminetheprevalenceofVitaminB12 deficiency in NPW and PW.
• To assess the national micronutrientsupplementation coverage in Kenya.
• Toassess thepatternsofhouseholdand/orindividual dietary consumption.
• To establish the roles of salt consumed inhouseholds on the Iodine status of survey respondents.
• To determine the prevalence of Iodinedeficiency in SAC and NPW.
• To determine the prevalence of Zincdeficiency in PSC, SAC, NPW, PW and men.

5
The Kenya National Micronutrient Survey 2011
CHAPTER TWO: STUDY METHODS
2.1 Study design, sample size and sampling processes
The KNMS 2011/2012 was designed to produce representative estimates for: (i) Kenya as a whole; (ii) rural areas; and (iii) urban areas. It was a cross-sectional stratified cluster survey comprising 296 clusters (123 in urban and 173 in rural areas). From each cluster, a uniform sample of 10 households was selected using the equal probability systematic sampling method. The study population comprised of preschool children aged 6-59 months, children aged 5-14 years, pregnant and non-pregnant women aged 15 to 49 years, and men 15-54 years old within the selected households. The sampling frame for the 2011 KNMS was based on the National Sample Survey and Evaluation Programme (NASSEP IV) master sampling frame maintained by Kenya National Bureau of Statistics (KNBS).
The sample size was based on prior estimates of the parameters (e.g. zinc, iodine, anaemia) for each target group; the desired precision; an assumed design effect of 2.0 and expected non-response rates. Allocation of the sample to the domains was done using the square root adjustment method to ensure valid estimates (Table 2-1), and selection of clusters done using the Equal Probability Selection Method (EPSEM).
Table 2.1: KNMS 2011 Sample Allocation
Domain Sample Households Sample clusters
Rural 1,730 173
Urban 1,230 123
National 2,960 296
2.2 Ethical considerations
The KNMS survey protocol was approved by the KEMRI Ethical Review Committee (ERC) and written informed consent was obtained for all individuals participating in the survey. Those tested and found to be severely anaemic, or with malaria were referred to the nearest health facilities for treatment and follow up. Through authorised written consent, the KNMS assessed the HIV status of all the survey participants. Respondents with HIV-positive test results received counselling and were referred for appropriate HIV care and treatment services in the area for follow-up, as per the Kenya Ministry of Health HIV policy guidelines.
2.3 Training and piloting
Each KNMS pre-test survey team had nine members; one team leader, one nurse/counsellor, one household phlebotomist (to collect blood samples from respondents), two cluster laboratory staff, three enumerators and one 24-hour recall staff. Fourteen teams undertook the pre-test survey in the country. The training of staff was conducted at Kenya Institute of Education (KIE) from 18th July to 12th August 2011, that was preceded by a three days (28th -30th June 2011) training of a team by KNBS to update the list of households in the selected clusters. The finalized version of the questionnaire was prepared based on the feedback from the field application during the training period.
The pilot was conducted on, 24th August 2011 in two clusters in Kiambu District about 20km North of Nairobi that represented a rural and an urban cluster, under the close eye of training facilitators.

6
The Kenya National Micronutrient Survey 2011
Piloting for the 24 Hour Recall was done within the Nairobi’s Eastland areas, Mathare Valley on the 28th of July 2011 where each trainee had the opportunity to interview a household.
2.4 Data collection
The KNMS fieldwork was conducted from September to December 2011 using household, individual and KIBHS questionnaires, and dietary assessment was undertaken in a cross-section of population in urban and rural areas using the multiple pass 24 hr recall tool. This is a 4-step, 24-hour recall interview technique that greatly enhances the recollection of foods and beverages consumed as well as improve the estimation of food quantities (portion sizes) consumed by the respondent. Anthropometry measurements included of height, length and weight in children, mid-upper arm circumference in both young children (6-59 months) and pregnant women, and weight and height in adults.
This was followed by collection of biological samples (blood, urine and stool). The amount of blood collected varied between the subject groups. Stool and urine samples were collected from women and school aged children. Initial sample processing was done in field laboratories and samples later transported to the central laboratory in KEMRI. Each team was supplied with the proper cold chain storage chambers,
which included liquid Nitrogen, -20°C CF 60 fridges, cool boxes, dry ice, battery packs among other supplies.
To ensure data quality, continuous collection and review of information was conducted for the purpose of identifying problems and correction in real-time by quality control teams. Steps were taken at the central and field level to improve data quality by implementing quality control procedures and monitoring proficient laboratory analyses. A team of supervisors and external evaluators were engaged in this process to evaluate the quality of training and field implementation processes.
For individual assays, samples were transferred to various laboratories in Kenya and overseas. Eight laboratories participated in analyzing samples for the KNMS 2011. These were: Centre for Public Health Research, Centre for Biotechnology Research and Development, Centre for Clinical Research, Centre for Virus Research of KEMRI, KEMRI - Welcome Trust in Kilifi, National Public Health Laboratory, DBS-Tech Laboratory in Germany and the Swiss Vitamin A Institute in Switzerland (Table 2-2). Field questionnaires were double-entered, cleaned and validated. Adjustment for altitude and correction for inflammation was done for the haematological indicators. The distribution and structure of variables were examined to identify outliers and errors.

7
The Kenya National Micronutrient Survey 2011
Table 2.2: Biological markers assessed per study population
Pre-SAC (6-59 months)
SAC (5-14 years) Non-Pregnant Women (15-49 years)
Pregnant Women (15-49 years)
Adult Men (15-54 years)
Household
Anaemia (Hb) Anaemia (Hb) Anaemia (Hb) Anaemia (Hb) Anaemia (Hb) Salt Iodine
AGP AGP AGP AGP AGP
CRP CRP CRP CRP CRP
Retinol Binding Protein (RBP)
Retinol Binding Protein (RBP)
Retinol Binding Protein (RBP)
Retinol Binding Protein (RBP)
Retinol Binding Protein (RBP)
Serum Ferritin Serum Ferritin Serum Ferritin Serum Ferritin Serum Ferritin
sTfR sTfR sTfR sTfR sTfR
Haemoglobinopathies Haemoglobinopathies Haemoglobinopathies Haemoglobinopathies Haemoglobinopathies
HIV Rapid testing (Voluntary)
Hematuria Hematuria Hematuria HIV Rapid testing (Voluntary)
Intestinal Parasites (qualitative1)
HIV Rapid testing (Voluntary)
HIV Rapid testing (Voluntary)
HIV Rapid testing (Voluntary)
Malaria (Rapid testing)
Intestinal Parasites (quantative2)
Intestinal Parasites (qualit)
Intestinal Parasites (qualit)
Intestinal Parasites (qualit)
Malaria (Thick smear)
Malaria (Rapid testing) Intestinal Parasites (quant)
Intestinal Parasites (quant)
Intestinal Parasites (quant)
HIV - DBS (ELISA)
Malaria (Thick smear) Malaria (Rapid testing) Malaria (Rapid testing) Malaria (Rapid testing) Zinc
Zinc Presence of S. haematobium
Presence of S. haematobium
Presence of S. haematobium
HIV - DBS (ELISA) Malaria (Thick smear) Malaria (Thick smear) Malaria (Thick smear)
HIV - DBS (PCR) (< 18 months)
Urinary Iodine Urinary Iodine Urinary Iodine
Urinary Sodium Urinary Sodium Urinary Sodium
Plasma Folate Zinc Serum Folate Serum Folate
Plasma Vitamin B12 HIV - DBS (ELISA) Vitamin B12 Vitamin B12
Zinc Zinc
HIV - DBS (ELISA) HIV - DBS (ELISA)
2.5 Adjustment of Haemoglobin Levels for Altitude
To adjust for altitude, an adjustment factor was computed using the following formula:-
Hb adjustment = -0.032 x [altitude (m) x 0.0032808] + 0.022 x [altitude (m) x 0.0032808]2
The haemoglobin values minus adjustment factor resulted in haemoglobin concentration at sea level to enable application of WHO cut-offs for determination of anaemia.
2.6 Correction of RBP, Serum Zinc and Serum Ferritin for Inflammation
Serum-ferritin, serum Zinc and Retinol Binding Protein (RBP) are indicators that are affected by inflammation. Based on concentrations of serum C-Reactive Protein (CRP) and Acid-Glycoprotein (AGP), four inflammation groups were determined, namely: 1,Normal (non elevated) or reference group (CRP ≤5 and AGP ≤1); 2, Incubation (CRP >5 and AGP ≤1); 3, Early convalescence (CRP >5 and AGP >1); and 4, Late convalescence (CRP ≤5 and AGP >1).
1 Described as positive/negative or present/absent 2 Described by total count

8
The Kenya National Micronutrient Survey 2011
The correction factor (CF) for each indicator was defined as the ratio of the median value of the indicator for the reference group to those in groups 2, 3, and 4. Adjusted corrected concentrations of the indicators were calculated by multiplying the individual values by their group-specific CF. These adjusted concentration indicators were used for estimating respective deficiencies.
2.7 Body Mass Index (BMI) for Adult Men and Non-pregnant Women
BMI was computed using a standard formula:
BMI = weight in kilograms / height in meters squared and BMI cut-off points recommended by (WHO 2000) were used in the analyses.
2.8 Anthropometry Computation
Anthropometric indices, weight-for-age, height-for-age and weight-for-height Z scores for pre-school children (PSC) were computed using ENA for SMART programme, which uses the 2007 WHO reference standards.
2.9 Calculation of Wealth index
The wealth index was calculated using data on household’s ownership of selected assets. The weights (factor scores) for each of the assets were generated through principal components analysis
2.10 Limitations of the Report
This study intended to achieve several objectives among them, ‘To determine the Kenyan household coverage in use of fortified food products (salt, flours, oil, sugar) and the level of fortification and labelling of such food’. Although questionnaires relating to this objective were filled and samples of flour, oil and sugar were collected at household level and preserved for laboratory analysis, analysis has, to date, not been undertaken due to financial constraints. Since the laboratory analysis of food samples was intended to corroborate results of the household questionnaire on food fortification and the laboratory data is missing, presenting the questionnaire data alone may be misleading and hence this objective has not been included in this report. In addition it’s important to note that HIV prevalence was not a main survey objective, therefore the results on low prevalence in HIV should be interpreted with caution. Consequently, comparison with KAIS might create misinterpretation of the findings especially in pregnant women, whose sample size was small.
(PCA). Weights were summed by household and after ranking the total scores, the household were divided into quintiles (each containing 20 percent of the households). Household members acquired the total score and quintile of their household.
(Table 2.3) gives cut-offs for various indicators recommended by WHO (2001) that were used in the analysis.

9
The Kenya National Micronutrient Survey 2011
Table 2. 3: Cut-off points for various key indicators
Study Group AnemiaHaemoglobin (Hb)
in g/dL
Iron DeficiencySerum Ferritin (SF)
in μg/L
Iron Deficiency AnemiaHaemoglobin & Serum Ferritin
PSC <11.0 <12 Hb <11.0 & SF <12
SAC 5 – 11 yrs <11.5 <15 Hb <11.5 & SF <15
12 – 14 yrs <12.0 <15 Hb <12.0 & SF <15
PW <11.0 <15 Hb <11.0 & SF <15
NPW <12.0 <15 Hb <12.0 & SF <15
Men <13.0 <15 Hb <13.0 & SF <15
Study Group Vitamin A DeficiencyRetinol Binding Protein (RBP)
in μmol/L
Folate DeficiencySerum Folate in nmol/L
Vitamin B12 DeficiencySerum B12 in pmol/L
VAD Marginal
PSC <0.70 0.7 - <1.05 - -
SAC <0.70 0.7 - <1.05 - -
PW <0.70 0.7 - <1.05 <10 <150
NPW <0.70 0.7 - <1.05 <10 <150
Men <0.70 0.7 - <1.05 - -

10
The Kenya National Micronutrient Survey 2011
CHAPTER THREE: RESPONSE RATES AND DEMOGRAPHIC CHARACTERISTICS OF HOUSEHOLDS3.1. Response rates
The response rate was computed out of the minimum sample size required to estimate a specific indicator without adjustment for non-
response. While the sample size attained for pre-school and school age children met or surpassed the minimum sample required for pregnant women and men was often below the minimum sample required for all indicators. Non-pregnant
Table 3. 1: Response rates for various indicators by study group
Population group Age Group Minimum sample size 3 Attained sample size Response rate4 (%), Anaemia statusPreschool Children 6-59 months 1243 1023 82School age Children 5-14 years 750 973 130Non-Pregnant Women 15-49 years 1312 650 50Pregnant Women5 15-49 years 227 117 52Men 15-54 years 384 264 69Iron statusPreschool Children 6-59 months 876 927 106School age Children 5-14 years 711 964 135Non-Pregnant Women 15-49 years 1367 647 47Pregnant Women 15-49 years 227 111 52Men 15-54 years 248 250 100Vitamin A statusPreschool Children 6-59 months 1026 918 89School age Children 5-14 years 686 942 137Men 15-54 years 132 257 195Sickle cell statusPreschool Children 6-59 months 1026 884 86Non-Pregnant Women 15-49 years 224 619 276Thalassaemia statusPreschool Children 6-59 months 1026 843 82Non-Pregnant Women 15-49 years 224 596 266Malaria statusPreschool Children 6-59 months 1149 856 74Non-Pregnant Women 15-49 years 876 622 71HIV statusPreschool Children 6-59 months 444 912 205Non-Pregnant Women 15-49 years 557 678 122Nutritional statusPreschool Children: Stunting 6-59 months 925 1130 122Preschool Children: Wasting 6-59 months 1119 1130 101Non-Pregnant Women 15-49 years 578 695 120
3 The minimum sample size calculations do not factor in the 20% (for women and PSC) and 30% (for men and SAC) inflation for non-response or refusals that was described in the proposal.
4 The minimum sample sizes calculated varied from indicator to indicator. A decision was made to use the sample sizes for the indicators with the highest minimum sample sizes on all indicators whose sample sizes were lower. Hence the observation of some response rates in excess of 100%.
5 The results for this sub group (pregnant women) should be interpreted with caution due to small sample size.

11
The Kenya National Micronutrient Survey 2011
3.2. Demographic characteristics
3.2.1. Residence, Household size, Age and sex
The sampled households totalled 2465. The majority of the households that participated in the KNMS (60.8 percent) resided in the rural areas compared to the estimated original sample size of 58.4 percent of households that would be in rural areas. The average household size of the participating households was 4.0 + 2.0 persons per household. This compares well with the national figure of KDHS 2008-2009 of 4.2 persons per household (KNBS AND ICF Macro, 2010). When the ages of the household heads (HhHs) were grouped into 10 year age group it was noted that the age group of 30 – 39 years contributed the highest proportion (29.0 percent) of HhHs while those aged less than 20 years had the least proportion (0.9 percent) of HhHs. The sex distribution of household heads showed a significant male dominance (72.4 Versus 27.6 percent), which was similar to the reported KDHS, 2008-2009 data (66.1 Versus 33.9 percent).
Table 3. 2: Characteristics of participating households, Kenya 2011
Characteristic N %
Age of Household Head
<20 21 0.9
20 – 29 421 17.2
30 – 39 709 29.0
40 – 49 462 18.9
50 – 59 384 15.7
60 – 69 226 9.2
70 – 79 132 5.4
80 and above 90 3.7
Sex of Household Head
Male 1783 72.4
Female 681 27.6
Residence
Rural 1498 60.8
Urban 967 39.2
Head of Household Education
Preschool 393 15.9
Primary 1080 43.8
Secondary/A Level 702 28.5
College/University 262 10.6
Not Stated 29 1.2
Household Size
Mean ( + SD) 4 (+ 2)
TOTAL PARTICIPATING HOUSEHOLDS 2,465
3.2.2. Household Head Education level
Household heads education level has long been associated with the quality of life of the members of the household. From the results, majority of the household heads (42.4 percent) had attained and completed primary education level. Only a few household heads (1.2 percent) had not gone to school or had zero years of schooling.
women had response rates of 80 percent and above for sickle cell, thalassemia and HIV status and sample size below 80 percent of the minimum required for anemia, iron and malaria status.

12
The Kenya National Micronutrient Survey 2011
CHAPTER FOUR: NUTRITIONAL STATUS
4.1. Overview
The nutritional status of children has been described using three indices namely, height for age, weight for age and weight for height. Height-for-age index provides an indicator of linear growth retardation and cumulative growth deficits. Children whose height-for-age Z-score is below minus two standard deviations (-2 SD) from the median of the WHO reference population are considered short for their age (stunted). Children who are below minus three standard deviations (-3 SD) are considered severely stunted. Stunting reflects failure to receive adequate nutrition over a long period and is affected by recurrent and chronic illness. Height-for-age, therefore, represents the long-term effects of malnutrition in a population and is not sensitive to recent, short-term changes in dietary intake.
The weight-for-height index measures body mass in relation to body height or length and describes current nutritional status. Children with Z-scores below minus two standard deviations (-2 SD) are considered thin (wasted) and are acutely malnourished. Wasting represents failure to receive adequate nutrition in the period immediately preceding the survey and may be the result of inadequate food intake or a recent episode of illness causing loss of weight and the onset of malnutrition. Children whose weight-for-height index is below minus three standard deviations (-3 SD) are considered severely wasted. Weight and height was available for 97.0 percent of sampled children.
Weight-for-age is a composite index of height-for-age and weight-for-height. It takes into account both chronic and acute malnutrition. Children whose weight-for-age is below minus two standard deviations (-2 SD) are classified as underweight. Children whose weight-for-age is below minus three standard deviations (-3 SD) are considered severely underweight (WHO, 2007).
4.2. Nutritional Status of Children aged 6-59 months
Nationally, the prevalence of stunting, underweight and wasting in children aged 6-59 months was 26.3 percent, 12.7 percent and 6.3 percent. Table 4-1 indicates the nutrition status of children 6-59 months of age using height for age, weight for age and weight for height.
According to the WHO classification, the national levels of stunting reported in this survey are classified as medium; so is the prevalence underweight and wasting. A reduction in the point prevalence was observed when these results are compared with results of the last Kenya Demographic Health Survey (KNBS AND ICF Macro, 2010, 2010) that reported the prevalence of stunting at 35 percent, while underweight and wasting was 16.7 percent and 6.7 percent respectively. The results are also comparable to the KDHS 2014which reported 26 percent of children are stunted. This trend has been observed in many countries that have reported, stunting rates much higher than their underweight rates (UNICEF, 2009).

13
The Kenya National Micronutrient Survey 2011
4.2.1. Levels of Stunting
In Kenya, stunting remains a problem of greater magnitude than underweight or wasting, and it more accurately reflects nutritional deficiencies and illness that occur during the most critical periods for growth and development in early life (UNICEF, 2009). Stunting is attributable to a wide range of factors including low birth weight, inadequate care and stimulation, insufficient nutrition, recurrent infections, and other environmental determinants (Wamaniet al., 2007). The prevalence of severe stunting which is defined as ≤ 3 standard deviations was 8.2 percent. This was higher in the rural (9.9 percent) than in the urban (3.7 percent) by almost three fold (Table 4-1). Compared to KDHS 2008-2009, there was a reduction in severe stunting from 14.2 percent to 8.2 percent (KNBS AND ICF Macro, 2010,).
Stunting was more pronounced in the rural children (30.0 percent) compared to urban children (16.9 percent), this is similar to the findings from the KDHS 2008-2009. This also concurs with evidence of a review of 36 countries, which showed that the rural children were more malnourished than those in urban areas (Smith et al., 2005). These have been associated with the observation that the mothers of children in urban areas are likely to be more educated and with better income therefore improved feeding and
care practices and access to better health care for their children (Smith et al., 2005).
The age group 6-11 months reported the lowest proportion of stunted children (0.14 percent), while the age group 24-35 months reported the highest proportion of stunted children (33.4 percent), Table 4-1. Infants are expected to be exclusively breastfed6 from birth to six months, and it is recommended that they begin eating nutritious and adequate solid foods (complementary foods) thereafter with continued breastfeeding through two years of age and beyond. This could explain the lower prevalence of stunting in children aged 6-11 months (0.14 percent), compared to those aged 24-35 months (33.4 percent).
The proportion of boys who were stunted was 27.4 percent compared to girls at26 percent. Ithas been observed in the region, there are gender differentials in stunting based on sex typically with males showing a slightly higher rate of stunting than females (Mukira et al, 2005). In several of the surveys reviewed by Mukira et al, sex differences in stunting were more pronounced in the lowest socio economic groups in sub-Saharan Africa. Male children under five years of age are more likely to become stunted than females, which might suggest that boys are more vulnerable to health inequalities than girls in the same age groups (Wamani et al. 2007).
6 Exclusive breastfeeding means a child is fed on only breastmilk and no other fluids or foods including water
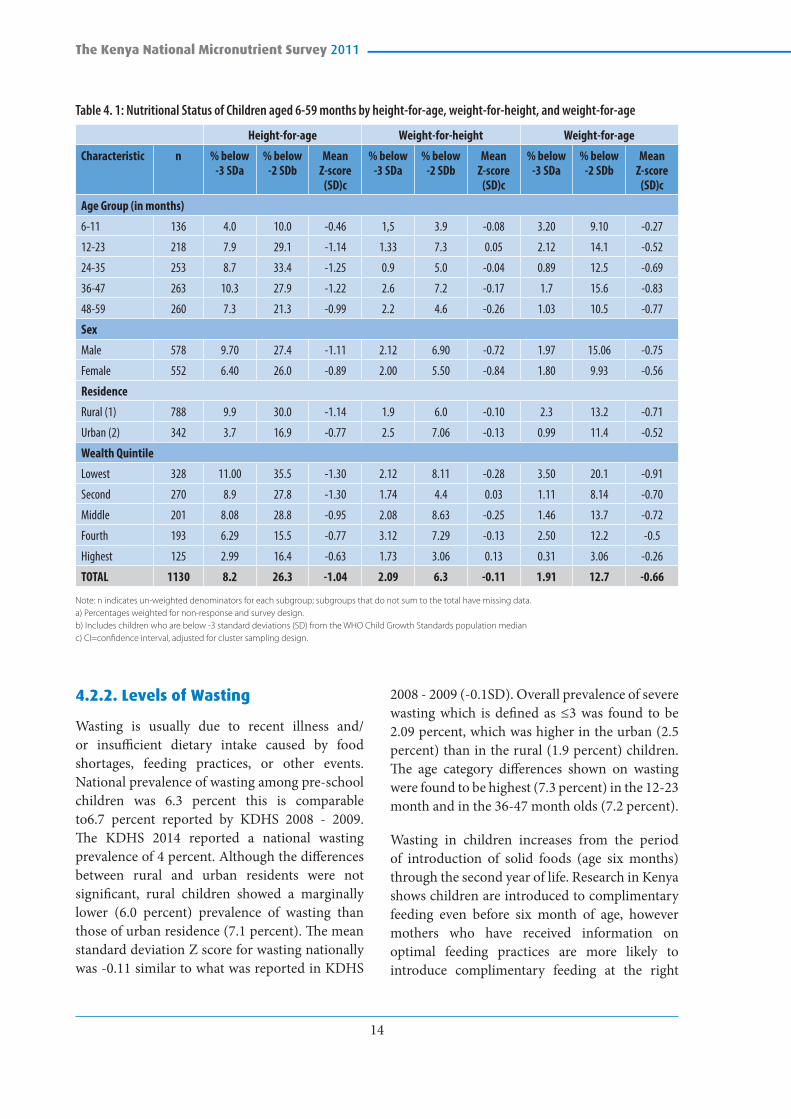
14
The Kenya National Micronutrient Survey 2011
Table 4. 1: Nutritional Status of Children aged 6-59 months by height-for-age, weight-for-height, and weight-for-age
Height-for-age Weight-for-height Weight-for-age
Characteristic n % below -3 SDa
% below -2 SDb
Mean Z-score
(SD)c
% below -3 SDa
% below -2 SDb
Mean Z-score
(SD)c
% below -3 SDa
% below -2 SDb
Mean Z-score
(SD)c
Age Group (in months)
6-11 136 4.0 10.0 -0.46 1,5 3.9 -0.08 3.20 9.10 -0.27
12-23 218 7.9 29.1 -1.14 1.33 7.3 0.05 2.12 14.1 -0.52
24-35 253 8.7 33.4 -1.25 0.9 5.0 -0.04 0.89 12.5 -0.69
36-47 263 10.3 27.9 -1.22 2.6 7.2 -0.17 1.7 15.6 -0.83
48-59 260 7.3 21.3 -0.99 2.2 4.6 -0.26 1.03 10.5 -0.77
Sex
Male 578 9.70 27.4 -1.11 2.12 6.90 -0.72 1.97 15.06 -0.75
Female 552 6.40 26.0 -0.89 2.00 5.50 -0.84 1.80 9.93 -0.56
Residence
Rural (1) 788 9.9 30.0 -1.14 1.9 6.0 -0.10 2.3 13.2 -0.71
Urban (2) 342 3.7 16.9 -0.77 2.5 7.06 -0.13 0.99 11.4 -0.52
Wealth Quintile
Lowest 328 11.00 35.5 -1.30 2.12 8.11 -0.28 3.50 20.1 -0.91
Second 270 8.9 27.8 -1.30 1.74 4.4 0.03 1.11 8.14 -0.70
Middle 201 8.08 28.8 -0.95 2.08 8.63 -0.25 1.46 13.7 -0.72
Fourth 193 6.29 15.5 -0.77 3.12 7.29 -0.13 2.50 12.2 -0.5
Highest 125 2.99 16.4 -0.63 1.73 3.06 0.13 0.31 3.06 -0.26
TOTAL 1130 8.2 26.3 -1.04 2.09 6.3 -0.11 1.91 12.7 -0.66
Note: n indicates un-weighted denominators for each subgroup; subgroups that do not sum to the total have missing data.a) Percentages weighted for non-response and survey design. b) Includes children who are below -3 standard deviations (SD) from the WHO Child Growth Standards population medianc) CI=confidence interval, adjusted for cluster sampling design.
4.2.2. Levels of Wasting
Wasting is usually due to recent illness and/or insufficient dietary intake caused by food shortages, feeding practices, or other events. National prevalence of wasting among pre-school children was 6.3 percent this is comparable to6.7 percent reported by KDHS 2008 - 2009. The KDHS 2014 reported a national wasting prevalence of 4 percent. Although the differences between rural and urban residents were not significant, rural children showed a marginally lower (6.0 percent) prevalence of wasting than those of urban residence (7.1 percent). The mean standard deviation Z score for wasting nationally was -0.11 similar to what was reported in KDHS
2008 - 2009 (-0.1SD). Overall prevalence of severe wasting which is defined as ≤3 was found to be 2.09 percent, which was higher in the urban (2.5 percent) than in the rural (1.9 percent) children. The age category differences shown on wasting were found to be highest (7.3 percent) in the 12-23 month and in the 36-47 month olds (7.2 percent).
Wasting in children increases from the period of introduction of solid foods (age six months) through the second year of life. Research in Kenya shows children are introduced to complimentary feeding even before six month of age, however mothers who have received information on optimal feeding practices are more likely to introduce complimentary feeding at the right

15
The Kenya National Micronutrient Survey 2011
age, reducing the likelihood of children becoming malnourished. (Ndolo M, 2006). Higher rates of illness among children in this age group also increase the chance of wasting among children. (Mukiraet al., 2005). Like in the other two nutritional indices cited above, sex differences in wasting showed that a higher proportion of males (6.9 percent) than females (5.5 percent) were wasted. This pattern of malnutrition identifies male children to be at higher risk of malnutrition.
4.2.3. Levels of Underweight
The prevalence of underweight is defined as the percentage of children whose weights are ≤ -2 below the median weight for age groups using the WHO international growth reference standards. Underweight is a reflection of chronic and acute malnutrition. The mean Z score for underweight in the study was 0.66, lower than -0.9 that was reported in KDHS 2008 - 2009, the prevalence of severe underweight which is defined as ≤ 3 was found to be 1.91 percent, which is much lower than the 4.2 percent that was observed three years prior to this survey in KDHS. It was higher in the rural (2.3 percent) than in the urban (1.0 percent) children.
The prevalence of underweight among pre-school children in this study was 12.7 percent and varied, marginally, by residence between rural and urban dwellers (13.2 percent and 11.4 percent respectively). Unlike stunting, this difference in rural-urban prevalence of underweight was not statistically different. Underweight on the other hand was more prevalent among the 12-23 months old. Sex differences in underweight showed that a higher proportion of males (15.1 percent) than females (9.9 percent) were identified as being underweight.
4.2.4. Social Economic Status and Nutritional Status of Children
One of the strong determinants of nutritional status in children is the economic status of the child’s household (Smith et al., 2005). Studies have shown that Social Economic Status (SES) is significantly related to child stunting, linear growth retardation or low height-for-age (Abuya, Ciera, & Kimani-Murage, 2012). Stunting is a useful anthropometric measure for children in terms of its positive correlation with social and economic deprivation. Stunting and underweight rates were higher in the children in the lowest wealth quintile; see Table 4-1, which indicates the distribution of nutritional status by wealth quintiles. Children in the middle wealth quintiles are generally more stunted, wasted and underweight than those in the highest wealth quintile. Wasting and underweight on the other hand was lowest (3.1 percent) in the highest wealth quintile. In households with high levels of poverty, the individuals often have low access to food, inadequate resources for care in addition to not being able to utilize resources for health sustainably (Smith et al., 2005). Just as reported in the nutritional situation analysis of children 2009, the nutritional gap between children from poorest and wealthiest households remains high (UNICEF, 2010).
4.3. Nutritional status in adults
Nutritional status in the non-pregnant women and men was defined by Body Mass Index (BMI), which is calculated as weight (kg) divided by height squared (m2). It is a simple measurement of body weight in relation to height. According to Garenne (2011), the height of adult women is considered stable after age 20 years. Height is an important anthropometric indicator because it defines stature. In the KNMS study, any respondents whose information on height and or weight was unavailable have been excluded from this analysis.

16
The Kenya National Micronutrient Survey 2011
Table 4. 2: Factors associated with nutritional status in non-pregnant women
n Thinness (%) (BMI<18.5)
Normal (%) (BMI 18.5 – 25.0
Overweight (%) (BMI >25-30
Obese (%) (BMI >30)
Residence Rural 410 16.1 67.8 11.2 4.9
Urban 285 9.1 55.8 23.5 11.6
Level of Education Preschool 71 39.4 57.7 2.8 0.0
Primary 365 12.1 64.1 16.2 7.7
Secondary, A level 236 7.6 61.4 21.2 9.7
Wealth index quintiles
Poorest 133 27.1 66.2 4.5 2.3
Second 147 13.6 76.9 5.4 4.1
Middle 128 11.7 64.8 21.10 2.3
Fourth 155 9.7 54.8 24.50 11.0
Richest 132 4.5 51.5 25.80 18.2
4.3.1. Levels of Malnutrition in Non-pregnant Women
The average height of adult women in this study was 159.5 ± 7.6 cm, average weight was 58.2 ± 14.1kg, and average BMI was 23.8 ± 5.4 kg/m². Mean BMI was higher in the urban non-pregnant women (24.1 ± 5.8kg/m2) than rural (21.9 ± 4.9kg/m2 ). Table 4.2 illustrates the prevalence’s of nutritional status of the non-pregnant women assessed during this survey. Among the non-pregnant women of reproductive age, the overall prevalence of thinness was 13.2 percent, comparable with what was reported by KDHS 2008 - 2009, of 12 percent.
There was considerable variability in prevalence of thinness between rural and urban non-pregnant women dwellers where rural women showed much higher (16.1 percent) prevalence than those in the urban (9.1 percent). This pattern is similar to that reported in KDHS 2008 - 2009, in which consistently thinness is higher in the rural than urban women. It is well documented that being underweight is normally the result of deficit energy consumption while being overweight is related to excess energy intake (Khan & Kraemer, 2009). According to Finucane et al (2011) by 2008, the lowest mean female BMIs in sub saharan Africa had reached around 21 kg/m2, suggesting that underweight prevalence has decreased, but that underweight might still affect some populations
as evidenced in this survey where a considerable 16.1 percent of women are still thin.
With respect to being overweight and or obese, the overall prevalence among non-pregnant women was 23.9 percent. This prevalence differed significantly between rural (16.1 percent) and urban (35.1 percent) non-pregnant women.
There is also a considerable association between overweight and social economic status (represented here by wealth quintiles), level of education and an increase in age. This study found a direct association between the level of wealth quintile and nutritional status in non-pregnant women. The highest prevalence of overweight/obesity (44.0 percent) was found in women in the highest level of wealth quintile while the highest prevalence of thin women was found in those in the lowest wealth quintile. This difference was statistically different and the distribution is further illustrated in Table 4-2. Our findings concur with findings from other studies where women of higher socio-economic status are more likely to be overweight or obese than their poorer counterparts (Zirabaet al.,2009; Ali & Crowther, 2009; Garenne, 2011). This is further supported by (Blanchard, 2009) where it is noted that as income increase, obesity increases. This may be the case in these studies including the current survey, however, there is seemingly a changing trend in presentation of overweight and obesity, where the

17
The Kenya National Micronutrient Survey 2011
Table 4. 3: Status of Non-pregnant Women (NPRG) and Men using BMI
Age Group Residence n Total Thinness (BMI<18.5)
Weighted (%)
Normal (BMI=18.5-<25)
Weighted (%)
Overweight & Obese (BMI>25)
Weighted (%)
NPRG Rural 410 16.1 67.8 16.1
Urban 285 9.1 55.8 35.1
Total 695 13.2 62.9 23.9
Men Rural 184 30.4 60.3 9.2
Urban 95 13.7 69.5 16.8
Total 279 24.7 63.4 11.8
shift is showing that, equally, populations from poor social economic status are also presenting very high prevalence of overweight and obesity. Monteiro et al, 2004 reviewed data from several studies in developing countries and found that obesity in the developing world can no longer be considered solely a disease of groups of higher SES.
In regard to education levels, overweight and obesity prevalence was higher (30.9 percent) in those with secondary or above levels of education (overweight 21.2 percent and obese 9.7 percent) followed by those with primary education who showed a prevalence of 23.9 percent, (overweight 16.2 percent and obese (7.7 percent) while thinness was prevalence in those who only attained preschool education at 39.4 percent. A statistically significant difference was observed between the various levels of education. The higher the education level, the higher the prevalence of overweight and obesity. These findings are similar in many populations where the level of education is directly related with obesity especially in women (Ali & Crowther, 2009). KDHS 2008 - 2009 showed a similar pattern where women with higher education presented the highest prevalence of overweight and obesity though for overweight, women without education had apparently higher prevalence than those with primary education (KNBS AND ICF Macro, 2010, 2009). Education appears to be protective for the underweight women but as a risk factor for the overweight and obese women (Khan & Kraemer, 2009).
4.3.2. Levels of Malnutrition in Men
The KNMS survey is among a few such studies that considered the inclusion and assessment of nutritional status of men and BMI was used for the classification of nutritional status. Unlike in the female population, the discussions regarding nutritional status in men is mainly based on the mean BMIs. The average height, weight and BMI of the adult men in this study was 169.3 ± 7.6 cm, 60.7 ± 14.19kg/m2, and 21.1 ± 4.4 kg/m² respectively. The mean BMI was higher in the men residing in urban areas (22.2 ±4.9 9kg/m2
) compared to the rural male population (20.5 ±3.9kg/m2). Wasting among men was observed to have an overall prevalence of 24.7 percent. Rural men were more than twice (30.4 percent) the prevalence of wasting in urban men (13.7 percent).
The overall prevalence of overweight (including obesity) among men was 11.8 percent. Males in rural areas had much lower prevalence (9.2 percent) than urban male dwellers (16.8 percent). This pattern of rural and urban distribution followed the same pattern with that seen in women. It is believed that populations in the urban settings are highly predisposed to sedentary lifestyles including intake of highly refined diets, which are some of the known factors associated with increase in BMI.

18
The Kenya National Micronutrient Survey 2011
Table 4. 4: Factors associated with nutritional status in men
n Thinness (BMI <18.5)
Normal (BMI 18.5 - <25)
Overweight & Obese (BMI >25)
Residence Rural 184 30.4 60.3 9.2
Urban 95 13.7 69.5 16.8
Education level None 17 64.7 29.4 5.9
Primary 141 31.2 62.4 6.4
Secondary & above 120 11.7 70.0 18.3
Wealth index quintiles Lowest 54 55.6 40.7 3.7
Second 68 19.1 72.1 8.8
Middle 56 14.3 69.6 16.1
Fourth 54 29.6 63.0 7.4
Highest 47 4.3 70.2 25.5
Total 279 24.7 63.4 11.8
In regard to education, the lowest mean BMI was found in men without education at 18.6 ± 2.6 kg /m2 and highest in those with secondary and above levels of education (21.1 ± 4.4kg /m2). Although the mean BMI was within the normal range, the poorest men had the lowest BMI (19.6 ± 5.1 kg /m2) while those with highest SES had the highest mean BMI (23.9 ± 5.9 kg /m2). The middle class had higher mean BMI (21.5 ±3.5 kg/m2) when compared to the second and fourth quintiles where the mean was 20.3 ± 2.5 kg /m2 and 20.7 ± 3.4 kg /m2 but lower than in the highest wealth quintile.
Nationally, the prevalence of thinness in men was higher than amongst women. This study has shown that more men in Kenya are likely to be underweight (thin) 24.7 percent when compared to women whose prevalence of underweight is 13.2 percent. The findings also show a consistency in the levels of education in both women and men, where those with the lowest education had the lowest mean BMI. The pattern of inverse relationship between SES and nutritional status in women is not observed the men. Explanations of the inverse association between SES and obesity among women, or the lack of association among men shown to exist in lower-middle-income and upper-middle income developing economies are complex and more research is necessary (Monteiro et al., 2004).
4.3.3. Nutrition Status of Pregnant Women by Mid Upper Arm Circumference
Mid Upper Arm Circumference (MUAC) does not vary much during pregnancy and is therefore an appropriate measure of nutritional status than BMI or weight (Assefa et al., 2012). In MUAC measurements, pregnant women with measurements of <23.0 cm are considered to be thin.
Table 4. 5: Nutrition status of pregnant women by Mid Upper Arm Circumference
n Total Thinness (MUAC<23cm)Weighted (%)
Normal (MUAC>23cm)Weighted (%)
Rural 71 11.4 88.6
Urban 46 12.0 88.0
Total 117 11.7 88.3
The results of this study show that, overall, the prevalence of thinness among pregnant women was 11.7 percent with little variability between rural (11.4 percent) and urban (12.0 percent) residents. The mean MUAC in the pregnant women was 26.4 SD 4.0 cm.

19
The Kenya National Micronutrient Survey 2011
CHAPTER FIVE: ANAEMIA, IRON DEFICIENCY, IRON DEFICIENCY ANAEMIA AND ASSOCIATED FACTORS
5.1. Introduction
Anaemia is a public health problem associated with, among others, impaired cognitive and motor development in children and increases the risk of mortality for the mothers and neonates. It is a condition in which the number of red blood cells (and consequently their oxygen-carrying capacity is insufficient to meet the body’s physiological needs. Specific physiological needs vary with a person’s age, gender, altitude, smoking behaviour, and different stages of pregnancy. Although the primary cause of anaemia is iron deficiency, it is seldom present in isolation. More frequently, it coexists with a number of other causes such as malaria, parasitic infection, nutritional deficiencies (including folate, vitamin B12 and vitamin A), and inherited or acquired disorders that affect haemoglobin synthesis, red blood cell production or red blood cell survival (WHO, 2008; KMIS, 2010; WHO, 2011).
Haemoglobin concentration is widely used to diagnose anaemia while the concentration of
plasma (or serum) ferritin is positively correlated with the size of the total body iron stores in the absence of inflammation. A low serum ferritin value reflects depleted iron stores, but not necessarily the severity of the depletion as it progresses (WHO, 2001). Table 5-1 below indicates the proposed classification of public health significance of anaemia in population on basis of prevalence estimated from blood levels of haemoglobin.
Table 5. 1 Proposed classification of public health significance of anaemia in populations
Category of public health significance
Prevalence of anaemia (%)
Severe > or = 40
Moderate 20.0 – 39.9
Mild 5.0 – 19.9
Normal < or = 4.9
A summary of the prevalence of anaemia, iron deficiency and iron deficiency anaemia in all the age categories evaluated during the survey period is as indicated in the Table 5-2 below.
Table 5. 2: Prevalence of Anaemia, Iron deficiency (ID) and Iron deficiency anaemia (IDA) in the study population
Study group
Anaemia Iron Deficiency Iron Deficiency Anaemia
N weighted (%)
anaemia
95% C.I. Lower Upper
n weighted (%) ID
95% C.I. Lower Upper
n weighted (%) IDA
95% C.I. Lower Upper
PSC 827 26.3 23.30 29.30 918 21.8 19.13 24.47 827 13.3 10.99 15.61
SAC 872 16.5 14.04 18.96 942 9.4 7.54 11.26 942 4.9 3.52 6.28
PW 104 41.6 32.13 51.07 111 36.1 27.16 45.04 104 26.0 17.57 34.43
NPW 592 21.9 18.57 25.23 633 21.3 18.11 24.49 592 14.0 11.20 16.80
Men 240 9.3 5.87 13.33 247 3.6 1.28 5.92 243 2.9 0.79 5.01
Total 2635 23.1 21.5 24.7 2851 18.4 17.0 20.0 2708 12.2 11.0 13.4

20
The Kenya National Micronutrient Survey 2011
In the study population, the highest prevalence of anaemia, iron deficiency and iron deficiency anaemia was noted in pregnant women (41.6 percent, 36.1 percent and 26 percent respectively), and lowest prevalence of anaemia, iron deficiency and iron deficiency anaemia noted in men (9.3 percent, 3.6 percent and 2.9 percent respectively). Overall, the prevalence of anaemia in Kenya was 23.1 percent compared to the global and Africa prevalence of 24.8 percent and 40.7 percent respectively (WHO, 2008).
5.2. Anaemia, Iron Deficiency and Iron Deficiency Anaemia in Pre-School Aged Children (6-59 months)
Full-term infants are normally born with adequate iron stores in the liver and haematopoietic tissue, because of destruction of fetal red blood cells soon after birth. Breast milk is relatively low in iron,
Table 5. 3: Anaemia, iron deficiency (ID), and iron deficiency anaemia (IDA) among pre-school age children (6-59 months) in relation to selected demographic and economic characteristics
Characteristic N Anaemia, weighted %
n ID, weighted % n IDA, weighted %
Age in months6-11 65 41.5 79 26.6 65 24.612-23 123 42.3 133 34.6 122 20.524-35 201 24.4 219 21.0 201 8.536-47 229 21.8 248 19.4 228 11.048-59 210 19.0 236 16.5 209 9.1SexMale 455 27.7 503 23.3 456 13.8Female 372 24.7 415 20.0 372 11.0ResidenceRural 592 26.9 662 21.5 592 12.5Urban 234 24.8 255 22.7 234 12.4Level of education of the household headPreschool/ None 150 34.7 162 34.0 149 20.1Primary 405 29.4 446 21.3 405 13.8Post primary/ Vocational 191 17.3 220 12.3 192 6.3College/ University 77 16.9 85 27.1 78 7.7Not stated 4 25.0 5 0.0 4 0.0Wealth QuintileLowest 240 31.7 262 22.9 240 13.8Second 214 27.6 241 20.3 214 14.5Middle 129 31.0 151 25.2 129 15.5Fourth 119 14.3 136 18.4 119 5.9Highest 124 20.2 128 21.9 124 9.7TOTAL 827 26.3 918 21.8 827 12.5

21
The Kenya National Micronutrient Survey 2011
5.2.1. Anaemia in children aged 6-59 months
The overall (National) prevalence of anaemia among pre-school children was 26.3 percent compared to the global prevalence of 47.4 percent. In Africa, the estimated prevalence of anaemia in preschool children is 67.6 percent (WHO, 2008). There was no variability in prevalence of anaemia between residences (rural 26.9% versus urban 24.8%). In terms of distribution of anaemia by sex, male children had a higher prevalence of anaemia than females (27.7 percent and 24.7 percent respectively) though the difference was not significant. When the prevalence of anaemia was considered by age sub-categories, significant variation was noted between the younger children (6-11 months 41.5 percent and 12-23 months 42.3 percent) and the older children (24-35 months 24.4 percent, 36-47 months 21.8 percent and 48-59 months 19.0 percent) with a consistent reduction in prevalence of anaemia as the age increased (Table 5-3 above). The Kenya Malaria Indicator Survey (KMIS) 2010 also observed similar patterns where the proportion of anaemic children generally declined with age from 62.7 percent in children 6-8 months to 38 percent in children 36-39 months, and the proportions varied little with residence (urban 23.6 percent & rural 26.5 percent) and gender (male 26.9 percent & female 25.2 percent).
Socio-economic status presented as wealth quintiles is considered an important factor in anaemia prevalence, and ranges from the lowest to the highest. In this study, wealth quintile was found to be a significant factor in anaemia. The lowest wealth quintiles showed much higher prevalence of anaemia (31.7 percent) compared to those in the higher wealth quintiles (14.3 percent in fourth and 20.2 percent in highest wealth quintile). The KNMS 2011 showed similar prevalence of anaemia in the lowest and second wealth quintiles to those reported by KMIS 2010 (lowest 31.5 percent & second 28.3 percent). It is important when making such comparisons to bear in mind variations in anaemia caused by differences in assessment methodology and source of blood sample i.e. capillary versus venous. Some studies suggest that haemoglobin values measured in capillary samples are higher than those measured in venous samples, potentially leading to false-negative results (WHO, 2011). In KNMS, venous blood was used. The HemoCue® system used in both KNMS and KMIS was based on the cyanmethemoglobin method that has been shown to be stable and durable in field settings. In the 1999 survey HemoCueTM, Angelholm, Sweden was used to test for Hb.
There was a notable decline in the national prevalence of anaemia in preschool children from 69 percent in 1999 national micronutrient survey to 46.1 percent in 2010 national malaria indicator survey and then to 26.3 percent in 2011 national micronutrient survey. A decline in anaemia prevalence in preschool children may be attributed to the many interventions put in place after the 1999 survey. These include micronutrient deficiency prevention and control programmes, such as promotion of intake of iron rich foods, prevention and control of helminths, and prevention, control and prompt treatment of malaria in children. The decline in anaemia prevalence between 2010 and 2011 may be attributed to low malaria prevalence during the time of conducting KNMS 2011 survey. According to the KMIS 2010 report, twenty percent of the anaemia cases could have been attributed to malaria. For this reason, anaemia
although the iron in breast milk is much better absorbed than that in cows’ milk. Iron deficiency commonly develops after six months of age if complementary foods do not provide sufficient absorbable iron, even for exclusively breastfed infants. Iron requirements on a body weight basis are proportional to growth velocity (WHO 2007).
In the KNMS 2011, haemoglobin cut-offs of less than 11g/dL were used to diagnose anaemia in children aged 6-59 months. Ferritin cut-off of less than 12µg/L was used in diagnosing iron deficiency (ID), while the combination of haemoglobin and ferritin cut-off values was used to compute iron deficiency anaemia (IDA).

22
The Kenya National Micronutrient Survey 2011
in children under five years is likely to be higher if assessments are done during peak malaria transmission seasons. Currently therefore and in accordance with World Health Organisation classification, prevalence of anaemia in preschool children in Kenya is moderate (Table 5-1).
5.2.2. Iron Deficiency in children aged 6-59 months
The overall (National) prevalence of Iron Deficiency in the Pre-school age children was 21.8 percent. There was a significant difference in iron deficiency prevalence among the age sub-categories. The prevalence was highest in 12-23 months age sub-categories (34.6 percent) and lowest in the oldest (48-59 months) with a prevalence of 16.5 percent. Infants 6-11 months had a prevalence of 26.6 percent.
Similar to the trends observed with anaemia, the prevalence of iron deficiency did not differ between the sexes or residence (rural versus urban). However, while differences in the anaemia prevalence were observed by wealth quintiles, there was no statistical difference in iron deficiency by wealth quintile.
Physiologically, normal ferritin concentrations vary by age and sex. Concentrations are high at birth, rise during the first two months of life, and then fall throughout later infancy. At about one year of age, concentrations begin to rise again and continue to increase into adulthood (WHO, 2011). What was notable in KNMS 2011 was that it is the 12-23 months age group that recorded the highest (34.6 percent) iron deficiency, which tapers off after two years. This brings into question the management and care practices in this cohort of children. Poor complementary foods that are low in bio-available iron are some of the major contributors to iron deficiency and anaemia in this age group.
The KNMS 2011 recorded a general decline in iron deficiency prevalence compared to the 1999
survey that reported prevalence of marginal to severe iron deficiency of 35.2 percent, 38 percent, 29.1 percent, 32 percent and 46 percent among 6-11, 12-23, 24-35, 36-47 and >47 months old children respectively. This again can be attributed to the success of micronutrient deficiency prevention and control programmes, that include use of food based approaches to prevention of iron deficiency in children, an example being promotion of intake of iron rich foods such as animal products.
5.2.3. Iron Deficiency Anaemia (IDA) in children aged 6-59 months
With respect to iron deficiency anaemia, the overall (national) prevalence was 13.3 percent. There was a notable difference in prevalence of iron deficiency anaemia between the younger children (6-23 months) and the older children (24 – 59 months) of the pre-school age. The trend in the distribution of IDA by wealth quintiles was noted to be lowest (5.9 percent) among those in the fourth wealth quintiles and highest (15.5 percent) in the middle wealth quintiles though the difference in prevalence of iron deficiency anaemia within the wealth quintiles was not statistically significant. Despite the male children and the rural population recording higher IDA, the prevalence did not differ significantly between sexes and residence (rural versus urban).
5.3. Anaemia, Iron Deficiency and Iron Deficiency Anaemia in School Age Children (5-14 years)
In the KNMS 2011, haemoglobin cut-offs of less than 11.5 g/dL for 5-11 years and less than 12 g/dL for 12-14 years were used to diagnose anaemia. Ferritin cut-offs of less than 15.0g/dL were used in diagnosing iron deficiency (ID), while the combination of haemoglobin and ferritin cut-off values was used to compute iron deficiency anaemia (IDA).

23
The Kenya National Micronutrient Survey 2011
Table 5. 4: Anaemia, iron deficiency (ID), and iron deficiency anaemia (IDA) among School Age Children (5– 14 years) in relation to selected demographic and economic characteristics
Characteristic n Anaemia % n ID (%) n IDA (%)
Gender
Male 419 17.9 444 10.1 402 4.5
Female 453 15.0 499 8.8 450 5.3
Residence
Rural 643 18.5 694 9.9 618 5.3
Urban 230 10.9 248 7.7 233 3.9
Education of household head
None or Pre School 164 29.3 160 19.4 145 11.0
Primary 444 15.1 485 7.8 441 4.1
Secondary 216 11.6 246 7.7 216 3.7
Tertiary/college/university 40 7.5 42 0.0 42 0.0
Wealth Quintile
Lowest 233 26.2 249 14.9 226 9.7
Second 224 9.8 258 9.3 226 1.8
Middle 188 19.7 203 4.9 175 4.0
Fourth 139 9.4 137 8.0 134 4.5
Highest 88 12.5 93 5.4 91 3.3
Total 872 16.5 942 9.4 942 4.9
5.3.1. Anaemia in School age children
The median age for school age children with anaemia was 8 years compared to 9 years without anaemia. Overall prevalence of anaemia among school age children was 16.5 percent which is lower compared to the global prevalence of 25.4percent (WHO 2008). The prevalence varied between gender; males had a higher prevalence (17.9 percent) compared to females (15 percent), though the difference was not significant. Similar to PSC, the prevalence of anaemia was noted to be significantly higher (18.5 percent) among school age children in rural areas compared to those in urban areas (10.9 percent) (Table 5-4 above).
Educational levels of household heads were observed to relate with the prevalence of anaemia in school age children in that those household heads who had never attended school had children with much higher (29.3 percent) prevalence of anaemia than those with primary school education and above. Analysis of anaemia
in the school age children by wealth quintiles showed that children in the lower wealth quintiles had, highest prevalence of anaemia (26.2 percent) followed by middle (19.7 percent) and highest (12.5 percent) while those in the fourth and second wealth quintiles had the lowest (9.4 and 9.8 percent respectively).
5.3.2. Iron Deficiency in school age children
School age children that were found to be iron deficient, (as is the case of those with anaemia), had a median age of 8 years, while those who were non deficient had a median age of nine years. The overall prevalence of iron deficiency was 9.4 percent compared to the global prevalence of 46 percent (WHO, 2011). Although the prevalence of iron deficiency showed marginal differences between gender (10.1 percent in males and 8.8 percent in females) the difference were not statistically significant. As was the case with anaemia, when the distribution of prevalence of iron deficiency was considered against levels of education,

24
The Kenya National Micronutrient Survey 2011
children whose household head had no education had the highest (34.7 percent) prevalence of iron deficiency compared to those with primary level of education and above. Variability in prevalence of iron deficiency anaemia was also observed between wealth quintiles where children in the lowest wealth quintiles had, the highest (14.9 percent) prevalence of iron deficiency while those in the middle wealth quintiles showed the lowest prevalence (4.9 percent). It is important therefore for efforts geared towards tackling iron deficiency to bear in mind the social and environmental determinants of IDA in the population.
5.3.3. Iron Deficiency Anaemia in school age children
Iron deficiency anaemia among school age children had an overall prevalence of 4.9 percent with the median age in those children with anaemia of 7 years compared with the median age of those without iron deficiency anaemia of 9 years. The prevalence of iron deficiency anaemia showed no significant difference between males and females. Higher prevalence (5.3 percent), albeit not significant, was also seen among rural dwellers than among urban residents (3.9 percent). Education level of household head was an important determinant of prevalence of iron deficiency anaemia among school age children. There was a significant difference in the prevalence of iron deficiency anaemia in children according to the education level of household heads.
Children whose household head had no education had prevalence of iron deficiency anaemia of 11.0 percent and those whose household head had primary school education and secondary level education had prevalence of 4.1 percent and 3.7 percent respectively, where in households whose household head had tertiary level of education, there were no reported cases of IDA. Further, significant variability in prevalence of iron deficiency anaemia was seen among the children in their different wealth quintiles. Children in the lowest wealth quintiles had the highest prevalence of 9.7 percent while children in the second wealth quintile had the lowest prevalence (1.8 percent). The distribution of the prevalence across other wealth quintiles was relatively equal (3.3-4.5 percent). There was a significant difference in distribution of iron deficiency according to the wealth quintiles.
5.4. Anaemia, Iron Deficiency and Iron Deficiency Anaemia in Non-Pregnant Women (15-49 years)
In the KNMS 2011, haemoglobin cut-offs of less than 12g/dL were used to diagnose anaemia in non-pregnant women. Ferritin cut-offs of less than 15µg/L was used in diagnosing iron deficiency (ID), while the combination of haemoglobin and ferritin cut-off values was used to compute iron deficiency anaemia (IDA).

25
The Kenya National Micronutrient Survey 2011
Table 5. 5: Anaemia, iron deficiency (ID), and iron deficiency anaemia (IDA) among School Age Children (5– 14 years) in relation to selected demographic and economic characteristics
Characteristic n Anaemia, weighted %
n ID, weighted % n IDA, weighted %
Age in years
15 – 19 116 13.8 122 15.6 119 7.6
20 – 49 475 23.8 511 22.7 473 15.6
Residence
Rural 370 24.6 397 21.4 363 13.2
Urban 221 17.2 236 21.2 229 15.3
Level of Education
Preschool/None 68 41.2 69 39.1 60 33.3
Primary 309 21.0 344 18.6 321 11.2
Post primary/ Vocational 175 20.6 179 23.5 174 14.9
College/ University 40 2.5 41 4.9 36 2.8
Wealth Quintile
Lowest 107 34.6 120 27.5 101 20.8
Second 112 22.3 130 20.0 129 13.2
Middle 119 22.7 123 26.0 118 12.7
Fourth 110 19.1 111 18.9 130 10.8
Highest 145 13.8 148 15.5 114 14.0
TOTAL 592 21.9 633 21.3 592 14.0
5.4.1. Anaemia in non-pregnant women
Non-pregnant women had an overall prevalence of anaemia of 21.9 percent (Table 5-5 above) which is lower compared to global prevalence of 30.2 percent, the African prevalence of 47.5 percent (WHO 2008), and that reported in 1999 national micronutrient survey of 47.9 percent. Prevalence of anaemia varied significantly between rural and urban residences of the non-pregnant women with those in rural areas registering a higher prevalence (24.6 percent) than the urban residents (17.2 percent). It is worth noting that about a third of anaemia cases among older individuals are said to be caused by iron, folate, or B12 deficiency (Fomovska et al., 2008).
Upon examining the relation between prevalence of anaemia and educational levels, notable significant differences were observed between those with no education (41.2 percent) and those with college/university level of education (2.5
percent). This scenario was also seen with levels of wealth quintiles, where those women in the lowest wealth quintiles had significantly much higher prevalence of anaemia than those in the higher wealth quintiles (13.8 percent). Previous studies have observed similar patterns where education, region of residence and wealth status are some of the factors associated with occurrence anaemia in Africa (Ngnie-Teta et al., 2008).
5.4.2. Iron Deficiency in non-pregnant women
The overall (National) prevalence of iron deficiency among non-pregnant women was 21.3 percent compared to 47.5 percent in 1999 national micronutrient survey. Prevalence of iron deficiency did not differ between women in rural (21.4 percent) and those of urban residence (21.2 percent) possibly because physiologically, serum ferritin values among women remain relatively low until menopause and then rise (WHO, 2011). However, significant differences

26
The Kenya National Micronutrient Survey 2011
existed with levels of education attained by these women, where those with no education had high prevalence (39.1 percent) compared to those with college/university education (4.9 percent).
Analysis by wealth quintiles showed that non-pregnant women in the lowest wealth quintile had a higher (27.5 percent) prevalence of iron deficiency than those in the highest wealth quintile (15.5 percent), although this difference was not statistically significant. The current findings highlight the importance of a multi-sectoral holistic approach in addressing anaemia problems. There is need to empower women through engagement and education (Tengco et al., 2008).
5.4.3. Iron Deficiency Anaemia in non-pregnant women
Iron deficiency anaemia had an overall (National) prevalence of 14.0 percent. Prevalence varied between women residing in the rural and urban areas with those in urban showing higher (15.3 percent) prevalence compared to those in rural (13.2 percent) although these differences were not statistically significant. Educational levels
were noted to be significant determinants in the prevalence of iron deficiency, with those women without education showing a high (33.3 percent) prevalence of iron deficiency anaemia compared to those with college/university levels of education (2.8 percent). The trend of differences in prevalence of iron deficiency anaemia is also reflected in the different wealth quintiles where the lowest wealth quintile had the highest prevalence (20.8 percent) while the fourth highest wealth quintile had the lowest prevalence (10.8 percent). These differences however were not statistically significant.
5.5. Anaemia, Iron Deficiency and Iron Deficiency Anaemia in Pregnant Women (15-49 years)
In the KNMS 2011, haemoglobin cut-offs of less than 11.0 g/dL were used to diagnose anaemia in pregnant women. Ferritin cut-offs of less than 15.0µg/L was used in diagnosing iron deficiency (ID), while the combination of haemoglobin and ferritin cut-off values was used to compute iron deficiency anaemia (IDA).

27
The Kenya National Micronutrient Survey 2011
Table 5. 6: Anaemia, iron deficiency, and iron deficiency anaemia among pregnant women (15–49 years) in relation to selected demographic and economic characteristics
Characteristic n Anaemia, weighted %
n ID, weighted % n IDA, weighted %
Age in years
15 – 19 17 41.2 19 31.6 18 27.8
20 – 49 86 41.9 92 37.0 86 25.6
Residence
Rural 61 50.8 68 45.6 60 36.7
Urban 44 29.5 43 20.9 44 11.4
Level of Education
Preschool/None 23 65.2 22 54.5 22 45.5
Primary 59 33.9 65 32.3 59 16.9
Post primary/ Vocational 16 56.3 15 40.0 15 40.0
College/ University 7 0.0 8 0.0 7 0.0
Wealth Quintile
Lowest 23 56.5 26 42.3 23 34.8
Second 28 53.6 30 46.7 28 39.3
Middle 17 35.3 20 45.0 17 23.5
Fourth 16 18.8 17 17.6 16 12.5
Highest 20 35.0 20 20.0 20 5.0
TOTAL 104 41.6 111 36.1 104 26.0
anaemia were highest in those in the lowest wealth quintile (56.5 percent) and lowest among women in the fourth wealth quintile (18.8), although this difference is not statistically significant.
In relation to levels of education, anaemia was highest (56.2 percent) among those that never attended school. Those with post primary/vocational level of education also registered higher prevalence of anaemia (56.3 percent) than those with primary level of education (33.9 percent). There were no cases of anaemia in those with college/university level of education. This again highlights the need for a holistic approach in addressing the social determinants of health ranging from interlocution between the society’s socioeconomic, cultural, and environmental policies to the creation of educational programs to change personal habits (Cotta et al., 2011).
5.5.1. Anaemia in pregnant women
Haemoglobin concentrations change dramatically during pregnancy to accommodate the increasing maternal blood volume and the iron needs of the foetus (WHO, 2011). Maternal anaemia is associated with a higher risk for low birth weight, premature birth, perinatal and neonatal death, as well as inadequate iron stores for the newborn.
The overall prevalence of anaemia (National) in pregnant women was 41.6 percent (Table 5-6) compared with global and African prevalence of 41.8 percent and 57.1 percent respectively. This was a decrease from 55.1 percent reported in 1999 national micronutrient survey. These prevalence were noted to be significantly higher in rural (50.8 percent) than urban areas (29.5 percent). Further, within the wealth quintile categories, prevalence of

28
The Kenya National Micronutrient Survey 2011
5.5.2. Iron Deficiency in pregnant women
Overall (National) prevalence of iron deficiency among pregnant women was 36.1 percent. However, in interpreting these results, it is important to note that serum ferritin is of limited use in diagnosing iron deficiency during pregnancy, as concentrations fall during late pregnancy, even when bone marrow iron is present (WHO, 2011).
Prevalence of iron deficiency differed significantly in distribution between rural (45.6 percent) and urban residents (20.9 percent). Similarly, significant variability in prevalence of iron deficiency was registered in the different levels of education. Among women who had no education, the prevalence was highest (54.5 percent) and lowest (32.3 percent) in those who had primary education. There were no cases of iron deficiency in those with college/ university level of education. There were differences in prevalence of iron deficiency according to wealth quintiles with the highest prevalence noted in second wealth quintile (46.7 percent) and the lowest prevalence noted in the fourth wealth quintiles (17.6 percent). However, this difference was not statistically significant.
5.5.3. Iron Deficiency Anaemia in pregnant women
The overall (National) prevalence of iron deficiency anaemia was 26.0 percent and like iron deficiency, there was a significant variability
between rural and urban women dwellers. Among rural women, the prevalence was high (36.7 percent) compared to that of urban women (11.4 percent). High prevalence of iron deficiency anaemia was seen in women who had never attended school (45.5 percent) and those with secondary school and vocational training (40.0 percent) (Table 5-6). Those with primary level of education registered a low prevalence of IDA (16.9 percent). There were no cases of IDA in pregnant women with college/university education. There was a significant difference in distribution of IDA across the wealth quintiles. Women who belonged to the second lowest wealth quintiles had high prevalence (39.3 percent) compared to those in the highest wealth quintiles (5.0 percent). There was a significantly different distribution of IDA across the wealth quintiles.
5.6. Anaemia, Iron Deficiency and Iron Deficiency Anaemia in Men (15-54 years)
In the KNMS 2011, haemoglobin cut-offs of less than 13 g/dL were used to diagnose anaemia in men. Ferritin cut-offs of less than 15.0µg/L was used in diagnosing iron deficiency (ID), while the combination of haemoglobin and ferritin cut-off values was used to compute iron deficiency anaemia (IDA).

29
The Kenya National Micronutrient Survey 2011
Table 5. 7: Anaemia, iron deficiency, and iron deficiency anaemia among men (15– 54 years) in relation to selected demographic and economic characteristics
Characteristic n Anaemia% N ID% N IDA%
Residence
Rural 144 11.8 148 4.7 144 3.5
Urban 96 5.2 99 2.0 98 2.0
Level of education
None/pre school 9 0.0 9 22.2 8 0
Primary 114 9.6 117 3.4 113 2.7
Secondary/post primary/vocational 103 9.7 107 3.7 106 3.8
Tertiary and above 15 13.3 15 0 15 0
Wealth Quintile
Lowest 38 15.8 39 5.1 39 5.1
Second 65 12.3 67 7.5 64 4.7
Middle 36 8.3 37 0 37 0
Fourth 56 7.1 58 3.4 56 3.6
Highest 45 2.2 47 0 47 0
Total 240 9.2 247 3.6 243 2.9
5.6.1. Anaemia in men
The overall (National) prevalence of anaemia among men was 9.3 percent (Table 5-7 above) compared to global prevalence of 12.7 percent (WHO 2008). This is a reduction from the 1999 national survey that had also noted a significant lower burden of anaemia (20 percent) in older children, adult men and the elderly (Mwaniki et al., 1999). Higher prevalence was observed in rural males than their urban counterparts (11.8 percent and 5.2 percent respectively) though not significantly different.
With respect to the levels of education, no anaemia cases were reported in men with no education. Highest prevalence (13.3 percent) of anaemia was reported in men with tertiary/university level of education. Those with primary and secondary level of education had relatively equal prevalence of anaemia (9.6 percent and 9.7 percent respectively). These differences, however, were not statistically significant. Prevalence also differed among the male in different wealth quintiles such that the men in the lowest wealth
quintile had the highest prevalence (15.8 percent) while those in the highest wealth quintile had the lowest prevalence (2.2 percent). Again these differences were not statistically significant.
5.6.2. Iron Deficiency in men
National prevalence of iron deficiency in men was 3.6 percent compared to prevalence of 4.9 percent reported in 1999 national micronutrient survey. The low prevalence can be attributed to physiological changes that accompany growth. Physiologically, beginning in adolescence, males have higher ferritin values than females, a trend that persists into late adulthood. Ferritin values among men peak between 30–39 years of age and then tend to remain constant until about 70 years of age (WHO, 2011). Although the distribution was variable between rural and urban male residents where the prevalence were higher among rural than urban (4.7 percent and 2.0 percent respectively), this was shown not to be statistically significant (Table 5-8).
The variability in prevalence was also observed in the various levels of education where those males

30
The Kenya National Micronutrient Survey 2011
with the lowest levels of education had the highest (22.2 percent) prevalence of iron deficiency compared with men with high educational levels (3.4 percent) i.e. secondary and beyond. This difference however was statistically insignificant. This trend of variability in prevalence of iron deficiency was also replicated in the wealth quintiles where those men belonging to the second wealth quintiles had, the highest prevalence (7.5 percent) while those in the middle wealth quintiles had lowest prevalence (0.0 percent).
5.6.3. Iron Deficiency Anaemia in men
The National prevalence of Iron deficiency anaemia was 2.9 percent and was notably variable between residences where those in the rural had higher (3.5 percent) prevalence than those in urban (2.0 percent). Differences in prevalence did not differ significantly by level of education, while the differences observed by wealth quintile were inconsistent with random distribution.
5.7. Factors that contribute to anaemia
Several factors such as iron deficiency, infections and blood disorders are known to contribute to the overall prevalence of anaemia in the population. Parasitic infections such as intestinal helminths can cause anaemia through a combination of blood loss and poor absorption of micronutrients. Taenia solium (pork tapeworm) and T. saginata are the most common types of tapeworms found in the region. Other important tapeworms include the fish tapeworm (Diphllobothrium latum) that is associated with consumption of raw fresh water fish, and the dwarf tapeworm (Hymenolepis nana) that commonly occurs in children. Whereas, tapeworms are associated with little or no symptoms, the fish tapeworm is known to compete with the host for absorption of vitamin B12, whose deficiency may result in pernicious anaemia.
Two species of hookworms are known to infect humans, Anyclostoma duodenale and Necator
americanus, with the latter being the dominant species in the sub Saharan Africa region. Hookworms feed on the blood off the wall of the small intestines, with moderate and heavy hookworm infection giving rise to intestinal inflammation and progressive iron/protein-deficiency anaemia (Smith and Brooker, 2010). On the other hand, Schistosoma mansoni eggs, which are highly immunogenic, lead to the development of anaemia of inflammation due to the sustained immune response of the host (Butler et al., 2012).
In this survey, stool samples were collected from Pre-School Children, School Age Children, Pregnant Women and Non-pregnant Women participants and examined for the presence of tapeworms, hookworms and S. mansoni. Besides helminths, other parasitic infections with widespread prevalence such as malaria can also contribute greatly to anaemia development in the host. In this case, malarial anaemia is due to clearance of uninfected cells by the spleen and poor generation of new red blood cells (Kai and Roberts, 2008).
Hereditary blood disorders, also known as heamoglobinopathies, constitute an important cause of anaemia due to their intrinsic nature. Sickle cell (SS) and thalassaemias are the two key heamoglobinopathies of importance in the region. Sickle Cell anaemia is a hereditary disorder of the blood characterized by mutation in the beta globin gene located on chromosome 11 and affects up to 3% of births in some parts of the continent and up to 85% of the global population with sickle cell disease is in Africa. The survival rate of children with SS is known to decrease with age (Barclay GP 1971), with high levels of early life mortality among children born with Sickle cell disease in this region (Grosse, S.D 2009, McAuley et al., 2010, Tshilolo L et al., 2008, Christianson AL, et al 2006). On the other hand, the thalassaemia is a group of genetic disorders characterised by reduced globulin units of haemoglobin as a result of underproduction of normal globin proteins (often through mutations in regulatory genes) that forms haemoglobin and do not cause fatalities (WHO 2008).
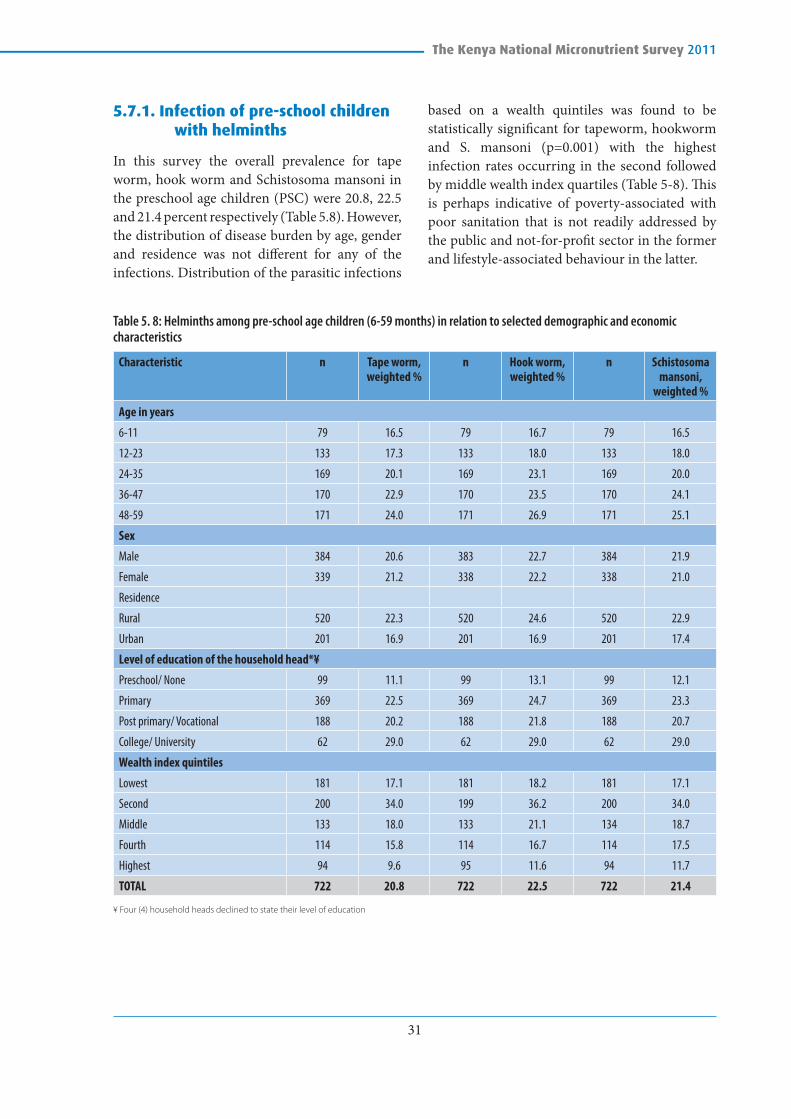
31
The Kenya National Micronutrient Survey 2011
5.7.1. Infection of pre-school children with helminths
In this survey the overall prevalence for tape worm, hook worm and Schistosoma mansoni in the preschool age children (PSC) were 20.8, 22.5 and 21.4 percent respectively (Table 5.8). However, the distribution of disease burden by age, gender and residence was not different for any of the infections. Distribution of the parasitic infections
based on a wealth quintiles was found to be statistically significant for tapeworm, hookworm and S. mansoni (p=0.001) with the highest infection rates occurring in the second followed by middle wealth index quartiles (Table 5-8). This is perhaps indicative of poverty-associated with poor sanitation that is not readily addressed by the public and not-for-profit sector in the former and lifestyle-associated behaviour in the latter.
Table 5. 8: Helminths among pre-school age children (6-59 months) in relation to selected demographic and economic characteristics
Characteristic n Tape worm, weighted %
n Hook worm, weighted %
n Schistosoma mansoni,
weighted %
Age in years
6-11 79 16.5 79 16.7 79 16.5
12-23 133 17.3 133 18.0 133 18.0
24-35 169 20.1 169 23.1 169 20.0
36-47 170 22.9 170 23.5 170 24.1
48-59 171 24.0 171 26.9 171 25.1
Sex
Male 384 20.6 383 22.7 384 21.9
Female 339 21.2 338 22.2 338 21.0
Residence
Rural 520 22.3 520 24.6 520 22.9
Urban 201 16.9 201 16.9 201 17.4
Level of education of the household head*¥
Preschool/ None 99 11.1 99 13.1 99 12.1
Primary 369 22.5 369 24.7 369 23.3
Post primary/ Vocational 188 20.2 188 21.8 188 20.7
College/ University 62 29.0 62 29.0 62 29.0
Wealth index quintiles
Lowest 181 17.1 181 18.2 181 17.1
Second 200 34.0 199 36.2 200 34.0
Middle 133 18.0 133 21.1 134 18.7
Fourth 114 15.8 114 16.7 114 17.5
Highest 94 9.6 95 11.6 94 11.7
TOTAL 722 20.8 722 22.5 722 21.4
¥ Four (4) household heads declined to state their level of education

32
The Kenya National Micronutrient Survey 2011
5.7.2. Helminths in relation to anaemia in preschool children
As indicated before, parasitic infections have been found to be associated with presence of anaemia. In this study, the prevalence of anaemia, was higher in children who were free from helminth infection. This relationship is not as expected though the same has been noted in other studies. A study done in Zanzibar by Kung’u et al, in 2009 found infected children had higher haemoglobin compared with uninfected children. There was no significant difference between the preschool children with anaemia and parasitic infection including tape worm, hookworm and Schistosoma mansoni.
Table 5. 9: Anaemia among pre-school age children (6-59 months) in relation to infection with helminths
n Anaemia, unweighted %
Tape worms
Present 105 22.9
Absent 415 28.0
Hook worms
Present 112 23.2
Absent 408 27.9
Schistosoma mansoni
Present 105 21.0
Absent 415 28.4
5.7.3. Helminths among school age children
In school aged children (SAC) the disease burden was more elevated and ranged from 24.6 percent in tapeworms, which had the lowest prevalence, to 26.0 percent in S. mansoni that had the highest infection rates (Table 5-10). This can be attributed to the higher reinfection rate of this demographic group owing to poor hygiene and exposure to the environment. Similarly in school age children, the distribution of infection rates by age, gender, and residence were also not statistically significant for all three infections. There was a significant difference in the distribution of infection rates for hookworm and S. mansoni by the level of education (preschool vs. primary and above) respectively. Again, distribution by socioeconomic status was statistically significant for each of the three infections, with the second poorest economic status bearing the largest burden. This highlights the key role sanitation plays in helminths transmission.

33
The Kenya National Micronutrient Survey 2011
Table 5. 10: Helminths among school age children (5-14 years) in relation to selected demographic and economic characteristics
Characteristic n Tape worm, weighted %
n Hook worm, weighted %
n Schistosoma mansoni,
weighted %
Age in years (grouped)
5 - 11 years 572 24.3 572 25.2 572 25.2
12 - 14 years 195 25.6 195 26.2 195 28.7
Sex
Male 363 24.5 363 24.8 363 25.9
Female 404 24.8 404 26.0 404 26.2
Residence
Rural 581 24.4 581 26.0 581 26.7
Urban 186 25.3 186 23.7 186 24.2
Level of education
None/Preschool 93 17.2 93 17.2 93 15.1
Primary 444 24.3 444 26.1 444 27.5
Secondary 180 26.1 180 24.4 180 25.0
College/University 41 39.0 41 41.5 41 41.5
Wealth index quintiles
Poorest 197 17.8 197 20.3 197 19.3
Second 215 34.9 215 36.3 215 35.3
Middle 181 19.9 181 19.3 181 19.9
Fourth 112 25.9 112 25.0 112 31.3
Richest 62 22.6 62 22.6 62 24.2
TOTAL 767 24.6 767 25.4 767 26.1
5.7.4. Helminths in relation to Anaemia in School Age Children
As indicated in the Table 5-10 above and in comparison to other study groups such as preschool children and women, the highest burden of worm infestation was reported in the school age children. When these findings were correlated with anaemia, the differences noted were not significant. Helminth infection was higher in anaemic children compared to those free from infection. As noted in the preschool children, the prevalence of ID and IDA was reported to be higher in school age children free from helminth infection (Table 5-11).
Table 5. 11: Anaemia, iron deficiency, and iron deficiency anaemia among school age children (5-14 yrs) in relation to infection with helminths
Characteristic n Anaemia, unweighted %
Tape worms
Present 131 17.6
Absent 476 12.6
Hook worms
Present 136 16.9
Absent 470 12.8
Schistosoma mansoni
Present 144 16.0
Absent 463 13.0

34
The Kenya National Micronutrient Survey 2011
5.7.5. Helminths among non-pregnant women
In non-pregnant women (NPW) helminth infection rates were a little lower, compared to school age children and ranged from 14.1 percent in tapeworm to 17.2 percent in hookworm infections (Table 5-12). Disease burden distribution by age and level of education was not different for all three infections. However, there
was a significant difference in the prevalence of helminth infections across the wealth quintiles with the second quintile having the highest prevalence for all the three infections and the highest quintile having the lowest prevalence for all the three infections. However, the occurrence of hookworm between rural vs urban was different with a higher prevalence in densely populated areas (urban) compared to rural for both.
Table 5. 12: Helminths among non-pregnant women (15-49 years) in relation to selected demographic and socio-economic characteristics
Characteristic n Tape worm, weighted %
n Hook worm, weighted %
n Schistosoma mansoni,
weighted %
Age group (in years)
15 - 19 77 18.2 77 20.8 77 19.5
20 - 49 377 13.3 377 16.4 377 14.1
Residence
Rural 286 15.4 286 20.3 286 16.4
Urban 167 11.4 167 12.0 167 12.6
Level of Education
Preschool/None 39 10.3 39 15.4 39 10.3
Primary 250 14.8 250 18.7 251 15.9
Post primary/ Vocational 145 13.8 145 15.9 145 15.2
College/ University 18 11.1 18 11.1 18 11.1
Wealth index quintiles
Lowest 82 12.2 82 20.5 82 12.2
Second 97 26.8 97 30.9 97 27.8
Middle 99 11.1 99 12.1 99 12.1
Fourth 82 11.0 82 11.0 82 12.2
Highest 93 8.6 93 10.9 93 8.6
TOTAL 453 14.1 453 17.2 453 15.0

35
The Kenya National Micronutrient Survey 2011
5.7.6. Helminths in relation to anaemia in non-pregnant women
Just like in preschool children, there was no significant relationship between anaemia and parasitic infestation in non-pregnant women (Table 5-13).
Table 5. 13: Anaemia, iron deficiency, and iron deficiency anaemia among non-pregnant women (15– 49 years) in relation to infection with helminths
Characteristic n Anaemia, unweighted %
Tape worms
Present 84 14.3
Absent 308 21.8
Hook worms
Present 100 19.0
Absent 292 20.5
Schistosoma mansoni
Present 87 14.9
Absent 305 21.6
5.7.7. Helminths among pregnant women
Due to the low numbers (n=76), evaluation of trends in the frequency of helminth infections amongst pregnant women (PW) could only be undertaken by residence and ranged from 19.7 percent in tapeworm and S. mansoni to 22.4 percent for hookworm (Table 5-14). In this case, differences in rural vs. urban distribution were not statistically significant.
Table 5. 14: Percentage of Helminths in pregnant women by residence
Residence n Tape worm,
weighted %
N Hook worm,
weighted %
n Schistosoma mansoni, weighted
%
Rural 48 22.9 48 27.1 48 25.0
Urban 28 14.3 28 14.3 28 14.3
TOTAL 76 19.7 76 22.4 76 21.1
5.8. Malaria and HIV Infections in the Study Population
Malaria prevalence was generally low during the survey in all age categories (<4 percent) when diagnosed by microscopy, and ≤8 percent using the more sensitive RDTs. This may be attributed to the seasonality of malaria as KMNS was conducted prior to the short rains that is usually associated with a peak in malaria transmission. Rural preschool aged children (PSC) and rural school aged children (SAC) bore the greatest malaria burden (Table 5-16).
HIV prevalence in the study population was low with highest prevalence observed in men at 2.8 percent followed by non-pregnant women at 2.4 percent. Lowest prevalence (0.8 percent) of HIV infection was registered in school age children and pregnant women.
Table 5. 16: HIV and Malaria infection in the study population by residence
Study Group
Residence HIV, Positive Malaria Microscopic, Positive
N Weighted %
n Weighted %
PSC Rural 652 1.5 604 2.6
Urban 252 1.6 244 0.0
Total 904 1.5 848 1.9
SAC Rural 733 0.8 682 3.8
Urban 256 0.8 226 0.9
Total 989 0.8 908 3.1
PW Rural 74 0.0 65 0.0
Urban 45 2.2 44 0.0
Total 119 0.8 109 0.0
NPW Rural 413 2.7 379 0.5
Urban 247 2.0 227 0.0
Total 660 2.4 606 0.3
Men Rural 52 1.9 52 0.0
Urban 19 5.3 19 0.0
Total 71 2.8 71 0.0

36
The Kenya National Micronutrient Survey 2011
5.8.1. Malaria and HIV infection in relation to anaemia in the study population
Malarial anaemia is associated with a shift in iron distribution from functional to storage compartments, and current or recent malarial infection is associated with increased serum concentrations of erythropoietin and transferrin receptor (Verhoef et al., 2002). In Kenya, intense malaria transmission occurs during the rainfall seasons with long rains occurring from March to May and short rains between October and December. The current study was carried out in the low malaria season. The proportion of malaria in PSAC was 2.2 percent and hence the contribution of malaria in this survey may not be to the same as that reported in KMIS 2010, which implied that up to 20 percent of anaemia may have been attributed to malaria.
Proportion of HIV infection in the study population was found to be 2.1%. With low proportions, the contribution of HIV in anaemia was negligible.
5.9. Haemoglobinopathies in the study population
5.9.1. Sickle Cell Disease
The overall (national) prevalence of sickle cell disease was 0.2 percent. This condition, assessed by population sub-groups, showed higher prevalence (0.6 percent) in the Pre-school age children than any other group. In fact, the only other population group in which sickle cell was manifested, after the Pre SAC, was the school age children (0.1 percent). No sickle cell disease was
established in the pregnant and non-pregnant and men. Clearly, the prevalence, generally, decreases with age. In both cases of preschool age and school age children, a higher prevalence of sickle cell was in the rural than the urban residences. The age prevalence variability is consistent with findings in the studies described earlier and other studies described elsewhere in Africa.
Analysis of the current data by regions was limited in validity by the small sample, which was intended for national and not regional representation.
5.9.2. Thalassemia
Thalassaemia (homozygous) had a national prevalence of 4.4 percent, which was higher than that observed for sickle cell. Again, generally, the prevalence was highest (5.3 percent) in the preschool and decreased in the older age groups (except for the non-pregnant women). The rural residents, had a prevalence of 6.2 percent; 1.4 percent and 3.5 percent in preschool, pregnant women and men respectively. Prevalence in rural school age children and non-pregnant women were 4.0 percent and 4.4 percent respectively compared to their counterparts in urban residence with 4.9 percent and 7.8 percent respectively (Table 5-17).
Thalassaemia is prevalent in West Africa but the Mediterranean Islands carry the highest prevalence’s of the trait in the world (16 percent). A very low prevalence has been reported from people in Northern Europe (0.1 percent) and Africa (0.9 percent), with those in North Africa having the highest prevalence. The national prevalence of 4.4 percent is higher than the estimated average in Africa (0.9 percent).

37
The Kenya National Micronutrient Survey 2011
Table 5. 17: Sickle cell and Thalassaemia in the study population by residence
Study Group Residence Sickle cell, SS Thalassaemia, Homo
N Weighted % n Weighted %
PSC Rural 645 0.6 631 6.20
Urban 232 0.4 231 2.60
Total 877 0.6 862 5.20
SAC Rural 678 1.0 653 4.0
Urban 227 0.0 225 4.9
Total 905 1.0 878 4.2
PW Rural 75 0.0 72 1.40
Urban 38 0.0 37 0.00
Total 113 0.0 109 0.90
NPW Rural 377 0.0 364 4.40
Urban 225 0.0 218 7.80
Total 602 0.0 582 5.70
Men Rural 144 0.0 144 3.5
Urban 75 0.0 75 2.7
Total 219 0.0 219 3.2
5.9.3. Haemoglobinopathies in relation to anaemia in preschool children
The number of preschool children found to have sickle cell anaemia was low as indicated in Table 5-18. With the low numbers, the test statistics to test for the relationship between the haemoglobinopathies and anaemia were not valid. Thus, there was no difference detectable in the occurrence of anaemia in preschool children with or without thalasssaemia.
Table 5. 18: Anaemia among pre-school age children (6-59 months) in relation to haemoglobinopathies
Characteristic n Anaemia, unweighted %
Sickle cell
Homo 3 33.3
Hetero/Normal 719 26.6
Thalassaemia
Homo 36 33.3
Hetero/Normal 672 26.2
5.9.4. Haemoglobinopathies in relation to anaemia among school age children
The number of school age children found to have sickle cell anaemia was low. With the low numbers, the test statistics to test for the relationship between the haemoglobinopathies and anaemia were not valid. Thus, there was no difference in occurrence of anaemia in preschool children with or without thalassaemia (Table 5-19).
Table 5. 19: Anaemia among school age children (5-14 years) in relation to haemoglobinopathies
Characteristic n Anaemia, unweighted %
Sickle cell
Homo 1 100
Hetero/Normal 777 17.0
Thalassaemia
Homo 28 32.1
Hetero/Normal 714 16.5

38
The Kenya National Micronutrient Survey 2011
5.9.5. Haemoglobinopathies in relation to anaemia among pregnant women
As is the case in preschool children found to have sickle cell anaemia, there were low numbers of pregnant women with thalassaemia. Due to the low response rate in pregnant women, it was not possible to test for the relationship between the haemoglobinopathies and anaemia in pregnant women.
5.9.6. Haemoglobinopathies in relation to anaemia among non-pregnant women
In KNMS 2011, there was a significance difference in occurrence of anaemia among non-pregnant women with and without thalassaemia (Table 5-20).
Table 5.20: Anaemia among non-pregnant women (15– 49 years) in relation to haemoglobinopathies
Characteristic n Anaemia, unweighted %
Thalassaemia
Homo 23 39.1
Hetero/Normal 486 21.6
5.9.7. Haemoglobinopathies in relation to anaemia among men
In KNMS 2011, there was no difference in occurrence of anaemia among men with or without thalassaemia (Table 5-21).
Table 5. 21: Anaemia among men (15– 64 years) in relation to haemoglobinopathies
Characteristic n Anaemia, unweighted %
Thalassaemia
Homo 5 40
Hetero/Normal 191 9.4
5.10. Nutrient Intake and anaemia in the study population
It is generally assumed that 50 percent of the cases of anaemia are due to iron deficiency. The major cause of iron deficiency in the body is low intake of iron from the diet. A given diet may be low in iron or may contain adequate amounts of iron, which are of low bioavailability. Other nutrients necessary for haematopoiesis may also be deficient. These include folic acid, vitamins A, B12, and C, protein, and copper and other minerals (WHO/UNICEF/ICCIDD, 2001).
5.10.1. Nutrient intake in relation to anaemia, ID and IDA among preschool children
In KNMS 2011, there was a significant difference in the number of preschool children with anaemia, iron deficiency and iron deficiency anaemia in relation to iron intake (Table 5-22). Preschool children with inadequate iron intake had higher prevalence of anaemia, iron deficiency and iron deficiency anaemia compared to those with adequate intake. Inadequate folate intake was also associated with iron deficiency in preschool children. There was a significant difference between children with inadequate and those with adequate folate intake, and presence of iron deficiency.
Table 5. 22: Anaemia among pre-school age children (6-59 months) in relation to adequacy in RDI of macro and micronutrients
Characteristic n Anaemia, unweighted %
Iron*
Inadequate 55 40.0
Adequate 96 22.9
Folate
Inadequate 98 33.7
Adequate 53 20.8
Vitamin B12
Inadequate 126 31.0
Adequate 25 20.0
* EAR=6.9mg/d (age 7-12 months), 3mg/d (age 1-3 years), 4.1mg/d (age 4-8 years);

39
The Kenya National Micronutrient Survey 2011
5.10.2. Nutrient intake in relation to anaemia among pregnant women
The low number of pregnant women in the study population whose data on nutrient intake was available could not allow for the testing of the difference between nutrient intake and occurrence of anaemia.
5.10.3. Nutrient intake in relation to anaemia among non-pregnant women
In relation to iron intake, there was no difference in occurrence of anaemia, iron deficiency and iron deficiency anaemia in non-pregnant women in the study population. The only difference noted was in relation to intake of Vitamin B12 and occurrence of iron deficiency anaemia. There was a significant difference in non-pregnant women with adequate and in-adequate intake of Vitamin
B12 in relation occurrence of iron deficiency anaemia (Table 5-23). There was no difference noted in intake of folate in relation to anaemia, iron deficiency and iron deficiency anaemia in non-pregnant women.
Table 5. 23: Anaemia among non-pregnant women (15– 49 years) in relation to adequacy in RDI of macro and micronutrients
Characteristic n Anaemia, unweighted %
Iron
Inadequate 68 33.8
Adequate 227 22.9
Folate
Inadequate 208 27.9
Adequate 87 19.5
Vitamin B12
Inadequate 255 24.3
Adequate 40 32.5

40
The Kenya National Micronutrient Survey 2011
CHAPTER 6: VITAMIN A DEFICIENCY
vitamin A in blood is associated with RBP and therefore RBP is used as a surrogate measure for retinol content and, thus, Vitamin A status. Retinol was measured in a sub-sample and showed strong correlation with RBP. Since clinical and sub-clinical inflammation lowers retinol concentrations, values for RBP and consequently VAD presented in this chapter have been corrected for inflammation using C-Reactive Protein (CRP) and α1-acid glycoprotein (AGP) to allow for more accurate interpretation of VAD (Erhardtet al., 2004; Gamble et al., 2001).
6.2. Vitamin A Deficiency in Pre-School Children (6-59 months)
The prevalence of vitamin A deficiency corrected for inflammation is presented by two cut off levels i.e. for those persons whose serum retinol levels were <0.7μmol/L and those who had levels ≥0.7 and ≤1.05μmol/L indicative of marginal vitamin A deficiency (Table 6-1). The crude national prevalence of VAD (considering the combined sub-populations studied) was (4.5 percent). Pre-School Age Children had the highest (9.2 percent) prevalence of VAD, followed by pregnant women (5.4 percent). The levels among SAC were almost half (4.7 percent) those reported among PSC.
Amongst all age groups, the overall prevalence of marginal vitamin A deficiency was 24.2 percent. When marginal VAD in men was excluded, national marginal VAD was reported as 23.8 percent.
In pre-school children in the 1999 survey the reported prevalence in severe VAD of 84.4 percent (Mwanikiet al., 1999), regardless of the 1999 report using a lower cut-off point. The cut-off
6.1. Introduction
Vitamin A is an essential fat-soluble vitamin normally stored in the liver. Retinol is the predominant circulating form of vitamin A in the blood. In response to tissue demand, it is released from the liver in a 1:1 ratio with its carrier protein, retinol-binding protein. Serum retinol levels reflect liver vitamin A stores only when they are severely depleted (< 0.7 μmol/g liver) or extremely high (> 1.05 μmol/g liver) (Hixet al. 2006). The distribution of serum retinol values in a population and the prevalence of individuals with serum retinol values below a given cut-off can provide important information on the vitamin A status of a population, and may reflect the severity of vitamin A deficiency as a public health problem especially when the degree of underlying infection or inflammation is taken into account (WHO, 2011). Vitamin A is essential for proper immune function, epithelial growth and repair, bone growth, reproduction, and normal embryonic and foetal development (CDC report, 2012).
Vitamin A deficiency (VAD) is defined as the prevalence of serum retinol values <0.70 μmol/L. Prominent signs of VAD include night blindness, corneal thinning, and conjunctival metaplasia. VAD is considered the main cause of childhood blindness in low-income countries and an important determinant in safe motherhood and in child survival. Vitamin A has been shown to reduce mortality from measles by about 50 percent, mortality from diarrhoea by 40 percent, morbidity from malaria by 30 percent and overall mortality by 23 percent (WHO, 2001).
In KNMS 2011, values presented for VAD are based on levels of retinol-binding protein (RBP) measured using the ELISA technique. Nearly all

41
The Kenya National Micronutrient Survey 2011
points used were, VAD ≤10 µg/dl (≤0.35 μmol/L); and 10-20 µg/dl (0.35 to 0.7μmol/L) for moderate and >20 µg/dl (>0.7 μmol/L) for normal (WHO 1996). However, serum retinol in the 1999 survey was not corrected for inflammation and VAD is therefore likely to have been overestimated, making comparison with the 2011 survey results difficult.
In the 2011 KNMS, VAD is not a problem of severe public health significance in pre-school aged children. However, given the reasonable number of PSC at risk (with marginal VAD proportion of 52.6 percent), these children could easily transit to VAD. The high percentage of SAC at risk of VAD (marginal VAD of 37.6 percent) may also easily transit to severe VAD. The observed proportions are also lower compared to the global estimates of 33.3 percent in pre-schoolers. It is possible therefore to attribute the gains made so far to the various intervention efforts by the MOH including blanket vitamin A supplementation for pre-schoolers, food fortification and dietary diversification.
Table 6. 1: National Prevalence of Vitamin A Deficiency Corrected for inflammation
Study group
N VAD1, % (95% CI)
Marginal VAD2 % (95% CI)
PSC 918 9.2 (7.3, 11.1) 52.6 (49.4, 55.8)
SAC 942 4.7 (3.4, 6.1) 37.6 (34.5, 40.7)
NPW 632 2.0 (0.9, 3.1) 7.8 (5.7, 9.9)
PW 111 5.4 (1.2, 9.6) 21.6 (14.0, 29.3)
Men 257 0.0 (0.0, 0.0) 2.0 (0.3, 3.7)
Total 2898 4.5 (4.0, 7.4) 24.2 (21.3, 27.5)
1 RBP<0.7μmol/L; 2 RBP ≥0.7 μmol/L - ≤1 .0 57 μmol/L
World Health Organization (2011) has derived the classification of vitamin A deficiency using the prevalence of retinol values <0.7μmol/L among children 6-71 months of age to define whether vitamin A deficiency is of public health significance in a population. The extent of public health concern is defined as mild, moderate or severe when the prevalence of low serum retinol (0.70μmol/l or below) is 2-9 percent, 10-19 percent and 20 percent or more respectively.
Residence of the children was one of the factors associated with occurrence of VAD in pre-school aged children (Table 6.2). Children in rural establishments were significantly less vitamin A deficient than their urban counterparts (proportions of 8.1 percent and 12.1 percent respectively). On gender differences, the male children were shown to have a higher (10.3 percent) proportion of VAD than female children (7.7 percent).
Importantly, wealth quintiles were not important determinants of VAD in pre-school aged children, compared to iron deficiency indicators. The use and interpretation of the current VAD prevalence rates has to take cognizant of the potential effect of ecological and demographic factors known to be associated with VAD such as mortality rates, full immunization coverage, mean dietary intake, prevalence of diarrhoea, nutritional status, water and sanitation among others (WHO, 2011; WHO, 2009). The government of Kenya and partners has initiated various programs which may explain VAD proportions being lower in Kenya and more so in rural areas.

42
The Kenya National Micronutrient Survey 2011
Table 6. 2: Distribution of VAD in pre-school children (PSC) by demographic characteristics
Variable N VAD1 % Marginal VAD2 %
Age in years (grouped)
6-11 months 79 3.8 44.3
12-23 months 134 12.7 47.0
24-35 months 219 9.1 54.8
36-47 months 249 9.2 53.8
48-59 months 236 9.7 54.2
Sex
Male 503 10.3 54.1
Female 416 7.7 50.7
Residence
Rural 663 8.1 51.4
Urban 256 12.1 55.5
Level of education
Preschool/None 162 11.1 48.8
Primary 446 9.4 53.6
Post primary/ Vocational
221 4.5 54.8
College/ University 85 16.5 49.4
Not stated 5 0.0 40.0
Wealth index quintiles
Lowest 262 9.5 46.6
Second 241 9.1 53.5
Middle 150 6.7 54.7
Fourth 136 8.1 62.5
Highest 127 11.8 50.4
Total 918 9.2 52.6
1 RBP<0.70 μmol/L; 2 RBP ≥0.70 - <1.05 μmol/L
6.3. Vitamin A deficiency in School Age Children (5-14 years)
The prevalence of VAD and marginal VAD among school-aged children (SAC) was 3.6 percent and 33.9 percent respectively. As observed in PSC, one third of children in this age group are at risk of VAD (Table 6.3). There wasn’t much difference in VAD between SAC living in rural (5.0 percent)
and urban (3.6 percent) areas. The opposite was found to be the case with those of PSC, which showed lower levels for those residing in urban areas when compared with the rural residence. On gender differences, the male children were shown to have a lower (3.8 percent) proportion of VAD than female children (5.4 percent).
There is therefore need for both short-term and long-term targeted intervention efforts to fully combat VAD bearing in mind the diversity in culture, geographical and socio-economic status (Stuijvenberget al., 2011). It is important to note reasons for reversal in VAD proportions in PSC and SAC based on area of residence to develop useful VAD mitigation strategies.
Table 6. 3: Distribution of VAD in school age children (SAC) by demographics
Characteristic N 1VAD % 2Marginal VAD %
Age in years
5-11 296 5.6 40.7
12-14 58 1.6 27.0
Total 354 3.6 33.9
Residence
Rural 695 5.0 36.4
Urban 248 3.6 40.7
Sex
Male 167 3.8 37.7
Female 187 5.4 37.5
Level of education
Preschool/None 70 8.8 35.0
Primary 224 5.4 40.9
Post primary/ Secondary 82 1.2 32.2
College/ University 61 4.6 42.9
Wealth Quintile
Lowest 107 10.4 43.0
Second 99 1.9 38.4
Middle 68 4.9 33.5
Fourth 52 1.5 38.0
Highest 27 0.0 29.0
1 RBP<0.70 μmol/L; 2 RBP ≥0.70 - <1.05 μmol/L

43
The Kenya National Micronutrient Survey 2011
Supplementation, promotion of vitamin A-rich diets and food fortification are some of the nutritional “well-being weapons” recommended by WHO. Usually, VAD develops in an environment of ecological, social and economic deprivation, in which a chronically deficient dietary intake of vitamin A coexists with infections, and frequent infections can lower intake through depressed appetite and absorption, and deplete body stores of vitamin A through excessive metabolism and excretion (WHO, 2009).
Vitamin A is fat soluble and SAC living in urban areas are exposed to food with fats/oils compared to their counterparts in the rural areas, which might be one of the explanations for the reversal in VAD between rural and urban areas.However, this explanation does not apply when it comes to PSC, whose VAD was higher in urban than rural areas(12.1 percent and 8.1 percent respectively). The government has been implementing a Vitamin A supplementation program with higher coverage in rural than in urban areas. This may explain the lower levels of VAD among PSC in rural areas. This may also explain why in PSC, level of education and wealth quantiles did not have an effect on the VAD levels, unlike in SAC where the higher the level of education and wealth quantile, the lover the VAD levels. Analysis of VAD by wealth quintiles showed a progressive decreasing trend, with people in the lowest category exhibiting the highest levels of both VAD and marginal VAD. The median age for children with VAD was 7 years, significantly lower. Child age alters the relationship between plasma RBP and retinol and may explain the decline in VAD with age. This may explain why SAC aged 5 to 12 years had a significantly higher VAD and marginal VAD than those aged 12 to 14 years.
6.4. Vitamin A deficiency in pregnant and non-pregnant women
In the adult populations, the highest VAD proportion (5.4 percent) was observed among pregnant women and reduced significantly in the non-pregnant women (1.1 percent) as indicated in table 6.1. Vitamin A requirements increases during pregnancy. The proportion of marginal VAD in pregnant and non-pregnant women was 21.6 and 8.1 percent respectively. Data for pregnant women was not segregated by socio-economic and demographic characteristics due to low response rate. The data for non-pregnant women is presented in Table 6.4.
The observed proportion in pregnant women was lower than the 15.3 percent global estimates (WHO, 2009). Physiologically, there is increased utilization of retinol in pregnancy (in meeting foetal demands), due to the physiologic adaptation of vitamin A metabolism that occurs during pregnancy related to the delivery of vitamin A to the foetus via the placenta, that results in changes in the saturation rate of RBP (Engle-Stone et al., 2011; Sapin et al., 2000). Retinol is required for normal foetal development and successful gestation. It is worth noting that haemodilution associated with later stages of pregnancy may alter interpretation of serum retinol values in pregnant women, and that other micronutrient deficiencies such as zinc required for the synthesis of RBP can cause a functional vitamin A deficiency.
When VAD was considered against the residence of the pregnant women, those residing in urban areas had a much higher (14.0 percent) deficiency unlike the rural counterparts who have no VAD deficiency (0.0 percent). Marginal vitamin A deficiency was higher in urban areas (30.2 percent) compared to 16.2 percent in pregnant women

44
The Kenya National Micronutrient Survey 2011
residing in rural areas. This trend is similar to the one portrayed in PSC,, where VAD is higher in urban areas compared to rural areas.
Among non-pregnant women, VAD was higher (3.3 percent) in the age group of 15-19 years compared to 0.6 percent in the older women aged 20-49 years. On education levels and residence, women with primary school and residing in rural areas presented with highest levels of severe VAD (2.0. percent and 1.8 percent respectively. Wealth quintile did not have a significant impact on VAD among non-pregnant women.
Table 6. 4: Distribution of VAD in non-pregnant women by demographic characteristics
Characteristic n 1VAD, % 2Marginal VAD, %
Age in years (grouped)
15-19 122 3.3 7.4
20-49 510 0.6 8.2
Level of education
Preschool/None 68 0.0 7.4
Primary 345 2.0 7.0
Post primary/ Vocational 178 0.0 10.7
College/ University 41 0.0 7.3
Residence
Rural 397 1.8 8.1
Urban 236 0.4 8.1
Wealth quintiles
Lowest 121 0.0 4.1
Second 129 3.1 11.6
Middle 123 0.8 14.6
Fourth 111 1.8 9.0
Highest 148 0.0 2.0
Total 632 1.1 8.1
1 RBP<0.70 µmol/L, 2 RBP≥0.70 - ≤1.05 µmol/L
6.5. Vitamin A Deficiency in Men
The men assessed only presented a marginal vitamin A deficiency of 2.0 percent without any prevalence of Vitamin A deficiency. Area of residence did not have any significance difference in men’s VAD status. Not much has been reported on VAD in men in the Kenyan population. However, a study by Mathenge et al., (2007) found vitamin A deficiency as a significant public health problem among Kenyan male prisoners, indicating that it is important to track VAD prevalence among all vulnerable groups and not just young children and pregnant or lactating women.
6.6. Relating Dietary and biochemical data
Nutritional intake is likely to be directly correlated with the biochemical presence of vitamins in the body. We looked at this relationship between dietary and biochemical data to estimate specifically the prevalence of dietary vitamin A inadequacy and prevalence of vitamin A deficiency with the assumption that estimated dietary vitamin A requirements are set at levels intended to prevent an insufficient supply of vitamin A to tissues, and if not met will contribute to vitamin A deficiency. Information regarding biochemical indicators and use of 24 hour recall for PSC and non-pregnant women is provided in Table 6.5. However, the limited number limits interpretation.

45
The Kenya National Micronutrient Survey 2011
Table 6. 5: Levels of Vitamin A deficiency among pre-school children (6-59 months) and non-pregnant women (15-49 years) in relation to adequacy in RDI of micronutrients
Micronutrient derived from 24 hour recall n 1VAD % 2Marginal VAD %
n 1VAD % 2Marginal VAD %
PSC Non-pregnantwomen
Adequacy
Inadequate 112 8.0 53.6 162 0.6 7.4
Adequate 56 7.1 55.4 154 0.0 9.7
1 RBP <0.70 µmol/L; 2 RBP ≥0.70 - <1.05 µmol/L

46
The Kenya National Micronutrient Survey 2011
CHAPTER SEVEN: IODINE
7.1. Introduction
Iodine is found in the environment all over the world, predominantly as iodide. However, its geographical distribution is quite uneven. Quantitatively, most iodide is found in the oceans because of flooding, glaciation and erosion, which have led to a washout of the element from many surface soils. On average, ocean waters contain about 50µg/L of iodide. There is a continuous ecological cycle in which iodide from the oceans evaporates into the atmosphere (air contains about 0.7µg/m3) and is brought back to replenish the inland areas by rain (rainwater contains 0.3-0.7µg/L). This cycle is slow, however, and the soils, groundwater and foods grown in many regions are low or lacking in iodine. Plant crops grown in iodine-deficient soils can have iodide content as low as 10µg/kg, compared to plants from iodine-sufficient soils which can contain as much as 1mg/kg, a 100-fold difference. In contrast, many foods of marine origin, especially shellfish, contain high iodine contents because of the ability to assemble iodide from their prey and seawater Koutras et al 1980).
Iodine from the diet is required by the human body for the synthesis of thyroid hormone in the thyroid gland. Other dietary substances, named goitrogens, can worsen the effect of an iodine-deficient diet as they interfere with iodine absorption or with the take-up and conversion to thyroid hormone in the thyroid gland. Cruciferous vegetables such as cabbage, kale and rapeseed, contain glucosinolates, which are compounds that compete with iodide for uptake in the thyroid grand.
A major function of thyroid hormone is in regulating cell growth and differentiation in the unborn and newborn early life. Also the metabolism of proteins, carbohydrates and lipids
during all life stages depends on thyroid hormone. Due to the rapid growth and differentiation of the brain cells in the fetus and during early infancy, the most damaging effects of iodine deficiency concerns the developing brain of the fetus and young children, depressing the children’s learning ability and handicapping their prospects for productive earnings in later life. Even mild iodine deficiency may be causally involved in cognitive impairment of children (Zimmermann et al., 2008). In 2011, the largest proportions of children with insufficient iodine intake were in Europe (43.9 percent) and Africa (39.3 percent), while the Americas and Western Pacific had the smallest proportions at risk at 13.7 percent and 18.6 percent, respectively. It was estimated that about 1.88 billion people globally had insufficient habitual iodine intakes from the diet to meet dietary recommendations, which is a 6.4 percent reduction since 2007, but still more than one-quarter of the world’s total population (Anderson et al., 2012).
7.2. Iodine Nutrition in Kenya
A national nutrition survey carried out between 1962 and 1964 reported very high goiter rates of 15-72 percent, with the highest rates goiter burden in the highlands of the Rift Valley, Nyanza and Western provinces Gitau et al., 1988). Salt iodization was started in 1970 as a preventive measure for goiter on voluntary basis at 20mg/kg (iodine parts per million), based on an assumption that the average salt intake in Kenya was 10g per person per day. In 1973, the amount of iodine to be added to iodized salt was increased to 30mg/kg after realizing that the daily salt intake was less, i.e., about 5g on average. Subsequent studies showed an increase in urinary iodine concentrations but this was not accompanied by a corresponding decrease in goiter prevalence.

47
The Kenya National Micronutrient Survey 2011
Gitau carried out a comparative study in 1984 to assess the effectiveness of the (increased) salt iodization level on goitre and urinary iodine concentration in localities of Kiambu, Kericho, Nairobi and Mombasa. The goiter prevalence was highest in Kericho at 55%, followed by Kiambu at 21%. Nairobi had a prevalence of 20% while in Mombasa no goiter was observed.
In 2010, upon suggestions of high iodine nutrition indicators in a 2004 National Survey, Kenya enacted a revised standard for the iodization of salt at production, a reduction from 100 to 30-50mg iodine/kg salt, while compelling the use of potassium iodate as fortificant. Therefore, one of the underlying purposes of the 2011 micronutrient survey was to collect indicator data from selected target groups to assess that the newly adopted standard provides adequate iodine supplies and status in the population.
7.3. Methods
KNMS field workers collected spot urine samples of school-age children (SAC) and non-pregnant women of reproductive age (NPW) and, in addition, salt was sampled in the households of the enrolled participants. The urine samples were analyzed in CPHR for the iodine (UIC) as well as the sodium concentration (UNaC), and the consumer salt samples were measured in NPHL for iodine content (SI). The laboratories of both institutes applied recommended quality control procedures to limit analytical variation (UIC and SI were measured with less than 5% total analytical error). The UIC and SI data were verified for accuracy by a 3-way inter-laboratory comparison with two accredited iodine laboratories in Tanzania and Kazakhstan. The iodine laboratory at CPHR received a certificate of successful performance during the period of processing of the KNMS urine samples from the external laboratory quality service program EQUIP, managed by CDC, Atlanta, USA.
Estimating the Sources of Iodine Intake
In a salt producer’s value chain, iodized salt is either directly sold to the consumer markets (consumer salt fraction) or sold to customers and traders who, in turn, supply the processing industry (food industry salt fraction). These two key salt supply channels come together in the customary diets and augment the iodine already present in native foods (native iodine fraction), in combination leading toward a total iodine intake that intends to satisfy the biological iodine requirements throughout all the segments of a population.
The KNMS protocol included the intent to estimate the supply sources of iodine in the common diet. The KNMS became the first large-scale micronutrient survey worldwide that added sodium measurements (the main discerning element of salt intake) in the same urine samples collected for iodine status assessment. By combining the two urinary parameters together with the SI content in salt from the respondent’s households, the survey intended to enable a separation of the population’s dietary iodine intake into its constituent iodine supply sources from native diet, food salt and consumer salt.
7.4. Statistical Analysis
The two indicators measured in urine samples were the UIC (expressed in µg iodine/L) and the UNaC (mmol sodium/L). SI (mg iodine/kg salt) was measured in salt samples collected from the enrolled participants’ households. All data analyses were weighted to account for non-participation due to refusal, absence from the household and missing data. The UIC findings are reported using medians and interquartile ranges (IQR), whereas for UNaC and SI the means and their 95% confidence intervals were obtained. The iodine indicators were categorized across different levels of selected co-factors age, gender, residence, province and wealth index, as applicable. Pearson’s Chi-Square test was used to express the strength of association.

48
The Kenya National Micronutrient Survey 2011
7.5. Urinary Iodine Concentration (UIC)
According to the World Health Organization, the median UIC is the main indicator to be used to assess the iodine nutrition situation of a population (WHO, 2013). Since it is overly cumbersome to accurately collect 24-h urines under field conditions, UIC was measured in spot urine specimens from a representative sample of each target group, and expressed as group median in µg/L. There are different hydration levels and diurnal variations in UIC between individuals, but these even out in a large number of samples, making the median UIC in spot
samples from groups of individuals correlate with the iodine intake findings from 24-h urine collections(Zimmermann et al 2009).
The UIC values, presented in table 7-1a and 7-1b, were categorized in line with current Iodine Global Network (IGN) recommendations. Table 7-1a shows the distribution parameters of UIC levels among the school age children of Kenya. The median UIC (µg/L) for all SAC was 208µg/L, which is in the range considered adequate by international agreement. Gender, residence, province and household wealth were significant factors influencing the SAC distributions of UIC. The median UIC values in boys (231µg/L) and girls (199µg/L) differed significantly but
Table 7. 1a: Urinary Iodine Concentration in school age children, KNMS 2011
Characteristic N Median µg/L IQR*
0 – 99 µg/l 100-299 µg/l 300-499 µg/l ≥500 µg/l
(%) (%) (%) (%)
Age
5 - 8 years 431 200 109 310 21 51 18 10
9 - 14 years 518 217 107 348 23 45 18 15
Gender
Male 478 231 118 368 19 45 21 15
Female 473 191 99 294 25 50 14 11
Residence
Rural 699 188 99 327 25 46 15 14
Urban 252 231 153 341 14 51 25 10
Province
Nairobi 49 209 169 313 6 55 38 2
Central 97 244 130 348 18 40 28 13
Coast 78 294 170 481 8 46 23 23
Eastern 139 240 178 457 9 50 19 22
N/East 77 846 303 1,157 3 19 13 65
Nyanza 138 122 88 222 30 61 8 1
Rift Valley 258 151 81 275 36 46 16 2
Western 115 164 72 245 32 53 12 3
HH wealth index
First 241 221 106 349 23 45 16 16
Second 270 143 83 243 32 48 14 6
Middle 206 231 121 397 20 45 14 20
Fourth 135 224 155 347 10 61 22 7
Fifth 99 294 192 409 11 39 33 16
All SAC 951 208 108 333 22.1 47.5 17.6 12.8
* Interquartile Range; P25 to P75

49
The Kenya National Micronutrient Survey 2011
were both within the range of 100-299µg/L, considered adequate. Similarly, the median UIC values of children in the rural (188µg/L) and urban areas (231µg/L) were different and within the boundaries of adequate iodine nutrition. The UIC findings in children across provinces vary substantially with very high values in North-Eastern province and the lowest, though sufficient, values in Nyanza, Rift Valley and Western provinces. SAC’s UIC values also differed significantly among household wealth categories, mainly due to lower UIC values (143µg/L) in the SAC from poorer households (HHW=2) as compared to the wealthiest households (median UIC 294µg/L). Overall, UIC values below 100µg/L were found in 22.1 percent of SAC, while 30.4 percent had UICs of 300µg/L or more. Approx. half of the UIC values of the SAC in Kenya were within the boundaries of optimal iodine nutrition (100-299µg/L) recommended by IGN.
The overall median UIC in the non-pregnant women of Kenya was 168µg/L, which is in the adequate range agreed internationally. Classification of the UIC values by age group did not generate a significant difference between the NPW of <20 and ≥20 years. The UICs of NPW separated by residence, though statistically different, indicate adequate iodine nutrition status in both the rural (163µg/L) and urban (180µg/L) NPW groups. Similar as in SAC, the classification of UIC values in NPW by household wealth index showed significant differences due to lower UICs (132µg/L) in women from poorer households (HHW=2) as compared the wealthiest households (202µg/L). And again, similar as in SAC, the variation of UIC values in NPW differed significantly by province, with highest UICs in North-Eastern Province and lowest in Western, Rift Valley and Nyanza provinces.
Table7-1b: Urinary Iodine Concentration in non-pregnant women, KNMS 2011.
Characteristic n Median µg/L IQR*
0 – 99 µg/l
100-299 µg/l
300-499 µg/l
≥500 µg/l
(%) (%) (%) (%)Age<20 years 119 168 104 287 20 61 13 6>20 years 504 164 97 305 27 47 17 9ResidenceRural 389 163 91 279 30 47 16 8Urban 234 180 125 321 18 55 17 10ProvinceNairobi 65 252 171 402 9 47 30 14Central 76 222 117 367 15 51 19 16Coast 54 220 133 368 10 51 18 21Eastern 91 203 111 310 21 49 21 9N/East 30 372 231 609 0 36 37 27Nyanza 85 148 86 244 32 51 13 4Rift Valley 159 138 80 165 36 56 7 1Western 101 98 64 172 52 41 7 0HH wealth indexFirst 114 163 98 384 27 39 22 12Second 130 132 67 226 42 46 9 4Middle 120 145 98 225 25 58 13 5Fourth 111 155 105 297 23 52 16 8Fifth 148 202 134 359 12 53 22 13All SAC 623 168 98 299 25.6 49.7 16.2 8.6
* Interquartile Range, P25 to P75

50
The Kenya National Micronutrient Survey 2011
Nearly half of the UIC values in NPW fell in-between the boundaries of optimal iodine nutrition (UIC 100-299µg/L) as per IGN recommendation.
7.6. Urinary Sodium Concentration (UNaC)
Like many countries in Africa and in other parts of the world, Kenya’s USI strategy is devised to meet the iodine requirements of its population through the iodization of all the salt intended for human consumption, meaning that the iodine status of Kenya’s population is directly linked with the consumption of salt, the main dietary supply “vehicle” to ensure iodine intake. In the KNMS, the urinary sodium concentration (UNaC) was measured in spot urine samples in complement to the urinary iodine measurements. Combined analysis of the UIC and the UNaC in a large cohort allows a more refined examination of the iodine nutritional status by estimating the contribution made by the consumption of iodized salt in the population’s iodine intake (Haldiman et al., 2015). As suggested previously (McLean RM et al., 2014), the use in large surveys of a single spot urine collection has many potential advantages, as it is able to be collected in a single encounter, thereby bypassing the need for multiple visits (Hawkes C and Webster J, 2012) .
The UNaC distribution shares in SAC and NPW are reported in accordance with the nomenclature recommended by the World Hypertension League (WHL) for classification of the salt intake in adults (Campbell NRC et al., 2015).
UNaC findings of the Kenyan SAC and NPW are shown in Tables 7-2a and 7-2b. The mean UNaC in SAC was 192mmol/L; 95% CI: 185-199mmol/L. Significant differences in UNaC values existed between age group, gender, urban/rural residence and household wealth index. SAC aged 9 to 14y had higher mean UNaC (203mmol/L) compared their younger peers (178mmol/L). The mean UNaC was also higher in male children (209mmol/L), children residing in urban areas (221mmol/L) and in the wealthiest households (236mmol/L), each in comparison to their respective counterpart groups.
Almost half of the female (47%) and more than half (63%) of the male SAC had UNaC values >174mmol/L, indicative of very high sodium intake using a classification of the World Hypertension League for adults. Very high UNaC values were also found in older children (61% of UNaC values), as well as children residing in urban areas (61%) and in the wealthiest households (69%). Also the differences in UNaC values of SAC were sizable across Provinces of Kenya; to illustrate, the mean UNaC ranged from 146mmol/L in Western Province to 241mmol/L in Coastal Province, a difference of approx. 50%.

51
The Kenya National Micronutrient Survey 2011
Table7-2a: Urinary Sodium Concentration in school-age children, KNMS 2011.
Category
n
Mean
95% CI
UNaC distribution shares (as per WHL)
Normative <87
High 87-174
Very high 174-261
Extreme ≥261
% % % %
Age
5 to 8y 386 178 167 to 188 22 32 22 24
9 to 14y 477 203 194 to 213 18 21 30 31
Gender
Male 424 209 199 to 219 14 23 28 35
Female 439 176 165 to 186 25 28 26 21
Residence
Rural 635 182 174 to 190 23 25 29 23
Urban 228 221 206 to 235 10 28 21 41
Province
Nairobi 45 224 202 to 245 3 31 26 40
Central 88 194 174 to 214 13 35 23 29
Coast 71 241 210 to 272 15 18 21 46
Eastern 126 226 208 to 244 10 20 32 38
N/Eastern 70 210 182 to 238 19 12 38 31
Nyanza 125 184 168 to 200 17 28 33 21
Rift Valley 233 171 157 to 185 26 30 22 22
Western 104 146 128 to 165 36 25 23 16
HH wealth
Poorest 224 180 167 to 193 19 27 36 17
HHW=2 234 164 150 to 178 32 25 19 25
Middle 189 203 189 to 218 19 21 27 33
HHW=4 125 217 199 to 236 7 35 25 32
Wealthiest 90 236 213 to 260 8 23 25 45
All SAC 863 192.0 184.8 to 199.2 20 26 27 28

52
The Kenya National Micronutrient Survey 2011
Table7-2b: Urinary Sodium Concentration in non-pregnant women, KNMS 2011
Category
n
Mean
95% CI
UNaC distribution shares as per WHLNormative
<87High
87-174Very high 174-261
Extreme ≥261
% % % %AgeUp to 19y 108 218 201 to 236 11 19 35 35≥20y 470 178 169 to 187 19 29 31 21ResidenceRural 361 175 164 to 185 22 30 29 20Urban 218 204 192 to 215 11 24 37 29ProvinceNairobi 61 231 213 to 249 5 8 53 34Central 71 197 177 to 217 7 37 33 23Coast 47 218 187 to 249 16 23 24 36Eastern 84 221 203 to 239 6 18 44 32N/Eastern 28 198 157 to 240 4 43 19 34Nyanza 79 193 169 to 218 19 29 23 28Rift Valley 148 149 135 to 163 28 33 29 10Western 61 125 102 to 149 40 27 22 11HH wealthPoorest 99 186 166 to 206 17 29 31 23Next 131 149 132 to 167 31 30 22 17Middle 109 177 160 to 194 20 27 37 16Next 110 189 171 to 208 16 35 22 27Wealthiest 130 226 212 to 240 4 18 45 33All NPW 579 185.5 177.6 to 193.4 18 27 32 23
NPW had a mean UNaC of 186mmol with 95 CI: 178-193mmol/L. The UNaC mean values and the UNaC distribution parameters in NPW, similar as in SAC, showed sizable differences between age group, urban/rural residence and household wealth index. The younger age group of NPW had a higher UNaC values than older women and the UNaC in urban areas (204mmol/L) exceeded the rural UNaC (175mmol/L). Further, women in the wealthiest households (226mmol/L) had higher UNaC than their counterpart group (149mmol/L) in poorer households (HHW=2). By Province, NPW in Nairobi had the highest (231mmol/L), while NPW in the Rift Valley (149mmol/L) and Western Province (149mmol/L) had the lowest mean UNaC. In terms of the WHL nomenclature, 55 of the UNaC values in NPW suggested very high salt intakes. Very high UNaC values were particularly
prevalent among <19y-old NPW (70), women in urban areas (65), in the wealthiest households (78) and in Nairobi (87) province.
Noteworthy, the UNaC and UIC levels, both in the SAC and the NPW, appeared to exhibit a mutually related pattern of co-variation. High median UIC along with high mean UNaC were found in the women and children in urban areas and in the highest household wealth quintiles whereas, in contrast, the lowest UNaC as well as lowest UIC values were found in rural areas, asset-poorer households (HHW index=2) and in the Rift Valley and Western Provinces. The observed pattern would suggest existence of a functional relationship between the dietary intakes of salt and iodine in the Kenyan population groups. This relationship is explored further in a later section of this report.
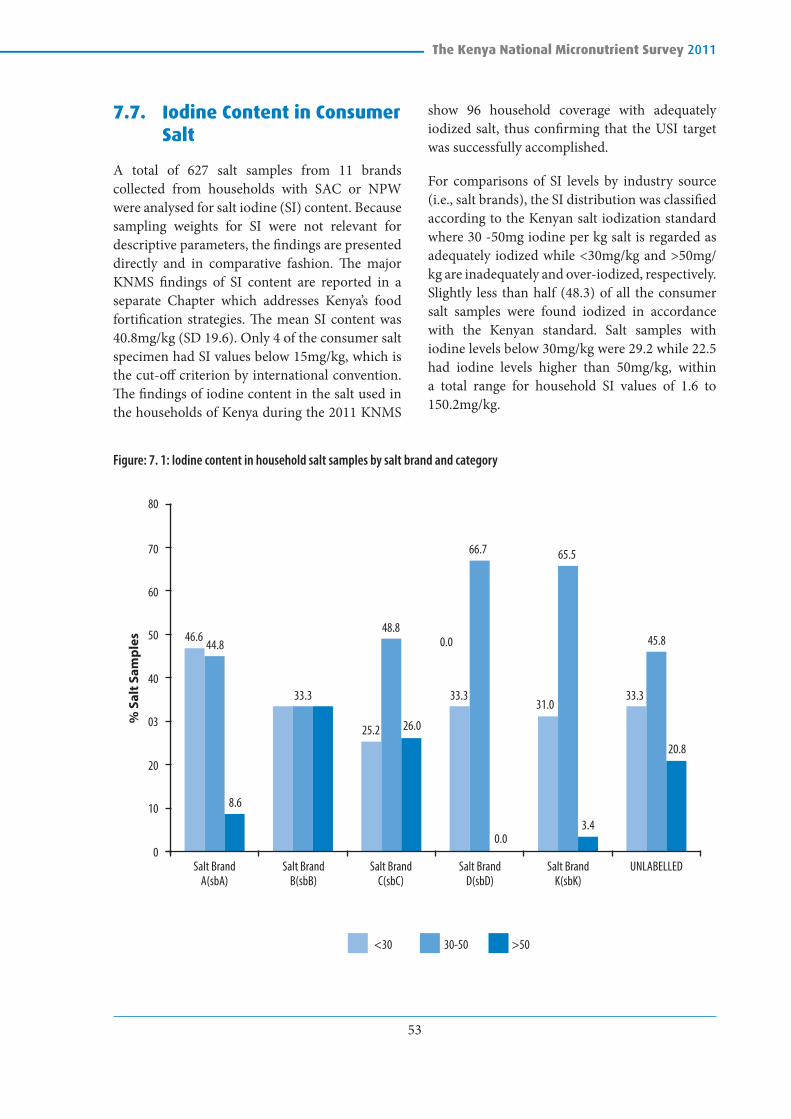
53
The Kenya National Micronutrient Survey 2011
7.7. Iodine Content in Consumer Salt
A total of 627 salt samples from 11 brands collected from households with SAC or NPW were analysed for salt iodine (SI) content. Because sampling weights for SI were not relevant for descriptive parameters, the findings are presented directly and in comparative fashion. The major KNMS findings of SI content are reported in a separate Chapter which addresses Kenya’s food fortification strategies. The mean SI content was 40.8mg/kg (SD 19.6). Only 4 of the consumer salt specimen had SI values below 15mg/kg, which is the cut-off criterion by international convention. The findings of iodine content in the salt used in the households of Kenya during the 2011 KNMS
show 96 household coverage with adequately iodized salt, thus confirming that the USI target was successfully accomplished.
For comparisons of SI levels by industry source (i.e., salt brands), the SI distribution was classified according to the Kenyan salt iodization standard where 30 -50mg iodine per kg salt is regarded as adequately iodized while <30mg/kg and >50mg/kg are inadequately and over-iodized, respectively. Slightly less than half (48.3) of all the consumer salt samples were found iodized in accordance with the Kenyan standard. Salt samples with iodine levels below 30mg/kg were 29.2 while 22.5 had iodine levels higher than 50mg/kg, within a total range for household SI values of 1.6 to 150.2mg/kg.
Figure: 7. 1: Iodine content in household salt samples by salt brand and category
46.644.8
0
10
<30 30-50 >50
20
03
Salt Brand A(sbA)
Salt Brand B(sbB)
Salt Brand C(sbC)
% S
alt S
ampl
es
Salt Brand D(sbD)
Salt Brand K(sbK)
UNLABELLED
40
50
60
70
80
33.3 33.3 33.3
48.80.0
0.0
8.6
3.4
20.8
45.8
31.0
26.025.2
65.566.7
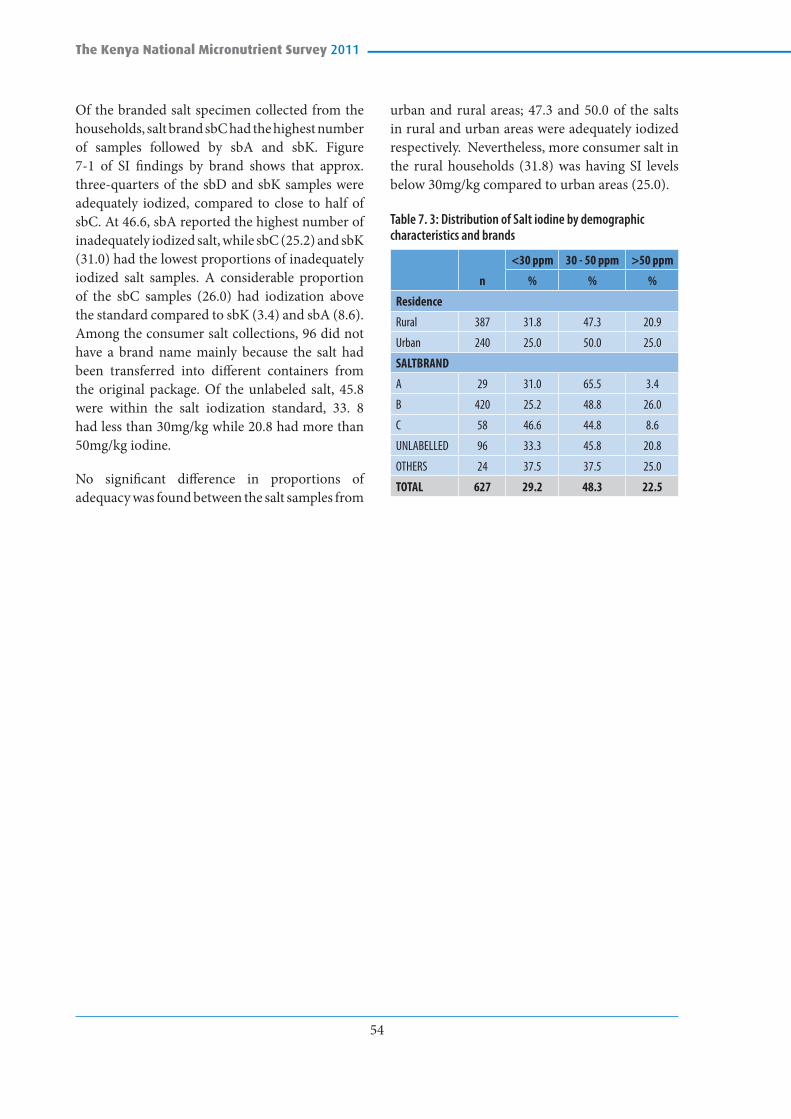
54
The Kenya National Micronutrient Survey 2011
Of the branded salt specimen collected from the households, salt brand sbC had the highest number of samples followed by sbA and sbK. Figure 7-1 of SI findings by brand shows that approx. three-quarters of the sbD and sbK samples were adequately iodized, compared to close to half of sbC. At 46.6, sbA reported the highest number of inadequately iodized salt, while sbC (25.2) and sbK (31.0) had the lowest proportions of inadequately iodized salt samples. A considerable proportion of the sbC samples (26.0) had iodization above the standard compared to sbK (3.4) and sbA (8.6). Among the consumer salt collections, 96 did not have a brand name mainly because the salt had been transferred into different containers from the original package. Of the unlabeled salt, 45.8 were within the salt iodization standard, 33. 8 had less than 30mg/kg while 20.8 had more than 50mg/kg iodine.
No significant difference in proportions of adequacy was found between the salt samples from
urban and rural areas; 47.3 and 50.0 of the salts in rural and urban areas were adequately iodized respectively. Nevertheless, more consumer salt in the rural households (31.8) was having SI levels below 30mg/kg compared to urban areas (25.0).
Table 7. 3: Distribution of Salt iodine by demographic characteristics and brands
n
<30 ppm 30 - 50 ppm >50 ppm
% % %
Residence
Rural 387 31.8 47.3 20.9
Urban 240 25.0 50.0 25.0
SALTBRAND
A 29 31.0 65.5 3.4
B 420 25.2 48.8 26.0
C 58 46.6 44.8 8.6
UNLABELLED 96 33.3 45.8 20.8
OTHERS 24 37.5 37.5 25.0
TOTAL 627 29.2 48.3 22.5

55
The Kenya National Micronutrient Survey 2011
CHAPTER EIGHT: ZINC DEFICIENCY
8.1. Introduction
Zinc deficiency is among the most important causes of morbidity in developing-country settings. From the 1999 National Survey report, approximately 50% of both children and women had serum Zinc levels below 65µg/L. Serum or plasma zinc concentration is the best available biomarker of risk of zinc deficiency in populations. In this study plasma zinc was used for biochemical analysis. The cut-offs used (Table 8-1) for the different population groups were as defined by the WHO/UNICEF/IAEA/IZiNCG (2007). A prevalence, for low serum zinc, of between 10 percent and 20 percent suggests that some segments of the population may be at high risk of zinc deficiency (Brown et al 2004). , (Refer to Chapter 2, Correction for inflammation section).
Table 8. 1: Cut-offs for serum zinc concentration (µg/dL*) for morning and non-fasting
Study Group Age / Pregnancy stage
Lower cut-off µg/dL
Pre SAC <5 years 65
SAC <10 years (boys & girls) 65
≥10 years (Boys) 70
≥10 years (Girls) 66
Men ≥10 years 70
Non-Pregnant Women (NPW) ≥10 years 66
Pregnant Women (PW) 1st trimester 56
2nd& 3rd trimesters 50
*For conversion to µmol/L, divide by 6.54 (IZiNCG; 2012)
8.2. Zinc Deficiency in Pre-School Children (6-59 months)
In children, the risk of zinc deficiency increases with the introduction of complementary foods, as these foods are mainly cereal based, which have lower nutrient densities (Veenemans, 2011). Complementary foods also contain high concentrations of phytates and polyphenols that inhibit the intestinal absorption of dietary zinc. This survey established a median plasma zinc concentration levels 50µg/dL ranging between 38 and 59 µg/dL.
Of all children 6-59 months, 83.3 percent had low plasma zinc, which is an indication of zinc deficiency among pre-school children being a major public health issue (Table 8-2). The difference in plasma zinc concentration between children 23 months and below and those aged 24-59 months was not significant. This observation was similar among boys and girls. However, the prevalence of zinc deficiency differed significantly across wealth quintiles where those children from poorer households had a high prevalence (89 percent) compared to those from richer households (75 percent). Further, zinc deficiency was significantly higher among children who resided in the rural areas compared to those in urban areas.
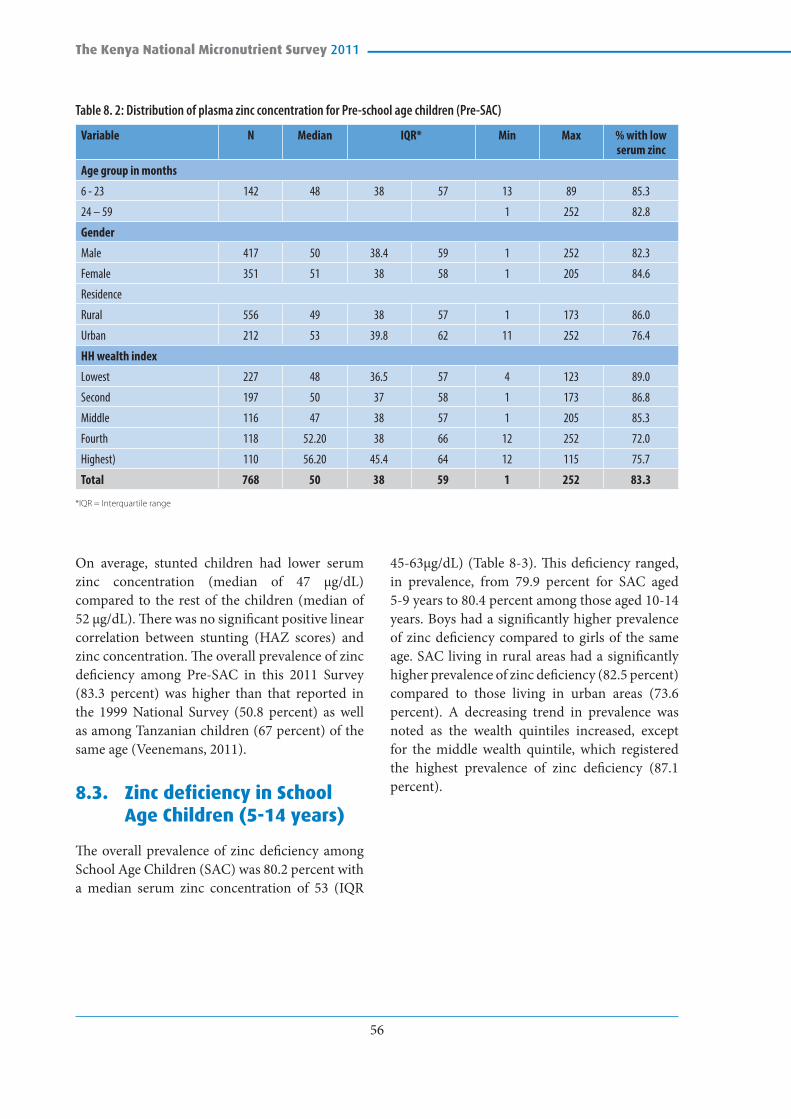
56
The Kenya National Micronutrient Survey 2011
Table 8. 2: Distribution of plasma zinc concentration for Pre-school age children (Pre-SAC)
Variable N Median IQR* Min Max % with low serum zinc
Age group in months
6 - 23 142 48 38 57 13 89 85.3
24 – 59 1 252 82.8
Gender
Male 417 50 38.4 59 1 252 82.3
Female 351 51 38 58 1 205 84.6
Residence
Rural 556 49 38 57 1 173 86.0
Urban 212 53 39.8 62 11 252 76.4
HH wealth index
Lowest 227 48 36.5 57 4 123 89.0
Second 197 50 37 58 1 173 86.8
Middle 116 47 38 57 1 205 85.3
Fourth 118 52.20 38 66 12 252 72.0
Highest) 110 56.20 45.4 64 12 115 75.7
Total 768 50 38 59 1 252 83.3
*IQR = Interquartile range
On average, stunted children had lower serum zinc concentration (median of 47 µg/dL) compared to the rest of the children (median of 52 µg/dL). There was no significant positive linear correlation between stunting (HAZ scores) and zinc concentration. The overall prevalence of zinc deficiency among Pre-SAC in this 2011 Survey (83.3 percent) was higher than that reported in the 1999 National Survey (50.8 percent) as well as among Tanzanian children (67 percent) of the same age (Veenemans, 2011).
8.3. Zinc deficiency in School Age Children (5-14 years)
The overall prevalence of zinc deficiency among School Age Children (SAC) was 80.2 percent with a median serum zinc concentration of 53 (IQR
45-63µg/dL) (Table 8-3). This deficiency ranged, in prevalence, from 79.9 percent for SAC aged 5-9 years to 80.4 percent among those aged 10-14 years. Boys had a significantly higher prevalence of zinc deficiency compared to girls of the same age. SAC living in rural areas had a significantly higher prevalence of zinc deficiency (82.5 percent) compared to those living in urban areas (73.6 percent). A decreasing trend in prevalence was noted as the wealth quintiles increased, except for the middle wealth quintile, which registered the highest prevalence of zinc deficiency (87.1 percent).

57
The Kenya National Micronutrient Survey 2011
Table 8. 3: Prevalence of serum zinc concentration for school aged children (SAC)
Variable n Median IQR* Min Max % with low serum zinc
Age category
5 - 9 years 537 53 45 - 61 8 291 79.9
10 - 14 years 428 54 47 - 64 3 380 80.4
Gender
Male 471 53 45 - 61 12 291 83.0
Female 492 54 46 - 64 3 380 77.2
Residence
Rural 713 53 44 - 62 3 380 82.5
Urban 254 54.4 49 - 66.8 8 206 73.6
HH wealth index
Lowest 256 52 43 - 59 3 136 85.5
Second 268 53 46 - 63.9 16 380 78.0
Middle 200 52.4 44 - 59 12 206 87.0
Fourth 143 54 48 - 65 27 128 74.1
Highest 99 58 51 - 69.6 8 185 67.7
Total 967 53 45 - 63 3 380 80.2
*IQR = Interquartile range
8.4. Zinc Deficiency in Pregnant Women
The overall prevalence of zinc deficiency in pregnant women (Table 8-4) was 68.3 percent, which was higher than that reported in 1999 National Survey (52 percent). Pregnant women in their 2nd /3rd trimester had a higher prevalence of zinc deficiency (69.4 percent) than those in their 1st trimester (60.7 percent). Though pregnant women residing in urban areas had high prevalence of zinc deficiency (70 percent), than those in the rural areas (67percent), there were no differences registered, in prevalence of zinc deficiency, between the various wealth quintiles.
Table 8. 4: Distribution of serum zinc concentration for pregnant women (PW)
Variable n Median IQR* Min Max % with low serum zinc
Pregnancy stage
1st Trimester 28 50.5 41 58 14 114 60.7
2nd & 3rd Trimester 85 42 36 54 19 191 69.4
Residence
Rural 75 43.5 37 57 14 191 67.1
Urban 47 40.5 40 56.3 19 125 70.2
HH wealth index
Poorest 26 47 38.5 57.5 14 191 57.7
Second 35 43.9 37 57 19 159 68.6
Middle 21 41.3 36 56.2 30 125 71.4
Fourth 17 38. 5 31.9 39 31 67 94.1
Richest 22 46 39 59.2 19 114 59.1
Total 122 43 36 57 14 191 68.3
*IQR = Interquartile range

58
The Kenya National Micronutrient Survey 2011
8.5. Zinc Deficiency in Non-Pregnant Women
The overall prevalence of zinc deficiency in non-pregnant women was 82.3 percent (Table 8-5) with over three quarters of all NPW showing low serum zinc concentration. There was no difference in prevalence of zinc deficiency among non-pregnant women residing in rural with those living in urban areas (82.4 percent).
8.6. Zinc Deficiency in Men
The overall prevalence of zinc deficiency among men was 74.8 percent (Table 8-6). Area of residence did have a significant difference in the prevalence of zinc deficiency (p<0.05). Men in rural areas had a significantly higher prevalence of low serum zinc concentration (79.7 percent) than in the urban areas where about two-thirds had zinc deficiency (67 percent).
Table 8. 5: Distribution of serum zinc concentration for non-pregnant women (NPW)
Variable n Median IQR* Min Max % with low serum zinc
Residence
Rural 409 53 46 60.5 16 287 82.4
Urban 244 55 43.7 63 10 219 82.4
HH wealth index
Poorest 124 54.6 44 59 19 101 87.1
Second 133 54 47 64.3 22 287 76.1
Middle 124 50 44 60 16 141 87.9
Fourth 117 52 43 59.7 22 235 82.2
Richest 154 55.6 46 64 10 219 79.2
Total 653 54 44 61.5 10 287 82.3
*IQR = Interquartile range
Table 8. 6: Distribution of serum zinc concentration for men
Variable n Median IQR* Min Max % with low serum zinc
Residence
Rural 158 60 49 67 10 148 79.7
Urban 100 63 48 76 19 687 67.0
HH wealth index
Poorest 40 60 47.5 63.8 10 125 87.5
Second 64 62 48.4 66 29 148 78.1
Middle 44 61 50 67 30 687 84.1
Fourth 62 52 33 63.8 19 219 79.4
Richest 47 74 62 82 23 118 44.7
Total 258 61.1 48.8 69.6 10 687 74.8
*IQR = Interquartile range
8.7. Prevalence of Low Serum Zinc after Correcting for Inflammation
For all persons whose CRP and AGP values were computed, an inflammation correction factor was constituted and zinc values adjusted accordingly (See chapter 2 on correction for inflammation). After adjustment, the recommended cut-offs were applied to determine prevalence of low serum zinc (Table 8-7).
Table 8.7: Distribution of low serum zinc concentration by study group, uncorrected and corrected for inflammation
Study group N1
% with low serum zinc
UncorrectedCorrected for inflammation
Pre-school age children (PSC) 711 82.8 81.6
School age children (SAC) 901 80.4 79.0
Pregnant women (PRG) 109 67.9 67.9
Non-pregnant women (NPW) 617 80.7 79.9
Men 239 77.4 77.4
1 Includes only those with both CRP and AGP values and therefore the prevalence may be different when you consider all surveyed

59
The Kenya National Micronutrient Survey 2011
After correcting for inflammation, the prevalence of low serum zinc decreased marginally for SAC (by 1.4 percent), PSC (by 1.2 percent) and NPW (by 0.8 percent). For men and pregnant women, the prevalence of low serum zinc remained unchanged. Although pregnant women had the lowest prevalence of low serum zinc concentration, in general men had a higher median serum zinc concentration than the rest of the population groups.
8.8. Nutrient Intake and Zinc Deficiency
Dietary intake is a good proxy indicator for estimating deficiencies in the absence of biochemical data. The need to have a varied diet with animal source foods that provide
micronutrient requirements has been documented (Mbwibo and Neumann, 2003). Dietary intake data as described in chapter 10 of this report, shows that the dietary diversity among children was below the miminum recommended 4 out of 7 groups. In addition, children from rural areas had markedly higher inadequacy levels than children from urban areas and also significantly higher prevalence of low serum zinc concentration. Prevalence of inadequate zinc intake was highest among children 6-11 months (66 percent) while 17 percent of those aged 12-59 months had inadequate zinc intake. The relationship between dietary intake and zinc concentration may therefore be inferred from this survey.

60
The Kenya National Micronutrient Survey 2011
CHAPTER NINE: FOLATE AND VITAMIN B12 DEFICIENCY IN PREGNANT AND NON-PREGNANT WOMEN
9.1. Introduction
Folate and vitamin B12 plays an important role in human development, and a high folate with low vitamin B12 plasma status combination has been associated with cognitive impairment. A deficiency of one of these vitamins alters the metabolism of the other, and folate sufficiency may mask cobalamin deficiency (WHO, 2008). Folate deficiency in women of childbearing age increases the risk of neural tube birth defects, and is associated with haematological disorders such as macrocytic anaemia (WHO, 2005; Brito et al., 2012). Folate is found naturally in plant and animal foods or added as folic acid to staple foods. Folate deficiency can arise from insufficient dietary intake as well as malabsorption due to gastrointestinal disorders and secondary deficiencies of B6 and B12. Ageing also has an impact on vitamin B12 absorption. Cobalamin deficiency can occur in both wealthy and poor individuals, and so deficiency occurs when intake of these foods is low. Vitamin B12 deficiency is certainly more prevalent in vegans, but ovo-lacto vegetarians are also at higher risk for inadequate intakes. Vitamin B12 concentrations in breast milk can be markedly lower in vitamin B12-depleted women in comparison to folate in lactating women (WHO 2008). Vitamin B12 can be increased in populations through diversification of diets, supplementation and food fortification.
The most practical and least expensive measurements at the population level are serum or plasma vitamin B12 and folate. Diagnosis of vitamin B12 deficiency is typically based on measurement of serum vitamin B12 levels.
9.2. Folate and B12 deficiency among pregnant women
This survey represents results of 78 respondents for pregnant women for both folate and B12 which represents a response rate of 34 per cent. The findings should therefore be used with caution to represent the national prevalence of folate and B12 deficiency.
Table 9. 1: Distribution of Folate and B12 deficiency among pregnant women (15-49 years) by residence
Residence Unweighted Folate<10 nmol/L Unweighted B12<150 pmol/L Unweighted
N % 95% C.I. % 95% C.I.
Rural 50 36.0 22.7 49.3 8.0 0.5 15.52
Urban 28 25.0 9.0 41.0 7.1 0.0 16.6
Total 78 32.1 21.7 42.5 7.7 1.8 13.62
The national prevalence of folate deficiency in pregnant women was 32.1 percent (Table 9-1), that compared with a study in India (26.3 percent) and Venezuela (36.3 percent) (Pathak, 2007). Distribution of folate deficiency in pregnant women showed no major variability by residence however, pregnant women that dwell in urban areas had a lower prevalence (25.0 percent) than those in rural areas (36.0 percent).
The national prevalence of Vitamin B12 deficiency in pregnant women was 7.7 percent (Table 9-1). This is a very low prevalence compared to other reported results from developing countries (India, 74.1 percent, Nepal 60 percent and Turkey 72 percent) (Koc et al, 2006).

61
The Kenya National Micronutrient Survey 2011
The pregnant women that dwell in rural areas had a higher (8.0 percent) prevalence of Vitamin B12 deficiency compared to pregnant women in urban areas (7.1 percent ).
9.3. Folate and B12 deficiency among non-pregnant women
The response rate of 63 percent was reported in non-pregnant women for folate and B12 indicators. The National prevalence of folate deficiency in non-pregnant women was 30.9 percent which was higher than that of pregnant women. There was no significant difference in the distribution of folate deficiency in terms of age, level of education and wealth quintile. However significant difference was noted in the prevalence of folate deficiency according to area of residence of the women.
Non-pregnant women in urban areas had a higher prevalence of folate deficiency (40.6 percent) than non-pregnant women in rural areas (25.1 percent (Table 9-3).
Table 9. 3: Distribution of Folate and Vitamin B12 deficiency among non-pregnant women (15-49 years) by selected demographic and economic characteristics
Variables n Folate <10nmol/L Weighted %
Vitamin B12 <150pmol/L Weighted %
Age in years (grouped)
15 - 19 89 31.5 47.7
20 - 49 356 30.6 31.5
Level of education
Preschool/None 47 36.2 45.8
Primary 253 30.0 37.7
Post primary/ Vocational
127 31.5 26.0
College/ University 18 27.8 27.8
Residence
Rural 279 25.1 36.9
Urban 165 40.6 30.7
Wealth index quintiles
Poorest 85 24.7 29.4
Second 98 33.7 39.4
Middle 88 23.9 40.9
Fourth 79 35.4 29.5
Richest 94 36.2 33.0
Total 445 30.9 34.7
The national prevalence of Vitamin B12 deficiency in non-pregnant women was 34.7 percent, higher than that of pregnant women. There was no significant difference in the distribution of Vitamin B12 deficiency in terms of area of residence and wealth quintile. However significant difference was noted in the prevalence of folate deficiency according to age, with the highest prevalence observed in women of 15 – 19 years (47 percent) and lowest in women 20 - 49 years (31.5 percent). Educated women are expected to make better choices in food selection as compared to uneducated or those with low level of education. In this study, significant difference was noted in the distribution of vitamin B12 deficiency by level of education. Women who have no education had the highest prevalence of Vitamin B12 deficiency (45.8 percent) compared to women with post primary level of education who had the lowest prevalence (26.0 percent) (Table 9-3). The prevalence of vitamin B12 decreased with an increase in the level of education.
9.3.1. Folate and B12 deficiency in relation to intake among non-pregnant women
There was no significant difference between non-pregnant women with adequate and those with inadequate intake of both folate and vitamin B12 in relation to occurrence of folate and B12 deficiency (Table 9-4).

62
The Kenya National Micronutrient Survey 2011
Table 9. 4: Folate and Vitamin B12 deficiency among non-pregnant women (15– 49 years) in relation to adequacy in RDI of micronutrients
Micronutrients derived from 24hour recall
n Folate<10 nmol/L unweighted % Vitamin B12 <150 pmol/L unweighted %
Folate
Inadequate 158 33.5 36.1
Adequate 67 26.9 29.9
Vitamin B12
Inadequate 195 29.7 34.4
Adequate 30 43.3 33.3

63
The Kenya National Micronutrient Survey 2011
CHAPTER TEN: FOOD CONSUMPTION PATTERNS, DIETARY PRACTICES NUTRIENT INTAKES10.1. Infant Feeding Practices
Infant feeding practices for the study population was assessed by asking caregivers /mothers to give details on children’s feeding with respect to initiation of breastfeeding after birth, proportions of children under bottle feeding, introduction of complimentary feeding (solid and semi-solid foods) and frequency of all foods consumed by the children including breast feeding.
10.1.1. Breast Feeding
Breastfeeding has well-established short- and long-term benefits, particularly the reduction of morbidity and mortality due to infectious diseases in childhood (WHO, 2013). World Health Organization recommends exclusive breastfeeding for up to 6 months of age, with continued breastfeeding along with appropriate complementary foods up to two years of age or beyond. Our findings show that 95.9 percent of the children aged 6-11 months; 61.9 percent aged 12-23 months; 10.7 percent aged 24-35 and 24.0 percent aged 36-47 months were breastfed the day preceding the survey. The expectation that children be breastfed upto the age of two years was only being achieved by two thirds of the children in that age category.
10.1.2. Early Initiation of Breast-feeding
In this study, mothers and caregivers reported that 93.8 percent of the children were ever breastfed. 33.7 percent of the children were breastfed immediately after delivery, 27.4 percent within an hour, 4.7 percent did not know. Early initiation of breastfeeding is associated with improved immunity for the child due to intake of colostrum. In addition, it is associated with reduced postpartum haemorrhage. WHO recommends that mothers first provide
breast milk to their infants within one hour of birth – referred to as “early initiation of breastfeeding”. This ensures that the infant receives the colostrum (“first milk”), which is rich in protective factors.
10.2. Micronutrient Supplementation
This section looks at supplementation of vitamin A, iron and folic acid in children and women of reproductive age. Caregivers of mothers were asked to give details of children’s supplementation and pica (persistent consumption of non-nutritive substances such as soil or paper) over the last 7 days or six months.
10.2.1. Vitamin A Supplementation in Children 6-59 months
The survey findings indicate that at least 84.3 percent of all the children under five years had ever received vitamin A supplementation while 53.1 percent had received the supplementation 6 months prior to the date of the survey. In settings where vitamin A deficiency is a public health problem, World Health Organization recommends vitamin A supplementation to infants and children 6–59 months of age as a public health intervention to reduce child morbidity and all-cause mortality by 23 percent (Horton et al 2008, WHO, 2011a). According to the World Bank data base, in 2010, vitamin A coverage in Kenya (the percentage of children ages 6-59 months old who received at least two doses of vitamin A in the previous year) was at 62 percent (World Bank-http://data.worldbank.org/indicator/SN.ITK.VITA.ZS) (WHO, 2009). The findings in this survey are much higher than what was reported (30.3 percent) by KDHS 2008 - 2009 but lower than what is reported by World Bank in 2010.

64
The Kenya National Micronutrient Survey 2011
Table 10. 1: Micronutrient supplementation among the Pre School Children
Variables Percent n
1. Has child ever received Vitamin A drops? 84.3 1435
2. Did the child receive Vitamin A drop within the last six months? 53.1 1210
3. During last six months were you given/buy any iron tablets, Iron pills, Micronutrient powders, or iron syrups? 4.7 1435
4. During last six months, were you given or did buy any folic acid tablets? 1.3 1435
5. Does child eat soil or earth from any source? 29.1 1435
6. Has child been diagnosed with anaemia in the past 6 months? 2.8 1435
7. Has child taken any drugs for intestinal worms in the past 6 months 38.3 1435
Among the WRA, in regard to most recent birth, 34.9 percent were supplemented with vitamin A immediately after delivery.
10.2.2. Iron and folic acid use and de-worming in Children
Care givers reported that 4.7 percent of pre-school children and 2.4 percent of school aged children had received or bought iron tables or pills, however, 29.0 percent of the pre-school children and 6.5 percent of school aged children were reported to consume soil or earth. 38.3 percent of preschool children and 33.5 percent school aged children had received medication for intestinal worms while only 2.8 percent were diagnosed with anaemia. Diagnosis will also depend on whether the health facilities have that capacity to diagnose. In the event that there is limited capacity, there is a possibility that a number of cases go undiagnosed. This study did not assess facility capacities and therefore cannot confirm.
10.2.3. Iron Supplementation in Women of Reproductive Age
Daily supplementation with iron and folic acid for a period of three months has been the standard approach for the prevention and treatment of iron deficiency anaemia and prevention of foetal neural
tubes defects among women of reproductive age (WHO, 2011b). From the reported information by the respondents only 5.7 percent indicated they were diagnosed with anaemia in the previous six months, 23.5 percent had taken drugs for intestinal worms, 49.7 percent reported that during the time of the pregnancy that occurred in the last twelve months, they bought or received iron supplements. While within the same period 31.6 percent reported having received folic acid. Intermittent use of oral iron supplements (i.e. once, twice or three times a week on non-consecutive days) has been proposed as an effective alternative to daily iron supplementation to prevent anaemia among menstruating women. The proposed rationale behind this intervention is that intestinal cells turn over every 5–6 days and have limited iron absorptive capacity. Thus intermittent provision of iron would expose only the new epithelial cells to this nutrient, which should, in theory, improve the efficiency of absorption. Intermittent supplementation may also reduce oxidative stress and the frequency of other side-effects associated with daily iron supplementation as well as minimize blockage of absorption of other minerals due to the high iron levels in the gut lumen and in the intestinal epithelium (WHO, 2011).

65
The Kenya National Micronutrient Survey 2011
10.3. Dietary diversity
The relevance of food intake in nutrition and health studies is already acknowledged. However, the measurement of food intake needs methods that combine simplicity, validity, and accuracy, which is a challenge given the constraints involved in this task. Food records, 24-hour dietary recall (24hr), and the food frequency questionnaire (FFQ) are the most common dietary assessment methods. Food records and 24hR recalls are based on foods and amounts actually consumed by an individual on one or more specific day (Pereira et al 2010).
Higher dietary diversity has been associated with better nutritional status of children in developing countries (Rah et al., 2010). Dietary diversity ensures adequate nutrient intakes among groups (Ajani, 2010). Dietary problems may be primarily quantitative in the most underprivileged areas, such as rural areas during seasonal food shortages or urban areas under acute poverty. As a result, the nutrient deficiency then appears to be chiefly energy related. However, even in these conditions it has been shown that the problem of dietary diversity is crucial and the measurement of the dietary quality is therefore essential (Savy et al., 2008). As no single food contains all necessary nutrients, diversity in dietary sources is needed to ensure a balanced and healthy diet.
Dietary diversity is most often measured by counting the number of food groups and the selection of foods groups is based on their unique contribution to nutrient adequacy. An individual’s dietary diversity score is calculated by summing up the different food groups consumed with a score of 1 assigned for each food group. The food group indicator was based on a total of seven possible food groups: (1) grains, roots and tubers, (2) legumes and nuts, (3) dairy products, (4) flesh foods (meat, fish, poultry, and liver/organ meats), (5) eggs, (6) vitamin A-rich fruits and vegetables (> 130 RAE of vitamin A per 100 g), and (7) other
fruits and vegetables, as recommended by the Working Group on IYCF indicators of dietary quality (FANTA 2006; WHO 2008; WHO 2010). For the 24 hr recall data, all food items with a minimum weight of 1 g were included.
The dietary diversity score serves as a useful and simple indicator for assessing quality of diet. Using the number of food groups consumed, a dietary diversity score was calculated for each child, with a range from 0 to 7 (0 if only miscellaneous food items were consumed, 7 if at least one item from all food groups in the index was consumed). Children with a score less than 4 are considered to have inadequate dietary diversity.
Dietary diversity using 24 hr recall data
The grains and tubers food group represents the majority of children’s energy intake, on average accounting for 57.4 percent of total energy intake in children 6-59 months of age (Table 10-2). The other food group, which accounted for the second largest proportion of energy intake was dairy products, with an average of 20.1 percent for all children and ranging from 27.3 percent in younger children (6-23 months) to 14.9 percent in older children (24-59 month). Intake of meat, poultry and fish accounted for 8.4 percent of energy intake on average. A comparison of the percent of energy intake by food group for children from rural and urban areas (Table 10-3). Previous studies in developing countries have shown a positive association between dietary diversity and socioeconomic status (Hatloyet. al, 1998) which indicates that the household’s capability to acquire necessary foods and the general availability of food, is a prerequisite to achieve the diversification of child diets. For example from figure 10-1 we see that meat based-meals are least consumed by the households in the poorest socio-economic index but the limited protein source appears to be compensated by consumption of more beans and nuts among the poor.

66
The Kenya National Micronutrient Survey 2011
Table 10. 2: Mean percent of energy intake by food group in children 6-59 months overall and by age group 1 (N=264)
Food group
Overall 6-23 month 24-59 month
Mean 95% CI Mean 95% CI Mean 95% CI
Grains & tubers 57.4 54.3, 60.5 53.9 48.6, 59.3 59.6 55.6, 63.7
Beans, nuts, seeds 8.5 6.4, 10.6 9.3 3.5, 15.0 8.3 6.1, 10.5
Dairy 20.1 16.8 27.3 21.2, 33.4 14.9 12.2, 17.6
Meat, poultry, fish 8.4 6.5, 10.3 9.4 5.4, 13.4 8.1 6.2, 10.0
Eggs 6.5 4.3, 8.7 7.4 3.8, 10.9 5.3 3.3, 7.4
Other fruits & vegetables 7.9 3.6, 12.3 13.1 2.0, 24.2 5.6 2.3, 8.9
Vitamin A-rich fruits & vegetables 8.8 4.9, 12.7 11.1 7.0, 15.1 7.5 1.8, 13.3
Miscellaneous (all other food items) 15.8 13.3, 18.3 15.5 10.2, 20.7 16.1 13.7, 18.4
1 Calculated as the mean of each child’s individual intake
Table 10. 3: Mean percent of energy intake by food group in children 6-59 months by area of residence1 (N=264)
Food group
Rural Urban
Mean 95% CI Mean 95% CI
Grains & tubers 59.7 55.7, 63.7 51.6 46.9, 56.2
Beans, nuts, seeds 9.5 6.8, 12.3 5.7 4.0, 7.4
Dairy 20.7 16.2, 25.2 18.7 15.0, 22.5
Meat, poultry, fish 7.9 5.6, 10.2 9.0 5.9, 12.2
Eggs 9.2 6.1, 12.2 4.2 2.2, 6.1
Other fruits & vegetables 5.5 1.9, 9.1 11.7 2.1, 21.4
Vitamin A-rich fruits & vegetables 9.8 4.3, 15.4 6.8 3.7, 9.9
Miscellaneous (all other food items) 15.7 12.4, 19.0 16.2 13.6, 18.8
1 Calculated as the mean of each child’s individual intake

67
The Kenya National Micronutrient Survey 2011
Table 10. 4: Mean number of food groups consumed and proportion with low dietary diversity (DDS<4) among children 6-59 month, by child characteristic (N=279)
Child characteristic
Food Group Index-7 Low DDS (<4) Risk of low DDS
mean (SEM) 95% CI % (95% CI) OR (95% CI) p
ALL 3.63 (0.12) 3.40, 3.87 46.1 (38.0, 54.3)
Age group
6-11 mo 2.78 (0.24) 2.30, 3.26 68.8 (53.8, 83.7) Ref
12-23 mo 3.95 (0.18) 3.59, 4.30 35.7 (22.0, 49.4) 0.25 (0.10, 0.63) 0.003
24-35 mo 4.09 (0.15) 3.80, 4.38 31.9 (18.8, 45.1) 0.21 (0.09, 0.51) 0.001
36-47 mo 3.35 (0.21) 2.94, 3.76 55.5 (39.8, 71.3) 0.57 (0.22, 1.44) 0.232
48-59 mo 4.41 (0.37) 3.69, 5.13 34.7 (11.2, 58.2) 0.24 (0.07, 0.85) 0.027
Sex
boys 3.60 (0.14) 3.32, 3.87 45.2 (35.0, 55.4) Ref
girls 3.69 (0.19) 3.31, 4.07 47.6 (34.7, 60.4) 1.10 (0.57, 2.10) 0.774
Residence
rural 3.32 (0.14) 3.05, 3.60 55.9 (45.9, 66.0) Ref
urban 4.45 (0.16) 4.15, 4.76 20.1 (10.0, 30.3) 0.20 (0.09, 0.42) <0.001
Wealth rank
poorest 2.99 (0.27) 2.47, 3.52 60.6 (43.3, 77.9) Ref
second 3.30 (0.17) 2.97, 3.63 57.0 (42.3, 71.8) 0.86 (0.35, 2.14) 0.748
middle 3.82 (0.32) 3.18, 4.46 44.6 (22.1, 67.0) 0.52 (0.17, 1.65) 0.266
fourth 4.02 (0.20) 3.63, 4.42 32.7 (15.7, 49.6) 0.31 (0.11, 0.90) 0.032
richest 4.87 (0.23) 4.42, 5.31 14.6 (2.9, 26.3) 0.11 (0.03, 0.36) <0.001
Table 10. 5: Description of number of food items consumed per day among children, by age group
Indicator All Children 6-11 mo 12-23 mo 24-35 mo 36-47 mo 48-59 mo
N 279 62 67 76 49 25
Meals per day, mean (95% CI) 3.08 (2.97, 3.18)
2.86 (2.59, 3.12)
3.22 (2.99, 3.44)
3.19 (3.00, 3.37)
3.10 (2.98, 3.21)
2.99 (2.82, 3.17)
Number of meals per day, %
1 3.7 9.1 2.0 3.3 0 0
2 9.4 18.1 9.5 6.4 3.0 7.8
3 62.3 50.6 53.5 58.3 84.3 85.0
4 24.6 22.2 35.0 31.9 12.7 7.2

68
The Kenya National Micronutrient Survey 2011
The mean dietary diversity for all children was 3.63 (SEM, 0.12) (Table 10- 4). This is below the recommended cut-off for minimum dietary diversity of at least 4 of the 7 food groups which is associated with better quality for both breastfed and non-breastfed children (FANTA, 2007). The rationale behind this cut-off is that consumption of foods from at least 4 food groups on the previous day would mean that the child has a high likelihood of consuming at least one animal-source food and at least one fruit or vegetable that day, in addition to a staple food (grain, root or tuber) (WHO, 2009).
Children are particularly vulnerable to micronutrient deficiency owing to their high nutrient requirements for growth and susceptibility to infectious diseases such as diarrhoea and respiratory infections, which can inhibit nutrient absorption as well as decrease appetite. The nutrient density of the diet given to young children is often insufficient to meet their nutrient requirements, and increasing the diversity of foods provided to young children, particularly meat, poultry, fish, eggs, fruits and vegetables, is recommended to improve micronutrient intake (Steyn et al ., 2006). About half of all children had a low DDS (46.1 percent). This is an indication that the diets of these children are suboptimal and unlikely to meet their dietary requirements.
Dietary diversity is expected to increase with age. This is the trend we see in our analysis where older children are more likely to consume food from more than 1 food group compared to their
younger counterparts. However the numbers per age category were very small to make any meaningful comparisons (Table 10- 4).The youngest age group was at highest risk of low dietary diversity, along with children from rural areas and those from poorer households (Table 10- 4).
Children were reported to consume three meals per day, on average (Table 10- 5).The proportion of children who consumed foods from the standard list of food groups on the observed day is shown in Table 10- 6. Grains, dairy products (primarily milk) and vegetables were consumed in the past 24 hours by a large majority of children. The proportion of children consuming the different food groups generally increased with age, as expected. However, the difference in the proportion of children consuming roots, dairy and eggs was less than 7 percent between the youngest and oldest age groups. The largest increase with age was observed for consumption of meat, fats and sugars (just over 40 percent for each group, not including the miscellaneous group which increased by 48 percent between the youngest and oldest children).A comparison of food group consumption among children by rural/urban residence and household wealth rank is shown in Table 10- 6. More children living in urban areas consumed meat, eggs, fruits, vegetables and fats in the past day compared to children living in rural areas. However, only meat consumption remained independently associated with residence (OR 4.1, 95% CI 1.2, 13.7, p=0.021) after accounting for the household’s wealth rank (data not shown).

69
The Kenya National Micronutrient Survey 2011
Table 10. 6: Percentage Intake of food groups among children 5-59 months by different characteristics
Grains Roots Beans Dairy Meat Fish Eggs Fruits Veg Fats Sugars Beverages Misc
Children 6-59months
(n=279) 94.3 33.3 26.8 82.7 18.9 9.3 9.4 16.4 74.9 67.6 68.5 44.6 64.9
Age groups
6-11months (n=62)
84.2 23.4 11.1 80.9 3.5 6.8 7.2 8.0 49.7 39.5 44.8 17.8 33.4
12-59months (n= 217)
97.7 36.6 32.0 83.3 24.0 10.2 10.1 19.2 83.4 77.0 76.4 53.6 75.5
Sex
Boys (n= 93.7 26.6 29.4 84.7 14.2 7.9 10.0 10.7 75.5 63.0 67.0 48.2 59.2
Girls (n= 95.2 43.2* 22.7 79.6 25.9 11.4 8.5 24.9* 74.8 74.5 70.7 39.4 73.5
Residence
Rural (n=185) 93.0 30.9 26.8 79.5 10.2 9.4 5.9 12.1 70.2 62.6 66.1 46.3 63.0
Urban (n=94) 97.8 39.6 26.6 91.1* 41.8 9.0 18.6* 27.8* 87.4* 81.0* 74.8 40.3 70.0
Wealth Rank
Poorest (n=75) 90.9 19.8 22.2 70.2 11.0 6.7 8.2 5.5 60.3 51.8 57.1 47.5 59.7
Middle (n=166) 94.9 38.6* 26.6 86.6* 14.0 11.1 6.5 20.1* 78.4 69.2 70.6 46.9 64.0
Richest (n=38) 98.8 38.0 37.1 91.4* 56.4* 7.0 24.7 22.8* 90.2* 93.4* 83.2* 28.6 79.8
* p<0.05 for difference in proportion using logistic regression p<0.001 for difference in proportion using logistic regression
The average number of meals per day and number of food items consumed by women is shown in Table 10- 7. Women consumed an average of 3 meals per day, with less than 10 percent of women reporting fewer meals per day. Table 10- 8 represents the intake among women of the standard food groups. Consumption of grains was nearly universal. Intake of dairy products, vegetables, fats, sugars and beverages was also very high. Only one quarter of women reported meat intake in the past 24 hours.
Comparison of intake by physiological state reveals that there was lower intake among non-pregnant lactating women. Lactating women were half as likely to consume foods from the meat group (OR 0.5; 0.2, 0.9; p=0.04) and were also less likely to eat fruits (OR 0.4; 0.2, 0.8; p=0.02) and vegetables (OR 0.3; 0.1, 0.8; p=0.02) than NPNL women.
A comparison of intake by women living in different areas and from different household wealth ranks is also shown in Table 10- 8. A higher proportion of women living in urban areas consumed foods from the dairy, meat, eggs, fruits, vegetables, fats and sugars food groups. Even when wealth rank was included in the model, urban women were over four times more likely to eat eggs (OR 4.4; 1.4, 13.7) and fats (OR 4.1; 1.2, 14.0) compared to women living in rural areas. Consumption of dairy, meat, eggs, fruits, vegetables, fats and sugars were associated with a woman’s household wealth rank. The higher egg consumption among women from the richest households was explained by her residence and was not independently associated with wealth rank.
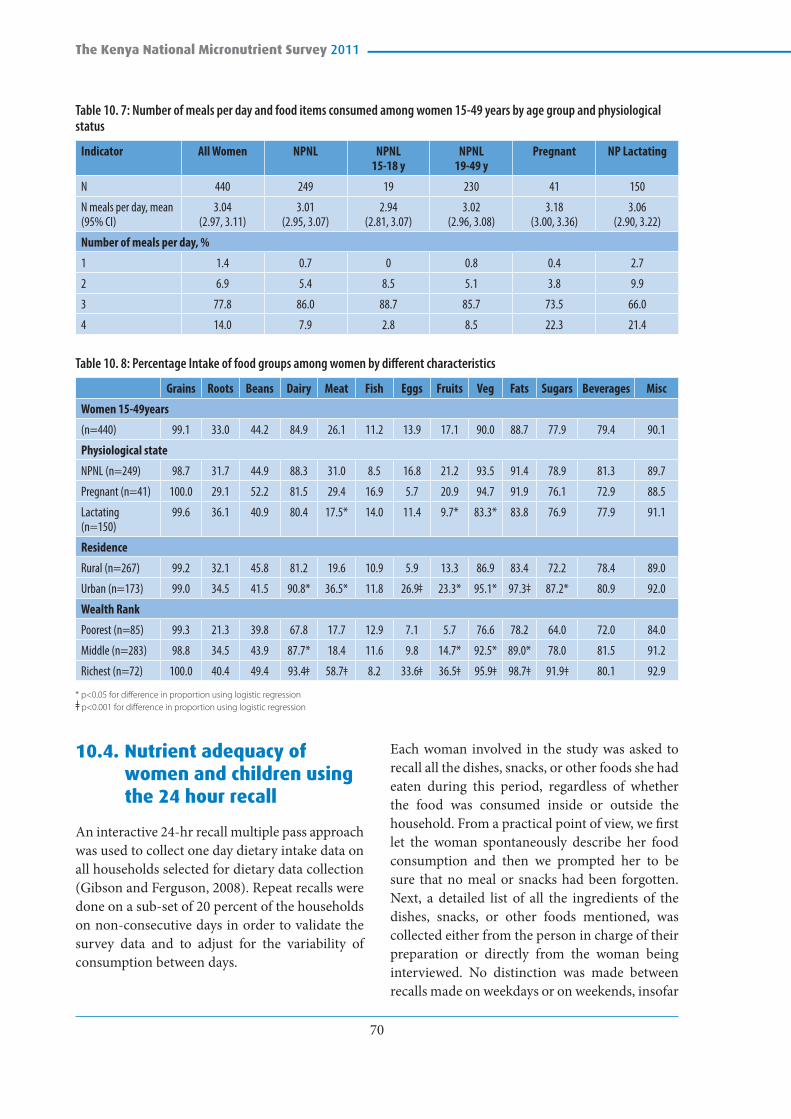
70
The Kenya National Micronutrient Survey 2011
Table 10. 7: Number of meals per day and food items consumed among women 15-49 years by age group and physiological status
Indicator All Women NPNL NPNL 15-18 y
NPNL 19-49 y
Pregnant NP Lactating
N 440 249 19 230 41 150
N meals per day, mean (95% CI)
3.04 (2.97, 3.11)
3.01 (2.95, 3.07)
2.94 (2.81, 3.07)
3.02 (2.96, 3.08)
3.18 (3.00, 3.36)
3.06 (2.90, 3.22)
Number of meals per day, %
1 1.4 0.7 0 0.8 0.4 2.7
2 6.9 5.4 8.5 5.1 3.8 9.9
3 77.8 86.0 88.7 85.7 73.5 66.0
4 14.0 7.9 2.8 8.5 22.3 21.4
Table 10. 8: Percentage Intake of food groups among women by different characteristics
Grains Roots Beans Dairy Meat Fish Eggs Fruits Veg Fats Sugars Beverages Misc
Women 15-49years
(n=440) 99.1 33.0 44.2 84.9 26.1 11.2 13.9 17.1 90.0 88.7 77.9 79.4 90.1
Physiological state
NPNL (n=249) 98.7 31.7 44.9 88.3 31.0 8.5 16.8 21.2 93.5 91.4 78.9 81.3 89.7
Pregnant (n=41) 100.0 29.1 52.2 81.5 29.4 16.9 5.7 20.9 94.7 91.9 76.1 72.9 88.5
Lactating (n=150)
99.6 36.1 40.9 80.4 17.5* 14.0 11.4 9.7* 83.3* 83.8 76.9 77.9 91.1
Residence
Rural (n=267) 99.2 32.1 45.8 81.2 19.6 10.9 5.9 13.3 86.9 83.4 72.2 78.4 89.0
Urban (n=173) 99.0 34.5 41.5 90.8* 36.5* 11.8 26.9 23.3* 95.1* 97.3 87.2* 80.9 92.0
Wealth Rank
Poorest (n=85) 99.3 21.3 39.8 67.8 17.7 12.9 7.1 5.7 76.6 78.2 64.0 72.0 84.0
Middle (n=283) 98.8 34.5 43.9 87.7* 18.4 11.6 9.8 14.7* 92.5* 89.0* 78.0 81.5 91.2
Richest (n=72) 100.0 40.4 49.4 93.4 58.7 8.2 33.6 36.5 95.9 98.7 91.9 80.1 92.9
* p<0.05 for difference in proportion using logistic regression p<0.001 for difference in proportion using logistic regression
10.4. Nutrient adequacy of women and children using the 24 hour recall
An interactive 24-hr recall multiple pass approach was used to collect one day dietary intake data on all households selected for dietary data collection (Gibson and Ferguson, 2008). Repeat recalls were done on a sub-set of 20 percent of the households on non-consecutive days in order to validate the survey data and to adjust for the variability of consumption between days.
Each woman involved in the study was asked to recall all the dishes, snacks, or other foods she had eaten during this period, regardless of whether the food was consumed inside or outside the household. From a practical point of view, we first let the woman spontaneously describe her food consumption and then we prompted her to be sure that no meal or snacks had been forgotten. Next, a detailed list of all the ingredients of the dishes, snacks, or other foods mentioned, was collected either from the person in charge of their preparation or directly from the woman being interviewed. No distinction was made between recalls made on weekdays or on weekends, insofar

71
The Kenya National Micronutrient Survey 2011
as weekends did not have any special importance in the context of our study.
This report focuses on both macro and micro-nutrients of public health concern. The results presented here are for the diets of children (under the age of five years) and All Women of Reproductive Age (WRA) 15-49 years who include Non-pregnant Women (NPW) and Pregnant Women (PW). Analysis for NPW is further presented categorized into Non-pregnant Non Lactating (NPNL) and Non-pregnant Lactating (NPL) women. These analyses are conducted using PC-SIDE (version 1.0, June 2013). PC-SIDE is a software developed to analyse dietary data. Single 24 hour dietary recalls represent individuals’ intakes on single days. Using one 24-hour recall period does not provide an indication of an individual’s habitual diet, but it does provide an assessment of the diet at the population level and can be useful to monitor progress or target interventions (FAO, 2011). However, for the assessment of dietary adequacy we need to know the usual intake of each nutrient, that is, what the average daily intake would be over many days or weeks. To collect 10 or more days of dietary data is usually not feasible. So PC-SIDE performs a statistical manipulation that, in effect, converts the one day distribution of intakes to the distribution of usual intakes – this is done for each nutrient. To do this analysis, a second day of dietary data is required from at least a sub-sample. The software then removes the intra-individual variation (that is, the variation in an individual’s intake from day to day) and leaves the inter-individual variation (that is, the variation between the individuals’ usual intakes). The resulting distribution can only be analysed or interpreted at the group level.
Adult women would be expected to have energy intakes of around 2000 kcals if they have low levels of physical activity, and around 2500 kcals if they have high levels of physical activity. The average nutrient intakes of children and women, calculated using PC-SIDE, are shown in Tables 10-9; 10-10; 10-11; and 10-12. The NPW 15-49 years in our survey had average (SD) energy intakes of 1944(583) Kcal (Table 10-9). This is slightly below what is expected and could be
explained by various factors including some underreporting in the dataset and the drought in the horn of Africa during this period. At the time of data collection, Kenya was in the midst of a severe drought which also affected areas of Ethiopia, Somalia, Djibouti and to a less extent South Sudan, Tanzania, Uganda and Eritrea. The drought affected mainly the arid and semi-arid regions of Kenya. The drought hit Kenya while it was already trying to navigate through economic shocks. The combination of high food and fuel prices may have contributed to reduced ability of the households to access food.The weighted average (SD) energy intakes for children was 12-59months was 1043 (402) Kcals. We did not do a 6-59month weighted average because the younger children (6-11 months) depend heavily on breast milk for their energy needs. Their average (SD) energy intakes was 449(328) Kcals (Table 10-10).
The prevalence of dietary inadequacy of macro and micro-nutrients were determined as the proportion of the population that had usual intakes less than the Estimated Average Requirement (EAR, [Gibson, 2008, WHO and FAO, 2004]) (Appendix 2). Assuming 8 percent bioavailability, the levels of inadequacy for iron were universal (100 percent) for children 6-11months and pregnant women.
10.5. Determinants of variation in energy intake
We tested differences, of energy intake by different independent variables. The factors considered were such as month of interview, enumerator, day of week, residence (urban/rural), wealth quintile, and whether the woman was sick. No differences were found. We then tested a number of interactions, to see if there were any important trends. There were no significant findings. No effect was found on mother’s intake by education level. We then tested protein, fat and all the other micronutrients against wealth quintile. The only one which was related to wealth quintile was fat intake. Fat intake was also found to vary by education, and residence. It is likely that the fat

72
The Kenya National Micronutrient Survey 2011
is from expensive animal source food fat or from eating processed junk food and therefore more available for households classified as wealthy using the wealth quintile classification.
Table 10. 9: Average (SD) energy and macronutrients intake among women
WRA 15-49y Weighted Averages
NPNL 15-18y NPNL 19-49y NPL 19-49y PW 19-49y All NPW 15-49y ALL WRA1
n individuals 19 232 148 38 399 437
n with 2nd 24hr recall 3 49 25 5 77 82
Energy (kcal) 1842(603) 1881(477) 2055(716) 1871(625) 1,944(583) 1,937(586)
Energy intake / BMR or Req2 1.43(0.33) 1.40(0.33) - - 0.9(0.44 ) 0.8(0.42)
Protein (g) 57.5(33.9) 53.6(19.4) 58.3(26.8) 52.5(24.1) 55.5(23.2) 55.3(23.3)
Protein (g / kg body weight) 1.2(0.7) 0.94(0.37) 1.04(0.28) - 1(0.36) 1(0.34)
Lipid (g) 45.6(34.9) 46.3(16.5) 38.5(15.0) 38.0(14.8) 43(17) 43(17)
% Energy from Fat 22.0(10.2) 21.9(5.6) 16.8(5.5) 18.4(27.4) 20.0(5.8 19.9(9.8)
1 Includes pregnant women2 Children - Estimated intakes (kcal / kg/ d) by estimated req (requirements) estimated for adequate growth and moderate activity from FAO, 2001. Expected
average should be around 1, and it does fall between 0.8 (for the 6-11m who are still being breastfed) and 1.2 (for the 36-47m kids). Women -Estimated intakes (kcal / kg/ d) by estimated BMR (basal metabolic rate, estimated by age and body weight.
Table 10. 10: Average (SD) energy and macronutrients intake among children 6-59 months
Children 6-59months Weighted Average
6-11 m 12-23 m 24-35 m 36 -47m 48-59m 12-59m
n individuals 59 70 83 48 22 223
n with 2nd 24hr recall 10 13 12 10 4 39
Energy (kcal) 449(328) 916(291) 1090(419) 1153(446) 1027(525) 1,043(402)
Energy intake / BMR or Req1 0.82(0.64) 1.15(0.37) 1.16(0.40) 1.19(0.48) 0.96(0.52) 1.1(0.42)
Protein (g) 12.7(8.6) 21.8(9.1) 30.2(6.7) 29.4(15.5) 35.8(22.1) 27.9(11.9)
Protein (g / kg body weight) 1.75(1.25) 2.38(1.07) 2.70(0.78) 2.46(1.33) 2.54(0.59) 3(1.00)
Lipid (g) 10.4(7.7) 19.4(9.3) 24.3(17.6) 21.7(7.8) 21.7(11.6) 22(13)
% Energy from Fat 22.3(3.0) 21.1(9.2) 20.1(5.7) 17.0(5.9) 18.5(6.0) 19.6(7.0)
1 Children - Estimated intakes (kcal / kg/ d) by estimated req(requirements) estimated for adequate growth and moderate activity from FAO, 2001. Expected average should be around 1, and it does fall between 0.8 (for the 6-11m who are still being breastfed) and 1.2 (for the 36-47m kids). Women -Estimated intakes (kcal / kg/ d) by estimated BMR (basal metabolic rate, estimated by age and body weight.

73
The Kenya National Micronutrient Survey 2011
Table 10. 11: Average (SD) micronutrients intake among women
WRA 15-49y Weighted Averages
NPNL 15-18y NPNL 19-49y NPL19-49y PW 19-49y All NPW 15-49y ALL WRA1
n individuals 19 232 148 38 399 437
n with 2nd 24hr recall 3 49 25 5 77 82
Calcium (mg) 510(174) 587(225) 599(390) 511(281) 588(295) 581(294)
Iron (mg) 12.6(2.9) 12.0(2.9) 13.38(1.81) 11.8(4.8) 12.6(2.6) 12.5(2.8)
Zinc (mg) 7.5(3.3) 8.1(2.7) 8.31(3.68) 9.2(3.4) 8.1(3.1) 8.2(3.1)
Vitamin A (mcg) 577(957) 750(460) 847(284) 734(485) 778(442) 774(445)
Folate (mcg) 320(138) 275(88) 251(129) 263(194) 268(107) 268(117)
Vitamin B12 (mcg) 1.98(0.93) 2.41(1.98) 2.65(0.81) 3.68(8.72) 2.5(1.6) 2.6( 3.0)
1 Includes pregnant women
Table 10. 12: Average (SD) micronutrients among children 6-59 months
Children 6-59months Weighted Average
6-11 m 12-23 m 24-35 m 36 -47m 48-59m 12-59m
n individuals 59 70 83 48 22 223
n with 2nd 24hr recall 10 13 12 10 4 39
Calcium (mg) 226(197) 361(209) 406(224) 365(362) 478(625) 390(313)
Iron(mg) 2.3(2.4) 4.2(2.4) 6.6(3.1) 9.2(6.6) 8.7(9) 6.6(4.8)
Zinc (mg) 2.1(1.8) 3.6(3.4) 4.8(0.5) 4.8(2.8) 4.9(2.6) 4.4(2.4)
Vitamin A (mcg) 156(189) 326(272) 323(403) 284(255) 376(353) 321(332)
Folate (mcg) 45(54) 91(50) 91(71) 147(103) 161(99) 110(77)
Vitamin B12 (mcg) 0.73(0.75) 1.13(1.02) 2.04(3.58) 0.70(0.95) 1.33(0.80) 1.4(2.3)
Table 10.13: Prevalence of dietary inadequacy of macro and micro-nutrients among women and children
Children 6-59 months WRA 15-49y
6-11 m 12-23 m 24-35 m 36 -47m 48-59m 12-59m NPNL 15-18y
NPNL 19-49y
NPL 19-49y
PW 19-49y
NPW 15-49y
ALL WRA1
n individuals 59 70 83 48 22 223 19 232 148 38 399 437
n with 2nd 24hr recall
10 13 12 10 4 39 3 49 25 5 77 82
% % % % % % % % % % %
Calcium 76 73 76 85 76 100 85 79 85 84 84
Iron* 100% 86 60 47 71 67 89 91 77 100 86 87
Zinc 66% 33 0 11 45 17 5 34 78 60 49 50
Vitamin A 40 52 50 50 48 4 33 62 43 43 43
Folate 78 76 48 58 69 52 73 92 91 79 80
Vitamin B12 42 35 66 40 44 59 52 42 68 48 50
% Energy from fat
84 95 98 87 91 71 39 74 63 54 54
* assuming 8% bioavailability. Assuming 18% bioavailability, the prevalence of dietary inadequacy among NPW is 26% while that among WRA is 32%

74
The Kenya National Micronutrient Survey 2011
10.6. Relationship of dietary and biochemical data
Dietary data intake was collected from a sub sample of the pre-school children and non-pregnant women of reproductive age. Arising from that, a comparison has been made between dietary data and biochemical data in the subsample that had both datasets available. As such, therefore the prevalence will not be similar to what is presented in the chapter 5. We did not expect perfect concordance between the dietary and biochemical data. However, we looked at this relationship to estimate specifically the prevalence of dietary iron inadequacy and prevalence of iron deficiency with the assumption that estimated dietary iron requirements are set at levels intended to prevent an insufficient supply of iron to tissues, and if not met will contribute to iron deficiency and anaemia. From our data, about 100 percent of children 6-11months and 67 percent of all children 12-59months and 87 percent of all WRA7 (32 percent of all WRA recruited in the survey)8 have insufficient dietary iron to meet their needs while about 15.9 percent and 30.7 percent of the children and about 26.0 percent and 24.4 percent women are iron deficient (using appropriate cutoffs for SF and sTfR respectively). The trend between the younger age groups and pregnant women are very similar with non-pregnant women being the most iron inadequate or iron deficient using both categorizations.
10.7. Dietary sources of micronutrients
The first day 24 hour recall data was used to analyse the dietary sources of micronutrients. The sum of four micronutrients (iron, zinc, calcium, vitamin A), as well as energy and lipid, from 11 different food groups (beans, nuts and seeds; beverages; eggs; fats and oils; fruits and fresh/pure fruit juices; grains and grain products; meats, poultry and insects; milk and dairy; sugars and sweets; vegetables; miscellaneous) were
divided by the daily total from all food groups to determine the percentage contribution from each food group. Grains are the leading source of dietary energy (Appendix 3a), and milk and dairy are also important sources in children. Other animal source foods (eggs, meat and insects) contribute less than 5 percent. Grains are also an important source of lipids (Appendix 3b) but fats and oils, and milk and dairy contribute more. Grains are, in fact, important sources of all the micronutrients studied (Appendix 3c-3e) except for vitamin A. Grains are the leading source of iron and zinc, milk and dairy is the leading source of calcium, and vegetables are the leading source of vitamin A.
10.8. Appropriate food fortification vehicles
It was also the objective of this survey to identify foods ideal for food fortification. Food fortification is an effective means of increasing micronutrient intake at relatively low cost, and is practiced with many foods in many countries. Kenya currently has ongoing or planned fortification of salt, wheat flour, vegetable oil and maize meal, but there is scope for improvement of their fortification program. The data from the 24 hour dietary recall are a source of information to identify suitable fortification vehicles. Suitable vehicles have certain production and distribution characteristics (e.g., fortification with needed micronutrients is technically feasible, the production and distribution of the food is relatively centralized), but these cannot be assessed with dietary recall data. With the recall data, assessment of two key characteristics is possible.
1. Regularity of consumption: The food to be fortified needs to be consumed regularly (daily) by a high percentage of the target population;
2. Range of consumption levels: Ideally, the usual distribution of intakes is relatively narrow, so that fortification levels can be
7 Assuming 8% bioavailability8 Assuming 18% bioavailability

75
The Kenya National Micronutrient Survey 2011
set that will be sufficient for the low-end consumer, but not excessive for the high end consumer.
In this chapter the foods we considered from the dietary data were: Maize Flour, Wheat Flour, Sugar, Oil, Salt, Wheat flour products, Vegetable Fats, Royco® Cubes, Powder Milk, Tea, and Milk. The first five foods (the flours, sugar, oil and salt) are also considered in the next chapter which compares the intake estimates from the 24 hour recall data to the estimates from household usage questions, to determine if the two types of questions yield similar information for use in fortification program monitoring. The list of specific food items included in each of the foods tested are listed in Appendix 4. Even a food as apparently standard or homogenous as table salt was recorded as 11 separate, specific food items. These foods are all combined into a single “food” without regards to the individual differences (e.g. salt includes non-iodized salt, iodized salt, and sea salt).
For each food, the average, standard deviation and median of consumption (grams per day) and the percent of individuals who consumed the food on one observed day are calculated. Subgroup analyses are somewhat limited by small sample-sizes but nonetheless they were carried out and presented by area of residence (rural or urban) and by wealth quintile (only the first, third and fifth quintiles are shown).
10.9. Maize and wheat flour, sugar, oil, salt, cow’s milk
The findings indicate that maize flour, sugar, salt and cow’s milk were widely consumed. Maize appeared in the recall data of more than 80 percent of most age groups and in amounts proportionate to age compared to wheat flour which was less widely consumed, appearing in the recall data of at most 31 percent of individuals
in any age groups, and amounts were not directly proportionate to age (older children had similar intakes to younger adults). There are minor differences between urban and rural consumers and there were slightly fewer maize flour than wheat flour consumers in the highest wealth quintile. Wheat flour was consumed on more days in urban areas than rural areas. However, almost 50 percent of older children and women had wheat flour on at least one day. The variation in wheat flour intake per day was even larger than for maize flour, with the standard deviation being more than double the mean in most age groups. For those with repeat observations only about 10 percent did not consume maize flour on at least one day. The first and second day amounts were correlated in consumers9. The variation in maize flour intake per day was large, with the standard deviation being close to the mean in most age groups.
Sugar and salt were both widely consumed. Sugar appeared in more than 70 percent of the days and in amounts roughly proportionate to age. Salt was consumed by about 90 percent of adults, and two-thirds of children and the amounts were greater in adults than children. Salt consumption appears similar between urban and rural areas compared to sugar where urban individuals consumed more sugar than rural. The consumers in the poorest wealth quintile consumed less sugar, but still more than 60 percent took sugar. For those with repeat observations about 20 percent did not consume sugar on at least one day. The first and second day amounts were highly correlated in consumers. The standard deviation was approximately equal to the mean in most age groups. While there were some differences by wealth quintile in salt consumption, it was high (>70 percent) in almost all groups.
Cow’s milk was consumed by more than two-thirds of all age groups, with amounts greater than 200 grams per day in most age groups.
9 Note that a correlation between days is not necessarily desirable. If the correlation is truly 0, then over the long term, individual intakes would equal the group average intake. Fortification decisions can be made based on the average daily intake (which is an easier quantity to measure through surveys) and not be concerned about possible excessive intakes in the high end consumers.

76
The Kenya National Micronutrient Survey 2011
However, the percentage of milk consumers in urban areas is much higher than rural, and much higher in individuals in the wealthiest quintile. The poorest quintile has about two-thirds as many consumers as the wealthiest quintile. Most of the individuals who consumed milk on the first day of observation also consumed it on the second day, and the amounts consumed on the two days were correlated.
Milk could be a suitable food for fortification. It is consumed in higher amounts in wealthier households, but it would still reach at least half of the poorest individuals.
Summary
The consumption levels of twelve foods were evaluated for suitability for fortification. Five foods (wheat flour products, vegetable fats, Royco® cubes, powder milk, and tea) were dismissed from consideration because of low consumption levels. Seven other foods were evaluated in more detail, summarized in Table 10- 14. Maize flour and salt are excellent candidates for fortification. Sugar could be a good candidate, but, if fortified, care would be needed in implementation and promotion, as it would be unwise to promote greater consumption of sugar due to other health risks of excessive sugar consumption. Cow’s milk has the consumption pattern that would be suitable for fortification, but since most of the cow’s milk
in rural areas is consumed unprocessed, it would be difficult to incorporate milk in to a large scale, centralized, fortification program. Overall, higher consumption of the selected foods is seen in populations with highest wealth quintile.
Table 10. 14: Of consumption levels of food candidates for fortification
Consumed by at least:
Food Two-thirds of all
adults and children1Half of rural
residentsHalf of lowest
wealth quintile
% women who consumed on at
least 1 dayRecommended for
fortification?
Maize Flour Yes Yes Yes 87% Yes
Wheat Flour No No No 47% No
Sugar Yes Yes Yes 80% Maybe
Oil No No No 69% No
Salt Yes Yes Yes 92% Yes
Cow’s Milk Yes Yes Yes 83% Maybe
1 Not including children 0 to 1 years.
10.10. Validation of HCES as a tool for monitoring food fortification programs
While food fortification can be an effective means of increasing micronutrient intake at relatively low cost, it is relatively difficult to identify suitable foods for fortification (“vehicles”) and to monitor the consumption of the vehicle. Conducting regular 24 hour dietary recalls is prohibitively expensive and so alternative methods are being sought and tested. One idea has to been to use “Household Consumption and Expenditure Surveys” (HCES) which are routinely collected in many countries and which measure the purchase of foods, among other things (Lividini et al., 2013).
Within the KNMS, data were collected on the purchase of five foods – maize flour, wheat flour, sugar, salt and oil/fat – which would be similar to the data that are collected in HCES. This allows for the direct comparison of the data collected with 24 hour recalls and with HCES-like questions to see if HCES data are valid at estimating individual

77
The Kenya National Micronutrient Survey 2011
intakes of the fortified foods. For each of the five foods, the respondent was asked how many grams or kilograms of the food the household used per month or per day (salt was somewhat different – see below). They were asked to respond in one of four different categories, and the midpoint of these categories was used as an estimate to calculate the daily household consumption of the food – see Table 10-15.
With salt, the households were asked the quantity of salt they usually purchase, and the frequency of purchase. The range of responses is shown in Table 10- 16. The frequency was divided by the estimated number of days between purchase to estimate the daily usage, show in Table 10-17.
Table 10. 15: Questions asked in household survey about quantity of consumption of maize flour, wheat flour, sugar and oil, the categories of answers for each food, and the amount used for each category in calculation of daily intakes. The final column shows the percent
MAIZE FLOUR WHEAT FLOUR
How many Kg of maize flour does your family use daily? (on an average)
How many Kg of wheat flour does your family use daily? (on an average)
Response Category
Range on Questionnaire (kg/day)
Used in Calculation
% HH in category
Range on Questionnaire (kg/month)
Used in Calculation
% HH in category
0 < 1 kg 500g 35 < 0.5 kg 250 g 4
1 1 to <2 kg 1500g 42 0.5 to < 1 kg 750 g 9
2 2 to <3 kg 2500g 12 1 to <2 kg 1500 g 16
3 3 to <4 kg 3500g 4 2 to < 3 kg 2500g 13
4 4+ kg 4500g 2 3+ kg 3500g 25
missing . 0 5 . 0 33
SUGAR OIL/FAT
How many grams of sugar does your household consume monthly?
How many grams of oil/fat does your family use daily? (on average)
Response Category
Range on Questionnaire (g/ month)
Used in Calculation
% HH in category
Range on Questionnaire (g per day)
Used in Calculation
% HH in category
0 < 0.25 kg 125 1 < 10 g 5 17
1 0.25to<0.5kg 375 3 20 - 30 g 25 44
2 0.5 to < 1 kg 750 6 30 - 50 g 40 22
3 1 to < 2 kg 1500 20 50 - 100 g 75 7
4 2+ kg 2500 57 50 - 100 g 150 6
missing . 0 13 . 0 4

78
The Kenya National Micronutrient Survey 2011
Table 10. 16: Quantity of salt usually purchased, and frequency of salt purchase in households
SALT QUANTITY
Response Category Range on Questionnaire (g per day)
Used in Calculation % HH in category
1 < 100 g 50 3.2
2 100 to 250 g 175 27.0
3 250 g to 500 g 375 32.8
4 500 g to 1 kg 750 19.3
5 1+ kg 1250 14.8
missing . 0 2.9
SALT PURCHASE FREQUENCY
Response Category Range on Questionnaire (g per day)
Divide quantity by this to get daily use
% HH in category
0 < once a month 15 41.6
1 once a month 30 39.2
2 once in 2 to < 3 months 75 14.9
3 once in 4 to < 6 months 150 2.5
7 other na 1.8
missing . 0 n=90
Table 10. 17: Estimated consumption of salt per day
Calculated amount (g) used per day per HH
% HH in each category
0.0 3.8
0.7 0.2
1.2 0.3
1.7 1.0
2.3 1.6
2.5 0.5
3.3 2.1
5.0 3.8
5.8 7.9
8.3 1.3
10.0 3.8
11.7 16.7
12.5 13.1
16.7 5.7
25.0 25.4
41.7 6.5
50.0 5.0
83.3 1.5
missing n=42
Comparison of HCES and 24 hour recall estimates
There are a number of parameters of food consumption that an ideal food fortification monitoring tool would be able to measure accurately. These parameters are listed in Table 10- 18 and the ability of 24 hour dietary recalls and HCES to estimate those parameters are described. Also, the expectations of a comparison of each tools’ estimates for each of the parameters is described in the right-most column.

79
The Kenya National Micronutrient Survey 2011
Table 10. 18: Five parameters that an ideal monitoring tool could measure, the ability of 24 hour dietary recalls and HCES to measure these parameters, and the meaning of this for tool validation
Parameter 24 hour recall HCES Expectations of the comparison of 24 hour recall and HCES for the purposes of tool validation.
Average daily intake of food by different age groups
The average can be estimated.
The average can be estimated, but distribution within household is assumed to be proportionate to energy requirements.
If both tools are accurate, then the averages should be the same.
Variation in usual daily intake (not variation on a single day)
With single day of data the variation in usual intake would be overestimated, because it includes intra-individual (between day) variation.
Yes, variation in usual intake is estimated, because intra-individual (between day) variation is zero, due to the nature of the tool.
Since a single 24 hour recall includes both intra- and inter-individual variation, and the HCES only includes inter-individual variation, the variation in the HCES should be larger.
Maximum one day intakes by individuals in each age group
While the true maximum cannot be accurately estimated, a high percentile (e.g. 95th percentile) can be reasonably estimated
Without knowing the intra-household distribution of the food, the maximum cannot be reasonably estimated. Crude assumptions (e.g. all the food purchased by household eaten by one person) could be carried out, but are not of practical value.
A comparison would not be meaningful.
Percentage of individuals who never consume food
The percentage cannot be estimated from a single or few days of data. Individuals who do not eat a food on the observed day may eat it on subsequent days.
It is assumed that intra-household distribution is proportionate to requirements, and therefore it is assumed that if the household uses the food all individuals are consumers. However, if the household does not purchase or use the food, then it is reasonable to assume that all individuals in the household are non-consumers.
The estimates of non-consumers with both tools are highly error prone. The 24 hour recall would overestimate and the HCES would under-estimate non-consumers. The two methods together may provide high and low limits around the true rate of non-consumption, but a comparison of the results yielded by the two methods would not be meaningful for tool validation.
Intra-household distribution
The distribution can be estimated
The real intra-household distribution is not measured. Estimating the distribution is simply describing the variation in energy requirements within the household.
A comparison would not be meaningful.
Considering these points, we now compare the 24 hour recall data and the HCES in their estimates of average intakes, and variation in intakes, for maize flour, wheat flour, sugar, oil and salt.
Maize flour
While the HCES provides an estimate for every member of the household (indeed it is necessary to estimate the intake of every household member so that the food purchased by the house is proportionately distributed), the 24 hour dietary recall provided estimates for only children and adult women. The HCES estimated intakes of approximately double the 24 hour recalls.
The calculations were also done by residence (rural and urban) and by wealth quintile. The relative differences are calculated as the ratio of intake estimates in grams per day for HCES divided by the estimates for 24 hour recalls (Relative difference = (HCES / 24 hr ). Clearly for all age groups and all subgroups, the HCES estimates higher intakes than the 24 hour recall, by only a small amount for the poorest quintile adults, to four times or more for the highest quintile children. Note that the biggest relative difference is for the youngest children. Dietary intakes are notoriously difficult to measure in young children. However, even in the older groups the difference is still usually more than two-fold. R ecall in Chapter 6 where it was demonstrated that dietary intakes were usually underreported

80
The Kenya National Micronutrient Survey 2011
in the 24 hour recall by some unknown amount. When these findings are re-calculated assuming that the 24 hour recall data were underestimated by one-third (that is, the 24 hour recall estimated intakes were multiplied by 1.5). While this brings the two estimates closer together, they are still farther apart to use the two tools interchangeably to estimate maize flour intake.
While the estimates of absolute intake are significantly different, the tools ranked the age groups similarly with most rankings from highest to lowest being identical between the two tools, or off by a rank of 1 or 2.
Finally, the standard deviation (SD) in maize flour intakes generated using the two methods were compared. Interestingly, and unexpectedly, the methods generated SDs that were relatively similar. The SDs of the tools represents different parameters. For the HCES it is the SD of usual intake, which should be relatively narrow.
For the 24 hour recalls, it is the SD of one day intakes, which should be relatively broad. But for the entire sample, and even more so for rural populations and the poorest wealth quintile, the SDs are within 20 percent of each other. This may simply be a function of the high (over) estimates of the HCES leading to inflated SDs, and the low (under) estimates of the 24 hour recall averages leading to depressed SDs, which somewhat balances out the inherent differences that come from being variation in usual (for HCES) or one day (for 24 hour recall) intake estimates.
Salt
The average intakes of salt for the different age groups are shown in Figure 10- 1. Unlike with wheat flour, the HCES did not always estimate greater intakes than the 24 hour recalls. With the exception of the adolescent females, the two tools match estimates quite closely.
Figure 10. 1: The intake of salt (grams per day) as estimated by the HCES-like questions in the household survey and by the 24 hour dietary recalls for different age groups (age boundaries of group shown in horizontal axis labels, M is for males and F for females).
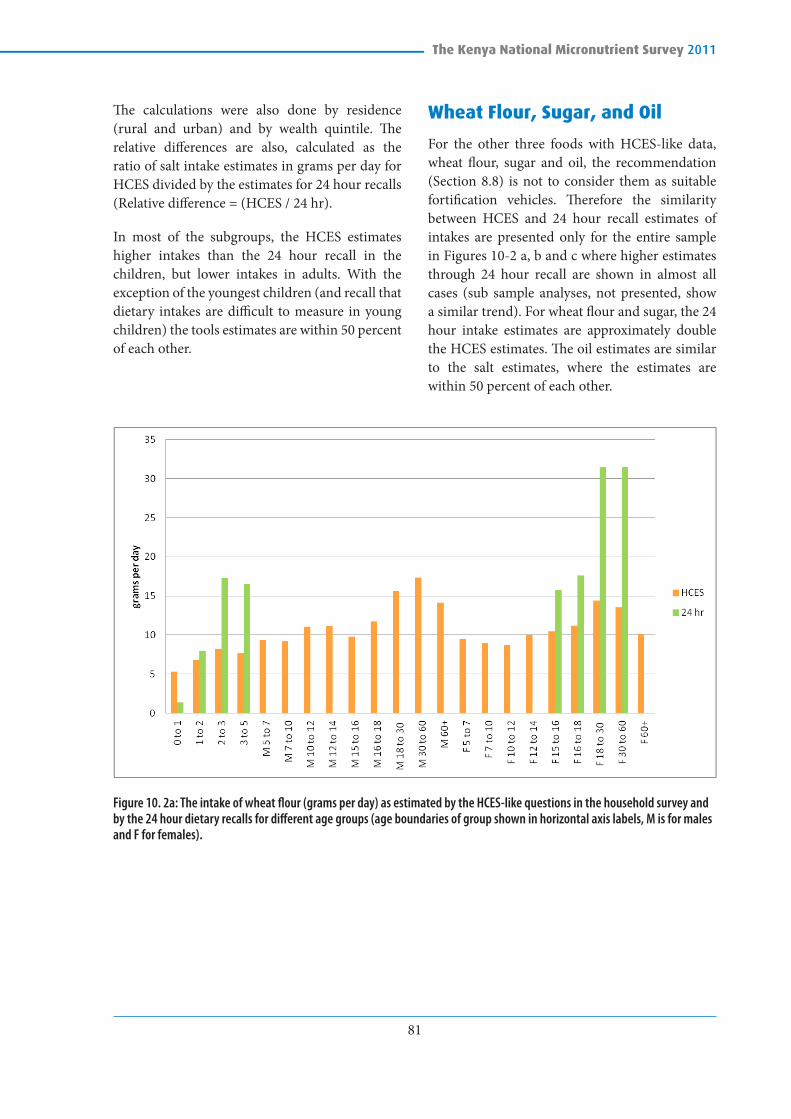
81
The Kenya National Micronutrient Survey 2011
The calculations were also done by residence (rural and urban) and by wealth quintile. The relative differences are also, calculated as the ratio of salt intake estimates in grams per day for HCES divided by the estimates for 24 hour recalls (Relative difference = (HCES / 24 hr).
In most of the subgroups, the HCES estimates higher intakes than the 24 hour recall in the children, but lower intakes in adults. With the exception of the youngest children (and recall that dietary intakes are difficult to measure in young children) the tools estimates are within 50 percent of each other.
Wheat Flour, Sugar, and Oil
For the other three foods with HCES-like data, wheat flour, sugar and oil, the recommendation (Section 8.8) is not to consider them as suitable fortification vehicles. Therefore the similarity between HCES and 24 hour recall estimates of intakes are presented only for the entire sample in Figures 10-2 a, b and c where higher estimates through 24 hour recall are shown in almost all cases (sub sample analyses, not presented, show a similar trend). For wheat flour and sugar, the 24 hour intake estimates are approximately double the HCES estimates. The oil estimates are similar to the salt estimates, where the estimates are within 50 percent of each other.
Figure 10. 2a: The intake of wheat flour (grams per day) as estimated by the HCES-like questions in the household survey and by the 24 hour dietary recalls for different age groups (age boundaries of group shown in horizontal axis labels, M is for males and F for females).

82
The Kenya National Micronutrient Survey 2011
Figure 10. 2b: The intake of sugar (grams per day) as estimated by the HCES-like questions in the household survey and by the 24 hour dietary recalls for different age groups (age boundaries of group shown in horizontal axis labels, M is for males and F for females).
Figure 10. 2c The intake of oil (grams per day) as estimated by the HCES-like questions in the household survey and by the 24 hour dietary recalls for different age groups (age boundaries of group shown in horizontal axis labels, M is for males and F for females). In the case of oil, the 24 hour recall intakes are calculated for oil only, and oil plus vegetable fat.

83
The Kenya National Micronutrient Survey 2011
Table 10. 19: Summary of the comparisons between the intake estimates from HCES and 24 hour dietary recall for maize flour, salt, wheat flour, sugar and oil.
FoodEstimates1 within
50%?Tool yielding
higher estimate Units of question2
Scale of answer
In possible responses on
q’airre in calculated g/d
Maize flour No HCES kg / day kg Hundreds
Salt Yes na g / day g Ones
Wheat flour No 24 hour kg / day kg Tens
Sugar No 24 hour g / month kg Tens
Oil/Fat Yes na g / day g to kg Ones to Tens
1 For purposes here consider only the older children (2 to 3 and 3 to 5 years) and older adults (18 to 30 and 30 to 60 years). The diets of younger children are very difficult to assess, and the younger adults had a small sample size.
2 The units used when conducting the questionnaire, for example “How many Kg of maize flour does your family use daily? (on an average)”.

84
The Kenya National Micronutrient Survey 2011
CHAPTER ELEVEN: CONCLUSIONS AND RECOMMENDATIONS
11.1 Conclusions
Nationally, malnutrition remains a problem. According to WHO classification of severity of malnutrition among children under five, stunting wasting and underweight reported in this survey are classified at medium level of severity. These results together with the recent results from the KDHS 2014 show that Kenya met the Millennium development Goal for underweight of 11 percent. However, MDG target for wasting and stunting were not met. The stunting, underweight and wasting pattern of malnutrition identified the male children at higher risk of malnutrition. Among non-pregnant women, the average BMI was within normal (18.5-24.9) and was higher in urban non-pregnant women compared to their rural counterparts. Obesity (BMI>30) was higher in urban non-pregnant women. Mean BMI was higher in men living in urban areas compared to the rural male population. There was little variability between the thinness of pregnant women residing in rural areas compared to those in urban areas.
According to the World Health Organization (WHO) classification, anaemia in pregnant women is of severe public health significance, while in preschool children and non pregnant women anaemia is of moderate public health significance. In school age children and men, anaemia is of mild public health significance. There is a significant reduction in anaemia prevalence in all the age groups from the previous national micronutrient survey conducted in 1999. In preschool and school age children, there has been a significant reduction in anaemia as noted in Kenya Malaria Indicator Survey of 2010 to 2011 Kenya National Micronutrient Survey.
Factors found to have an effect on anaemia in preschool children include age, where young
children were found to be more affected than older children, low wealth quintile, low level of education of household head, and in-adequate intake of iron. Residence is an important factor for anaemia in school age children, pregnant women and non pregnant women. Rural residence was found to be a risk factor for anaemia in all these age groups. Living in low wealth quintile households and households with household heads of levels of education is a risk factor to anaemia in school age children. Anaemia among non-pregnant women is associated with old age, low level of education and presence of thalassaemia.
Vitamin A deficiency was highest among preschool children (PSC) than in school age children (SAC). In SAC, the main factors associated with VAD were age, level of education, and wealth while area of residence and sex did not have a significant different in this age group. Among pregnant women, VAD (including marginal) was higher in those residing in urban areas. Age and residence were significantly associated with VAD among non-pregnant women. VAD in men was almost non-existent. Based on the 2011 KNMS, VAD is a problem of mild public health concern in Kenya.
The findings from this survey clearly indicate that more than half of the salts found in households was not adequately iodized going by the Kenyan standard (30-50 ppm) of iodized salt at the household. All the major salts in the market or as found at the households indicate that the population is exposed to both inadequately and overly iodized salts. The distribution of these salt brands is in equal measures in rural and urban areas. It is also noted that a considerable population 25.2 percent of the population has presentation of iodine deficiency going by the urinary Iodine levels in this survey. The pattern of iodine deficiency is similar in both school age children and non-pregnant women. The prevalence of the

85
The Kenya National Micronutrient Survey 2011
deficiencies is similar in children (22.1 percent) and non-pregnant women (25.6 percent). In both populations, the deficiencies are higher in the rural areas than in urban areas. However it’s important to note that the deficiencies are high in female children. This pattern presents a uniform distribution of the challenges in school age children and non-pregnant women that need to be addressed.
Within the context of the findings of this survey, the prevalence of zinc deficiency across all the groups suggest a higher zinc deficiency than in 1999. In 1999, approximately half of the children, women and men (50%, 52% and 46% respectively) had serum zinc levels below 65 µg/dL (Mwaniki et al, 1999). This high prevalence of zinc deficiency is way above the 20% prevalence cut-off to raise a public health concern. These findings are very similar to those reported in Cameroon in 2014 where 82% of the women and and 83% of children aged 12-59 months respectively had low adjusted plasma zinc concentration (Engle-Stone et al, 2014). The results suggest that a concerted effort is needed in the country to improve the zinc nutrition. Due to the sensitive nature of plasma zinc measurement, it may be important to conduct smaller validation studies to inform policy and programming around zinc interventions.
The folate and B12 results from the KNMS are the first nationally representative data for both folate and B12 deficiencies in Kenya. Prevalence of folate deficiency in pregnant and non pregnant women was found to be almost the same. This compared closely with studies done in India and Venezuela. The prevalence of B12 deficiency was found to be different between pregnant and non pregnant women. Generally the prevalence of vitamin B12 deficiency is much low than that reported in India and Venezuela. Urban residence was found to be associated with folate deficiency in non pregnant women. Young age and low level of education were also found to be associated with folate deficiency in non pregnant women.
This study had a component to validate the use of HCES as a tool for monitoring the intake of food fortification vehicles. However, the results are too
inconsistent to draw a firm conclusion. Two of the five foods had relatively similar estimates, two of the foods had higher estimates from the 24 hour recalls and maize flour had higher estimates from the HCES. The units of the questions were different between the foods, with a mix of grams and kg, and per day and per month. The two foods with the most similar estimates, salt and oil/fat, were those foods consumed in the smallest amounts. The reason for this is unclear. Perhaps the respondents were better able to judge the amounts that they used when they were small amounts – such as teaspoons of salt or oil added to the pot, rather than the large handfuls or ladles in the case of the flours. Or perhaps the containers that the salt and oil come in have clearly marked quantities, and the flours do not – or some other such reason. This is mere speculation and qualitative research would be required to determine the real reason for the differences between the estimates for the different foods. In conclusion, with this analysis the HCES has not been validated and it is difficult to conclude that the HCES is not necessarily less valid than the 24 hour recall given that typically we know that 24 hr recalls have been associated with underestimation of food intakes.
11.2 Recommendations
Stunting, a chronic form of malnutrition, has multiple causes. Concerted multi-sectoral effort will be required to meet WHA targets though the country has been on course to meet the targets. Kenya is also facing double burden of malnutrition as observed in this survey. Over-nutrition is a risk factor for non-communicable diseases which lead to high health care costs and poor quality of life. There is need to come up with workable strategies to address over nutrition especially in the urban areas where higher prevalence of over nutrition has been observed. There is need for enhanced implementation and scaling up of prevention and control strategies for obesity and associated comorbidities in Kenya.
The KNMS 2011 has revealed the importance of anaemia and the progress made in the reduction of anaemia prevalence in Kenya. The role of

86
The Kenya National Micronutrient Survey 2011
factors other than iron deficiency in development of anaemia has been underestimated in the past, largely because anaemia has, for a long time, been confused with iron deficiency anaemia. This has influenced the development of strategies and programmes designed to control anaemia, with less emphasis paid on control and prevention of iron deficiency, a major cause of anaemia. Building on to the successes achieved so far, attention should now be directed to addressing all causes of anaemia and implementing them to scale. The priority target population is pregnant women who were the most affected followed by preschool children and non pregnant women. Attention to the social determinants of anaemia is necessary. Looking at the findings of VAD, it may be useful to the population for government to intensify available intervention to continuously prevent VAD and reverse the marginal VAD levels to normal.
There is a need to be concerned about the 25.6 percent of the population that had mild and moderate iodine deficiency. At this point it’s important to note that based on previous studies done on iodine in early years spanning from 1965, 1978, 1989 seem to point deficiency of iodine in the same regions in the country as found in this survey. This is an indication of concerns that need further interrogation. The survey findings showed wide ranges in iodized salt across different brands. The recommendation for more effort in getting salt producers to adequately iodize salt has been addressed by ministry of health with support from partners, a process that is ongoing. Regional assessments are urgently needed to identify endemic areas of iodine deficiencies to identify causes. Since there is knowledge that cruciferous vegetables like cabbage, kale, cauliflower, broccoli, turnips, and rapeseed contain glucosinolates compete with iodine for uptake by the thyroid, further studies are needed to identify if these foods have a role in thyroid deficiencies in certain regions.
Importance of folate in pregnant women cannot be re-emphasised in prevention neural tubal defects. For it to be effective, the body stores should be adequate before and in the early stages of pregnancy. The reason being, neural tubal defect occur within the first 28 days of pregnancy. B12 together with folate is important in prevention of megaloblastic anaemia. The high prevalence of low serum zinc concentrations in this report compared to the 1999 National Survey is still indicative of the need for concerted efforts in addressing the problem of zinc deficiency in Kenya.
High salt and sugar consumption in the population calls for urgent public health actions and policy actions to mitigate this trend amid the knowledge that high consumption of salt and sugar is one of the contributon factors for increased non communicable diseases. There is a need for programmatic interventions to reverse the trends.
It is recognized the Ministry of Health has commited itself to improve the nutrition situation in Kenya as defined in National Nutrtion Action Plan 2012-2017. However together with partners in the sector there is need to scale up high impact nutrition interventions with a focus on micronutrients. Diferent approaches should be employed. These include;
1. Continued promotion of exclusive breastfeeding and implementation of the Breast Milk Substitute act. This has been the gold standard in promotion of optimal growth, prevention and management of magement of malnutrition.
2. Food based interventions such as diet diversifications and modification. This may be addressed together with other nutrition sensitive intervention under agriculture sector such as promotion of kitchen gardens and promotion of locally available underutized foods.

87
The Kenya National Micronutrient Survey 2011
3. Promotion and scaling up fortification of staples with micronutrients such as iron and zinc. As well as promotion and scaling up home fortification especially among children 6-23 months using multiple micronutrient powders.
4. Scale up of micronutrient supplementaion such as vitamin A in children below five years and iron/folic acid in women. In all women of reproductive age, it may be important to explore the possibility of implementing the WHO recommendation of weekly IFA supplementation.
5. Public health measures which deals with factors which predespose population to manutrition. These includes; deworming, hygienic practises such as hand washing, use of ITNs
6. Other nutrition sensitive interventions that would improve the economic levels of the households e.g. livelihoods promotion, agricultural based programs, poverty alleviation and income generating approaches such as; conditional cash transfers, micro-credit facilities and agriculture/home food production such as kitchen gardens.

88
The Kenya National Micronutrient Survey 2011
References
1. Abuya BA., CieraJM., Kimani-Murage E. (2012) Effect of mother’s education on child’s nutritional status in the slums of Nairobi. BMC Pediatrics;12:80
2. Ajani, S.R., (2010). An Assessment of Dietary Diversity in Six Nigerian States. 13, p.161–167.
3. Ali AT, Crowther NJ, (2009) Factors predisposing to obesity: a review of the literature. Journal of Endocrinology, Metabolism and Diabetes of South Africa Vol 14, No 2
4. Anderson M., Karumbunathan V., and Z. M. B. (2012). Global iodine status in 2011 and trends over the past decade. The Journal of Nutrition 744–751.
5. Assefa, N., Berhane, Y. & Worku, A., (2012). Wealth status, mid upper arm circumference (MUAC) and antenatal care (ANC) are determinants for low birth weight in Kersa, Ethiopia. PloS one, 7(6), pp 39957.
6. Barclay GP., (1971). Sickle cell anaemia in Zambia. Transactions of the Royal Society of Tropical Medicine & Hygiene, (4) (65)p. 529-30
7. Benoist, B. De & Clugston, G., (2002). Editorial Eliminating iodine deficiency disorders, 80(02).
8. Bhutta ZA1, Ahmed T, Black RE, Cousens S, Dewey K, Giugliani E, Haider BA, Kirkwood B, Morris SS, Sachdev HP, Shekar M; (2008). What works? Interventions for maternal and child undernutrition and survival. Lancet, 371(9610),p.417–40.
9. Black, R. E., Victora, C. G., Walker, S. P., Bhutta, Z. A., Christian, P., Onis, M. De, & Ezzati, M. (2013). Maternal and Child Nutrition 1 Maternal and child undernutrition and overweight in low-income and middle-income countries. The Lancet, (382), 427–451. http://doi.org/10.1016/S0140-6736(13)60937
10. Blanchard, S. A. (2009). Variables associated with obesity among African-American women in Omaha. American Journal of Occupational Therapy, 63, 58–68.
11. Brito A1, Hertrampf E, Olivares M, Gaitán D, Sánchez H, Allen LH, Uauy R (2012). Folate, vitamin B12 and human health. Rev Médica Chile 2012;140:1464
12. Brown KH, Rivera JA, Bhutta Z, Gibson RS, King JC, Lönnerdal B, Ruel MT, Sandström B, Wasantwisut E, Hotz C. (2004) International Zinc Nutrition Consultative Group (IZiNCG) technical document #1. Assessment of the risk of zinc deficiency in populations and options for its control. Food Nutr Bull,; 25:S94-S203.
13. Butler SE, Muok EM, Montgomery (2012). Mechanism of anemia in Schistosoma mansoni-infected school children in Western Kenya. Am J Trop Med Hyg.; 87:862–867
14. Bohdal, M., Gibbs, N.E. an d Simmons W.K (1968) Nutrition Survey and Campaign Against Malnutrition in Kenya, 1964-1968 Report to the Ministry of Health of Kenya, Nairobi, 1968.

89
The Kenya National Micronutrient Survey 2011
15. Campbell, N. R. C., Correa-rotter, R., Cappuccio, F. P., Webster, J., Lackland, D. T., Neal, B., … Macgregor, G. A. (2015). Proposed Nomenclature for Salt Intake and for Reductions in Dietary Salt, 247–251.
16. Christianson AL., Christopher P. Howson, Bernadette M.,(2006) March of Dimes Birth Defects Foundation White Plains, the hidden toll of dying and disabled White Plains, New York
17. Cotta RM., Oliveira FCC., Magalhães KA., Ribeiro AQ., Luciana FR., Priore SE., Franceschini SCC., (2011). Social and biological determinants of iron deficiency anemia. Cadernos de Saúde Pública, Rio de Janeiro, 27(2)p.309-S32
18. Dary, O., (2009). Nutritional interpretation of folic acid interventions. Nutrition reviews, 67(4), p.235–44.
19. Dror D.K, Allen L.H, (2008). Effect of vitamin B 12 deficiency on neurodevelopment in infants: current knowledge and possible mechanisms. Nutrition Reviews 66 (5)p. 250–255
20. Engle-Stone R, Haskell MJ, Ndjebayi AO, Nankap M, Erhardt JG, Gimou MM, Brown KH (2011) Plasma retinol-binding protein predicts plasma retinol concentration in both infected and uninfected Cameroonian women and children. Journal of Nutrition; 141: 2233–41
21. Erhardt, J.G., Estes J.E.,. Pfeiffer, C.M Hans., Biesalski K., Craft N.E., (2004). Combined Measurement of Ferritin, Soluble Transferrin Receptor, Retinol Binding Protein, and C-Reactive Protein by an Inexpensive, Sensitive, and Simple Sandwich Enzyme-Linked Immunosorbent Assay Technique. The Journal of Nutrition. 134(11)p.3127-3132.
22. FANTA, (2006). Developing and validating simple indicators of dietary quality and energy intake of infants and young children in developing countries: Additional analysis of 10 data sets. The Food and Nutrition Technical Assistance (FANTA) Project. Washington: Academy of Educational Development.
23. FAO, (2011). Thompson B and Amoroso L. (Editors). Combating Micronutrient Deficiencies: Food-based Approaches .FAO and CABI International.
24. Finucane MM, Stevens GA, Cowan MJ, Danaei G, Lin JK, Paciorek CJ, Singh GM, Gutierrez HR, Lu Y, Bahalim AN, Farzadfar F, Riley LM, Ezzati M; (2011) National, regional, and global trends in body-mass index since 1980: systematic analysis of health examination surveys and epidemiological studies with 960 country-years and9•1millionparticipants. Lancet,377(9765), p.557–67.
25. Fomovska A, McDade, T., Sharon W., Tessler L.S. (2008). Blood Spot Measurement of Hemoglobin in Wave I of the National Social Life Health & Aging Project. The National Social Life, Health & Aging Project (NSHAP), University of Chicago.
26. Gamble MV, Ramakrishnan R, Palafox NA, Briand K, Berglund L, Blaner WS.(2001) Retinol binding protein as a surrogate measure for serum retinol: studies in vitamin A-deficient children from the Republic of the Marshall Islands. Am J Clin Nutr. Mar;73(3):594-601.
27. Garenne, Michel. (2011). Trends in Nutritional Status of Adult Women in Sub-Saharan Africa. DHS Comparative Reports No. 27. Calverton, Maryland, USA: ICF Macro.

90
The Kenya National Micronutrient Survey 2011
28. Gibson, R.S and Ferguson, E.L. (2008). An interactive 24-hour recall for assessing the adequacy of iron and zinc intakes in developing countries. HarvestPlus Technical Monograph 8. Washington DC and Cali: International Food Policy Research Institute (IFPRI) and International Center for Tropical Agriculture (CIAT).
29. Gitau W (1988) A review of iodine deficiency disorders in Kenya . East African Med. J. 65 , 727-33
30. Grosse, S.D. (2009). Assessing the clinical utility of newborn screening. Khoury M, Gwinn M, Higgins J, Ioannidis J, Little J, eds. Human genome epidemiology. 2nd ed. NewYork NY: Oxford University Press.
31. Haldimann, M., Bochud, M., Burnier, M., & Paccaud, F. (2014). Prevalence of iodine inadequacy in Switzerland assessed by the estimated average requirement cut-point method in relation to the impact of iodized salt, (8), 1–10.
32. Hanegraaf TA and Gemert W (1978). Endemic goitre in Kenya: the pattern of iodine excretion. Trop Geogr Med. Dec;30(4):429-38.
33. Hatloy A., Torheim, LE and Oshaug A. (1998). Food variety- a good indicator of nutritional adequacy of the diet? A case study from an urban area in Mali, West Africa. European Journal of Clinical Nutrition, 52 p. 891-898
34. Hawkes C, Webster J, 2012. National approaches to monitoring population salt intake: A trade-off between accuracy and practicality? Plos One 7(10), e46727. Doi:10.1371/journal.pone.0046727
34. Hix J, Rasca P, Morgan J, Denna S, Panagides D, Tam M, Shankar AH. (2006) Validation of a rapid enzyme immunoassay for the quantitation of retinol-binding protein to assess vitamin A status within populations. European Journal of Clinical Nutrition 60 (11),p.1299
35. Horton S., Begin,F., Greig A and Lakshman A. (2008) Micronutrient Supplements for Child Survival (vitamin A and Zinc). Retrieved from http://www.copenhagenconsensus.com/sites/default/files/BPP_Micronutrient_VitaminA_Zinc.pdf-1303
36. Kai O.K, Roberts D.J. (2008). The pathophysiology of malarial anaemia: where have all the red cells gone? BMC Medicine 24(6)
37. Kenya Malaria Indicator Survey (KMIS) (2010). Division of Malaria Control, Ministry of Public Health and Sanitation
38. Kenya National Bureau of Statistics (2015), Kenya Demographic and Health Survey 2014 Key Indicators
39. Kenya National Bureau of Statistics (KNBS) and ICF Macro. (2010). Kenya Demographic and Health Survey 2008-09. Calverton, Maryland: KNBS and ICF Macro.
40. Khan, M.M.H. & Kraemer, A. (2009). Factors associated with being underweight, overweight and obese among ever-married non-pregnant urban women in Bangladesh. Singapore medical journal, 50(8),p.804–13.
41. Koc A, Kocyigit A, Soran M, Demir N, Sevinc E, Erel O, Mil Z. (2006). High frequency of maternal vitamin B12 deficiency as an important cause of infantile vitamin B12 deficiency in Sanliurfa province of Turkey. European Journal of Nutrition, 45(5)p291-7.
42. Koutras DA, Matovinovic J, Vought R, 1980. The ecology of iodine. In: Stanbury JB & Hetzel BS, Eds. Endemic Goiter and Endemic Cretinism. New York, Wiley & Sons, 185-195

91
The Kenya National Micronutrient Survey 2011
43. Kung’u JK, David Goodman, Hamad J Haji, Mahdi Ramsan, Victoria J Wright, Quentin D Bickle, James M Tielsch, John G Raynes, Rebecca J Stoltzfus. Early Helminth Infections Are Inversely Related to Anemia, Malnutrition, and Malaria and Are Not Associated with Inflammation in 6 to 23 month-old Zanzibari Children. American Journal of Tropical Medicine and Hygiene 2009 Dec; 81(6): 1062–1070.
44. Lividini K, Fiedler John L, Bermudez Odilia I. 2013. “Policy implications of using a household consumption and expenditures survey versus an observed-weighed food record survey to design a food fortification program.” Food and nutrition bulletin 34 (4): 520-32.
45. Mathenge, W., Kuper, H., Myatt, M., Foster, A. and Gilbert, C. (2007), Vitamin A deficiency in a Kenyan prison. Tropical Medicine & International Health, 12: 269–273.
46. Mburu ASW, Thurnham DI, Mwaniki DL, Muniu EM and Alumasa FM. (2010) The influence of inflammation on plasma zinc concentration in apparently healthy, HIV+ Kenyan adults and zinc responses after a multi-micronutrient supplement. European Journal of Clinical Nutrition 64, 510–517;
47. Mbwibo, N and Neumann,C (2003); The Need for Animal Source Foods by Kenyan Children J. Nutr. 133: 3936S–3940S,
48. McAuley, C.F., Webb C., Makani, J., Macharia, A., Uyoga, S., Opi, D.H., Ndila, C., Ngatia, A., Scott, J.A.G., Marsh K, Williams T.N. (2010). High mortality from Plasmodium falciparum malaria in children living with sickle cell anemia on the coast of Kenya, Blood; (116),p.1663-1668
49. Mclean, R. M. (2014). Measuring Population Sodium Intake: A Review of Methods. Nutrients, 6, 4651–4662.
50. Metz, J., (2008). A high prevalence of biochemical evidence of vitamin B12 or folate deficiency does not translate into a comparable prevalence of anemia. Food and nutrition bulletin, 29(2Suppl), p.S74–85.
51. Monteiro, C.A., Moura, E.C., Conde, W.L., Popkin, B.M. (2004). Health reviews: Socioeconomic status and obesity in adult populations of developing countries: a review 940. Bulletin of the World Health Organization, 82(12)
52. Mukuria, Altrena, Jeanne Cushing, and J. S. (2005). Nutritional Status of Children: Results from the Demographic and Health Surveys 1994-2001. DHS Comparative Reports No. 10. Calverton, Maryland: ORC Macro.
53. Mwaniki, D.L., Omwega A.M., Muniu E.M., Mutunga J.N., Akelola R., Shako B., Gotink M.H., Pertet A.M., (1999), Anaemia and micronutrient status of iron vitamin A and zinc in Kenya; National Micronutrient Survey Report, 1999.
54. Ngnie-Teta I., Receveur O. and Kuate-Defo B. (2008). Multilevel modelling of sociodemographic predictors of various levels of anaemia among women in Mali. Public Health Nutrition 12 (9) pp. 1462-1469.
55. Pathak P, Kapil U, Yajnik C.S, Kapoor S.K, Dwivedi S.N. (2007). Singh R. Iron, folate, and vitamin B12 stores among pregnant women in a rural area of Haryana State, India. Food and Nutrition Bulletin, 28(4)pp435-8.

92
The Kenya National Micronutrient Survey 2011
56. Pereira R A., Marina C. A., Lopes T. der S, Y.E.M., (2010). How many 24-hour recalls or food records are required to estimate usual energy and nutrient intake ? Quantos recordatórios de 24-horas ou registros alimentares são necessários para estimar o consumo usual de energia e nutrientes ? Cad. Saúde Pública, 26(11), pp.2101–2111.
57. Rah J.H., Akhter N., Semba R.D., de Pee S., Bloem M.W., Campbell A.A. et al. (2010) Low dietary diversity is a predictor of child stunting in rural Bangladesh. European Journal of Clinical Nutrition 64, 1393–1398.
58. Reina Engle-Stone, Alex O. Ndjebayi, Martin Nankap, David W. Killilea, and Kenneth H. Brown (2014), Stunting Prevalence, Plasma Zinc Concentrations, and Dietary Zinc Intakes in a Nationally Representative Sample Suggest a High Risk of Zinc Deficiency among Women and Young Children in Cameroon. Journal of Nutrition 144: 382–391, 2014
59. Ricalde, Anamaría E., Velásquez-Meléndez, Gustavo, Tanaka, Ana Cristina d’A., & Siqueira, Arnaldo A.F. de. (1998). Mid-upper arm circumference in pregnant women and its relation to birth weight. Revista de Saúde Pública, 32(2), 112-117
60. Sapin V., Marie C Alexandre, Samira Chaïb, Jean A Bournazeau, Patrick Sauvant, Patrick Borel, Bernard Jacquetin, Pascal Grolier, Didier Lémery, Bernard Dastugue, and Véronique Azaïs-Braesco (2000) Effect of vitamin A status at the end of term pregnancy on the saturation of retinol binding protein with retinol1–3 Am J Clin Nutr;71:537–43.
61. Savy, M., Martin-Prével, Y., Danel, P., Traissac, P., Dabiré, H., & Delpeuch, F. (2008). Are dietary diversity scores related to the socio-economic and anthropometric status of women living in an urban area in Burkina Faso? Public Health Nutrition, 11(2), 132–41.
62. Sazawal S, Black, R.E, Bhan, M.K, Bhandari N, Sinha A, Jalla S. (1995). Zinc supplementation in young children with acute diarrhea in India. New England Journal Medicine, 333(13):839-844.
63. Smith, J.L and Brooker, S. (2010) Impact of hookworm infection and deworming on anaemia in non-pregnant populations: a systematic review. Tropical Medicine & International Health, 15 (7) pp. 776-795
64. Smith, L.C., Ruel, M.T. & Ndiaye, A. (2005). Why Is Child Malnutrition Lower in Urban Than in Rural Areas? Evidence from 36 Developing Countries. World Development, 33(8), pp.1285–1305.
65. Steyn, N.P., Nel, J.H., Nantel, G., Kennedy, G. and Labadarios, D. (2006) Food variety and dietary diversity scores in children: are they good indicators of dietary adequacy? Public Health Nutrition, p.5.
66. Stoltzfus R.J. (2003). Iron deficiency: global prevalence and consequences. Food and Nutrition Bulletin,24(4 Suppl):S99-S103.
67. Stuijvenberg ME, Schoeman SE, Lombard CJ, Dhansay MA.(2012) Serum retinol in 1-6-year-old children from a low socio-economic South African community with a high intake of liver: implications for blanket vitamin A supplementation. Public Health Nutr. Apr;15(4):716-24
68. Tengco L.W., Rayco-Solon P., Solon J.A., Sarol J.N & Solon F.S. (2008). Determinants of anemia among preschool children in the Philippines. Journal of the American College of Nutrition, 27 (2)pp. 229-243
69. Tshilolo L, Kafando E, Sawadogo M, Cotton F, et al. (2008). Neonatal screening and clinical care programmes for sickle cell disorders in sub-Saharan Africa: Lessons from pilot studies. Public Health 122(9):933-941.

93
The Kenya National Micronutrient Survey 2011
70. UNICEF, 2009. Tracking progress on child and maternal nutrition. (2009). UNICEF, New York.
71. UNICEF, (2010). 2009 Situation Analysis of Children, Young People and Women in Kenya.
72. UNICEF, (2011). Nutrition strategies and programmes in Kenya,
73. UNICEF, the Government of Kenya. 2009. 2009 Situation Analysis of Children, Young People and Women in Kenya “Securing Kenya’s Future in the Hands of Children and Young People”
74. Veenemans J. (2011). Effect of preventive supplementation with zinc and other micronutrients on malaria and diarrhoeal morbidity in African children. PhD Thesis, Wageningen University
75. Verhoef H1, West CE, Nzyuko SM, de Vogel S, van der Valk R, Wanga MA, Kuijsten A, Veenemans J, Kok FJ. (2002) Intermittent administration of iron and sulfadoxine-pyrimethamine to control anaemia in Kenyan children: a randomised controlled trial.
76. Wamani, H. Åstrøm, A.N., Peterson, S., Tumwine, J. K., and Tylleskär, T. (2007). Boys are more stunted than girls in sub-Saharan Africa: a meta-analysis of 16 demographic and health surveys. BMC pediatrics, (7)p.17.
77. WHO (2008). “World Malaria Report (2008)” Geneva Switzerland. WHO/HTM/GMP/.
78. WHO (2011). Haemoglobin concentrations for the diagnosis of anaemia and assessment of severity. Vitamin and Mineral Nutrition Information System. Geneva, World Health Organization, 2011 (WHO/NMH/NHD/MNM/11.1)
79. WHO / UNICEF / IAEA / IZiNCG (2007) Executive summary. Recommendations for indicators of population zinc status. Report of WHO / UNICEF / IAEA / IZiNCG Interagency Meeting on Zinc Status Indicators. Food Nutr Bull, 2007; 28:S399-S400.
80. WHO, (2007). “Indicators for assessing infant and young child feeding practices. Part 1. Defintions. Geneva:” WHO Press.
81. WHO, (2013). [Long-term health effects of breastfeeding]. Lijec̆nic̆ki vjesnik (Vol. 129, pp. 293–8). Retrieved from http://www.ncbi.nlm.nih.gov/pubmed/20960419
82. WHO, (2011a). Guideline : Vitamin A supplementation in infants and children 6 – 59 months of age.
83. WHO, (2011b). Guideline: Intermit-tent iron and folic acid supplementation in menstruating women. Geneva: World Health Organization. Retrieved from http://scholar.google.com/scholar?hl=en&bt-nG=Search&q=intitle:Guideline+:+Inter-mittent+iron+and+folic+acid+supplemen-tation+in+menstruating+women#0
84. WHO, (2011d). Serum ferritin concentrations for the assessment of iron status and iron deficiency in populations. Vitamin and Mineral Nutrition Information System. Geneva, World Health Organization. (WHO/NMH/NHD/MNM/11.2).
85. WHO. (1996). Trace elements in human nutrition and health. WHO, Geneva.
86. WHO. (2000) Obesity: preventing and managing the global epidemic. Report of a WHO Consultation. WHO Technical Report Series 894. Geneva: World Health Organization, 2000.
87. WHO. ICCIDD (2001) Assessment of the iodine deficiency disorders and monitoring their elimination. WHO, Geneva.

94
The Kenya National Micronutrient Survey 2011
88. World Health Organization, 2013. Urinary iodine concentrations for determining iodine status in populations. Available at http://www.who.int/nutrition/publications/micronutrients/indicators_urinaryiodine/en/
89. WHO. (2009) Global prevalence of vitamin A deficiency in populations at risk 1995–2005. WHO Global Database on Vitamin A Deficiency. Geneva, World Health Organization, 2009.
90. WHO. (2011c). Haemoglobin concentrations for the diagnosis of anaemia and assessment of severity. Vitamin and Mineral Nutrition Information System. Geneva, World Health Organization (WHO/NMH/NHD/MNM/11.1) WHO. (2011e). WHO child growth standards. Acta Paediatr.
91. WHO/CDC. (2005). WHO/CDC Technical Consultation: Optimal blood folate concentrations in women of reproductive age for prevention of neural tube defects.
92. WHO/FAO. (2004). Vitamin and mineral requirements in human nutrition Second edition.
93. WHO/UNICEF/ICCIDD, (2001). Iron Deficiency Anaemia Assessment, Prevention, and Control. Assessment, Prevention and Control. A Guide for Programme Managers. Geneva, Switzerland.
94. FANTA (2007) Working Group on Infant and Young Child Feeding Indicators. Developing and validating simple indicators of dietary quality of infants and young children in developing countries: Additional analysis of 10 data sets. Report submitted to: the Food and Nutrition Technical Assistance (FANTA) Project/Academy for Educational Development (AED), July 2007.
95. Zimmermann MB, Jooste PL, Pandav CS, 2008. Iodine-deficiency disorders. The Lancet 372, 1251–1262.
96. Zimmermann, M. B. (2009). Iodine Deficiency. Endorine Reviews, 30(June 2009), 376–408. doi:10.1210/er.2009-0011
97. Zimmermann, M. B. (2012). Iodine and Iodine Deficiency Disorders. Present Knowledge in Nutrition, 554–567.
98. Zimmermann, M. B., Aeberli, I., Melse-Boonstra, A., Grimci, L., Bridson, J., Chaouki, N., Jooste, P. L. (2009). Iodine treatment in children with subclinical hypothyroidism due to chronic iodine deficiency decreases thyrotropin and C-peptide concentrations and improves the lipid profile. Thyroid : Official Journal of the American Thyroid Association, 19(10), 1099–104.
99. Ziraba A.K., Fotso J.C., and Ochako R., (2009) Overweight and obesity in urban Africa: A problem of the rich or the poor? BMC public health, 9, pp.465.

95
The Kenya National Micronutrient Survey 2011
Ap
pen
dix
1: D
ieta
ry R
efer
ence
In
tak
es (
DR
I’s)
for
Min
eral
s an
d V
itam
ins
Appe
ndix
1a: M
iner
als
Life S
tage
Gro
upCa
(mg/
d)
Cu (u
g/d)
Fe (
mg/
d)
I (ug
/d)
Mg
(mg/
d)M
n (m
g/d)
P (m
g/d)
Se (u
g/d)
Zn (m
g/d)
Infa
nts
AIAI
AIAI
AIAI
AIAI
0-6 m
o21
020
00.2
711
030
0.003
100
15 (u
g/kg
/d)
AI=
27-
12 m
o27
022
0RD
A=11
EAR=
6.913
075
0.627
520
(ug/
kg/d
)RD
A=3
EAR=
2.2Ch
ildre
nAI
RDA
EAR
RDA
EAR
RDA
EAR
RDA
EAR
AIRD
AEA
RRD
AEA
RRD
AEA
R1-
3 yrs
500
340
260
73
9065
8065
1.246
038
020
173
2.24-
8 yrs
800
440
340
104.1
9065
130
110
1.550
040
530
235
4M
ales
9-13
y13
0070
054
08
5.912
073
240
200
1.912
5010
5540
358
714
-18 y
1300
890
685
117.7
150
9541
034
02.2
1250
1055
5545
118.5
19-3
0 y10
0090
070
08
615
095
400
330
2.370
058
055
4511
9.431
-50 y
1000
900
700
86
150
9542
035
02.3
700
580
5545
119.4
51-7
0 y12
0090
070
08
615
095
420
350
2.370
058
055
4511
9.4>
70 y
1200
900
700
86
150
9542
035
02.3
700
580
5545
119.4
Fem
ales
9-13
y13
0070
054
08
5.712
073
240
200
1.612
5010
5540
358
714
-18 y
1300
890
685
117.9
150
9536
030
01.6
1250
1055
5545
97.5
19-3
0 y10
0090
070
018
8.115
095
310
255
1.870
058
055
458
6.831
-50 y
1000
900
700
188.1
150
9532
026
51.8
700
580
5545
86.8
51-7
0 y12
0090
070
08
515
095
320
265
1.870
058
055
458
6.8>
70 y
1200
900
700
85
150
9532
026
51.8
700
580
5545
86.8
Preg
nanc
y<
18 y
1300
1000
785
2723
220
160
400
335
212
5010
5560
4913
10.5
19-3
0 y10
0010
0080
027
2322
016
035
029
02
700
580
6049
119.5
31-5
0 y10
0010
0080
027
2322
016
036
030
02
700
580
6049
119.5
Lact
atio
n<
18 y
1300
1300
985
107
290
209
360
300
2.612
5010
5570
5914
11.6
19-3
0 y10
0013
0010
009
6.529
020
931
025
52.6
700
580
7059
1210
.431
-50 y
1000
1300
1000
96.5
290
209
320
265
2.670
058
070
5912
10.4

96
The Kenya National Micronutrient Survey 2011
Appe
ndix
1b: V
itam
ins
Life S
tage
Gr
oup
Vit A
(ug/
d)Th
ia (m
g/d)
Ribo
(mg/
d)Ni
a (m
g/d)
Vit B
6 (mg/
d)Fo
late
(ug/
d)Vi
t B12
(ug/
d)Pa
nto A
cid
(mg/
d)Bi
otin
(u
g/d)
VC (m
g/d)
Vit D
(u
g/d)
Vit E
(m
g/d)
Infa
nts
AIAI
AIAI
AIAI
AIAI
AIAI
AIAI
0-6 m
o40
00.2
0.32
0.165
0.41.7
540
54
7-12
mo
500
0.30.4
40.3
800.5
1.86
505
6Ch
ildre
nRD
AEA
RRD
AEA
RRD
AEA
RRD
AEA
RRD
AEA
RRD
AEA
RRD
AEA
RAI
AIRD
AEA
RAI
RDA
1-3 y
rs30
021
00.5
0.40.5
0.46
50.5
0.415
012
00.9
0.72
815
135
65
4-8 y
rs40
027
50.6
0.50.6
0.58
60.6
0.520
016
01.2
13
1225
225
76
Mal
es9-
13 y
600
445
0.90.7
0.90.8
129
10.8
300
250
1.81.5
420
4539
511
914
-18 y
900
630
1.21
1.31.1
1612
1.31.1
400
330
2.42
525
7563
515
1219
-30 y
625
1.21
1.31.1
1612
1.31.1
400
320
2.42
530
9075
515
1231
-50 y
625
1.21
1.31.1
1612
1.31.1
400
320
2.42
530
9075
515
1251
-70 y
625
1.21
1.31.1
1612
1.71.4
400
320
2.42
530
9075
1015
12>
70 y
625
1.21
1.31.1
1612
1.71.4
400
320
2.42
530
9075
1515
12Fe
mal
es9-
13 y
600
420
0.90.4
0.90.8
129
10.8
300
250
1.81.5
420
4539
511
914
-18 y
700
485
10.9
10.9
1411
1.21
400
330
2.42
525
6556
515
1219
-30 y
500
1.10.9
1.10.9
1411
1.31.1
400
320
2.42
530
7560
515
1231
-50 y
500
1.10.9
1.10.9
1411
1.31.1
400
320
2.42
530
7560
515
1251
-70 y
500
1.10.9
1.10.9
1411
1.51.3
400
320
2.42
530
7560
1015
12>
70 y
500
1.10.9
1.10.9
1411
1.51.3
400
320
2.42
530
7560
1515
12Pr
egna
ncy
< 18
y75
053
01.4
1.21.4
1.218
141.9
1.660
052
02.6
2.26
3080
665
1512
19-3
0 y77
055
01.4
1.21.4
1.218
141.9
1.660
052
02.6
2.26
3085
705
1512
31-5
0 y77
055
01.4
1.21.4
1.218
141.9
1.660
052
02.6
2.26
3085
705
1512
Lact
atio
n<
18 y
1200
880
1.41.2
1.61.3
1713
21.7
500
450
2.82.4
735
115
965
1916
19-3
0 y13
0090
01.4
1.21.6
1.317
132
1.750
045
02.8
2.47
3512
010
05
1916
31-5
0 y13
0090
01.4
1.21.6
1.317
132
1.750
045
02.8
2.47
3512
010
05
1916
Com
pile
d fr
om: 1
. A R
epor
t of t
he S
tand
ing
Com
mitt
ee o
n th
e Sc
ient
ific
Eval
uatio
n of
Die
tary
Ref
eren
ce In
take
s an
d its
Pan
el o
n Fo
late
, Oth
er B
Vita
min
s, an
d C
holin
e an
d Su
bcom
mitt
ee o
n U
pper
Ref
eren
ce L
evel
s of
Nut
rient
s, Fo
od a
nd
Nut
ritio
n Bo
ard,
Inst
itute
of M
edic
ine.
Die
tary
Ref
eren
ce In
take
s fo
r Thi
amin
, Rib
oflav
in, N
iaci
n, V
itam
in B
6, F
olat
e, V
itam
in B
12, P
anto
then
ic A
cid,
Bio
tin, a
nd C
holin
e (2
000,
592
pp)
: 2. P
anel
on
Die
tary
Ant
ioxi
dant
s an
d Re
late
d Co
mpo
unds
, Su
bcom
mitt
ees
on U
pper
Ref
eren
ce L
evel
s of
Nut
rient
s an
d In
terp
reta
tion
and
Use
s of
DRI
s, St
andi
ng C
omm
ittee
on
the
Scie
ntifi
c Ev
alua
tion
of D
ieta
ry R
efer
ence
Inta
kes,
Food
and
Nut
ritio
n Bo
ard.
Die
tary
Ref
eren
ce In
take
s fo
r Vita
min
C
, Vita
min
E, S
elen
ium
, and
Car
oten
oids
. (20
00, 5
29 p
p.):
3. A
Rep
ort o
f the
Sub
com
mitt
ees
on In
terp
reta
tion
and
Use
s of
Die
tary
Ref
eren
ce In
take
s an
d U
pper
Ref
eren
ce L
evel
s of
Nut
rient
s, an
d th
e St
andi
ng C
omm
ittee
on
the
Scie
ntifi
c Ev
alua
tion
of D
ieta
ry R
efer
ence
Inta
kes,
Food
and
Nut
ritio
n Bo
ard.
Die
tary
Ref
eren
ce In
take
s: A
pplic
atio
ns in
Die
tary
Ass
essm
ent.
(200
1, 3
06 p
p.):
4. P
anel
on
Mic
ronu
trie
nts,
Subc
omm
ittee
s on
Upp
er R
efer
ence
Lev
els
of N
utrie
nts
and
of In
terp
reta
tion
and
Use
of D
ieta
ry R
efer
ence
Inta
kes,
and
the
Stan
ding
Com
mitt
ee o
n th
e Sc
ient
ific
Eval
uatio
n of
Die
tary
Ref
eren
ce In
take
s, Fo
od a
nd N
utrit
ion
Boar
d. D
ieta
ry R
efer
ence
Inta
kes
for V
itam
in A
, Vita
min
K, A
rsen
ic, B
oron
, C
hrom
ium
, Cop
per,
Iodi
ne, I
ron,
Man
gane
se, M
olyb
denu
m, N
icke
l, Si
licon
, Van
adiu
m, a
nd Z
inc.
(200
2, 6
50 p
p.):5
. Sta
ndin
g Co
mm
ittee
on
the
Scie
ntifi
c Ev
alua
tion
of D
ieta
ry R
efer
ence
Inta
kes,
Food
and
Nut
ritio
n Bo
ard,
Inst
itute
of M
edic
ine.
D
ieta
ry R
efer
ence
Inta
kes
for C
alci
um, P
hosp
horu
s, M
agne
sium
, Vita
min
D, a
nd F
luor
ide.
(199
7, 4
48 p
p.

97
The Kenya National Micronutrient Survey 2011
Appendix 2
Appendix 2a: Sources of dietary energy by food group and age group. When source contributes more than 10% of total energy the value is shown in red text.
Food Group 6-11m 12-23m 24-35m 36-47m 48-59m NPNL15-19 NPNL19+ PL15-19 PL19+
Beans, nuts, and seeds 5% 2% 3% 4% 3% 7% 5% 6% 5%Beverages 0% 1% 1% 0% 1% 1% 1% 0% 0%Eggs 0% 1% 0% 0% 0% 0% 1% 0% 0%Fats and oils 4% 6% 8% 6% 7% 8% 9% 8% 7%Fruits and fresh/pure fruit juices 3% 4% 2% 1% 5% 2% 2% 1% 1%Grains and grain products 54% 50% 58% 66% 56% 57% 60% 67% 65%Meats, poultry, and insects 0% 2% 3% 1% 4% 2% 3% 5% 2%Milk and dairy 22% 21% 14% 10% 12% 8% 8% 5% 8%Miscellaneous 0% 0% 0% 1% 0% 0% 1% 0% 0%Sugars and sweets 8% 10% 7% 9% 8% 7% 7% 5% 8%Vegetables 3% 4% 3% 2% 5% 6% 4% 3% 3%
Appendix 2b: Sources of dietary lipid by food group and age group. When source contributes more than 10% of total energy the value is shown in red text.
Food Group 6-11m 12-23m 24-35m 36-47m 48-59m NPNL15-19 NPNL19+ PL15-19 PL19+
Beans, nuts, and seeds 7% 1% 2% 1% 0% 8% 1% 1% 1%Beverages 0% 0% 0% 0% 0% 0% 0% 0% 0%Eggs 1% 2% 1% 2% 1% 1% 2% 0% 1%Fats and oils 17% 26% 35% 34% 34% 36% 40% 38% 38%Fruits and fresh/pure fruit juices 0% 0% 0% 0% 1% 0% 0% 0% 0%Grains and grain products 21% 17% 20% 30% 21% 23% 23% 29% 28%Meats, poultry, and insects 0% 5% 8% 1% 8% 5% 9% 14% 7%Milk and dairy 46% 42% 30% 27% 27% 16% 18% 11% 22%Miscellaneous 0% 1% 2% 4% 0% 0% 3% 0% 0%Sugars and sweets 0% 0% 0% 0% 0% 0% 0% 0% 0%Vegetables 7% 5% 2% 1% 7% 10% 4% 7% 3%
Appendix 2c: Sources of dietary iron by food group and age group. When source contributes more than 10% of total energy the value is shown in red text.
Food Group 6-11m 12-23m 24-35m 36-47m 48-59m NPNL15-19 NPNL19+ PL15-19 PL19+
Beans, nuts, and seeds 20% 8% 11% 10% 8% 14% 14% 19% 15%Beverages 0% 0% 0% 0% 0% 0% 0% 0% 0%Eggs 1% 2% 1% 1% 0% 0% 1% 0% 1%Fats and oils 0% 0% 0% 0% 0% 0% 0% 0% 0%Fruits and fresh/pure fruit juices 2% 4% 2% 0% 4% 1% 1% 0% 1%Grains and grain products 65% 63% 63% 67% 61% 54% 57% 61% 62%Meats, poultry, and insects 2% 7% 6% 1% 6% 4% 5% 8% 5%Milk and dairy 2% 0% 1% 1% 0% 0% 0% 0% 0%Miscellaneous 0% 0% 1% 1% 0% 0% 1% 0% 0%Sugars and sweets 0% 0% 0% 7% 0% 8% 3% 0% 2%Vegetables 9% 16% 16% 11% 21% 19% 17% 11% 13%

98
The Kenya National Micronutrient Survey 2011
Appendix 2d: Sources of dietary zinc by food group and age group. When source contributes more than 10% of total energy the value is shown in red text.
Food Group 6-11m 12-23m 24-35m 36-47m 48-59m NPNL15-19 NPNL19+ PL15-19 PL19+
Beans, nuts, and seeds 17% 4% 6% 8% 5% 13% 9% 11% 9%Beverages 0% 0% 0% 0% 0% 0% 0% 0% 0%Eggs 1% 1% 0% 1% 1% 1% 1% 0% 1%Fats and oils 0% 0% 0% 0% 0% 0% 0% 0% 0%Fruits and fresh/pure fruit juices 1% 2% 1% 1% 3% 1% 1% 1% 2%Grains and grain products 44% 43% 50% 64% 52% 51% 53% 54% 58%Meats, poultry, and insects 3% 9% 12% 3% 13% 11% 13% 23% 11%Milk and dairy 31% 34% 23% 17% 18% 13% 13% 7% 14%Miscellaneous 0% 0% 0% 1% 0% 0% 1% 0% 0%Sugars and sweets 0% 0% 0% 0% 0% 0% 0% 0% 0%Vegetables 4% 6% 7% 6% 8% 10% 8% 5% 6%
Appendix 2e: Sources of dietary calcium by food group and age group. When source contributes more than 10% of total energy the value is shown in red text.
Food Group 6-11m 12-23m 24-35m 36-47m 48-59m NPNL15-19 NPNL19+ PL15-19 PL19+
Beans, nuts, and seeds 6% 1% 2% 3% 2% 6% 4% 9% 5%Beverages 0% 3% 3% 0% 2% 0% 1% 0% 0%Eggs 0% 1% 0% 0% 0% 0% 1% 0% 1%Fats and oils 0% 0% 0% 0% 0% 0% 0% 0% 0%Fruits and fresh/pure fruit juices 2% 2% 1% 1% 1% 1% 1% 3% 1%Grains and grain products 4% 7% 9% 23% 12% 18% 16% 13% 16%Meats, poultry, and insects 0% 0% 0% 0% 1% 0% 1% 1% 1%Milk and dairy 82% 76% 67% 53% 57% 46% 47% 47% 54%Miscellaneous 0% 1% 1% 2% 2% 1% 2% 5% 1%Sugars and sweets 0% 0% 0% 1% 0% 1% 0% 0% 0%Vegetables 6% 10% 17% 16% 22% 26% 26% 22% 21%
Appendix 2f: Sources of dietary vitamin A by food group and age group. When source contributes more than 10% of total energy the value is shown in red text.
Food Group 6-11m 12-23m 24-35m 36-47m 48-59m NPNL15-19 NPNL19+ PL15-19 PL19+
Beans, nuts, and seeds 4% 0% 0% 0% 0% 0% 0% 0% 0%Beverages 0% 0% 1% 0% 0% 0% 0% 0% 0%Eggs 0% 1% 0% 0% 0% 0% 0% 0% 0%Fats and oils 4% 3% 2% 3% 1% 4% 2% 6% 3%Fruits and fresh/pure fruit juices 2% 3% 4% 1% 1% 1% 2% 1% 1%Grains and grain products 0% 0% 0% 3% 0% 0% 1% 0% 1%Meats, poultry, and insects 0% 7% 4% 0% 0% 0% 1% 0% 2%Milk and dairy 9% 7% 5% 4% 2% 2% 2% 2% 3%Miscellaneous 0% 0% 0% 0% 0% 0% 0% 0% 0%Sugars and sweets 0% 0% 0% 0% 0% 0% 0% 0% 0%Vegetables 79% 79% 83% 89% 94% 94% 91% 91% 90%

99
The Kenya National Micronutrient Survey 2011
Ap
pen
dix
3: D
ieta
ry R
efer
ence
In
tak
es (
DR
I’s)
for
Min
eral
s an
d V
itam
ins
Appe
ndix
3a: M
iner
als
Life S
tage
Gro
upCa
(mg/
d)
Cu (u
g/d)
Fe (
mg/
d)
I (ug
/d)
Mg
(mg/
d)M
n (m
g/d)
P (m
g/d)
Se (
ug/d
) Zn
(mg/
d)In
fant
sAI
AIAI
AIAI
AIAI
AI0-
6 mo
210
200
0.27
110
300.0
0310
015
(ug/
kg/d
)AI
=2
7-12
mo
270
220
RDA=
11EA
R=6.9
130
750.6
275
20 (u
g/kg
/d)
RDA=
3EA
R=2.2
Child
ren
AIRD
AEA
RRD
AEA
RRD
AEA
RRD
AEA
RAI
RDA
EAR
RDA
EAR
RDA
EAR
1-3 y
rs50
034
026
07
390
6580
651.2
460
380
2017
32.2
4-8 y
rs80
044
034
010
4.190
6513
011
01.5
500
405
3023
54
Mal
es9-
13 y
1300
700
540
85.9
120
7324
020
01.9
1250
1055
4035
87
14-1
8 y13
0089
068
511
7.715
095
410
340
2.212
5010
5555
4511
8.519
-30 y
1000
900
700
86
150
9540
033
02.3
700
580
5545
119.4
31-5
0 y10
0090
070
08
615
095
420
350
2.370
058
055
4511
9.451
-70 y
1200
900
700
86
150
9542
035
02.3
700
580
5545
119.4
> 70
y12
0090
070
08
615
095
420
350
2.370
058
055
4511
9.4Fe
mal
es9-
13 y
1300
700
540
85.7
120
7324
020
01.6
1250
1055
4035
87
14-1
8 y13
0089
068
511
7.915
095
360
300
1.612
5010
5555
459
7.519
-30 y
1000
900
700
188.1
150
9531
025
51.8
700
580
5545
86.8
31-5
0 y10
0090
070
018
8.115
095
320
265
1.870
058
055
458
6.851
-70 y
1200
900
700
85
150
9532
026
51.8
700
580
5545
86.8
> 70
y12
0090
070
08
515
095
320
265
1.870
058
055
458
6.8Pr
egna
ncy
< 18
y13
0010
0078
527
2322
016
040
033
52
1250
1055
6049
1310
.519
-30 y
1000
1000
800
2723
220
160
350
290
270
058
060
4911
9.531
-50 y
1000
1000
800
2723
220
160
360
300
270
058
060
4911
9.5La
ctat
ion
< 18
y13
0013
0098
510
729
020
936
030
02.6
1250
1055
7059
1411
.619
-30 y
1000
1300
1000
96.5
290
209
310
255
2.670
058
070
5912
10.4
31-5
0 y10
0013
0010
009
6.529
020
932
026
52.6
700
580
7059
1210
.4

100
The Kenya National Micronutrient Survey 2011
Appe
ndix
3b: V
itam
ins
Life S
tage
Gr
oup
Vit A
(ug/
d)Th
ia (m
g/d)
Ribo
(mg/
d)Ni
a (m
g/d)
Vit B
6 (m
g/d)
Fola
te (u
g/d)
Vit B
12 (u
g/d)
Pant
o Acid
(mg/
d)Bi
otin
(ug/
d)VC
(mg/
d)Vi
t D (u
g/d)
Vit E
(mg/
d)
Infa
nts
AIAI
AIAI
AIAI
AIAI
AIAI
AIAI
0-6 m
o40
00.2
0.32
0.165
0.41.7
540
54
7-12
mo
500
0.30.4
40.3
800.5
1.86
505
6Ch
ildre
nRD
AEA
RRD
AEA
RRD
AEA
RRD
AEA
RRD
AEA
RRD
AEA
RRD
AEA
RAI
AIRD
AEA
RAI
RDA
1-3 y
rs30
021
00.5
0.40.5
0.46
50.5
0.415
012
00.9
0.72
815
135
65
4-8 y
rs40
027
50.6
0.50.6
0.58
60.6
0.520
016
01.2
13
1225
225
76
Mal
es9-
13 y
600
445
0.90.7
0.90.8
129
10.8
300
250
1.81.5
420
4539
511
914
-18 y
900
630
1.21
1.31.1
1612
1.31.1
400
330
2.42
525
7563
515
1219
-30 y
625
1.21
1.31.1
1612
1.31.1
400
320
2.42
530
9075
515
1231
-50 y
625
1.21
1.31.1
1612
1.31.1
400
320
2.42
530
9075
515
1251
-70 y
625
1.21
1.31.1
1612
1.71.4
400
320
2.42
530
9075
1015
12>
70 y
625
1.21
1.31.1
1612
1.71.4
400
320
2.42
530
9075
1515
12Fe
mal
es9-
13 y
600
420
0.90.4
0.90.8
129
10.8
300
250
1.81.5
420
4539
511
914
-18 y
700
485
10.9
10.9
1411
1.21
400
330
2.42
525
6556
515
1219
-30 y
500
1.10.9
1.10.9
1411
1.31.1
400
320
2.42
530
7560
515
1231
-50 y
500
1.10.9
1.10.9
1411
1.31.1
400
320
2.42
530
7560
515
1251
-70 y
500
1.10.9
1.10.9
1411
1.51.3
400
320
2.42
530
7560
1015
12>
70 y
500
1.10.9
1.10.9
1411
1.51.3
400
320
2.42
530
7560
1515
12Pr
egna
ncy
< 18
y75
053
01.4
1.21.4
1.218
141.9
1.660
052
02.6
2.26
3080
665
1512
19-3
0 y77
055
01.4
1.21.4
1.218
141.9
1.660
052
02.6
2.26
3085
705
1512
31-5
0 y77
055
01.4
1.21.4
1.218
141.9
1.660
052
02.6
2.26
3085
705
1512
Lact
atio
n<
18 y
1200
880
1.41.2
1.61.3
1713
21.7
500
450
2.82.4
735
115
965
1916
19-3
0 y13
0090
01.4
1.21.6
1.317
132
1.750
045
02.8
2.47
3512
010
05
1916
31-5
0 y13
0090
01.4
1.21.6
1.317
132
1.750
045
02.8
2.47
3512
010
05
1916
Com
pile
d fr
om: 1
. A R
epor
t of t
he S
tand
ing
Com
mitt
ee o
n th
e Sc
ient
ific
Eval
uatio
n of
Die
tary
Ref
eren
ce In
take
s an
d its
Pan
el o
n Fo
late
, Oth
er B
Vita
min
s, an
d C
holin
e an
d Su
bcom
mitt
ee o
n U
pper
Ref
eren
ce L
evel
s of
Nut
rient
s, Fo
od a
nd
Nut
ritio
n Bo
ard,
Inst
itute
of M
edic
ine.
Die
tary
Ref
eren
ce In
take
s fo
r Thi
amin
, Rib
oflav
in, N
iaci
n, V
itam
in B
6, F
olat
e, V
itam
in B
12, P
anto
then
ic A
cid,
Bio
tin, a
nd C
holin
e (2
000,
592
pp)
: 2. P
anel
on
Die
tary
Ant
ioxi
dant
s an
d Re
late
d Co
mpo
unds
, Su
bcom
mitt
ees
on U
pper
Ref
eren
ce L
evel
s of
Nut
rient
s an
d In
terp
reta
tion
and
Use
s of
DRI
s, St
andi
ng C
omm
ittee
on
the
Scie
ntifi
c Ev
alua
tion
of D
ieta
ry R
efer
ence
Inta
kes,
Food
and
Nut
ritio
n Bo
ard.
Die
tary
Ref
eren
ce In
take
s fo
r Vita
min
C,
Vita
min
E, S
elen
ium
, and
Car
oten
oids
. (20
00, 5
29 p
p.):
3. A
Rep
ort o
f the
Sub
com
mitt
ees
on In
terp
reta
tion
and
Use
s of
Die
tary
Ref
eren
ce In
take
s an
d U
pper
Ref
eren
ce L
evel
s of
Nut
rient
s, an
d th
e St
andi
ng C
omm
ittee
on
the
Scie
ntifi
c Ev
alua
tion
of D
ieta
ry R
efer
ence
Inta
kes,
Food
and
Nut
ritio
n Bo
ard.
Die
tary
Ref
eren
ce In
take
s: A
pplic
atio
ns in
Die
tary
Ass
essm
ent.
(200
1, 3
06 p
p.):
4. P
anel
on
Mic
ronu
trie
nts,
Subc
omm
ittee
s on
Upp
er R
efer
ence
Lev
els
of N
utrie
nts
and
of In
terp
reta
tion
and
Use
of D
ieta
ry R
efer
ence
Inta
kes,
and
the
Stan
ding
Com
mitt
ee o
n th
e Sc
ient
ific
Eval
uatio
n of
Die
tary
Ref
eren
ce In
take
s, Fo
od a
nd N
utrit
ion
Boar
d. D
ieta
ry R
efer
ence
Inta
kes
for V
itam
in A
, Vita
min
K, A
rsen
ic, B
oron
, Chr
omiu
m, C
oppe
r, Io
dine
, Iro
n, M
anga
nese
, Mol
ybde
num
, Nic
kel,
Silic
on, V
anad
ium
, and
Zin
c. (2
002,
650
pp.
):5. S
tand
ing
Com
mitt
ee o
n th
e Sc
ient
ific
Eval
uatio
n of
Die
tary
Ref
eren
ce In
take
s, Fo
od a
nd N
utrit
ion
Boar
d, In
stitu
te o
f Med
icin
e. D
ieta
ry R
efer
ence
Inta
kes
for
Calc
ium
, Pho
spho
rus,
Mag
nesi
um, V
itam
in D
, and
Flu
orid
e. (1
997,
448
pp.

101
The Kenya National Micronutrient Survey 2011
Appendix 4
Appendix 4a: Sources of dietary energy by food group and age group. When source contributes more than 10% of total energy the value is shown in red text.
Appendix 4b: Sources of dietary lipid by food group and age group. When source contributes more than 10% of total energy the value is shown in red text.
Food Group 6-11m 12-23m 24-35m 36-47m 48-59m NPNL15-19 NPNL19+ PL15-19 PL19+
Beans, nuts, and seeds 5% 2% 3% 4% 3% 7% 5% 6% 5%Beverages 0% 1% 1% 0% 1% 1% 1% 0% 0%Eggs 0% 1% 0% 0% 0% 0% 1% 0% 0%Fats and oils 4% 6% 8% 6% 7% 8% 9% 8% 7%Fruits and fresh/pure fruit juices 3% 4% 2% 1% 5% 2% 2% 1% 1%Grains and grain products 54% 50% 58% 66% 56% 57% 60% 67% 65%Meats, poultry, and insects 0% 2% 3% 1% 4% 2% 3% 5% 2%Milk and dairy 22% 21% 14% 10% 12% 8% 8% 5% 8%Miscellaneous 0% 0% 0% 1% 0% 0% 1% 0% 0%Sugars and sweets 8% 10% 7% 9% 8% 7% 7% 5% 8%Vegetables 3% 4% 3% 2% 5% 6% 4% 3% 3%
Food Group 6-11m 12-23m 24-35m 36-47m 48-59m NPNL15-19 NPNL19+ PL15-19 PL19+
Beans, nuts, and seeds 7% 1% 2% 1% 0% 8% 1% 1% 1%Beverages 0% 0% 0% 0% 0% 0% 0% 0% 0%Eggs 1% 2% 1% 2% 1% 1% 2% 0% 1%Fats and oils 17% 26% 35% 34% 34% 36% 40% 38% 38%Fruits and fresh/pure fruit juices 0% 0% 0% 0% 1% 0% 0% 0% 0%Grains and grain products 21% 17% 20% 30% 21% 23% 23% 29% 28%Meats, poultry, and insects 0% 5% 8% 1% 8% 5% 9% 14% 7%Milk and dairy 46% 42% 30% 27% 27% 16% 18% 11% 22%Miscellaneous 0% 1% 2% 4% 0% 0% 3% 0% 0%Sugars and sweets 0% 0% 0% 0% 0% 0% 0% 0% 0%Vegetables 7% 5% 2% 1% 7% 10% 4% 7% 3%
Appendix 4c: Sources of dietary iron by food group and age group. When source contributes more than 10% of total energy the value is shown in red text.
Food Group 6-11m 12-23m 24-35m 36-47m 48-59m NPNL15-19 NPNL19+ PL15-19 PL19+
Beans, nuts, and seeds 20% 8% 11% 10% 8% 14% 14% 19% 15%Beverages 0% 0% 0% 0% 0% 0% 0% 0% 0%Eggs 1% 2% 1% 1% 0% 0% 1% 0% 1%Fats and oils 0% 0% 0% 0% 0% 0% 0% 0% 0%Fruits and fresh/pure fruit juices 2% 4% 2% 0% 4% 1% 1% 0% 1%Grains and grain products 65% 63% 63% 67% 61% 54% 57% 61% 62%Meats, poultry, and insects 2% 7% 6% 1% 6% 4% 5% 8% 5%Milk and dairy 2% 0% 1% 1% 0% 0% 0% 0% 0%Miscellaneous 0% 0% 1% 1% 0% 0% 1% 0% 0%Sugars and sweets 0% 0% 0% 7% 0% 8% 3% 0% 2%Vegetables 9% 16% 16% 11% 21% 19% 17% 11% 13%

102
The Kenya National Micronutrient Survey 2011
Appendix 4d: Sources of dietary zinc by food group and age group. When source contributes more than 10% of total energy the value is shown in red text.
Food Group 6-11m 12-23m 24-35m 36-47m 48-59m NPNL15-19 NPNL19+ PL15-19 PL19+
Beans, nuts, and seeds 17% 4% 6% 8% 5% 13% 9% 11% 9%Beverages 0% 0% 0% 0% 0% 0% 0% 0% 0%Eggs 1% 1% 0% 1% 1% 1% 1% 0% 1%Fats and oils 0% 0% 0% 0% 0% 0% 0% 0% 0%Fruits and fresh/pure fruit juices 1% 2% 1% 1% 3% 1% 1% 1% 2%Grains and grain products 44% 43% 50% 64% 52% 51% 53% 54% 58%Meats, poultry, and insects 3% 9% 12% 3% 13% 11% 13% 23% 11%Milk and dairy 31% 34% 23% 17% 18% 13% 13% 7% 14%Miscellaneous 0% 0% 0% 1% 0% 0% 1% 0% 0%Sugars and sweets 0% 0% 0% 0% 0% 0% 0% 0% 0%Vegetables 4% 6% 7% 6% 8% 10% 8% 5% 6%
Appendix 4e: Sources of dietary vitamin A by food group and age group. When source contributes more than 10% of total energy the value is shown in red text.
Food Group 6-11m 12-23m 24-35m 36-47m 48-59m NPNL15-19 NPNL19+ PL15-19 PL19+
Beans, nuts, and seeds 4% 0% 0% 0% 0% 0% 0% 0% 0%Beverages 0% 0% 1% 0% 0% 0% 0% 0% 0%Eggs 0% 1% 0% 0% 0% 0% 0% 0% 0%Fats and oils 4% 3% 2% 3% 1% 4% 2% 6% 3%Fruits and fresh/pure fruit juices 2% 3% 4% 1% 1% 1% 2% 1% 1%Grains and grain products 0% 0% 0% 3% 0% 0% 1% 0% 1%Meats, poultry, and insects 0% 7% 4% 0% 0% 0% 1% 0% 2%Milk and dairy 9% 7% 5% 4% 2% 2% 2% 2% 3%Miscellaneous 0% 0% 0% 0% 0% 0% 0% 0% 0%Sugars and sweets 0% 0% 0% 0% 0% 0% 0% 0% 0%Vegetables 79% 79% 83% 89% 94% 94% 91% 91% 90%

103
The Kenya National Micronutrient Survey 2011
Appendix 5: Summary of key findings in Kenya National Micronutrient Survey 2011
IndicatorsKenya Rural Urban
n % 95% CI n % 95% CI n % 95% CINutritional statusPre School Children 10 Height-for-age <-2 SD 1130 26.3 23.7 28.9 788 30.0 26.8 33.2 342 16.9 12.9 20.9Weight-for-height <-2 SD 1130 6.3 4.9 7.7 788 6.0 4.3 7.7 342 7.1 4.4 9.8Weight-for-age <-2 SD 1130 12.7 10.8 14.6 788 13.2 10.8 15.6 342 11.4 8.0 14.8Pregnant Women7 (MUAC <23 cm) 117 11.7 5.9 17.5 71 11.4 4.0 18.8 46 12.0 2.6 21.4Non-pregnant Women11 (BMI<18) 695 13.2 10.7 15.7 410 16.1 12.5 19.7 285 9.1 5.8 12.4Men12 (BMI<18) 279 24.7 19.6 29.8 184 30.4 23.8 37.0 95 13.7 6.8 20.6Anaemia13
Pre-School Children 827 26.3 23.3 29.3 592 26.9 23.3 30.5 234 24.8 19.3 30.3School Age Children14 872 16.5 14.0 19.0 643 18.5 15.5 21.5 230 10.9 6.9 14.9Pregnant Women 104 41.6 32.1 51.1 61 50.8 38.3 63.4 44 29.5 16.0 43.0Non-pregnant Women 592 21.9 18.6 25.2 370 24.6 20.2 29.0 221 17.2 12.2 22.2Men 240 9.3 5.9 13.3 144 11.8 6.5 17.1 96 5.2 0.8 9.6Total 2635 23.1 21.5 24.7 1810 26.5 24.5 28.5 825 17.5 14.9 20.1Iron Deficiency15
Pre-School Children 918 21.8 19.1 24.5 662 21.5 18.4 24.6 255 22.7 17.6 27.8School Age Children 942 9.4 7.5 11.3 694 9.9 7.7 12.1 248 7.7 4.4 11.0Pregnant Women 111 36.1 27.2 45.0 68 45.6 33.8 57.4 43 20.9 8.8 33.0Non-pregnant Women 633 21.3 18.1 24.5 397 21.4 17.4 25.4 236 21.2 16.0 26.4Men 247 3.6 1.3 5.9 148 4.7 1.3 8.1 99 2.0 0.0 4.8Total 2851 18.4 17.0 19.8 1969 20.6 18.8 22.4 881 14.9 12.6 17.3Iron Deficiency Anaemia16
Pre-School Children 827 13.3 11.0 15.6 592 12.5 9.8 15.2 234 12.4 8.2 16.6School Age Children 942 4.9 3.5 6.3 618 5.3 3.5 7.1 233 3.9 1.4 6.4Pregnant Women 104 26.0 17.6 34.4 60 36.7 24.5 48.9 44 11.4 2.0 20.8Non-pregnant Women 592 14.0 11.2 16.8 363 13.2 9.7 16.7 229 15.3 10.6 20.0Men 243 2.9 0.8 5.0 144 3.5 0.5 6.5 98 2.0 0.0 4.8Total 2708 12.2 11.0 13.4 1777 14.2 12.6 15.8 838 9.0 7.1 11.0Vitamin A DeficiencyPre-School Children 918 9.2 7.3 11.1 663 8.1 6.0 10.2 256 12.1 8.1 16.1School Age Children 942 4.7 3.4 6.1 695 5.0 3.4 6.6 248 3.6 1.3 5.9Pregnant Women 111 5.4 1.2 9.6 68 0.0 N/A N/A 43 14.0 3.6 24.4Non-pregnant Women 632 1.1 0.3 1.9 397 1.8 0.5 3.1 236 0.4 0.0 1.2Men 247 0.0 N/A N/A 148 0.0 N/A N/A 99 0.0 N/A N/ATotal 2850 4.1 3.4 4.8 1971 3.0 2.3 3.8 882 6.0 4.4 7.8Folate Deficiency Pregnant Women 78 32.1 21.7 42.5 50 36.0 22.7 49.3 28 25.0 9.0 41.0Non-pregnant Women 445 30.9 26.6 35.2 279 25.1 20.0 30.2 165 40.6 33.1 48.1Total 523 31.5 27.5 35.5 329 30.6 25.6 35.6 193 32.8 26.2 39.4Vitamin B12 DeficiencyPregnant Women 78 7.7 1.8 13.6 50 8.0 0.5 15.5 28 7.1 0.0 16.6Non-pregnant Women 445 34.7 30.3 39.1 279 36.9 31.2 42.6 165 30.7 23.7 37.7Total 523 21.2 17.7 24.7 329 22.5 18.0 27.0 193 18.9 13.4 24.4
10 Children 6-59 months11 Women of reproductive age (15-49 years)12 Men aged 15-54 years13 Using age specific Hb cut-offs. Hb adjusted for altitude
14 Children 5-14 years15 Using age specific serum ferritin cut-offs. Serum ferritin corrected for
inflammation16 Use both Hb and serum ferritin cut-offs

104
The Kenya National Micronutrient Survey 2011
Ap
pen
dix
6: D
ieta
ry R
efer
ence
In
tak
es (
DR
I’s)
for
Min
eral
s an
d V
itam
ins
Appe
ndix
6a: M
iner
als
Life S
tage
Gro
upCa
(mg/
d)
Cu (u
g/d)
Fe (
mg/
d)
I (ug
/d)
Mg
(mg/
d)M
n (m
g/d)
P (m
g/d)
Se (
ug/d
) Zn
(mg/
d)In
fant
sAI
AIAI
AIAI
AIAI
AI0-
6 mo
210
200
0.27
110
300.0
0310
015
(ug/
kg/d
)AI
=2
7-12
mo
270
220
RDA=
11EA
R=6.9
130
750.6
275
20 (u
g/kg
/d)
RDA=
3EA
R=2.2
Child
ren
AIRD
AEA
RRD
AEA
RRD
AEA
RRD
AEA
RAI
RDA
EAR
RDA
EAR
RDA
EAR
1-3 y
rs50
034
026
07
390
6580
651.2
460
380
2017
32.2
4-8 y
rs80
044
034
010
4.190
6513
011
01.5
500
405
3023
54
Mal
es9-
13 y
1300
700
540
85.9
120
7324
020
01.9
1250
1055
4035
87
14-1
8 y13
0089
068
511
7.715
095
410
340
2.212
5010
5555
4511
8.519
-30 y
1000
900
700
86
150
9540
033
02.3
700
580
5545
119.4
31-5
0 y10
0090
070
08
615
095
420
350
2.370
058
055
4511
9.451
-70 y
1200
900
700
86
150
9542
035
02.3
700
580
5545
119.4
> 70
y12
0090
070
08
615
095
420
350
2.370
058
055
4511
9.4Fe
mal
es9-
13 y
1300
700
540
85.7
120
7324
020
01.6
1250
1055
4035
87
14-1
8 y13
0089
068
511
7.915
095
360
300
1.612
5010
5555
459
7.519
-30 y
1000
900
700
188.1
150
9531
025
51.8
700
580
5545
86.8
31-5
0 y10
0090
070
018
8.115
F095
320
265
1.870
058
055
458
6.851
-70 y
1200
900
700
85
150
9532
026
51.8
700
580
5545
86.8
> 70
y12
0090
070
08
515
095
320
265
1.870
058
055
458
6.8Pr
egna
ncy
< 18
y13
0010
0078
527
2322
016
040
033
52
1250
1055
6049
1310
.519
-30 y
1000
1000
800
2723
220
160
350
290
270
058
060
4911
9.531
-50 y
1000
1000
800
2723
220
160
360
300
270
058
060
4911
9.5La
ctat
ion
< 18
y13
0013
0098
510
729
020
936
030
02.6
1250
1055
7059
1411
.619
-30 y
1000
1300
1000
96.5
290
209
310
255
2.670
058
070
5912
10.4
31-5
0 y10
0013
0010
009
6.529
020
932
026
52.6
700
580
7059
1210
.4

105
The Kenya National Micronutrient Survey 2011
Appe
ndix
6b: V
itam
ins
Life S
tage
Gr
oup
Vit A
(ug/
d)Th
ia (m
g/d)
Ribo
(mg/
d)Ni
a (m
g/d)
Vit B
6 (m
g/d)
Fola
te
(ug/
d)Vi
t B12
(ug/
d)Pa
nto
Acid
(m
g/d)
Biot
in
(ug/
d)VC
(mg/
d)Vi
t D
(ug/
d)Vi
t E (m
g/d)
Infa
nts
AIAI
AIAI
AIAI
AIAI
AIAI
AIAI
0-6 m
o40
00.2
0.32
0.165
0.41.7
540
54
7-12
mo
500
0.30.4
40.3
800.5
1.86
505
6Ch
ildre
nRD
AEA
RRD
AEA
RRD
AEA
RRD
AEA
RRD
AEA
RRD
AEA
RRD
AEA
RAI
AIRD
AEA
RAI
RDA
1-3 y
rs30
021
00.5
0.40.5
0.46
50.5
0.415
012
00.9
0.72
815
135
65
4-8 y
rs40
027
50.6
0.50.6
0.58
60.6
0.520
016
01.2
13
1225
225
76
Mal
es9-
13 y
600
445
0.90.7
0.90.8
129
10.8
300
250
1.81.5
420
4539
511
914
-18 y
900
630
1.21
1.31.1
1612
1.31.1
400
330
2.42
525
7563
515
1219
-30 y
625
1.21
1.31.1
1612
1.31.1
400
320
2.42
530
9075
515
1231
-50 y
625
1.21
1.31.1
1612
1.31.1
400
320
2.42
530
9075
515
1251
-70 y
625
1.21
1.31.1
1612
1.71.4
400
320
2.42
530
9075
1015
12>
70 y
625
1.21
1.31.1
1612
1.71.4
400
320
2.42
530
9075
1515
12Fe
mal
es9-
13 y
600
420
0.90.4
0.90.8
129
10.8
300
250
1.81.5
420
4539
511
914
-18 y
700
485
10.9
10.9
1411
1.21
400
330
2.42
525
6556
515
1219
-30 y
500
1.10.9
1.10.9
1411
1.31.1
400
320
2.42
530
7560
515
1231
-50 y
500
1.10.9
1.10.9
1411
1.31.1
400
320
2.42
530
7560
515
1251
-70 y
500
1.10.9
1.10.9
1411
1.51.3
400
320
2.42
530
7560
1015
12>
70 y
500
1.10.9
1.10.9
1411
1.51.3
400
320
2.42
530
7560
1515
12Pr
egna
ncy
< 18
y75
053
01.4
1.21.4
1.218
141.9
1.660
052
02.6
2.26
3080
665
1512
19-3
0 y77
055
01.4
1.21.4
1.218
141.9
1.660
052
02.6
2.26
3085
705
1512
31-5
0 y77
055
01.4
1.21.4
1.218
141.9
1.660
052
02.6
2.26
3085
705
1512
Lact
atio
n<
18 y
1200
880
1.41.2
1.61.3
1713
21.7
500
450
2.82.4
735
115
965
1916
19-3
0 y13
0090
01.4
1.21.6
1.317
132
1.750
045
02.8
2.47
3512
010
05
1916
31-5
0 y13
0090
01.4
1.21.6
1.317
132
1.750
045
02.8
2.47
3512
010
05
1916
Com
pile
d fr
om: 1
. A R
epor
t of t
he S
tand
ing
Com
mitt
ee o
n th
e Sc
ient
ific
Eval
uatio
n of
Die
tary
Ref
eren
ce In
take
s an
d its
Pan
el o
n Fo
late
, Oth
er B
Vita
min
s, an
d C
holin
e an
d Su
bcom
mitt
ee o
n U
pper
Ref
eren
ce L
evel
s of
Nut
rient
s, Fo
od a
nd
Nut
ritio
n Bo
ard,
Inst
itute
of M
edic
ine.
Die
tary
Ref
eren
ce In
take
s fo
r Thi
amin
, Rib
oflav
in, N
iaci
n, V
itam
in B
6, F
olat
e, V
itam
in B
12, P
anto
then
ic A
cid,
Bio
tin, a
nd C
holin
e (2
000,
592
pp)
: 2. P
anel
on
Die
tary
Ant
ioxi
dant
s an
d Re
late
d Co
mpo
unds
, Su
bcom
mitt
ees
on U
pper
Ref
eren
ce L
evel
s of
Nut
rient
s an
d In
terp
reta
tion
and
Use
s of
DRI
s, St
andi
ng C
omm
ittee
on
the
Scie
ntifi
c Ev
alua
tion
of D
ieta
ry R
efer
ence
Inta
kes,
Food
and
Nut
ritio
n Bo
ard.
Die
tary
Ref
eren
ce In
take
s fo
r Vita
min
C
, Vita
min
E, S
elen
ium
, and
Car
oten
oids
. (20
00, 5
29 p
p.):
3. A
Rep
ort o
f the
Sub
com
mitt
ees
on In
terp
reta
tion
and
Use
s of
Die
tary
Ref
eren
ce In
take
s an
d U
pper
Ref
eren
ce L
evel
s of
Nut
rient
s, an
d th
e St
andi
ng C
omm
ittee
on
the
Scie
ntifi
c Ev
alua
tion
of D
ieta
ry R
efer
ence
Inta
kes,
Food
and
Nut
ritio
n Bo
ard.
Die
tary
Ref
eren
ce In
take
s: A
pplic
atio
ns in
Die
tary
Ass
essm
ent.
(200
1, 3
06 p
p.):
4. P
anel
on
Mic
ronu
trie
nts,
Subc
omm
ittee
s on
Upp
er R
efer
ence
Lev
els
of N
utrie
nts
and
of In
terp
reta
tion
and
Use
of D
ieta
ry R
efer
ence
Inta
kes,
and
the
Stan
ding
Com
mitt
ee o
n th
e Sc
ient
ific
Eval
uatio
n of
Die
tary
Ref
eren
ce In
take
s, Fo
od a
nd N
utrit
ion
Boar
d. D
ieta
ry R
efer
ence
Inta
kes
for V
itam
in A
, Vita
min
K, A
rsen
ic, B
oron
, C
hrom
ium
, Cop
per,
Iodi
ne, I
ron,
Man
gane
se, M
olyb
denu
m, N
icke
l, Si
licon
, Van
adiu
m, a
nd Z
inc.
(200
2, 6
50 p
p.):5
. Sta
ndin
g Co
mm
ittee
on
the
Scie
ntifi
c Ev
alua
tion
of D
ieta
ry R
efer
ence
Inta
kes,
Food
and
Nut
ritio
n Bo
ard,
Inst
itute
of M
edic
ine.
D
ieta
ry R
efer
ence
Inta
kes
for C
alci
um, P
hosp
horu
s, M
agne
sium
, Vita
min
D, a
nd F
luor
ide.
(199
7, 4
48 p
p.

106
The Kenya National Micronutrient Survey 2011
Appendix 7: Population groups and the key measurement variables
Study Objective Population Sub-set for Data Collection NationalObjective 1-3 Anaemia, iron deficiency, and vitamin A deficiency
Preschool children aged 6-59 monthsChildren aged 5-14 years oldWomen of reproductive age 15-49 years (including non-pregnant) Pregnant women age 15 – 49 yearsMen 15-54 years old
Objective 4 Iodine deficiency
Children 5-14 yearsWomen of reproductive age 15-49 years (including non-pregnant) Pregnant women age 15-49 years
Objective 5-6 Folate and vitamin B12 deficiency
Women of reproductive age 15-49 years (including non-pregnant)Pregnant women age 15-49 yearsPreschool children aged 6-59 months
Objective 7 Supplementation coverage Preschool children 6-59 months old (Vit. A Supplem. Coverage)Women delivered in past 12 months (Vit. A Suppl. Coverage)Women delivered in past 12 months (Perinatal Iron Suppl. coverage)
Objective 8-9 Relative roles of salt consumed in households on the iodine status
Children 5 - 14 years old and Women 15 – 49 years old
Objective 10 Wasting, stunting and underweight and BMI
Children 6 – 59 moths (Wasting, Stunting & Underweight)Non-pregnant women 15 – 49 years old (BMI)
Objective 11 Factors contributing to anaemia
Preschool children 6 – 59 months
MalariaHIVHaemoglobinopathies Intestinal parasites
Children 5 – 14 years MalariaHIVIntestinal parasitesSchistosomiasis
Women Reproductive age include pregnant and non-pregnant aged 15 – 49 years
MalariaHIVHaemoglobinopathies Intestinal parasitesSchistosomiasis
Objective 12 Zinc deficiency
Preschool children aged 6-59 yearsChildren aged 5-14 years oldAll reproductive age women 15 – 49 years oldMen 15 – 49 years old
Objective 13 Household and/or individual dietary consumption
Household (food consumption and/or 24 hour recall methodology)Multiple target groups (food consumption and/or 24 hour recall methodology)
Objective 14 Magnitude of infection
Preschool children aged 6-59 monthsChildren aged 5-14 years oldWomen of reproductive age 15-49 years (including non-pregnant) Pregnant women age 15 – 49 yearsMen 15-54 years old

107
The Kenya National Micronutrient Survey 2011
Ap
pen
dix
8: S
amp
le s
izes
an
d p
reci
sion
for
max
imu
m s
amp
le s
ize
for
each
tar
get
gro
up
Popu
latio
n gr
oup
Age
Grou
pIn
dica
tor
Prev
alen
ce
estim
ate
Prec
ision
per
st
ratu
m (+
X%
) Val
ue fo
r M
axim
um
sam
ple s
ize
Desig
n Eff
ect
Resp
onse
ra
teSa
mpl
e siz
e per
St
ratu
m
Tota
l sam
ple
size f
or
Natio
nal
estim
ates
an
d pr
ecisi
on
(%)
Tota
l nu
mbe
r of
HH
Num
ber
of H
H pe
r clu
ster
Mea
n HH
siz
eTa
rget
gr
oup
as %
of
the t
otal
Po
pula
tion
Sam
ples
to
be
take
n pe
r in
divi
dual
Pres
choo
l Ch
ildre
n6-
59 M
ons
Anae
mia
65%
Rura
l: 4.0%
Ur
ban:
6.1%
290
%Ru
ral: 1
088
Urba
n:46
71,5
54
(3.4%
)2,9
6010
per
cluste
r4.2
14.2%
Bloo
d 2m
l St
ool: 3
0gm
s
Scho
ol Ch
ildre
n5-
14 ye
ars
Iodine
de
ficien
cy25
%Ru
ral: 4
.4%
Urba
n:6.7
%2
80%
Rura
l: 751
Ur
ban:
322
1,072
(3.7%
)1,1
844 p
er cl
uste
r4.2
29.0%
Bloo
d 5m
l Ur
ine 30
ml
Stoo
l: 30g
ms
Non-
Preg
nant
W
omen
15-4
9 ye
ars
Iron
defic
iency
50%
Rura
l: 4.0%
Ur
ban:
6.1%
290
%Ru
ral: 1
196
Urba
n:51
31,7
08 (3
.4%)
1,184
4 per
clus
ter
4.245
.4%Bl
ood 9
ml
Urine
30 m
l St
ool: 3
0gm
s
Preg
nant
W
omen
15-4
9 ye
ars
Iron
defic
iency
50%
Rura
l: 9.9%
Ur
ban:
15.1%
286
%Ru
ral: 1
96
Urba
n:84
283 (
8.3%
)2,9
6010
per
cluste
r4.2
7% of
all
WRA
Bloo
d 9m
l Ur
ine 30
ml
Stoo
l: 30g
ms
Men
15-5
4 ye
ars
Zinc
defic
iency
50%
Rura
l:7.1%
Ur
ban:
10.8%
280
%Ru
ral: 3
84
Urba
n:16
554
8 (5.9
%)
528
2 per
clus
ter
4.243
.3%Bl
ood 6
ml
Hous
ehold
sFo
rtifie
d fo
ods
50%
Rura
l: Ur
ban:
290
%Ru
ral:
Urba
n:29
6029
6010
n/a
n/a
Stap
le fo
ods

108
The Kenya National Micronutrient Survey 2011
Appendix 9: KEMRI ERC Approvals

109
The Kenya National Micronutrient Survey 2011
Appendix 10: A map of Kenya showing clusters covered in KNMS 2011

110
The Kenya National Micronutrient Survey 2011
Appendix 11: Sampling Errors
Appendix 11A: Sampling Errors for Rural Kenya
Pre School Children (6-59 Months old)
Variable Category Estimate Std Err N W DEFF DEFT 95% CI
Anaemia PSC (Haemoglobin <12.0g/dL adjusted for altitude and corrected for inflammation)
Anaemic 26.8806 2.4963 827 1.8773 1.3701 21.9622 31.7991
Normal 73.1194 2.4963 827 1.8773 1.3701 68.2009 78.0378
ID PSC (FER <15ug/L corrected for inflammation
Deficiency 21.4878 2.8124 918 3.1047 1.7620 15.9488 27.0267
Normal 78.5122 2.8124 918 3.1047 1.7620 72.9733 84.0512
IDA PSC (Haemoglobin <12.0g/dL and FER <15ug/L
IDA 12.5613 2.3212 827 2.9047 1.7043 7.9878 17.1348
Normal 87.4387 2.3212 827 2.9047 1.7043 82.8652 92.0122
Vitamin A deficiency PSC (using RBP<0.70 μmol/L)
Severe 8.0951 1.3757 918 1.6845 1.2979 5.3857 10.8044
Marginal 51.4280 2.6610 918 1.8772 1.3701 46.1870 56.6689
Normal 40.4770 2.6294 918 1.9004 1.3785 35.2982 45.6557
Malaria status PSC Positive 2.6651 0.9896 848 2.2789 1.5096 0.7155 4.6147
Negative 97.3349 0.9896 848 2.2789 1.5096 95.3853 99.2845
HIV results PSC Positive 1.4873 0.4934 903 1.0819 1.0401 1.5155 2.4591
Negative 98.5127 0.4934 886 1.0819 1.0401 97.5409 99.4845
Sickle cell genotype PSC AA 93.1430 1.3772 876 1.9111 1.3824 90.4304 95.8554
AS 6.3121 1.2498 876 1.6997 1.3037 3.8506 8.7736
SS 0.5449 0.3342 876 1.3265 1.1517 -0.1134 1.2032
Thalassaemia PSC Het 27.4833 2.4482 862 1.8959 1.3769 22.6613 32.3052
Homo 6.1772 1.2252 862 1.6328 1.2778 3.7641 8.5902
Normal 66.3395 2.7201 862 2.0888 1.4453 60.9821 71.6969
Tape_worm_qualitative PSC Present 22.3401 4.6188 722 6.3946 2.5288 13.2386 31.4416
Absent 77.6599 4.6188 722 6.3946 2.5288 68.5583 86.7614
Hookworm_qualitative PSC Present 24.6420 4.5716 722 5.8528 2.4193 15.6336 33.6504
Absent 75.3580 4.5716 722 5.8528 2.4193 66.3495 84.3664
Schistosoma_mansoni_qualitative PSC
Present 22.9352 4.7747 722 6.7075 2.5899 13.5265 32.3437
Absent 77.0649 4.7747 722 6.7075 2.5899 67.6562 86.4734
Calcium-RDA-24 hour recall PSC Inadequate 74.7827 4.1987 281 1.9072 1.3810 66.5033 83.0620
Adequate 25.2174 4.1987 281 1.9072 1.3810 16.9380 33.4967
Iron-RDA-24 hour recall PSC Inadequate 47.9682 4.9778 281 2.0255 1.4232 38.1525 57.7838
Adequate 52.0319 4.9778 281 2.0255 1.4232 42.2162 61.8475
Zinc-RDA-24 hour recall PSC Inadequate 52.8084 4.8598 281 1.9335 1.3905 43.2254 62.3914
Adequate 47.1916 4.8598 281 1.9335 1.3905 37.6086 56.7745
Vitamin A-24 hour recall PSC Inadequate 75.0269 3.7163 281 1.5039 1.2263 67.6986 82.3551
Adequate 24.9731 3.7163 281 1.5039 1.2263 17.6449 32.3013
School Aged Children (5- 14 years)
Variable Category Mean Std Err N W DEFF DEFT 95% CI
Anaemia SAC (Haemoglobin <12.0g/dL adjusted for altitude and corrected for inflammation)
Anaemic 19.6496 2.7604 872 3.1356 1.7708 14.2092 25.0899
Normal 80.3505 2.7604 872 3.1356 1.7708 74.9101 85.7908

111
The Kenya National Micronutrient Survey 2011
ID SAC (FER <15ug/L corrected for inflammation
Deficiency 9.9775 2.2174 942 3.7964 1.9484 5.6088 14.3463
Normal 90.0225 2.2174 942 3.7964 1.9484 85.6537 94.3913
IDA SAC (Haemoglobin <12.0g/dL and FER <15ug/L
IDA 5.1968 1.6837 872 3.7385 1.9335 1.8784 8.5152
Normal 94.8032 1.6837 872 3.7385 1.9335 91.4848 98.1216
Vitamin A deficiency SAC (using RBP<0.70 μmol/L)
Severe 5.0017 1.1087 942 1.7941 1.3395 2.8173 7.1861
Marginal 36.4523 2.7512 942 2.2661 1.5054 31.0318 41.8727
Normal 58.5460 3.2332 942 2.9873 1.7284 52.1758 64.9162
Malaria status SAC Positive 4.7410 1.6779 908 4.1666 2.0412 1.4345 8.0475
Negative 95.2590 1.6779 908 4.1666 2.0412 91.9525 98.5655
HIV results SAC Positive 0.5392 0.2602 981 0.9193 0.9588 0.0265 1.0519
Negative 99.4608 0.2602 981 0.9193 0.9588 98.9481 99.9735
Sickle cell genotype SAC AA 91.6215 1.8985 904 3.1236 1.7674 87.8809 95.3622
AS 8.3785 1.8985 904 3.1236 1.7674 4.6378 12.1191
Thalassaemia SAC Het 24.4654 2.5345 878 2.2465 1.4988 19.4713 29.4596
Homo 3.4037 0.9306 878 1.7023 1.3047 1.5699 5.2374
Normal 72.1309 2.8187 878 2.5542 1.5982 66.5768 77.6850
Pregnant Women (Age 15 -49 years)
Variable Category Mean Std Err N W DEFF DEFT 95% CI
Anaemia PW (Haemoglobin <12.0g/dL adjusted for altitude and corrected for inflammation)
Anaemic 50.2537 7.4459 104 1.3338 1.1549 35.4300 65.0774
Normal 49.7463 7.4459 104 1.3338 1.1549 34.9226 64.5700
ID (FER <15ug/L corrected for inflammation) - PW
Deficiency 46.1295 7.8199 111 1.6531 1.2857 30.5760 61.6830
Normal 53.8705 7.8199 111 1.6531 1.2857 38.3170 69.4240
IDA PW (Haemoglobin <12.0g/dL and FER <15ug/L
IDA 36.7459 7.5414 104 1.4716 1.2131 21.7321 51.7597
Normal 63.2541 7.5414 104 1.4716 1.2131 48.2403 78.2679
Vitamin A deficiency PW (using RBP<0.70 μmol/L)
Severe 111
Marginal 15.5810 4.9405 111 1.2466 1.1165 5.7546 25.4074
Normal 84.4190 4.9405 111 1.2466 1.1165 74.5926 94.2454
Malaria status PW Positive 0.6264 0.6334 110 0.4191 0.6474 -0.6333 1.8862
Negative 99.3736 0.6334 110 0.4191 0.6474 98.1138 100.6333
HIV results PW Positive 0 0 119 0 0 0 0
Negative 100 0 118 0.5797 0.7614 100 100
Sickle cell genotype PW AA 94.5982 2.9679 113 1.2801 1.1314 88.6983 100.4981
AS 5.4018 2.9679 113 1.2801 1.1314 -0.4981 11.3017
Thalassaemia PW Het 45.1788 7.0660 109 1.4366 1.1986 31.1321 59.2255
Homo 1.3635 0.9792 109 0.5081 0.7128 -0.5831 3.3100
Normal 53.4577 7.1248 109 1.4540 1.2058 39.2942 67.6213
Tape_worm_qualitative PW Present 23.5846 7.5006 76 1.4862 1.2191 8.5911 38.5779
Absent 76.4154 7.5006 76 1.4862 1.2191 61.4220 91.4089
Hookworm_qualitative PW Present 26.5750 7.6474 76 1.4269 1.1945 11.2880 41.8619
Absent 73.4250 7.6474 76 1.4269 1.1945 58.1380 88.7120
Schistosoma_mansoni_qualitative PW
Present 24.4291 7.6076 76 1.4925 1.2217 9.2218 39.6364
Absent 75.5709 7.6076 76 1.4925 1.2217 60.3635 90.7782
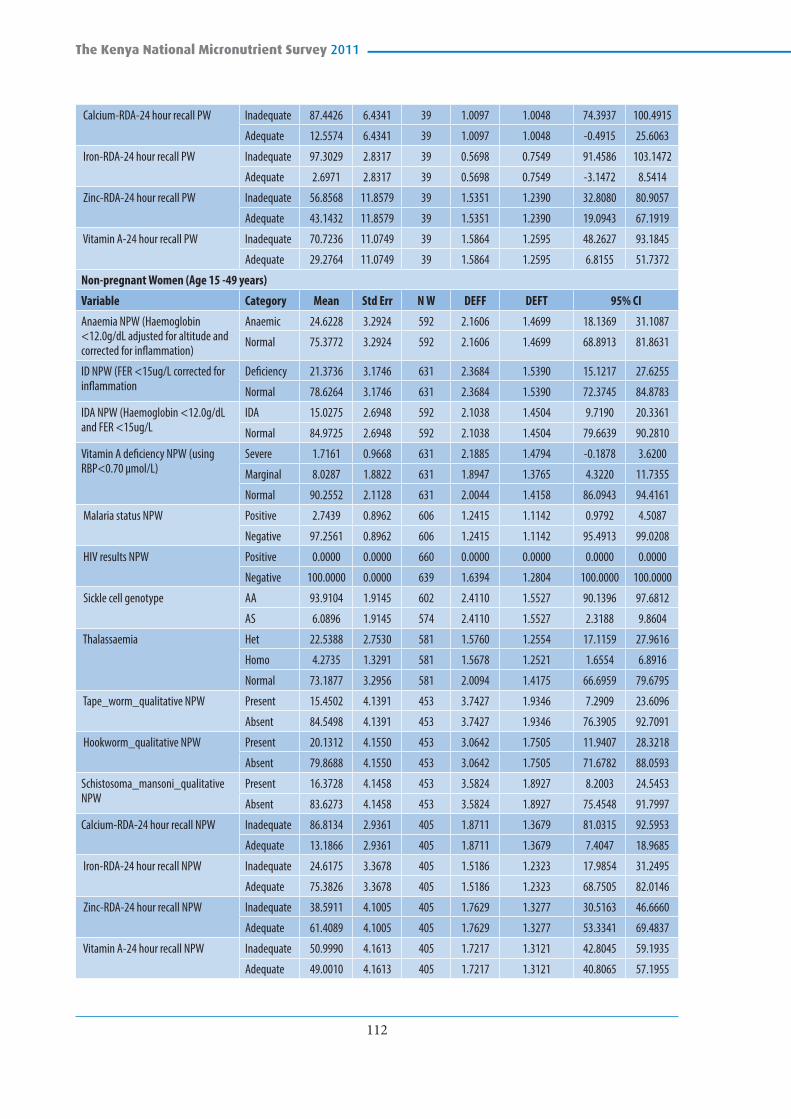
112
The Kenya National Micronutrient Survey 2011
Calcium-RDA-24 hour recall PW Inadequate 87.4426 6.4341 39 1.0097 1.0048 74.3937 100.4915
Adequate 12.5574 6.4341 39 1.0097 1.0048 -0.4915 25.6063
Iron-RDA-24 hour recall PW Inadequate 97.3029 2.8317 39 0.5698 0.7549 91.4586 103.1472
Adequate 2.6971 2.8317 39 0.5698 0.7549 -3.1472 8.5414
Zinc-RDA-24 hour recall PW Inadequate 56.8568 11.8579 39 1.5351 1.2390 32.8080 80.9057
Adequate 43.1432 11.8579 39 1.5351 1.2390 19.0943 67.1919
Vitamin A-24 hour recall PW Inadequate 70.7236 11.0749 39 1.5864 1.2595 48.2627 93.1845
Adequate 29.2764 11.0749 39 1.5864 1.2595 6.8155 51.7372
Non-pregnant Women (Age 15 -49 years)
Variable Category Mean Std Err N W DEFF DEFT 95% CI
Anaemia NPW (Haemoglobin <12.0g/dL adjusted for altitude and corrected for inflammation)
Anaemic 24.6228 3.2924 592 2.1606 1.4699 18.1369 31.1087
Normal 75.3772 3.2924 592 2.1606 1.4699 68.8913 81.8631
ID NPW (FER <15ug/L corrected for inflammation
Deficiency 21.3736 3.1746 631 2.3684 1.5390 15.1217 27.6255
Normal 78.6264 3.1746 631 2.3684 1.5390 72.3745 84.8783
IDA NPW (Haemoglobin <12.0g/dL and FER <15ug/L
IDA 15.0275 2.6948 592 2.1038 1.4504 9.7190 20.3361
Normal 84.9725 2.6948 592 2.1038 1.4504 79.6639 90.2810
Vitamin A deficiency NPW (using RBP<0.70 μmol/L)
Severe 1.7161 0.9668 631 2.1885 1.4794 -0.1878 3.6200
Marginal 8.0287 1.8822 631 1.8947 1.3765 4.3220 11.7355
Normal 90.2552 2.1128 631 2.0044 1.4158 86.0943 94.4161
Malaria status NPW Positive 2.7439 0.8962 606 1.2415 1.1142 0.9792 4.5087
Negative 97.2561 0.8962 606 1.2415 1.1142 95.4913 99.0208
HIV results NPW Positive 0.0000 0.0000 660 0.0000 0.0000 0.0000 0.0000
Negative 100.0000 0.0000 639 1.6394 1.2804 100.0000 100.0000
Sickle cell genotype AA 93.9104 1.9145 602 2.4110 1.5527 90.1396 97.6812
AS 6.0896 1.9145 574 2.4110 1.5527 2.3188 9.8604
Thalassaemia Het 22.5388 2.7530 581 1.5760 1.2554 17.1159 27.9616
Homo 4.2735 1.3291 581 1.5678 1.2521 1.6554 6.8916
Normal 73.1877 3.2956 581 2.0094 1.4175 66.6959 79.6795
Tape_worm_qualitative NPW Present 15.4502 4.1391 453 3.7427 1.9346 7.2909 23.6096
Absent 84.5498 4.1391 453 3.7427 1.9346 76.3905 92.7091
Hookworm_qualitative NPW Present 20.1312 4.1550 453 3.0642 1.7505 11.9407 28.3218
Absent 79.8688 4.1550 453 3.0642 1.7505 71.6782 88.0593
Schistosoma_mansoni_qualitative NPW
Present 16.3728 4.1458 453 3.5824 1.8927 8.2003 24.5453
Absent 83.6273 4.1458 453 3.5824 1.8927 75.4548 91.7997
Calcium-RDA-24 hour recall NPW Inadequate 86.8134 2.9361 405 1.8711 1.3679 81.0315 92.5953
Adequate 13.1866 2.9361 405 1.8711 1.3679 7.4047 18.9685
Iron-RDA-24 hour recall NPW Inadequate 24.6175 3.3678 405 1.5186 1.2323 17.9854 31.2495
Adequate 75.3826 3.3678 405 1.5186 1.2323 68.7505 82.0146
Zinc-RDA-24 hour recall NPW Inadequate 38.5911 4.1005 405 1.7629 1.3277 30.5163 46.6660
Adequate 61.4089 4.1005 405 1.7629 1.3277 53.3341 69.4837
Vitamin A-24 hour recall NPW Inadequate 50.9990 4.1613 405 1.7217 1.3121 42.8045 59.1935
Adequate 49.0010 4.1613 405 1.7217 1.3121 40.8065 57.1955

113
The Kenya National Micronutrient Survey 2011
MEN (age 15-54 years)
Variable Category Mean Std Err N W DEFF DEFT 95% CI
Anaemia MEN (Haemoglobin <12.0g/dL adjusted for altitude and corrected for inflammation)
Anaemic 12.7892 3.3751 238 1.4486 1.2036 6.1201 19.4584
Normal 87.2108 3.3751 238 1.4486 1.2036 80.5416 93.8799
ID MEN (FER <15ug/L corrected for inflammation
Deficient 4.8712 1.7997 245 1.0432 1.0214 1.3154 8.4269
Normal 95.1288 1.7997 245 1.0432 1.0214 91.5731 98.6846
WHO classification of BMI MEN Thinness 25.3373 4.5248 270 1.5960 1.2633 16.3990 34.2756
Normal 64.0361 5.0845 270 1.6553 1.2866 53.9923 74.0799
Obese 10.6266 3.4623 270 1.8613 1.3643 3.7872 17.4660
Sickle cell genotype MEN AA 93.2574 3.9459 224 3.4288 1.8517 85.4546 101.0602
AS 6.7426 3.9459 224 3.4288 1.8517 -1.0602 14.5454
Thalassaemia MEN Homo 3.0438 1.3622 210 0.8307 0.9114 0.3505 5.7370
Other 96.9562 1.3622 210 0.8307 0.9114 94.2630 99.6495
Malaria status MEN Positive
Negative 100 0 236 0.9639 981,762.0000 100 100
HIV results MEN Positive 7.0325 6.8269 71 4.0505 4.0505 -6.7651 20.8301
Negative 92.9675 6.8269 69 4.0505 2.0126 79.1699 106.7651

114
The Kenya National Micronutrient Survey 2011
Appendix 11B: Sampling Errors for Urban areas of Kenya
Pre School Children (6-59 Months old)
Variable Category Estimate Std Err N W DEFF DEFT 95% CI
Anaemia PSC (Haemoglobin <12.0g/dL adjusted for altitude and corrected for inflammation)
Anaemic 24.8585 4.1924 827 2.2008 1.4835 16.5984 33.1187
Normal 75.1415 4.1924 827 2.2008 1.4835 66.8813 83.4016
ID PSC (FER <15ug/L corrected for inflammation
Deficiency 22.6237 3.4532 918 1.7356 1.3174 15.8220 29.4248
Normal 77.3763 3.4532 918 1.7356 1.3174 70.5752 84.1774
IDA PSC (Haemoglobin <12.0g/dL and FER <15ug/L
IDA 12.3218 2.8059 827 1.7045 1.3056 6.7934 17.8502
Normal 87.6782 2.8059 827 1.7045 1.3056 82.1497 93.2066
Vitamin A deficiency PSC (using RBP<0.70 μmol/L)
Severe 11.9652 3.1694 918 2.4297 1.5587 5.7231 18.2074
Marginal 55.4867 5.2243 918 2.8155 1.6779 45.1973 65.7760
Normal 32.5481 5.6745 918 3.7368 1.9331 21.3720 43.7240
Malaria status PSC Positive 0.0000 0.0000 848 0.0000 0.0000 0.0000 0.0000
Negative 100.0000 0.0000 848 3.1020 0.7613 100.0000 100.0000
HIV results PSC Positive 1.4080 0.8425 903 1.2836 0.1329 -0.2513 3.0674
Negative 98.5920 0.8425 886 1.2836 1.1329 96.9326 100.2513
Sickle cell genotype PSC AA 89.4370 3.6746 876 3.3081 1.8188 82.1995 96.6744
AS 10.2213 3.6646 876 3.3873 1.8405 3.0035 17.4391
SS 0.3417 0.3446 876 0.8072 0.8984 -0.3370 1.0204
Thalassaemia PSC Het 25.5030 7.2201 862 6.3266 2.5153 11.2825 39.7235
Homo 2.5987 1.2441 862 1.4100 1.1874 0.1483 5.0491
Normal 71.8983 7.1495 862 5.8334 2.4152 57.8160 85.9798
Tape_worm_qualitative PSC Present 16.8958 4.9197 722 3.4641 1.8612 7.2015 26.5900
Absent 83.1042 4.9197 722 3.4641 1.8612 73.4099 92.7985
Hookworm_qualitative PSC Present 17.0851 4.9246 722 3.4405 1.8549 7.3810 26.7891
Absent 82.9149 4.9246 722 3.4405 1.8549 73.2108 92.6190
Schistosoma_mansoni_qualitative PSC
Present 17.5479 4.9268 722 3.3715 1.8362 7.8395 27.2562
Absent 82.4521 4.9268 722 3.3715 1.8362 72.7438 92.1604
Calcium-RDA-24 hour recall PSC Inadequate 69.8583 6.5925 281 1.5681 1.2523 56.8585 82.8581
Adequate 30.1417 6.5925 281 1.5681 1.2523 17.1418 43.1415
Iron-RDA-24 hour recall PSC Inadequate 39.5855 6.6558 281 1.4073 1.1863 26.4609 52.7101
Adequate 60.4145 6.6558 281 1.4073 1.1863 47.2898 73.5391
Zinc-RDA-24 hour recall PSC Inadequate 44.2419 7.9853 281 1.9639 1.4014 28.4956 59.9881
Adequate 55.7581 7.9853 281 1.9639 1.4014 40.0119 71.5044
Vitamin A-24 hour recall PSC Inadequate 56.8599 8.3978 281 2.1843 1.4779 40.3002 73.4196
Adequate 43.1401 8.3978 281 2.1843 1.4779 26.5804 59.6997
School Aged Children (5- 14 years)
Variable Category Mean Std Err N W DEFF DEFT 95% CI
Anaemia SAC (Haemoglobin <12.0g/dL adjusted for altitude and corrected for inflammation)
Anaemic 11.5002 2.6883 872 1.5714 1.2536 6.2020 16.7984
Normal 88.4998 2.6883 872 1.5714 1.2536 83.2016 93.7980
ID SAC (FER <15ug/L corrected for inflammation
Deficiency 7.6485 2.3173 942 1.8814 1.3716 3.0828 12.2143
Normal 92.3515 2.3173 942 1.8814 1.3716 87.7857 96.9172

115
The Kenya National Micronutrient Survey 2011
IDA SAC (Haemoglobin <12.0g/dL and FER <15ug/L
IDA 3.8257 1.5138 872 1.3784 1.1741 0.8422 6.8092
Normal 96.1743 1.5138 872 1.3784 1.1741 93.1908 99.1578
Vitamin A deficiency SAC (using RBP<0.70 μmol/L)
Severe 3.7012 1.3900 942 1.3414 1.1582 0.9626 6.4398
Marginal 40.6442 6.7938 942 4.7346 2.1759 27.2587 54.0297
Normal 55.6547 6.9555 942 4.8510 2.2025 41.9506 69.3588
Malaria status SAC Positive 0.7535 0.6039 908 1.1636 1.0787 -0.4365 1.9436
Negative 99.2465 0.6039 908 1.1636 1.0787 98.0564 100.4365
HIV results SAC Positive 0.4957 0.4275 981 0.9634 0.9815 -0.3466 1.3380
Negative 99.5043 0.4275 981 0.9634 0.9815 98.6619 100.3466
Sickle cell genotype SAC AA 95.6827 1.6004 904 1.4739 1.2141 92.5294 98.8360
AS 4.3173 1.6004 904 1.4739 1.2141 1.1640 7.4706
Thalassaemia SAC Het 24.8139 6.4877 878 5.2054 2.2815 12.0302 37.5977
Homo 4.1760 1.7458 878 1.7573 1.3256 0.7360 7.6161
Normal 71.0100 6.6228 878 4.9161 2.2172 57.9601 84.0600
Pregnant Women (Age 15 -49 years)
Variable Category Mean Std Err N W DEFF DEFT 95% CI
Anaemia PW (Haemoglobin <12.0g/dL adjusted for altitude and corrected for inflammation)
Anaemic 29.3705 8.9408 104 1.6515 1.2851 11.5707 47.1702
Normal 70.6295 8.9408 104 1.6515 1.2851 52.8298 88.4293
ID (FER <15ug/L corrected for inflammation) - PW
Deficiency 20.3802 7.5338 111 1.4979 1.2239 5.3958 35.3645
Normal 79.6198 7.5338 111 1.4979 1.2239 64.6355 94.6042
IDA PW (Haemoglobin <12.0g/dL and FER <15ug/L
IDA 10.4534 4.2210 104 0.8158 0.9032 2.0500 18.8569
Normal 89.5466 4.2210 104 0.8158 0.9032 81.1431 97.9500
Vitamin A deficiency PW (using RBP<0.70 μmol/L)
Severe 12.9889 # 111 4.3429 2.0840 -8.3047 34.2824
Marginal 31.2068 9.8025 111 1.9167 1.3845 11.7101 50.7036
Normal 55.8043 11.4439 111 2.2739 1.5080 33.0429 78.5658
Malaria status PW Positive 0 0 110 0 0 0 0
Negative 100 0 110 1.1469 1.0710 100 100
HIV results PW Positive 2.2299 2.2228 119 1.0059 1.0029 -2.1866 6.6465
Negative 97.7701 2.2228 118 1.0059 1.0029 93.3535 102.1866
Sickle cell genotype PW AA 100 0 113 0 0 0 0
AS 0 0 113 0 0 0 0
Thalassaemia PW Het 25.5894 8.9423 109 1.5427 1.2420 7.8126 43.3662
Homo 1.1329 1.1689 109 0.4482 0.6694 -1.1909 3.4566
Normal 73.2777 9.0063 109 1.5217 1.2336 55.3737 91.1817
Tape_worm_qualitative PW Present 14.2610 9.4903 76 2.0177 1.4204 -4.7099 33.2310
Absent 85.7390 9.4903 76 2.0177 1.4204 66.7681 104.7099
Hookworm_qualitative PW Present 13.5486 9.4139 76 2.0725 1.4396 -5.2695 32.3660
Absent 86.4514 9.4139 76 2.0725 1.4396 67.6334 105.2695
Schistosoma_mansoni_qualitative PW
Present 13.5486 9.4139 76 2.0725 1.4396 -5.2695 32.3660
Absent 86.4514 9.4139 76 2.0725 1.4396 67.6334 105.2695
Calcium-RDA-24 hour recall PW Inadequate 96.3489 3.8994 39 0.4849 0.6964 88.4405 104.2573
Adequate 3.6511 3.8994 39 0.4849 0.6964 -4.2573 11.5595

116
The Kenya National Micronutrient Survey 2011
Iron-RDA-24 hour recallNPW Inadequate 100 39
Adequate 39
Zinc-RDA-24 hour recall PW Inadequate 93.5234 5.0815 39 0.4783 0.6916 83.2177 103.8292
Adequate 6.4766 5.0815 39 0.4783 0.6916 -3.8292 16.7823
Vitamin A-24 hour recall PW Inadequate 69.1729 17.4663 39 1.6051 1.2669 33.7495 104.5963
Adequate 30.8271 17.4663 39 1.6051 1.2669 -4.5963 66.2504
Non-pregnant Women (Age 15 -49 years)
Variable Category Mean Std Err N W DEFF DEFT 95% CI
Anaemia NPW (Haemoglobin <12.0g/dL adjusted for altitude and corrected for inflammation)
Anaemic 17.2866 3.7564 592 2.1816 1.4770 9.8866 24.6865
Normal 82.7134 3.7564 592 2.1816 1.4770 75.3135 90.1134
ID NPW (FER <15ug/L corrected for inflammation
Deficiency 21.3288 4.0660 + 2.3160 1.5219 13.3215 29.3361
Normal 78.6712 4.0660 631 2.3160 1.5219 70.6639 86.6785
IDA NPW (Haemoglobin <12.0g/dL and FER <15ug/L
IDA 12.3928 3.4034 592 2.3585 1.5357 5.6883 19.0973
Normal 87.6072 3.4034 592 2.3585 1.5357 80.9027 94.3117
Vitamin A deficiency NPW (using RBP<0.70 μmol/L)
Severe 0.2512 0.1813 631 0.3083 0.5553 -0.1058 0.6081
Marginal 8.1301 2.6634 631 2.2325 1.4942 2.8849 13.3752
Normal 91.6188 2.6858 631 2.2082 1.4860 86.3295 96.9080
Malaria status NPW Positive 2.1732 1.0550 606 1.2905 1.1360 0.0958 4.2507
Negative 97.8268 1.0550 606 1.2905 1.1360 95.7493 99.9042
HIV results NPW Positive 0.0000 0.0000 660 0.0000 0.0000 0.0000 0.0000
Negative 100.0000 0.0000 639 3.0976 1.7600 100.0000 100.0000
Sickle cell genotype NPW AA 87.5328 3.8521 602 3.0568 1.7484 79.9455 95.1201
AS 12.4672 3.8521 574 3.0568 1.7484 4.8799 20.0545
Thalassaemia NPW Het 20.8262 5.4650 581 3.9296 1.9823 10.0612 31.5912
Homo 7.6312 4.0373 581 5.0167 2.2398 -0.3215 15.5830
Normal 71.5426 5.6610 581 3.4149 1.8480 60.3915 82.6937
Tape_worm_qualitative NPW Present 11.5752 3.6063 453 2.1171 1.4550 4.4662 18.6841
Absent 88.4249 3.6063 453 2.1171 1.4550 81.3159 95.5338
Hookworm_qualitative NPW Present 11.9457 3.6366 453 2.0949 1.4474 4.7770 19.1143
Absent 88.0544 3.6366 453 2.0949 1.4474 80.8857 95.2231
Schistosoma_mansoni_qualitativ NPW
Present 12.3632 3.7285 453 2.1379 1.4622 5.0132 19.7131
Absent 87.6368 3.7285 453 2.1379 1.4622 80.2869 94.9868
Calcium-RDA-24 hour recall NPW Inadequate 96.3666 1.6273 405 1.1764 1.0846 93.1619 99.5712
Adequate 3.6335 1.6273 405 1.1764 1.0846 0.4288 6.8381
Iron-RDA-24 hour recall NPW Inadequate 27.5804 6.0167 405 2.8190 1.6790 15.7321 39.4287
Adequate 72.4196 6.0167 405 2.8190 1.6790 60.5713 84.2679
Zinc-RDA-24 hour recall NPW Inadequate 48.2184 5.7318 405 2.0466 1.4306 36.9312 59.5056
Adequate 51.7816 5.7318 405 2.0466 1.4306 40.4944 63.0689
Vitamin A-24 hour recall NPW Inadequate 45.1477 5.6012 405 1.9704 1.4037 34.1177 56.1777
Adequate 54.8523 5.6012 405 1.9704 1.4037 43.8223 65.8824

117
The Kenya National Micronutrient Survey 2011
MEN (age 15-54 years)
Variable Category Mean Std Err N W DEFF DEFT 95% CI
Anaemia MEN (Haemoglobin <12.0g/dL adjusted for altitude and corrected for inflammation)
Anaemic 5.1765 2.4288 238 1.1436 1.0694 0.3771 9.9759
Normal 94.8235 2.4288 238 1.1436 1.0694 90.0241 99.6229
ID MEN (FER <15ug/L corrected for inflammation
Deficient 1.6317 1.3179 245 1.0253 1.0126 -0.9720 4.2353
Normal 98.3683 1.3179 245 1.0253 1.0126 95.7646 100.9720
WHO classification of BMI MEN Thinness 7.8204 3.3593 270 1.9026 1.3794 1.1844 14.4564
Normal 83.7251 5.0922 270 2.3128 1.5208 73.6661 93.7842
Obese 8.4545 3.5123 270 1.9372 1.3918 1.5163 15.3927
Sickle cell genotype MEN AA 96.9868 2.7087 224 2.1223 1.4568 91.6305 102.3431
AS 3.0132 2.7087 224 2.1223 1.4568 -2.3431 8.3695
Thalassaemia MEN Homo 2.7708 2.2167 210 1.5299 1.2369 -1.6119 7.1535
Other 97.2292 2.2167 210 1.5299 1.2369 92.8465 101.6119
Malaria status MEN Positive 236
Negative 100 0 236 3.3377 0.8269 100 100
HIV results MEN Positive 1.9366 2.0654 71 0.2960 0.2960 -2.2377 6.1110
Negative 98.0634 2.0654 69 0.2960 0.5441 93.8890 102.2377
118
The Kenya National Micronutrient Survey 2011
Appendix 12: List of Investigators and Institutional Affiliations
Principal Investigator OrganizationYeri Kombe KEMRI
Co-Investigators Charles Mbakaya KEMRI
Lydia Kaduka KEMRI
Zipporah N. Bukania KEMRI
Richard Mutisya KEMRI
Erastus Muniu KEMRI
Moses Mwangi KEMRI
Philip Ndemwa KEMRI
Lawrence N. Muthami KEMRI
Lucy Kanyara KEMRI
Tom Williams KEMRI/Wellcome Trust
Terry Wefwafwa MoH
John Maina Mwai MoH
Gladys Mugambi MoH
Evelyne Kikechi MoH
James Gatungu KNBS
Samoei Paul K. KNBS
Robert C. B. Buluma KNBS
James Ng’ang’a K. KNBS
Nancy Njine NPHLS
Ruth Situma UNICEF
Ismail Arte Rage Kassim UNICEF
James Wirth GAIN, GroundWork LLC
C J Jones GAIN
Christopher Wanyoike MI
Lucy Murage Rowa MI
Yvonne Forsen WFP
Emily Sakwa Madete WFP
Assumpta Muriithi WHO

119
The Kenya National Micronutrient Survey 2011
Appendix 13: Survey Field Team1 Mwambire Francis Safari
2 Maureen Njeri Mwarangu
3 Anderson K. Osaro
4 Yvonne Opanga
5 Otieno Crystal G. Anyango
6 Abbas B. Hussein
7 Simani Joshua Ogoncho
8 Robert M. Karanja
9 Salma Ali Kea
10 Judith Wawira Mwangangi
11 Yusifu Bille Salat
12 Siyatha Ahmed Hillow
13 Natha Ahmed Badel
14 Velma Nyapera
15 Mercy Nelima Mukoya
16 Jawira Hussein Haji
17 Hope Lola M. Mwanyumba
18 Everlyne Adhiambo
19 Lenah Chepngetich
20 Martha R. Nabonwe
21 Jackline Milkah M. Mwangi
22 Emma Bosibori Osoro
23 Elizabeth W. Ndogo
24 Ebla Ali Omar
25 Jackob Kipruto Korir
26 Ezekiel Mukhaye Lilako
27 Lydia Gathoni Kamau
28 Mchaka M. Jeremiah
29 Evelyne Musomba
30 Keena Nangolo Nyongesa
31 Stella Naliaka Simiyu
32 Margaret Atieno Mumoki
33 Julia Nafula Khabai Shimwaka
34 Charmaine Kinuthia
35 James Njiru Kanyuira
36 Bakari Moyo Burhaan
37 Otieno Crystal Anyango G.
38 Lydia W. Mwaura
39 Joseph Otieno Oloo
40 Ruth Wairimu Mbuthia
41 Betty Kharoya Luhutsa
42 Ochieng W. Gumbo
43 Stephen N. Onteri
44 Audrina Mikhala Mikaka
45 Faswila Athman Omar
46 Fatuma Abdi Mahmud
47 Hillary Otieno
48 Peres Adhiambo Ondiek
49 Eddah Jepkemboi Kirui
50 Abdallah Tsuma
51 Bevelyne Khayecha Mmera
52 Boniface Kahindi Kazungu
53 John Paul Sore
54 Johnstone Mwihwa Ingonga
55 Doris Namboye Walukano
56 Lydia Adhiambo Sirwaha
57 Beatrice Moige Gisemba
58 Hellen Wangui Gitau
59 Paul Oduor Odhacha
60 Catherine Nditi Mutuku
61 Lenard K. Manoti Ombongi
62 Stellah Chepng’etich
63 Cynthia Ngendo Kuria
64 BrIgid Chebet Kotut
65 James Musyoka Maithya
66 Patricia Wajiru Gitari
67 Abdi Abdullahi Adan
68 Irene M. Ndambuki
69 Derrick F. Makhandia
70 Nancy Muchuta Muyeka

120
The Kenya National Micronutrient Survey 2011
71 Jedidah Mwia Ndunda
72 Brenda AwinO Odera
73 Eunice Atieno Onyina
74 Daniel Mwai Thangari
75 Joshua Ndungu Gikonyo
76 Stellah Njoki Ngere
77 Peter Ngari /Rosaline W. Ngari
78 Adow Aden Buul
79 Rachel Jumwa Dzombo Kahindi
80 Kisiang’ani S. Isaac
81 Dorothy N. Moseti
82 Ahmed Omar Shukrow
83 Hussein Issack Hassan
84 Oscar Kambona Ayoma
85 Mohamed Abdi Dayow
86 Rodgers Maxwell Ochieng
87 Rachel Wageni Munyi
88 Vincent SEBASTIAN Kwena
89 Musdalafa Lyaga Okello
90 Osman Muse Dahir
91 Daniel Muigai Kinyanjui
92 Susan Wathera Ngure
93 Mercy A. Ndiege
94 Bidii Stephen Ngalah
95 Susan Wanja Njeru
96 Irene Mwikali Mulia
97 Saidi Abdalla Kisiwa
98 Ruth Sada Mwatelah
99 Benard O. Ogoma
100 Melissa Nyawira Karimi
101 Aggrey Gisiora Mokaya
102 Abbas Bahola Hussein
103 Janet Otin (Hesbon Oyendo)
104 Delila Vunzu Ngala
105 Mohamed Ismail Dalal
106 Roseline Chebet
107 Agnes Chepng’eno Rotich
108 Nancy Mbeyu Mwangome
109 Mary Wangui Mwangi
110 Emily Wanjiru Maina
111 Echoka Elizabeth
112 Evelyne Nasimiyu Kikechi
113 Tobias Onyango Oliech
114 Caroline Nyawira Kioi
115 Jackline Kanyua Kibete
116 Ruto Kipkoech Edwin
117 Susan M. Karuga Njoroge
118 Paul Kemboi Samoei
119 Lillian Nyandieka
120 Douglas Magugu
121 Tadayo Mahonga Mudanya
122 Prisca C. Nekesa Otambo
123 James Tsuma Rimba
124 Lydia W. Mudenyo
125 George Ndichu Munjuga
126 John Gitau Mburu
127 Wilson Mukwana Wawire
128 David Mathu Mingu
129 Felista W. Kingori
130 Caren Wanja Mugambi
131 Lydiah E. Mukhaye
132 Phoebe Mutila Kisavi
133 Joyce Nduku Munini
134 Mulia Wilfred Kisingu
135 Cleophas Paul Wayodi
136 Issack Yakub Jamaa
137 Josiah Waithaka Kaara
138 Sadikl Mohamed Ali
139 Sahal Mohammed
140 Amos Kimunyu Muia
141 Dennis Gichobi Magu
142 Biscah Syombua Munyaka

121
The Kenya National Micronutrient Survey 2011
143 Ebla Ali Omar
144 Nicholas Njau Ngomi
145 Surow Adan Adaw
146 Edgar E. V. Okoth Onyango
147 Mary Atieno Nyakomitta
148 Okumu Adhiambo Carolyne
149 Katra Mohammed Abdi
150 Charles Ogwang Odah
151 Tobias Okech
152 John Paul Likalamu Buleti
153 Samuel Maina Nyakamba
154 John Egesa Nato
155 Tecla Mbithe Kula
156 Thomas K. Mulima
157 Philip Njoroge Waweru
158 Amina Abdi Mohamed
159 Nebert Amuguni Kitungulu
160 Richard Mutisya M. Arun
161 Linus Omondi Odawo
162 Moses C. Barasa

122
The Kenya National Micronutrient Survey 2011


Ministry of Health