the koepsel permeameter - nist...
TRANSCRIPT

THE KOEPSEL PERMEAMETER
By Charles W. Burrows
CONTENTS ^ „fage
1. Historical loi
2. The Koepsel permeameter 102
3. Consistency on repetition 105
4. Shearing curves 106
5. Cross section of specimen 112
6. Length of specimen : . . . 115
7
.
Position of bushings 116
8. Flux distribution in Koepsel apparatus 117
9. The direct magnetization of the yokes by the solenoid 120
10. The magnetizing force 121
11. Flux density 123
12. Hysteresis data on the Koepsel permeameter 125
13. Theory of hysteresis errors 127
14. Conclusion 129
1. HISTORICAL
The moving coil galvanometer and many other electrical instru-
ments built on the same principle consist essentially of a coil of
wire suspended in a magnetic field. This coil experiences a torque
which is proportional to the product of the current in the coil
and the component of the magnetic field in the plane of the coils.
In the instruments just mentioned the magnetic field is constant
and the current varies. The deflection due to the torque thus
becomes a measure of the cturent strength.
Instead of using a constant magnetic field, we may maintain a
constant electric cturent through the moving coil and use this
system for the measurement of the magnetic field. If this mag-netic field is due to an electromagnet, the magnitude of the field
depends upon the magnetomotive force applied and the material
of the magnetic circuit. An electromagnetic system of this kind
may therefore be made the basis of an apparatus for the determi-
nation of the magnetic properties of iron and steel.
lOI

I02 Bulletin of the Bureau of Standards [Voi. n
Robinson ^ in the Electrical World of February 24, 1894, gave
a complete description of a permeameter based on this principle.
However, he had not actually built the instrument.
Three days later Koepsel ^ described before a German electro-
technical society substantially the same piece of apparatus,
which he had built and was actually using. This apparatus, as
later improved by Kath,^ is widely used, both in this country
and abroad. It is sometimes called the Siemens and Halske
permeameter, from the name of the manufacturer.
Orlich * at the Reichsanstalt determined a number of hysteresis
loops with the Koepsel instrument and also by the magnetometer
method, using ellipsoidal specimens for this latter test. His data
show that at inductions of 1 5 000 gausses the instrument gives
values of the magnetizing force which are too high. All values
of the coercive force, as obtained by this instrument, are greater
than those of the magnetometer. The shearing curves differ
for different materials. Rohr ^ compares hysteresis data obtained
by the Koepsel permeameter with that obtained by the watt-
meter method and finds that the values of the Steinmetz coefficient
thus obtained are in substantial agreement. The Koepsel appa-
ratus has also been used by Voller,^ Gans and Goldschmidt,^
Aliamet and Brunswick,^ and others.
Much of the data on the magnetic properties of iron and steel
have been determined with this, apparatus. It seems, therefore,
well worth while to give the Koepsel permeameter a careful ex-
perimental examination with a view to determining its reliability
for use in making magnetic measurements.
2. THE KOEPSEL PERMEAMETER
Fig. I shows the Koepsel apparatus diagrammatically. Themagnetic circuit consists of a semicircular yoke J J with its ends
1 Iv. T. Robinson: "A modified instrument for the determination of B-H curves," Electrical World,
23, p. 236; Feb. 24, 1894.
- A. Koepsel: Apparat ziu* Bestimmung der magnetischen Eigenschaften des Eisens in absoluten Maasund directer Ablesimg, E T Z., 15, p. 214; Apr. 12, 1894.
3 H. Kath: E T Z., 19, pp. 411-415; 1898.
1 E. Orlich: E T Z., 19, pp. 291-294; 1898.
» W. Rohr: E T Z., 19, p. 713; 1898.
5 A. VoUer: Hamburg Verh. Natw. Ver. (3 folge), p. 8; 1900.
^ Gans and Goldschmidt: E T Z., 17, pp. 372-374; 1896.
8 Aliamet and Brunswick: Electricien, 16, pp. 187-191; 1898.

Burrows] Tiie Koepsel Permeanieter 103
joined by the test piece P. The middle of the yoke has a circular
gap in which swings the test coil h for the measurement of the in-
duction. The system is magnetized by means of a ciurent in a
solenoid S, surrounding the specimen. The constants of the
Fig. I.
—
Diagram of the Koepsel permeameier
F Test specimen
JJ Heavy semiciroilar soft iron yokes
K Soft iron bushings
S Main Magnetizing solenoid
CC Compensating turns
h. Moving coil
(The dimensions given on the figure are in centixaeters.
)
instrument are such that the magnetizing force is given by the
equationH^iool
where / is the magnetizing current in amperes, and H is the
magnetizing force in gausses.
This coil is designed for values of H as large as 450 gausses,
so that it must have a carrying capacity of 4.5 amperes. In
order to eliminate, when there is no specimen in the apparatus,
any deflection of the moving coil due to the magnetizing effect
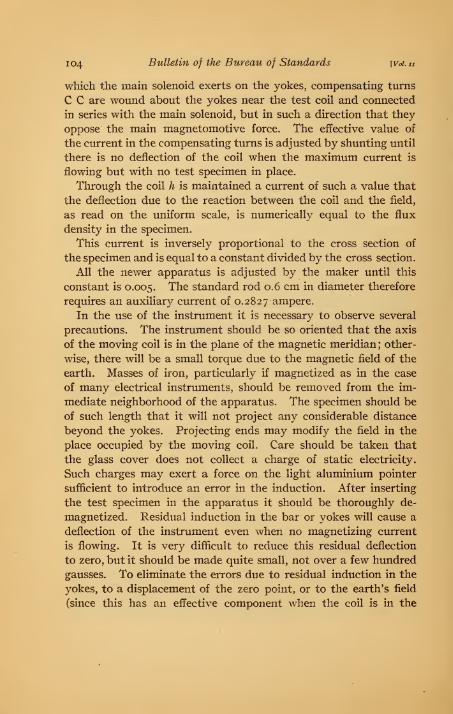
I04 Bulletin of the Bureau of Standards [Voi.n
which the main solenoid exerts on the yokes, compensating turns
C C are wound about the yokes near the test coil and connected
in series with the main solenoid, but in such a direction that they
oppose the main magnetomotive force. The effective value of
the current in the compensating turns is adjusted by shunting until
there is no deflection of the coil when the maximum current is
flowing but with no test specimen in place.
Through the coil h is maintained a current of such a value that
the deflection due to the reaction between the coil and the field,
as read on the uniform scale, is numerically equal to the flux
density in the specimen.
This current is inversely proportional to the cross section of
the specimen and is equal to a constant divided by the cross section.
All the newer apparatus is adjusted by the maker until this
constant is 0.005. "^^^ standard rod 0.6 cm in diameter therefore
requires an auxiliary current of 0.2827 ampere.
In the use of the instrument it is necessary to observe several
precautions. The instrument should be so oriented that the axis
of the moving coil is in the plane of the magnetic meridian ; other-
wise, there will be a small torque due to the magnetic field of the
earth. Masses of iron, particularly if magnetized as in the case
of many electrical instruments, should be removed from the im-
mediate neighborhood of the apparatus. The specimen should be
of such length that it will not project any considerable distance
beyond the yokes. Projecting ends may modify the field in the
place occupied by the moving coil. Care should be taken that
the glass cover does not collect a charge of static electricity.
Such charges may exert a force on the light aluminium pointer
sufficient to introduce an error in the induction. After inserting
the test specimen in the apparatus it should be thoroughly de-
magnetized. Residual induction in the bar or yokes will cause a
deflection of the instrument even when no magnetizing current
is flowing. It is very difficult to reduce this residual deflection
to zero, but it should be made quite small, not over a few hundred
gausses. To eliminate the errors due to residual induction in the
yokes, to a displacement of the zero point, or to the earth's field
(since this has an effective component when the coil is in the

Scientific Paper 228
Fig. 2.
—
Photograph of the Koepsel permcameter used in this investigation

The Koepsel Permeameter 105
deflected position) it is necessary to take readings on both sides of
the zero point. This may be done by reversing either the auxiliary
or the magnetizing current, preferably the latter, since in that
method partial correction is made for errors due to the imperfect
demagnetization of the test piece.
In the present investigation the normal induction data were
obtained by reading the magnetic inductions with the magnetizing
current first in one direction and then in the reverse direction.
The mean of these two readings gives more consistent results
than the method, given in the maker's instructions, of varying
the magnetizing current step by step without reversals. In deter-
mining the hysteresis data, however, the step-by-step method was
followed.3. CONSISTENCY ON REPETITION
The first requirement of a permeameter is that it shall give
the same readings on different determinations of the same material.
Table i shows two sets of data taken in succession and without
removing the test material from the apparatus.
TABLE 1
Typical Koepsel Data
BAR NO. 293, 0.6 CM DIAMETER
First set Second set
H ^Ba.ean
B+ B- B„.ean B+ B—j
B mean
1 650 25 337 600 100 350 13
2 1700 1100 1400 1650 1150 1400 00
3 3500 2950 3225 3450 3000 3225 00
4 5100 4800 4950 5100 4850 4975 25
6 8000 7900 7950 8000 7975 7987 37
8 10 050 10 000 10 025 10 250 10 000 10 125 100
10 11 500 11 400 11 450 11 500 11 400 11 450 00
20 14 600 14 500 14 550 14 700 14 300 14 500 50
50 16 800 16 400 16 600 16 700 16 450 16 575 25
100 17 950 17 500 17 725 17 900 17 650 17 775 50
300 20 000 19 500 19 750 19 900 19 600 19 750 00
Mean.. 27
B and H are expressed in gausses. B+ and B— correspond to
the two directions of the corresponding magnetizing force.

io6 Bulletin of the Bureau of Standards [Vol u
The two readings B -f- and B— on the two sides of the zero for
the same magnetizing force differ widely from each other, especi-
ally in the initial inductions. These differences are probably due
to a residual induction of the yokes, although very great care was
used in demagnetizing. This failure to get complete demagneti-
zation of the yokes is due to the fact that in some earlier use of
the apparatus with test rods of larger diameter the yokes were
carried to a higher flux density than can be reached with the
smaller rods. Other experiments have shown that a closer
equality between the two readings is obtained when care has been
taken to demagnetize the yokes with a large rod in place before
the smaller one to be tested is inserted.
The individual readings in the two sets of data given above
differ quite appreciably, but the mean values of each set differ
only slightly. Experiment shows that if more careful demagneti-
zation of the yokes had been carried out, as indicated above, the
resulting mean values would have been in substantial agreement
with those here obtained. The differences noted in the last
column of Table i may all be accounted for as errors of obser-
vation. The smallest graduation on the scale is about 2.5 mmlong and represents an induction of 500. The maximum differ-
ence in the table of 100 gausses represents an error of one-fifth
of a division and may be distributed over four readings. Themean difference of 27 corresponds to an error in estimation of
1/18 division. We may conclude, therefore, that this apparatus
yields results which are reproducible.
4. SHEARING CURVES
To test the accuracy of the data obtained by the Koepsel
apparatus a number of rods were measured by this apparatus,
and also by the author's compensated double-yoke method.'^
Fig. 3 may be taken as representing the results of such a com-
parison. The Koepsel apparatus indicates a magnetizing force
which is too high for the lower inductions. This error in magnetiz-
ing force increases as the induction increases up to a certain stage,
when it decreases, passes through zero, and reaches a maximumof opposite sign. Finally it approaches the zero value again
and in some cases even changes sign a second time.
9 Burrows: " The determination of magnetic induction in straight bars." This Bulletin, 6, pp. 31-88;
1909 (Reprint No. 117).

Bttmnos] The Koepsel Permeameter 107
UPPER
SCALE
'
COWER
SCALE
\
\
\
\ \ U
I \*
\ r
\<\ \
\ \
\ \^
tI
___s
"^
[shearing
--^-"^

io8 Bulletin of the Bureau of Standards [Voi.u
These variations are well shown in the curve of corrections or
"shearing curve," as it is usually called. The true points on the
induction ciu^e are obtained from the observed values by a
shearing parallel to the H axis by an amount equal to the abscissa
of the point on the shearing curve having the corresponding
induction.
If the shearing curve is constant for specimens of different size
and quality, the apparatus would be perfectly reliable for per-
meability measurements. Unfortunately, however, this correction
is not a constant nor does it vary according to any simple law.
Figs. 4, 5, and 6 show the normal induction and shearing curves
for wrought iron, low-carbon steel, and high-carbon steel, as
obtained on the Koepsel apparatus. For comparison, the shear-
ing curves are brought together in Fig. 6. This set of cruves
shows a number of interesting things. At an induction of 5000
gausses the correction to be applied to the observed magnetizing
force is negative and increases in magnitude as we pass from
wrought iron to low-carbon steel and to high-carbon steel ; that is,
*the shearing correction is greater for the harder material. At an
induction of 1 5 000 gausses each correction curve has crossed both
of the others and the order is completely reversed. The curves
show zero correction at inductions which increase as we pass from
the hard to the soft material. The maximum positive correction
and the maximum negative correction occur at inductions which
are lower for the hard material than for the softer material.
It is obvious that the correction does not depend on the induction
alone. For accurate use the apparatus should be accompanied
by shearing ciuves of material similar to that under examination.
The result of using a shearing curve determined from material
which is slightly different from the test material is shown in
Table 2 . The shearing cm^^e used is that of a low-carbon steel
while the test material is wrought iron. The full normal and
shearing curves of these two rods are shown in Fig. 6. Table 2
shows that the use of the low-carbon shearing ciu-ve results in an
error of 10 per cent or over in magnetizing force. If shearing
ciu*ves of substantially the same material as the test specimen
are used, data correct within 5 per cent may be expected.

Burrows] The Koepsel Permeameier 109
UJ
<i
ccUJQ-Q.3
\ \ DC
\ \ "J
\ V
\
< \ \2 \ \
\ \z \ ^
\ V
V Is §
"1SHEARING
^
*>-. ?=O* h
68976°-

no
o
Bulletin of the Bureau of Standards [Vol. II
\^
1 <1 ^1^
1 cc
\.AI3
\ ^\
>
\\
\ \\
Vi
I <\CO \ occ \o
NORMAL
000
/oo
t
I«— CO
3 \
/shearing
iO
--^'r

Burrows] The Koepsel Permeameter
en
'upper
scale
upper
scale
Ul_l<
ccHi
1
8
o
1
1 \ "J
\ 1-
\ z\ °
A\ <\ ^
\x
O ON
STEEL
SON
STEEL,,,,,-.-^ \\ -JHIUJ \
o
° WiX
1 \\\ <X o
5z^
\\
\\
\
\
\
'J:rui\\ 8
^ fc fe
^ i 1til . 1
\. °^1
\ liJ V
/^WROU(
*
—
--LOW
C
^
-HIGH
C
r^vr
8

112 Bulletin of the Bureau of Standards
TABLE 2
[Vol. XI
Showing the Results of Using a Low-Carbon Steel Shearing Curve with Data
Obtained on Wrought Iron
B gausses H true gaussesH (wrought iron)
-H (steel)Shearing applied Error in H Percent error
inH
2 000 1.60 - 2.30 -0.78 -0.16 -10
4 000 2.20 - 2.85 -1.45 -0.25 -11
6 000 2.84 - 3.15 -2.02 —0.20 - 9
8 000 3.68 - 3.65 -2.50 -0.04 - 1
10 000 4.98 - 4.35 -2.90 + .26 + 5
12 000 7.35 - 5.65 -3.10 + .76 + 12
14 000 12.95 - 7.9 -2.86 + 1.50 + 12
16 000 30.00 -15.1 + 1.00 +4.45 + 15
18 000 115. 00 .0 +3.70 +3.2 + 3
5. CROSS SECTION OF SPECIMEN
The influence of cross section was determined by using narrow
strips and building them up into bundles of different cross sections.
These strips were cut from the same material and a preliminary
examination was made to make certain that the individual strips
were substantially equivalent magnetically. Fig. 7 shows the
curves for strips of transformer steel (silicon steel) 0.037 cm thick.
This material was tested in bundles of 4, 8, and 16 strips. Thecurves all intersect at approximately 10 000 gausses. For all
points below this intersection the apparent magnetizing force is
greater for the bundles of greater cross section. For all points
above this intersection the reverse is true and in more markeddegree. For instance, at an induction of 16 000 gausses the
observed magnetizing forces for the 16, 8, and 4 strips are 52, 95,
and 285 gausses, respectively.
Similar experiments were performed on a low-carbon steel,
using, in this case, rectangular rods 0.39 by 0.63 cm in cross section.
The curves in Fig. 8 show the same general characteristics. Theyintersect at an induction of 13 000 gausses, and below this value
the two rods in parallel require a larger apparent magnetizing
force than one alone. The two rods were tested separately and
showed quite appreciable differences. The curve has been plotted
from the mean values of the two separate rods.

Burrows] The Koepsel Permeameter 113
500
H->
15000 ^.^^
^_--;::^
IP. STRIPS
ft STRIPS
4 STRIPS1
t^-^^^^^^TscZ,^ _ 1
10000 .^
5000 ///
/
H->5 10 15 20 25 30
Fig. 7.
—
Showing the variation of Koepsel data of transfortner steelfor differences in cross
section
50 ICO 150 200 250 300
15000 ^1
!
^2RODS_^
-;^2]]IIIII--- f Trod UPPER SCALE
ft
10000
1 Ro^^::^
^fH'^^lXi'^ER S CALE
5000
^
5 10 15 20 25 30
Fig. 8.
—
Showing the variation of Koepsel data of low-carbon steel for differences in
cross section

114 Bulletin of the Bureau of Standards [Vol. II
The changes in cross section were quite large in the cases of the
wrought iron and low-carbon steel, and the question arises whether
small variations in cross section are proportionately important.
To test this point and also to get data on a harder material ii
strips of tempered steel tape 0.63 cm wide and 0.047 cm thick
were measured in groups of 8, 9, 10, and 11 strips. Fig. 9 shows
the extreme curves for the greatest and least cross sections. Theother curves are not shown in the figin-e but lie between those
shown here. These curves show the same characteristics in the
15000'
11 STRIPS,,^
TstrIps
10000 /
^5000 /
B/
Fig, 9
—
Showing the variation of Koepsel data of tempered spring steel for differences in
cross section
upper portions as the preceding. The point of crossing, which is
so conspicuous with the softer material and the greater range of
cross sections, is barely discernible in the numerical data but
would probably develop if a greater range of cross sections had
been tried.
From the preceding it is quite evident that separate shearing
cinves must be supplied, not only for test samples of different
materials, but also for test samples of the same material which
have widely different cross sections.
Burrows] The Koepsel Permeameter
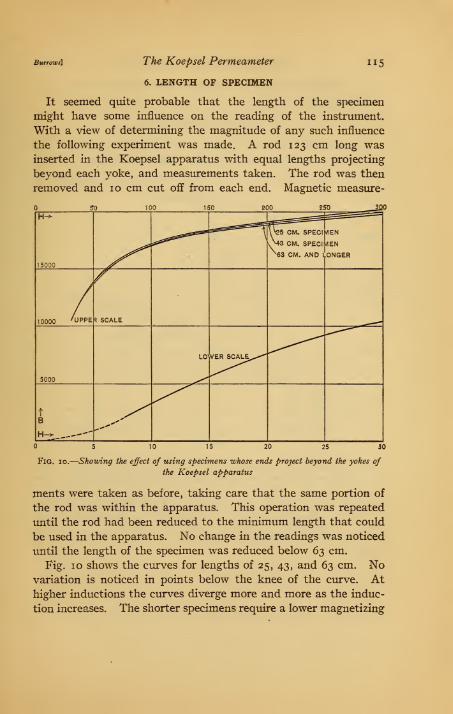
6. LENGTH OF SPECIMEN
115
It seemed quite probable that the length of the specimen
might have some influence on the reading of the instrument.
With a view of determining the magnitude of any such influence
the following experiment was made. A rod 123 cm long wasinserted in the Koepsel apparatus with equal lengths projecting
beyond each yoke, and measurements taken. The rod was then
removed and 10 cm cut off from each end. Magnetic measure-
FlG. 10.- -Showing the effect of usuig specimens whose ends project beyond the yokes of
the Koepsel apparatus
ments were taken as before, taking care that the same portion of
the rod was within the apparatus. This operation was repeated
until the rod had been reduced to the minimum length that could
be used in the apparatus. No change in the readings was noticed
until the length of the specimen was reduced below 63 cm.
Fig. 10 shows the ctirves for lengths of 25, 43, and 63 cm. Novariation is noticed in points below the knee of the cin*ve. Athigher inductions the curves diverge more and more as the induc-
tion increases. The shorter specimens require a lower magnetizing

ii6 Bulletin of the Bureau of Standards [Vol. XI
force. The difference is so slight that projections of several
centimeters are not serious.
7. POSITION OF BUSHINGS
A more serious source of error is in the proper placing of the
bushings. In one run the bushings were inadvertently left pro-
i IN PROPER POSITION^
'^SHINGS MISPLACED
H-^ ^**=
Fig. -Showing the effect of improper placing of the bushings in
apparatus
Koepsel
jecting beyond the yokes on the outer side by about 5 mm. This
has the effect of increasing the effective length of the portion of the
specimen tested. Fig. 1 1 shows the two ctirves obtained with the
bushings misplaced as indicated and with the bushings flush with
the yokes as they should be. The differences indicate that somecare should be exercised in inserting the test specimen in the
apparatus.

Burrows] The KoBpsel Permeameter 117
8. FLUX DISTRIBUTION IN THE KOEPSEL APPARATUS
The preceding experimental results show that the correctionto be applied to the readings with the Koepsel permeameter, toreduce them to true values, depends upon several factors. It hasbeen shown that the magnitude of this correction depends upon thematerial, length, and cross section of the specimen under test,
and also the magnetic condition of the yokes and the position ofthe bushings.
-a-Fig. 12.—Showing the location of the exploring coils used in the determination of the
flux distribution, and the approximate direction of the magnetic flux
In order to determine more fully the natme of the influencewhich each of the conditions exerts on the resultant observedvalues of magnetizing force and magnetic induction, it seemsdesirable to determine the flux distribution along different partsof the magnetic circuit.
We know that in a general way the magnetic flux in an appa-ratus of this type is distributed somewhat as shown by the arrowsof Fig. 12.
To secure quantative results on the flux distribution, exploring

ii8 Bulletin of the Bureau of Standards [Vol. II
coils of lo turns each were wound around different cross sections
of the magnetic circuit. These were placed over the portions indi-
cated in Fig. 12, by the letters A, B, C, D, and E. Full magneti-
zation curves were taken both with and without current in the
compensation coils. A condensed view of the results is given
in Tables 3 and 4, where the various fluxes are expressed in terms
of the flux through the coil surrounding the center of the test
TABLE 3
Showing the Relative Distribution of the Flux in the Koepsel Apparatus with
Normal Compensation. (See Fig. 12)
Decrease
Current A B C D E C+E A-B in A, dueta com-
pensation
Amperes0.15 1.00 0.93 0.86 0.76 0.07 0.93 0.07 0.03
0.30 1.00 0.93 0.87 0.78 0.06 0.93 0.07 0.01
0.60 1.00 0.93 0.88 0.79 0.06 0.94 0.07 0.01
3.00 1.00 0.95 0.94 0.79 0.11 1.05 0.05 0.00
TABLE 4
Showing the Relative Distribution of Flux in the Koepsel Apparatus Without
the Compensation. (See Fig. 12)
Current(amperes) A B C D E A-B C+E
0.15 1.00 0.93 0.88 0.79 0.06 0.07 0.94
0.30 1.00 0.93 0.90 0.81 0.05 0.07 0.95
0.60 1.00 0.95 0.92 0.83 0.05 0.07 0.97
2.00 1.00 0.95 1.00 0.91 0.05 0.05 1.05
3.00 1.00 0.95 1.05 0.95 0.05 0.05 1.10
rod. The test rod itself is a low-carbon steel rod of rectangular
section 0.9 cm square. The difference, A-B, represents the
magnetic leakage from the bar between the center and either end
;
that is, between A and B. This leakage is nearly constant, but
is slightly lower for the higher inductions. It is practically the
same with as without the compensation. This leakage flux gives
rise to magnetic poles. Due to these poles there is a magnetic
force acting in the space occupied by the middle portion of the
test rod. This is a demagnetizing force, which varies with the

Burrows] The KoBpsel PermeameteT 119
pole strength or, what is proportional to it, the leakage. Wesee, therefore, that this self-demagnetizing effect is proportional
to the magnetic induction, except for points near satm-ation,
where it is somewhat below proportionality. It is what is left
of the much larger self-demagnetizing force that would exist if
the ends of the bar were not connected by yokes.
The sum C + B is a measure of the greater portion of the flux
that enters the yoke. It does not measure the whole flux which
enters the yoke, since only those portions which leave through
sections C and B are included. The yoke between these twosections is the seat of some leakage, which has been neglected.
This flux C + B is less than the flux through the specimen for
the lower inductions, but becomes greater as satiuration approaches.
This latter condition means that more flux enters the yokes than
leaves the bar. The resulting polarity of the yokes is the seat
of a positive magnetizing force. It is less with the compensation
than without it. The explanation of this extra flux is considered
more fully in the next section.
The flux through B is the retiu-n flux which passes between the
yokes through the air without linking the moving coil. It in-
creases at the higher inductions when the compensation is used,
but decreases when it is not used.
Column D is the ratio of the flux through the moving coil to the
flux through the center of the test rod. If this ratio and the
relative leakage around the poletips are constant, the flux through
the test coil may be used as a measure of the flux in the specimen.
However, this ratio is not constant. Without compensation, it
varies from 79 per cent to 95 per cent of the flux through the test
piece. With compensation, the ratio is more nearly constant,
showing a flux of from 76 per cent to 79 per cent of the flux through
the test piece. The variation of this ratio is, therefore, about
2 per cent of its own mean value.
If the scale is calibrated so that the magnetic induction read is
proportional to the deflection of the moving coil, the scale may be
so calibrated that the induction readings at any point on the scale
are not in error by over i per cent. This variation at an induction
of 20 000 gausses corresponds to an error in the corresponding
magnetizing force of 5 per cent or more.

I20 Bulletin of the Bureau of Standards [Voi.n
9. THE DIRECT MAGNETIZATION OF THE YOKES BY THE SOLENOID
The excess of flux in the yokes over that in the bar is due to
the magnetizing force which is exerted on the yokes by the mag-
netizing solenoid. The total mmf acting along the yokes of the
magnetic circuit is no inconsiderable portion of the applied mmf.
I
T
Fig. 13.
—
Representing a solenoid of length I whose inner and outer layers have the
radii r^ and r^ respectively
If r = radius of any layer
X = distance of a point on the axis from one end of the sole-
noid
/ = current in amperes
n = number of turns per cmH = magnetizing force in gausses
^^^^„ r o,2iTrhiIdx
{r^+x'')
= o.27rnI\ I ^ +yr^+x" -^Jr^ + il-xY]
This equation gives the magnetizing force for any point on the
axis of the solenoid.
If now we calculate the magnetomotive force along the axis of
the solenoid between the planes bounding its ends, we find for the
mmf along that portion of the test bar between the yokes:
/Hdx = / o.2'irnl\ , , + / , ,, =x% dx
J^yr'+x' ^|r' + (l-xy\
= o.27rniyr^~+¥- ^r^-}-(l-xy}
[
= o.47rn/{Yr^ + /^ — r}
This last expression is the mmf applied to the bar.

Burrows] The Kospsel Permeameter 121
The total mmf of the solenoid is
The ratio of the mmf applied to the bar to that of the solenoid is
therefore
o.^'irnl{-^r^+l^-r),
, ^ a u o ^—-^ ——Y^
'- = V I + p^ - P, where p = y-
= i+--- + ,etc.
The proportion of the total mmf applied to the yokes is the differ-
ence between the above quantity and unity; that is,
/S-7 +1 -etc. eq. (i)
In the case of the solenoid of the Koepsel apparatus
7\ = 0.85
rg = 2.70
^' mean- ^^ ^ '7^
I =12.7
p =—^=0.1412.7 ^
Substituting /3 = 0.14 in equation (i)
we have yS- — +^ = 0.14-—^+—
^
28 ^2 8
= 0.140 — .010 + .000
= 0.13
that is 13 per cent of the total mmf of the solenoid is applied
directly to the yokes.
This result is calculated on the assumption that the portion of
the mmf applied to the yokes is the same as if the coil were con-
centrated in one layer at its mean radius.
10. THE MAGNETIZING FORCE
The magnetizing force acting on the center of the bar is the
resultant of at least five components.
The most important is the magnetizing solenoid itself. This is
the only one that can be calculated directly and it is very desirable
to construct the apparatus so that all the other components of

122 BMlletin of the Bureau of Standards \v6i.ji
magnetizing force neutralize each other. The next best condition
is to have these secondary magnetizing forces directly proportional
to that exerted by the main solenoid. In the present piece of
apparatus neither of these conditions is fulfilled.
The compensating coil C, Fig. i, contributes a small demagnetiz-
ing force at the center of the bar. This is shown in the last column
of Table 3 by indicating a lower actual induction in the bar whenthe compensation is used than when no compensation is used.
This difference produces a change in induction as great as 3 per
cent at low intensities and vanishes at the higher inductions.
This demagnetizing force is small and may be considered as approx-
imately 3 per cent of the total magnetizing force at the lower
inductions, and is negligible at the upper values.
The magnetic field of the solenoid acts on the yokes in such a
direction as to produce a positive magnetizing force in the space
occupied by the test bar. This magnetizing force is proportional
to the cmrent and consequently, if plotted as abscissae against
induction as ordinates, would give a curve of the same shape as the
normal B—H curve. This reactive force of the yokes has been
noted before in other forms of magnetic circuit. ^^
The bar itself presents magnetic poles which exert a magnetizing
force both on the bar and on the yokes. This magnetizing force
opposes that due to the solenoid as far as the rod is concerned.
It is this demagnetizing force which plays so important a part in
straight bars with air-return magnetic circuits.
This magnetizing force acts also on the yokes, thus producing a
positive magnetizing force in the region occupied by the bars.
Each of these effects is proportional to the leakage from the bar,
and if the resultant poles were fixed in position they might be con-
sidered as a single influence. However, the distance between the
poles is a function of the permeability of the bar and increases as
the permeability decreases. Consequently, we might expect the
demagnetizing effect of the poles to predominate at the lower in-
ductions where the permeability is high and the corresponding
magnetizing effect of the yokes to predominate at the higher in-
ductions where the permeability of the specimen is low. These
10 Burrows: "The determination of magnetic induction in straight bars." thisBuJletin, 6.p. 45; 1909
(Reprint No. 117).

Burr<rws] The Koepsel Permearneier 123
effects would be accentuated in test specimens of larger cross sec-
tion, in which the leakage is greater in magnitude, thus exerting
a greater field in both the bar and the yoke.
11. FLUX DENSITY
In the Koepsel apparatus the flux density through the center of
the test bar is measured in terms of the field in the gap in which
the test coil swings. This field is influenced by the magnitude of
the flux in the test specimen, the flux in the yokes due to the mag-
netizing force of the solenoid, the flux due to the compensating
turns, the flux due to the current in the moving coil, and also the
various leakage fluxes.
The flux through the center of the test specimen is the quantity
we wish to measure, and it is desirable that this flux have a con-
stant ratio to the field in the gap in which the coil swings. If this
is true, then the instrument may be calibrated so as to read true
flux densities in the bar. To do this all the other flux components
must add up to zero or give a resultant which is proportional to
the flux in the bar. That neither of these conditions is fulfilled is
seen from the data of Table 2. The total flux through the gap is
always less than the flux through the specimen, but the difference
becomes relatively less as the induction increases. Accordingly,
if the instrument is calibrated at low or moderate inductions the
higher inductions would give a reading too high or, what is equiva-
lent, the corresponding correction to the observed magnetizing
force would become positive.
The flux due to the magnetization of the yokes by the main
magnetizing solenoid is nearly proportional to the current, since
the iron of the yokes is worked at comparatively low inductions.
The corresponding component of the shearing curve has the shape
of a normal induction curve and becomes important only at the
higher inductions.
The effect of the compensating turns is to reduce the flux caught
by the moving coil. This effect is nearly proportional to the cur-
rent and, consequently, greater at the higher inductions. It like-
wise contributes to the shearing cvirve a component which has the
same shape as a normal induction curve.

124 Bulletin of the Bureau of Standards [Vol. II
The leakage flux between the ends of the specimen is very con-
siderable, but combines with that due to the compensating turns
to produce a nearly constant ratio of leakage, as shown above.
The magnetomotive force of the moving coil is relatively small.
This coil has 30 ttmis which, for a normal specimen, corresponds
to a magnetomotive force of 11 cgs units. The total magneto-
motive force of the solenoid is about 12 H cgs units. The mag-
netomotive force of the test coil has only a small component along
the direction of the main magnetic flux. However, it is concen-
trated at the most effective part of the circuit and undoubtedly
exerts an appreciable influence.
Another element which is a source of error in the measmrement
of the flux density is the determination of the constant of the
instrument. An error in the determination of this constant or in
the setting of the auxiliary current introduces a proportional error
in the measurement of the induction. The corresponding error
in the magnetizing force depends upon the relative rate of change
of the magnetizing force necessary to produce this change in
induction. Table 5 contains a set of normal data and the changes
in magnetizing force which correspond to i per cent change in
induction. From this table we see that a change of i per cent in
the induction corresponds to changes in magnetizing force varying
from 0.4 per cent at the maximum permeability to 9 per cent at
20 000 gausses.TABLE 5
Showing the Percentage Variations in H Corresponding to 1 Per Cent Variation in
B for Low-Carbon Steel
B gausses H gausses fxiooo B>^100Percentage variation
inH
2000 3.89 0.74 0. 0148 0.38
4000 4.93 .45 .0180 .36
6000 5.96 .48 .0288 .47
8000 7.28 .77 .0616 .85
10 000 9.30 1.25 .125 1.35
12 000 13.01 2.66 .319 2.46
14 000 21.36 7.25 1.07 5.01
16 000 44.18 17.5 2.80 6.35
18 000 116.3 52. 9.36 8.1
20 000 314.3 145. 29.0 9.2
Burrows] . Tkc KoBpsel Pemieameter 125
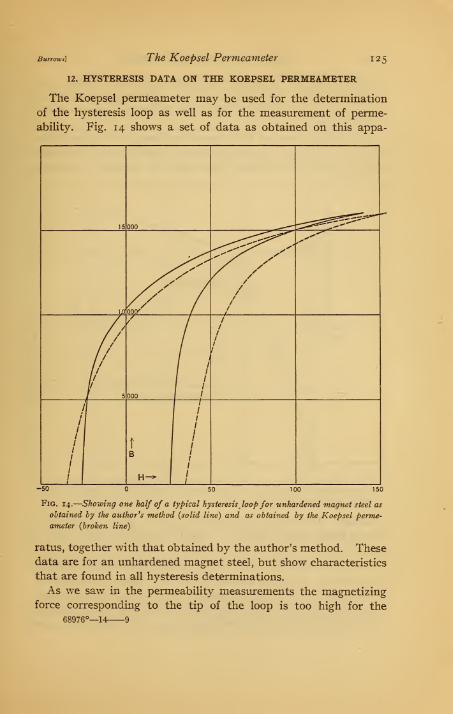
12. HYSTERESIS DATA ON THE KOEPSEL PERMEAMETER
The Koepsel permeameter may be used for the determination
of the hysteresis loop as well as for the measurement of perme-
ability. Fig. 14 shows a set of data as obtained on this appa-
15 000
.^-^^<<^^^'^^^' ,^''
/<^/ //
/
//^ / /^D 00c/ /
/ //
/ / 1 /
/ / /
/ / /
/ / /
/ / I \
// / /
/ / /
/ / /
/ /
!/1 /
I ^ 000 1 /
1/
1 /
i1
/1
//
/
/
/
/
t
B
1
1
1
1
1
1
1
Fig. 14.
—
Showing one half of a typical hysteresis loop for unhardened magnet steel as
obtained by the author's method {solid line) and as obtained by the Koepsel perme-
ameter {broken line)
ratus, together with that obtained by the author's method. Thesedata are for an unhardened magnet steel, but show characteristics
that are found in all hysteresis determinations.
As we saw in the permeability measurements the magnetizing
force corresponding to the tip of the loop is too high for the68976°—14 9

126 Bulletin of the Bureau of Standards [Vol. II
Koepsel. The residual induction is lower and the coercive force
is higher as obtained by this apparatus. The two ctirves intersect
between the points represented by the residual induction and the
coercive force.
The relation between the magnetizing forces at the tips of the
ciuves, as obtained by the two methods, depends upon the nature
of the material investigated and upon the maximum induction
__^
—
15 000 /^^^^^^^^"""^
/ NORMAL INDUC/
TION
10
/ /
/ // /
000 / /
COERCIVE/ /
/ /
/ /
/ /
/ /
/ /
000 / / ^^^
FORCE
5
/ /^ '-" RESIDUAL INDUCTION
/ /
/ /
//
-
-5 5 10 15 20
Fig. 15.
—
Showing curves of normal induction, residual induction, and coercive force
for a sample of low-carbon Bessemer steel as obtained by the author's method {solid line)
and by the Koepsel method {broken line)
obtained. The other characteristics are the same qualitatively
for all loops of any material. Different materials differ only in
degree.
On Fig. 1 5 are plotted the cm^es of maximum induction against
magnetizing force, of residual induction against magnetizing
force, and of coercive force against normal induction for various
hysteresis loops taken with the same specimen. It is to be noticed
here that the observed ctirve representing the tips of the loops

Burrows] The Koepsel Permeameter 127
crosses the true curve at a moderately high value. The observed
residual induction ciu-ve is always lower than the true ctuve.
The observed coercive force ctirve shows values of the coercive
force always too large, no matter what maximum induction is used.
Figs. 16 and 17 show similar data for harder materials. Froma comparison of the three figures it is evident that the residual
induction as obtained on the Koepsel apparatus is always too
Fig. 16.
—
Showing curves of normal induction, residual induction, and coercive force
for a sample of tool <:teel as obtained by the author's method (solid line) and by the
Koepsel method (broken line)
low and that the error is greater with material having the higher
inductions. The observed coercive force which gives too large
a value has an increasing error as the coercive force increases.
13. THEORY OF HYSTERESIS ERRORS
The residual induction as measured may be considered as
influenced by the residual magnetic fluxes in the bar, yokes, andair gaps. If these three parts of the magnetic circuit had the

128 Bulletin of the Bureau of Standards [Vol. II
same remanence the reading of the instrument which measm^es
the field in the air gap would be proportional to the residual induc-
tion in the specimen. However, this is not the case. The air
gaps have no remanence, while that of the yokes may be greater
or less than that of the test specimen. If it is less than the speci-
men, it is obvious that the mean remanence is less than that of
the specimen alone. If the yokes are of hard material relative
\
\
\ 15 000
^—>)
\
\
\
\
\
\
\
\ \000 /
^ /'^NORMAL ir
//
/
DUCTION
Q\ \ 10
CO
I
I
\
\
\
\
IRCIVE FORCE5 000 / / /
Z' RESIDUAL
/f
INDUCTION
/ /
/ /
t //
Fig. 17.
—
Showing the curves of normal induction, residual induction, and coercive
forcefor a sample of unhardened-magnet steel as obtained by the author's method {solid
line) and by the Koepsel method {broken line). The short segments Q represent similar
data on the same material after it has been hardened
to the specimen, they may compensate for the lack of remanence
of the air gap and we find the remanence indicated by the moving
coil equal to that of the specimen or even greater than it.
The magnetomotive force which is the source of the coercive
force is concentrated over the specimen itself, while the condition
of no flux in the magnetic circuit is determined at a point some-
what removed from the specimen. The moving coil is in a field

Burrows] The Koepscl Permeameter 1 29
due to the induction in the yokes. After the whole magnetic
circuit has been magnetized to a degree represented by the tip
of a given hysteresis loop of the specimen and a reversed magnet-
izing force applied until there is no induction in the test specimen,
we still have a residual induction in the yokes. This residual
induction of the yokes indicates an incomplete demagnetization
of the system, as shown by the pointer attached to the moving
coil. To bring this pointer to zero it is necessary to magnetize
the test specimen in the opposite direction. The magnetic field
then due to the induction in the specimen, acts on the yokes and
demagnetizes them. In this condition the instrument reads zero
induction, but the test bar is magnetized in the reverse direction
under a magnetizing force greater than the true coercive force.
The exact nature of the error in coercive force is complicated
somewhat by the influence w^hich the magnetizing solenoid and
the compensating coil exert on the yokes.
14. CONCLUSION
The Koepsel permeameter has several valuable characteristics.
It gives direct readings of the magnetizing force and the magnetic
induction, both for normal induction and for hysteresis data. It
is easy of manipulation and does not require greater care than the
usual deflection instruments. It repeats its readings as con-
sistently as could be desired. The readings may be very useful
in indicating relative values of different materials or the degree
of nonuniformity of similar materials. The fact that the
observed values of the magnetizing force may differ by as much as
100 per cent from the true values does not destroy the value of
this instrument for purposes of comparison.
From the experimental consideration of the different factors
which may affect the accuracy of the readings the following
detailed conclusions were drawn
:
1
.
Readings on the two sides of the zero of the instrument maydiffer considerably, but the mean of the two values thus obtained
shows satisfactory consistency on repetition.
2. Shearing curves for different grades of material show that
the correction to be applied to the observed magnetizing force is
not constant for a given induction, but depends upon the nature
of the test specimen. This correction is usually subtractive for

130 Bulletin of the Bureau of Standards [Voi.u\
points below the knee of the induction curve and additive for
points above the knee.
3. An increase in the cross section of the test specimen tends
to increase the observed values of the magnetizing force for points
below the knee of the induction curve, and to decrease the observed
values for points above the knee.
4. The length of the specimen projecting beyond the yokes
produces no noticeable effect for points below the knee of the
induction curve. For points above the knee the projecting ends
increase the observed value of the magnetizing force.
5. If the bushings are not pushed all the way into their proper
position, a higher apparent value of the magnetizing force is
observ^ed, due to the increased length of the portion of the bar
under test.
6. Hysteresis loops obtained by the Koepsel permeameter
always show a low observ^ed residual induction and a high ob-
served coercive force.
7. A theoretical and experimental stud}^ of the distribution
of the magnetic fluxes through different parts of the magnetic
circuit shows that shearing curves of the form observed are to be
expected.
If the apparatus is to be used for the determination of the abso-
lute values of the magnetic quantities, it is necessary to apply a
correction to the readings. Since the apparatus gives consistent
results on repetition, the whole error may be charged to errors
in the correction or shearing curve. As this shearing curve
varies with the dimensions and quality of the specimen, it is essen-
tial that shearing curv^es be prepared for each size and quality of
specimen to be tested. With extreme care and the use of proper
shearing curves, the apparatus is capable of giving quantitive
results within 5 per cent of the true value of the magnetizing
force for a given induction.
Uncorrected hysteresis data for hard steels show values of
the residual induction that are too small; the error may be as
great as 10 per cent. Values obtained of the coercive force are
systematically too large ; the error may be as much as 40 per cent.
Washington, August i, 1914.