the kyoto protocol and patterns of international trade
TRANSCRIPT
The Kyoto Protocoland
Patterns of International Trade
Tao Wang∗†
Princeton UniversityJob Market Paper
Nov. 4th, 2011
Abstract
This paper analyzes the effects of climate change policy on internationaltrade flows. Data on CO2 emission intensities and US imports from 1990 to2010 are used to test whether being an Annex I party to the Kyoto Protocolhas an effect on a country’s export patterns. The panel structure allows dealingwith possible endogenous selection of countries into the Protocol. The findingsconfirm the commonly held but rarely empirically documented view that acountry committed to reduce emissions exports less in CO2 emission intensiveindustries. Moreover this effect is quantitatively important and comparableto that of the traditional sources of comparative advantage, such as factorendowments.JEL Classification Codes: F18, Q56Keywords: international trade, climate change, Kyoto Protocol, emission
intensity.
∗I am very grateful to my advisors, Gene Grossman and Michael Oppenheimer, for their continualsupport and encouragement. I am extremely indebted to Stephen Redding for his generous andthoughtful guidance. I also have benefited from insightful comments made by participants at theInternational Trade workshops and the Science, Technology and Environmental Policy (STEP) PhDworkshops at Princeton University. I thank the International Economics Section (IES) and PrincetonEnvironmental Institute (PEI) at Princeton University for their generous financial support.†Department of Economics and Woodrow Wilson School of Public and International Af-
fairs, Princeton University. Email: [email protected], Tel: 1-609-356-8113, Web:http://www.princeton.edu/~taowang.
I. Introduction
Climate change is one of the greatest challenges of our time. Deep cuts in global
greenhouse gas (GHG) emissions are required to hold the increase in global average
temperature below 2 degrees Celsius above per-industrial levels. Since the emissions
are a global public bad, effi cient mitigation efforts must entail international coopera-
tion. However, because countries are in different stages of development and therefore
have different priorities in national policies and varying responsibilities based on his-
torical emission inventories, international cooperation in the form of a global cap or
universal tax on emissions is hard to achieve. Unilateral emission abatement com-
mitments in the form of the Kyoto Protocol suffer from free rider problems. Policy
makers are concerned about "carbon leakage," i.e., emissions reduced by committed
countries are offset by corresponding increase in non-committed countries; and they
worry about the potential negative effect on the competitiveness of domestic compa-
nies in the emission intensive industries. On the other hand, there is also skepticism
that the Protocol can be effective in reducing emissions, due to its lack of a strong
punishment mechanism.
In this paper I analyze whether the Kyoto Protocol has had an effect on the
organization of economic activities, particularly the patterns of international trade.
I test whether a country’s commitment and subsequent policies to reduce emissions
are an important determinant of comparative advantage. The channel that I consider
builds on the well-established insight that differences in stringency of environmental
regulation across countries may result in "pollution havens." As countries with less
stringent climate change policies have a lower implied price of GHG emissions, they
will have comparative advantage in the production of goods that are more emission
intensive. The change in the composition of production resulting from policy changes
1
constitutes an important channel for "carbon leakage."
I examine this hypothesis by testing whether countries with more stringent cli-
mate policies export relatively less in industries which are more emission intensive.
For emission intensities, I used a measure constructed based mostly on the energy
used in the production process. For climate change policies, I used a country’s com-
mitment to reduce GHG emissions under the Kyoto Protocol as a proxy.
I find that countries with emission targets under the Kyoto Protocol do tend
to produce and export less in more emission intensive industries, compared to those
without commitment, and the magnitude of the effect is comparable to traditional
determinants of comparative advantage, namely the factor endowments. However,
one concern is that countries that chose to abide by binding emission targets un-
der the Protocol could have already been specializing in cleaner industries and have
self-selected into the commitment. The panel structure of the trade data allows ad-
dressing the issue of endogeneity by analyzing data from the years preceding and
after the introduction of the Kyoto Protocol in a number of ways. In particular, I
find little evidence that the committed countries exported less in emission intensive
industries prior to them signing the Kyoto Protocol. Rather, data suggest that their
exports have gradually shifted away from such industries after signing or ratifying
the Protocol. This is consistent with the view that the commitment entails more
stringent domestic climate change policies and the resulting higher implied price for
GHG emission makes the country’s comparative advantage shift away from emission
intensive industries. Therefore, contrary to the belief that it is not effective, the Ky-
oto Protocol appears to have exerted a sizable impact on the trade composition of
the committed countries. On the other hand, there seems to be no evidence that un-
committed countries have moved toward specializing in emission intensive industries.
Therefore, the non-committer side of the industry reallocation channel of "carbon
2

leakage" does not seem to be at work.
The paper is organized as follows. The next section briefly reviews relevant the-
oretical and empirical literature on international trade and environment. Section III
discusses the estimating strategies and the regression equations. Section IV describes
the data used. Section V reports the OLS estimates and Section VI tackles the issue
of endogeneity. Section VII concludes.
II. Background and Related Literature
The Kyoto Protocol is an international agreement linked to the United Nations
Framework Convention on Climate Change (UNFCCC). It was adopted at the third
session of the Conference of Parties (COP3) of the UNFCCC in December 1997.
Currently, there are 193 parties (192 states and the European Union (EU)) to the
Protocol. The major feature of the Protocol is that it sets binding emission targets
for the Annex I parties to UNFCCC, which includes 40 industrialized countries and
the EU. Table 1 lists the countries that are Annex I parties and reports the targets
specified in the Annex B to the Kyoto Protocol1. They have committed themselves
to national or joint reduction targets, that range from a joint reduction of 8 percent
for the EU and others, 7 percent for the United States (US)2, 6 percent for Japan
and 0 percent for Russia. These amount to an average of about five percent against1Since these targets are specified in the Annex B to the Protocol, the committed countries are
sometimes referred to a Annex B countries. I will use the term Annex I throughout this paperto avoid confusion. The Annex I countries in this paper refers to the Annex I parties that arecommitted to a binding emission target under the Kyoto Protocol. It differs from the list of currentAnnex I members to the UNFCCC as it does not include US, Malta and Turkey. US is not a partyto the Kyoto Protocol; Malta was not an Annex I party when it ratified the Protocol and is notcurrently committed to a binding target; Turkey is placed in a situation different from that of otherAnnex I Parties and is not under a binding target.
2The United States (US) originally signed the Kyoto Protocol in 1998, however, it did not rat-ify the protocol after a non-binding Senate Resolution (Byrd-Hagel resolution) urged the Clintonadministration to not accept any treaty that did not include the "meaningful" participation of alldeveloping as well as industrialized countries, arguing that to do so would unfairly put the US at acompetitive disadvantage.
3
1990 levels over the five-year period 2008-2012. The Protocol establishes reporting
and compliance systems and introduces market-based mechanisms to help states meet
targets. It adopts the principle of “common but differentiated responsibilities3,” so
that emerging and developing countries including major polluters like China or India
do not face any binding emission limits. The Kyoto Protocol went into effect in 2005
after Russia ratified the Protocol, overcoming the requirement that the ratified parties
incorporate Annex I parties which accounted in total for at least 55 per cent of the
total emissions for 1990 of the Parties included in Annex I.
The Kyoto Protocol has been criticized for its lack of credible punishment, and
people have worried it will not be an effective international treaty. Nonetheless, a
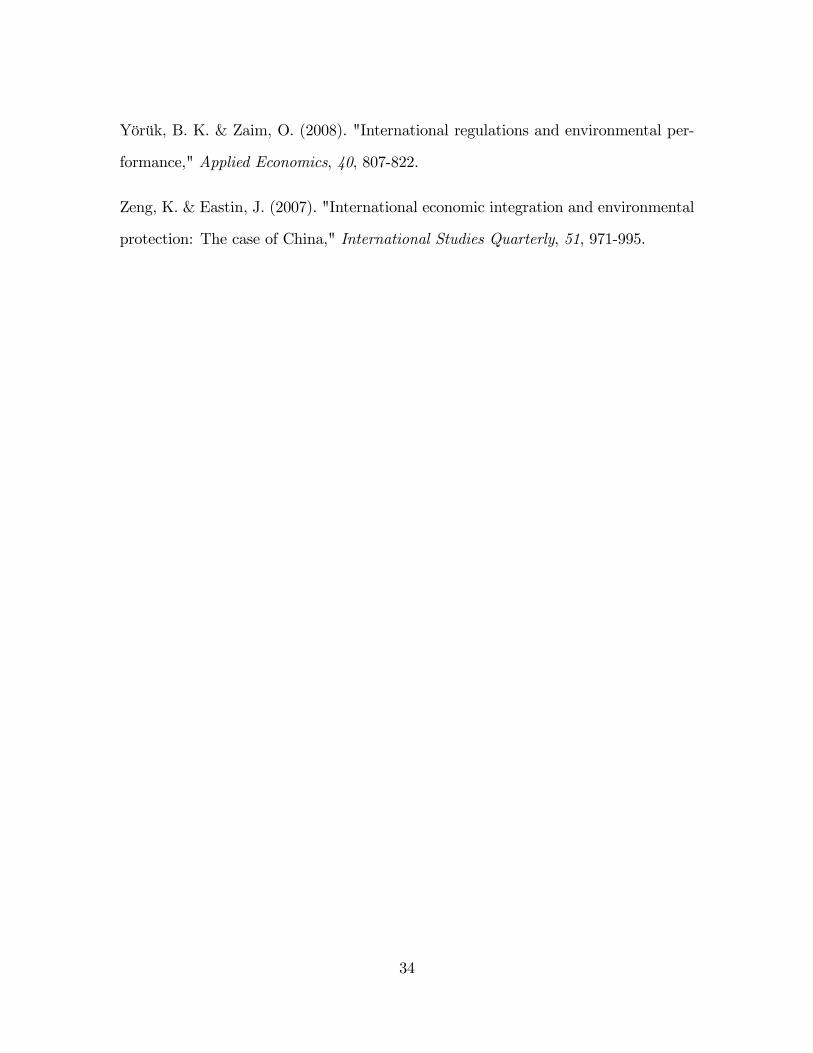
quick look at the total fossil-fuel related carbon dioxide (CO2) emissions data4 in the
past 20 years suggest that the UNFCCC and the Kyoto Protocol might indeed have
had some effect. Figure 1 shows that the total emission from the Annex I countries
have experienced much slower increase in the last two decades compared to that from
non-Annex I countries and it seemed to have peaked in 2005, when the Kyoto Protocol
went into force. In 1990, total emission from Annex I countries is about double of that
from non-Annex I countries. By 2006, the emission for non-Annex I countries have
become more than that from the Annex I countries, and is keep growing fast. There
are of course many reasons that have contributed to the observed path of emissions.
Figure 2 gives a closer look at the emissions from different countries or country groups.
The Annex I countries with economies in transition (EIT) experienced large decrease
in emission due to the decline of their economic activities in the 1990s, which explains
3Article 3.1 of UNFCCC states: The Parties should protect the climate system for the benefit ofpresent and future generations of humankind, on the basis of equity and in accordance with theircommon but differentiated responsibilities and respective capabilities. Accordingly, the developedcountry Parties should take the lead in combating climate change and the adverse effects thereof.
4CO2 is the most important type of greenhouse gases. It represent about 80% of total anthro-pogenic GHG emission measured in CO2 equivalent in terms of global warming potential.
4
the decrease in total Annex I emissions in that period. Nonetheless, emission from
other Annex I countries, including US, has increased much more slowly than non-
Annex I countries. The increase became even slower in the early 2000s and eventually
the emission level peaked in about 2005 or 2006, right before the first commitment
period of the Kyoto Protocol. It is therefore reasonable to believe that the Kyoto
Protocol indeed have contributed to the much slower growth and peaking of Annex
I emission. On the other hand, emission from non-Annex I countries have increased
dramatically, with China overtaking US to become the largest emitter in the world by
2006. One has to wonder if the Kyoto Protocol has made Annex I countries become
cleaner by shifting emission to non-Annex I countries, possibly through international
trade.
Ever since the signing of the Kyoto Protocol, plenty of attention have been paid
to analyze it effects with respect to international trade. Since trade and climate
change have become two of the most prominent subjects of international cooperation
in today’s globalized world, the two inevitably found themselves intertwined with
each other. The World Trade Organization (WTO) and the UNFCCC recognize and
respect each other’s mandate and acknowledges the need for meaningful interaction
(World Bank, 2009). Unfortunately, the trade and climate change personnel and
organizations have largely walked their distinct paths over the years.
In recent years, there has been increased interest from policy makers on the in-
teraction of international trade and the global GHG mitigation effort, as trade may
have potentially large yet ambiguous effect on the effectiveness of domestic and global
climate change policies. "Carbon leakage" through "dirty" industry reallocation to
and lower energy prices in non-participating countries has been an important concern
for participants of the Kyoto Protocol. If the emissions policy of a country raises
local costs, then another country with a more relaxed policy may have a comparative
5

advantage in industries where such costs associated with emissions are high. If de-
mand for these goods remains the same, production may move offshore to the cheaper
countries with lower standards, and global emissions will not be reduced. Mean while
on the energy supply side, if environmental policies in one country add a premium to
certain fuels or commodities, then the demand may decline and their price may fall.
Countries that do not place a premium on those items may then pick up the demand
and use the same supply, negating any benefit.
On the other hand, despite all these concerns, various academic studies have
suggested that the presence of international trade provides more benefit than harm
for combating climate change. International trade in goods may substitute for in-
ternational trade in emission permits and facilitate more effi cient emission reduc-
tion by aligning emission abatement cost across countries (Copeland & Taylor, 2001;
2005). In a trading environment, pressure from enhanced environmental regulations
and product standards from principal developed-world importers encourages more
stringent environmental policy enforcement and compliance and induces technolog-
ical upgrading and innovation (Zeng & Eastin, 2007; Frankel, 2009). In addition,
the international trade of the clean technology and other environmental goods and
services may directly contribute to the effort to fight climate change.
With both sides seemingly plausible, it will be useful to empirically estimate the
actually effect of existing climate change policies in relation to international trade.
So far, there has been little empirical evidence for the "Pollution Heaven Hypothesis"
with respect to GHG emission. Yet the potential for "carbon leakage" under deep-
ening regulations cannot be ruled out. With the commitment period of the Kyoto
Protocol coming to an end in 2012, it is important to understand the effects of the
Protocol so as to shed light on the design and implementation of the successor to the
Kyoto regime. This paper therefore attempts to fill the void in the literature on the
6
empirical assessment of the effect of climate change policy, namely the Kyoto Proto-
col, on international goods trade. By assessing whether it has shifted the patterns
of international trade flows, the paper hope to shed light on the important indus-
try reallocation channel of potential “carbon leakage.”There are three main lines of
literature that are related to the current study.
The first is the thriving literature on the carbon content of trade or the emission
embodied in trade goods. Most of these studies employ input-output analysis to
quantify CO2 emissions embodied in international trade flows. The goal of such
analysis is often to calculate the magnitude of emission embodied in imports and
exports, and compare to that of domestic production and consumption. For a lot
of countries heavily involved in international trade, such differences are substantial
and therefore whether a productions based or consumption based measurement of
an economy’s carbon footprint, or emission inventories (Peters & Hertwich, 2008;
Atkinson, et. al., 2010), will have very different implications for responsibilities in
the global effort to mitigate greenhouse gas emissions. This paper will use similar data
on international trade, but will focus on the variations across industries with varying
emission intensities, rather than the overall emission content. In the terminology of
the trade and environment literature, this paper will try to deduce the importance
of composition effect in potential “carbon leakage”, and do not look at scale and
technology effects.
The next is the vast literature of Pollution Haven Hypothesis. It build on the
intuition that everything else equal, countries or regions with weaker environmental
regulation tend to have a comparative advantage in polluting industries and they
become pollution haven while opening up to trade. Early studies, mostly utilizing
cross-sectional data across countries or industries, do not find significant evidence for
the pollution haven hypothesis (see Chua, 1999 for a survey). Part of the reason is
7
that for most industries, pollution abatement costs are a small component of total
costs, while those industries with the largest abatement costs tend to be the least
geographically mobile (Ederington, Levinson & Minier, 2005). Later analyses, taking
advantage of newly available panel data and using more advanced econometric tech-
niques, have found support for the hypothesis for domestic industry location (List, et.
al., 2003) , foreign direct investment (FDI) (Keller & Levinson, 2002; Dean, Lovely &
Wang, 2009) as well as trade flows (Levinson & Taylor, 2008; Broner, et. Al, 2011).
This paper draws on similar strategies to identify the potential source of comparative
advantage in emission intensive industries.
The last line of literature concerns with the economic impact of existing and
potential climate change policies. Prospective studies of the EU Emission Trading
System (ETS) have shown that concern over the system’s potential impacts on trade
flows should be limited to a small set of industrial sectors (Grubb, et. al., 2007).
Studies focusing on specific sectors under EU ETS found overall leakage of EU emis-
sions is unlikely to be greater than 1 percent, but that impacts on EU production and
imports could be significantly larger in the iron and steel and cement sectors (De-
mailly & Quirion, 2006; 2008). Other studies have found large magnitudes of carbon
leakage of over 40 percent (Aichele & Felbermayr, 2010) or higher. A World Bank
study (2008) concludes that both carbon taxes and energy effi ciency standards have a
statistically significant negative effect on competitiveness suggested by their impacts
on bilateral trade flows, particularly for industries that are subject to higher energy
effi ciency standards and are not subsidized by governments. The current research will
attempt to complement the limited empirical literature on the effect of climate change
policies on international trade by exploring more than the most emission intensive
industries. In sum, this paper draws on the empirical estimation strategies from the
"Pollution Haven" literature, takes an alternative approach of analyzing trade flows
8

to input-output analysis, and attempts to shed light on the issue of "carbon leakage"
on a broader scope.
III. Empirical Strategy and Estimation Equations
To test the effectiveness of the Kyoto Protocol and identify potential “carbon
leakage,” I would like to analyze the effect of climate change policy on the pattern
of international trade. My empirical analysis is informed by recent developments
in quantitative general equilibrium models of trade. Eaton and Kortum (2002) de-
velope a multi-country Ricardian model of international trade with a continuum of
goods, based on differences in technology, that captures the forces of comparative
advantages as well as geographical barriers. Their probablistic formulation of tech-
nological heterogeneity allows a tractable framework for general equilibrium analysis
and results in a gravity equation for bilateral trade flows. Chor (2010) extends the
Eaton-Kortum model beyond aggregate trade volumes and incorporates both Ricar-
dian and Heckscher-Ohlin (H-O) forces in order to quantify the importance of various
sources of comparative advantage within a common framework. Chor’s model ex-
plains the cross-country patterns of specialization and industry trade flows based on
the intuition that industries vary in the factors and institutions needed for produc-
tion, and countries differ in their abilities to meet these industry-specific requirements.
Comparative advantage therefore arises from these country-industry matches. By un-
packing the technological parameter in the Eaton-Kortum model, Chor derives the
following estimation equation to assess determinants of comparative advantage,
ln(Xkni) =
F∑f=1
βf
(lnωifωi0
)skf +
∑{l,m}
βlmLilMkm + βdDni + αi + αnk + υni + υkni (1)
9

where Xkni denotes the trade flow from exporter i to importer n in industry k, ωif the
price for factor f in exporter i, skf the share of factor f in production for industry
k, Lil an institutional measure l for country i, Mkm the dependency of industry k on
institution component m, Dni the bilateral general distance variables, α’s the fixed
effects, β’s the regression coeffi cients and υ’s the error terms. Log bilateral industry
trade flows are regressed on (i) H-O forces, through the interaction of country fac-
tor prices, lnωifωi0, and industry factor shares, skf ; (ii) institutional forces, captured by
the interaction between country institutional measures, Lil, and industry measures
of dependence, Mkm; (iii) bilateral distance variables, Dni, that impose an iceberg
cost on trade, including physical distance, linguistic ties, colonial links, border re-
lationships, and trade agreements, (iv) exporter fixed effect, αi, which absorbs any
exporter specific characteristics that have common effects on trade flows across in-
dustries and importer; and (v) importer-industry fixed effect, αnk, which collects such
factors as specific industry demand in an importing country or an industry specific
tariff rate of an importer, provided it does not vary across exporters. Standard errors
are clustered by exporter importer pair, to allow for correlated shocks among bilat-
eral observations υni. This estimation equation embeds the empirical specification of
recent studies on sources of comparative advantage ranging from factor endowments
(Romalis, 2004), to institutional sources such as financial development (Beck, 2003)
and legal institutions (Levchenko, 2007; Nunn, 2007).
To implement equation 1 for my analysis on comparative advantage in emission
intensive industries, I can treat the stringency of climate change policies as an institu-
tional measure and use emission intensities as the dependency score of each industry
on a country’s climate change institutions. Alternatively, I can view emission inten-
sity as analogous to factor shares and use the stringency of climate change policies to
approximate for the relative emission prices. In fact, a common practice in the trade
10

and environment literature is to model pollution emission as a factor of production in
the trade and environment literature. Drawing on the theoretical work of Copeland
and Taylor (2001), Broner, et al. (2011) extends Chor’s model to include pollution as
an additional factor for production and proposes an estimation equation to analyze
comparative advantage in polluting industries, which is similar to the following form,
omitting the institutional terms,
ln(Xkni) = βE
(ln
τ iωi0
)skE +
F∑f=1
βf
(lnωifωi0
)skf + βdDni + αi + αnk + υni + υkni (2)
where the added term is the interaction of industry pollution expenditure share, skE,
and the relative price of pollution in the exporting country, ln τ iωi0. As Copeland and
Taylor (2001) pointed out, their model does not allow "polluting to prosperity", i.e.,
there is an upper bound of emission per output. Only when the price for emission τ i
is high enough and firms actively engage in emission abatement will emission price
factor into the cost function. In a world where this is not the case in any country,
βE is zero and equation 2 reduces to equation 1. However, estimation of equation
2 may still find βE significantly different from zero if the emission interaction term
is correlated with other factors that determines the pattern of industry trade flows.
When the emission prices are high enough in a group of countries, βE is expected to be
negative, through both the direct channel of cost of production in countries with high
enough emission prices and the indirect general equilibrium production reallocation
effect that countries with non-binding emission prices are also affected.
I will apply equation 2 to this study using stringency of climate change policies
to proxy for the relative emission price, ln τ iωi0. In particular, I will use the indicator
variable for Annex I status under the Kyoto Protocol CPi. A number of previous
studies have also utilized the same measure as a proxy of the stringency of climate
11

change policy (Aichele & Felbermayr, 2010; Yörük and Zaim, 2008). The underlying
assumption is that there is a link between Kyoto commitment and actual climate
policies that potentially result in higher emission prices. This policy measure may
be correlated with other country characteristics or institutional measures that may
potentially affect trade patterns. In particular, Annex I countries are mostly high
income countries that tend to have good legal and financial institutions. If an indus-
try’s dependency on such measures is correlated with emission intensities, ignoring
them will render estimates for the coeffi cient on the climate change policy-emission
intensity interaction biased. I will therefore try to control for various country charac-
teristics and institutional measures. Moreover, because it is a bivariate variable, only
the average effect of Annex I membership to the Kyoto Protocol on the patterns of
trade can be estimated with potential country-heterogeneity remaining undisclosed.
It is, however, feasible to generate an emission interaction term for each of the Annex
I countries using indicator variables. One can then observe the coeffi cients for each
countries and check if there is an interesting pattern in the heterogeneity. For the
industry emission expenditure share skE, I will use the measure of CO2 emission in-
tensity, i.e., the amount of CO2 emitted per unit of value added, which I will discuss
in detail in the next section.
In this paper, I will use US imports data for empirical estimation. When esti-
mating equation 2 with only one importer, all the bilateral distance variables βdDni
and the bilateral error term υni will be absorbed into the exporter fixed effect αi.
Following standard practice in the literature, I use factor endowment ratios in the
place of factor price ratios. The main estimation equation is now
ln(Mki ) = βECPis
kE +
F∑f=1
βf
(lnVifVi0
)skf + αi + αk + υkni (3)
12

where log US imports are regressed on the interaction of Annex I status CPi and CO2
emission intensities skE, factor interactions(
lnVifVi0
)skf and exporter and industry fixed
effects αi and αk. Because of data availability at the level of analysis, I do included a
wide range of possible determinants of comparative advantage. Though there will not
be a serious problem as long as they are not correlated with the emission interaction,
these unobserved variables may make the error terms correlate for a given exporter
or an industry. To accommodate such correlations, errors will be two-way clustered
by exporter and industry.
One potential concern for the estimation is that of endogenous selection. It is
conceivable that the countries that were already specializing in less emission intensive
industries, or self-selected to become Annex I parties to UNFCCC and ratify the
Kyoto Protocol. To provide evidence of the extent to which this is the case, I exploit
the panel structure of the trade data and address the endogeneity problem in several
ways.
First, I do a regression using the full panel spanning the years before and after
the signing of the Kyoto Protocol. I introduce two versions of the dummy variable
for Annex I status, and run the following regression
ln(Mki,t) = βRECP
Ri,ts
kE + βECPis
kE +
F∑f=1
βf
(lnVifVi0
)skf + αi,t + αk,t + υki,t (4)
where trade flowsMki,t are now also index by year t, and the fixed effects are now spec-
ified as exporter-time αi,t and industry-time αk,t. Errors are still two-way clustered
by exporter and industry. CPi is time invariant, denoting whether country i is com-
mitted under the Kyoto Protocol, while CPRi,t is only positive starting the year after
the country ratified the Kyoto Protocol. By including both as explanatory variables,
the estimation can provide evidence on the extent to which there were preexisting
13
patterns of specialization in emission intensive industries before the signing of the
Kyoto Protocol and the extent to which there are changes in trends following the
ratification of the Protocol. Thus, I can identify if ratification of the Kyoto Protocol
indeed institutes more stringent climate policy that significantly affects patterns of
trade.
Alternatively, I estimate equation 3 for every year from 1990 to 2010. I then
check whether the βE is significant before the signing of the Kyoto Protocol or is only
the case after the Protocol entered into force. Compared with the single regression
of equation 4 using the full sample, the series of regressions is more flexible to the
extent that the coeffi cients on the factor interactions are allowed to differ over time,
however, it does not capture the differences in the year of each Annex I parties ratified
the Kyoto Protocol.
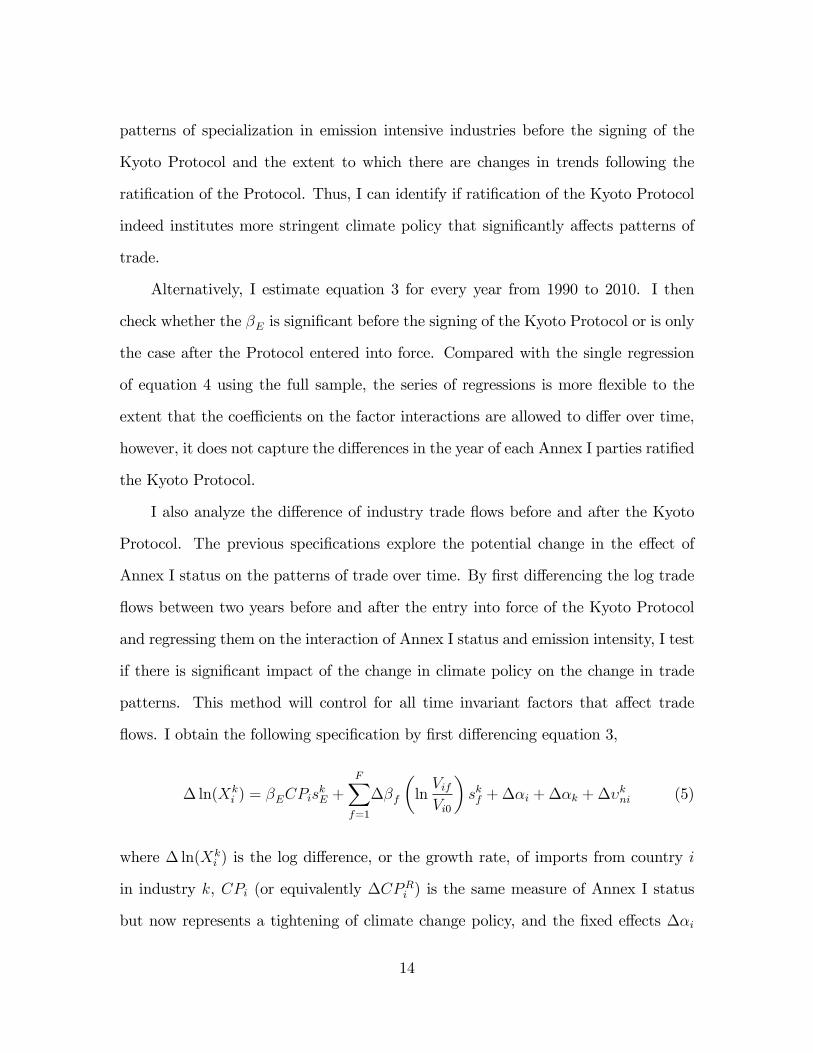
I also analyze the difference of industry trade flows before and after the Kyoto
Protocol. The previous specifications explore the potential change in the effect of
Annex I status on the patterns of trade over time. By first differencing the log trade
flows between two years before and after the entry into force of the Kyoto Protocol
and regressing them on the interaction of Annex I status and emission intensity, I test
if there is significant impact of the change in climate policy on the change in trade
patterns. This method will control for all time invariant factors that affect trade
flows. I obtain the following specification by first differencing equation 3,
∆ ln(Xki ) = βECPis
kE +
F∑f=1
∆βf
(lnVifVi0
)skf + ∆αi + ∆αk + ∆υkni (5)
where ∆ ln(Xki ) is the log difference, or the growth rate, of imports from country i
in industry k, CPi (or equivalently ∆CPRi ) is the same measure of Annex I status
but now represents a tightening of climate change policy, and the fixed effects ∆αi
14

and ∆αk now control for changes in the country and industry specific factors that
contribute to the change in trade flows, such as a country signing a trade agreement
with US or an increase in US demand for a particular industry. Considering the
relatively short time period of several years, I have assumed that other country and
industry specific characteristics, including industry factor shares skf and country factor
endowments(
lnVifVi0
), have not changed over the period. Hence, these interaction
terms drop out if the coeffi cients βf remain unchanged. One complication is that
before Kyoto, the cost of emission may not be part of the cost function of firms,
and therefore the coeffi cient for other factor share and factor endowment interaction
terms may indeed be different. For robustness, I report estimation results with the
factor interaction terms as well. The estimated coeffi cients now signifies change in the
previously described coeffi cients ∆βf . To explore whether there is any evidence of a
preexisting trend in Annex I countries toward specializing in less emission intensive
products, I conduct a similar regression on first differenced log trade flows between
two years before the Kyoto enters into force and check if βE is significant.
So far we have exploited the difference between the climate change policies of
the Annex I and non-Annex I countries to test if the Kyoto Protocol has had an
effect on trade patterns. It is also informative to separately analyze the pattern
of specialization with respect to industry emission intensity for the two groups of
countries. The last exercise I do is to estimate the following equation for the respective
groups,
ln(Mki ) = βEs
kE +
F∑f=1
βfsskf +
F∑f=1
βf
(lnVifVi0
)skf + αi + υkni (6)
where log imports Mki , is regressed on emission intensity s
kE, industry factor shares
skf and factor interactions(
lnVifVi0
)skf with country fixed effects αi. Since there is
no variation in the Annex I status within the Annex I and non-Annex I groups, the
15
emission interaction term reduces to emission intensities. Therefore industry fixed
effects cannot be included while industry factor shares are added in. Estimation of
of equation 6 will allow comparison between the Kyoto Protocol’s direct effect on
committed countries and the indirect effect on non-committed countries with respect
to specialization in emission intensive industries. If the Kyoto induced "carbon leak-
age" is strong enough, one would expect βE to be negative for Annex I countries and
positive for non-Annex I countries.
IV. Data
CO2 Emission Intensities.– Due to data availability, industry level CO2
emission intensities are created only US data. Data on industry CO2 emissions inten-
sities are from a report of Economics and Statistics Administration of US Department
of Commerce (ESA, 2010). The report analyzes energy-related CO2 emissions and
intensities for all Iliad5 industries, government and households in the US for the 1998
to 2006 period. The majority of the energy-related emissions are attributable to heat
and power. Direct input of energy to production, such as natural gas used in produc-
ing fertilizer, and process emissions for a small number of industries, such as cement
and lime, are also considered. The intensities are measured in emissions produced
per unit value of gross output, and reported for the three years of 1998, 2002 and
2006. For manufacturing industries, I am able to adjust such measures by the gross
output to value added ratios of the industries to obtain intensities in terms of direct
emissions per value added, which are more consistent with treating emission as a
factor of production. For agriculture and mining industries, value added data are
only available at a more aggregated level. Therefore for analysis of all industries, I
5Iliad stands for Interindustry Large-scale Integrated And Dynamic model of the U.S.. See DataAppendix for details.
16

use total emissions, including direct emissions in production and emissions embodied
in intermediate inputs, over total output. For the set of industries for which both
measure are available, i.e., the manufacture industries, the correlation between the
output and the value added based measures is very high, at about .98, as shown in
Table 2. Table 4 list the ten most and the ten least emission intensive industries.
The most emission intensive industries are lime, cement, fertilizer and a few mining
industries. The list is broadly consistent with those identified by previous studies
as the energy intensive industries that may be affected by climate regulations the
most (EPA, 2009). The least emission intensive industries are tobacco products and
high-tech industries.
I treat emission intensity as a time and country invariant characteristic of in-
dustries and use the average of the measures over 1998, 2002 and 2006 for all our
analysis. Over the period, the measured emission intensities are on a general decreas-
ing trend and the average emission intensity of US economy went down by about
20%. Therefore, if I were to analyze the evolution of total CO2 emissions over time, I
could not overlook the fact that technological advances are the main reason for emis-
sion reduction in the U.S., compared to industry reallocation or composition changes
(Levinson, 2009). However, since the main objective of this paper is to explore the
potential effect of relative emission intensities across different industries on the pat-
terns of international trade, I only need the relative intensities to remain stable over
time, i.e., an emission intensive industry before Kyoto kept being emission intensive
relative to other industries in the economy afterwards. As shown in Table 3, this is
indeed the case as the correlation between the measures from the three years (panel
(1) and (2), over .96) as well as the ranking of these measures (panels (3) and (4),
over .88) are very high.
Similar to previous studies, since I only have detailed data on emission for US
17

industries, I also need to assume that the relative intensities is the same across
economies. I recognized that there is substantial difference due to technological devel-
opment, resulting in different emission intensities in different countries, evidenced by
large differences in emission per capita and emission intensities of the general econ-
omy. I implicitly assume that advances in abatement technology is not biased toward
particular industry, rather it applies in general to all industries. If we believe most of
development in the CO2 emission abatement technologies apply to the energy sector,
then our assumption is valid, as all other industries consume the produced electricity
or fuel and all benefit from the technological advances.
Climate Change Policy.– I use the Annex I membership to UNFCCC as a
proxy of a country’s climate change policy. In particular, if a country is an Annex I
party, it commits to reduce or limit its emission levels relative to a baseline (in most
cases the 1990 emission level) under the Kyoto Protocol. The underlying assumption
is that a country that commits to reduce emissions will adopt policy measures such
as cap-and-trade, taxes and effi ciency standards that puts a price on the price of
CO2 emissions. Firms in the economy will bear such cost either directly through
abatement or indirectly through increased prices of electricity and other inputs.
As discussed in Section III, I introduce two versions of the measure. The time
invariant Annex I dummy assigns 1 to a country if it is currently an Annex I party.
The other dummy assigns 1 to an Annex I party only starting the year after it has
ratified the Kyoto Protocol. There are other ways of assigning the time varying Annex
I status with respect to the Kyoto Protocol, according to when a country signs the
Protocol (before ratification) or when the Protocol actually went into force for the
country (the later of Feb., 2005 or 90 days after ratification). All yield similar results
for our estimation.
Other variables.– Data on trade flows, factor endowments, factor intensities
18
of production and other country characteristics are from standard sources. US im-
port data in Harmonized System (HS) 10-digits are from US Census, 1990 to 2005
from Schott (2008), 2006 to 2010 from Census Disks. Data are then aggregated to
Iliad industry level, using HS to the North American Industry Classification System
(NAICS) concordances provided by the Census and Pierce and Schott (2009), and
NAICS to Iliad concordances from the Interindustry Forecasting Project at the Uni-
versity of Maryland (Inforum). The panel of trade flows is unbalanced. There are
many zeros or missing data, so the estimation results must be interpreted as condi-
tional on positive trade flows. I also use the data on output and export of ISIC3 4
digit industries from 70 countries obtained from Industrial Demand-Supply Balance
Database of UNIDO (2011).
Capital endowment is proxied by the capital-labor ratio from Extended Penn
World Tables (EPWT) (Marquetti, 2011), averaged for years 1990 to 2009. Human
capital is proxied by average years of education for Barro & Lee (2001). I use the
data from 2000, which is the latest available, in our estimation. For countries where
the 2000 data are missing but 1995 or 1990 data are available, I update the older data
based on a quadratic estimation of 2000 measures from 1995 or 1990. Capital and skill
shares are calculated from value added, total payroll and production worker payroll
data. The shares are averaged over 1990 to 2009. Data from 1990 to 2005 are from
NBER CES manufacturing industry database (Becker & Gray, 2009); data from 2006
to 2009 are obtained from the Annual Survey of Manufactures by the U.S. Census
Bureau. Since the focus of the paper is on the cross sectional pattern of trade and the
time series variation over this short interval of time is likely to be small relative to
cross-sectional variation across countries, I treat these country and industry specific
measures as time invariant.
I also obtain income per capita, CO2 emission per capita and CO2 intensity of
19

GDP for each year from EPWT. I obtain a measure of stringency of a country’s
environmental regulations from Global Competitiveness Report (2007).
V. Empirical Results
Emission Content of US imports.– Before I present the estimation results,
I take a look at some raw data available to see if the they lend support to the
hypothesis that the Kyoto Protocol has an impact on patterns of trade. Using U.S.
emission intensities, constant for all years, I calculate the proportion of CO2 emissions
embodied in imports of US, or the displaced US emission by importing, from non-
Annex I countries. Figure 3 shows that over the period of study, there is a steady
increasing trend from 37 percent in 1990 to 53 percent in 2010. It seems to suggest
that the U.S. is importing more of embodied carbon from countries with less stringent
climate policy. However, an apparent explanation is that US is just importing more
goods from non-Annex I countries, which includes fast growing emerging economies.
Indeed, the proportion of total US imports from non-Annex I countries is almost
parallel to the proportion of "carbon imports." Nonetheless, if we consider that non-
Annex I countries also tend to use out-dated more emission intensive technologies in
production compared to Annex I countries, then the increase in proportion of "carbon
imports" from non-Annex I countries may be increasing faster than that of the value
of imports. Potentially, "carbon leakage" as a result of unilateral commitment to
emission abatement could be happening. Another interesting observation is presented
in Figure 4. Non-Annex I countries seems to have a large share of total output from
emission intensive industries, while they do not seem to be exporting proportionally
more than Annex I countries in these industries. To explore more rigorously on the
impact of Kyoto Protocol on the pattern of trade, I present the estimation results.
20

Baseline Results.– I present here as baseline result a pure cross-sectional
analysis of the data of US imports in 2007 based on equation 3. I choose 2007 because
it is the last year before the collapse of trade in the Great Recession, while late enough
for the economies to adjust for policy changes brought about by the Kyoto Protocol,
being the last year before the first commitment period. Regressions based on data
from other years in mid to late 2000s yield similar results. The estimated coeffi cient
for the interaction CPiskE is negative and statistically significant, suggesting Annex
I countries export less in emission intensive industries, which is consistent with the
hypothesis that climate change policy is important for comparative advantage. In
particular, it implies that for an industry with an emission intensity half a standard
deviation above the mean, such as the glass containers industry, an Annex I country
will export on average a little over 20 percent less to the U.S. than an non-Annex
I country, controlling for general effects of country characteristics on all industries.
This effect is similar whether I consider all industries (column (1) of Table 5) or only
manufacturing industries (column (2)), or whether I use the output based measure
(columns (1) and (2)) or the value added based measure (column (3)) of emission
intensity.
CO2 emission intensive industries are essentially energy intensive industries,
which are also likely capital intensive. Annex I countries are high income countries,
generally with higher capital labor ratio than non-Annex I countries. Therefore one
would worry that the results presented above are merely a reflection of the endow-
ment of capital as a determinant of comparative advantage. Regression results with
controls for factor endowments as determinants of comparative advantage is reported
in column (4) Table 5. Adding controls for capital and skill interactions does reduce
the magnitude of the estimated coeffi cient on the emission interaction, however, it
remains significant at 5 percent level, which suggests that the emission intensity and
21

Annex I status interaction is not merely capturing other classical determinants of com-
parative advantage. In addition, the magnitude of the effect of the emission intensity
interaction is similar to the factor intensity interactions. The estimated coeffi cient
on the average measure of pollution intensity implies that an Annex I country would
export 29 percent less to the U.S. than a non-Annex I country in an industry with
an emission intensity one standard deviation above the mean. On the other hand,
a country with one standard deviation above the mean in average schooling would
export 38 percent more in an industry with a skill share one standard deviation above
the mean. Surprisingly, capital intensity does not seem to have a significant effect.
Robustness.– Including country and industry fixed effects in the estimation
already addresses a number of concerns, such as neutral differences in technology
levels across countries that have common effect on exports across industries, or differ-
ences in the relative volume of US imports across industries. One potential remaining
problem in the estimation of equation 3 is that environmental regulation is partially
determined by other country characteristics. In particular, it is possible that richer
citizens care more about potential damages of climate change and demand more strin-
gent climate policies. Alternatively, it is possible that countries with higher emissions
per capita feel more responsible to address climate change related issues. This leads
to a positive correlation between climate change regulation and those country char-
acteristics. If emission intensity is also correlated with other industry characteristics,
the omission of these other determinants of comparative advantage might bias the
estimated effect of climate change policy on comparative advantage. To address this
concern, I therefore estimate equation 3 including controls for interactions of emission
intensity with emission per capita, emission intensity of overall economy and income
per capita. The results reported in columns (2)-(4) of Table 6 show that the coeffi cient
on the original interaction do not a lot and remain significant. It suggests that Annex
22
I status is capturing more than the effect of aforementioned country characteristics
On the other hand, the status is highly correlated with the stringency of a coun-
try’s environmental regulations, at about .8. This is not surprising since the climate
change policies constitute part of the overall environmental regulations. As a result,
the interaction term of emission intensity with Annex I status becomes insignificant
when controlling for interaction term with the finer measure of stringency (column
(5)).
A closely related concern as a result of the use of a binary variables is that only an
average effect of commitment under the Kyoto Protocol is identified. It is informative
to investigate if there are substantial variations in the effects across countries. To
explore the potential differences, I regress the log imports on interactions of emission
intensities with dummy variables for each of the Annex I countries. As Figure 8 shows,
there are indeed large difference between individual countries. Russia, Belarus and a
few others have a significantly positive coeffi cient on the emission interaction term,
suggesting that they actually tend to specialize more in emission intensive industries
relative to an average non-Annex I country. The result is not quite surprising. With
the exception of Greece, all the countries with a positive coeffi cient are EIT countries.
With their economies in drastic transition in the 1990s, these countries tend to have
a much lower emission level compared to the base years around 1990 as well as their
committed targets under the Kyoto Protocol (see Figure 2 and Table 1). Therefore,
there is not much pressure for such countries in meeting their commitment in the 2008-
2012 period and hence little incentive to ramp up climate change regulations. There
are, however, exception in the EIT group, as Czech Republic, Slovakia, Hungary and
Poland are among those with the most negative coeffi cients. These four countries
were among the first EITs to join the EU in 2004 and it is possible that they have
taken the opportunity to restructure their economy to be green. The result echoes
23

with earlier finding by Yörük and Zaim (2008) that Poland and Hungary are the best
in environmental performance among OECD countries6, while Czech Republic and
Slovakia both score fairly high, at just over one standard deviation above the mean, in
terms of stringency of environmental regulation in the 2007 Global Competitiveness
Report.
VI. Endogeneity
As discussed in section III, one must be cautious in interpreting the OLS re-
sults presented in the previous section. This is because that causality may run from
trade flows to climate change policy. Countries may have chosen to become Annex I
members of the Kyoto Protocol when they were already specializing in less emission
intensive industries. To address this concern, I exploit the panel structure of the
data on trade flows and present three sets of results to provide evidence against this
potential alternative explanation.
Changes in Climate Policy.– As explained in section III, I pool the cross
sectional data for each year and use the full panel for an estimation of equation
4. I characterize the change in the regression coeffi cient of the interaction term of
emission intensity and Annex I membership before and after a country ratifies the
Kyoto Protocol, by including two sets of interaction variables. One of the interaction
is time invariant, based on a country’s commitment under the Kyoto Protocol and
the other time variant, only positive for years after a country’s ratification of the
Protocol. The regression includes industry-year fixed effects, which capture any factor
that affects export in all countries in the same way in a given industry year, as well
as country-year fixed effects, which capture the factors that influence exports in all
6Slovak Republic and Czech Republic are excluded from Yörük and Zaim’s (2008) analysis dueto the unavailability of the data.
24
industries in the same manner for a given country year.
As shown in Table 7, when I include both versions of the interaction term
(columns (2) and (4)), the coeffi cient on the time-invariant one is a little more than
half of the magnitude of the coeffi cient of the time varying status as a single regressor
(columns (1) and (3)), suggesting that Annex I countries had been exporting less in
emission intensive industries before they ratified the Kyoto Protocol. However, this
effect is only significant at the 10 percent level. On the other hand, the coeffi cient
on the time-varying term is highly significant and is also about half the magnitude
of the coeffi cient on time varying emission interaction term as a single regressor. It
shows that Annex I countries experience a reduction in exports in emission intensive
industries following their ratification of or accession to the Kyoto Protocol. This sug-
gests that ratifying the Kyoto Protocol does signal a more stringent climate change
policy and higher costs of emission made committing countries export even less in
CO2 intensive industries.
Regression of Differences.– A related approach to examine the impact of
the Kyoto Protocol in changing export patterns is to estimate equation 5, with the
specification in log differences. As discussed in section III, the estimation is based on
the intuition that the ratification of Kyoto Protocol constitutes a policy change for
the Annex I countries. The fixed effects in the regress now control for the average
growth rate of industry trade flows of each exporter and the average growth rate of
country trade flows for a particular industry. In reality it takes time for the real
economy to respond to policy changes, therefore I exploit the changes in trade flows
before and after the adoption (ratification) of the Kyoto Protocol to see if becoming
and Annex-I member mattered for the patterns of trade. I look at changes between
1992 and 1999 and that of 2000 and 2007. The reason for choosing 1999/2000 as the
breaking point is that most countries signed the Protocol in 1998 or 1999 but did not
25

ratify until the early 2000s. In addition, the Protocol did not enter into force until
16 February 2005. Choosing other reasonable years yields similar results.
Table 8 shows that the effect on the changes of US import volume is significant for
the Kyoto period, but not for the pre-Kyoto period. This suggests that committing to
emission abatement through becoming an Annex-I party to the Kyoto Protocol does
make a country export less in emission intensive industries relative to non-committed
economies.
Trends.– Another related approach to address the selection issue is to estimate
equation 3 for each year from 1990 to 2010 and check whether the patterns of trade
with respect to varying emission intensities have changed before and after the Kyoto
Protocol. This approach is more general than the previous specification of equation
4 with post-ratification interaction, as it allows the coeffi cient on Annex I status to
vary flexibly over time. It enables me to look at pre-trends as well as initial level
differences. Figure 7 presents the series of coeffi cients on the emission interaction
term along with 95 percent confidence bands.
The coeffi cient seems to be rather flat and not different from zero until year
2000, after which there is a clear downward trend. Eventually, it becomes statistically
different from zero. This is consistent with the previous results that there is a week
pattern of Annex I parties exporting less emission intensive goods before the Kyoto
Protocol. However, the policy change signified by the ratification of the Protocol does
have statistically significant effect. Namely, the pattern that an Annex I party export
less in emission intensive industries becomes stronger after the adoption of the Kyoto
Protocol in later 1997 and eventually becomes statistically significant from zero as
it approaches the commitment period of the Protocol. The fact that the coeffi cient
is close to zero and not moving much suggests that there does not appear to be a
preexisting trend for the Annex I countries to shift toward cleaner exports. Thus
26
endogenous selection is not a great issue for my analysis.
I further analyze the two sets of countries separately, estimating equation 6.
For Annex I countries and non-Annex I countries, I separately regress trade flows
on emission intensity controlling for factor shares and factor endowment-factor share
interactions with country fixed effects. This specification further allows me to analyze
the trade patterns of the two sets of countries with respect to emission intensity, rather
than focusing on their differences. It also allows the coeffi cients on the H-O forces
to differ for the two groups of countries, which according to the theory behind the
estimation equations could indeed be the case if the price of emission is negligible
in non-committing countries. The evolution of the coeffi cient on emission intensity
in presented in Figure 6. It is clear that although the coeffi cient for the Annex I
countries is generally below zero and that for non-Annex I countries about zero, they
are not significantly different from each other until later in the period. Starting in
the late 1990s, concurrent with the signing of the Kyoto Protocol, there seems to be a
diverging trend. Most of the increasing differences between the two is because of the
decreasing trend of the coeffi cient for Annex I parties. It suggests that the effect of
the more stringent climate policy indeed mainly affects the countries that adopt them.
There seem to be little evidence that non-committing countries are moving toward
specializing in more emission intensive industries. This is an interesting observation
that it suggests the general equilibrium relocation of production does not seem have
happened therefore the dreaded "carbon leakage" may not be as serious as some have
feared, at least through the production relocation channel. Of course, since our data is
limited to US imports, this could be explained by a change in US domestic production
moving toward more emission intensive industries or the US demand moving toward
less emission intensive industries. It warrants further analysis
Exploiting the panel structure of the data, I have been able to address the po-
27
tential selection issue. I find no evidence that Annex I countries specialized less in
emission intensive industries prior to the adoption of the Kyoto Protocol. Rather,
there is a statistically significant decline in their specialization in these industries
following their ratification of the Protocol. This pattern of results is consistent with
an impact of the Kyoto Protocol on patterns of specialization across industries and
on overall emissions through a change in the composition of exports and production.
VII. Conclusion
In this paper I attempt to empirically assess the impact of climate change policies
on economic activities using detailed data on industry emission intensities and trade
flows. Using estimation strategies informed by recent developments in the quantitative
general equilibrium of international trade, I find that climate change regulations are
an important determinant of comparative advantage in emission intensive industries.
In particular, countries that commit to binding emission targets under the Kyoto
Protocol export less in emission intensive industries. The result is robust to a variety
of controls of comparative advantage and the magnitude of the effect is comparable to
that of factor endowment. Exploiting the panel structure of the data, I show there is
indeed a statistically significant trend of committed countries shifting exports toward
less emission intensive industries that emerged after the introduction of the Kyoto
Protocol, which cannot be explained by any trend previously existed.
My analysis suggests that despite skepticism of its effectiveness, the Kyoto Pro-
tocol does have a effect on the organization of trade production, which may lead to
reduction of GHG emissions in countries with binding commitments. On the other
hand, there is little evidence that there is generally equilibrium production relocation
which may contribute to sizable "carbon leakage." Therefore, adoption of carbon mo-
28

tivated boarder adjustments to address the leakage concern may be not be desirable
Given significant differences in the technological differences across countries, atten-
tion of policy making may be better directed at facilitating technological transfer and
other mitigation and growth potentials (UNCTAD, 2010).
REFERENCES
Aichele, R. & Felbermayr, G. (2010). "Kyoto and the carbon content of trade," FZID
Discussion Paper 10-2010.
Atkinson, G., Hamilton, K. Ruta, G. & van der Mensbrugghe, D. (2009).. "Trade in
‘virtual carbon’: Empirical results and implications for policy," Background paper to
the 2010 World Development Report, Policy Research Working Paper 5194.
Barro, R. J. & Lee, J.-W. (2000). "International Data on Educational Attainment:
Updates and Implications", CID Working Paper No. 42.
Becker, R. A. & Gray, W. B. (2009). "NBER-CES manufacturing industry database."
Available at http://www.nber.org/data/nbprod2005.html.
Boden, T.A., Marland, G., & Andres, R. J. (2011). "Global, regional, and national
fossil-fuel CO2 emissions," Carbon Dioxide Information Analysis Center, Oak Ridge
National Laboratory, U.S. Department of Energy, Oak Ridge, Tenn., U.S.A. doi
10.3334/CDIAC/00001_V2011
Broner, F., Bustos, P. & Carvalho, V. M. (2011). "Sources of comparative advantage
in polluting industries." Unpublished.
Chor, D. (2010). "Unpacking sources of comparative advantage: A quantitative ap-
proach," Journal of International Economics, 82, 152-167.
29

Chua, S. (1999) "Economic growth, liberalization, and the environment: A review of
the economic evidence," Annual Review of Energy and the Environment, 24, 391-430.
Copeland, B. R. & Taylor, M. S. (2001). "International trade and the environment:
A framework for analysis," NBER Working Paper No. 8540.
Copeland, B. R. & Taylor, M. S. (2005). "Free trade and global warming: A trade
theory view of the Kyoto Protocol," Journal of Environmental Economics and Man-
agement, 49, 205-234.
Demailly & Quirion, 2006
Demailly, D. & Quirion, P. (2008). "European Emission Trading Scheme and com-
petitiveness: A case study on the iron and steel industry," Energy Economics, 30,
2009-2027.
Dinda, D. (2004). "Environmental Kuznets curve hypothesis: A survey," Ecological
Economics, 49, 431-455.
Douglas, S. & Nishioka, S. (2009). "International differences in emissions intensity and
emissions content of global trade," Working Papers 09-02, Department of Economics,
West Virginia University.
Eaton, J. & Kortum, S. (2002). "Technology, geography, and trade," Econometrica,
70, 1741-1779.
Ederington, J., Levinson, A. & Minier, J. (2005). "Footloose and pollution-free," The
Review of Economics and Statistics, 87, 92-99.
Frankel, J. (2009). "Environmental effects of international trade," HKS Faculty Re-
search Working Paper RWP09-006.
30
World Economic Forum. (2007). The Global Competitiveness Report 2007-2008.
Geneva: World Economic Forum.
Grubb, M., Brewer, T., Sato, M., Heilmayr, R., & Fazekas, D. (2009).
"Climate policy and industrial competitiveness: Ten insights from Europe on
the EU Emissions Trading System," German Marshall Fund. Available at:
http://www.climatestrategies.org/component/reports/category/61/204.html.
Grunewald, N. & Martínez-Zarzoso, I. (2011). "How well did the Kyoto Protocol
work? A dynamic-GMM approach with external instruments," Ibero America Insti-
tute for Econ. Research (IAI) Discussion Paper 212.
Karp, L. (2010). "Reflections on carbon leakage." Unpublished.
Karp, L. (forthcoming). "The environment and trade: A review," forthcoming, An-
nual Review of Resource Economics.
Keller, W. & Levinson, A. (2002). "Pollution abatement costs and foreign direct
investment inflows to U.S. states," The Review of Economics and Statistics, 84, 691-
703.
Levchenko, A. (2007). "Institutional quality and international trade," Review of Eco-
nomic Studies, 74, 791-819.
Levinson, A. (2009). "Technology, international trade, and pollution from US manu-
facturing," American Economic Review, 99, 2177-2192.
Levinson, A. & Taylor, M. S. (2008). "Unmasking the pollution haven effect," Inter-
national Economic Review, 49, 223-254.
31

List, J. A., Millimet, D. L., Fredriksson, P. G., & McHone, W. W. (2003). "Effects of
environmental regulations on manufacturing plant births: Evidence from a propensity
score matching estimator," The Review of Economics and Statistics, 85, 944-952.
Marquetti, A. (2011). "Extended Penn world tables." Available at
http://homepage.newschool.edu/~foleyd/epwt/.
Nunn, N. (2007). "Relationship-specificity, incomplete contracts, and the pattern of
trade," The Quarterly Journal of Economics, 122, 569-600.
Peters, G. P. & Hertwich, E. G. (2008). "CO2 embodied in international trade with
implications for global climate," Environmental Science and Technology, 42, 1401-
1407.
Pierce, J. R. & Schott, P. K. (2010). "Concording U.S. Harmonized System codes over
time." Available at: http://faculty.som.yale.edu/peterschott/sub_international.htm.
Romalis, J. (2004). "Factor proportions and the structure of commodity trade,"Amer-
ican Economic Review, 94, 67-97.
Schott, P. K. (2008). "The relative sophistication of Chinese exports," Economic
Policy, 23, 5-49.
Su, B., Huang, H. C., Ang, B. W., and Zhou, P. (2010). "Input—output analysis of CO2
emissions embodied in trade: The effects of sector aggregation," Energy Economics,
32, 166—175.
UNCTAD. (2010). Trade and environment review 2009/2010: Promoting poles of
clean, sustainable growth in developing countries to enhance resilience to the inter-
related economic, food and climate crises. New York and Geneva: United Nations
Publications.
32
UNFCCC. (2011). Total CO2 Equivalent Emissions with-
out Land Use, Land-Use Change and Forestry. Available at:
http://unfccc.int/ghg_data/ghg_data_unfccc/time_series_annex_i/items/3814.php.
UNIDO. (2011). Industrial Demand-Supply Balance Database, 2011 edition at the 4-
digit level of ISIC Revision 3. Vienna, Austria: Statistics and Information Networks
Branch, UNIDO.
U.S. Census Bureau. (2007-2011).U.S. Imports Merchandise Trade, 2006-2010. Wash-
ington, DC: U.S. Census Bureau.
U.S. Census Bureau. (2007, 2009-2010). Annual Sur-
vey of Manufactures (ASM), 2006, 2008-2009. Available at:
http://factfinder.census.gov/servlet/DatasetMainPageServlet?_program=EAS.
U.S. Census Bureau. (2008). 2007 Economic Census and Surveys. Available at:
http://factfinder.census.gov/servlet/DatasetMainPageServlet?_program=ECN.
Economics & Statistics Administration, U.S. Department of Commerce.
(2010). "U.S. carbon dioxide emissions and intensities over time: A de-
tailed accounting of industries, government and households." Available at:
http://www.esa.doc.gov/Reports/u.s.-carbon-dioxide.
U.S. Environmental Protection Agency. (2009). "The effects of
H.R. 2454 on international competitiveness and emission leak-
age in energy-intensive trade-exposed industries." Available at:
http://www.epa.gov/climatechange/economics/pdfs/InteragencyReport_Competitiveness-
EmissionLeakage.pdf.
33
Yörük, B. K. & Zaim, O. (2008). "International regulations and environmental per-
formance," Applied Economics, 40, 807-822.
Zeng, K. & Eastin, J. (2007). "International economic integration and environmental
protection: The case of China," International Studies Quarterly, 51, 971-995.
34
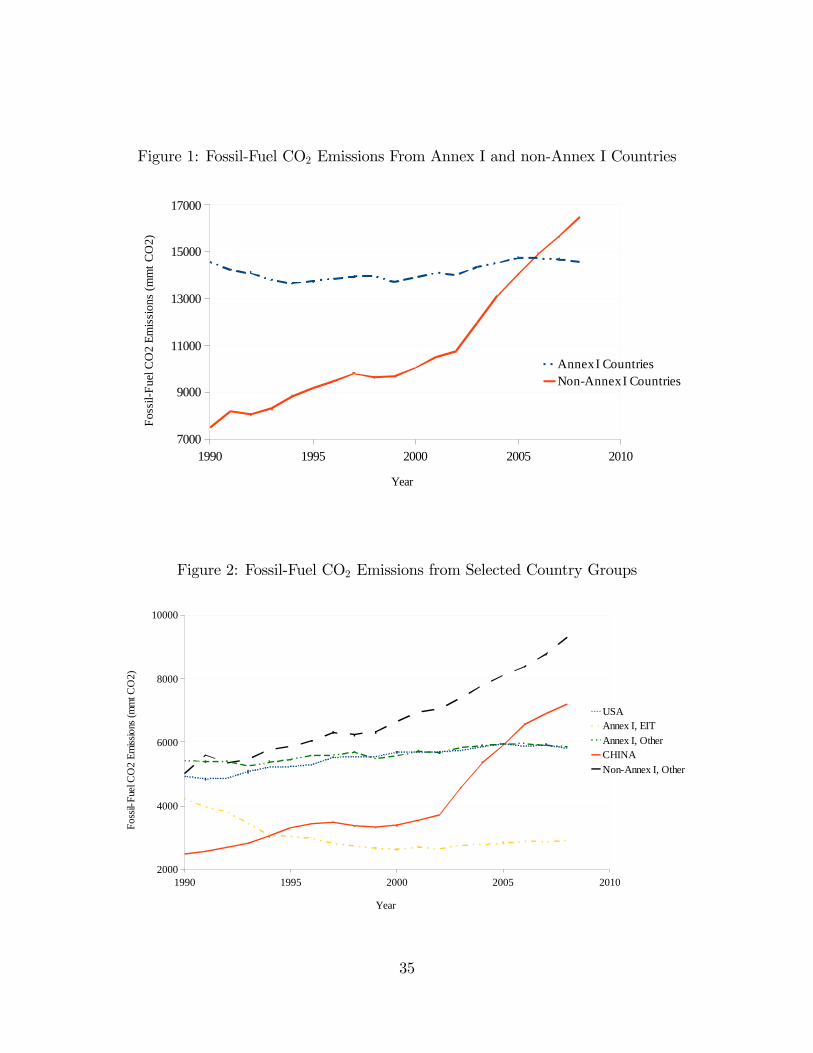
Figure 1: Fossil-Fuel CO2 Emissions From Annex I and non-Annex I Countries
1990 1995 2000 2005 20107000
9000
11000
13000
15000
17000
Annex I CountriesNonAnnex I Countries
Year
Foss
ilFu
el C
O2
Emis
sion
s (m
mt C
O2)
Figure 2: Fossil-Fuel CO2 Emissions from Selected Country Groups
1990 1995 2000 2005 20102000
4000
6000
8000
10000
USAAnnex I, EITAnnex I, OtherCHINANonAnnex I, Other
Year
Foss
ilFu
el C
O2
Emiss
ions
(mm
t CO
2)
35
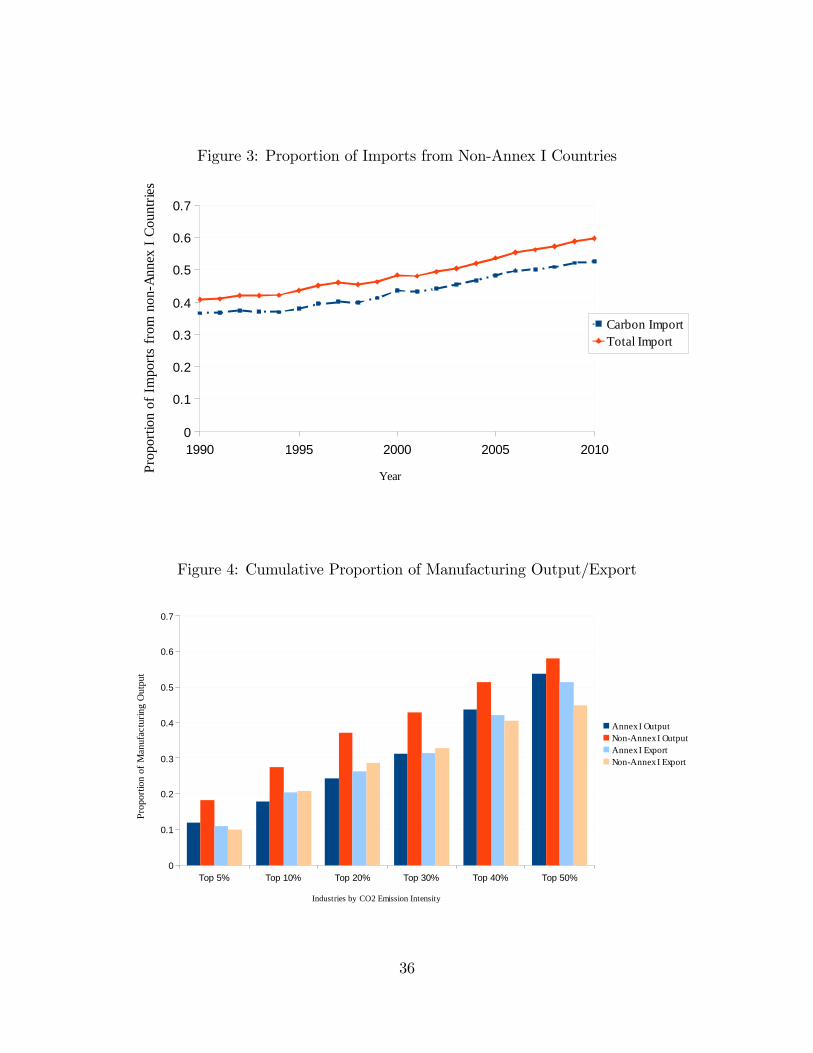
Figure 3: Proportion of Imports from Non-Annex I Countries
1990 1995 2000 2005 20100
0.1
0.2
0.3
0.4
0.5
0.6
0.7
Carbon ImportTotal Import
YearProp
ortio
n of
Impo
rts fr
om n
onA
nnex
I Co
untri
es
Figure 4: Cumulative Proportion of Manufacturing Output/Export
Top 5% Top 10% Top 20% Top 30% Top 40% Top 50%0
0.1
0.2
0.3
0.4
0.5
0.6
0.7
Annex I OutputNonAnnex I OutputAnnex I ExportNonAnnex I Export
Industries by CO2 Emission Intensity
Prop
ortio
n of
Man
ufac
turin
g O
utpu
t
36
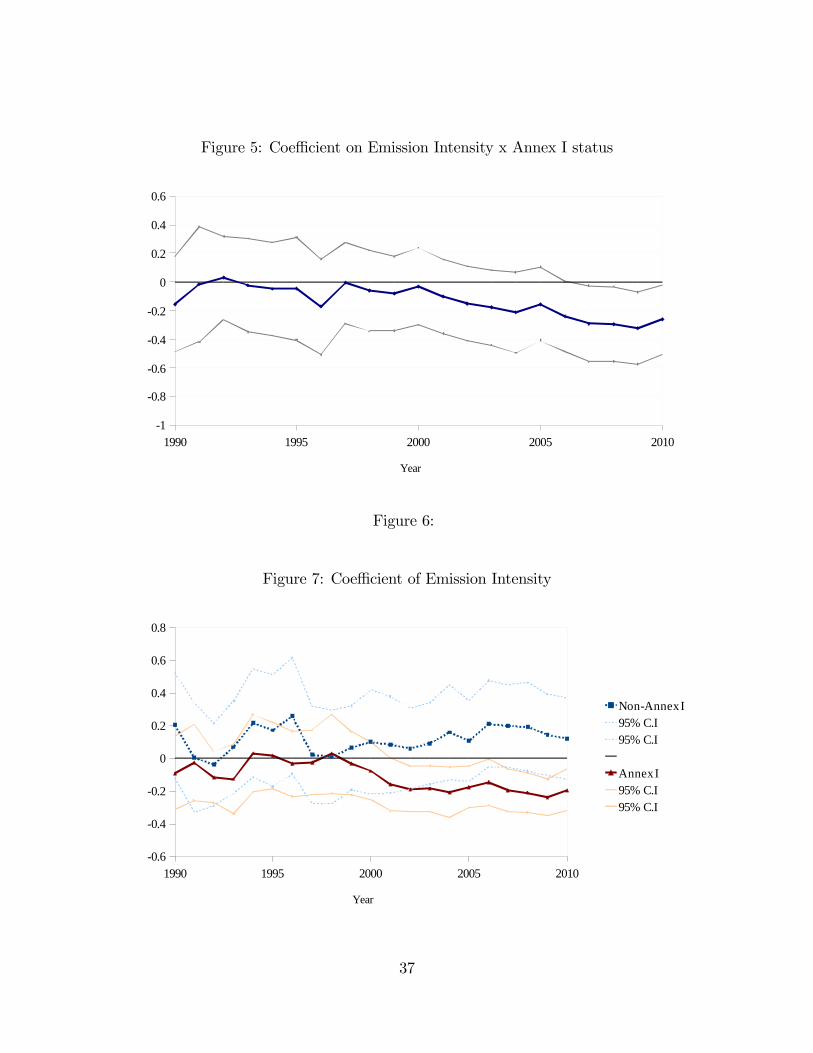
Figure 5: Coeffi cient on Emission Intensity x Annex I status
1990 1995 2000 2005 20101
0.8
0.6
0.4
0.2
0
0.2
0.4
0.6
Year
Figure 6:
Figure 7: Coeffi cient of Emission Intensity
1990 1995 2000 2005 20100.6
0.4
0.2
0
0.2
0.4
0.6
0.8
NonAnnex I95% C.I95% C.I
Annex I95% C.I95% C.I
Year
37

Figure8:CoefficientonEmissionInteractionforAnnexICountries
ISLM
CO NZLCZ
E IRLSV
K HUNA
UTPO
LLUX SW
EFIN PR
TGBR DN
KDEU A
USCH
E JPNLI
E ITAES
P FRASV
N TURBE
L NLDCA
N BGRHR
V ROMNO
R LTUES
T GRCLV
A UKRRU
S BLR
3210123
Coefficient on Emission Interaction
38
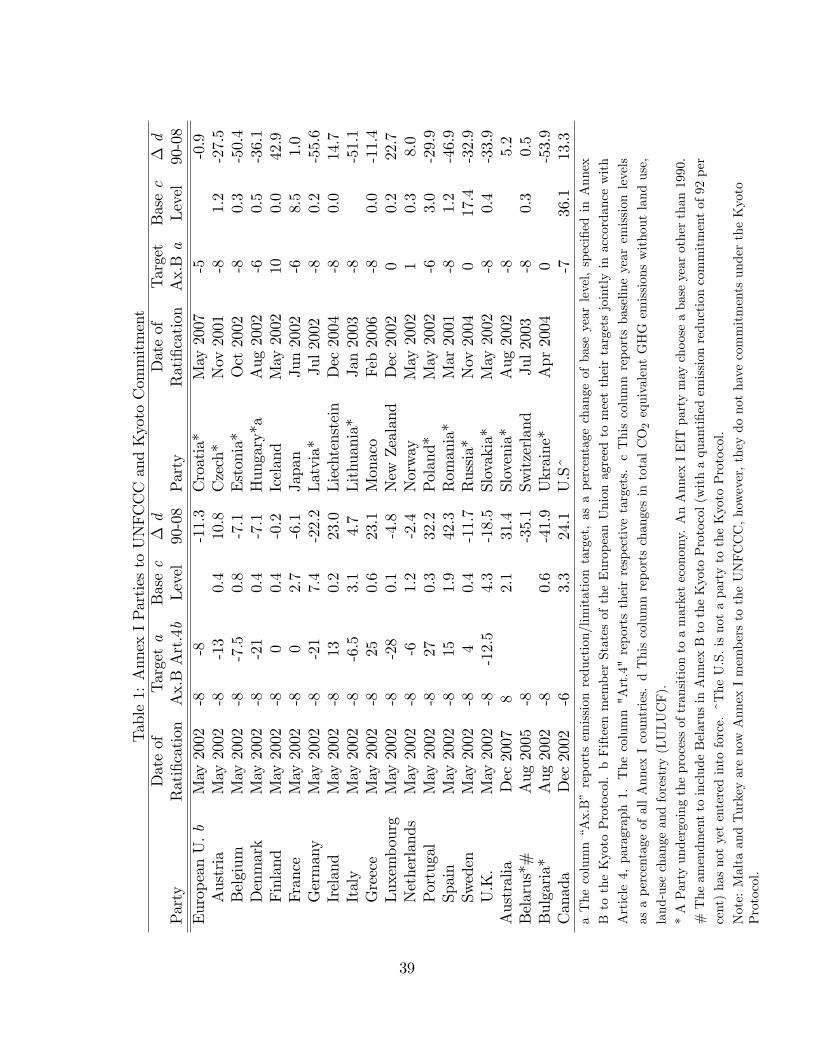
Table1:AnnexIPartiestoUNFCCCandKyotoCommitment
Dateof
Targeta
Basec
∆d
Dateof
Target
Basec
∆d
Party
Ratification
Ax.BArt.4b
Level
90-08Party
Ratification
Ax.Ba
Level
90-08
EuropeanU.b
May2002
-8-8
-11.3
Croatia*
May2007
-5-0.9
Austria
May2002
-8-13
0.4
10.8
Czech*
Nov2001
-81.2
-27.5
Belgium
May2002
-8-7.5
0.8
-7.1
Estonia*
Oct2002
-80.3
-50.4
Denmark
May2002
-8-21
0.4
-7.1
Hungary*a
Aug2002
-60.5
-36.1
Finland
May2002
-80
0.4
-0.2
Iceland
May2002
100.0
42.9
France
May2002
-80
2.7
-6.1
Japan
Jun2002
-68.5
1.0
Germany
May2002
-8-21
7.4
-22.2
Latvia*
Jul2002
-80.2
-55.6
Ireland
May2002
-813
0.2
23.0
Liechtenstein
Dec2004
-80.0
14.7
Italy
May2002
-8-6.5
3.1
4.7
Lithuania*
Jan2003
-8-51.1
Greece
May2002
-825
0.6
23.1
Monaco
Feb2006
-80.0
-11.4
Luxembourg
May2002
-8-28
0.1
-4.8
NewZealand
Dec2002
00.2
22.7
Netherlands
May2002
-8-6
1.2
-2.4
Norway
May2002
10.3
8.0
Portugal
May2002
-827
0.3
32.2
Poland*
May2002
-63.0
-29.9
Spain
May2002
-815
1.9
42.3
Romania*
Mar2001
-81.2
-46.9
Sweden
May2002
-84
0.4
-11.7
Russia*
Nov2004
017.4
-32.9
U.K.
May2002
-8-12.5
4.3
-18.5
Slovakia*
May2002
-80.4
-33.9
Australia
Dec2007
82.1
31.4
Slovenia*
Aug2002
-85.2
Belarus*#
Aug2005
-8-35.1
Switzerland
Jul2003
-80.3
0.5
Bulgaria*
Aug2002
-80.6
-41.9
Ukraine*
Apr2004
0-53.9
Canada
Dec2002
-63.3
24.1
U.S^
-736.1
13.3
aThecolumn“Ax.B”reportsemissionreduction/limitationtarget,asapercentagechangeofbaseyearlevel,specifiedinAnnex
BtotheKyotoProtocol.bFifteenmemberStatesoftheEuropeanUnionagreedtomeettheirtargetsjointlyinaccordancewith
Article4,paragraph1.Thecolumn"Art.4"reportstheirrespectivetargets.cThiscolumnreportsbaselineyearemissionlevels
asapercentageofallAnnexIcountries.dThiscolumnreportschangesintotalCO2equivalentGHGemissionswithoutlanduse,
land-usechangeandforestry(LULUCF).
*APartyundergoingtheprocessoftransitiontoamarketeconomy.AnAnnexIEITpartymaychooseabaseyearotherthan1990.
#TheamendmenttoincludeBelarusinAnnexBtotheKyotoProtocol(withaquantifiedemissionreductioncommitmentof92per
cent)hasnotyetenteredintoforce.^TheU.S.isnotapartytotheKyotoProtocol.
Note:MaltaandTurkeyarenowAnnexImemberstotheUNFCCC,however,theydonothavecommitmentsundertheKyoto
Protocol.
39

Table2:CorrelationBetweenOutputandValueAddedBasedIntensities
1998
2002
2006
Average
Correlation,sk E
,T,sk E
,D0.9774
0.9789
0.9792
0.9804
Correlation,ranks
0.8424
0.8519
0.8850
0.8667
sk E,T,measurestotalemissionperoutput,sk E,Dmeasuresdirectemissionpervalue
added.UnitsareinmetrictonsofCO2per$1000inconstant2000dollars.
40

Table 3: Correlations of Intensities Across Time1998 2002 2006 Average 1998 2002 2006 Average
(1) skE,T (2) skE,D1998 1 12002 0.9846 1 0.9915 12006 0.9655 0.9640 1 0.9859 0.9916 1Average 0.9928 0.9927 0.9856 1 0.9960 0.9981 0.9955 1
(3) Rank skE,T (4) Rank skE,D1998 1 12002 0.9189 1 0.9127 12006 0.8865 0.9331 1 0.8851 0.9287 1Average 0.9687 0.9745 0.9608 1 0.9643 0.9714 0.9598 1skE,T , measures total emission per output, s
kE,D measures direct emission per value added. Units
are in metric tons of CO2 per $1000 in constant 2000 dollars.
Table 4: The Most and the Least Emission Intensive IndustriesMost Intensive Intensities Least Intensive Intensities
skE,T skE,D skE,T skE,DLime 24.9 41.7 Tobacco products .26 .04Cement 12.1 17.4 Support activities for
printing.29 .13
Fertilizers 6.6 10.4 Propulsion units,parts for space vehi-cles, guided missiles
.29 .20
Iron ore mining 6.0 - Computer storage de-vices
.29 .16
Gold, silver, and othermetal ore mining
4.9 - Electricity and signaltesting instruments
.31 .13
Other nonmetallicmineral mining
4.6 - Other ordnance andaccessories
.31 .13
Primary aluminumproduction
4.6 7.8 Guided missiles andspace vehicles
.31 .22
Industrial gas 3.6 5.6 Telephone apparatus .32 .06Sand, gravel, clay andrefractory mining
3.6 - Surgical and medicalinstruments
.32 .09
Wet corn milling 3.4 6.9 Computer terminals .33 .15skE,T , measures total emission per output, s
kE,D measures direct emission per value
added. Units are in metric tons of CO2 per $1000 in constant 2000 dollars.
41
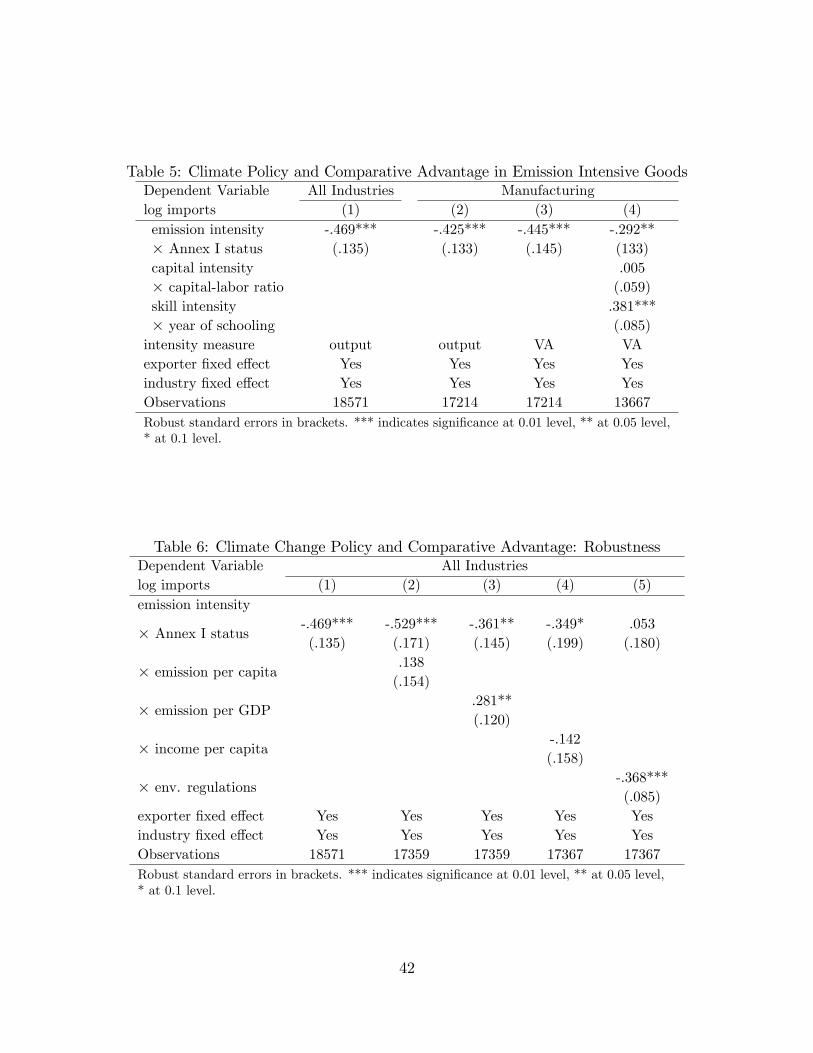
Table 5: Climate Policy and Comparative Advantage in Emission Intensive GoodsDependent Variable All Industries Manufacturinglog imports (1) (2) (3) (4)emission intensity× Annex I status
-.469***(.135)
-.425***(.133)
-.445***(.145)
-.292**(133)
capital intensity× capital-labor ratio
.005(.059)
skill intensity× year of schooling
.381***(.085)
intensity measure output output VA VAexporter fixed effect Yes Yes Yes Yesindustry fixed effect Yes Yes Yes YesObservations 18571 17214 17214 13667Robust standard errors in brackets. *** indicates significance at 0.01 level, ** at 0.05 level,* at 0.1 level.
Table 6: Climate Change Policy and Comparative Advantage: RobustnessDependent Variable All Industrieslog imports (1) (2) (3) (4) (5)emission intensity
× Annex I status -.469***(.135)
-.529***(.171)
-.361**(.145)
-.349*(.199)
.053(.180)
× emission per capita .138(.154)
× emission per GDP .281**(.120)
× income per capita -.142(.158)
× env. regulations -.368***(.085)
exporter fixed effect Yes Yes Yes Yes Yesindustry fixed effect Yes Yes Yes Yes YesObservations 18571 17359 17359 17367 17367Robust standard errors in brackets. *** indicates significance at 0.01 level, ** at 0.05 level,* at 0.1 level.
42
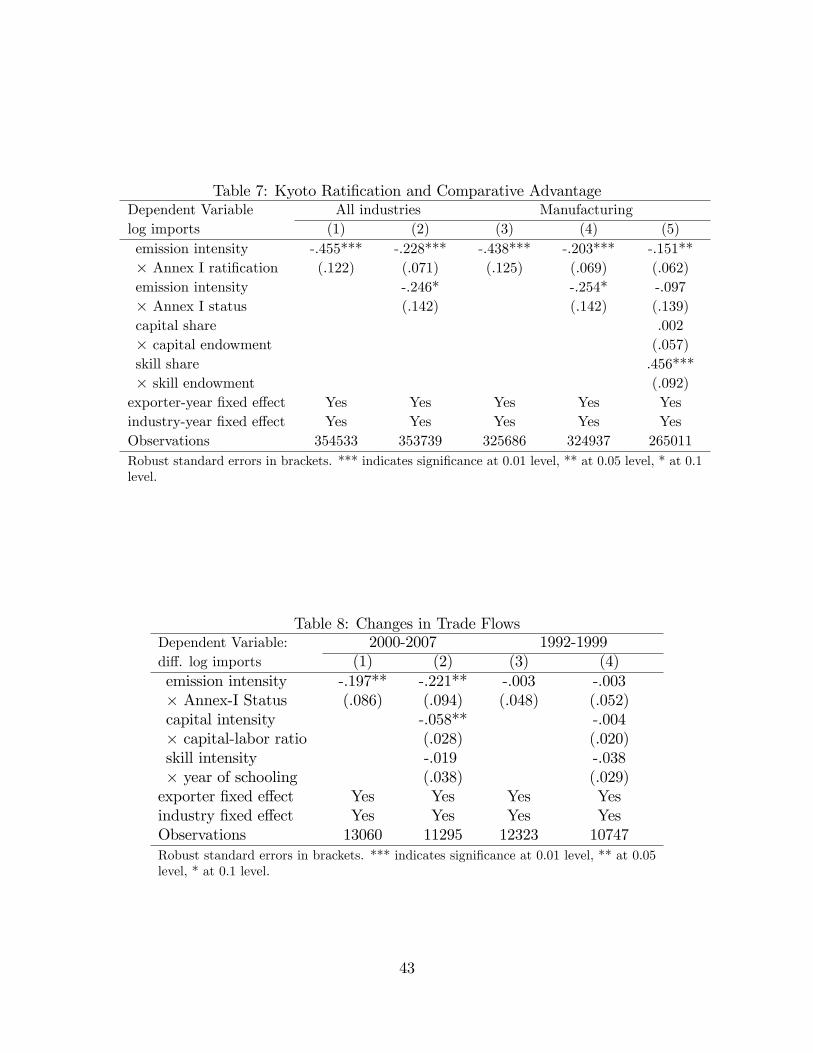
Table 7: Kyoto Ratification and Comparative AdvantageDependent Variable All industries Manufacturinglog imports (1) (2) (3) (4) (5)emission intensity× Annex I ratification
-.455***(.122)
-.228***(.071)
-.438***(.125)
-.203***(.069)
-.151**(.062)
emission intensity× Annex I status
-.246*(.142)
-.254*(.142)
-.097(.139)
capital share× capital endowment
.002(.057)
skill share× skill endowment
.456***(.092)
exporter-year fixed effect Yes Yes Yes Yes Yesindustry-year fixed effect Yes Yes Yes Yes YesObservations 354533 353739 325686 324937 265011Robust standard errors in brackets. *** indicates significance at 0.01 level, ** at 0.05 level, * at 0.1level.
Table 8: Changes in Trade FlowsDependent Variable: 2000-2007 1992-1999diff. log imports (1) (2) (3) (4)emission intensity× Annex-I Status
-.197**(.086)
-.221**(.094)
-.003(.048)
-.003(.052)
capital intensity× capital-labor ratio
-.058**(.028)
-.004(.020)
skill intensity× year of schooling
-.019(.038)
-.038(.029)
exporter fixed effect Yes Yes Yes Yesindustry fixed effect Yes Yes Yes YesObservations 13060 11295 12323 10747Robust standard errors in brackets. *** indicates significance at 0.01 level, ** at 0.05level, * at 0.1 level.
43