the lam dong redd+ pilot area, viet namthe lam dong redd+ pilot area, viet nam a ocioeconomi aseline...
TRANSCRIPT

Adrian Enright
RED
D+
co
un
tRy
REp
oR
t
The Lam Dong REDD+ pilot area, Viet Nam
A socioeconomic baseline survey

First published by the International Institute for Environment and Development (UK) in 2012Copyright © International Institute for Environment and DevelopmentAll rights reserved
For a full list of publications please contact:International Institute for Environment and Development (IIED)80-86 Gray’s Inn Road, London WC1X 8NHTel: +44 (0)20 3463 7399 Fax: +44 (0)20 3514 9055pubs.iied.org
Citation: Enright, A (2012) The Lam Dong REDD+ pilot area, Viet Nam: a socioeconomic baseline survey IIED, London.
This document has been produced with the financial assistance of the Norwegian Government through NORAD, as part of a multi-country project coordinated by IIED in partnership with UMB on Poverty and Sustainable Development Impacts of REDD Architecture. The views expressed in this document are the sole responsibility of the authors and do not necessarily represent the views of the institutions involved in this project or of NORAD.
Design by: Eileen Higgins, email: [email protected] photo: Duncan Macqueen

Poverty and sustainable development impacts of REDD architecture; options for equity growth and the environment
About this project...Poverty and sustainable development impacts of REDD architecture is a multi-country project led by the International Institute for Environment and Development (IIED, UK) and the University of Life Sciences (Aas, Norway). It started in July 2009 and will continue to December 2013. The project is funded by the Norwegian Agency for Development Cooperation (Norad) as part of the Norwegian Government’s Climate and Forest Initiative. The partners in the project are Fundação Amazonas Sustentável (Brazil); Hamilton Resources and Consulting (Ghana); SNV (Viet Nam); Sokoine University of Agriculture, Faculty of Forestry and Nature Conservation (Tanzania); and Makerere University, Faculty of Forestry and Nature Conservation (Uganda).
The project aims to increase understanding of how different options for REDD+ design and policy at international, national and sub-national level will affect achievement of greenhouse gas emission reduction and co-benefits of sustainable development and poverty reduction. As well as examining the internal distribution and allocation of REDD+ payments under different design option scenarios at both international and national level, the project will work with selected REDD+ pilot projects in each of the five countries to generate evidence and improve understanding on the poverty impacts of REDD+ pilot activities, the relative merits of different types of payment mechanisms and the transaction costs.
This report has been published under the Poverty and Sustainable Development Impacts of REDD Architecture: Options for equity, growth and the environment project generously funded by the Norwegian Agency for Development Cooperation (NORAD). SNV is implementing activities in Viet Nam under this project alongside our project partners the International Institute for Environment and Development (IIED) and the University of Life Sciences (UMB), Norway. For further information on this project, publications and other REDD+ projects managed globally by SNV, please visit http://www.snvworld.org/redd

Contents
1. Executive summary
2. Introduction A. Household structure and livelihoods B. Resource use, income and constraints C. Property rights, use rights and management D. Perceptions, attitudes and norms concerning resource conservation E. Pre-REDD+ analysis
3 Conclusions
1
36
14202427
29

List of abbreviations
CBFM Community Based Forest ManagementDARD Department of Agriculture and Rural DevelopmentDONRE Department of Natural Resources and EnvironmentFGD Focus group discussionFPIC Free, Prior and Informed ConsentHa HectareHH Household MRV Monitoring, Reporting and VerificationNTFP Non-timber forest productPFES Payments for Forest Ecosystem ServicesPRA Participatory Rural AppraisalREDD+ Reducing Emissions from Deforestation and Forest Degradation in Developing CountriesSNV The Netherlands Development OrganisationSD Standard Deviation
1
The Lam Dong REDD+ pilot area, Viet Nam: a socioeconomic baseline survey
Deforestation and forest degradation continue to be key threats in the central highlands forests of Viet Nam. Unplanned drivers include encroaching agriculture, illegal felling of trees for timber, and the collection of fuelwood. Planned deforestation and degradation also continue as a part of broader land-use planning and socio-economic development planning activities. This has seen large areas of land allocated for plantation development, expanded agricultural activities and infrastructure developments.
The Netherlands Development Organisation (SNV) began exploring REDD+ opportunities in the central highlands province of Lam Dong in 2009. Part of the preliminary work conducted has included carrying out socio-economic surveys in 2010 across three of the four communes involved in the REDD+ project area, with an additional ‘control’ commune added to the study. In total, 280 households were surveyed with the intention of creating a robust baseline of socio-economic data against which follow-up surveys in the future can measure the socio-economic impacts of REDD+. The baseline results also provide an interesting insight into the shape that REDD+ activities may take going forward.
Results from the surveys clearly illustrate the low income status of village groups in the four surveyed communes. A high dependence on low yield agriculture, combined with low levels of education and limited access to capital, is constraining the income earning potential of villagers. This poor socio-economic status is linked to important drivers of deforestation, especially the encroachment of agricultural land into neighbouring forests.
The surveys also produced other key insights for REDD+ development in Lam Dong Province, and more generally in Viet Nam. In particular, the high dependence of households on fuelwood as a primary cooking source suggest opportunities exist to introduce reduced biomass energy solutions such as biogas and improved cook stoves in project areas. Such systems could provide a complementary mechanism to REDD+ and also yield health benefits for local households, particularly women.
It was also found that more than 30 per cent of people believed that changes to the rules of governance and management systems in state forests (CBFM) had improved their livelihood to some extent. This result, combined with the high rate of compliance with management rules, could also be linked to the very positive relationship found between households and forest management committees. These results suggest REDD+ will have a positive platform to build on in terms of future governance arrangements and their cooperation with REDD+ actors.
Other results from the surveys provide useful insights into the future structure of local benefit sharing mechanisms. In particular, the risk aversion of most households to loans for capital investments could provide insights into people’s preferences regarding different kinds of payment disbursement. Risks associated with corruption were also reported and will need to be considered in future benefits sharing systems for REDD+.
Executive summary1

2
REDD+ Country Reports
Although people’s understanding of the link between climate change and forestry was somewhat mixed, there was considerable support for the idea of compensation for forest protection efforts. Benefits in the form of cash payments were found to be preferred, and some support was also given to improved job opportunities. Such results have important applications for REDD+ activities going forward.
Finally, amongst the discussions around REDD+, a principal concern raised by many respondents was its impact on existing land use rights. In particular, REDD+ was seen as a potential threat. This will need to be considered in the future design of REDD+ activities. Finding a balance between ensuring emissions reductions are achieved, while not depriving people’s access to important forest resources, will be vital to the future participation of stakeholders in REDD+ in Lam Dong, and Viet Nam more broadly.

3
The Lam Dong REDD+ pilot area, Viet Nam: a socioeconomic baseline survey
IntentionThe intention of this report is to provide a synthesis of results collected on the socio-economic conditions within villages involved in the Cattien Pro-poor REDD+ pilot study in Lam Dong Province, in the central highlands of Viet Nam. Results from this research will be used to understand the existing socio-economic conditions of households. The results will also be used to help determine the poverty and sustainable development impacts of REDD+ through follow-up comparative surveys.
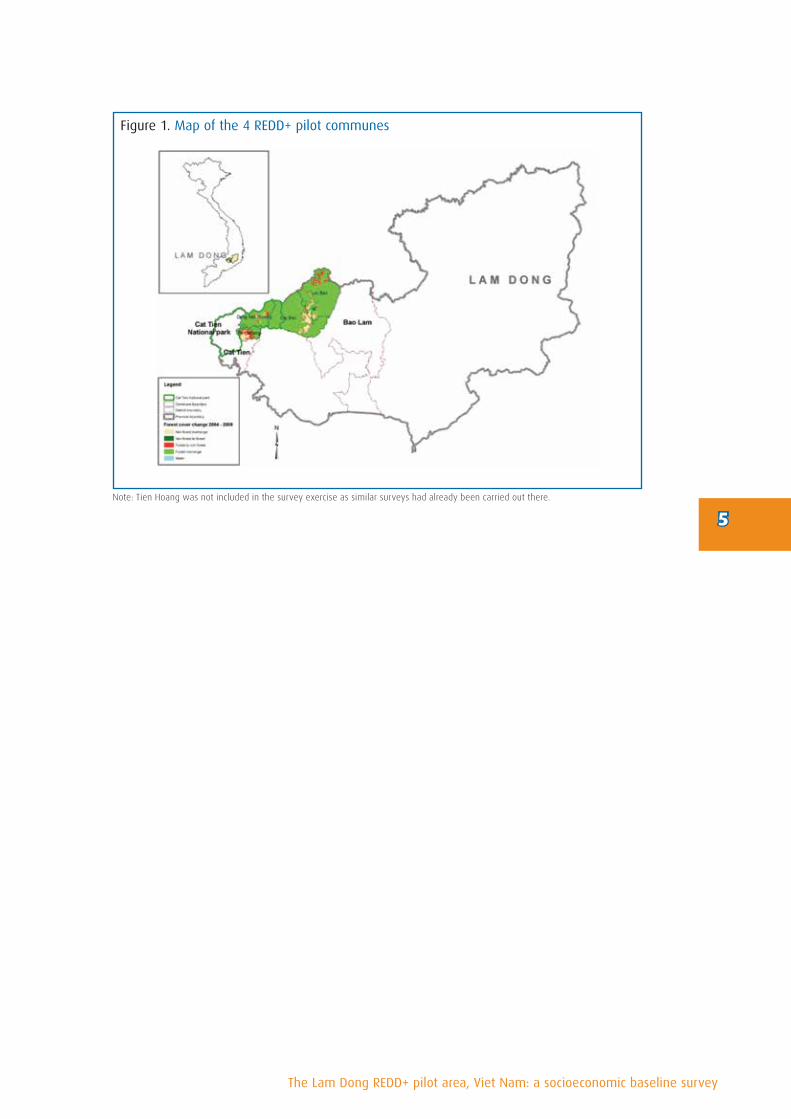
REDD+ in Lam DongSNV’s efforts in REDD+ in Lam Dong were in four communes, three of which were the focus of the socio-economic surveying conducted through this assignment: LocBac, LocBao, and Dong NaiThuong (see Figure 1). Another commune, Loc Lam, was added as a control commune for the purpose of the socio-economic surveying activities.
The four communes support primarily land-dependent incomes with coffee, tea, rubber and cashews being some of the key agricultural products produced. Poor productivity on existing land is a major factor influencing the very poor livelihoods of most in the communes. Government support and subsidies are provided as a means of households on low incomes, with some programmes specifically targeted at ethnic minority groups in the Central Highlands – such as Program 132, which provides land for agricultural production; and Program 304/2005/QD-TTg, which allocate forests for protection to local ethnic groups. Government policies have also been introduced that restrict the clearing of forest bordering on agricultural land. National pilot trials for Payments for Forest Ecosystem Services (PFES) were also established in Lam Dong Province and have now matured into ongoing payments to local actors for the provision of services, specifically watershed benefits.
Lam Dong can also be characterised by the threat its forest biodiversity has faced. Until recently, the forests of the neighbouring Cattien National Park were the last remaining habitat for the Javan Rhinoceros population in Viet Nam. Due to growing threats to habitat such as agricultural development, forest resource exploitation and infrastructure developments, biodiversity in the area has become heavily depleted and remains under constant pressure.
The combination of pressures from deforestation and especially from forest degradation, and a foundation of existing payment structures (e.g. 661 Program and PFES)1 for forest protection, have made Lam Dong an interesting target area to concentrate efforts in developing REDD+. As such, SNV and other REDD+ implementing agencies have focused their efforts on building the capacity of local stakeholders to test the viability of REDD+ in the central highlands of Viet Nam.
Introduction2
1. The 661 Program, or Five Million Hectare Reforestation Program (5MHRP), was approved by the Parliament in 1997 and by the Prime Minister with Decision No. 661/QD – TT dated 29 July 1998. The 5MHRP aimed to increase the national forest cover to 43% and was undertaken between 1998 and 2010. The programme included payments to local actors for the planting and management of forested areas. Following pilot payment for forest ecosystem services (PFES) in two provinces, Lam Dong and Son La, the Prime Minister approved PFES Decree No.99/2010 to roll-out PFES nationally. Although the architecture to operationalise PFES continues to be under construction, payments continue to be made in the pilot provinces, largely for watershed services from hydro-electric companies.

4
REDD+ Country Reports
Village selectionFor the purpose of the survey exercises, seven villages were chosen out of the 10 in the three pilot communes of LocBao (3 villages), LocBac (4 villages) and Loc Lam (3 villages). The villages were chosen, with the help of each commune’s People’s Committee, to ensure that some were near the centre of their commune and others far from the centre, as it was believed that remoteness may be a factor affecting the livelihood, income and access to information and market, as well as people’s attitudes about alternative sources of livelihood. The chosen villages are: a. LocBao: Village 1, Village 3 b. Loc Bac: Village 1, Village 2, Village 4 c. Loc Lam: Village 1, Village 2 (control villages)d. Dong NaiThuong: Bi Nao, Da Co, Bu Sa
In each selected village, interviewed households were chosen on the basis of simple random sampling (see Table 1), the method excluding the probabilities that respondents were selected on subjective criteria such as their language competencies or the distance of their houses from where the interviewer was. Focus Group Discussion and Resource Person interviews were also carried out.2
2. For further details, see the Participatory Rural Appraisal findings included in Socio-economic Baseline and Analysis of Drivers of Deforestation in Cat Tien Landscape, Lam Dong Province, Viet Nam available at: http://www.snvworld.org/en/sectors/redd/publications
Table 1. Sample sizes of each of village
Village Population a Sample size b
LocBac
Village 1 160 34
Village 2 141 32
Village 4 327 30
LocBao
Village 1 559 34
Village 3 200 30
Loc Lam (Control villages)
Village 1 138 30
Village 2 138 30
Dong NaiThuong
Bi Nao 68 20
Bu Sa 63 20
Da Co 39 20
a Provided by the Commune’s People Committee of LocBac, LocBao and Loc Lamb In some villages the sample size was larger than 30 households. As the survey took place in the coffee harvest season, the local team had to make appointments in advance with the households in the sampling list. However, if the household stayed at home, the team still interviewed them even 30 households had already been interviewed.
5
The Lam Dong REDD+ pilot area, Viet Nam: a socioeconomic baseline survey
Figure 1. Map of the 4 REDD+ pilot communes
Note: Tien Hoang was not included in the survey exercise as similar surveys had already been carried out there.

6
REDD+ Country Reports
A. Household structure and livelihoods
Household structure and educationHouseholds in the four communes are relatively small, mostly with two children and one in every two households having one person of either sex over the age of 60. The ethnic composition (Figure 2) clearly shows a dominance of the Ma ethnic group. Only three households across the sample of 280 were H’Mong, Muong or Co Ho. Almost 65 per cent of households were of Christian belief and one was Buddhist, but almost all others had no religion.
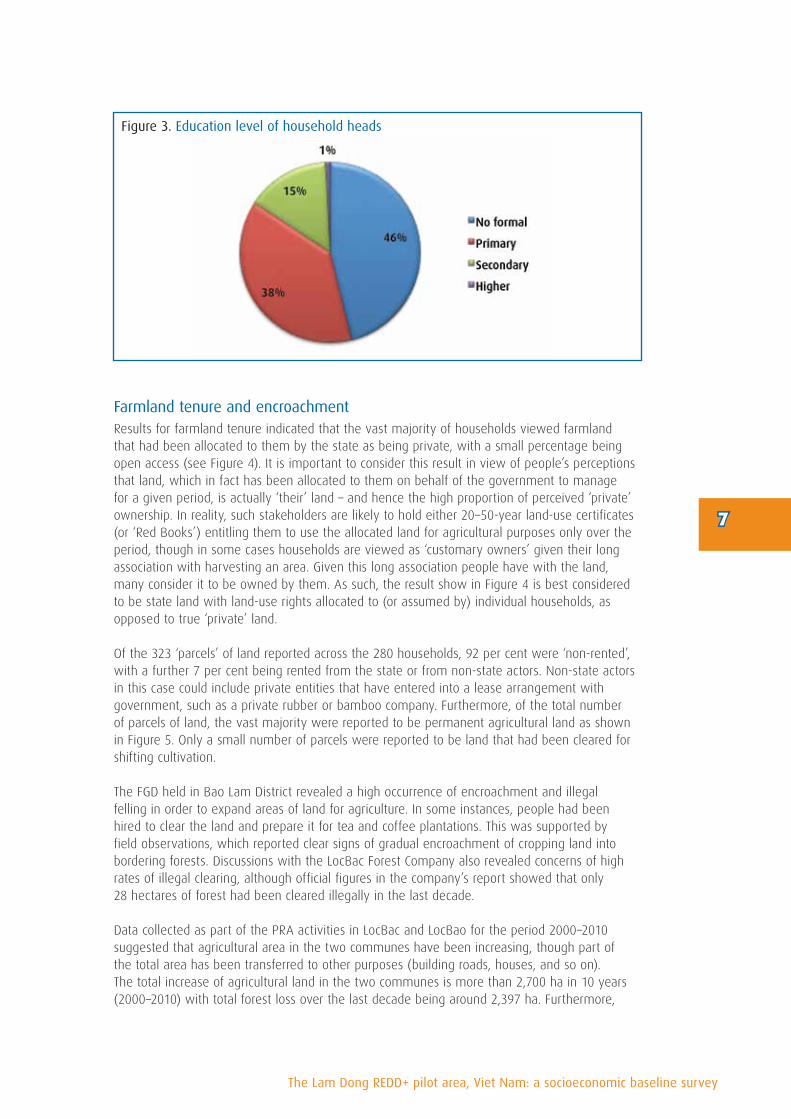
Education levels (Figure 3) suggest very low standards across the four communes. In particular, almost half the heads of the households surveyed had no formal education, with a further 38 per cent having only primary level education. Only two people surveyed had reached an education level higher than high school.
Observations from the Participatory Rural Appraisal (PRA) exercises and focus group discussions indicated that this low level of education was often preventing local farmers from being able to obtain new knowledge about alternative production methods, and thus was a significant contributor to low productivity.This will also have implications on people’s ability to understand their rights and responsibilities under REDD+. As such, significant effort is already, and will need to continue to be, invested in consultation exercises with local stakeholders, including Free and Prior Informed Consent (FPIC) activities. Such exercises need to continue to use simple yet effective communication mechanisms that are appropriately adapted to the local context.
Figure 2. Composition of ethnicity
7
The Lam Dong REDD+ pilot area, Viet Nam: a socioeconomic baseline survey
Figure 3. Education level of household heads
Farmland tenure and encroachmentResults for farmland tenure indicated that the vast majority of households viewed farmland that had been allocated to them by the state as being private, with a small percentage being open access (see Figure 4). It is important to consider this result in view of people’s perceptions that land, which in fact has been allocated to them on behalf of the government to manage for a given period, is actually ‘their’ land – and hence the high proportion of perceived ‘private’ ownership. In reality, such stakeholders are likely to hold either 20–50-year land-use certificates (or ‘Red Books’) entitling them to use the allocated land for agricultural purposes only over the period, though in some cases households are viewed as ‘customary owners’ given their long association with harvesting an area. Given this long association people have with the land, many consider it to be owned by them. As such, the result show in Figure 4 is best considered to be state land with land-use rights allocated to (or assumed by) individual households, as opposed to true ‘private’ land.
Of the 323 ‘parcels’ of land reported across the 280 households, 92 per cent were ‘non-rented’, with a further 7 per cent being rented from the state or from non-state actors. Non-state actors in this case could include private entities that have entered into a lease arrangement with government, such as a private rubber or bamboo company. Furthermore, of the total number of parcels of land, the vast majority were reported to be permanent agricultural land as shown in Figure 5. Only a small number of parcels were reported to be land that had been cleared for shifting cultivation.
The FGD held in Bao Lam District revealed a high occurrence of encroachment and illegal felling in order to expand areas of land for agriculture. In some instances, people had been hired to clear the land and prepare it for tea and coffee plantations. This was supported by field observations, which reported clear signs of gradual encroachment of cropping land into bordering forests. Discussions with the LocBac Forest Company also revealed concerns of high rates of illegal clearing, although official figures in the company’s report showed that only 28 hectares of forest had been cleared illegally in the last decade.
Data collected as part of the PRA activities in LocBac and LocBao for the period 2000–2010 suggested that agricultural area in the two communes have been increasing, though part of the total area has been transferred to other purposes (building roads, houses, and so on). The total increase of agricultural land in the two communes is more than 2,700 ha in 10 years (2000–2010) with total forest loss over the last decade being around 2,397 ha. Furthermore,

8
REDD+ Country Reports
PRA activities conducted in LocBao and LocBac revealed that land-use planning decisions at provincial level in 2008 resulted in a large area of degraded forests being converted to non-forestry: 1,035 ha (in LocBao commune), 446 ha (in LocBac commune), and 260 ha (in LocBac Forestry Company). Table 2 provides a summary of the planned uses of forest under the province’s Decision 450/QD-UBND issued on 19 February 2008.
This finding highlights the necessity to integrate REDD+ into broader land-use planning exercises at the sub-national level. Properly embedding REDD+ into broader land-use planning considerations will help to highlight the different trade-offs between alternative land uses and allow for more informed decision making around the future viability of these options. Without properly integrating REDD+ into planning decisions, deforestation may continue to be planned for without the consideration of alternative, and potentially more lucrative, opportunities such as REDD+.
Figure 4. Farm land ownership (tenure)
Figure 5. Land conversion type
9
The Lam Dong REDD+ pilot area, Viet Nam: a socioeconomic baseline survey
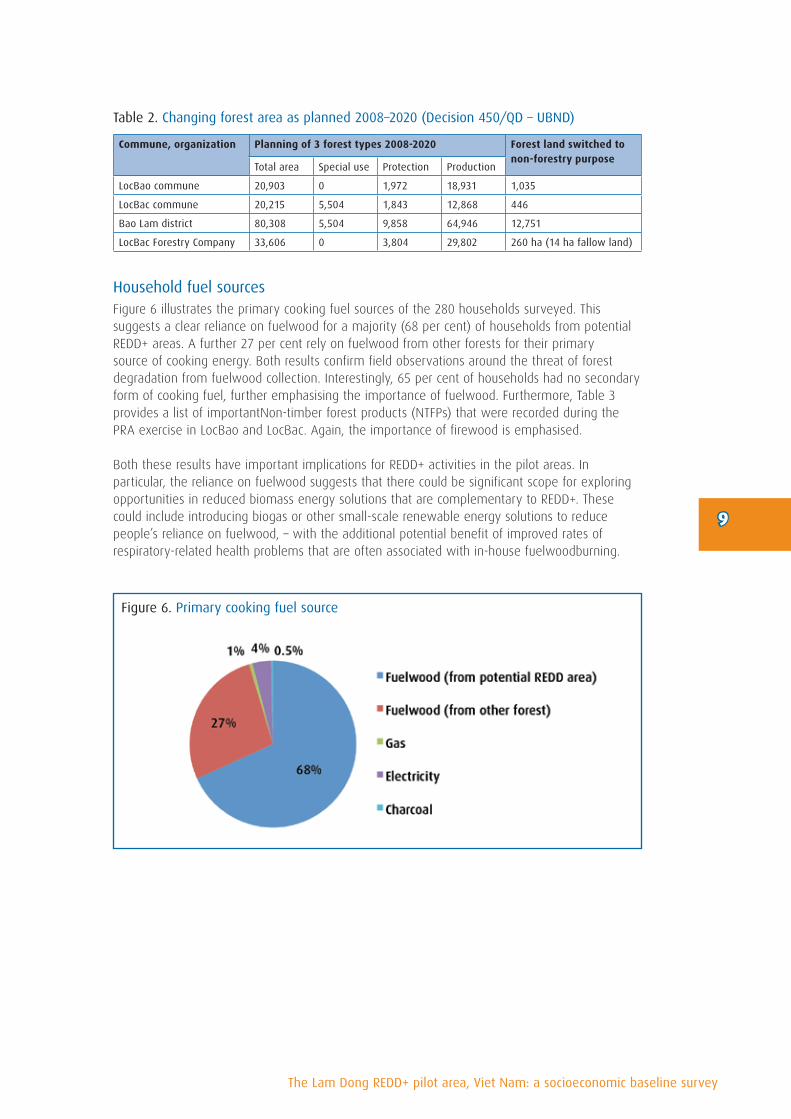
Table 2. Changing forest area as planned 2008–2020 (Decision 450/QD – UBND)
Commune, organization Planning of 3 forest types 2008-2020 Forest land switched to non-forestry purpose
Total area Special use Protection Production
LocBao commune 20,903 0 1,972 18,931 1,035
LocBac commune 20,215 5,504 1,843 12,868 446
Bao Lam district 80,308 5,504 9,858 64,946 12,751
LocBac Forestry Company 33,606 0 3,804 29,802 260 ha (14 ha fallow land)
Household fuel sourcesFigure 6 illustrates the primary cooking fuel sources of the 280 households surveyed. This suggests a clear reliance on fuelwood for a majority (68 per cent) of households from potential REDD+ areas. A further 27 per cent rely on fuelwood from other forests for their primary source of cooking energy. Both results confirm field observations around the threat of forest degradation from fuelwood collection. Interestingly, 65 per cent of households had no secondary form of cooking fuel, further emphasising the importance of fuelwood. Furthermore, Table 3 provides a list of importantNon-timber forest products (NTFPs) that were recorded during the PRA exercise in LocBao and LocBac. Again, the importance of firewood is emphasised.
Both these results have important implications for REDD+ activities in the pilot areas. In particular, the reliance on fuelwood suggests that there could be significant scope for exploring opportunities in reduced biomass energy solutions that are complementary to REDD+. These could include introducing biogas or other small-scale renewable energy solutions to reduce people’s reliance on fuelwood, – with the additional potential benefit of improved rates of respiratory-related health problems that are often associated with in-house fuelwoodburning.
Figure 6. Primary cooking fuel source

10
REDD+ Country Reports
Table 3. Rank of important NTFPs in LocBao and LocBac
Source: FGD in LocBao and LocBac communes, 2010* More available including: wild pig, porcupine, chicken, snake, squirrel, bamboo rat.
Forest products
LocBao (Villages 1, 2 and 3) LocBac (Villages 1 and 3)
Level of importance
Where to collect Level of importance
Where to collect
Anywhere Exhausted forest
Tree-standing forest
Anywhere Exhausted forest
Tree-standing forest
Timber 2 P 2 P
Firewood 1 P 1 P
Rattan 6 P 5 P
Rattan bud (use as vegetable)
5 P 4 P
Bamboo (Lo o)
6 P –
Bamboo (nua)
7 P –
Nhip vegetable
2 P 3 P
Bamboo shoot
4 P –
Lichi (to make broom)
– 6 P
Stream fish 3 P 4 P
Water – 1
Wild animals*
4 P 7 P
Perceptions of trust within the villagesThe level of trust within the villages was also analysed across the communes and was found to be high, with over 84 per cent of households responding either ‘High’ or ‘Very High’ levels of trust within the village. There were also positive results in terms of the relationship with neighbours and others in the communities. Relationships with NGOS were found to be ‘Fair’, but also had the lowest occurrence of ‘Bad’ perceptions. Reasons for this are likely to be largely because of unfamiliarity with NGOs. SNV is one of the first NGOs to have worked in the area, with the World Bank being the only other known organisation in the area in 1997 to 2003. Results for village councils and local government officials were similar and reflected generally positive relationships. Results are shown in Table 4 below.
Table 4. Relationship of households with others involved in the village communities
1 Very bad 2 Bad 3 Fair 4 Good 5 Very good
Neighbours 0 3 30 115 132
People from other communities
0 3 116 125 36
NGO workers 0 1 209 45 23
Village council 0 3 137 111 29
Local government officials 0 4 132 111 32
11
The Lam Dong REDD+ pilot area, Viet Nam: a socioeconomic baseline survey
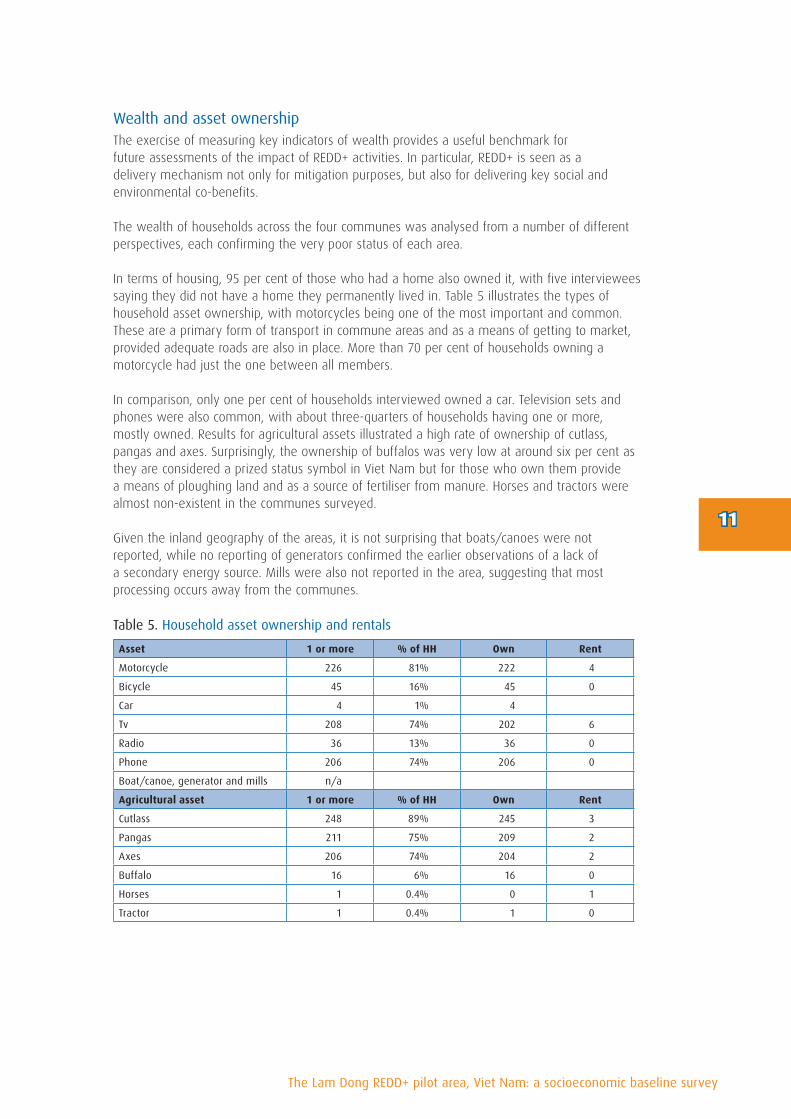
Wealth and asset ownershipThe exercise of measuring key indicators of wealth provides a useful benchmark for future assessments of the impact of REDD+ activities. In particular, REDD+ is seen as a delivery mechanism not only for mitigation purposes, but also for delivering key social and environmental co-benefits.
The wealth of households across the four communes was analysed from a number of different perspectives, each confirming the very poor status of each area.
In terms of housing, 95 per cent of those who had a home also owned it, with five interviewees saying they did not have a home they permanently lived in. Table 5 illustrates the types of household asset ownership, with motorcycles being one of the most important and common. These are a primary form of transport in commune areas and as a means of getting to market, provided adequate roads are also in place. More than 70 per cent of households owning a motorcycle had just the one between all members.
In comparison, only one per cent of households interviewed owned a car. Television sets and phones were also common, with about three-quarters of households having one or more, mostly owned. Results for agricultural assets illustrated a high rate of ownership of cutlass, pangas and axes. Surprisingly, the ownership of buffalos was very low at around six per cent as they are considered a prized status symbol in Viet Nam but for those who own them provide a means of ploughing land and as a source of fertiliser from manure. Horses and tractors were almost non-existent in the communes surveyed.
Given the inland geography of the areas, it is not surprising that boats/canoes were not reported, while no reporting of generators confirmed the earlier observations of a lack of a secondary energy source. Mills were also not reported in the area, suggesting that most processing occurs away from the communes.
Table 5. Household asset ownership and rentals
Asset 1 or more % of HH Own Rent
Motorcycle 226 81% 222 4
Bicycle 45 16% 45 0
Car 4 1% 4
Tv 208 74% 202 6
Radio 36 13% 36 0
Phone 206 74% 206 0
Boat/canoe, generator and mills n/a
Agricultural asset 1 or more % of HH Own Rent
Cutlass 248 89% 245 3
Pangas 211 75% 209 2
Axes 206 74% 204 2
Buffalo 16 6% 16 0
Horses 1 0.4% 0 1
Tractor 1 0.4% 1 0
12
REDD+ Country Reports
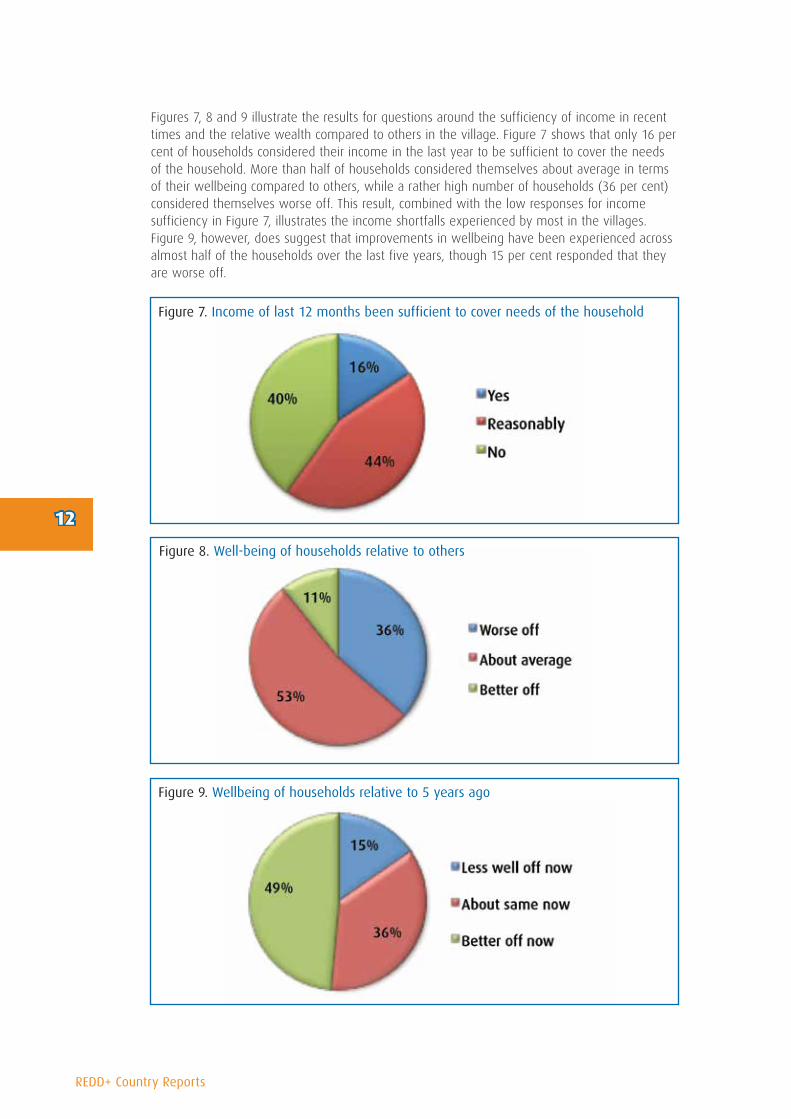
Figures 7, 8 and 9 illustrate the results for questions around the sufficiency of income in recent times and the relative wealth compared to others in the village. Figure 7 shows that only 16 per cent of households considered their income in the last year to be sufficient to cover the needs of the household. More than half of households considered themselves about average in terms of their wellbeing compared to others, while a rather high number of households (36 per cent) considered themselves worse off. This result, combined with the low responses for income sufficiency in Figure 7, illustrates the income shortfalls experienced by most in the villages. Figure 9, however, does suggest that improvements in wellbeing have been experienced across almost half of the households over the last five years, though 15 per cent responded that they are worse off.
Figure 7. Income of last 12 months been sufficient to cover needs of the household
Figure 8. Well-being of households relative to others
Figure 9. Wellbeing of households relative to 5 years ago

13
The Lam Dong REDD+ pilot area, Viet Nam: a socioeconomic baseline survey
In addition to the above results, it was also found that 215 (around 77 per cent) of households had experienced unexpected income shortfalls in the last 12 months. Of these 215, more than 50 per cent, reported that the reason was due to serious crop failure, which caused either severe or very severe impacts on income for the last year. The death or serious illness of a family member was also a major factor for severe or very severe impacts.
Table 6 illustrates other reasons for those people who said they had experienced a severe or very severe income impacts over the last 12 months. Interestingly, climate-related events were not considered to be a major factor, suggesting that the high rate of crop failure could be due to other factors, such as declining soil productivity, poor cropping techniques (linked to low education levels and access to new information) and a constrained access to capital, combined with a depletion in labour due to the serious ill-health of those of economically productive age. Price fluctuations were also not considered a major driver. However, there could be several reasons for this, including price stability over the course of the last 12 months, which is not always the case. Price changes at a higher market levels also have a delayed impact at the lowest level of the supply-chain, particularly for poor small-scale farmers. Therefore, the 12-month timeframe for this price analysis is likely to be inadequate got any definitive conclusions to be drawn.
Table 6. Reasons for severe or very severe shortfalls in income in the last 12 months
Reason Households
Serious crop failure 117
Death/serious illness in family (productive age group/adult) 125
Loss of land 0
Major livestock loss (drought, disease, etc.) 5
Loss of waged employment 1
Climate/drought/floods 10
Price changes on products and consumer goods 8
Protected area establishment 1
Table 7. Indicative wealth ranking
Representative household across the four communesAlthough it is difficult to generalise from the results what a ‘typical’ household across the four communes is, a ranking index has been made in Table 7 to try to represent the general composition of households in terms of their relative wealth. It uses four key assets and the availability of a secondary fuel source as another key indicator where there were clear divides between households.
In general wealth terms, a representative households across the four communes would likely be classified as poor, owning one motorcycle, no buffalo and unlikely to have access to a secondary cooking fuel source, and thus be dependent on fuelwood from forests. Television and mobile phone ownership would be very likely.
Wealth ranking
Ownership Estimate of householdsMotorcycle TV/Phone Buffalo Car Secondary
fuel source
Poor 0–1 0–1 0 0 0 65–85%
Non-poor 0–1 1 0–1 0 1 15–35%
Wealthy 1+ 1+ 1+ 1+ 1+ Up to 1%

14
REDD+ Country Reports
B. Resource use, income and constraintsAgricultural outputThe most important agricultural crops across the four communes are listed in Table 8, with tea and coffee being the first and second cost common crops respectively. In terms of area, the average number of hectares of cashew was clearly the highest, reflecting a recent surge in production in the area following market price increases. Similarly, acacia plantations have increased significantly in many areas across Viet Nam.
Of the 280 households surveyed, 478 different observations were made on crop types across the 323 ‘parcels’ of land reported earlier. This suggests that many households have a mix of crops on their land.
Although reporting only a relatively small average hectare size and number of households, cassava/maize production had the highest average value and average quantity sold. This is consistent with market trends, which have seen the price for cassava increase markedly over the last decade.
In analysing these results, it is important to note the large degree of variation between households in the size of their land and the amount of their output. For example, the average area of cassava plantations ranged from 0.1 ha to 2.0 ha, suggesting that some households had much larger land allocations, or land dedicated to cassava. Similarly, outputs ranged from as low as 300 kg per year to 8,000 kg per year, also clearly indicating differences.
Table 8. Most important agricultural crops across the four communes
No. households
Avg area (ha)
SD (ha) Labour type
Avg output (kg)
SD (kg) Avg sold (kg)
Acacia 12 1.13 HH * * *
Cassava/maize
41 0.4 0.4 HH 2490 1791 2411
Cashew 83 1.7 1.8 HH 753 1127 749
Cocoa 38 0.3 0.3 HH ** ** **
Coffee 121 0.6 0.9 HH 343 804 333
Tea 183 1 1 HH 1231 1550 1226
* – no Acacia was traded in the last 12 months. This is likely due to the fact that the trees were not yet mature enough for harvesting. Acacia rotations are usually every seven years.** – No cocoa was reported as having been traded in the last 12 months.
Constraints to productionHouseholds reported a very high rate of difficulties associated with agricultural production, with almost 95 per cent saying such difficulties were common from year to year. The types of hardship faced are shown in Figure 10 and clearly illustrate a perceived difficulty in accessing or being able to afford sufficient fertiliser.
A lack of capital was also seen as a key constraint. During the PRA and focus group exercises, it was learnt that there have been many preferential credit programmes implemented across the communes that assist with capital purchases. These programmes give priority to poor households (20–30 per cent of all households), while better-off households are restricted in taking preferential loans. Beyond these programmes, there are banks that are willing to provide

15
The Lam Dong REDD+ pilot area, Viet Nam: a socioeconomic baseline survey
credit, such as the Bank for Agriculture and Rural Development, the Social Policy Bank, and some commercial banks. However, people are not accustomed to taking loans from these banks and thus their success in promoting capital ownership can be often limited.
This result provides a useful insight into how future benefit sharing mechanisms may operate under REDD+. The general risk aversion to borrowing money for capital investments suggests that benefit distribution in REDD+ could be best targeted such that slow dispersions of payments are made over time, rather than one upfront payment for future carbon gains – which could be required to be paid back later if the carbon sequestration potential is not realised. Similarly, the preference for fertilisers to apply to existing agricultural land implies there could be a general preference for in-kind, rather than cash support, through REDD+. Although providing in-kind benefits in the form of fertilisers may be counterproductive to general sustainable land-use management, other forms of in-kind support may be appropriate that also deliver improvements for crop productivity, such as the provision of improved extension services to villages.
Figure 10. Causes of difficulties in agricultural production
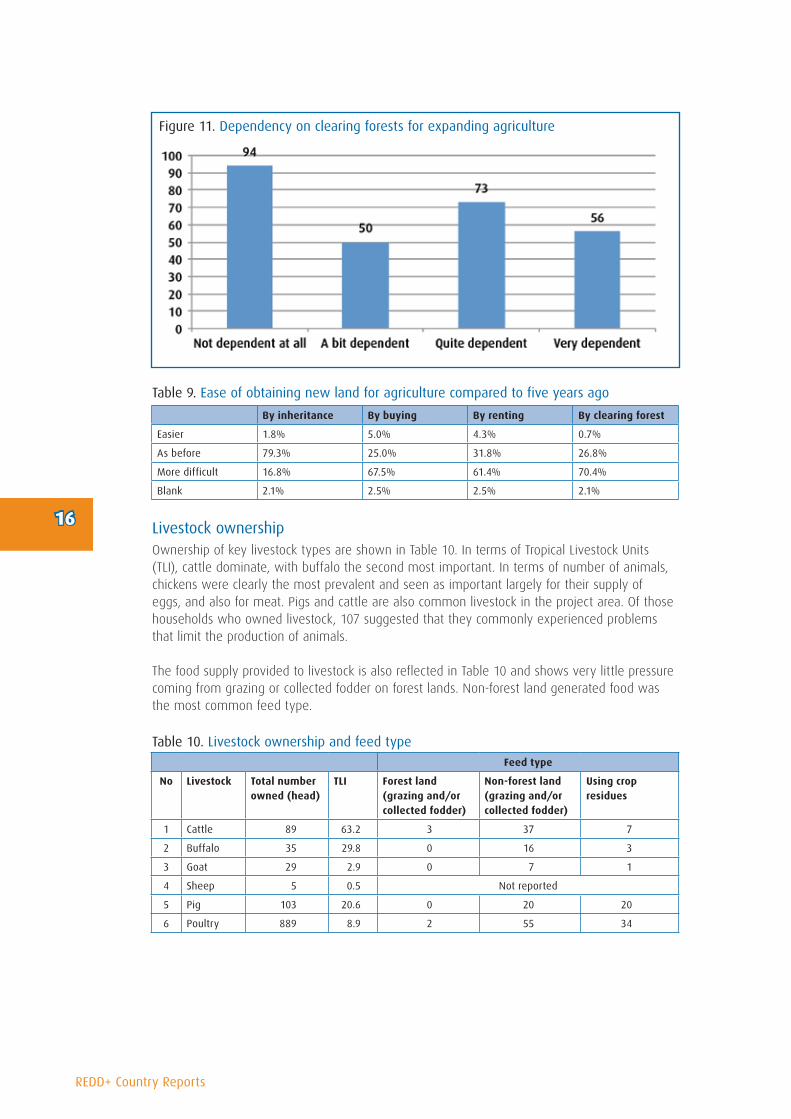
Interesting findings were reported in response to questions about future expansions of agriculture and the need to clear land. Figure 11 shows that 129 households (over 45 per cent) were either quite dependent or very dependent on clearing forests for agricultural expansion. A further 50 households were somewhat dependent. This result strengthens ground observations around encroaching agriculture being a driver of deforestation and highlights the potential ongoing threat to forests bordering agricultural plots in the REDD+ pilot areas. It should also be noted, however, that 94 households did not consider clearing forests to be at all necessary for expanding agriculture. Several reasons could be given for this, including that such people’s farms may not border forested lands, or that other reasons were seen to be relatively more important to crop expansion, particularly fertiliser availability.
Questions around the ease of obtaining access to land illustrated a general perception that it was more difficult to buy and rent land today than it was five years ago. It was also observed that access to land through clearing forests was also more difficult, as show in Table 9.
In response to questions around land conflict for agriculture over the last five years, only 10 people responded yes to this question, with seven people saying these conflicts were either of high or very high significance.
16
REDD+ Country Reports
Figure 11. Dependency on clearing forests for expanding agriculture
Table 9. Ease of obtaining new land for agriculture compared to five years ago
By inheritance By buying By renting By clearing forest
Easier 1.8% 5.0% 4.3% 0.7%
As before 79.3% 25.0% 31.8% 26.8%
More difficult 16.8% 67.5% 61.4% 70.4%
Blank 2.1% 2.5% 2.5% 2.1%
Table 10. Livestock ownership and feed type
Livestock ownershipOwnership of key livestock types are shown in Table 10. In terms of Tropical Livestock Units (TLI), cattle dominate, with buffalo the second most important. In terms of number of animals, chickens were clearly the most prevalent and seen as important largely for their supply of eggs, and also for meat. Pigs and cattle are also common livestock in the project area. Of those households who owned livestock, 107 suggested that they commonly experienced problems that limit the production of animals.
The food supply provided to livestock is also reflected in Table 10 and shows very little pressure coming from grazing or collected fodder on forest lands. Non-forest land generated food was the most common feed type.
Feed type
No Livestock Total number owned (head)
TLI Forest land (grazing and/or collected fodder)
Non-forest land (grazing and/or collected fodder)
Using crop residues
1 Cattle 89 63.2 3 37 7
2 Buffalo 35 29.8 0 16 3
3 Goat 29 2.9 0 7 1
4 Sheep 5 0.5 Not reported
5 Pig 103 20.6 0 20 20
6 Poultry 889 8.9 2 55 34

17
The Lam Dong REDD+ pilot area, Viet Nam: a socioeconomic baseline survey
Forest resourcesIn analysing the importance of forest resource use, it was found that timber/poles and charcoal recorded very low response rates. In particular, only one household responded positively to collecting poles/timber from forests while there were no responses for the collection of charcoal from forests. This suggests that the small amount of the charcoal reported in the cooking fuel source in Figure 6 is purchased rather than collected.
Alternatively, fuelwood, as a primary source of cooking fuel, was shown to be supported by an almost equal split between primary and secondary forest. Collections were mostly carried out by a mix of household members (as reflected in Table 11). Furthermore, Figure 12 illustrates that state (CBFM) is the most commonly relied on source of fuelwood. In response to questions about access to forest resources compared to five years ago, almost 67 per cent of households believed it had not changed considerably.
Figure 12. Distribution of areas where fuelwood is collected
Table 11. Degree of dependence on fuelwood overall
Fuelwood
Primary Secondary Mix N/A
Forest type 42% 50% 3% 4%
Household Hired Both N/A
Collected by whom (labour)
93% 1% 2% 4%
Men Women Children Mix N/A
Sex/age group 14% 24% 2% 56% 4%
Forest management and clearing activitiesIn response to questions around the individual household’s satisfaction with forest management in their community, more than 50 per cent were very satisfied and most others somewhat satisfied (Figure 13). People’s relationship with other forest users in relation to access to forest resources was also relatively positive, as shown in Figure 14.

18
REDD+ Country Reports
Figure 14. Relationship with other forest users in terms of access to and use of forest resources
The extent of forest clearing by households over the last five years is shown in Figure 15, illustrating that almost 20 per cent of households interviewed had cleared some forest. Of the percentage that had cleared forest, a total of 13.41 ha/yr was cleared over the last five years. Most households had done so to establish tree plantations on secondary forest that is likely to consist of poor quality forest bordering on agricultural land. Field observations observed that a lot of this activity would have occurred illegally in all communes except Tien Hoang, where land-use allocations permitted such clearances. Almost half of this activity was conducted on state (CBFM) forest, with 10 households also clearing on state (ordinary) and common property forest, as illustrated in Table 12. Only one respondent had more than one reason for clearing land, so figures are shown for ‘Rank 1’ uses only.
Figure 13. Satisfaction with forest management

19
The Lam Dong REDD+ pilot area, Viet Nam: a socioeconomic baseline survey
Figure 15. Percentage of households who had cleared forest in the last five years
Table 12. Reasons for clearing, type of forest cleared and ownership status
Rank 1 (number of household)
1. What was the cleared forest (land) used for?
• Cropping 1
• Tree plantations 47
• Pasture 1
• Other 3
2. What type of forest did you clear?
• Primary 6
• Secondary 42
• Mix 0
• No response 4
3. What was the ownership status of the forest cleared
• Private 1
• State (Ordinary) 10
• State (JFM) 1
• State (CBFM) 24
• State (Individual) 1
• Common property 1
• Open access 10
• No response 4

20
REDD+ Country Reports
C. Property rights, use rights and managementAll land in Viet Nam is owned by the people, with the state as their representative (Law of Land, 2003 [Clause 5]). Therefore, questions related to the private ownership of forest lands were not applicable in the Viet Namese context. Although people are granted various types of user rights on forest lands, private ownership does not apply.
When questioned about the user rights to access forest resources in state (CBFM) forests, only one household responded positively, with 252 saying they did not have use rights and 27 providing no response. This is an interesting result, and one that needs to be clarified in this context.
In particular, the survey defined CBFM as ‘the land is owned by the state, but the management is the responsibility of the local communities’. In the case of the study sites, it is likely that village communities have signed forest protection contracts either with the Cat Tien National Park Authority or state operated companies (both of which are under the management of the state) and act in groups to conduct forest patrols. In this sense, local people involved in these activities may not perceive themselves to have ‘individual’ land-use rights. But in practice it is observed that the community groups patrolling the forest are indeed accessing forest resources, such as the collection of NTFPs, and therefore could be thought of as having access rights to the forest resources. Because these rights are seen to be community-based rights, it has likely led to the very low response rate for ‘individual’ land-use rights in areas defined as CBFM.
An interesting comparison can then be made between this result and those shown in Figure 15. This shows that although user rights to state (CBFM) forests might be low, there are still a number of people who are clearing forests that seem largely for plantation establishment.
Household perceptions around how much influence they are given on the rules that govern use and management of the CBFM forests were heavily divided (Figure 16). The largest number of households (128) reported that they had a strong influence through village assembly meetings, whereas 86 households suggested they had not taken part at all. This result is likely to be village specific and closer analysis revealed that LocBac and Loc Lam had the highest number of respondents who had no influence on the governance and management of state forests (see Figure 17).
This finding has implications for REDD+ with respect to the future success of management boards and other local governance frameworks that it might be necessary to establish for carrying out and monitoring REDD+ activities. In particular, the results above suggest that establishing such frameworks in LocBac may be made more challenging given the existing limited interaction between villagers and local governing bodies. Alternatively, it may be much easier to construct these systems in LocBao, and particularly Dong NaiThuong where there is greater existing collaboration.
Satisfaction over forest regulationsIn terms of households’ satisfaction with the rules that govern and manage state forests, around 72 per cent were either satisfied or very satisfied. The reasons for the remaining percentage that were either very dissatisfied or somewhat dissatisfied are illustrated in Figure 18. The most commonly agreed reasons included an unequal distribution of use and benefits and too strong a limitation on access to resources. A relatively large number also mentioned their interests were not taken into account, reflecting the results shown in Figure 17.

21
The Lam Dong REDD+ pilot area, Viet Nam: a socioeconomic baseline survey
Figure 16. Household responses to their influence on the rules that govern and manage state forests (CBFM)
Figure 17. Number of households by commune who responded that they had not taken no part in meetings that influenced state forest (CBFM) management and governance
Again, this has important implications for the design of benefit sharing mechanisms in REDD+. In particular, the feeling amongst some members of the villages that benefit distribution is currently unequal and that people’s interests are not taken into account suggests close community consultation will need to take place to illicit the most suitable benefit distribution choices offered through REDD+.
Figure 19 represents the reasons for the majority of people who were either strongly satisfied or somewhat satisfied. These responses suggest that there is confidence amongst the communes that rules are being followed, and also the perception that clear boundaries are set. Correct enforcement was also seen as a strong point of agreement and reason for satisfaction around governance and forest management.

22
REDD+ Country Reports
Figure 18. Reasons for dissatisfaction (28 per cent of respondents) with the rules governing and managing state forests (CBFM)
Figure 19. Reasons for satisfaction (72 per cent of respondents) with the rules governing and managing state forests (CBFM)
The responses of households to how bound they feel by the rules governing these forests also revealed a high degree of effectiveness in the way households feel bound to comply (Figure 20). In particular, 67 per cent felt bound by the rules and implied that they followed them always, with a further 29 per cent following them mostly. Only a small percentage of answers suggested non-compliance. However, these results are somewhat clouded by the fact that 21 per cent of households were not aware whether there had been any changes to the rules that govern and manage state forests, suggesting there is still a degree of uncertainty around what rules exist and how they are complied with.
Around 37 per cent of households mentioned that there had been changes to the rules of governance and management, of which 63 per cent did not consider that these changes had had any effect on their livelihood (see Figure 21). But more than 30 per cent of people believed that the changes had improved their livelihood to some extent. This result, combined with the high rate of compliance with management rules, could also be linked to the generally very positive relationship between households and forest management committees, as illustrated in Figure 22.

23
The Lam Dong REDD+ pilot area, Viet Nam: a socioeconomic baseline survey
Figure 20. Binding power of rules governing and managing state forests (CBFM)
Figure 21. Responses to those who were aware of changes to governance and management rules as to whether the changes influenced the use of state forests (CBFM)
Figure 22. Household relationship with the forest management committee under state forest (CBFM)

24
REDD+ Country Reports
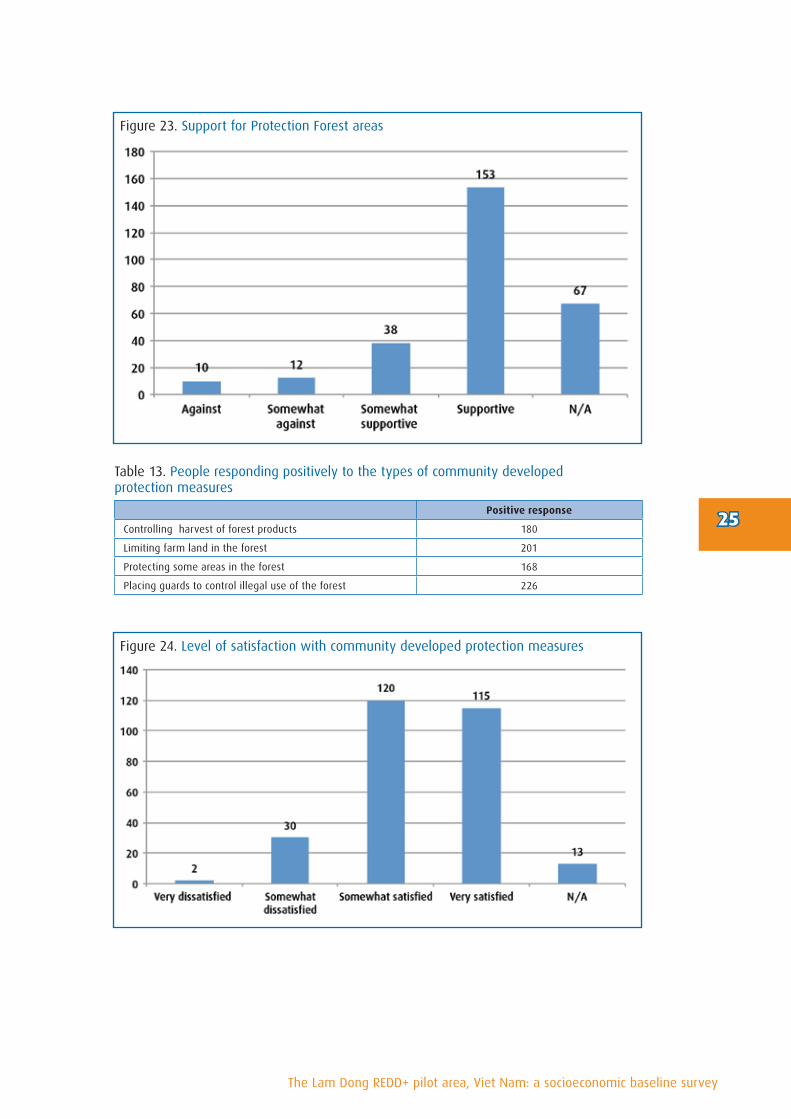
D. Perceptions, attitudes and norms concerning resource conservationVast areas of forest in the four communes have been subject to considerable exploitation. Government policies to increase the area of crop lands or plantations have come at the expense of large tracts of natural forest. Precious wood trees like Micheliamediocris Dandy (gioi) and HopeaadorataRoxb (sao) are becoming scarce and remaining forest is being continuously degraded through the pressures of fuelwood collection, NTFP exploitation and agricultural encroachment. However, there are still areas classified as ‘Protection Forest’ and various government policies have been established to provide incentives for reforestation and forest protection, namely Decisions 661, 304 and 30a.
A basic question around household’s awareness of these protection forests in their communities revealed that 76 per cent of households knew of such protected areas. Among these households there was generally a very high level of support for forest protection with well over half in agreement with the protective measures, as shown in Figure 23. Additional discussions with household groups suggested that one of the main reasons for some households’ lack of support was their desire to obtain more land for agricultural conversion to meet production needs.
Of the 86 per cent of households who positively responded to the question of whether the community had any locally developed conservation measures for the forest, the most common response related to the establishment of safeguards to protect against illegal logging (Table 13). Yet the success of these measures is questionable, with focus group discussions and field observations in LocBac and LocBaoin in particular revealing that illegal forest encroachment and loggings very often occur in villages of both communes. Statistical data from Bao Lam district Forest Protection Unit also confirmed these observations and illustrate that forests have been decreasing in area and quality, mostly because of cases of illegal logging.
For example, over the three-month period July to September 2010, LocBao Forestry Board carried out arrests and confiscated more than 10 m3 of timber being transported. However, the actual extent of illegal activity is far more serious than is reflected through actual arrests. The FGDs and ground observations suggested that a lot of illegal deforestation through gradual encroachment was occurring year by year as a direct result of coffee and tea plantation expansion by local ethnic groups. The gradual nature of this encroachment often made it difficult to monitor and enforce penalties.
In Cattien District, illegal logging is also considered a major threat and driver of deforestation and degradation. However, again, there are large discrepancies between the amount of reported illegal activity and actual activity. For example, Table 14 illustrates the Cattien Forest Protection Department’s record of law violations in three communes. But ground observations and FGDs revealed a much larger problem associated with illegal activity including cases where cashew transportation trucks were being used to transport illegal logs, villagers being paid to undertake illegal felling, and instances of violence against forest protection guards by local villagers exploiting protected forest areas.
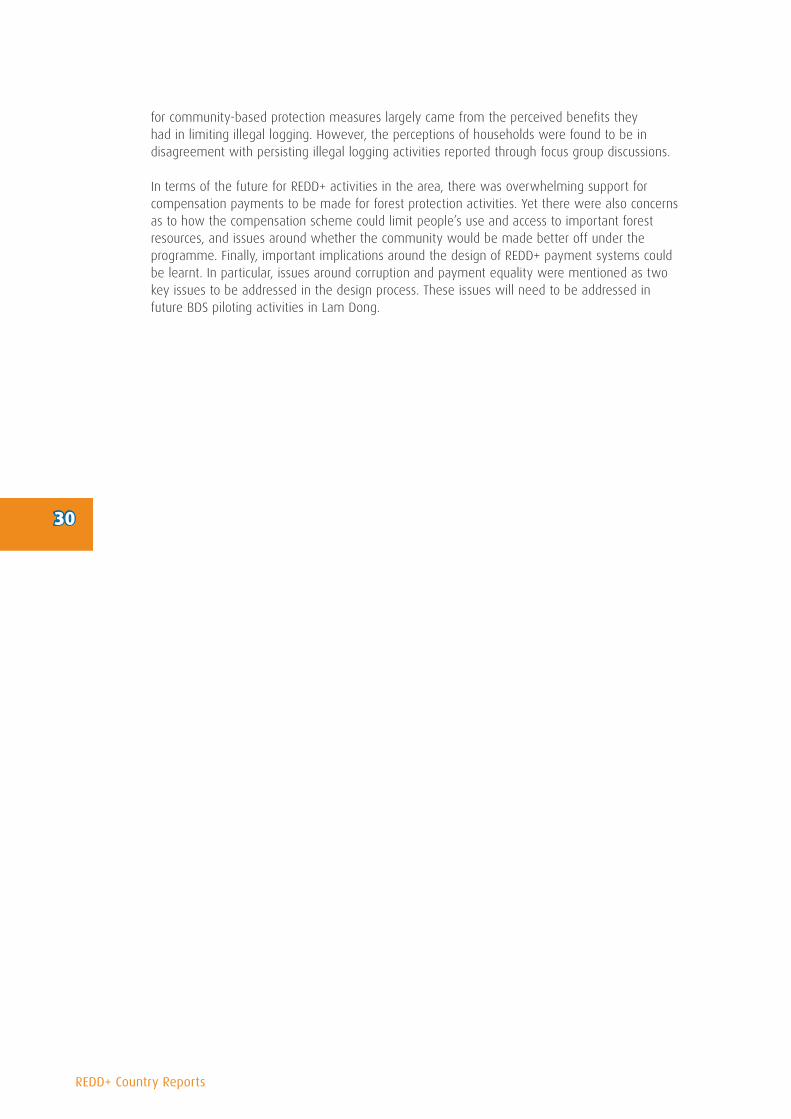
Nevertheless, Figure 24 shows that the level of satisfaction amongst households of these community-based protection measures was relatively high. A somewhat minimal effect of these measures on households’ use of forest resources was also reported, as shown in Figure 25.
25
The Lam Dong REDD+ pilot area, Viet Nam: a socioeconomic baseline survey
Figure 23. Support for Protection Forest areas
Table 13. People responding positively to the types of community developed protection measures
Positive response
Controlling harvest of forest products 180
Limiting farm land in the forest 201
Protecting some areas in the forest 168
Placing guards to control illegal use of the forest 226
Figure 24. Level of satisfaction with community developed protection measures

26
REDD+ Country Reports
Figure 25. Extent to which community protection measures affected households’ use of forest resources
Table 14. Cattien FPD’s 2009 record of forest protection law violation cases in three communes
Total cases Reduction compared to 2008
Transportation of illegal timber
Illegal timber logging
Forest encroachment
Illegal forest resource exploitation
DNT 583 N/A 5 5 14 34
TH 10 6 4 3 3 (18 m3 of timber)
NN 4 N/A 2 2
District 75 30
3. There is a discrepancy of 11 cases in the records of Bu Sa Forest Guard Station and the DNT PPC. The figure of 58 cases is recorded by the Bu Sa Forest Guard Station of CTNP.

27
The Lam Dong REDD+ pilot area, Viet Nam: a socioeconomic baseline survey
E. Pre-REDD+ analysisThe awareness of the role of forests in climate change amongst the 280 households surveyed across the four communes was almost perfectly even split, with 51 per cent saying they were not aware of the role forests play in climate change.
Interesting results can be observed in Table 15, which shows the responses of households to the question of whether people would stop clearing forests if they were compensated for their losses. There was very strong agreement, suggesting that the overwhelming majority of people would be willing to receive some sort of compensation for giving up clearing practices. Payment compensation was the clear favourite of all types of compensation, which had almost 90 per cent of people either agreeing or somewhat agreeing that it would provide them with an incentive to stop forest clearances. But increasingly, job opportunities also generated a high agreement response. This result could help to inform the type of benefit distribution system that would be most suitable for REDD+ activities in these communes.
Of those who disagreed or somewhat disagreed to the compensation types, reasons were provided and are summarised in Table 16. Many were concerned that by protecting the forest, their forest dependent livelihood would be inhibited too much. Other strong responses came from concern that the compensation amount would not be enough. Interestingly, the weakest response came from concerns involving people’s cultural beliefs around the forest.
In comparison, Table 17 indicates the responses of households who agreed or somewhat agreed with compensation for forest protection. There was very strong agreement that forest protection is important and that compensation was seen as a way of gaining more income. There was also a strong understanding that environmental conditions would be improved through reducing clearing, while more than 85 per cent of households either agreed or somewhat agreed the compensation would improve conditions in the village.
Lastly, over 75 per cent of households believed that a key issue as part of a compensation scheme would be whether the overall income of the village would be better, as shown in Table 18. Around a third of respondents agreed that corruption would be an important issue to consider, while there was generally a fairly even distribution between agreement and disagreement on whether payment equality would be an issue for consideration. Again, these results could be influential in the design of benefit distribution systems at the commune level.
Table 15. Types of compensation and whether they would prevent households from clearing forests
Types of compensation Disagree (%) Disagree somewhat (%)
Agree somewhat (%)
Agree (%)
By payments 7.25 3.26 7.25 82.25
By increasing job opportunities 5.07 5.07 35.87 53.99
By alternative sources of livelihoods 5.43 5.8 48.19 40.58
By better social service 10.87 5.8 49.28 34.06

28
REDD+ Country Reports
Table 16. Reasons given by those in disagreement with compensation
Disagree (%) Disagree somewhat (%)
Agree somewhat (%)
Agree (%)
My livelihood depends too much on the forest
22 0 17 61
The forest has a strong cultural value to me and it is wrong to accept compensation to stop present use
28 28 28 17
Money cannot compensate for reduced use of the forest
11 17 39 33
I do not think I will be compensated enough
17 17 17 50
Table 17. Reasons for agreement with compensation
Disagree (%) Disagree somewhat (%)
Agree somewhat (%)
Agree (%)
The compensation will make me equally well or better off
8.4 17.56 29.01 45.04
Forest protection is important 3.45 3.07 15.71 77.78
It will improve our environmental conditions
3.82 7.25 36.26 52.67
I need more income 1.53 3.05 18.7 76.72
It will improve the conditions of our village/community
3.44 11.45 35.5 49.62
Table 18. Issues associated with a compensation system for stopping forest clearing
Disagree (%) Disagree somewhat (%)
Agree somewhat (%)
Agree (%)
The overall income situation in the village/community will be better
5.78 18.77 37.55 37.91
It will result in corruption 44.69 23.44 24.18 7.69
Unequal distribution of payments 29.6 13.36 36.82 20.22

29
The Lam Dong REDD+ pilot area, Viet Nam: a socioeconomic baseline survey
Conclusion3
Comprehensive socio-economic surveys were conducted in 2010 across 280 randomly selected households within four communes located within the Pro-poor REDD+ pilot area of the Cattien Landscape, Lam Dong Province, Viet Nam.
The results pertaining to the household structure and livelihoods illustrated a clear dominance of the Ma ethnic group, and very low levels of education. Low productivity agricultural activities are the primary source of income for the vast majority of households, with key constraints to productivity being identified as access to fertilisers and capital. However, focus group discussions also identified a clear link between low education levels and the uptake of new production techniques. Coupled with this was a general hesitance of households to take out loans through existing government support programmes, which was a reason for the constrained capital investment.
Timber from potential REDD+ forests and other forests was found to be the overwhelmingly dominant source of fuel for cooking, with few households having access to a secondary source. A list of other key NTFPs was also developed from focus group discussions, showing a strong dependence of households on forest resources.
Indicators of wealth, such as key asset ownership, clearly highlighted the poor livelihood conditions of the majority of households across the four communes. Key assets such as buffalo were owned by only a small percentage, and only 16 per cent of households suggested that their income was sufficient to meet the needs of the household. But almost 50 per cent of respondents did notice an improvement in their wellbeing compared to five years earlier.
Section B of the report illustrated the wide variance in the size and efficiency of agricultural production amongst households, with key crops being tea, coffee, acacia, cassava and cashew. A large proportion of households reported they faced annual constraints, which impinged on their productivity.
Forest clearing was seen by a large number of households as being necessary for the expansion of agricultural activities, yet it was also found there was a general perception that is was now more difficult to conduct these clearances than five years ago. This result can be viewed in association with the relatively low number of people who reported having cleared forest in the last five years, most of which cleared land had then been converted into plantations.
Conclusions can be drawn from Section C around the rights, use and management of forests. In particular, there appears to be a split between the communes in terms of their feelings of influence in forest management decisions, with LocBac and Loc Lam showing higher rates of dissatisfaction in their level of involvement. It was also found that there was a general level of satisfaction with the way in which state (CBFM) forests were being managed.
Despite the ongoing exploitation of natural forests in the project area, there was generally a very high rate of favourable responses from households for the protection of forests. Those who were not supportive largely saw these protection measures as an impediment to agricultural expansion, which was consistent with other findings throughout the surveying exercise. Support
30
REDD+ Country Reports
for community-based protection measures largely came from the perceived benefits they had in limiting illegal logging. However, the perceptions of households were found to be in disagreement with persisting illegal logging activities reported through focus group discussions.
In terms of the future for REDD+ activities in the area, there was overwhelming support for compensation payments to be made for forest protection activities. Yet there were also concerns as to how the compensation scheme could limit people’s use and access to important forest resources, and issues around whether the community would be made better off under the programme. Finally, important implications around the design of REDD+ payment systems could be learnt. In particular, issues around corruption and payment equality were mentioned as two key issues to be addressed in the design process. These issues will need to be addressed in future BDS piloting activities in Lam Dong.

