the language of architectural diagrams€¦ · basis of an initial idea or concept, frequently...
TRANSCRIPT

The Language of Architectural DiagramsThora Tenbrink1
School of Languages, Literatures and Linguistics, Bangor University, Wales, [email protected]
Ruth C. Dalton1
The University of Northumbria at Newcastle, [email protected]
Anwen Jago WilliamsSchool of Languages, Literatures and Linguistics, Bangor University, Wales, [email protected]
AbstractComplex buildings frequently present a challenge to users’ understanding, which may affect wayfindingas well as appreciation of the building’s structure. In this paper we focus on the building’s diagram,a representation by the building’s architect that captures its main ‘idea’. Motivated by the intuitionthat a building may be easier to understand if its conceptual diagram can be clearly and easilydescribed, we explored perceivers’ descriptions of such diagrams’ features. We asked students ofLanguage and students of Architecture to write about the buildings represented in a variety ofdiagrams, and then repeated the task for photographs of the actual buildings. Using CognitiveDiscourse Analysis, we aimed to create a first qualitative exploration of the linguistic and conceptualpatterns that are associated with the perception of diagrams and images of complex buildings. Amongother factors, results show how perception of the diagram’s meaning is fundamentally affected bysubject expertise. Linguistic patterns demonstrate the ways in which written descriptions reflectobservers’ understanding and concepts of building representations, providing a starting point forfuture studies which may address the possible relationship between the verbalisability of a diagramand the legibility of a building.
2012 ACM Subject Classification General and reference → Empirical studies
Keywords and phrases visualisation, Cognitive Discourse Analysis, linguistic representation, buildinglegibility
Digital Object Identifier 10.4230/LIPIcs.COSIT.2019.17
Acknowledgements We thank the students at Bangor and Northumbria Universities who participatedin this study, and the architects who gave us permission to use their diagrams.
1 Introduction
Have you ever stood in front of a complex public building, marvelled at its strange andfascinating forms – and wondered how to make sense of it, locate the entrance or how tofind your way around inside? The building shown in Figure 1, Museu Paula Rego in Cascais,might trigger such thoughts – impressive and perhaps a bit intimidating. How easy is it tounderstand such buildings?
To represent our understanding of a complex building, how would we describe it inlanguage? Words are, after all, our most commonly used tool to represent the world andour understanding of it. We use language to communicate our thoughts to others, andto express and develop our thought processes [5]. To some extent, people’s concepts of abuilding can therefore be accessed by a close look at how they talk (or write) about them,
1 The first two authors contributed equally to this paper.
© Thora Tenbrink, Ruth C. Dalton, and Anwen Jago Williams;licensed under Creative Commons License CC-BY
14th International Conference on Spatial Information Theory (COSIT 2019).Editors: Sabine Timpf, Christoph Schlieder, Markus Kattenbeck, Bernd Ludwig, and Kathleen Stewart;Article No. 17; pp. 17:1–17:14
Leibniz International Proceedings in InformaticsSchloss Dagstuhl – Leibniz-Zentrum für Informatik, Dagstuhl Publishing, Germany

17:2 The Language of Architectural Diagrams
Figure 1 Museu Paula Rego, Cascais: Photograph and architectural diagram. Photograph, left,is copyright Chia Hsien Liao (‘LeonL’) and made available under a Creative Commons Attribution2.0 Generic license. Diagram, right, copyright Eduardo Souto Moura and used with permission.
i.e. by analysing verbal descriptions. In the context of architectural concepts, we mightexpect that the complexity of buildings and the concomitant understanding of them shouldbe represented in linguistic description. Ultimately, we would also expect that a buildingthat can be clearly understood (and hence clearly verbalised) should also be easy to use,or usable – applying a previous definition by Krukar et al. in which they suggest that “Abuilding is usable when it allows the user to execute his/ her tasks effectively, efficiently andwith satisfaction in the specified context of use.” [14]. To a high extent, this will in practicedepend on navigability, i.e. the ability to navigate to a destination within the building. Thispresupposes a degree of understanding of the building’s structure, and thus relates to Lynch’sidea of legibility: namely, “the ease with which its parts can be recognized and organizedinto a coherent pattern” [15].
Unique buildings such as the one shown in Figure 1 are designed by architects on thebasis of an initial idea or concept, frequently represented in an architectural diagram (anotion we’ll examine in some depth in Section 2), such as the one shown on the right. Adiagram represents the architects’, not the users’, conceptualization – and it does so invisual form, not in language. Intuitively, there should be a connection: If a diagram and itsassociated building are easy to understand, they should also be relatively easy to put intowords. However, the literature so far offers few insights as to how buildings, or their diagrams,are described intuitively by speakers with different degrees of architectural expertise. Inthis paper, we therefore start by exploring the ways in which various types of diagrams areverbalised by students of architecture and (for comparison) of language-related subject areas.
2 Architectural diagrams
A diagram can be thought of as a particularly specialist sub-class or type of drawing, inwhich a number of simplified or often symbolic depictions of real world objects are used torepresent complex relations between those objects. The use of diagrams, who produces them,for what reasons, the features that they contain, and how they are used to communicate ideashave been the focus of study in various ways: for example the classic studies on the nature

T. Tenbrink, R. C. Dalton, and A. J. Williams 17:3
Table 1 Characteristics of architectural diagrams and their production (“diagramming”).
of representation by Peirce [17] and later Goodman [7] or on the use of diagrams in specificcontexts such as in scientific texts [8]. In this paper we focus on the very particular type ofdiagrams, as used by architects. Architectural diagrams are typically produced during thedesign process [16]; they may be the “key form of visual thinking within architecture” [2].
In Table 1 we outline a range of characteristics of architectural diagrams and theirproduction, which set them apart from the diagrams produced by other disciplines. Do [4]argued that the main distinctive feature of architectural design diagrams, as compared todiagrams in other domains, is “that the elements and spatial relations correspond to physicalelements and spatial relations in the architectural problem”. While diagrams often depict realworld objects, it is only in architectural diagrams that the spatial relationships between thosereal world objects are elevated to a level that gives them equal to, if not greater importancethan, the real world objects being depicted. This is because architecture is essentially aspatial (and specifically a spatial configurational) art: as Hillier says, “The designer is ineffect a configurational thinker” [10].
Herbert [9] defined the architectural diagram as an analytic statement used to help thearchitect solve a problem. Design problems, in general, and architectural design problemsspecifically, are well-known examples of wicked or ill-formulated problems [18, 1]: problemsthat have no definitive formulation, no stopping rules, can always have more than one solution,and are unique in each case. This is aggravated by the constant need to negotiate betweendeterminacy and indeterminacy [1] - a process that may be supported substantially by theuse of diagrams. Somol [19] even suggested that, beyond a means of thinking, diagrams mayactually be “the matter of architecture itself”; and furthermore that the architectural diagramhas “seemingly emerged as the final tool. . . for architectural production and discourse”.
This view of architectural diagrams acting as more than a mere representation alignsvery well with Hillier’s view in his book, Space is the Machine, where he suggests “the ideaof architecture is at once a thing and an activity, certain attributes of buildings and a certainway of arriving at them. Product and process are not, it seems, independent. In judgingarchitecture we note both the attributes of the thing and the intellectual process by whichthe thing is arrived at.” [10] If, in this sense, architecture is both a thing and an activity,then surely, by extension, the architectural diagram can be both an activity (tellingly often
COSIT 2019
17:4 The Language of Architectural Diagrams
denoted by the verb ‘diagramming’ in architectural practice) and a thing, not only in ofitself, but also as an interchangeable artifact standing for the, as yet, unrealised building.Even though some diagrams may never be realised as a building (which may make theirsignificance debatable to some), they still represent their designer’s intent.
3 From diagrams to language
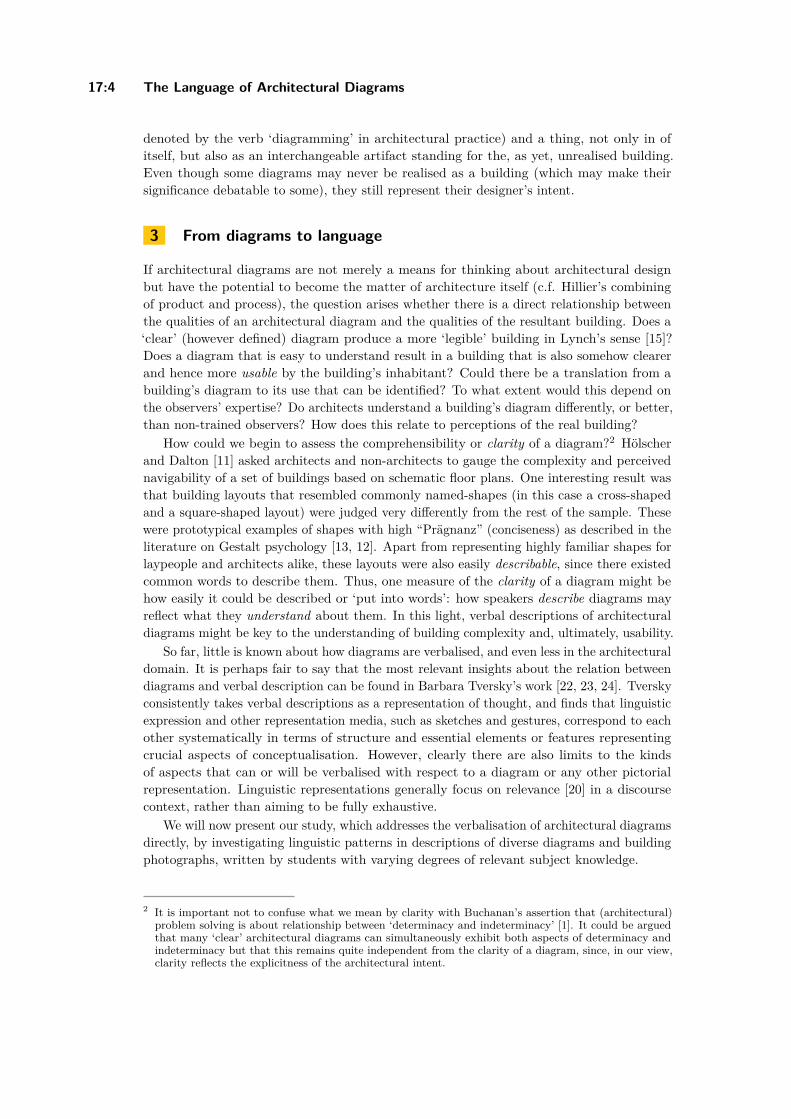
If architectural diagrams are not merely a means for thinking about architectural designbut have the potential to become the matter of architecture itself (c.f. Hillier’s combiningof product and process), the question arises whether there is a direct relationship betweenthe qualities of an architectural diagram and the qualities of the resultant building. Does a‘clear’ (however defined) diagram produce a more ‘legible’ building in Lynch’s sense [15]?Does a diagram that is easy to understand result in a building that is also somehow clearerand hence more usable by the building’s inhabitant? Could there be a translation from abuilding’s diagram to its use that can be identified? To what extent would this depend onthe observers’ expertise? Do architects understand a building’s diagram differently, or better,than non-trained observers? How does this relate to perceptions of the real building?
How could we begin to assess the comprehensibility or clarity of a diagram?2 Hölscherand Dalton [11] asked architects and non-architects to gauge the complexity and perceivednavigability of a set of buildings based on schematic floor plans. One interesting result wasthat building layouts that resembled commonly named-shapes (in this case a cross-shapedand a square-shaped layout) were judged very differently from the rest of the sample. Thesewere prototypical examples of shapes with high “Prägnanz” (conciseness) as described in theliterature on Gestalt psychology [13, 12]. Apart from representing highly familiar shapes forlaypeople and architects alike, these layouts were also easily describable, since there existedcommon words to describe them. Thus, one measure of the clarity of a diagram might behow easily it could be described or ‘put into words’: how speakers describe diagrams mayreflect what they understand about them. In this light, verbal descriptions of architecturaldiagrams might be key to the understanding of building complexity and, ultimately, usability.
So far, little is known about how diagrams are verbalised, and even less in the architecturaldomain. It is perhaps fair to say that the most relevant insights about the relation betweendiagrams and verbal description can be found in Barbara Tversky’s work [22, 23, 24]. Tverskyconsistently takes verbal descriptions as a representation of thought, and finds that linguisticexpression and other representation media, such as sketches and gestures, correspond to eachother systematically in terms of structure and essential elements or features representingcrucial aspects of conceptualisation. However, clearly there are also limits to the kindsof aspects that can or will be verbalised with respect to a diagram or any other pictorialrepresentation. Linguistic representations generally focus on relevance [20] in a discoursecontext, rather than aiming to be fully exhaustive.
We will now present our study, which addresses the verbalisation of architectural diagramsdirectly, by investigating linguistic patterns in descriptions of diverse diagrams and buildingphotographs, written by students with varying degrees of relevant subject knowledge.
2 It is important not to confuse what we mean by clarity with Buchanan’s assertion that (architectural)problem solving is about relationship between ‘determinacy and indeterminacy’ [1]. It could be arguedthat many ‘clear’ architectural diagrams can simultaneously exhibit both aspects of determinacy andindeterminacy but that this remains quite independent from the clarity of a diagram, since, in our view,clarity reflects the explicitness of the architectural intent.

T. Tenbrink, R. C. Dalton, and A. J. Williams 17:5
3.1 Diagram selection and questionnaire designIn order to investigate the verbalisability of a diagram, we selected a consistent set ofarchitectural diagrams, representative of a wide range of styles and from a diverse group ofpracticing architects, from a recent book on architectural sketches and diagrams3 by Chrisvan Uffelen (2014) [25], as follows. We first identified a set of 37 diagrams that correspondedto our notions of an architectural diagram (namely exploratory, ‘early-stage’ diagrams thatseemed to capture aspects of both determinacy and indeterminacy) but did not contain anywords. We analysed this initial set in terms of their attributes, noting if they appeared to bedrawn as a two-dimensional plan, section or elevation or as a three-dimensional view (or ifthe viewpoint was unclear). We then recorded the number of occurrences of current drawingelements, i.e. arrows, triangles, squares, rectangles, circles, ovals, spirals, curves/waves as wellas 90° and non-90° angles. We considered whether the diagrams included graphic techniquessuch as hatching and shading and whether they included non-building symbols such aspeople/figures and foliage/trees. Finally we noted if and when the building corresponding toa diagram had been built in the real world.
From those buildings that had been constructed, we selected two that had a diagramdrawn in plan view, two with a diagram representing a section (or elevation) view, and twowith a diagram drawn in 3D. For each of these different iconic viewpoints we selected onerelatively simple diagram (i.e., the frequency of graphical elements in the feature set waslow, compared to the sample as a whole) and one more complex diagram (a relatively highnumber of graphical elements in the feature set). The final set therefore consisted of 1 xsimple+plan; 1 x complex+plan; 1 x simple+section; 1 x complex+section; 1 x simple+3Dand 1 x complex+3D yielding 6 diagrams in total (see Figure 3 for all diagrams used in thisstudy4, and Figure 2 for photographs of the actual buildings).
A questionnaire (approved, separately, by Northumbria University’s Research EthicsCommittee and by the College of Arts, Humanities, and Business Research Ethics Committeeof Bangor University) was designed as follows. Prior to the main data collection, thequestionnaire’s purpose was explained and participants were asked to give their informedconsent. Following the main data collection, anonymized demographic information wascollected along with a set of questions designed to identify ‘visual thinkers’.
Section 1 of the questionnaire presented participants with each of the six buildings’diagrams, in a sequential but randomized order, along with the instruction (repeated sixtimes): “Please look at this image below. Describe the building as it is depicted in the image,in about three sentences.” In Section 2, the same diagrams were shown again (re-randomized),along with the following instruction (again repeated for each diagram): “Please look at thisimage below. Identify and describe which ‘elements’ (i.e. lines, shapes, forms, patterns etc.)you can find in this image”. In Section 3, a photograph, randomly ordered, of each of thereal buildings for which the diagrams had originally been drawn was presented,5 along with
3 Sketch is a more general term; in architecture it typically means a freehand representation of what isseen, or what might be seen: i.e., a translation from vision to paper. The architectural diagram is morespecific: this is about relations between building spaces, forms and functions, and about exploring thesevia the medium of the drawing.
4 Copyrights for Figure 3: Top left: © Christian de Portzamparc Architect; Top middle: Fernando Romero,Mexico City, 2006; Top right: UNStudio Architects; Bottom left: copyright Daniel Libeskind; Bottommiddle: Ana Rocha Architecture; Bottom right: Mr. Eduardo Souto Moura
5 For copyright reasons, the pictures shown in Figure 2 differ slightly from the ones used in the study.Copyrights for Figure 2: Top left: Diego Baravelli; Top middle: Carlos Valenzuela; Top right: UNStudioArchitects; Bottom left: Bernd Gross; Bottom middle: Ana Rocha Architecture; Bottom right: ChiaHsien Liao - LeonL. Top left and middle, bottom left and right are licensed under Creative Commons.
COSIT 2019

17:6 The Language of Architectural Diagrams
Figure 2 Building photographs. Top left: Cidade das Artes, Brasil: 2013 by architect Christiande Portzamparc; top middle: The Soumaya Museum, Mexico City: 2011 by Fernando Romero;top right: House Bierings, Utrecht: 2009 by Ana Rocha/Christian Richters; bottom left: MilitaryHistory Museum, Dresden: 2011 by Studio Daniel Libeskind; bottom middle: Villa NM, New York:2007 by Ben van Berkel; bottom right: Museu Paula Rego, Cascais: 2008 by Eduardo Souto Moura.
the following instruction (again repeated 6 times): “Here is one of the buildings that wasshown as a drawing earlier. Please describe the real-world building in a few sentences.” Thus,for each of the six buildings, three written descriptions were elicited: two for its diagram andone for its photograph.
3.2 Participant featuresTwo sets of students were invited to participate in the study: students of language-relatedsubject areas (such as Linguistics or English Literature, henceforth “Language student” forshort) at Bangor University in Wales, and students of Architecture at Northumbria Universityin England. These two subject areas were chosen because the study addresses the languageused in the context of architectural design, produced by participants whose background isrelevant in distinct ways. The questionnaire was available for two weeks. The only incentivewas a prize draw for an Amazon voucher; no other payments were made.
Of the 37 respondents, 22 were female, 14 male and 1 preferred not to say. For consistencyof analysis, we eliminated one age outlier (64 years) from the final data set, as well as5 participants who were not native speakers of English, and 1 participant who failed tocomplete the questionnaire as asked. The final data set has 12 female, 5 male, and onegender-unidentified language students (mean age: 22.1; age range: 18-33), and 8 female and4 male architecture students (mean age: 22.7; age range: 20-25).
6 female and 2 male architecture students and 7 female, 2 male, and 1 gender-unidentifiedlanguage student self-identified as visual thinkers. 7 female and 1 gender-unidentifiedlanguage students (but no male) considered themselves to be artistic, and 7 female and3 male architecture students did so. Thus, while the data sets seemed fairly balanced inthese respects, architecture students were (as might be expected) somewhat more likely toview themselves as visual thinkers and artistic. The same subject-related tendency was alsoreflected in the fact that all architecture students said they drew at least once a week orevery day, whereas only four of the language students (3 female, 1 gender-unidentified) didso; 6 (3 males) said they could not remember when they last drew something, and 8 (2 males)drew once a month.

T. Tenbrink, R. C. Dalton, and A. J. Williams 17:7
Figure 3 Architectural diagrams used in the study, shown in the same order and configuration asthe photographs of the corresponding buildings in Figure 2. Top row: simple; bottom row: complex.Diagrams on the left: plan views; middle: section views; right: 3D views.
Figure 4 Mean word count in each questionnaire section. LangNot = gender-unidentified.
Subject-related and gender differences were also reflected in word count (see Figure 4).6Language students produced more words on average (female: 384.6; male: 460.4) thanarchitecture students (female: 201.6; male: 322); variability of word count was reduced infemale architecture students (range: 119-261) as compared to other groups (male architecturestudents: 151–748; female language students: 161-643; male language students: 137-805).
4 Cognitive Discourse Analysis
Our aim was to gain insights into the concepts represented in the language in an explorativeway, in light of various aspects of the study design: the two groups of students with theirdifferent subject expertise, how students described diagrams as opposed to photographs, thedifferent building views and varying diagram complexity, and possible differences accordingto gender. None of these factors can be ignored, but they are too diverse to aim for any
6 Words were counted semi-automatically in Microsoft Excel. Likewise, further analyses were supportedby Excel’s features as far as feasible.
COSIT 2019

17:8 The Language of Architectural Diagrams
specific hypotheses based on inferential statistics, especially with unconstrained languageproduction in an only loosely controlled data elicitation exercise, using a small sample size.Instead, we will present a qualitative analysis of linguistic patterns in our data following themethodology of Cognitive Discourse Analysis [21], which aims to identify conceptual aspectsin discourse on the basis of systematic linguistic choices (beyond content).7
In the absence of specific hypotheses based on earlier literature we inspected the data togain first insights about patterns in the responses that highlight the participants’ underlyingconcepts systematically, in light of our motivating research question as to how architecturaldiagrams may be put into words and how verbalisability might relate to complexity andother features of the diagrams. To achieve systematic and objective annotation of our fairlylarge data set across various aspects, we then semi-automatically counted the occurrence ofkeywords in the following categories (emerging from the data, rather than predefined).
Peculiar: Words indicating a sense of peculiarity (signalling challenges for legibility),namely difficult, strange, unusual, unclear, peculiar, oddPossibility: Indicators of tentative (i.e., possible rather than certain) interpretations:seem, could, perhaps, appear, maybe, possible/possibility, ?Familiarity: Words marking the respondent’s familiarity with something (signallinglegibility): standard, traditional, exactly what, normalStructure: Descriptions of structural elements (highlighting what kinds of structureswere legible and verbalisable): rectangle/rectangular, prism, triangle/triangular, square,boomerang, pyramid, box, hourglass, L-shaped, circleFunction: Mention of possible building functions (suggesting comprehension of thebuilding in this respect): public, school, theatre, museum, officeBuilding/house: Using the words building and house (reflecting conceptualisations ofthe building as a whole 3D entity)Building parts: Mention of any building parts in the house, such as wall or window(reflecting more fine-grained real-world concepts of the actual building functions)Aesthetics: Using terms that, in this context, indicate a sense of aesthetics (signallingusability and legibility in a different way): organic, contrast, clean, featureArchitectural: Terms we identified in this context as architectural jargon, namelycirculation, intervention, extrude/extruding/intrude/intruding/extrusion/intrusion, ori-ent/orientation, void, mass, material, symmetry, plus Adrian Forty’s “key words inarchitecture” [6]: character, context, design, flexibility, form, formal, function, history,memory, nature, order, simple, space, structure, transparency, truth, type, user.
Note that there is no intention for these different categories to be equal in size, norcomparable in any sense to each other. They are, however, mutually exclusive.
5 Results
To gain a first intuitive impression of the language data, consider some exemplary descriptions:Female language student, Section 1, complex, plan view (bottom left in Figure
3): “This looks like a birds-eye plan of a building. It is comprised of different shapes andwould appear to have a triangular shaped building (or something) at the very top.”
7 To clarify, this approach does not exclude inferential statistics but only advocates it where feasible,which it is not in this explorative study.
T. Tenbrink, R. C. Dalton, and A. J. Williams 17:9
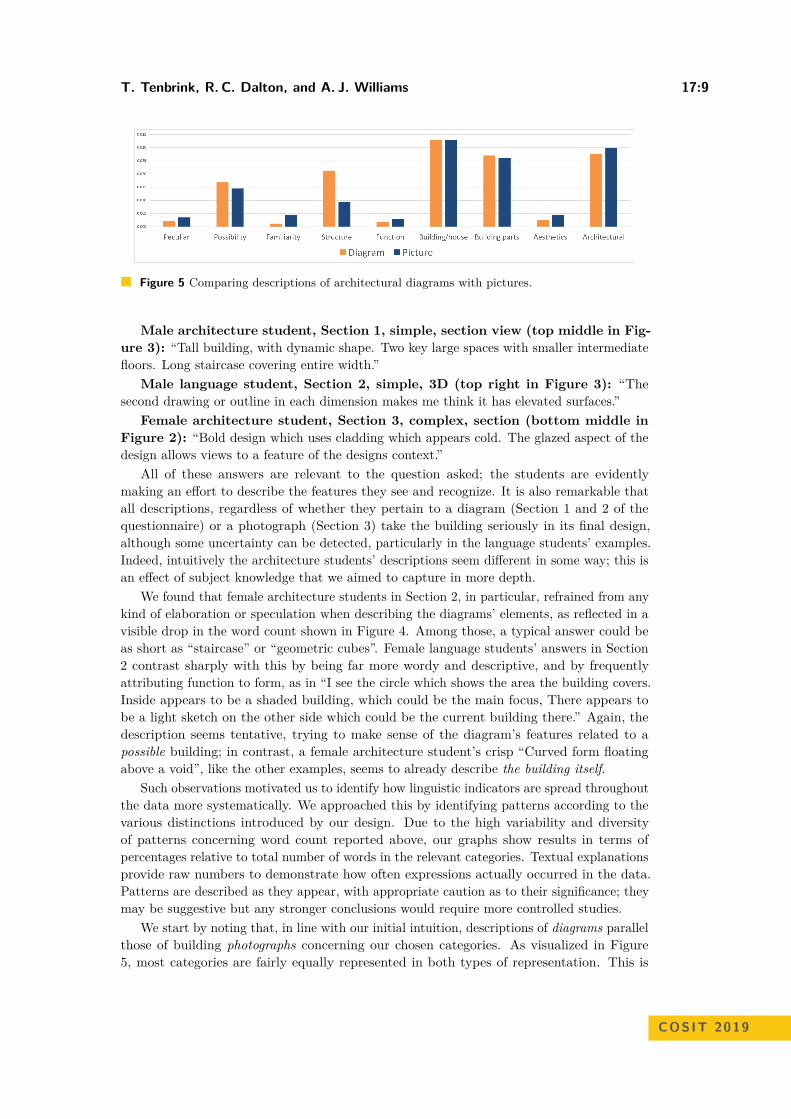
Figure 5 Comparing descriptions of architectural diagrams with pictures.
Male architecture student, Section 1, simple, section view (top middle in Fig-ure 3): “Tall building, with dynamic shape. Two key large spaces with smaller intermediatefloors. Long staircase covering entire width.”
Male language student, Section 2, simple, 3D (top right in Figure 3): “Thesecond drawing or outline in each dimension makes me think it has elevated surfaces.”
Female architecture student, Section 3, complex, section (bottom middle inFigure 2): “Bold design which uses cladding which appears cold. The glazed aspect of thedesign allows views to a feature of the designs context.”
All of these answers are relevant to the question asked; the students are evidentlymaking an effort to describe the features they see and recognize. It is also remarkable thatall descriptions, regardless of whether they pertain to a diagram (Section 1 and 2 of thequestionnaire) or a photograph (Section 3) take the building seriously in its final design,although some uncertainty can be detected, particularly in the language students’ examples.Indeed, intuitively the architecture students’ descriptions seem different in some way; this isan effect of subject knowledge that we aimed to capture in more depth.
We found that female architecture students in Section 2, in particular, refrained from anykind of elaboration or speculation when describing the diagrams’ elements, as reflected in avisible drop in the word count shown in Figure 4. Among those, a typical answer could beas short as “staircase” or “geometric cubes”. Female language students’ answers in Section2 contrast sharply with this by being far more wordy and descriptive, and by frequentlyattributing function to form, as in “I see the circle which shows the area the building covers.Inside appears to be a shaded building, which could be the main focus, There appears tobe a light sketch on the other side which could be the current building there.” Again, thedescription seems tentative, trying to make sense of the diagram’s features related to apossible building; in contrast, a female architecture student’s crisp “Curved form floatingabove a void”, like the other examples, seems to already describe the building itself.
Such observations motivated us to identify how linguistic indicators are spread throughoutthe data more systematically. We approached this by identifying patterns according to thevarious distinctions introduced by our design. Due to the high variability and diversityof patterns concerning word count reported above, our graphs show results in terms ofpercentages relative to total number of words in the relevant categories. Textual explanationsprovide raw numbers to demonstrate how often expressions actually occurred in the data.Patterns are described as they appear, with appropriate caution as to their significance; theymay be suggestive but any stronger conclusions would require more controlled studies.
We start by noting that, in line with our initial intuition, descriptions of diagrams parallelthose of building photographs concerning our chosen categories. As visualized in Figure5, most categories are fairly equally represented in both types of representation. This is
COSIT 2019

17:10 The Language of Architectural Diagrams
Figure 6 Results according to students’ background.
remarkable in light of the fact that participants were not asked to make a direct comparisonand never saw a building’s photograph side by side with its diagram. The differences thatwe do find in the graph intuitively make sense. Expressions of familiarity appear to bemore frequent with pictures (N=15 out of 3380 words) than with diagrams (N=8 out of6806 words); most of these (N=14 in total) point to the fairly traditional or standard formof House Bierings, Utrecht. In contrast, descriptions of structure are more frequent withdiagrams (N=145; buildings: N=32). Thus, it appears that diagrams represent structuresmore clearly than the actual buildings do. Functions and aesthetic aspects, in contrast,appear to be somewhat more prominent with photographs.
Concerning our two participant groups, subject knowledge is most clearly evident throughthe architecture students’ enhanced use of architectural terms (circulation, intervention,mass, etc.; N=174; language students: N=82). Beyond this, the graph shown in Figure 6suggests a range of further differences that together account, to some extent, for our previouslyobserved impression that descriptions by architecture students seem different on the whole. Inparticular, language students tended to use more expressions of peculiarity (difficult, strange,unusual etc.; N=23) than architecture students (N=3), as well as expressions of possibility(seem, perhaps etc.; N=134; architects: N=30). Also, they referred to structures theyrecognised within the diagrams using non-architectural terms (square, pyramid, hourglassetc.; N=143) more than architecture students (N=34), and used the words building andhouse more frequently (N=258; architects: N=70). Relative to the overall number of wordswritten, which was far lower in architecture students (2946 as opposed to 7240 written bylanguage students), architecture students provided suggestions of possible functions (public,school, museum, etc.) more often (N=9) than language students (N=13), and they referredmore often to aesthetic aspects (organic, feature etc.), (N=28; language students: N=4).
Next, we consider possible differences based on diagram complexity (see Figure 7). Againstpredictions, references to peculiarity seemed more frequent with simple diagrams (N=19) thanwith complex ones (N=7). However, expressions of possibility were somewhat more frequentin complex diagrams (N=90) than in simple ones (N=74), and expressions of familiarity(standard, traditional, etc.) appeared more often in simple diagrams (N=17) than in complexones (N=6). Suggestions of structure were less frequent with simple diagrams (N=76) thanwith complex ones (N=101), but the use of architectural terms appeared to decline withcomplexity (N=141 simple; N=116 complex).
The type of building view in the diagram (see Figure 8) appeared to affect language useonly with respect to a few of our categories. References to the words building and houseseemed more frequent in the case of a 3D diagram (N=136 as opposed to N=110 with a plan

T. Tenbrink, R. C. Dalton, and A. J. Williams 17:11
Figure 7 Results according to complexity of the diagram.
Figure 8 Results according to the type of diagram.
view and N=89 in the case of a section), suggesting that the idea of a building or house wasmore clearly visible. Structure seemed clearer with plan views (N=74) and 3D (N=66) thanwith section views (N=37). Plan views did not encourage recognition of specific buildingparts (N=51; 3D: N=125; section: N=96).
Finally, we can observe some tentative patterns concerning gender (Figure 9), beyondthe word count differences noted in Section 3.2. Female participants tended to refer moreto structures and used the words building and house more, and male participants usedmore expressions of possibility. (The gender-unidentified participant was excluded fromthis analysis.) We further noted that female architecture students were the only ones whoused the words North, East, South or West in their responses (N=5, all in Section 1); theplan view diagrams may have invited this interpretation in the absence of actual compassinformation.
Figure 9 Results according to gender.
COSIT 2019

17:12 The Language of Architectural Diagrams
6 Discussion
We explored how architectural diagrams and their associated buildings are represented inlanguage by people with different subject expertise, in light of various features of the diagrams.Results highlight a range of relevant observations that we hope will inspire future research.To start with, we note that this appeared a relatively easy task for both sets of students; infact, the descriptions suggest that it may actually have been quite enjoyable8 - even though itwas an atypical and unusual task for all participants, for different reasons. It is not surprisingthat language students produced a far higher mean number of words, despite their lack ofsubject knowledge: architects generally prefer the media of drawing and talking more thanthe act of writing. The fact that it nevertheless proved quite easy to elicit text descriptionsof the diagrams is encouraging, as it suggests that this might be a fruitful way to investigatethe purpose, intent and range of possible interpretations of architectural diagrams.
The high degree of correspondence between descriptions of diagrams and building pictures,in terms of our linguistic categories, aligns with the idea that in architecture, diagrams havea particular significance in that they are as much the subject of architectural endeavour asthe buildings themselves (see Section 2). Indeed, the designer does not actually ‘make’ thebuilding – that is built by others – and so the only artifact that is touched by the hand ofthe ‘creator’ are the drawings (which includes diagrams). It is therefore reasonable that thedrawings should stand for the creative intent of the architect and should have a status thatis equivalent (in this respect) to the building. To what extent descriptions of photographscorrespond to descriptions of actual building views and, ultimately, building experience andusage, is a matter of future investigation.
Our diverse analyses suggest various effects caused by the nature of the diagram (such asits level of complexity or whether it shows the building in plan or section view), as well asthe observers’ gender. There are, for instance, some indications that complexity matters forthe degree of understanding of a building and its diagram, as shown by differences such asreferences to possibility or architectural terminology. These avenues could be pursued furtherin the future, to assess the relevance of any such systematic effects for building legibility.
Beyond these patterns, it is interesting to consider the ways in which subject knowledgeaffects diagram (and photograph) interpretation. Unsurprisingly, architecture students madeheavier use of what we classed as technical terminology. Note however that only a few ofthe ‘architectural’ terms in our list (see Section 4 above) are exclusively used in the realmof architecture. Others, such as structure, are everyday words whose meanings may changewith expertise [6]. Compare one language student’s formulation flat looking rectangularstructure with an architecture student’s simple pitched roof structure with extruded mirroredwindow boxes. For language students, the term structure serves as a generic label usedto describe whatever elements they can find; for architecture students, the term itself ismeaningful, specifying, within their context, the nature of architectural design with respectto the elements described. Similar effects have been found in previous studies; for instance,professional background can affect how simple words such as back and end are used whendescribing pictures [3]. Ultimately, such differences in language use subtly convey diversityin how speakers think about what they perceive in a picture or in a diagram.
The idea that expertise affects how people conceive of diagrams and associated buildingsis further corroborated by various other differences we found between our participant groups.
8 To illustrate, here’s a quote from the gender-unidentified language student, while describing the diagramof Villa NM in section 2: “An A-shape holding up a piece of pasta.”

T. Tenbrink, R. C. Dalton, and A. J. Williams 17:13
Altogether, the impression emerges that language students faithfully describe what they see,and use elaborate, cautious descriptions to speculate on possible meanings. For architects,in contrast, the simultaneous presence of both ‘determinacy and indeterminacy’ [1] ispredominant; whilst the determinacy of the diagram shows the design-intent of the architect,it is the very indeterminent aspect of the drawing which permits diagrams to be ‘read’ onmany different levels at the same time. Architecture students are being trained to producesuch multi-level, multi-interpretable diagrams for themselves; this study indicates that thisalso contributes to the skill of interpreting the work of others in this way.
7 Conclusions and Outlook
This study brought together two hitherto fairly disconnected perspectives: the significanceof the architectural diagram as a representation of design ideas [19], and the significanceof linguistic choices in representing a speaker’s perceptions [21]. The aim was to betterunderstand how observers perceive architectural ideas as represented in diagrams.
Although explorative and qualitative in nature, a range of insights can be gained from thisstudy. First, describing diagrams is feasible and yields meaningful linguistic data. Second,subject expertise (along with various further factors) affects descriptions in various ways; thishighlights the different conceptualizations triggered by the visual information. It appearsthat the clarity of a diagram, or the ways in which it is understood, depends on who isinterpreting it. It remains to be seen how these systematic differences in interpretationtransfer to the real world building.
Supporting the idea of such a transfer, our third insight is that diagrams and photographsof buildings appear equally interpreted as representations of something real. The next step,accordingly, is to connect these representations to the actual buildings. Our ultimate aim(motivating this initial study) is to see whether a clear diagram (however defined) makes amore usable building (however defined), due to the legibility of its structures. This creates aclear need to take this work to the next stage: to relate diagram descriptions to navigationperformance and further measures of the usability of the associated building.
References
1 Richard Buchanan. Wicked problems in design thinking. Design issues, 8(2):5–21, 1992.2 Anthony Burke. Considering the diagram and design research. Revista Lusófona de Arquitectura
e Educação, 11:345–355, 2014.3 Claudia Cialone, Thora Tenbrink, and Hugo J Spiers. Sculptors, architects, and painters
conceive of depicted spaces differently. Cognitive Science, 42(2):524–553, 2018.4 Ellen Yi-Luen Do and Mark D Gross. Thinking with diagrams in architectural design. Artificial
Intelligence Review, 15(1-2):135–149, 2001.5 K Anders Ericsson and Herbert A Simon. Protocol analysis: verbal reports as data. MIT Press
Cambridge, Mass, 1984.6 Adrian Forty. Words and buildings: A vocabulary of modern architecture. Thames & Hudson
London, 2000.7 Nelson Goodman. Languages of art: An approach to a theory of symbols. Hackett, 1968.8 Mary Hegarty, Patricia A Carpenter, and Marcel Adam Just. Diagrams in the comprehension
of scientific texts, pages 641–668. Lawrence Erlbaum, Hillsdale, NJ, US, 1991.9 Daniel M Herbert. Architectural study drawings. John Wiley & Sons, 1993.10 Bill Hillier. Space is the machine: a configurational theory of architecture. Space Syntax, 2007.
COSIT 2019
17:14 The Language of Architectural Diagrams
11 Christoph Hölscher and Ruth Conroy Dalton. Comprehension of layout complexity: Effectsof architectural expertise and mode of presentation. In Design Computing and Cognition’08,pages 159–178. Springer, 2008.
12 Kurt Koffka. Principles of Gestalt Psychology. Harcourt Brace Javanovich, 1935.13 Wolfgang Köhler. Gestalt Psychology. New York: Liveright, 1929.14 Jakub Krukar, Ruth Conroy Dalton, and Christoph Hölscher. Applying HCI Methods and
Concepts to Architectural Design. In Architecture and Interaction, pages 17–35. Springer,2016.
15 Kevin Lynch. The Image of the City. Harvard University Press, 1960.16 Alexandre Menezes and Bryan Lawson. How designers perceive sketches. Design Studies,
27(5):571–585, 2006.17 Charles S Peirce. Logic as semiotic: The theory of signs. Philosophical writings of Peirce,
page 100, 1902.18 Horst WJ Rittel and Melvin M Webber. Wicked problems. Man-made Futures, 26(1):272–280,
1974.19 Robert E Somol. Dummy text, or the diagrammatic basis of contemporary architecture.
Diagram Diaries, pages 6–25, 1999.20 Dan Sperber and Deirdre Wilson. Relevance: Communication and cognition. Harvard University
Press Cambridge, MA, 1986.21 Thora Tenbrink. Cognitive discourse analysis: Accessing cognitive representations and processes
through language data. Language and Cognition, 7(1):98–137, 2015.22 Barbara Tversky. Visualizing Thought. TopiCS, 3(3):499–535, 2011. doi:10.1111/j.
1756-8765.2010.01113.x.23 Barbara Tversky, Julie Heiser, Paul Lee, and Marie-Paule Daniel. Explanations in gesture,
diagram, and word. In Kenny Coventry, Thora Tenbrink, and John Bateman, editors, Spatiallanguage and dialogue, pages 119–131. Oxford University Press, 2009.
24 Barbara Tversky, Masaki Suwa, Maneesh Agrawala, et al. Sketches for design and design ofsketches. In Human behaviour in design, pages 79–86. Springer, 2003.
25 Chris Van Uffelen. The book of drawings + sketches: architecture. Salenstein: Braun, 2014.