the last have become first - the civil rights project at...
TRANSCRIPT

1
The Last Have Become First Rural and Small Town America Lead the Way on Desegregation A Research Brief from the Civil Rights Project
Gary Orfield & Erica Frankenberg January, 2008

2
Back in the early l960s when there were civil rights struggles across the South in large cities, small towns and rural areas, it would have been shocking to suggest that rural areas would become beacons of interracial education while the great urban centers of the Northeast would have vastly more segregated schools, often only a few percentage points from total apartheid. Southern leaders at the time such as Alabama Governor George Wallace and Mississippi Senator John Stennis often predicted that that the North would never desegregate, attacking what he called Northern hypocrisy. The statistics we present in this report shows that such a pattern has clearly developed, though caused in a way they never suspected--driven by a Supreme Court that first limited and then rolled back desegregation efforts to the point where desegregated schools tend to be in areas without large areas of residential segregation. Policies and legal requirements for desegregation in urban schools have now been largely nullified by court decisions but those that desegregated the rural and small town South remain in effect. In communities where there is no significant residential segregation, the basic policy is that children must be assigned to the same school. Where there is serious residential segregation, under current judicial policies, the courts are likely to dissolve existing desegregation plans and to create serious barriers to voluntary desegregation by local school boards. The consequence of spreading segregation and these policies is that rural areas and towns have the most integrated schools while big cities and their suburbs are the most segregated. Since a similar study in 19911 there has been a substantial increase of segregation, very notable, for example, in the suburbs of large metro areas. The only areas where levels of intense segregation have declined since the early 1990s for black and Latino students are in rural areas and smaller towns. For black or Latino students, the kind of community you live in is likely to be strongly related to the level of segregation or integration you experience in public schools. The reason is that without desegregation plans, school segregation is strongly related to housing patterns. The Supreme Court’s decision last June to restrict many of the remaining tools used by school districts to design voluntary desegregation plans is likely to make this linkage even more pronounced.2 Specifically, extensive residential segregation and fragmentation of any metro area into separate school districts as well as the dissolution of desegregation plans that has been accelerating across the country means that those who live in big urban communities have few chances to attend integrated schools. In fact, Professor Amy Stuart Wells of Columbia University’s Teachers College has found that many adults who experienced successful desegregated education in their own lives but live in segregated communities regret that their children will not experience desegregation themselves.3 Our annual reports on desegregation trends have shown steadily growing segregation for both black and Latinos on both a national and regional level since 1990.4 The current level of segregation for Latinos is the highest recorded in the forty years these statistics have been
1 Orfield, Schley, Glass, and Reardon, 1993, see appendix 1. 2 127 S.Ct. 2738 (2007). 3 Wells, A.S.; Duran, J. & White, T. (2007). Refusing to Leave Desegregation Behind: From Graduates of Racially Diverse Schools to the Supreme Court. Teachers College Record. 4 Orfield, G. & Lee, C. (2007). Historic Reversals, Accelerating Resegregation, and the Need for New Integration Strategies. Los Angeles: The Civil Rights Project.

3
collected while the segregation of African Americans is back to what it was in the late 1960s, before serious urban desegregation began. These trends reflect both the dissolution of court-ordered desegregation plans after a series of Supreme Court decisions in the 1990s and the rising share of Latino and declining share of white students in the country. At the same time, patterns of residential segregation have spread to encompass more of the central cities and inner suburban communities. Residential segregation has been rising for Latinos, and although residential segregation has declined modestly for blacks over the past two decades, it remains extremely high, especially in the older large metropolitan areas and families with school age children are more segregated than the overall population.5 The resulting combination of these forces is that the only kinds of communities with high levels of school integration are the nation’s rural areas and towns, once the center of the most intense resistance. By contrast, extreme segregation is concentrated in the largest metropolitan areas. What Difference Does it Make? Americans like to believe that old problems of race have been solved or that they are insoluble and they need not worry about them. In many surveys, whites assert that discrimination is no longer serious and that minorities have equal opportunity for education. Black public opinion often differs considerably on these same questions, however.6 In fact, segregation in schools has been increasing for a generation and the data produced by state education reforms and No Child Left Behind show more clearly than ever that segregated minority schools are inferior both in life opportunities and academic outcomes (in spite of a handful of highly publicized exceptions). In terms of the educational factors that have the largest impact on student learning, most segregated minority schools typically have very high poverty levels, instability from rapid turnover of both students and faculty, less qualified and experienced teachers, more limited pre-collegiate curriculum, lower levels of competition and achievement, substantially higher dropout rates, and much weaker links to college and success in preparing students for college. The differences are profound and research of the last half century, summarized in a statement submitted by 553 social scientists in a brief to the Supreme Court in 2006, found that desegregated schools offer better opportunities and produce significant benefits for students.7 The social science statement also concluded that such schools offer both nonwhite and white students a substantially better chance to prepare to live and work successfully in the increasingly multiracial communities of the present and future. Desegregated education does not eliminate all racial gaps: how well it works depends on how desegregation is implemented and what kind of structures are in place within interracial schools,8 but the great bulk of scientific research shows that the Supreme Court was correct in l954 in concluding that, in the context of American society, segregated schools were and are fundamentally unequal. If this is true, the patterns of segregation should be of very serious concern both in educational terms and in terms of building successful, sustainable communities. 5 Logan, J. (2001). Ethnic Diversity Grows, Neighborhood Integration Lags Behind. Albany: Lewis Mumford Cente; Logan, J. (2001). Segregating the Children. Albany: Lewis Mumford Center. 6 Schuman, H., Steeh, C., Bobo, L., & Krysan, M. (1998). Racial Attitudes in America, Revised Edition. Cambridge, MA: Harvard University Press. 7 Brief available at http://www.civilrightsproject.ucla.edu/research/deseg/amicus_parents_v_seatle.pdf. 8 See E. Frankenberg & G. Orfield (Eds.) (2007). Lessons in integration: Realizing the promise of racial diversity in American schools. Charlottesville, VA: University of Virginia Press.

4
Communities Where Students Live, By Race. In the 2005-6 school year American public schools enrolled 27.7 million white students, 9.6 million Latinos, 8.4 million African Americans, 2.2 million Asians and 0.6 million American Indians. 57% of students were white.9 Of the nation’s total enrollment, 7.4 million went to school in big city districts, including 2.4 million blacks and 2.7 million Latinos, but just 1.6 million whites. Big cities educated 29% of African Americans, 29% of Latinos and 6% of whites. A large majority of whites went to school in the suburbs and rural areas. Schools in the suburbs of large metro areas serve 7.9 million white students but surprisingly they also educate 2.1 million blacks and 2.9 million Latinos, almost half of the nonwhite students in the large metropolitan areas. The middle-class, nonwhite migration to the suburbs that began in the l970s is now far advanced. In fact, there are more Latino students attending suburban schools in large metros than Latinos in the central city schools in these same metros. What these numbers tell us is that there are limited prospects for substantial integration within the boundaries of the largest central cities where there often isn’t even social class diversity to say nothing of racial diversity. At the same time, however, much could be done towards racial integration within the suburbs, between the cities and the suburbs, or among groups of suburbs.10 The mid-size central cities, with are defined as cities with less than a quarter million residents, have much more diversity. White students are equal in size to the combined enrollment of black and Latino students; almost a fifth of the nation’s Asian students also attend schools in these cities. The suburbs of the mid-size cities are overwhelmingly white with 4.1 million white students and only 0.6 million blacks and 0.8 million Latinos. The towns (communities over 2500 residents outside metropolitan areas) have a similar pattern of student racial composition with 2.7 million whites but 0.5 million blacks and 0.5 million Latinos. Rural areas, defined as communities of less than 2500, provide schools for a surprising 8.1 million whites but only 1.1 million blacks and .9 million Latinos. More than a fourth of the nation’s white students live there compared to an eighth of blacks and less than a tenth of Latinos. Thus different racial and ethnic groups are concentrated in communities that have strikingly different overall racial compositions and, within these areas, there are also great differences among school districts. Where students live matters very much for their experiences.
9 See Orfield & Lee, 2007. 10 There have been limited interdistrict desegregation efforts since the 1974 Milliken decision, which we discuss below. This decision does not prevent jurisdictions from voluntarily integrating across boundary lines, however.

5
Table 1: Enrollment of Students by Race/Ethnicity and Locale, 2005-0611 Locale American
Indian Asian Black Latino White
Large City 64,109 555,393 2,393,085 2,795,156 1,606,320 Mid-Sized City 59,515 411,123 1,658,758 1,707,948 3,330,124 Suburbs of Large City
89,398 878,862 2,111,158 2,931,113 7,852,885
Suburbs of Mid-Sized City
50,122 157,171 612,945 829,434 4,109,502
Town 106,524 69,965 530,328 475,833 2,720,760 Rural Areas 224,638 170,114 1,060,448 899,228 8,123,021 Total 594,306 2,242,628 8,366,722 9,638,712 27,742,612 Table 2: Percentage of Students of Each Race/Ethnicity by Location of School, 2005-06 Locale American
Indian Asian Black Latino White
Large City 10.8 24.8 28.6 29.0 5.8 Mid-Sized City 10.0 18.3 19.8 17.7 12.0 Suburbs of Large City
15.0 39.2 25.2 30.4 28.3
Suburbs of Mid-Sized City
8.4 7.0 7.3 8.6 14.8
Town 17.9 3.1 6.3 4.9 9.8 Rural Areas 37.8 7.6 12.7 9.3 29.3 Segregation of Students by Race and Community. In spite of the overall trend of continuously rising segregation, there are vast differences among types of American communities, ranging from almost total segregation of major groups to very high levels of interracial contact. There are massive transformations under way in major parts of suburbia in what has become a majority suburban nation with many suburbs experiencing racial change. These trends are important to keep in mind when thinking about the challenges for teachers and school leaders as they face many different kinds of situations with regard to race and class, and the likelihood that many communities long seen as overwhelmingly white are in transition or may face it soon. Intense segregation is the dominant pattern in our big cities. The Supreme Court handed down a 5-4 decision in the l974 school desegregation case in metropolitan Detroit that erected an almost impassable barrier for courts to require inter-district desegregation. Justice Thurgood Marshall’s dissent in this case concluded that it was a decision that, by refusing to allow an inter-district remedy, would create “separate and unequal education” and allow “our great metropolitan areas
11 The data analyzed for this report is NCES Common Core of Data, 2005-06, which is annually compiled by the U.S. Department of Education. The definition of communities comes from the NCES Common Core of Data’s locale code, which reports the location each school: central city larger than 250,000 residents; mid-sized central city (smaller than 250,000); urban fringe of large central city; urban fringe of mid-sized city; large or small town; and rural areas.
6
to be divided up….”12 He predicted that the policy of limiting desegregation to heavily minority, deeply impoverished central cities would fail and would build a racial barrier into the heart of society. The statistics show that this has happened in large cities and other analyses have consistently found metropolitan Detroit to be among the nation’s most segregated metros.13 Across the country in the 2005-06 school year, about two-thirds of black and Latino students in major urban centers attended intensely segregated schools where zero to ten percent of their fellow students were white as did one-third of big city Asian students. These are very important numbers because black and Latino students are many times more likely than white students to rely on big city schools for their education.14 Our studies of metropolitan Boston showed, for example, that almost half of the metro’s black students and about a fourth of the Latino students but only one in fifty white students in the region were educated in the Boston public schools.15 In the middle-sized central cities and suburban school districts surrounding large cities, the level of intense segregation was substantial but only about half as high as in the big cities for both black and Latino student. Further, only a tenth of Asian students were extremely isolated from whites. Even for black and Latino students intense segregation is relatively uncommon in suburbs of middle size cities, towns and rural areas. In rural areas only about a seventh of black and Latino students attend intensely segregated schools. Across all types of communities there are consistently higher percentages of black and Latino students in these intensely segregated minority schools than Asian students, the nation’s least segregated racial group. White students are the least likely of any students to attended segregated minority schools, particularly outside of central city schools.
12 Milliken v. Bradley, 418 U.S. 717 (1974). Marshall, J., dissenting). 13 Frankenberg, E., Lee, C.,& Orfield, G. (2003). A multiracial society with segregated schools: Are we losing the dream? Cambridge, MA: The Civil Rights Project at Harvard University. 14 Frankenberg, Lee, & Orfield, 2003, supra note 13. 15 Lee, C. (2004). Racial Segregation and Educational Outcomes in Metropolitan Boston. Cambridge, MA: The Civil Rights Project at Harvard University.

7
Table 3: Percentage of Students in Segregated Minority Schools, by Location of School and Race/Ethnicity, 2005-06
Percentage of students in segregated minority schools (90-100% nonwhite):
Percentage of students in predominantly minority schools (50-
100%):
Location of School
Blacks Latinos Asian White Asian Black Latino White Large city 68.3 64.3 36.7 6.1 85.3 93.5 94.0 46.4 Mid-sized city
32.3 33.7 10.5 1.3 59.2 76.8 80.4 24.1
Suburbs of large cities
34.1 33.8 11.6 0.9 48.3 70.8 75.9 13.7
Suburbs of mid-size cities
12.3 27.9 3.1 0.3 24.1 46.2 63.1 6.5
Town 16.0 18.1 5.3 0.2 46.7 61.8 57.7 9.2 Rural 14.4 14.7 2.6 0.2 32.1 48.5 51.4 5.0 Total 38.3 39.5 16.1 0.9 56.5 73.3 77.7 12.8 There is a relatively small group of schools in the U.S. that we have labeled “apartheid schools” because their enrollment is 99-100% nonwhite. These schools enroll almost 2.5 million students, or about one out of every twenty public school students. Across the U.S., one-sixth of African American children attend such schools and one-ninth of Latino students. In the nation’s big cities, however, more than one-third of black students and about one-fifth of Latino students are in such profoundly isolated schools. The number is also surprisingly high in the suburbs of big cities, where 13% of African American and 8% of Latino students attend apartheid schools. Nationally only 9,349 of 27,742,612 white students attend such schools. Table 4: Percentage of Students in 99-100% Minority Schools, by Location of School and Race/Ethnicity, 2005-06
Percentage of students in virtually all-minority schools (99-100% nonwhite): Location of School Asian Black Latino White
Large city 3.99 36.00 19.59 0.33 Mid-sized city 0.37 9.49 7.58 0.03 Suburbs of large cities 0.70 13.29 7.69 0.02 Suburbs of mid-size cities 0.47 2.68 10.24 0.01 Town 0.15 5.86 6.07 0.01 Rural 0.17 4.51 3.95 0.00 Total 1.38 16.67 10.92 0.03 White students in the U.S. attend schools where, on average, about four of every five students are white16 but only about one fourth of black and Latino students attend majority white schools. In 16 Orfield & Lee, 2007, supra note 4.

8
the large cities almost none do—only 6% of black and Latino students are in majority white schools while 94% are in schools with less than half whites. This level of extreme segregation existed by the early l990s (see Appendix), although a gradually declining share of nonwhite students rely on schools in major urban centers for their education. About a fifth of black and Latino students in central cities of mid-sized metros are in majority white schools. Small cities tend to have lower proportions of minority residents and to encompass a larger proportion of the metro housing market, though there are small cities, such as Hartford, Connecticut, that show extreme segregation similar to large metros. During the civil rights era, the image of the suburbs was of segregated white areas of privilege walled off from the cities. Suburban development began under overtly discriminatory policies in which the Federal Housing Administration would not support mortgages for communities unless they were segregated and decades before it became illegal to openly discriminate in real estate sales.17 Beginning in the l970s, however, a mass migration of non-whites to the suburbs began and the question became, would the suburban change replicate the experience of spreading segregation seen in the cities or would it create large areas of genuine, lasting integration? In the 2005-6 school year nearly three-fourths of the rapidly growing black and Latino enrollment in the suburbs of large metros attended majority nonwhite schools. As the growing number of middle class black and Latino families move to the suburbs they are not finding what other groups who suburbanized earlier received. In many cases, segregation is coming with them in spite of fair housing laws. On the 40th anniversary of the federal fair housing law there are only a handful of cases brought each year in spite of evidence of massive continuing discrimination. Only in rural areas do about half of black and Latino students attend majority white schools. The numbers for school segregation are getting worse. There has been a steady increase in the segregation of Latino students since the l960s, when Latinos had been far less segregated than blacks. Now they have become the most segregated. The history for black students is different: they have experienced increasing segregation since 1991, which is when the Supreme Court authorized the dismantling of court ordered desegregation plans. Partially because of desegregation orders and plans, the South was the most integrated region for black students for a quarter century until it fell behind in the 2005-6 school year. The segregation patterns are not only by race or ethnicity but highly segregated black and Latino schools are, in the vast majority of cases, also segregated by poverty.18 Latino students also experience increasing isolation by language Asian students are the most integrated group of students, though there are pockets of serious segregation, and whites are the most segregated within their own racial group. Schools that are segregated by race and poverty also tend to show systemic differences by teacher quality and experience, by graduation levels, by parental education levels, by the instability of enrollment, by the presence or absence of strong college prep courses, by the success of their students in college and many other important conditions and
17 Kenneth T. Jackson, The Crabgrass Frontier: The Suburbanization of the United States, New York: Oxford Univ. Press, 1985; Gary Orfield, “Federal Policy, Local Power, and Metropolitan Segregation, Political Science Quarterly, vol. 89, no. 4 (1974), pp. 777-802. 18 Orfield & Lee, 2007, supra note 4.

9
outcomes.19 Racial and ethnic segregation is part of a complex, interrelated pattern of inequality that affects the future opportunity of all students who attend such schools. Regional Patterns. There are strikingly different patterns of segregation in communities of different sizes and regions of the country,20 reflecting the patterns of residential segregation and the impact of court decisions that now treat different forms of segregation in radically different ways. At the time of the civil rights movement in the early l960s the epicenter of resistance to desegregation was in the rural and small town South which has far higher proportions of black students than rural areas in other regions. As a result, it is rather remarkable that almost a half century later the levels for concentration of black students in intensely segregated schools in these areas are less than half the national level. Contrast that to the level for black students in the big cities of the North, which sent down many of the protesters of the civil rights era; in the large central cities of the Northeast, 79% of black students attend intensely segregated schools, more than four times the proportion in the rural and small town South. In the West, where Latinos are concentrated, the pattern is similar, with levels of concentration in intensely segregated schools three times as high in the big cities as in the rural areas and less than a fifth in small towns Table 5: Percentage of Students in the South in Segregated Minority Schools, by Location of School and Race/Ethnicity, 2005-06
Percentage of students in segregated minority schools (90-100% nonwhite):
Percentage of students in predominantly minority schools (50-100%):
Location of School
Blacks Latinos Asian Asian Black Latino large city 64.2 68.1 24.0 70.1 92.4 95.0 mid-sized city 36.4 40.7 6.0 53.3 81.6 82.6 large suburbs 36.0 29.4 7.6 47.8 76.1 76.8 mid-sized suburbs 13.7 39.5 2.0 24.8 51.7 68.7 town 19.2 27.2 3.4 43.2 71.1 73.4 rural 16.5 15.4 1.3 24.9 52.5 53.5 Total 32.4 40.2 8.3 46.7 72.0 78.3 The border states, the arc of six slave states from Oklahoma to Delaware, which fought on the Union side in the Civil War but had state-imposed segregation until the Brown decision, have smaller black and Latino populations than the South. At the same time, there are a number of highly segregated central cities here including Kansas City, St. Louis, Baltimore, and Washington DC that show a very highly level of segregation for blacks in the cities of large
19 See generally, social science statement, supra note 7. 20 The region definitions are--South: Alabama, Arkansas, Florida, Georgia, Louisiana, Mississippi, North Carolina, South Carolina, Tennessee, Texas, & Virginia. Border: Delaware, Kentucky, Maryland, Missouri, Oklahoma, & West Virginia. Northeast: Connecticut, Maine, Massachusetts, New Hampshire, New Jersey, New York, Rhode Island, Pennsylvania & Vermont. Midwest: Illinois, Indiana, Iowa, Kansas, Minnesota, Nebraska, North Dakota, Michigan, Ohio, Iowa, South Dakota, & Wisconsin. West: Arizona, California, Colorado, Montana, Nevada, New Mexico, Oregon, Utah, Washington, & Wyoming. Alaska & Hawaii are excluded here because of their unique ethnic compositions and geographic isolation from the regions studied.

10
metros and their suburbs. There are much lower levels in smaller metros, towns and rural areas. Some very rapid increases in segregation are taking place in parts of this area. Table 6: Percentage of Students in the Border in Segregated Minority Schools, by Location of School and Race/Ethnicity, 2005-06
Percentage of students in segregated minority schools (90-100% nonwhite):
Percentage of students in predominantly minority schools (50-
100%):
Location of School
Blacks Latinos Asian Asian Black Latino Large city 60.6 13.6 8.2 51.3 91.3 84.0 Mid-sized city 6.4 4.0 0.2 21.5 44.5 46.0 Large suburbs 39.5 22.8 7.0 40.5 70.4 63.7 Mid-sized suburbs n/a
n/a n/a 5.9 15.1 3.9
Town n/a n/a n/a 8.9 21.7 28.0 Rural 9.3 0.8 0.8 17.8 29.8 16.8 Total 37.4 13.6 5.1 34.5 67.1 55.1 The Northeast has been the most segregated region of the country for several decades. In its large cities, the region has 79 percent of black students and 74 percent of Latinos attending intensely segregated schools and only 3% of them in majority white schools. In this region there are few blacks living in towns and rural areas but those who do, as well as those living in suburbs of mid-sized metros, have very low levels of intense segregation. In the suburbs of large metros, however, segregation is much higher with a third of blacks and Latinos attending intensely segregated schools and two-thirds in predominantly minority schools. Table 7: Percentage of Students in the Northeast in Segregated Minority Schools, by Location of School and Race/Ethnicity, 2005-06
Percentage of students in segregated minority schools (90-100% nonwhite):
Percentage of students in predominantly minority schools (50-
100%):
Location of School
Blacks Latinos Asian Asian Black Latino Large city 79.0 73.8 40.4 92.8 97.4 96.8 Mid-sized city 34.7 32.1 8.1 68.9 82.3 84.6 Large suburbs 33.8 30.9 3.8 25.9 65.7 65.1 Mid-sized suburbs 6.0 2.5 0.2 7.9 30.3 29.1 Town 1.6 0.2 0.1 6.9 18.3 29.5 Rural 2.0 0.7 0.0 9.7 23.5 15.9 Total 51.0 44.7 16.8 51.0 78.4 76.8
11
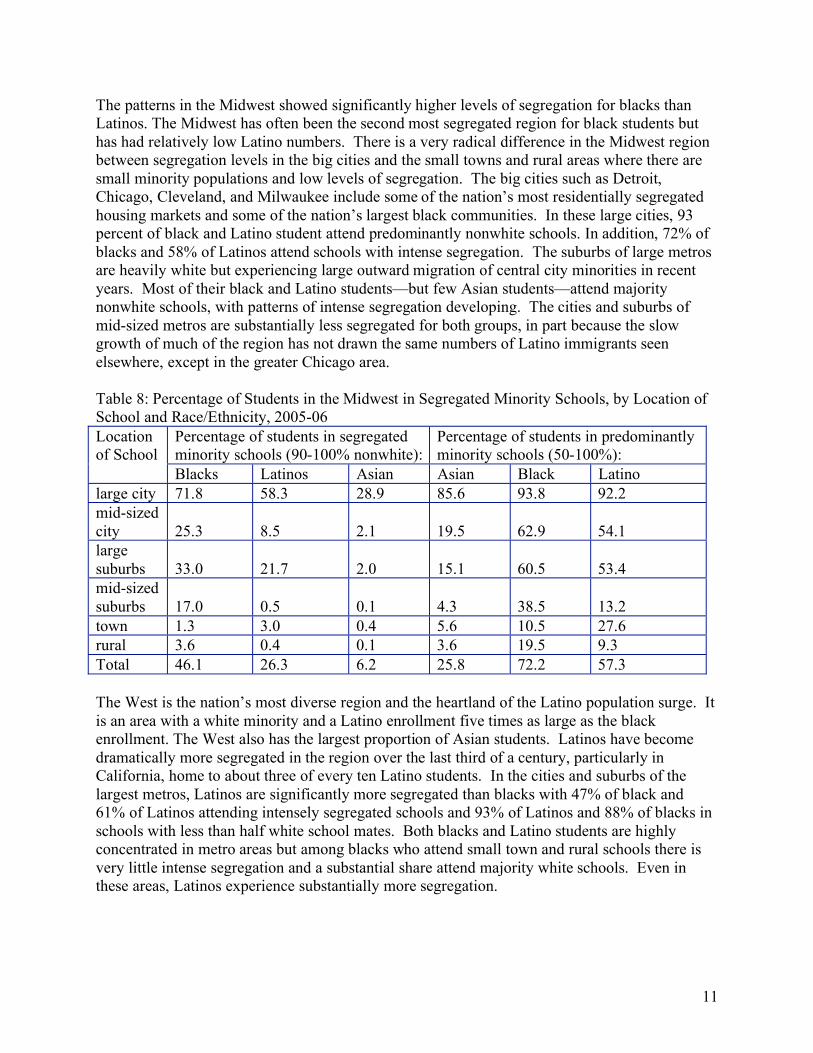
The patterns in the Midwest showed significantly higher levels of segregation for blacks than Latinos. The Midwest has often been the second most segregated region for black students but has had relatively low Latino numbers. There is a very radical difference in the Midwest region between segregation levels in the big cities and the small towns and rural areas where there are small minority populations and low levels of segregation. The big cities such as Detroit, Chicago, Cleveland, and Milwaukee include some of the nation’s most residentially segregated housing markets and some of the nation’s largest black communities. In these large cities, 93 percent of black and Latino student attend predominantly nonwhite schools. In addition, 72% of blacks and 58% of Latinos attend schools with intense segregation. The suburbs of large metros are heavily white but experiencing large outward migration of central city minorities in recent years. Most of their black and Latino students—but few Asian students—attend majority nonwhite schools, with patterns of intense segregation developing. The cities and suburbs of mid-sized metros are substantially less segregated for both groups, in part because the slow growth of much of the region has not drawn the same numbers of Latino immigrants seen elsewhere, except in the greater Chicago area. Table 8: Percentage of Students in the Midwest in Segregated Minority Schools, by Location of School and Race/Ethnicity, 2005-06
Percentage of students in segregated minority schools (90-100% nonwhite):
Percentage of students in predominantly minority schools (50-100%):
Location of School
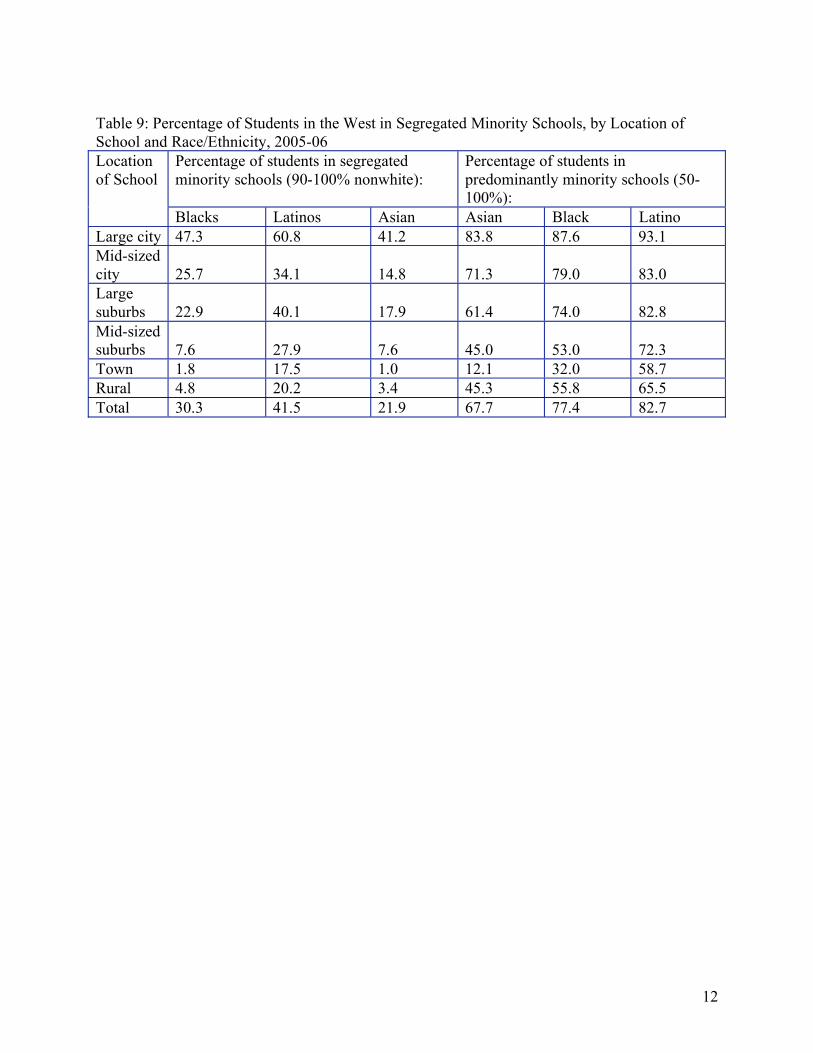
Blacks Latinos Asian Asian Black Latino large city 71.8 58.3 28.9 85.6 93.8 92.2 mid-sized city 25.3 8.5 2.1 19.5 62.9 54.1 large suburbs 33.0 21.7 2.0 15.1 60.5 53.4 mid-sized suburbs 17.0 0.5 0.1 4.3 38.5 13.2 town 1.3 3.0 0.4 5.6 10.5 27.6 rural 3.6 0.4 0.1 3.6 19.5 9.3 Total 46.1 26.3 6.2 25.8 72.2 57.3 The West is the nation’s most diverse region and the heartland of the Latino population surge. It is an area with a white minority and a Latino enrollment five times as large as the black enrollment. The West also has the largest proportion of Asian students. Latinos have become dramatically more segregated in the region over the last third of a century, particularly in California, home to about three of every ten Latino students. In the cities and suburbs of the largest metros, Latinos are significantly more segregated than blacks with 47% of black and 61% of Latinos attending intensely segregated schools and 93% of Latinos and 88% of blacks in schools with less than half white school mates. Both blacks and Latino students are highly concentrated in metro areas but among blacks who attend small town and rural schools there is very little intense segregation and a substantial share attend majority white schools. Even in these areas, Latinos experience substantially more segregation.
12
Table 9: Percentage of Students in the West in Segregated Minority Schools, by Location of School and Race/Ethnicity, 2005-06
Percentage of students in segregated minority schools (90-100% nonwhite):
Percentage of students in predominantly minority schools (50-100%):
Location of School
Blacks Latinos Asian Asian Black Latino Large city 47.3 60.8 41.2 83.8 87.6 93.1 Mid-sized city 25.7 34.1 14.8 71.3 79.0 83.0 Large suburbs 22.9 40.1 17.9 61.4 74.0 82.8 Mid-sized suburbs 7.6 27.9 7.6 45.0 53.0 72.3 Town 1.8 17.5 1.0 12.1 32.0 58.7 Rural 4.8 20.2 3.4 45.3 55.8 65.5 Total 30.3 41.5 21.9 67.7 77.4 82.7

13
Appendix: Patterns in l991-92 school year A related study was carried out in 1993 on data from the 1991-92 school year. It used somewhat different definitions of community size but it does permit some interesting comparisons. It shows that central city school districts were already highly segregated fourteen years earlier but that there has been a major increase in suburban enrollment for blacks and Latinos and that Suburban segregation has increased significantly especially for Latino students. Segregation Patterns by Type of Community
School Segregation of Blacks and Latinos, 1991-92
SCHOOLS Large Metros Small Metros Towns Rural
RACE% City Suburbs City Suburbs 25,000+ Small Areas
90-100%
MINORITY
Blacks 63.9 21.5 27.4 14.6 12.2 9.3 17.3
Latinos 56.2 22.4 32.8 13.7 4.2 20.0 19.3
50-100%
MINORITY
Blacks 92.4 57.9 62.9 43.0 45.5 44.9 45.8
Latinos 93.8 63.9 70.4 51.4 44.0 60.5 46.5
MAJORITY
WHITE
Blacks 7.6 42.1 37.1 57.0 54.5 55.1 54.2
Latinos 6.2 31.1 29.6 48.6 56.0 39.5 53.5
Gary Orfield with Sare Schley, Dianne Glass and Sean Reardon , The Growth of Segregation in American Schools: Changing Patterns of Separation and Poverty Since 1968, Washington: National School Boards Association, Council of Urban Boards of Education, 1993.
Large metros are defined in this table as urban communities in which the central city has a
population over 400,000. There were 33 cities of this size in the 1990 Census. In 1986 the 25
largest central city systems contained 30% of Latino students, 27% of blacks, and 3% of whites.

14
Exposure of Blacks, Latinos and Whites to
Students of Other Groups, by Size of Community
Community Type
% White in
School of Typical
Blacks
% Minority in
School of Typical
White
Blacks Latinos Blacks Latinos
LARGE METRO
City 13.7 15.0 18.9 16.5
Suburbs 40.8 36.2 13.2 8.5
SMALL METRO
City 37.5 33.0 7.0 6.7
Suburbs 50.6 47.5 8.2 5.1
TOWNS
25,000+ 50.4 53.0 8.1 5.4
Small 25.6 40.3 6.0 4.3
RURAL 48.7 48.6 4.7 2.0
Gary Orfield with Sara Schley, Dianne Glass and Sean Reardon, The Growth of Segregation in American Schools: Changing Patterns of Separation and Poverty Since 1968, Washington: National School Boards Association, Council of Urban Boards of Education, 1993.