the late amir his highness shaikh isa bin salman al khalifa · the late amir his highness shaikh...
TRANSCRIPT

The late AmirHis Highness Shaikh Isa Bin Salman Al Khalifa
amir ruling ....english. 11/19/01 8:21 AM Page 1

H.H. Shaikh Hamad Bin Isa Al KhalifaThe Amir of the State of Bahrain
amir ruling ....english. 11/19/01 8:21 AM Page 2

H.H. Shaikh Khalifa Bin Salman Al KhalifaThe Prime Minister
amir ruling ....english. 11/19/01 8:21 AM Page 3

H.H. Shaikh Salman Bin Hamad Al KhalifaThe Crown Prince and Commander-in-Chief
of the Bahrain Defence Force
amir ruling ....english. 11/19/01 8:21 AM Page 4

BOARD OF DIRECTORS
CHAIRMAN
H.H. Shaikh Khalifa Bin Salman Al KhalifaPrime Minister
DEPUTY CHAIRMAN
H.E. Abdulla Hassan SaifMinister of Finance & National Economy
GOVERNOR
H.E. Shaikh Ahmed Bin Mohammed Al-Khalifa
ADVISERS
Mr. John Field - Adviser, Banking and Finance Dr. Bakri A. Bashir - Adviser, Economic AffairsMs. Bernadette M. Doyle - Adviser, Legal AffairsMr. Richard Ellis - Adviser, Banking Control
ADDRESS
P.O. Box 27, Manama, State of BahrainE-mail: [email protected]
Telex: BN8295 BAHMONTelephone: 547777
Fax: 532274
Registration No.: MBMA 113
I

TABLE OF CONTENTS
FOREWORD BY H.E. THE GOVERNOR
CHAPTER ONE: INTERNATIONAL ECONOMIC 1PERSPECTIVE
1-1 Economic Developments
1-2 Exchange Rates and Gold Prices
1-3 Interest Rates
CHAPTER TWO: DOMESTIC ECONOMIC 4DEVELOPMENTS
2-1 Domestic OutputGDP at Current PricesGDP at Constant PricesCrude Oil Production and RefiningGas Production and UtilisationAluminium Production
2-2 Government FinanceRevenuesExpenditures
2-3 Consumer Price Index
2-4 Bahrain Stock Exchange
CHAPTER THREE: FOREIGN TRADE AND BALANCE 13OF PAYMENTS
3-1 Trade BalanceExportsImports
3-2 Direction of Non-Oil Trade
3-3 Non-Oil Trade with GCC Countries
3-4 Balance of Payments
II

CHAPTER FOUR: MONEY AND BANKING 18
4-1 Money Supply And Liquidity
4-2 Banking System
4-3 Commercial Banks
4-4 Offshore Banking Units
4-5 Investment Banks
4-6 Employment in the Banking & Financial Sector
CHAPTER FIVE: BMA OPERATIONS, ACTIVITIES 28STATUTORY ACCOUNTSAND REGULATIONS
DIRECTORATES:AccountsAdministrationBanking ControlBanking ServicesComputer ServicesCurrency IssueEconomic ResearchInvestment
LIST OF BMA OFFICERS 35
STATUTORY ACCOUNTS 36
LIST OF BANKS AND OTHER FINANCIAL INSTITUTIONS 44IN BAHRAIN
LIST OF BMA REGULATIONS AND CIRCULARS - 2000 47
LIST OF TABLES 63
LIST OF CHARTS 64
III

IV
FOREWORD
It is with great pleasure that I present the 27th Annual Report of the Bahrain MonetaryAgency.
The Report provides a brief summary of international economic and financial events in2000, followed by a detailed review of domestic economic and financial developments and of theactivities and operations of the Bahrain Monetary Agency over the course of the year. The Reportalso presents the statutory accounts and financial statements of the Agency for the year ended 31stDecember 2000, as well as the significant Circulars and Regulations issued by the Agency duringthat year.
Bahrain’s economy performed strongly in 2000 under the influence of continuing rise inoil and aluminium prices. Inflation remained firmly under control with the Consumer Price Indexcontinuing to fall (down 0.7% following a fall of 1.3% in 1999). In terms of economic growth, GDPat current prices increased by 20.4% and by 5.3% in real terms. The budget was in surplusfollowing a deficit the previous year. The overall balance of payments was again in surplus, byBD75 million, following the return to surplus the previous year.
The outlook for the economy in 2001 indicates continuing improvement. Preliminary dataindicates further strengthening of both trade and fiscal accounts. The commitment of the Bahrainauthorities to the utilisation of Bahrain resources, the further diversification of the economy,coupled with the support of the private sector, will continue to exert favourable influences on theeconomy.
Over the year, the banking sector continued to demonstrate satisfactory progress. For thefull commercial banks, it was a year of consolidation. The banks’ combined balance sheet grew bynearly 3% in the first quarter, with assets/liabilities reaching an all-time high of BD3852.2 million,but declined thereafter, to end the year virtually unchanged at BD3768.1 million. The combinedbalance sheet of the offshore banking units also reached record levels; assets/liabilities peaking atalmost US$93.0 billion by the year-end. However; those for the investment banks fell throughoutthe year, from last year’s record high of US$4.0 billion, but recovering slightly in the fourthquarter, to stand at US$3.4 billion.
A total of 173 banks and financial institutions were licensed by the Agency at end 2000. Inaddition, the Agency approved 176 collective investment schemes and mutual funds in 2000,bringing the total to 699 schemes sold and marketed in Bahrain by 39 financial institutions.

V
Supervisory events in 2000 were dominated by international initiatives. First, in February2000, the Agency was assessed by the IMF for its compliance with the Basel Core Principles (a setof best practices compiled by the Basel Committee). The Agency was found fully compliant with24 of the 30 principles and sub-principles and an Action Plan was implemented to address theremaining six. The first direct result of this Action Plan was the issuing of a new circular in May2000 with revised rules for controllers of banking institutions which requires that all potentialsignificant shareholders in Bahraini banks must be assessed fit and proper by the Agency. Otherregulations are to be put in place prior to the next IMF Assessment which is scheduled for 2002.The Agency is confident that it will be found fully compliant, or largely complaint, with all theCore Principles by the time of the next Assessment. Second, the Agency was pleased to note theFATF (Financial Action Task Force) formally accepted the Mutual Evaluation Report performed onBahrain in the Summer of 2000 concerning the compliance of Bahrain with international standardsrelating to the prevention of money laundering. Third, the imminent implementation ofInternational Accounting Standard 39 (IAS 39) involved both the banks and the Agency inextensive preparatory work throughout the year. The Standard, to be introduced on 1st January2001, requires accounting and prudential systems to reflect fair value assessment of securities andinvestments. Its adoption will lead to an immediate and further improvement in the quality oftransparency of banks’ financial records.
The IMF assessment, the Mutual Evaluation Report and the adoption of IAS 39 are allmajor contributions to the continuing evolvement of Bahrain as a major international financialcentre implementing the highest international standards of best practice.
A further development of major importance during the year was the introduction of directinvolvement of external auditors in the statistical reporting system. From June 2000 onwards, asa means to improve the accuracy of prudential reporting to the Agency, all prudential returnssubmitted by banks became subject to formal review by each bank’s external auditors.
Finally, from early 2000, new quarterly information reports were required from providersof investment advisory services and, similarly, from money brokers by the year end.
I should like to take this opportunity to express my deep gratitude to His Highness theAmir of Bahrain, Shaikh Hamad Bin Isa Al Khalifa, His Highness the Prime Minister andChairman of the Board of the Bahrain Monetary Agency, Shaikh Khalifa Bin Salman Al Khalifa,and His Highness the Crown Prince and Commander-in-Chief of the Bahrain Defence Force,Shaikh Salman Bin Hamad Al Khalifa, for their guidance to, and patronage of, the Agency. I alsoextend to all Government Ministries and Agencies my sincere appreciation for their continuedsupport.
I am deeply grateful to Bahrain’s financial community for its support and cooperation in2000, and to the Agency’s personnel for their substantial contribution towards further enhancingthe effectiveness and efficiency of the Agency.
Ahmed Bin Mohammed Al-KhalifaGovernor

1
1-1 Economic Developments
The global economy witnessed a number of developments in 2000, the most importantbeing the tightening of monetary policy in the United States to address rising demand pressures.In addition, the year witnessed a series of shocks such as a sharp fall in equity markets,particularly those of technology stocks, slow growth in the technology sector, tightening of creditconditions and a sharp weakening in consumer and business confidence.
The steep rise in crude oil prices was also a major feature of 2000. During the year, the averageprice of crude oil increased to a peak of US$ 29.80 per barrel in the third quarter of 2000 from a lowof US$ 26.56 in the first quarter. The average price of crude oil in 2000 was US$ 28.21 per barrel,as compared with US$ 17.98 per barrel a year earlier.
(a) Output
World economic growth increased to 4.8% in 2000 compared with 3.5% in 1999. Averagegrowth in the advanced and developing economies was 4.1% and 5.8% in 2000, compared with3.4% and 3.8% respectively in 1999. In addition, countries in transition experienced growth of 5.8%in 2000, compared with 2.6% a year earlier.
(b) Unemployment
Unemployment rates in the advanced economies fell from 6.1% in 1999 to 5.7% in 2000.Unemployment in the United States and the United Kingdom decreased from 4.2% and 6.0% in1999 to 4.0% and 5.6% respectively in 2000. Similarly, unemployment in Germany fell from 8.3% to7.8% and in France from 11.3% to 9.7%. Unemployment in Japan, however, remained unchangedat 4.7%.
CHART 1-1: ECONOMIC GROWTH RATES
CHAPTER ONE
INTERNATIONAL ECONOMIC PERSPECTIVEPe
rcen
t
7.0
6.0
5.0
4.0
3.0
2.0
1.0
0.0
-1.0
-2.01998 1999 2000
AdvancedEconomices
DevelopingCountries
Countries inTransition
World

2
1-2 Exchange Rates and Gold Prices
An analysis of exchange rates between end 1999 and end 2000, using national currencyunits per SDR, indicates that the Euro, Japanes Yen and Pound Sterling depreciated by 2.5%, 6.7%and 2.8% respectively. In contrast, the U.S. Dollar appreciated by 5.1% against the SDR.
(c) Inflation
Inflation rates in the advanced economies remained fairly subdued during the yearregistering 2.3% in 2000. In the developing countries, however, inflation fell from 6.7% to 6.1%.Inflation in the transition economies decreased significantly from 43.9% in 1999 to 20.1% in 2000.
Country Group 1998 1999 2000
Advanced Economies 1.5 1.4 2.3Developing Countries 10.4 6.7 6.1Countries in Transition 21.8 43.9 20.1
Table 1.1: Inflation Rates (%)
Gold prices showed a downward trend during 2000, falling from US$ 290.2 per ounce inthe first quarter of 2000 to US$ 269.2 per ounce in the fourth quarter. However, year on year, theaverage price remained little changed at $279.00 per ounce.
Source: IMF, World Economic Outlook, May 2001.
US Dollar 1.3725 1.3469 1.3373 1.2979 1.3029
Euro 1.3662 1.4099 1.3994 1.4808 1.4002
Japanese Yen 140.27 142.57 140.95 139.98 149.70
Pound Sterling 0.8491 0.8444 0.8843 0.8829 0.8732
Table 1.2 : Exchange Rates of Major Currencies Against the SDR
Source: IMF, International Financial Statistics, April 2001.
Currency1999 2000
Q4 Q1 Q2 Q3 Q4

3
1-3 Interest Rates
Interest rates on the major international currencies rose during 2000. Rates on the U.S.dollar increased from 5.5% in 1999 to 6.7% in 2000. In addition, rates on the Japanese Yen and Euroincreased from 0.2% and 3.0% in 1999 to 0.3% and 4.6% respectively in 2000.
CHART 1-2: GOLD PRICES IN 2000(London Closing)
400
300
200
100
0
USD
per
fin
e ou
nce
1999 Q4 Q1 Q2 Q3 Q4
2000
Currencies 1998 1999 2000
U.S. Dollar 5.6 5.5 6.7
Japanese Yen 0.7 0.2 0.3
Euro 3.7 3.0 4.6
Table 1.3: Interest Rates on Major Currency Deposits ( 6 Month LIBOR )
Source: IMF World Economic Outlook, May 2001.

4
CHAPTER TWO
DOMESTIC ECONOMIC DEVELOPMENTS
2-1 Domestic Output
GDP at Current Prices
Gross Domestic Product (GDP) at current prices registered an increase of 20.4% in 2000compared with 7.1% in 1999.
The value added of the non-financial corporations sector rose by 28.0% in 2000 comparedwith 9.3% a year earlier. This rise was mainly attributable to an increase in the value added ofcrude petroleum and natural gas sector by 86.5%. As a result, the contribution of the non-financialcorporations sector to GDP rose from 68.8% in 1999 to 73.2% in 2000.
Similarly, the value added of the financial corporations sector rose by 19.1% in 2000compared with 0.8% in 1999. Local and Offshore financial institutions grew by 20.9% and 19.0%respectively in 2000. The share of this sector in GDP remained relatively unchanged at 21.4% in2000.
On the other hand, growth in the value added of the Government services sectordecelerated from 3.3% in 1999 to 1.2% in 2000. Accordingly, the Government services sector’scontribution to GDP fell from 12.5% to 10.5%.
CHART 2-1: BAHRAIN - ECONOMIC GROWTH RATES
Perc
ent
Current Prices Constant Prices
22.020.018.016.014.012.010.0
8.06.04.02.00.0
-2.0-4.0
1998 1999 2000

Source: Ministry of Finance and National Economy.
5
1- The Non-Financial Corporations 1712.9 2193.0 9.3 28.0 68.8 73.2- Agriculture & Fishing 21.4 22.1 2.1 3.2 0.9 0.7- Mining & Quarrying 453.5 840.8 43.4 85.4 18.2 28.1
Crude Petroleum & Natural Gas 448.1 835.7 43.9 86.5 18.0 27.9- Manufacturing 306.7 342.8 3.6 11.8 12.3 11.4- Electricity & Water 44.9 42.8 2.5 (4.7) 1.8 1.4- Construction 105.6 107.0 11.8 1.3 4.2 3.6- Trade 207.8 240.7 (11.6) 15.8 8.3 8.0- Hotels & Restaurants 56.4 59.6 4.6 5.7 2.3 2.0- Transport and Communication 196.2 210.9 1.8 7.5 7.9 7.0- Social & Personal Services 51.6 53.2 2.9 3.0 2.1 1.8- Real Estate & Business Activities 268.7 272.9 2.0 1.6 10.8 9.1
2- The Financial Corporations 537.2 640.0 0.8 19.1 21.6 21.4- Financial Institutions 138.6 167.6 (1.2) 20.9 5.6 5.6- Offshore Financial Institutions 289.6 344.5 9.0 19.0 11.6 11.5- Insurance 109.0 127.9 (14.1) 17.4 4.4 4.3
3- Government Services 311.1 314.9 3.3 1.2 12.5 10.5
4- Education Services 106.1 109.2 6.1 2.9 4.3 3.6
5- Health Services 58.8 59.3 2.8 0.8 2.4 2.0
6- Private Non-Profit Institutions 1.2 1.5 3.4 25.7 0.0 0.0Serving Households
7- Households with Employed Persons 17.6 18.3 8.8 3.7 0.7 0.6
8- Minus Financial Intermediation (312.8) (395.2) (0.2) 26.3 (12.6) (13.2)Services Indirectly Measured
9- GDP at Producer Prices 2432.2 2941.1 7.5 20.9 97.7 98.1
10- Import Duties 57.1 55.8 (9.9) (2.3) 2.3 1.9
TOTAL GDP 2489.3 2996.9 7.1 20.4 100.0 100.0
Table 2.1: Gross Domestic Product at Current Prices
BD MillionsAnnual Relative Share
Growth (%) (%)
1999 2000 1999 2000 1999 2000Sectors
GDP at Constant Prices
In 2000, GDP at constant prices (1989=100) increased by 5.3% compared with 4.3% in 1999.
The value added of the non-financial corporations sector increased by 5.2% in 2000compared with 5.4% in 1999. This rise was a result of an increase in crude petroleum and naturalgas by 11.2%. The contribution of this sector to GDP remained relatively unchanged at 70.1%during 1999 and 2000.

6
Similarly, the value added of the financial corporations sector grew by 14.6% in 2000compared with 0.1% in 1999. This was due to a rise in both local and offshore financial institutionsby 7.9% and 16.6% respectively in 2000. The contribution of this sector to GDP rose from 17.4% in1999 to 19.0% in 2000.
Growth in the value added of the government services sector decreased from 2.1% in 1999to 1.3% in 2000. The share of this sector in GDP fell from 11.2% in 1999 to 10.8% in 2000.
Source: Ministry of Finance and National Economy.
1-The Non-Financial Corporations 1736.1 1825.9 5.4 5.2 70.2 70.1- Agriculture & Fishing 22.5 23.8 2.7 6.0 0.9 0.9- Mining & Quarrying 419.5 466.3 11.7 11.1 17.0 17.9
Crude Petroleum & Natural Gas 417.2 464.1 11.7 11.2 16.9 17.8- Manufacturing 303.9 311.4 6.3 2.5 12.3 12.0- Electricity & Water 50.7 53.4 0.2 5.3 2.1 2.1- Construction 98.0 99.3 16.9 1.4 4.0 3.8- Trade 323.7 332.1 (6.2) 2.6 13.1 12.8- Hotels & Restaurants 55.1 59.1 4.7 7.1 2.2 2.3- Transport and Communication 194.2 206.0 8.3 6.1 7.9 7.9- Social & Personal Services 42.7 43.8 4.9 2.6 1.7 1.7- Real Estate & Business Activities 225.9 230.8 6.4 2.2 9.1 8.9
2- The Financial Corporations 431.2 494.3 0.1 14.6 17.4 19.0- Financial Institutions 136.2 146.9 (0.4) 7.9 5.5 5.6- Offshore Financial Institutions 205.1 239.3 6.9 16.6 8.3 9.2- Insurance 89.9 108.1 (12.0) 20.3 3.6 4.2
3- Government Services 277.7 281.4 2.1 1.3 11.2 10.8
4- Education Services 83.0 90.0 5.5 8.4 3.4 3.5
5- Health Services 49.7 50.8 1.4 2.2 2.0 1.9
6- Private Non-Profit Institutions 1.0 1.2 (1.1) 18.8 0.0 0.0Serving Households
7- Households with Employed Persons 15.9 16.5 3.7 3.7 0.6 0.6
8- Minus Financial Intermediation (173.3) (208.5) (5.0) 20.3 (7.0) (8.0)Services Indirectly Measured
9- GDP at Producer Prices 2421.3 2551.5 4.7 5.4 97.9 98.0
10- Import Duties 50.6 51.7 (12.1) 2.2 2.1 2.0
TOTAL GDP 2471.9 2603.3 4.3 5.3 100.0 100.0
Table 2.2: Gross Domestic Product at Constant 1989 Prices 1989 = 100
BD MillionsAnnual Relative Share
Growth (%) (%)
1999 2000 1999 2000 1999 2000Sectors

7
Description
120
100
80
60
40
20
01998 1999 2000
U.S
. Bar
rels
(M
illio
ns)
Crude Oil Production and Refining
Crude oil production from the Bahrain field rose from 13.7 million barrels in 1999 to 13.8 million barrels in 2000, an increase of 0.7%. On the other hand, imports of crude oil registereda decrease of 2.4% in 2000 to reach 80.3 million barrels.
Refined oil production fell by 2.1 million barrels, or by 2.2% to reach 93.7 million barrelsin 2000. Similarly, exports of oil products fell by 5.0% to reach 91.0 million barrels.
Table 2.3: Selected Oil Statistics
Bahrain Crude Oil Production 13,677 13,766 -0.5 0.7Imports of Saudi Arabian Crude 1/ 82,310 80,296 6.8 -2.4Refined Oil Production 95,843 93,737 5.8 -2.2Local Sales of Refined Products 4,409 4,694 -4.9 6.5Exports 2/ 95,766 90,963 5.2 -5.0
U.S. Barrels Percentage(Thousands) Change
1999 2000 1999 2000
Source: Ministry of Oil and Industry.
1/ Imported crude used in refined products for export.
2/ Includes exports by Bapco and Banagas.
Gas Production and Utilisation
Bahrain’s gas production increased by 1.4% to reach 412.0 billion cubic feet in 2000,compared with 406.4 billion cubic feet in 1999. This rise was attributable to an increase in naturalgas production by 2.0%.
Aluminium Bahrain (Alba) remained the single largest consumer of gas, accounting for26.2% of total gas utilisation in 2000. Oil field injection accounted for 24.7%, while the powerstations, Gulf Petrochemical Industries Company (GPIC), and the refinery accounted for 24.5%,10.0% and 8.8% of total utilisation respectively.
CHART 2-2: BAHRAIN - SELECTED OIL STATISTICS
Crude Oil Production Refined Oil Production Exports

8
Items
Table 2.4: Gas Production and Utilisation
Gas Production 406.4 412.0 3.4 1.4 100.0 100.0Associated Gas 96.0 95.3 5.5 -0.7 23.6 23.1Natural Gas 310.4 316.7 2.8 2.0 76.4 76.9
Gas Utilisation 406.4 412.0 3.4 1.4 100.0 100.0Power Stations 93.9 101.1 6.9 7.7 23.1 24.5Alba 109.3 108.0 -2.0 -1.2 26.9 26.2Refinery 35.7 36.3 0.8 1.7 8.8 8.8Oil Field Injection 100.1 101.6 3.3 1.5 24.6 24.7GPIC 43.5 41.0 7.4 -5.7 10.7 10.0Others 23.9 24.0 14.9 0.4 5.9 5.8
Billions of Percentage Cubic Feet Change
Relative Share
1999 2000 1999 2000 1999 2000
Source: Ministry of Oil and Industry.
600
500
400
300
200
100
01998 1999 2000
CHART 2-3: BAHRAIN - ALBA’S ALUMINIUM PRODUCTION AND EXPORTS
ALBA Production Exports
Met
ric
Tonn
es (
Tho
usan
ds)
Aluminium Production
Alba production registered an increase of 1.7%, or 8.8 thousand metric tonnes, to reach509.7 thousand metric tonnes in 2000.

9
CHART 2-4: BAHRAIN - GOVERNMENT FINANCE
1200
1000
800
600
400
200
01998 1999 2000
BD
Mill
ions
Revenue Expenditure
2-2 Government Finance
The fiscal account registered a surplus of BD 5.3 million in 2000, or 0.2% of GDP, comparedwith a deficit of BD 63.4 million in 1999, or 2.5% of GDP.
Revenues
Total revenue increased by BD 386.9 million or 58.6%, from BD 660.4 million in 1999 to BD 1,047.3 million in 2000.
Oil and gas revenue increased by BD 393.2 million or 105.9%, to BD 764.6 million in 2000.As a result, the share of oil and gas revenue in total revenue increased from 56.2% in 1999 to 73.0%in 2000.
Non-oil revenue fell by 2.2%, to BD 282.7 million in 2000. As a result, the share of Non-oilrevenue in total revenue decreased from 43.8% in 1999 to 27.0% in 2000.
Expenditures
Total expenditure rose by BD 63.2 million or 8.7%, from BD 723.8 million in 1999 to BD 787.0 million in 2000.
Current expenditure rose from BD 596.0 million in 1999 to BD 664.1 million in 2000, or by11.4%. This rise reflected increases in all current expenditure chapters over the year, particularly intransfers, grants, subsidies and repayment of loan interest and manpower. Current expenditurerepresented 84.4% of total expenditure in 2000.
However, projects expenditure fell by 3.8%, from BD 127.8 million in 1999 to BD 122.9million in 2000.
Total amount reserved for sovereign and strategic projects was BD 255.0 million in2000.

10
A. Total Revenue 660.4 1047.3 19.2 58.6 100.0 100.0Oil & Gas Revenue 371.4 764.6 43.2 105.9 56.2 73.0Non-Oil Revenue 289.0 282.7 -1.9 -2.2 43.8 27.0
Taxation & Fees 109.5 114.7 -3.6 4.7 16.6 11.0Government Goods & Services 98.2 95.4 3.5 -2.8 14.9 9.1Investments & Govt. Properties 38.3 40.3 -10.5 5.2 5.8 3.8Grants 37.6 18.8 0.0 -50.0 5.7 1.8Sale of Capital Assets 0.2 0.3 100.0 50.0 0.0 0.0Miscellaneous 5.2 13.2 -8.8 153.8 0.8 1.3
B. Total Expenditure 723.8 787.0 2.7 8.7 100.0 100.0Current Expenditure 596.0 664.1 6.4 11.4 82.3 84.4Manpower 388.8 396.4 2.3 1.9 53.7 50.4Services 58.2 58.9 12.1 1.2 8.0 7.5Consumables 30.6 33.7 14.2 10.1 4.2 4.3Assets 7.7 7.7 42.6 0.0 1.1 1.0Maintenance 24.5 24.2 14.5 -1.2 3.4 3.1Transfers 46.9 87.5 12.7 86.6 6.5 11.1Grants, Subsidies and Repaymentof Loan Interest 39.3 55.7 19.8 41.7 5.4 7.0Projects Expenditure 127.8 122.9 -11.5 -3.8 17.7 15.6Sovereign and Strategic Projects 255.0
C. Surplus/Deficit -63.4 5.3
BD MillionsAnnual Relative Share
Growth (%) (%)
1999 2000 1999 2000 1999 2000Description
Table 2.5: Government Finance
Source: Ministry of Finance and National Economy.

11
Table 2.6: Consumer Price Index (CPI)
(1994 - 1995 = 100)
Groups 1999 2000 Annual Change %
1. Food, Beverages and Tobacco 103.1 101.8 -1.3
2. Ready-made Clothes, Textiles and Foot-wear 101.8 100.3 -1.5
3. House-Related Expenses, Fuel Lighting & Water 100.5 99.6 -0.9
4. Goods for Home Services 96.3 95.0 -1.3
5. Transportation Services 100.8 101.4 0.6
6. Education 127.6 127.4 -0.2
7. Medical Care & Health Services 107.8 108.4 0.6
8. Service Requirements of Personal Care 89.9 90.0 0.1
9. Culture, Entertainment and Recreation 112.0 111.7 -0.3
General C.P.I. 102.8 102.1 -0.7
2-3 Consumer Price Index
Bahrain’s Consumer Price Index (CPI), (base year 1994-1995 =100), reached an indexlevel of 102.1 in 2000, compared with 102.8 in 1999, a decrease of 0.7%.
An analysis of the main goods and services groups within the CPI reveals a slight increasein the average prices of three main groups during 2000, namely, the transportation services groupand medical and health services group by 0.6% each, and the service requirements of personal caregroup by 0.1%.
In contrast, average prices of the remaining groups decreased by varying degrees. Thisincluded the ready-made clothes, textiles & foot-wear group by 1.5%, the goods for home servicesgroup by 1.3%, the food, beverages & tobacco group by 1.3%, and house-related expenses, fuellighting & water group by 0.9%.
Source: Central Statistics Organisation

12
2-4 Bahrain Stock Exchange
The Bahrain index closed at 1,805.8 points at end-2000, a decrease of 18.4% compared withend-1999.
The main indicators for the market indicate a fall in activity during 2000. The volume ofshares traded fell from 536.3 million shares in 1999 to 422.1 million shares in 2000, or by 21.3%,and their value fell from BD 168.0 million to BD 92.5 million, or by 44.9%. The number oftransactions fell from 18,145 in 1999 to 11,906 in 2000, or by 34.4%. Also, the market capitalizationof listed companies fell from BD 2.7 billion at end-1999 to BD 2.5 billion at end-2000.
An analysis by sector reveals that the shares traded in the commercial banking sectoramounted to BD 41.1 million or 44.4% of the value of total shares traded. Shares traded in theinvestment sector amounted to BD 27.3 million or 29.5% of the value of total shares traded,followed by the services sector with BD 17.2 million or 18.6% of the total.
Table 2.7: Trading Activity of the Bahrain Stock Exchange
Items 1998 1999 2000Annual change %
1999 2000
Volume of shares traded (million) 619.7 536.3 422.1 -13.6 -21.3
Value of shares traded (BD million) 217.3 168.0 92.5 -22.7 -44.9
Number of Transactions 24,061 18,145 11,906 -24.6 -34.4
Bahrain Index (points) 2,188.9 2,212.2 1,805.8 1.1 -18.4
Number of listed companies 38 37 36 -2.6 -2.7
Market capitalisation of listed companies (BD billion) 2.6 2.7 2.5 3.8 -7.5
Source: Bahrain Stock Exchange

13
CHAPTER THREE
FOREIGN TRADE AND BALANCE OF PAYMENTS
3-1 Trade Balance
The trade balance registered a surplus for the second consecutive year, rising from BD 166.5 million in 1999 to BD 409.4 million in 2000. The value of both total exports and importsrose during the year. The oil trade balance surplus increased from BD 491.0 million in 1999 to BD 727.6 million in 2000, or by 48.2%, which was mainly due to a rise in oil prices. In addition, thenon-oil trade balance deficit fell from BD 324.5 million to BD 318.2 million, or by 1.9%.
Exports
The value of total exports rose from BD 1,556.8 million in 1999 to BD 2,143.4 million in2000, an increase of 37.7%. Oil exports rose by 56.1%, from BD 960.1 million in 1999 to BD 1,498.9million in 2000. As a result, the share of oil exports in total exports increased from 61.7% to 69.9%.Similarly, the value of non-oil exports rose by 8.0%, from BD 596.7 million in 1999 to BD 644.5million in 2000, while its share in total exports fell from 38.8% to 30.1%.
An analysis by the main commodity groups in 2000 shows that exports of mineralproducts comprised 73.6% of total exports, followed by exports of base metals and articles thereofwith 14.5%, and textiles and textile articles with 5.9%.
Imports
The value of total imports increased by 24.7% to reach BD 1,734.0 million in 2000 comparedwith BD 1,390.3 million in 1999. Oil imports increased from BD 469.1 million in 1999 to BD 771.3 million in 2000, an increase of 64.4%. As a result, the share of oil imports in totalimports rose from 33.7% to 44.5%. In addition, the value of non-oil imports rose from BD 921.2million in 1999 to BD 962.7 million in 2000, or by 4.5%, while its share in total imports fell from66.3% to 55.5%.
An analysis by the main commodity groups shows that imports of mineral productsrepresented 48.3% of total imports, followed by machinery, appliances and electrical equipmentwith 11.2%, and products of chemical and allied industries with 8.1%.
CHART 3-1: BAHRAIN - FOREIGN TRADE
2,500
2,000
1,500
1,000
500
01998 1999 2000
BD
Mill
ions
Total Exports Total Imports

Total Exports 1,556.8 2,143.4 26.6 37.7 100.0 100.0Oil Exports 960.1 1,498.9 50.7 56.1 61.7 69.9Non-Oil Exports 1/ 596.7 644.5 0.7 8.0 38.3 30.1
Total Imports 1,390.3 1,734.0 3.7 24.7 100.0 100.0Oil Imports 469.1 771.3 71.2 64.4 33.7 44.5Non-Oil Imports 921.2 962.7 -13.7 4.5 66.3 55.5
Trade Balance 166.5 409.4
14
Table 3.1: Foreign Trade
1999 2000* 1999 2000 1999 2000Main Group
BD Millions Annual Change (%) Relative Share (%)
Source: Central Statistics Organisation* Provisional data.1/ Includes re-exports.
3-2 Direction of Non-Oil Trade
The year 2000 witnessed an increase in the value of non-oil exports to Bahrain’s maintrading partners, with the exception of Arab countries. Overall, there were no significant changesin the non-oil trade balance deficit with Asia and Europe. The non-oil trade balance surplus withthe Arab countries fell by 60.5%, whereas the non-oil trade balance with the Americas switchedfrom a deficit of BD 32.7 million in 1999 to a surplus of BD 18.9 million in 2000.
300
200
100
0
BD
Mill
ions
Exports Imports
Asia Arab Countries Americas Europe Other Countries
CHART 3-2: BAHRAIN - DIRECTION OF NON-OIL TRADE DURING 2000

15
1999 2000*
Exports Imports Balance Exports Imports Balance
Source: Central Statistics Organisation
* Provisional data
CountryGroups
Table 3.2: Direction of Non-Oil Trade(BD Millions)
Arab Countries 218.8 150.0 68.8 187.7 160.5 27.2Africa 3.3 3.3 0.0 5.6 3.7 1.9Asia 195.0 246.1 -51.1 233.3 289.5 -56.2Europe 60.2 284.2 -224.0 60.6 283.2 -222.6Americas 101.1 133.8 -32.7 144.0 125.1 18.9Oceania 12.5 103.0 -90.5 9.6 100.0 -90.4Other Countries 5.8 0.8 5.0 3.7 0.7 3.0
Total 596.7 921.2 -324.5 644.5 962.7 -318.2
3-3 Non-Oil Trade with GCC Countries
Bahrain’s non-oil trade surplus with GCC countries decreased from BD 66.4 million in1999 to BD 19.2 million in 2000, or by 71.1%. This decrease was due to a fall in non-oil exports ofBD 38.7 million, or by 19.4%, together with an increase in non-oil imports of BD 8.5 million, or6.4%. Non-oil exports to GCC countries accounted for 25.0% of Bahrain’s total non-oil exports,while imports from them represented 14.7%.
CHART 3-3: BAHRAIN - DIRECTION OF NON-OIL TRADE
WITH GCC COUNTRIES DURING 2000
100
80
60
40
20
0
BD
Mill
ions
Saudi Arabia U.A.E. Kuwait Qatar Oman
Exports Imports

Kuwait 20.3 5.6 14.7 15.1 6.1 9.0Oman 6.7 3.5 3.2 8.0 4.2 3.8Qatar 36.9 3.5 33.4 13.9 3.4 10.5Saudi Arabia 104.7 81.4 23.3 92.7 85.4 7.3U.A.E. 31.1 39.3 -8.2 31.3 42.7 -11.4
Total 199.7 133.3 66.4 161.0 141.8 19.2
16
Table 3.3: Non-Oil Trade with GCC Countries
(BD Millions)
Source: Central Statistics Organisation
* Provisional data.
Country1999 2000*
Exports Imports Balance Exports Imports Balance
3-4 Balance of Payments
The current account registered a surplus of BD 42.5 million in 2000, compared with adeficit of BD 128.1 million in 1999. This was due to an increase in the trade balance surplus by BD 246.3 million as a result of the increase in oil prices, which led to an increase in oil exports by52.4%. In addition, the net service receipts increased by BD 17.1 million as a result of the growthin the tourism industry in Bahrain. On the other hand, net current transfers and net incomeoutflow increased by BD 64.2 million and BD 28.6 million respectively.
The capital and financial account registered an increase in the foreign assets by BD 59.5million in 2000 compared with an increase in the foreign liabilities by BD 136.0 million in 1999 asa result of the increase in the net outflow of the financial account by BD 78.3 million.
Bahrain overall balance of payments (Reserve Assets) surplus increased from BD 9.6million in 1999 to BD 75.2 million in 2000.

17
Table 3.4: Balance of Payments
Items 1998 19992000
(Prov.)
* Financial transactions. A negative sign means net outflows/increases in external assets.
1. Current Account (a+b+c+d) -292.3 -128.1 42.5a. Goods -10.7 252.7 499.0
Exports 1229.6 1556.8 2143.4- Oil and oil products 664.4 1035.6 1577.8- Non-oil 565.2 521.2 565.6
Imports -1240.3 -1304.1 -1644.4- Oil and oil products -334.9 -528.0 -838.3- Non-oil -905.4 -776.1 -806.1
b. Services (net) 27.4 38.2 55.3- Transportation -62.6 -46.0 -50.4- Travel 84.3 93.7 112.7- Insurance -10.1 -8.6 -9.0- Others 15.8 -0.9 2.0
c. Income (net) -60.9 -110.9 -139.5Investment Income -60.9 -110.9 -139.5
- Direct Investment Income -226.6 -223.8 -252.7- Portfolio Income 193.4 217.1 265.1- Other Investment Income -27.7 -104.3 -151.9
d. Current Transfers (net) -248.1 -308.1 -372.3- Workers’ remittances -272.6 -321.9 -380.8
2. Capital and Financial Account (net) (A+B) 52.3 136.0 -59.5
A. Capital Account 37.6 37.6 18.8- Capital Transfers 37.6 37.6 18.8
B. Financial Account (1+2+3+4)* 14.7 98.4 -78.31. Direct Investment -0.5 109.2 134.6
- Abroad -68.0 -61.4 0.1- In Bahrain 67.5 170.6 134.5
2. Portfolio Investment (net) -380.5 -727.8 74.8
3. Other Investment (net) 389.4 726.6 -212.5
4. Reserve Assets (net) 6.3 -9.6 -75.2
3. Errors and Omissions 240.0 -7.9 17.0
(BD Millions)

18
CHAPTER FOUR
MONEY AND BANKING
4-1 Money Supply and Liquidity
At end 2000, currency in circulation registered an increase of BD 7.7 million, or 6.8%, toreach BD 120.7 million at year end.
M1 (Currency in circulation plus private demand deposits) increased by BD 19.5 million,or 4.6%, to reach BD 445.7 million at end-2000.
As a result of the increase in M1 and growth in private sector savings and time deposits byBD 180.5 million, M2 (M1 plus private sector savings and time deposits) rose by 10.2%, from BD 1,956.7 million at end-1999 to BD 2,156.7 million at end-2000. M3 (M2 plus governmentdeposits) rose by 9.0% to reach BD 2,602.6 million at end-2000 compared with BD 2,388.7 millionat end-1999.
ItemsYear-end
Change(2000 vs. 1999)
Table 4.1: Domestic Liquidity
(BD Millions)
1998 1999 2000 Absolute Percent
Currency in Circulation 93.3 113.0 120.7 7.7 6.8M1 365.6 426.2 445.7 19.5 4.6M2 1,876.2 1,956.7 2,156.7 200.0 10.2M3 2,299.3 2,388.7 2,602.6 213.9 9.0
3,000
2,500
2,000
1,500
1,000
500
01998 1999 2000
BD
Mill
ions
M1 M2 M3
CHART 4-1: BAHRAIN - DOMESTIC LIQUIDITY

19
Table 4.2: Factors Affecting Domestic Liquidity(BD Millions)
Factors
Year-end Changes
Factors Affecting Domestic Liquidity
Changes in the major factors affecting domestic liquidity over the period 1998-2000 areillustrated in Table 4.2.
(1999 (20001998 1999 2000 vs. vs.
1998) 1999)
A. Total Domestic Liquidity (M3) 2,299.3 2,388.7 2,602.6 89.4 213.9
B. Factors Affecting Liquidity
1. Net Foreign Assets (a+b) 1,000.6 807.5 1,122.1 -193.1 314.6(a) BMA 383.1 391.9 465.2 8.8 73.3(b) Commercial Banks 617.5 415.6 656.9 -201.9 241.3
2. Domestic Claims (a+b+c) 1,298.7 1,581.2 1,480.5 282.5 -100.7(a) Claims on government 267.9 336.2 343.0 68.3 6.8(b) Claims on private sector 1/ 1,160.0 1,302.6 1,380.5 142.6 77.9(c) Other assets (net) -129.2 -57.6 -243.0 71.6 -185.4
Total domestic liquidity (M3) registered an increase of BD 213.9 million, or 9.0%, at end-2000 following a rise of BD 89.4 million, or 3.9%, at end-1999.
Net foreign assets registered a rise of BD 314.6 million, or 39.0%, at end-2000. This was aresult of an increase in commercial banks’ and BMA’s net foreign assets by BD 241.3 million andBD 73.3 million respectively.
Total domestic assets fell by BD 100.7 million at end-2000, or by 6.4%. This was a result ofa decrease in other assets (net) of BD 185.4 million. However, claims on both the private sectorand the government increased by BD 77.9 million and BD 6.8 million respectively.
1/ Loans and holdings of securities.

20
4-2 The Banking System
The consolidated balance sheet of the banking system in Bahrain (commercial banks,offshore banking units, and investment banks) rose from US$ 102.1 billion at end-1999 to US$ 106.4billion at end-2000, an increase of 4.2%.
Offshore banking units accounted for 87.4% of the total balance sheet of the bankingsystem at end-2000, while commercial and investment banks accounted for 9.4% and 3.2%respectively.
Table 4.3: Consolidated Balance Sheet of the Banking System
(US$ Billions)
CHART 4-2: BAHRAIN - CONSOLIDATEDBALANCE SHEET OF THE BANKING SYSTEM
120
100
80
60
40
20
0
1998 1999 2000
US$
Bill
ions
ItemsEnd-1999 End-2000
Absolute % Absolute %
AnnualChange
%
Commercial Banks 9.9 9.7 10.0 9.4 1.0
Offshore Banking Units 88.2 86.4 93.0 87.4 5.4
Investment Banks 4.0 3.9 3.4 3.2 -15.0
Total 102.1 100.0 106.4 100.0 4.2
21
4-3 Commercial Banks
At end-2000, Bahrain’s commercial banking sector comprised 19 Full Commercial Banks(FCBs), two of which were Islamic banks.
The consolidated balance sheet of the commercial banks continued its upward trendin 2000 to reach BD 3,768.1 million, as against BD 3,745.5 million at end-1999, an increaseof 0.6%.
Foreign Assets and Liabilities
Total foreign assets of the commercial banks increased by 0.3%, from BD 1,282.4 million atend-1999 to BD 1,285.9 million at end-2000. During the same period, total foreign liabilities fell by27.4%, from BD 866.8 million to BD 629.0 million, this was due to a decrease in transations betweensome resident banks with their Head Offices and affiliates abroad. As a result, total net foreignassets rose by BD 241.3 million, or 58.1% to reach BD 656.9 million at end-2000.
Domestic Deposits
(a) Private Sector Deposits
Total private sector deposits (Bahraini Dinars plus other currencies) amounted to BD 2,009.7 million at end-2000, an increase of BD 214.4 million, or 11.9%, over end-1999. Total time,savings, and demand deposits increased by 15.4%, 6.2% and 3.7% respectively.
Private sector deposits denominated in Bahraini Dinars were BD 1,207.1 million at end-2000, compared with BD 1,089.2 million at end-1999, an increase of 10.8%. In addition, depositsin other currencies increased from BD 706.1 million at end-1999 to BD 802.6 million at end-2000,or by 13.7%.
(b) Government Deposits1
Government deposits (Bahraini Dinars plus other currencies) amounted to BD 436.7million at end-2000, compared with BD 431.0 million at end-1999, an increase of 1.3%. This increasewas a result of a rise in Bahraini Dinar deposits of BD 7.2 million, coupled with a fall in depositsin other currencies by BD 1.5 million.
1Includes the Central Government and the Social Insurance System.

22
Table 4.4: Domestic Deposits at Commercial Banks (Excluding Interbank Deposits)
(BD Millions)
ItemsEnd-1999 End-2000
BD OC Total BD OC Total %
1. Private Sector Deposits 1,089.2 706.1 1,795.3 1,207.1 802.6 2,009.7 11.9Demand Deposits 237.7 75.5 313.2 260.1 64.9 325.0 3.8Time Deposits 578.7 623.0 1,201.7 658.8 728.2 1,387.0 15.4Savings Deposits 272.8 7.6 280.4 288.2 9.5 297.7 6.2
2. Government Deposits 156.1 274.9 431.0 163.3 273.4 436.7 1.3
Total Domestic Deposits 1,245.3 981.0 2,226.3 1,370.4 1,076.0 2,446.4 9.9
Credit
Outstanding credit facilities extended by commercial banks to the different sectors of thedomestic economy amounted to BD 1,421.5 million at end-2000, compared with BD 1,349.9million at end-1999, an increase of 5.3%.
(a) Business Sectors
Credit facilities extended to the business sectors rose by BD 39.8 million, or 5.1%, from BD 781.4 million at end-1999 to BD 821.2 million at end-2000. Credit extended to the trade andconstruction & real estate sectors increased by 11.0% and 7.7% respectively, while credit extendedto the manufacturing sector decreased by 5.1%. The business sector’s share of total credit facilitiesextended was 57.8% at end-2000.
CHART 4-3: BAHRAIN - FCB DEPOSIT TRENDS
1,600
1,400
1,200
1,000
800
600
400
200
01998 1999 2000
BD
Mill
ions
Private Demand Deposits
Private Time Deposits
Private SavingsDeposits
Government Deposits
(2000 vs.1999)

23
Table 4.5: Outstanding Credit to Non-Bank Residents by Economic Sector
(BD Millions)
CHART 4-4: BAHRAIN - OUTSTANDING
COMMERCIAL BANK CREDIT TO RESIDENTS IN 2000
Others10%
Manufacturing14%
Construction12%
Trade22%Government
7%
Personal35%
(b) Personal Sector
Credit facilities extended to the personal sector increased by BD 31.9 million, or 6.8%, fromBD 467.6 million at end-1999 to BD 499.5 million at end-2000. The personal sector’s share of totalcredit facilities extended was 35.1% at end-2000.
(c) Government
Credit to the government amounted to BD 100.8 million at end-2000. The Governmentsector’s share of total credit facilities extended was 7.1% at end-2000.
Sectors
Year-endChange
(2000 vs. 1999)
1999 2000
Absolute % Absolute % Absolute %
1. Business 781.4 57.9 821.2 57.8 39.8 5.1Manufacturing 210.1 15.6 199.4 14.0 -10.7 -5.1Mining and Quarrying 0.5 0.0 0.2 0.0 -0.3 -60.0Agriculture, Fishing and Dairy 4.1 0.3 4.6 0.3 0.5 12.2Construction & Real Estate 158.7 11.8 170.9 12.0 12.2 7.7Trade 278.8 20.6 309.4 21.8 30.6 11.0Non-Bank Financial 43.9 3.3 45.4 3.2 1.5 3.4Other Business 85.3 6.3 91.3 6.4 6.0 7.0
2. Government 100.9 7.5 100.8 7.1 -0.1 -0.1
3. Personal 467.6 34.6 499.5 35.1 31.9 6.8
Total 1,349.9 100.0 1,421.5 100.0 71.6 5.3

24
BD Interest Rates
(a) Deposits
The weighted average time deposit rate rose from 5.24% at end-1999 to 5.45% at end-2000.Meanwhile, the weighted average savings rate remained stable at 2.22%.
(b) Loans
The weighted average interest rate on business loans rose from 8.99% at end-1999 to 9.04%at end-2000. The interest rate on personal loans rose from 13.09% to 14.57%.
Table 4.6: Interest Rates on BD Deposits & Loans
2000Items
End End1998 1999 1st 2nd 3rd 4th
Quarter Quarter Quarter Quarter
1. DepositsTime 1 / 4.39 5.24 5.71 6.16 5.92 5.45Savings 2.29 2.22 2.23 2.22 2.22 2.22
2. LoansBusiness 8.60 8.99 8.61 9.23 9.40 9.04Personal 12.72 13.09 13.04 13.93 14.04 14.57
1/ Time deposits of 3-12 months.
4-4 Offshore Banking Units
The number of licensed Offshore Banking Units (OBUs) totaled 51 at end-2000. Theaggregate assets/liabilities of the OBUs increased from US$ 88.2 billion at end-1999 to US$ 93.0 billion at end-2000, or 5.4%.
Foreign Assets and Liabilities
Total foreign assets of the OBUs increased by 5.3% to reach US$ 88.8 billion at end-2000,compared with US$ 84.3 billion at end-1999. Total foreign liabilities also increased from US$ 82.3billion at end-1999 to US$ 87.4 billion at end-2000, an increase of 6.2%. As a result, net foreignassets of the OBUs fell to US$ 1.4 billion at end-2000.

25
Table 4.7: Geographical Classification of OBU Assets/Liabilities at End-2000
Table 4.8: Currency Structure of OBU Assets/Liabilities at End-2000
Arab Countries 30.6 32.9 39.0 41.9
Asia 10.5 11.3 15.1 16.3
Americas 20.0 21.5 10.5 11.3
Western Europe 29.8 32.0 28.0 30.1
Others 2.1 2.3 0.4 0.4
Total 93.0 100.0 93.0 100.0
Assets LiabilitiesCountries
US$ billion % of total US$ billion % of total
Assets LiabilitiesCurrencies
US$ billion % of total US$ billion % of total
A classification by currencies indicates that the U.S. dollar, GCC currencies, and the Euroaccounted for 74.3%, 10.0% and 7.7% of total assets, and 71.0%, 11.2% and 7.4% of total liabilitiesrespectively at end-2000.
USD 69.1 74.3 66.0 71.0
GCC Currencies 9.3 10.0 10.4 11.2
Euro 7.2 7.7 6.9 7.4
Others 7.4 8.0 9.7 10.4
Total 93.0 100.0 93.0 100.0
The geographical distribution of OBU assets and liabilities at end-2000 is illustrated inTable 4.7

26
4-5 Investment Banks
The number of licensed Investment banks (IBs) at end-2000 totaled 31. The aggregateassets/liabilities of the IBs decreased by 15.0%, from US$ 4.0 billion at end-1999 to US$ 3.4 billionat end-2000.
Foreign Assets and Liabilites
Total foreign assets of the IBs decreased from US$ 3.3 billion at end-1999 to US$ 2.8 billionat end-2000, or by 15.2%. Similarly, total foreign liabilities decreased from US$ 2.9 billion at end-1999 to US$ 2.3 billion at end-2000, or by 20.7%. As a result, total net foreign assets of the IBsamounted to US$ 0.5 billion at end-2000.
The geographical distribution of IB assets and liabilities at end-2000 is illustrated in Table 4.9.
Table 4.9: Geographical Classification of IB Assets/Liabilities at End-2000
Arab Countries 1,239.6 36.6 2,555.8 75.6
Asia 115.2 3.4 34.7 1.0
Americas 780.4 23.1 347.6 10.3
Western Europe 1,243.3 36.8 409.9 12.1
Others 3.3 0.1 33.8 1.0
Total 3,381.8 100.0 3,381.8 100.0
Assets LiabilitiesCountries
US$ million % of total US$ million % of total
A classification by currencies indicates that the U.S. dollar and GCC currencies accountedfor 85.6% and 11.7% of total assets, and 88.8% and 5.3% of total liabilities respectively at end-2000.
Table 4.10 : Currency Structure of IB Assets/Liabilities at End-2000
Assets LiabilitiesCurrencies
US$ million % of total US$ million % of total
USD 2,895.6 85.6 3,002.7 88.8
GCC Currencies 394.8 11.7 178.1 5.3
Others 91.4 2.7 201.0 5.9
Total 3,381.8 100.0 3,381.8 100.0

Banking SectorCommercial Banks 2,042 315 2,357 2,015 290 2,305Offshore Banking Units 958 462 1420 996 482 1,478Investment Banks 569 284 853 648 277 925Representative Offices 23 39 62 32 54 86Total 3,592 1,100 4,692 3,691 1,103 4,794
Financial SectorMoney Changers 75 163 238 122 186 308Money Brokers 38 28 66 37 26 63Inv. Advisory & Other 31 41 72 31 33 64Financial ServicesTotal 144 232 376 190 245 435
Grand Total 3,736 1,332 5,068 3,881 1,348 5,229
27
4-6 Employment in the Banking & Financial Sector
Total employment in the banking and financial sector rose from 5,068 at end-1999 to 5,229at end-2000, an increase of 3.2%. Bahrainis made up 74.2% of the total number of employees in thebanking and financial sector at end-2000.
The Banking Sector
Total employment in the banking sector (commercial banks, offshore banking units,investment banks and representative offices) increased by 2.2%, to reach 4,794 at end-2000compared with 4,692 at end-1999. Bahrainis made up 77.0% of the total.
Commercial banks accounted for 48.0% of the total employment in the banking sector,while offshore banking units, investment banks and representative offices accounted for 30.8%,19.4% and 1.8% respectively.
The Financial Sector
The financial sector consists of money changers, money brokers and investment advisory& other financial services.
Total employment in the financial sector was 435 at end-2000, compared with 376 at end-1999, an increase 15.7%. Bahrainis accounted for 43.7% of the total employment.
Table 4.11 : Employment in the Banking & Financial Sector 1999 - 2000
End - 1999 End - 2000Sectors
Bahraini Non TotalBahraini
Bahraini Non TotalBahraini

28
CHAPTER FIVE
BMA OPERATIONS, ACTIVITIES, STATUTORYACCOUNTS AND REGULATIONS
ACCOUNTS:
Statutory Accounts
The total assets/liabilities of the Agency increased from BD 560.9 million at end-1999 to BD 575.4 million at end-2000.
On the assets side, holdings of foreign exchange and other assets rose by BD 110.6 millionand BD 9.8 million respectively, while claims on Bahrain-based banks fell by BD 106.1 million.
On the liabilities side, notes & coins in circulation decreased by BD 6.1 million to reach BD 154.2 million at end-2000, while Bahraini Dinar deposits rose by BD 3.8 million to reach BD 110.9 million.
The Agency’s net profit for the year 2000 was BD 24.5 million, compared with BD 18.1million a year earlier.
ADMINISTRATION:
Training and Career Development Unit
The Agency continued its efforts to enhance the capabilities of its staff through internaland external training courses as well as field tours in order to expose them to the latestadministrative, financial, banking and accounting advances.
A number of Agency staff were enrolled, during the year, in a one-year course leading tothe CPA Certificate. Also, a practical training course for a period of 6 months was arranged for onestaff member at the International Monetary Fund. Another overseas training opportunity wasmade available for two staff members who participated in the Executive Management Programmeof Dardin University, USA, in association with the Bahrain Institute of Banking and FinancialStudies.
In addition, the Agency pursued its training objectives by sending a number of staff tonumerous courses, in various fields, including computer technologies and data processing,money laundering, forgery and fraud. Furthermore, a number of staff enrolled at the BahrainUniversity to enhance their academic standards and language skills in the areas of finance,banking, computer studies and the English language.
Personnel Division
During 2000, nine employees were recruited by the Agency. The total number of Agencystaff at end-2000 was 204.

29
Public Relations Division
The Public Relations Division organized a number of economic conferences and eventsunder the sponsorship of the Agency. This included the Organisation of Islamic BankingProfession Conference, the Gulf Economic & Investment Conference, a Conference on Internet andE-Commerce in Financial Services, and the 2000 World Islamic Banking Conference.
The Division also arranged visits to the Agency’s Coin Museum for central bankgovernors and senior government officials visiting Bahrain. In addition, visits to the Agency bystudents from the University of Bahrain, Bahrain Institute of Banking & Finance, and governmentand private schools were arranged to brief them on Agency’s activities and functions.
During the year, the Division published four issues of the quarterly news bulletin"Money".
BANKING CONTROL:
Banking Inspection
The Banking Inspection Directorate conducted a number of risk-focused inspections ofbanks and financial institutions licensed by the Agency. These inspections were conducted withthe aim of ensuring the soundness of the respective bank’s systems of internal control, and that allapplicable regulations issued by the Agency were properly observed. The outcome of eachinspection was discussed with the management of the relevant institution.
The Directorate collaborated with various ministries to prepare for the mutual evaluationvisit conducted by the Financial Action Task Force (FATF) delegation during June 2000. TheDirectorate attended the FATF meeting held in Madrid during September 2000 to discuss thefindings of the FATF report. The Directorate also completed the annual FATF financial and legalquestionnaire. The Directorate participated with other officials from various ministries in themembership of a committee created to review the final draft of the law for the prevention andprohibition of money laundering.
Representatives from the Directorate participated in the E-Commerce Steering Committeeand E-Commerce working groups, to prepare the regulations and guidelines for E-Commerce inBahrain. Directorate officials also attended the UN Expert visit held on 29th July 2000 regardingE-Commerce.
Banking Supervision
During the year, the Banking Supervision Directorate pursued its responsibilities andcontinued to supervise those banks under its jurisdiction through a continuous supervisoryapproach. The Directorate conducted its prudential meetings with the management of each bankin Bahrain in the presence of their external auditors. Discussions covered Bank’s Strategies,Capital Adequacy, Profitability, Asset Quality, Liquidity, Operational Risk, Transparency,Operations of Subsidiaries and Overseas Branches, Reporting to BMA, Internal Controls andCompetence of management of banks. At the end of the year the Directorate scheduled theprudential meetings for the year 2001.

30
The Directorate has decided that in respect of the Quarterly Prudential Returns as endingon 30th June, 2000 and thereafter, or banks external auditors should formally review these returnsto confirm to the Agency that they are being completed in accordance with the Agency’sguidelines.
The Directorate also reviewed with the banks and their external auditors the effect ofInternational Accounting Standard No. 39 on a banks financial positions and the steps and actionsthat the banks had taken in implementing the standard with effect from 1st January, 2001. In thiscontext, the Directorate commissioned a consultant to update the Prudential Informational Reportto comply with the IAS 39.
Currently, the Directorate is studying certain amendments to policy issues such as thecapital adequacy framework, connected exposures and concentration guidelines.
The Directorate participated in the meetings of the GCC Banking Supervisory Committeethat were held to discuss documents issued by the Basle Committee concerning banking risks andother regional supervisory issues. The Directorate also participated in the meetings of the ArabBanking Supervision Committee in which discussions were held concerning banks profitabilityand risk management. A representative from the Directorate also participated in the annualmeeting of the Financial Sanctions Experts group.
Financial Institutions Supervision
During the year, the Financial Institutions Supervision Directorate continued itssupervisory role over the financial institutions in Bahrain. Prudential meetings were held withIslamic banks, moneychangers, moneybrokers, investment advisors and banks marketing mutualfunds in/from Bahrain, to discuss their overall financial performance based on the periodicalreturns submitted to the Agency.
In furtherance of its aim to constantly develop supervision over Islamic banks, and inorder to provide a regulatory framework for the monitoring of their operations, the Directoratereviewed the new Prudential Information and Regulations for Islamic Banks (PIRI), that Islamicbanks will be required to complete on a quarterly basis. In developing the PIRI framework, theAgency took into consideration the various standards developed by the Accounting and AuditingOrganization for Islamic Financial Institutions (AAIOFI), International Accounting Standards andthe Basle Committee’s various guidelines.
Also, as part of its supervisory role to enhance the supervision on the providers ofinvestment advisory services, the Agency developed in May 2000 a new computerized QuarterlyInformation Report (QIR) which is completed and submitted to the Agency electronically on aprompt and regular basis. In addition, the Agency issued in October 2000 a new (QIR) to becompleted by money brokers on a regular basis, starting the fourth quarter of 2000.
Furthermore, during the period between the coming into force of the Regulationgoverning the general supervision, operation and marketing of collective investment schemesissued on 18th November 1992 and 31st December 2000, approval and authorization have beengranted to 39 banks to establish and market in/from Bahrain 699 schemes, of which 176 schemeswere approved in 2000.

31
Licensing and Information Unit
The Agency issued 9 new licences in 2000, comprising of 5 offshore banking units, 1investment bank, 2 representative offices, and 1 money changer. At the end of 2000, a total of 173banks and other financial institutions were licensed by the Agency.
Central Risk
The Central Risk Unit continued to assist the commercial banks by identifying thenecessary obligations of bank clients with exposures of BD 50,000 and above, replying to theinquiries raised by banks and providing them with total credit facilities while maintaining theconfidentiality of information.
The Agency is currently exploring the feasibility of enhancing the Central Risk Unit andup-grading its existing capabilities in order to assist lending banks in making better informedlending decisions and also to stay abreast with the more advanced Central Risk functions operatedby other central banks.
BANKING SERVICES:
Automated Clearing and Fund Transfers
The number of cheques cleared by the Banking Services Directorate was 1,944,638 during2000 compared with 1,898,360 during 1999. The total value of these cheques was BD 1,365.9million as against BD 1,266.2 million in 1999, an increase of 7.9%. (The average value of a chequecleared rose from BD 666 to BD 702). To improve the efficiency of the Clearing system the Agencyimplemented a penalty charge of BD 2 on each returned cheque. Also, the Agency has imposed acharge of BD 5 for incompatibility between supporting documents and the value of individualcheque batches. Moreover, the Agency has initiated two clearing sessions daily for processingcheques to expedite the settlement function.
The number of inter-bank transfers increased to 76,527 in 2000 from 68,757 in 1999. Thevalue of total telex transfers increased to BD 15,594 million in 2000 compared with BD 14,504million in 1999, an increase of 7.5%. The Agency has developed its internal system to interfacewith the (SWIFT) message system.
Issues of Treasury Bills
The Agency continued to hold weekly auctions of treasury bills on behalf of theGovernment of Bahrain. The initial amount of 91-days bills issued for sale each week was BD 10.0million. The total value of bills issued for sale during the year was BD 510.0 million. Tendersreceived totalled BD 1,383.0 million indicating that, on average, each week’s issue was oversubscribed 2.7 times.
The average interest rate on new issues of 91-day bills during 2000 was 6.5%.
The Agency also issued each month treasury bills of BD 5.0 million with a maturity of 182days and, for the first time, the Agency offered two BD 30.0 million tranches of treasury bills witha maturity of one year.

32
At the end of 2000, outstanding treasury bills totalled BD 220.0 million.
Government Development Bonds
On behalf of the Government of Bahrain, the Agency issued on February 3, 2000 the 16Bissue of Government Development Bonds totalling BD 100.0 million. The Bonds have a maturityof 30 years and carry an interest rate of 50 basis point over the six-month LIBOR rate.
Provision of Bahraini Dinar Liquidity
The Bahraini Dinar liquidity of the commercial banks consists mainly of the currentaccount balances they hold with the Agency. These balances, which can be traded between banksin the money market, fluctuate from day to day under the influence of the Government’sconversions of US Dollars to finance its domestic expenditure, the banks’ purchases of US Dollarsfrom the Agency, changes in the amount of currency in circulation and changes in the banks’reserve balance with the Agency.
During 2000, the Agency continued its policy of providing liquidity through secondaryoperations in treasury bills. Accordingly, the Agency provided commercial banks with facilities todiscount their treasury bills or to enter into "Repo" agreements.
The total number of "Repo" transactions concluded by the Directorate during 2000 was 769of which 586 were for a one-day period, 166 for two days and 17 for seven days. The total valueof "Repo" transactions concluded in 2000 was BD 1,061.7 million.
Banks’ Deposits
The Agency continued to offer the commercial banks the facility to invest their funds inBahraini Dinar deposits with the Agency for one week to six month periods at the prevailingBahraini market interest rate. Such deposits totalled BD 625.4 million at end 2000 as against BD 245.2 million a year earlier.
COMPUTER SERVICES:
The Directorate has implemented an Intranet for all Agency employees. This will greatlyreduce the flow of paper within the Agency. All employees now have access to specificinformation pertaining to loans, salary and leave. The security needs have been specificallyaddressed to enable an employee to view only his/her information.
The Directorate continued to provide maintenance services to the various directorateswithin the Agency. These services largely cater to changes and enhancements required by the endusers to in-house developed applications.
The Directorate completed the upgrade of all network cabling within the Agency. This willprovide adequate bandwidth to address existing as well as future application requirements.
The application in use by the Banking Services Directorate has been enhanced to enablethe Agency to run two sessions for cheque clearing. Additionally, functionality has been added toallow for fees to be charged for returned cheques. Also, the Directorate developed in-house ftwareto be used by the Banking Supervision and Investment Business Section.

33
CURRENCY ISSUE:
Issue & Vault Sections
Currency in circulation amounted to BD 154.2 million at end-2000, compared with BD 160.3 million at end-1999. The value of old bank notes destroyed during the year was BD 26.8million.
The Directorate continued working with equipment to verify the authenticity of banknotes as well as other advanced methods of reviewing and packaging the bank notes.
Currency Museum
The Agency’s Coin Museum took part in a number of national exhibitions and conferencesincluding "Made in Bahrain 2000" organized under the patronage of H.H. Shaikh Khalifa BinSalman Al-Khalifa The Prime Minister, during the period 9–13 May 2000. The Museum alsoparticipated in the "2000 World Islamic Banking Conference" held during the period 28-29 October2000 where rare Islamic coins of the type that once circulated in Bahrain were exhibited. TheMuseum also participated in a show organized by Hamad Town Secondary School from 24-25December 2000.
Visitors to the Museum:
The Coin Museum was classified by the Tourism Directorate at the Ministry of CabinetAffairs and Information as a tourist landmark in Bahrain. Given this new status, the Museum hasattracted more visitors from inside and outside Bahrain, including senior officials, businessmen,students, and tourist groups.
During the year the Museum acquired 7 new rare Islamic coins of a type known to havecirculated in Bahrain during earlier periods of Bahrain’s development.
ECONOMIC RESEARCH:
The Economic Research Directorate continued to monitor economic, monetary, andfinancial developments during the year. The Directorate was also responsible for the preparationand publication of statistical data as well as the co-ordination with regional and internationalorganisations such as the GCC, the Arab Monetary Fund, the International Monetary Fund andthe Bank for International Settlements. During the year, the Agency published the Annual Reportand four issues of the Quarterly Statistical Bulletin. The Directorate also completed a number ofresearch studies and reports relating to financial and banking developments in Bahrain.
The Directorate was responsible for the coordination of the IMF Article IV Consultationmission that took place in Bahrain at the beginning of 2000. Also, the Directorate was representedin the Bahrain delegation that participated in the October, 2000 meetings with the World TradeOrganization (WTO) to review Bahrain’s trade policies.
The Directorate also participated in the meeting of the technical committee responsible forstudying the currency unification among the GCC.

34
Furthermore, the Directorate took part in the arrangements and briefing for internationaland regional meetings. This included the Annual Meetings of the International Monetary Fund,the World Bank, the Arab Monetary Fund and the GCC.
INVESTMENT:
The Investment Directorate continued to manage the Agency’s investment portfoliosconsisting of gold and foreign exchange. The Directorate continued to meet all commercial banks’requirements for U.S. Dollars. During the year 2000, the Agency’s outright sales of U.S. Dollars tocommercial banks in Bahrain totalled US$ 1,381.1 million against US$ 1,230.4 million in 1999, anincrease of 12.2%. The official buying and selling rates for the U.S. Dollar against the BahrainiDinar remained unchanged at BD 0.375 and BD 0.377 respectively.
The Directorate also continued to issue daily recommended exchange rates to commercialbanks in Bahrain for their dealings with the public in U.S. Dollar, Pound Sterling andDeutschemark for amounts up to BD 1,000.

35
LIST OF BMA OFFICERS
H.E. Sh. Ahmed Bin GovernorMohammed Al-Khalifa
Dr. Naser M. Y. Al Belooshi Executive Director - Management Services
Dr. Khalid Abdulla Ateeq Executive Director - Banking Control
Mr. Khalid Abdulla Al Bassam Executive Director - Banking Operations
Mr. Abbas Mahmood Radhi Director, Currency Issue Directorate
Sh. Salman Bin Khalifa Al Khalifa Director, Banking Services Directorate
Mr. Anwar Khalifa Al Sadah Director, Financial Institutions SupervisionDirectorate
Mr. Nabeel Hussain Mattar Director, Administration Directorate
Mr. Ahmed Isa Al Somaim Director, Investment Directorate
Mr. Khalid Hamad A. Rahman Director, Banking Supervision Directorate
Dr. Abdul Rahman Ali Saif Director, Economic Research Directorate
Mrs. Raqia Ebrahim Bardooli Director, Accounts Directorate
Mr. Yousif Rashid Al Fadhel Director, Computer Services Directorate
Mr. Waleed Abdulla Rashdan Director, Inspection Directorate

36
STATUTORY ACCOUNTSTHE AGENCY ANNUAL REPORT 2000
The total capital funds of the Agency increased from BD 285.9 million at end-1999 to
BD 301.3 million at end-2000. The net foreign exchange holdings on the Agency’s account
increased from BD 424.4 million at end-1999 to BD 535.0 million at end-2000. Notes and coins in
circulation fell by BD 6.1 million, from BD 160.3 million at end-1999 to BD 154.2 million at
end-2000.

37
BAHRAIN MONETARY AGENCYFINANCIAL STATEMENTS
31 DECEMBER 2000

38
AUDITORS’ REPORT TOH.H. THE CHAIRMAN OF THE BOARD OF DIRECTORS OF THE BAHRAIN MONETARY AGENCY
Your Highness,
We have audited the financial statements of the Bahrain Monetary Agency (the Agency) for theyear ended 31 December 2000. These financial statements are the responsibility of the Agency’smanagement. Our responsibility is to express an opinion on these financial statements based onour audit.
We conducted our audit in accordance with International Standards on Auditing. Those Standardsrequire that we plan and perform the audit to obtain reasonable assurance about whether thefinancial statements are free of material misstatement. An audit includes examining, on a test basis,evidence supporting the amounts and disclosures in the financial statements. An audit alsoincludes assessing the accounting principles used and significant estimates made by management,as well as evaluating the overall financial statement presentation. We believe that our auditprovides a reasonable basis for our opinion.
In our opinion the financial statements present fairly, in all material respects, the financial positionof the Agency as of 31 December 2000 and the results of its operations for the year then ended inaccordance with the Amiri Decree No. (23) of 1973.
We confirm that, in our opinion, proper accounting records have been kept by the Agency and thefinancial statements are in agreement therewith. We obtained all the information and explanationswhich we required for the purpose of our audit.
Ernst & Young
10 February 2001Manama, State of Bahrain.

39
BAHRAIN MONETARY AGENCY
BALANCE SHEET31 DECEMBER 2000
2000 1999Note BD’000 BD’000
ASSETS
Gold 2,500 2,500Foreign exchange 3 535,002 424,406Cash and due from Bahraini banks 9,583 115,718Accounts with central banks 162 10Fixed assets 847 781Other assets 27,325 17,536
575,419 560,951
LIABILITIES AND CAPITAL FUNDS
LIABILITIESNotes and coins in circulation 4 154,191 160,298Bahraini dinar deposits 110,962 107,113Other payables 8,978 7,669
274,131 275,080
CAPITAL FUNDSCapital 5 200,000 200,000General reserve 6 80,576 66,151Contingency reserve 7 8,000 7,000Re-evaluation reserve 8 12,712 12,720
301,288 285,871
575,419 560,951
......................................... .........................................Chairman Governor
The attached notes 1 to 8 form part of these financial statements.

40
BAHRAIN MONETARY AGENCY
PROFIT AND LOSS ACCOUNT AND APPROPRIATIONYEAR ENDED 31 DECEMBER 2000
2000 1999Note BD’000 BD’000
INCOME
Net interest income 32,823 28,323
Licence fees 717 717
Net investment trading loss (4,724) (7,908)
Other 1,450 1,115
30,266 22,247
EXPENDITURE
General and administration expenses 4,357 3,787
Note issue expenses 1,380 320
Brokerage fees 47 27
5,784 4,134
PROFIT FOR THE YEAR 24,482 18,113
Transfer to contingency reserve 7 1,000 --
TRANSFER TO GENERAL RESERVE 6 23,482 18,113
The attached notes 1 to 8 form part of these financial statements.

41
BAHRAIN MONETARY AGENCY
NOTES TO THE FINANCIAL STATEMENTS31 DECEMBER 2000
1. ACTIVITIES
The Bahrain Monetary Agency is the central monetary authority of the State of Bahrain.The Agency is responsible for the issue of currency, acts as the fiscal agent on behalf of theGovernment of the State of Bahrain and is the supervisory authority for banking and investmentinstitutions in the State of Bahrain.
2. SIGNIFICANT ACCOUNTING POLICIES
The financial statements are prepared in compliance with the Amiri Decree No. (23) of1973.
Accounting convention
The financial statements are prepared under the historical cost convention, except for goldwhich is valued in accordance with Article 27 (a) of the Amiri Decree No. (23) of 1973 at BD 1 per1.86621 grams of fine gold.
Foreign exchange
Foreign exchange comprises deposits placed, net of deposits taken, and investmentsdenominated in foreign currencies.
Investments are purchased with the intention of being held to maturity and are treated aslong term. Accordingly, short term market fluctuations are not taken into account and investmentsare carried at cost, net of premium or discount on purchase. Premium or discount on purchase isamortised over the remaining life of the investment and included under net interest income in theprofit and loss account.
Depreciation
The cost of the building and any addition thereto is expensed in the year in which the costis incurred. The cost of other fixed assets is depreciated by equal annual instalments over theestimated useful lives of the assets.
Foreign currencies
Foreign currency transactions are recorded at rates of exchange ruling at the dates of thetransactions.
Assets and liabilities in foreign currencies at the balance sheet date are retranslated on thebasis of the official par value of the Bahraini dinar in relation to the United States dollar and theclosing market rates of exchange for the other currencies against the United States dollar at theyear end.

42
In accordance with Article 32 (a) of the Amiri Decree No. (23) of 1973, gains and losses onretranslation of foreign currencies into Bahraini dinars are taken direct to re-evaluation reserveaccount. The deficit, if any, in this account is covered by the Government of the State of Bahrain bythe issue of non- negotiable, interest free bonds.
Notes and coins in circulation
Notes and coins in circulation are stated net of the Bahrain dinar notes and coins held inbanking stock and adjusted for the notes and coins to be withdrawn from circulation.
Revenue recognition
Interest income is recognised on a time apportioned basis, taking into account the principaloutstanding and the rate applicable. License fees, investment trading results and other income arerecognised when received or realised.
3. FOREIGN EXCHANGE
Included in foreign exchange are marketable securities carried at their cost of BD 77.493million (1999 : BD 48.504 million). The market value of these investments as of 31 December 2000was BD 77.075 million (1999 : BD 47.730 million).
4. EXCESS OF AUTHORISED BACKING FOR CURRENCY INCIRCULATION
2000 1999BD'000 BD'000
Authorised backing:Gold 2,500 2,500Net foreign currency balances 535,002 424,406
537,502 426,906Currency in circulation:
Notes and coins (154,191) (160,298)
Excess of authorised backing over currency in circulation 383,311 266,608
The excess of authorised backing for currency in circulation is calculated in accordancewith Articles 28 and 29 of the Amiri Decree No. (23) of 1973.
5. CAPITAL2000 1999
BD'000 BD'000
Authorised 400,000 400,000
Issued 200,000 200,000

43
6. GENERAL RESERVE
2000 1999BD'000 BD'000
Balance at beginning of the year 66,151 61,126Transfer from profit and loss account 23,482 18,113Transfer to the Government of the State of Bahrain (9,057) (13,088)
Balance at end of the year 80,576 66,151
Transfer to the Government of the State of Bahrain relates to the transfer made inaccordance with Article 18 of the Amiri Decree No. (23) of 1973.
7. CONTINGENCY RESERVE2000 1999
BD'000 BD'000
Balance at beginning of the year 7,000 7,000Transfer during the year 1,000 --
Balance at end of the year 8,000 7,000
The contingency reserve has been established to meet any future contingencies.
8. RE-EVALUATION RESERVE
2000 1999BD'000 BD'000
Balance at beginning of the year 12,720 12,742Movement in unrealised surplus during the year (8) (22)
Balance at end of the year 12,712 12,720
Re-evaluation reserve represents the net unrealised surplus arising from the translation offoreign currencies, included in foreign exchange, at the exchange rates ruling on 31 December2000.

44
LIST OF BANKS AND OTHER FINANCIALINSTITUTIONS LICENSED BY THE BMA
(As at 31st December 2000)FULL COMMERCIAL BANKS (19):
ABN AMRO Bank N.V. Citibank N.A.Al-Ahli Commercial Bank B.S.C.(c) Grindlays Bahrain Bank B.S.C. (c)Arab Bank plc Habib Bank LimitedBahrain Islamic Bank B.S.C. HSBC Bank Middle EastBahraini Saudi Bank B.S.C. (The) National Bank of Bahrain BSCBank Melli Iran Rafidain BankBank of Bahrain and Kuwait B.S.C. Shamil Bank of Bahrain E.C. (Islamic Bankers)Bank Saderat Iran Standard Chartered BankBanque Du Caire S.A.E. United Bank LimitedBNP Paribas
SPECIALISED BANKS (2):
Bahrain Development Bank B.S.C.Housing Bank (The)
OFFSHORE BANKING UNITS (51):
ABN AMRO Bank N.V. DisbankAhli United Bank B.S.C. Finansbank A.S.Al Baraka Banking Group E.C. Gulf International Bank B.S.C.Allied Banking Corporation Gulf Investment CorporationALUBAF Arab International Bank E.C. Habib Bank Ltd.Arab Asian Bank E.C. Hanvit BankArab Bank plc Hongkong and Shanghai Banking Arab Banking Corporation (B.S.C.) Corporation Limited. (The)Arab Investment Company S.A.A. (The) HSBC Bank Middle EastAustralia & New Zealand Banking Group International Bank for Commerce
Limited (ANZ) (Under Liquidation) Bahrain Arab International Bank (E.C.) Kocbank A.S.
(Under Voluntary Liquidation) Korea Exchange BankBahrain International Bank (E.C.) KorfezbankBahrain Middle East Bank (E.C.) Kuwait Asia Bank E.C.Bank Kapital T.A.S. (Under Voluntary Liquidation)Bank of Credit and Commerce International S.A. MashreqBank psc
(Under Liquidation) Muslim Commercial Bank Ltd.Bank of Tokyo - Mitsubishi, Ltd. (The) National Bank of Abu DhabiBank Saderat Iran National Bank of Kuwait S.A.K. Banque de Commerce et de Placements S.A. National Bank of PakistanBanque Francaise de l’Orient Pamukbank T.A.S.BNP Paribas Saudi National Commercial Bank (The)Chase Manhattan Bank (The) Shamil Bank of Bahrain E.C. (Islamic Bankers)Citibank N.A. Standard Chartered Bank PLCCiticorp Banking Corporation of Delaware Standard Chartered Grindlays Bank LimitedCredit Agricole Indosuez State Bank of IndiaDemirbank T.A.S. Turkiya Is Bankasi A.S.
Yapi ve Kredi Bankasi A.S.

45
INVESTMENT BANKS (31):
ABC Islamic Bank (E.C.) Faysal Investment Bank of Bahrain (E.C.)ABC Islamic Fund (E.C.) First Islamic Investment Bank E.C.AFS-Singer & Friedlander E.C. Gulf Finance House (B.S.C.) E.C.
(Under Voluntary Liquidation) Investcorp Bank E.C.Albaraka Islamic Bank B.S.C. (E.C.) Investors Bank E.C.Al Khaleej Islamic Investment Bank (B.S.C.)E.C. Man-Ahli Investment Bank E.C.Amex (Middle East) E.C. Merrill Lynch International Bank LimitedArab Financial Services Company (E.C.) Nomura Investment Banking (Middle East) E.C.Arab Islamic Bank (E.C.) Okasan International (M.E.) E.C. Bahrain Investment Bank B.S.C. (Under Voluntary Liquidation)Bahrain Islamic Investment Co. B.S.C. (c) Securities & Investment Company B.C.S.C.Capital Investment Holding Co. (E.C.) Shamil Bank of Bahrain E.C. (Islamic Bankers)Capital Union, E.C. (c) TAIB Bank E.C.Card Company E.C. (The) Turk-Gulf Merchant Bank E.C.Citi Islamic Investment Bank E.C. UBS Brinson, Inc.CrediMax United Gulf Bank (B.S.C.) E.C.Daiwa SBCM Europe, Middle East
REPRESENTATIVE OFFICES (38):
Alliance Capital Limited Hansard Financial Trust LimitedAmerican Express Bank Ltd. HSBC Bank plcAmerican Express International Inc. Industrial Bank of Japan, Limited (The)Bank of Bermuda Limited (The) International Commercial Bank of China (The)Baring Asset Management International Investment GroupBB Aval - Berliner Bank Group Matheson Bank LimitedBNP Paribas Merrill Lynch Bank (Suisse) S.A.Citicorp Investment Bank Merrill Lynch Investment Managers LimitedClose Brothers Corporate Finance Limited MFS International Limited Commerzbank AG Murray Johnstone LimitedCredit Agricole Indosuez Robert Fleming Holdings LimitedDai-Ichi Kangyo Bank, Limited (The) Sakura Bank, Limited (The)Deutsche Bank A.G. Salomon Smith Barney, Inc.Discount Bank and Trust Company Sanwa Bank Limited (The)E D & F Man International Ltd. Sumitomo Bank, Limited (The)First Union National Bank Thomas Cook Group Ltd. (The)Fuji Bank Limited (The) Tokai Bank, Limited (The)GNI Fund Management UBS AG
(Gerrard and National Inter commodities) Wasserstein Perella Middle East, Inc.Weiss, Peck and Greer L.L.C. (Investments)
FOREIGN EXCHANGE ANDMONEY BROKERS (6):
Charles Fulton (Gulf) W.L.L. Marshalls (Bahrain) LimitedHarlow Butler (Bahrain) W.L.L. R.P. Martin (Bahrain) W.L.L.International Financial Services Tullett & Tokyo (Bahrain) Company W.L.L.
(Under Voluntary Liquidation)

46
MONEY CHANGERS (18):
Al-Manama Exchange Delmon ExchangeAl-Yousif Exchangers Gulf Exchange Co.Al-Zamil Exchange Est. Haji Yousif Al Awadi Exchange EstablishmentArab Exchange Company. Khalil Ebrahim Al Fardan ExchangeAwal Exchange Co. W.L.L. Mandeel ExchangeBahrain Express Exchange National Finance & Exchange Co. W.L.L.Bahrain Financing Co. Nonoo Exchange Co. W.L.L.Bahrain India International Exchange Co. B.S.C.(C) World Exchange Centre W.L.L.Dalil Exchange Zenj Exchange Co. W.L.L.
INVESTMENT ADVISORY ANDOTHER FINANCIAL SERVICES (8):
a) Investment Advisory & Other Financial Services/Brokerage (7):
Abdulla A. Saudi & Associates Islamic Finance Consultants E.C.Capital Growth Management W.L.L. Robert Fleming (Bahrain) W.L.L.H & A Investment Services Company W.L.L. Towry Law (Asia) HK LimitedIndogulf Financial Services W.L.L.
b) Provider of Ancillary Services to the Financial Sector (1):
The Benefit Company B.S.C. (c)

47
LIST OF BMA REGULATIONS & CIRCULARS2000
1- Prudential Information and Regulations for Islamic Banks (PIRI).
2- New Return to the Agency.
3- Bahrain Monetary Agency - Prudential Returns.
4- Bahrain Monetary Agency - Prudential Returns.
5- Controllers of, and holdings and transfers of significant ownership or controllinginterests in, Agency licensees.
6- Returned Cheques.
7- Cheque Clearing System.
8- Quarterly Information Report.
9- Quarterly Information Report (QIR).

48
OG/386/200012th July 2000
The General ManagerAll Islamic BanksAll Audit FirmsAAOIFIManama - Bahrain
Dear Sir,
Prudential Information and Regulations for Islamic Banks (PIRI)
The Islamic banking industry has been growing at a steadily increasing rate in Bahrain. The natureof this industry is substantially different from conventional banking both in terms of risks beingundertaken and for the purposes of accounting and disclosure.
The Agency recognizes the importance of this industry to Bahrain and has identified the need todevelop a separate framework for regulating these institutions, taking into account their specialfeatures. The Agency also recognizes the need to maintain and enhance the confidence of theparticipants in the financial services industry and the investors in Islamic banks.
With this in mind the Agency has developed a proposed framework for Prudential Informationand Regulations for Islamic Banks (PIRI). The objective of the PIRI is not only to provide aregulatory framework but also to use information contained in these proposed returns to monitorthe operations of the banks and to identify signs of deterioration in a bank’s performance if any.
The proposed PIRI framework covers five important areas:
n Capital adequacy, covering both credit and market risk;
n Asset quality, including monitoring of large exposures and related party exposures;
n Management of investment accounts, both unrestricted and restricted and on and offbalance sheet;
n Liquidity management, covering both on balance sheet and separate funds pertaining torestricted investment accounts; and
n Earnings quality.
The Agency perceives that the PIRI framework will assist in developing further credibility forIslamic banks and will provide a standard framework of comparison that can be subsequentlyused in allocating credit ratings.
In developing the proposed PIRI framework, the Agency has taken into consideration the variousstandards developed by the Accounting and Auditing Organization for Islamic FinancialInstitutions (AAIOFI), International Accounting Standards and the Basle Committee’s variousguidelines.
49
The Agency therefore, seeks your close cooperation in reviewing the PIRI framework in detail andproviding it with your valuable comments by 15th September 2000.
Should you have any queries relating to this circular, please contact the Director of FinancialInstitutions Supervision Directorate at the Agency on Tel: 529444/529445. The Agency would liketo thank you in advance for your cooperation in this regard.
Yours faithfully,
Abdulla K. Al-KhalifaGovernor

50
BC/1/20005th February, 2000
The General ManagerAll Moneychangers Manama - Bahrain
Dear Sir,
New Return to the Agency
In order to clarify and simplify the Agency’s requirement in relation to the monthly return, theAgency has decided to issue this circular to replace the Agency circular No. BC/22/99 dated 24thOctober 1999.
Moneychangers are required to complete and submit the attached report on monthly basis starting31st March, 2000. The Agency expects to receive the report within 3 weeks of each month end. Inorder to complete the Report and to ensure that adequate records exist to back-up the Report,moneychangers are required to retain copies of their customers’ identification documentsincluding name, address, and nationality for any transaction equal to or exceed BD10,000.Moneychangers are also required to maintain records of details of beneficiaries in case of draftsissued/received including, name, address and nationality for a period of at least five years.
It should be noted that, for the purposes of the Report, "resident" and "non-resident" are definedas follows:
1. Entities
"Resident Entities" are those entities that are physically located in Bahrain, whether or notassociated with an institution that is located outside Bahrain, and irrespective of nationality of theunderlying ownership of such entities.
"Non-Resident Entities" are those entities which are located outside Bahrain, whether or notowned – wholly or in part – by entities inside Bahrain.
2. Individuals
"Resident Individuals" are those persons who are long-term residents of, or have their "economiccenter of interest" in, Bahrain. For these purposes, "long-term" generally means working orstaying in Bahrain for more than one year.
"Non-Resident Individuals" are those persons who are short-term residents of Bahrain. For thesepurposes, "short-term" generally means working or staying in Bahrain for less than one year.

51
Any persons with queries relating to the attached should contact Anwar Khalifa Al-Sadah,Director of Financial Institutions Supervision Directorate, at the Agency on Tel: 529444/529445.
Yours faithfully,
Dr. Khalid Abdulla AteeqExecutive Director – Banking Control

52
Con
soli
dat
ed m
onth
ly r
etu
rn f
or a
ll m
oney
chan
gers
Mon
thly
Pur
chas
es o
f C
urre
ncie
s, T
rave
ller
s C
hequ
es, G
old,
Oth
er P
. Met
als
and
Dra
fts
for
the
mon
th e
ndin
g
/
/ 20
00
Am
oun
t in
BD
Res
.N
on R
es.
Res
. N
on R
es.
Res
.N
on R
es.
Res
.N
on R
es.
Typ
e of
Cu
rren
cy
Pu
rch
ases
Dra
fts
Cu
rren
cyTr
. Ch
qs.
Gol
dO
ther
P. M
etal
sA
mou
nts
Cou
ntr
y
G.C
.C.
Ara
b
Asi
a
Nor
th A
mer
ica
&C
anad
a
Eur
opea
n
Oth
er
T ota
l

53
Con
soli
dat
ed m
onth
ly r
etu
rn f
or a
ll m
oney
chan
gers
Mon
thly
Sal
es o
f C
urre
ncie
s, T
rave
ller
s C
hequ
es, G
old,
Oth
er P
. Met
als
and
Dra
fts
for
the
mon
th e
ndin
g
/
/ 20
00
Am
oun
t in
BD
Res
.N
on R
es.
Res
. N
on R
es.
Res
.N
on R
es.
Res
.N
on R
es.
Typ
e of
Cu
rren
cy
Sal
esD
raft
s
Cu
rren
cyTr
. Ch
qs.
Gol
dO
ther
P. M
etal
sA
mou
nts
Cou
ntr
y
G.C
.C.
Ara
b
Asi
a
Nor
th A
mer
ica
&C
anad
a
Eur
opea
n
Oth
er
T ota
l

54
BC/6/2000
26th April, 2000
The General ManagerAll Locally Incorporated Banks
The Managing PartnerAll Auditing FirmsManama - Bahrain
Dear Sir,
Re: Bahrain Monetary Agency - Prudential Returns
As you will be aware, locally incorporated banks in Bahrain are required to complete and send tothe Agency Prudential Returns on a quarterly basis. In order to ensure value from this regularreporting by banks, the Agency has decided that, in respect of the quarterly Return as ending on30th June, 2000 and for all quarterly Returns thereafter, banks' external auditors should formallyreview these returns so as to be able to confirm to the Agency that these Returns are beingcompleted in accordance with the Agency's guidelines in this regard. This review should beconducted by external auditors after the filing of the relevant Return as part of the auditor'squarterly review of the bank.
Banks which demonstrate to the satisfaction of the Agency that they have fulfilled all of theAgency's requirements with regard to Prudential Returns for at least two consecutive quartersmay apply (in writing) to the Agency for an exemption from the review procedure set out above.Persons with queries in relation to any matter set out above should contact Mr. Khalid HamadAbdulrahman, Director - Banking Supervision Directorate at the Agency (ph. 529405).
Yours faithfully,
Dr. Khalid Abdulla AteeqExecutive Director - Banking Control

55
BC/6/2000
26th April, 2000
The General ManagerAll Branches of Foreign Banks
The Managing PartnerAll Auditing FirmsManama - Bahrain
Dear Sir,
Re: Bahrain Monetary Agency - Prudential Returns
As you will be aware, branches of foreign banks in Bahrain are required to complete and send tothe Agency Prudential Returns on a quarterly basis. In order to ensure value from this regularreporting by banks, the Agency has decided that, in respect of the quarterly Return as ending on30th June, 2000 and for all quarterly Returns thereafter, banks' external auditors should formallyreview these returns so as to be able to confirm to the Agency that these Returns are beingcompleted in accordance with the Agency's guidelines in this regard. This review should beconducted by external auditors after the filing of the relevant Return.
Banks which demonstrate to the satisfaction of the Agency that they have fulfilled all of theAgency's requirements with regard to Prudential Returns for at least two consecutive quartersmay apply (in writing) to the Agency for an exemption from the review procedure set out above.Persons with queries in relation to any matter set out above should contact Mr. Khalid HamadAbdulrahman, Director - Banking Supervision Directorate at the Agency (ph. 529405).
Yours faithfully,
Dr. Khalid Abdulla AteeqExecutive Director - Banking Control

56
BC/8/200024th May, 2000
The General ManagerAll Banks and Other Financial Institutions (not Rep. Offices)Manama - Bahrain
Dear Sir,
Controllers of, and holdings and transfers of significant ownership or controlling interests in, Agency licensees
Pursuant to its general supervisory powers under the BMA Law (Articles 3.C and 14.D) and underother relevant provisions of Bahrain law, the Agency has now formalised the criteria it applies to,and the procedures applicable for, requests for the Agency's approval for controllers of, and forholdings and transfers of significant ownership or controlling interests in Agency licensees. Thesecriteria and procedures are set out below. "This Circular does not override but should be read inconjunction with, Agency Circular BC/11/98 dated 27th July, 1998 concerning the "fit & proper"requirements of the Agency for board and senior management of licensees".
Definitions
For the purposes of this Circular:
(a) "controller" means (i) a managing director or chief executive of the licensee or of anotherlicensee of which the licensee is a subsidiary or associate company, (ii) a parent undertaking of thelicensee, (iii) a person who (either alone or with an associate) is or would be a holder or proposedtransferee of significant ownership or controlling interests in the licensee, or (iv) a person (eitheralone or with an associate) in accordance with whose instructions the directors of the licensee orpersons who are controllers of the licensee are accustomed to act;
(b) "significant ownership" means ownership (whether legal or beneficial and whetherdirect or indirect) within the following bands i) between 10 to 19.9 percent, ii) 20 to 32.9 percent,iii) 33 to 49.9 percent, iv) 50 to 74.9 percent, v) or 75 to any greater percentage, of the issued sharecapital of the licensee". In determining significant ownership, account shall be taken by theAgency of any percentage ownership which, when added to an existing ownership percentage,brings total ownership of the holder or proposed transferee with the percentage bands referred toabove;
(c) "controlling interests" mean either significant ownership or any other interests (including,but not limited to, the ability to exercise or control the exercising of voting power of issued sharecapital in the licensee) which enable the holder, or which would enable a proposed transferee,thereof to exercise significant influence over the management and business of the licensee;
(d) "associate" means, in the case of a controller, (i) the spouse or son or daughter of thecontroller, (ii) any company of which the controller is a director, (iii) any person who is anemployee or partner of the controller, (iv) any other person with whom the controller has anyagreement or arrangement with respect to the acquisition, holding or disposal of shares in the

57
licensee, (v) any person with whom the controller has any agreement or arrangement with respectto acting together in exercising their voting power.
The above percentages and definitions may be amended, and other relevant terms may be defined,from time to time by the Agency either generally or in the case of a particular licensee.
Persons becoming controllers, and transfers made, after the date of this Circular
After the date of this Circular, no person may become a controller of a locally incorporated Agencylicensee, and no transfer of significant ownership or controlling interests in a locally incorporatedAgency licensee shall be effective or valid in law, unless the Agency has given its prior writtenconsent.
"In the case of branches of foreign banks, the Agency must be notified of any new significantownership in excess of 50% of the issued share capital of the concerned bank as soon as the branchbecomes aware of the new significant ownership. Where the Agency objects to the holder of thesignificant ownership in the foreign bank, the Agency reserves the right to take any appropriateactions, including withdrawal of the licence. Branches of foreign banks have no other notificationrequirements concerning "controllers". They do, however, still have to comply with therequirements of Agency Circular BC/11/98 dated 27th July, 1998 concerning the management ofbranches in Bahrain".
An application should be made to the Agency in writing to obtain such consent.
Persons deemed by the Agency to be controllers or holders at the date of this Circular or at anytime hereafter
A person who is deemed by the Agency to be a controller of, or a holder of significant ownershipor controlling interests in, an Agency licensee at the date of this Circular or at any time hereafter,may be deemed by the Agency to not be "fit and proper" to hold such position.
In such event, the Agency shall so notify the controller or holder, and such notice may specify anyaction which the Agency believes should be taken in this regard (including, but not limited to, theimposing of a restriction on, or the disposal of, all or a part of such ownership or interests).
Making a determination of when a person is a controller or a holder
In making a determination of when a person is a controller or a holder, the Agency may takeaccount of all holdings in and control over a licensee which the person in question has, whetherdirectly or indirectly and including, but not limited to, holdings and control by or throughsubsidiaries, parent or sister companies, as well as associates.
Making a determination of fit and proper
In making a determination of fit and proper of controllers, holders and transferees, for thepurposes of this Circular, the Agency shall:
a. Apply the same broad criteria as it uses for directors, chief executives/general managersand managers of licensees as set out in Agency Circular BC/11/98 dated 27th July, 1998;
b. Consider the effect of a positive or negative determination in this context on (i) the

58
interests of depositors and potential depositors of the licensee, (ii) the licensee as a whole, (iii) theBahrain banking and financial sector; and
c. Take account of such other matters as the Agency may determine appropriate and relevant.
Information to be provided to the Agency
In carrying out its duties under this Circular, the Agency may require such information as it deemsnecessary to be provided to it by any person and may consult with such persons and authorities(whether in Bahrain or elsewhere) as it considers appropriate.
Notification to the Agency of change in significant ownership or controlling interests
The Agency must be immediately notified by the licensee and by the relevant controller of anymovement by a controller between the above percentage bands in a locally incorporated Agencylicensee.
Yours faithfully,
Dr. Khalid Abdulla AteeqExecutive Director - Banking Control
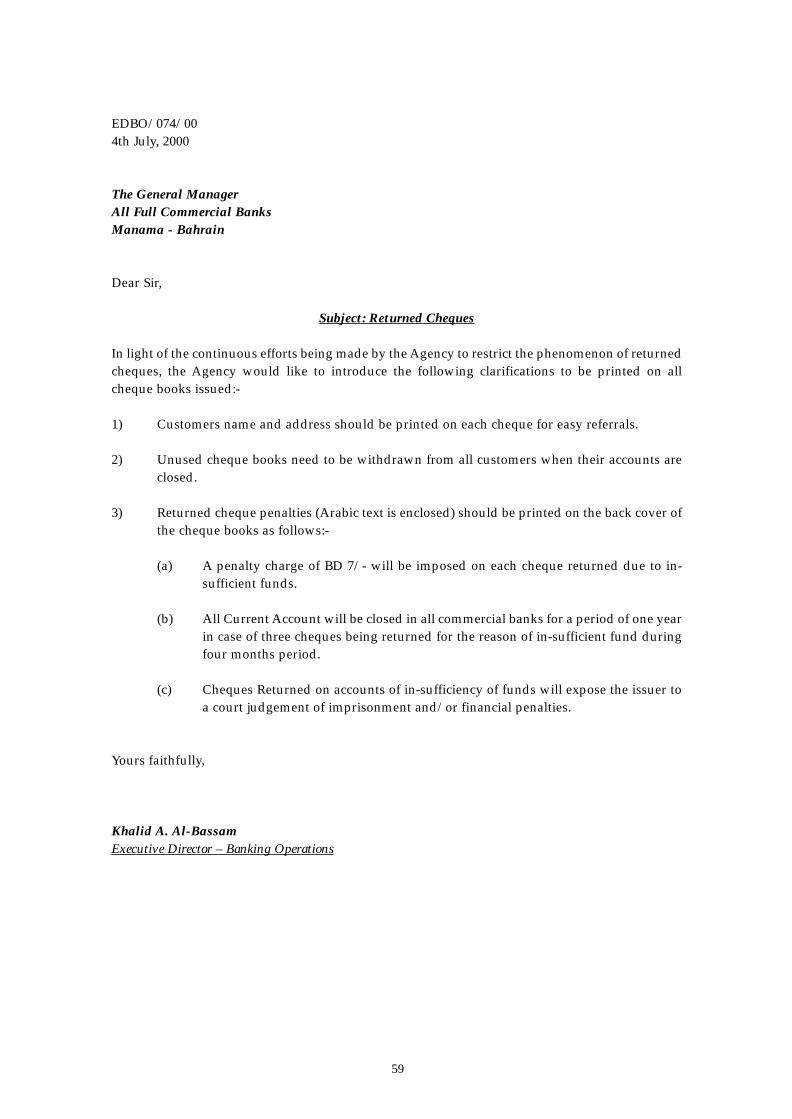
59
EDBO/074/004th July, 2000
The General ManagerAll Full Commercial BanksManama - Bahrain
Dear Sir,
Subject: Returned Cheques
In light of the continuous efforts being made by the Agency to restrict the phenomenon of returnedcheques, the Agency would like to introduce the following clarifications to be printed on allcheque books issued:-
1) Customers name and address should be printed on each cheque for easy referrals.
2) Unused cheque books need to be withdrawn from all customers when their accounts areclosed.
3) Returned cheque penalties (Arabic text is enclosed) should be printed on the back cover ofthe cheque books as follows:-
(a) A penalty charge of BD 7/- will be imposed on each cheque returned due to in-sufficient funds.
(b) All Current Account will be closed in all commercial banks for a period of one yearin case of three cheques being returned for the reason of in-sufficient fund duringfour months period.
(c) Cheques Returned on accounts of in-sufficiency of funds will expose the issuer toa court judgement of imprisonment and/or financial penalties.
Yours faithfully,
Khalid A. Al-BassamExecutive Director – Banking Operations
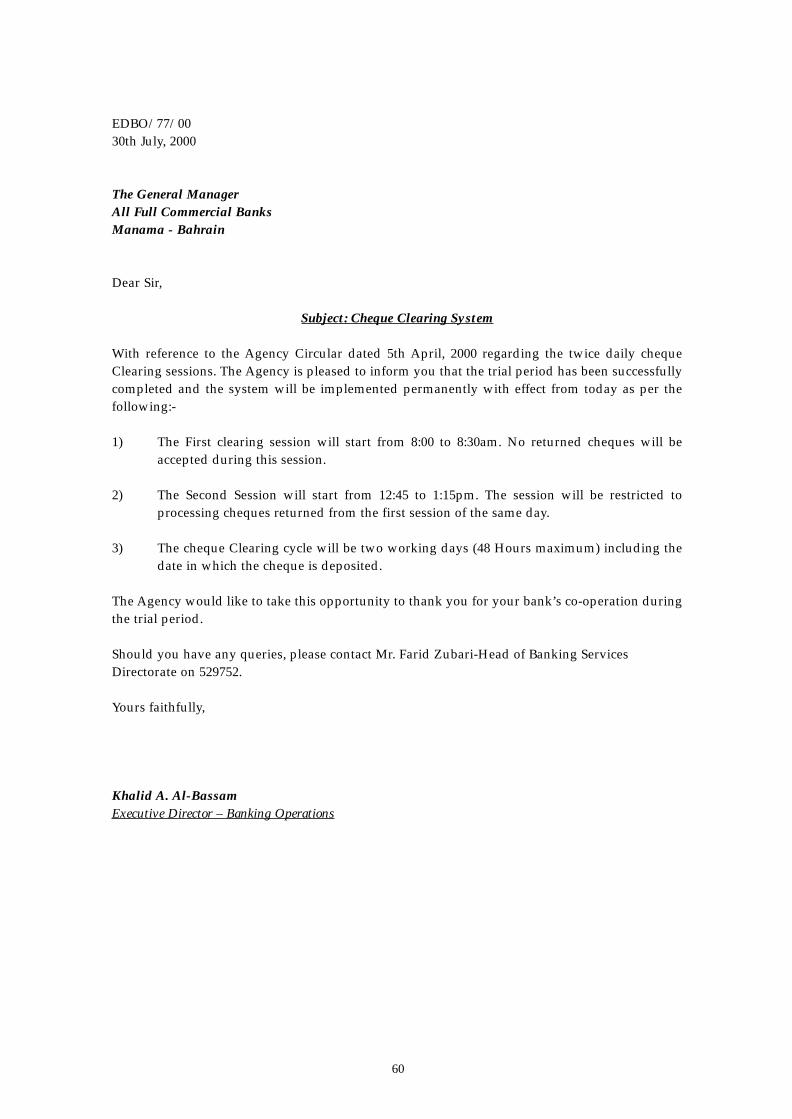
60
EDBO/77/0030th July, 2000
The General ManagerAll Full Commercial BanksManama - Bahrain
Dear Sir,
Subject: Cheque Clearing System
With reference to the Agency Circular dated 5th April, 2000 regarding the twice daily chequeClearing sessions. The Agency is pleased to inform you that the trial period has been successfullycompleted and the system will be implemented permanently with effect from today as per thefollowing:-
1) The First clearing session will start from 8:00 to 8:30am. No returned cheques will beaccepted during this session.
2) The Second Session will start from 12:45 to 1:15pm. The session will be restricted toprocessing cheques returned from the first session of the same day.
3) The cheque Clearing cycle will be two working days (48 Hours maximum) including thedate in which the cheque is deposited.
The Agency would like to take this opportunity to thank you for your bank’s co-operation duringthe trial period.
Should you have any queries, please contact Mr. Farid Zubari-Head of Banking ServicesDirectorate on 529752.
Yours faithfully,
Khalid A. Al-BassamExecutive Director – Banking Operations

61
BC/10/20004th October, 2000
The General ManagerAll FCBs, IBs, OBUs & Representative OfficesManama - Bahrain
Dear Sir,
Sub: Quarterly Information Report
The Agency would like to draw your attention to the requirements of Article 4 (d) of theRegulation with respect to the General Supervision, Operation, and Marketing of CollectiveInvestment Schemes issued on 18th November 1992 (Agency Circular No. OG/356/92), and ofAgency Circular No. BC/15/97 dated 5th October 1997, which requires your bank to submit to theAgency a Quarterly Information Report of all Collective Investment Schemes which are authorisedand approved by the Agency for your bank’s marketing in/from Bahrain. A copy of Circular No.BC/15/97 is attached hereto for ease of reference.
All banks are requested to submit the above report on a timely basis. Should any bank fail toprovide the above Report at all or on time, the Agency will not consider any further applicationsto establish and/or market a new scheme in/from Bahrain until matters are appropriatelyrectified.
Should you have any queries in respect of any matter referred to herein, please do not hesitate tocontact Mr. Anwar Al-Sadah, Director of Financial Institutions Supervision Directorate at529444/445.
Yours faithfully,
Dr. Khalid Abdulla AteeqExecutive Director – Banking Control

62
BC/12/200010th October, 2000
The General ManagerAll Money BrokersLicensed by the AgencyManama - Bahrain
Dear Sir,
Re : Quarterly Information Report (QIR)
In accordance with the Agency’s Standard Conditions and Licensing Criteria for Money andForeign Exchange Brokers (specifically paragraph No. "5"), the Agency has now developed aQuarterly Information Report (QIR) for completion by Money and Foreign Exchange BrokersLicensed by the Agency.
The attached QIR should be completed by your Firm for each quarter period (i.e. for the quarterperiod ending on 31st March, 30th June, 30th September and 31st December of each year), andshould be submitted to the Agency within 20 days of the end of the quarterly period to which itrelates. The first QIR to be sent to the Agency will be for the quarter period ending on 31stDecember 2000, and should be submitted by 20th January, 2001.
Furthermore, all Money Brokers are request to comply with requirements of this circular inpreparing their year 2000 annual accounts. The accounts should be submitted to the Agencywithin a period no later than two months from the year-end of your financial year.
The Agency also expects your external auditors to reconcile the quarterly reports with the year-endaudited accounts.
Any queries concerning this matter should be directed to Mr. Anwar Khalifa Al-Sadah, Director ofFinancial Institutions Supervision Directorate at the Agency (Tel : 529444/445).
Yours faithfully,
Dr. Khalid Abdulla AteeqExecutive Director – Banking Control

NUMBER DESCRIPTION PAGE
1.1 Inflation Rates 2
1.2 Exchange Rates for SDR Against Selected GCC Currencies 3
2.1 Gross Domestic Product at Current Prices 7
2.2 Gross Domestic Product at Constant Prices 8
2.3 Selected Oil Statistics 9
2.4 Natural Gas Production and Utilisation 10
2.5 Government Finance 12
3.1 Value of Exports 13
3.2 Valueof Imports 14
3.3 Direction of Non-Oil Trade 16
3.4 Non-Oil Trade with GCC Countries 17
3.5 Balance of Payments 18
4.1 Domestic Liquidity 19
4.2 Factors Affecting Domestic Liquidity 20
4.3 Private and Public Sector Deposits 22
4.4 Outstanding Commercial Bank Credit to Residents by 23
Economic Sectors
4.5 Interest Rates on Deposits 24
4.6 Interest Rates on Loans and Overdrafts 25
63
NUMBER DESCRIPTION PAGE
1.1 Inflation Rates (%) 2
1.2 Exchange Rates of Major Currencies Against the SDR 2
1.3 Interest Rates on Major Currency Deposits 3
2.1 Gross Domestic Product at Current Prices 5
2.2 Gross Domestic Product at Constant 1989 Prices 6
2.3 Selected Oil Statistics 7
2.4 Gas Production and Utilisation 8
2.5 Government Finance 10
2.6 Consumer Price Index (CPI) 11
2.7 Trading Activity of the Bahrain Stock Exchange 12
3.1 Foreign Trade 14
3.2 Direction of Non-Oil Trade 15
3.3 Non-Oil Trade with GCC Countries 16
3.4 Balance of Payments 17
4.1 Domestic Liquidity 18
4.2 Factors Affecting Domestic Liquidity 19
4.3 Consolidated Balance Sheet of the Banking System 20
4.4 Domestic Deposits at Commercial Banks 22
4.5 Outstanding Credit to Non-Bank Residents by Economic Sector 23
4.6 Interest Rates on BD Deposits & Loans 24
4.7 Geographical Classification of OBU Assets/Liabilities at End-2000 25
4.8 Currency Structure of OBU Assets/Liabilities at End-2000 25
4.9 Geographical Classification of IB Assets/Liabilities at End-2000 26
4.10 Currency Structure of IB Assets/Liabilities at End-2000 26
4.11 Employment in the Banking & Financial Sector 1999 - 2000 27
LIST OF TABLES

NUMBER DESCRIPTION PAGE
1.1 Inflation Rates 2
1.2 Exchange Rates for SDR Against Selected GCC Currencies 3
2.1 Gross Domestic Product at Current Prices 7
2.2 Gross Domestic Product at Constant Prices 8
2.3 Selected Oil Statistics 9
2.4 Natural Gas Production and Utilisation 10
2.5 Government Finance 12
3.1 Value of Exports 13
3.2 Valueof Imports 14
3.3 Direction of Non-Oil Trade 16
3.4 Non-Oil Trade with GCC Countries 17
3.5 Balance of Payments 18
4.1 Domestic Liquidity 19
4.2 Factors Affecting Domestic Liquidity 20
4.3 Private and Public Sector Deposits 22
4.4 Outstanding Commercial Bank Credit to Residents by 23
Economic Sectors
4.5 Interest Rates on Deposits 24
4.6 Interest Rates on Loans and Overdrafts 25
64
NUMBER DESCRIPTION PAGE
1-1 Economic Growth Rates 1
1-2 Gold Prices in 2000 3
2-1 Bahrain – Economic Growth Rates 4
2-2 Bahrain - Selected Oil Statistics 7
2-3 Bahrain – Alba’s Aluminium Production and Exports 8
2-4 Bahrain – Government Finance 9
3-1 Bahrain - Foreign Trade 13
3-2 Bahrain - Direction of Non-Oil Trade During 2000 14
3-3 Bahrain - Direction of Non-Oil Trade with GCC Countries During 2000 15
4-1 Bahrain - Domestic Liquidity 18
4-2 Bahrain – Consolidated Balance Sheet of the Banking System 20
4-3 Bahrain - FCB Deposit Trends 22
4-4 Bahrain - Outstanding Commercial Bank Credit to Residents in 2000 23
LIST OF CHARTS

65