the latest myths and facts on global warming · the latest myths and facts on global warming. the...
TRANSCRIPT

The Latest Myths and Factson Global Warming


The Latest Myths and Factson Global Warming
AUTHORSDr. James Wang
SCIENTIST, CLIMATE AND AIR PROGRAM, ENVIRONMENTAL DEFENSE
Dr. Michael OppenheimerPROFESSOR OF GEOSCIENCES AND INTERNATIONAL AFFAIRS, PRINCETON UNIVERSITY

Cover image: Photodisc
Our missionEnvironmental Defense is dedicated to protecting the environmental rights of allpeople, including the right to clean air, clean water, healthy food and flourishingecosystems. Guided by science, we work to create practical solutions that win last-ing political, economic and social support because they are nonpartisan, cost-effective and fair.
©2005 Environmental Defense
Printed on paper that is 80% recycled, 80% post-consumer, processed chlorine free (text);100% recycled, 50% post-consumer, processed chlorine free (cover).
The complete report is available online at www.environmentaldefense.org.

iii
Executive summary iv
Introduction 1
Part I. Is global warming happening? 2MYTH #1: Winters have been getting colder 2MYTH #2: Satellite measurements show a smaller warming than surface 2measurementsMYTH #3: The warming over the past century is nothing unusual; it is 3part of a natural cycleMYTH #4: Earth’s climate is self-regulating 5MYTH #5: Recent extreme events have no link to climate change 5
Part II. Is global warming being caused by human activities? 8MYTH #6: Humans cannot be responsible for the increase in atmospheric CO2 8MYTH #7: The warming of the past century has been caused by natural 8factors, such as solar variability, a recovery from the Little Ice Age, cosmic raysMYTH #8: Global warming has been caused by the urban heat island effect 10
Part III. Can we have any confidence in predictions of future climate 11change?MYTH #9: Models cannot predict the climate many years in advance 11MYTH #10: Models have many flaws that make them useless in predicting climate 11MYTH #11: The growth of emissions in the IPCC scenarios is unrealistically high 11MYTH #12: We can’t trust global warming predictions since scientists just a few 12decades ago warned that a new ice age was approachingMYTH #13: The science behind the theory of global warming is too uncertain 13for policy making
Part IV. How harmful would the predicted warming be? 14MYTH #14: The warming predicted by the IPCC is small and hardly a cause 14for concernMYTH #15: Global warming and increased CO2 would be beneficial 14
Part V. What should we do about global warming? 16MYTH #16: Society can easily adapt to climate change 16MYTH #17: Forests in the Northern Hemisphere are absorbing as much CO2 16as is emitted by burning fossil fuelsMYTH #18: It would be safe and more effective to wait to solve the problem 17rather than act nowMYTH #19: Humankind is foolish to believe it is capable of controlling the climate 17
References 18
FiguresFigure 1: Temperature trends for the Northern Hemisphere over the past 41,000–2,000 years.Figure 2: Comparison of modeled and observed temperature trends since 1860 9
Contents

iv
This summary provides a brief overview of the most common myths regardingglobal warming. For a more comprehensive and in-depth discussion of thescientific issues, please see the main body of the report. While written for ageneral audience, the main body of the report includes citations of peer-reviewedscientific literature.
MYTH: Global warming can’t be happening, since winters have been getting colder.
FACT: Winters have been getting warmer. Measurements show that Earth’s climatehas warmed overall over the past century, in all seasons, and in most regions. Theskeptics mislead the public when they bill the winter of 2003–2004 as record cold inthe northeastern United States. That winter was only the 33rd coldest in the regionsince records began in 1896. Furthermore, a single spell of cold weather in one smallregion is no indication of cooling of the global climate, which refers to a long-termaverage over the entire planet.
MYTH: Satellite measurements of temperature over the past two decades show a muchsmaller warming in the atmosphere than is measured by thermometers at the surface.This contradicts global warming predictions based on climate models.
FACT: Recent research has corrected problems that led to underestimates of thewarming trend in earlier analyses of satellite data. The new results show anatmospheric warming trend slightly larger than at the surface, exactly as modelspredict.
MYTH: The global warming over the past century is nothing unusual. For example, theMedieval Warm Period (MWP), roughly from A.D. 1000 to 1400, was warmer thanthe 20th century. This indicates the global warming we are experiencing now is part ofa natural cycle.
FACT: Ten independent scientific studies all have found a large 20th-centurywarming trend compared to temperature changes over the past millennium or two.Uncertainty exists as to exactly how warm the present is compared to the MWP.Some studies have received valid criticism for possibly underestimating the magni-tude of longer-lasting, century-scale temperature changes, such as the warmingduring the MWP. However, other studies, using different methods, still find noevidence of any period during the last 2,000 years that was warmer than the 1990s.Most importantly, any uncertainty about whether the present is warmer than theMWP has little effect on the finding that humans likely have caused most of thewarming over the past 50 years. A separate body of studies has provided the mainevidence for this finding. (See the Myth on causes of warming.)
MYTH: Human activities contribute only a small fraction of carbon dioxide (CO2)emissions, far too small to have a significant effect on the concentration of thegreenhouse gas in the atmosphere.
FACT: Before the Industrial Revolution, the amount of CO2 emitted from largenatural sources closely matched the amount that was removed through naturalprocesses. That balance has now been upset by human activities, which since the
Executive summary

v
Industrial Revolution have put twice as much CO2 into the atmosphere as can bereadily removed by the oceans and forests. This has resulted in the accumulation ofCO2 to the highest levels in 420,000 years.
MYTH: The Earth’s warming is caused by natural factors like increased sunlight andsunspots or decreased cosmic rays, not by greenhouse gases (GHGs).
FACT: Modeling studies indicate that most of the warming over the past severaldecades was probably caused by the increase in human-produced GHGs. Climatemodels have difficulty reproducing the observed temperature changes over the past150 years unless they account for the increase in GHGs as well as natural factors,such as sunlight and volcanic eruptions, and changes in the amount of human-produced sulfate particles, which cool the planet. Satellite measurements of theintensity of sunlight exhibit little or no trend over the past 25 years, when there wasrapid warming on Earth. The purported correlations between the amount of cosmicrays and Earth’s temperature are the result of flawed analysis methods.
MYTH: The warming observed during the past century was caused by urbanization(urban heat island effect).
FACT: Urbanization does increase temperatures locally, affecting thermometerreadings in certain areas. But the temperature data used in trend analyses are adjustedto remove any bias from urbanization. In any case, urbanization has an insignificanteffect on global temperature trends.
MYTH: Models have trouble predicting the weather a few days in advance. How canwe have any confidence in model projections of the climate many years from now?
FACT: Climate prediction is different from weather prediction, just as climate isdifferent from weather. Models are now sophisticated enough to be able to repro-duce the observed global average climates over the past century as well as overother periods in the past. Thus, scientists are confident in the models’ ability toproduce reliable projections of future climate for large regions. Furthermore,climate assessments typically consider the results from a range of models andscenarios for future GHG emissions, in order to identify the most likely rangefor future climatic change.
MYTH: The science behind the theory of global warming is too uncertain to drawconclusions useful to policy makers.
FACT: The primary scientific debate is about how much and how fast, rather thanwhether, additional warming will occur as a result of human-produced GHGemissions. While skeptics like to emphasize the lower end of warming projections,uncertainty actually applies to both ends of the spectrum—the climate could changeeven more dramatically than most models predict. Finally, in matters other thanclimate change, policy decisions based on uncertain information are made routinelyby governments to ensure against undesirable outcomes. In the case of globalwarming, scientists have given society an early warning on its possibly dangerous,irreversible and widespread impacts.
MYTH: Global warming and increased CO2 would be beneficial, reducing cold-relateddeaths and increasing plant growth (“greening the Earth”).

vi
FACT: If society does not limit further warming, the beneficial effects probably willbe heavily outweighed by negative effects. Regarding cold-related deaths, studieshave indicated that they might not decrease enough to compensate for a significantincrease in heat-related deaths. Even though higher levels of CO2 can act as a plantfertilizer under some conditions, they do not necessarily benefit the planet, sincethe fertilization effect can diminish after a few years in natural ecosystems as plantsacclimate. Furthermore, increased CO2 may benefit undesirable, weedy speciesmore than others.
MYTH: Society can easily adapt to climate change; after all, human civilization hassurvived through climatic changes in the past.
FACT: While humans as a species have survived through past climatic changes, indi-vidual civilizations have collapsed. Unless we limit GHGs in the atmosphere, wewill face a warming trend unseen since the beginning of human civilization. Manydensely populated areas, such as low-lying coastal zones, are highly vulnerable toclimate shifts. A middle-of-the-range projection indicates the homes of 13 to 88million people would be flooded by the sea each year in the 2080s. Many ecosystemsand species already threatened by other human activities may be pushed to the pointof extinction.
MYTH: CO2 is removed from the atmosphere fairly quickly, so we can wait to takeaction until after we start to see dangerous impacts from global warming.
FACT: Global warming cannot be halted quickly. CO2 and other GHGs can remainin the atmosphere for many centuries. Even if emissions were eliminated today, itwould take centuries for the heat-trapping GHGs now in the atmosphere to fall topre-industrial levels. Only by starting to cut emissions now can humanity avoid theincreasingly dangerous and irreversible consequences of climate change.

1
A vast majority of climate scientists agree that global warming is happening and thatit poses a serious threat to society. They also agree that it is being caused largely byhuman activities that release greenhouse gases, such as burning fossil fuels in powerplants and cars and deforesting the land. This scientific consensus emerged graduallyover decades of research and debate. The current state of knowledge on climate issummed up in the periodic reports of the Intergovernmental Panel on ClimateChange (IPCC), which are compiled by thousands of scientists. Unfortunately, muchof the American public remains unaware of this overwhelming scientific agreement.Part of the blame for this lies with coordinated efforts within certain industriesto spread misinformation about global warming.
This report is intended to provide a comprehensive discussion of common mythsand misunderstandings regarding climate change. Our goal is to provide members ofCongress and their staff, journalists and the public with detailed, well-researched anduser-friendly information on these issues. This will allow readers to see that globalwarming science is not split between two opposing camps, as the public may oftenbelieve. Our rebuttals of myths are based on peer-reviewed, widely accepted scientificpublications, which are cited and listed at the end of the report. For a less technicalsummary of only the most common myths, see the executive summary.1
Introduction
1 This report will be updated in response to new developments. Suggestions for improvements andadditions are welcome. Please send suggestions to Dr. James Wang, Environmental Defense, 257Park Ave. S., New York, NY 10010; [email protected]

2
MYTH #1: Winters have been getting colder; for example, the winter of 2003–2004 in thenortheastern U.S. was the coldest on record. Therefore global warming can’t be happening.
FACT: Winters have been getting warmer. Independent analyses of measurementsby different scientists show that the Earth’s climate has warmed overall over the pastcentury, in all seasons, and in most regions. (The studies are summarized in the ThirdAssessment Report of the Intergovernmental Panel on Climate Change, 2001.)
The skeptics are doubly misleading when they bill the winter of 2003-2004 asrecord cold in the northeastern U.S. and imply that it disproves global warmingpredictions. While that winter was colder than average in the Northeast, it ranked asonly the 33rd coldest in that region since records began in 1896 (NCDC, Climate of2004, 2004). January 2004, when the most severe cold of the season occurred, was the11th coldest January in the Northeast. No all-time low temperature records werebroken in the Northeast that winter (NCDC, Climate of 2004, 2004). Only recordsfor a given day of the year, such as January 16th, were broken, which is nothingunusual; the temperatures were not the coldest that had ever been experienced on anyday. This contrasts with the 2003 heat waves in Europe, during which many all-timerecord high temperatures occurred (see Myth #5).
In addition, a single spell of cold weather in one small region is no indication thatthe Earth’s climate is not warming. “Weather” refers to the atmospheric conditions ata particular time and location, while “climate” refers to the long-term average weatherfor a location. Scientists say that the Earth’s climate has been warming, since, onaverage, temperatures have been increasing over a long period of time in mostregions. The global average temperature for January 2004 ranked as the fourthwarmest on record (NCDC, Climate of 2004, 2004), showing that colder-than-usualweather was limited to a small area. Even with global warming, we will occasionallyexperience an unusually cold winter somewhere on Earth, since weather variesnaturally from year to year and from place to place. But record-breaking cold isexpected to become less common as the climate continues to warm, shifting thebounds within which weather fluctuates.
MYTH #2: Satellite measurements of temperature over the past two decades show amuch smaller warming a few miles above Earth’s surface than is measured by ther-mometers at the surface.2 These observations show that computer climate models arewrong, since they predict that increasing amounts of greenhouse gases should causeslightly greater warming above the surface.
FACT: Recent research has corrected problems that led to underestimates of thewarming trend in earlier analyses of satellite data. The early work of Spencer andChristy (1990), as well as subsequent revisions (Christy et al. 2003, and referencestherein), found little or no warming in the troposphere based on satellite data.Skeptics continue to cite these results.
But two recent studies made different corrections to those analyses which, whenadded together, completely eliminate the discrepancy between climate models and
PART I
Is global warming happening?
2 The region of the atmosphere examined in these satellite analyses, comprising the lowermost partof the atmosphere, is known as the troposphere.

3
observations. Mears et al. (2003), in a reanalysis of the satellite data, took intoaccount various difficulties in determining a temperature trend from weathersatellites. First, since no single satellite has been monitoring temperatures for along period of time, researchers have had to rely on combining data from differentsatellites. However, different satellites have different instruments that need to be cali-brated precisely against one another. Second, even one satellite may not produce con-sistent measurements over time, since satellite orbits can drift. After accounting forthese factors, Mears et al. found a satellite temperature trend closer in size to thesurface trend than in previous studies.
Fu et al. (2004) found another major problem with previous analyses. Satellite datathat actually blend temperature readings in the stratosphere (the layer of atmosphereabove the troposphere) with those in the troposphere were previously misinterpretedas representing only tropospheric temperatures. A strong cooling of the stratosphereover the same time period partly cancels out the tropospheric warming in the satellitemeasurements (the averaging of a warming trend and a cooling trend results in littletrend).3 Fu et al. isolated the portion of the data that represented just the troposphere,and, accounting also for the corrections by Mears et al., found that the tropospherewarmed slightly more than the surface, exactly as models predict. This finding dispelsthe notion that satellite data disprove the role of greenhouse gases in global warming.
Weather balloon measurements may also show a smaller tropospheric warmingtrend than that observed at the surface. But here again, the interpretation of thesemeasurements suffers from difficulties, such as sparse spatial coverage and incon-sistencies among instruments (Fu et al. 2004). So trends derived from balloon dataare not reliable.
MYTH #3: Even if Earth has been warming over the past century, it is nothingunusual. For example, temperature reconstructions show that there was a periodknown as the Medieval Warm Period, roughly from A.D. 1000 to 1400, that waswarmer than the 20th century. This means that the global warming we are experi-encing now is part of a natural cycle.
FACT: Ten independent scientific studies have all found a large 20th-centurywarming trend compared to other temperature changes over the past millenniumor two. (See Figure 1a.) Some of the studies carefully reconstructed a history oftemperatures across the globe over the past 1,000 years or more based on differentkinds of records (ice cores, tree rings, historical documents, etc.) The rest of thestudies calculated past temperature changes using climate models and an estimateof how climatic factors such as sunlight, volcanic eruptions and greenhouse gaseschanged over time.
Uncertainty exists as to exactly how warm the present is compared to the MedievalWarm Period. Recently, von Storch et al. (2004) argued validly that the method usedin some temperature reconstruction studies may underestimate the magnitude of pastclimate changes; however, the study does not answer the question of how warm theMedieval Warm Period actually was. Further support for the idea of an unusual 20thcentury warming is provided by a recent temperature reconstruction by Moberg et al.(2005), who consciously avoided the method criticized by von Storch et al. Although
3 The cooling of the stratosphere was largely a result of ozone depletion caused by chloro-fluorocarbons (CFCs) and other human-produced chemicals.

4
200 400 600 800 1000 1200 1400 1600 1800 2000
Mann et al. 1999 with uncertaintiesJones et al. scaled 1856-1980Crowley and LoweryEsper et al. scaled 1856-1980Mann et al. 2003 (gridded, area-weighted boreholes)Mann et al. 2003 ("optimal" borehole reconstruction)Mann and Jones with uncertaintiesBriffa et al. scaled 1856-1980
Crowley EBMBauer et al. EBMGerber et al.1.5CO2Gerber et al. 2.5CO2
Instrumental recordInstrumental records/reconstructions
Simulations
Year A.D.
Tem
pera
ture
cha
nge
(°C
)
0.8
0.6
0.4
0.2
0
–0.4
–0.6
–0.8
–0.2
Instrumental data (AD 1902 to 1969)Reconstruction (AD 1000 to 1980)Reconstruction (40-year smoothed)Linear trend (AD 1000 to 1900) 1998 instrumental value
1000 1200 1400 1600 1800 2000
1.0
0.5
0.0
–0.5
–1.0
Year
Nor
ther
n H
emis
pher
e an
omal
y (°
C) r
elat
ive
to 1
961
to 1
990
FIGURE 1Temperature trends for the Northern Hemisphere over the past1,000–2,000 years.
a) Comparison of various temperature reconstructions and model simulations for theNorthern Hemisphere (more data is available here than in the Southern Hemisphere)for the last 2,000 years. All show anomalous warming in the 20th century.Source: Mann et al. (2003a). Copyright 2003 American Geophysical Union. Reprinted by permission ofAmerican Geophysical Union.
b) Northern Hemisphere temperature changes over the past millennium based onthe work of Mann et al. (1999). The gray vertical lines represent the uncertainty (twostandard deviations).Source: Reprinted with permission from the IPCC Third Assessment Report (2001).
5
they find that the Medieval Warm Period may have been warmer than previouslyestimated, they “find no evidence for any earlier periods in the last two millennia withwarmer conditions than the post-1990 period—in agreement with previous similarstudies.” In contrast to these two studies, a number of papers arguing for a very warmMedieval Warm Period contain serious flaws. These include articles by Willie Soonand Sallie Baliunas, and Stephen McIntyre and Ross McKitrick. See the box on “The‘hockey stick’ controversy.”
But what if future research were to produce results drastically different from thescientific studies to date, indicating with a high degree of certainty that the MedievalWarm Period was warmer than the present? That would have very little impact onthe scientific case for a human cause of the current warming; whether or not theMedieval Warm Period was warmer provides only one piece of evidence in deter-mining what is causing the current warming. That there were warmer periods in thepast caused by natural factors (such as millions of years ago when tropical speciesflourished in polar regions) is insufficient reason to assume that the current warmingalso is natural. In fact, a whole body of studies separate from the ones discussed abovehave focused on the physical factors potentially responsible for changing the climateover the past 150 years, and they indicate with a high degree of confidence that mostof the warming over the past 50 years was caused by human-produced greenhousegases. (See Myth #7.)
The current warming is unlikely to be entirely natural and inevitable. Humanitylargely controls how much climate change will unfold over the coming centuries.
MYTH #4: The Earth’s climate is self-regulating—natural control mechanisms preventvery large swings. For example, Richard Lindzen claims that the Earth has a planetary“iris,” consisting of tropical cloud cover that expands or contracts to control the amountof heat that escapes from the surface out to space (Lindzen et al. 2001).
FACT: The Earth’s climate actually has been very unstable in the distant past. Therehave been times, hundreds of millions of years ago, when much of the planet wascovered in ice. Tens of millions of years ago, tropical species flourished in polarregions (such as during the era of the dinosaurs). A wealth of scientific evidenceindicates that the climate has changed significantly and abruptly (within one or afew decades) numerous times in the past. (For a comprehensive review ofthe literature on this subject, see the 2002 report by the National Academyof Sciences.) While the climate has been relatively stable since human civilizationstarted around 10,000 years ago, the warming projected to occur over the nextcentury with unrestrained emissions of greenhouse gases is likely to exceed anythingseen in the last 10,000 years (IPCC 2001). This warming could cross certainthresholds for abrupt climate change, triggering such dangerous events as a shutdownof the ocean currents that supply nutrients to important fisheries and moderate theclimate in Europe and other regions (Sarmiento et al. 2004).
MYTH #5: Recent extreme events such as record heat waves, intense precipitation,massive forest fires and worldwide coral bleaching have no link to climate change.
FACT: These recent events are all consistent with a warming world and can beexpected to occur more frequently with global warming.
Heat waves and extreme precipitation: Weather fluctuates naturally, resulting attimes in extreme events, even in the absence of climate change. However, the increase
Whether or notthe Medieval WarmPeriod was warmerthan the presentprovides only onepiece of evidence indetermining what iscausing the currentwarming.

6
Many critiques by global warming skeptics havefocused on the work of one particular groupof climate scientists, Dr. Michael Mann andcolleagues. Their graph of temperature variationsover the past 1,000 years (Mann et al. 1999) isfeatured prominently in the 2001 AssessmentReport of the Intergovernmental Panel onClimate Change (IPCC). The temperature trendis often known as the “hockey stick” because ofits shape: nearly flat for most of the millenniumand then a sharp upward turn in the 20th century(see Figure 1b). In their critiques of Mann’sfindings, the skeptics claim that they haveweakened a primary pillar on which the IPCC’sconclusions about human-produced warmingrest. That claim is incorrect. The truth is thatother independent studies have found similartemperature trends; the differences that do arisedo not affect the overall conclusion that 20thcentury warming is relatively large and long-lasting (see Figure 1a). Furthermore, how warmthe Medieval Warm Period was compared to thepresent, which is the focal point of the skeptics’critiques, is only a secondary piece of evidencefor what is causing the present warming. TheIPCC actually assessed an entirely different bodyof studies to come to the conclusion that humanscaused most of the recent climatic change.4
Some of the analyses critiquing the work ofMann et al. have serious flaws. For example, apair of similar papers by Willie Soon and SallieBaliunas use subjective and unscientific methodsto paint a picture of a Medieval Warm Periodthat was much warmer than the present. Arebuttal was published by thirteen climatescientists (Mann et al. 2003a, b). Soon andBaliunas use incorrect criteria for definingpast warm periods. They actually consider aperiod to be warm even if it was simply unusuallywet or dry, rather than basing their judgmentstrictly on direct indicators of temperature. Theauthors also consider the entire interval, A.D.800–1300, to be warm, even though their dataindicate that the warmth occurred only inscattered regions at any given time. True globalwarming occurs when temperatures over largeareas increase simultaneously. Also, manyscientists have found that the results of their
studies were misinterpreted by Soon andBaliunas in a way that bolstered the authors’thesis (Monastersky 2003).
A paper published in 2003 by Stephen McIntyreand Ross McKitrick, claiming to be an audit of astudy by Mann et al. (1998), used data from acorrupted electronic file, arbitrarily omitted 80%of the data before 1600, and replaced certain datawith incompatible data, artificially resulting intemperatures during the 1400s that were warmerthan during the late 1900s (Rutherford et al., inpress, 2005). A paper published in 2005 byMcIntyre and McKitrick claims that the hockeystick pattern is an artificial result of the methodused by Mann et al. rather than an unbiasedcompilation of the data. Mann et al. used aversion of a method known as principal com-ponents analysis, which basically boils a largeamount of data down to its main features, or“principal components.” One main problem withMcIntyre and McKitrick’s critique is that theymisunderstand why Mann et al. used principalcomponents analysis—Mann et al. used it tosummarize all the important features of the data,not to extract only the one chief feature. Thereason McIntyre and McKitrick’s version of thedata doesn’t have a hockey stick pattern is thatthey display only the first principal component,omitting other critical principal components. Inaddition, scientists have shown that the hockeystick pattern emerges regardless of what versionof principal components analysis is used or evenwhether principal components analysis is used(Rutherford et al., in press, 2005).
Recently, von Storch et al. (2004) argued validlythat the method used in Mann et al. and someother temperature reconstruction studies mayunderestimate the magnitude of past climatechanges, particularly the longer-lasting, century-scale changes such as during the Medieval WarmPeriod. But this paper provides no definitiveanswer as to how large the underestimates are(Osborn and Briffa 2004). Also, the temperaturereconstruction of Moberg et al. (2005), whichavoids the method criticized by von Storch et al.,still provides no indication that there were anyperiods in the past 2,000 years that were warmerthan the 1990s.
The “hockey stick” controversy
4 Chapter 2 in volume 1 (“The Scientific Basis”) of the Third Assessment Report describes the hockey stick, while Chapter 12 analyzes the causesof climate change.

7
in global average temperature over the past century, which constitutes a changein climate, shifts the bounds within which weather fluctuates. This climate changeincreases the likelihood that high temperature records will be broken and intenseprecipitation events will occur. (Precipitation becomes more intense because highertemperatures promote increased evaporation and thus higher moisture content in theatmosphere.) In fact, some scientists estimate that human-produced greenhouse gaseshave already at least doubled the chance of an extreme heat wave like the one thatscorched Europe in 2003 (Stott et al. 2004). According to measurements, precipi-tation appears to have increased in intensity over recent decades, at least in certainregions (IPCC 2001).
During the 2003 heat waves in Europe, many all-time high temperature recordswere broken. The temperature surpassed 100°F in the United Kingdom for the firsttime since records began (NCDC, Climate of 2003, 2004). Furthermore, the Europeanheat waves were part of an unusually warm summer overall, which appears to havebeen the hottest in Europe in at least the last 500 years (Luterbacher et al. 2004).
Forest fires: Global warming is expected to cause, and may already have caused,more severe droughts in many regions. The ongoing drought in the western U.S.,possibly the worst in 500 years, may be caused by unusually warm waters in thewestern Pacific and other effects of global warming (Cook et al. 2004; Hoerling andKumar 2003). Parched conditions and high temperatures associated with droughtcreate ideal conditions for wildfires to spread. Global warming also lengthens the fireseason and promotes outbreaks of tree-killing insects, which create a large amount ofdry fuel to stoke forest fires (ACIA 2004). The amount of forest burned annually hasbeen increasing over recent decades in some regions, such as the Arctic (ACIA 2004).Alaska experienced its worst fire year ever in 2004, a year with the warmest and thirddriest summer on record (NIFC 2004).
Coral bleaching: The incidence of large-scale coral “bleaching” events has increasedaround the world since 1979, and most evidence indicates that these mass bleachings,which can lead to coral death, are caused by global warming (Hoegh-Guldberg 1999).An increase in water temperature causes coral bleaching, and the average surfaceocean temperature in many tropical regions rose by almost one degree C (1.8°F) overthe last century. In 1997–98, the largest bleaching event on record damaged 16% ofthe reefs in the world and killed 1,000-year-old corals (Global Coral Reef Monitor-ing Network 2004; Hoegh-Guldberg 1999).

8
MYTH #6: The amount of carbon dioxide (CO2) generated by human activities is muchsmaller than natural sources; therefore, human activities cannot be responsible for thelarge observed increase in atmospheric CO2 over the past few centuries.
FACT: It is undisputed that humans are entirely responsible for the increase inatmospheric CO2 over the past few centuries. In pre-industrial times, large naturalsources of CO2 were balanced by equally large natural removal processes, such asphotosynthesis in plants, maintaining a stable level of CO2 in the atmosphere forthousands of years. Human-produced emissions, though smaller than naturalemissions, upset this balance. Because human-produced emissions aren’t completelyabsorbed by natural processes, they accumulate in the atmosphere, increasing theconcentration of CO2 (McElroy 2002).
MYTH #7: The warming of the past century has been caused by natural factors, such assolar variability, a recovery from the Little Ice Age, cosmic rays, etc.; the warming wasnot caused by the increase in greenhouse gases (GHGs). This is shown by the fact thatthe warming has not followed the trend of GHG concentrations.
FACT: While natural factors have been important causes of climatic changes in thepast, human-produced GHGs have become increasingly dominant over the lastcentury. Scientists know with certainty that GHGs have an important effect onclimate. GHG molecules absorb infrared radiation emitted by the Earth’s surface andre-emit it downward, acting as a blanket that traps heat at the surface and warms theplanet. Without the naturally occurring “greenhouse effect,” the average temperatureof the Earth would be about 35°C (63°F) colder than at present, or an inhospitable–20°C (–4°F) (McElroy 2002). The problem is that humans are increasing the amountof GHGs in the atmosphere.
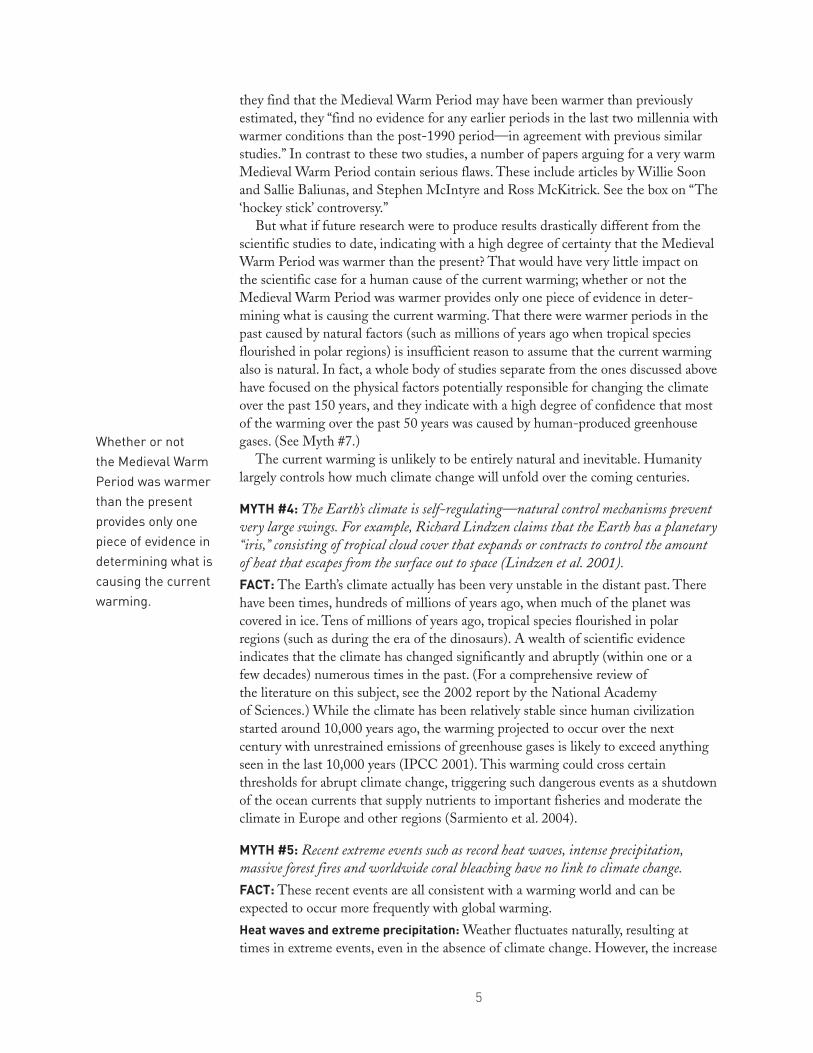
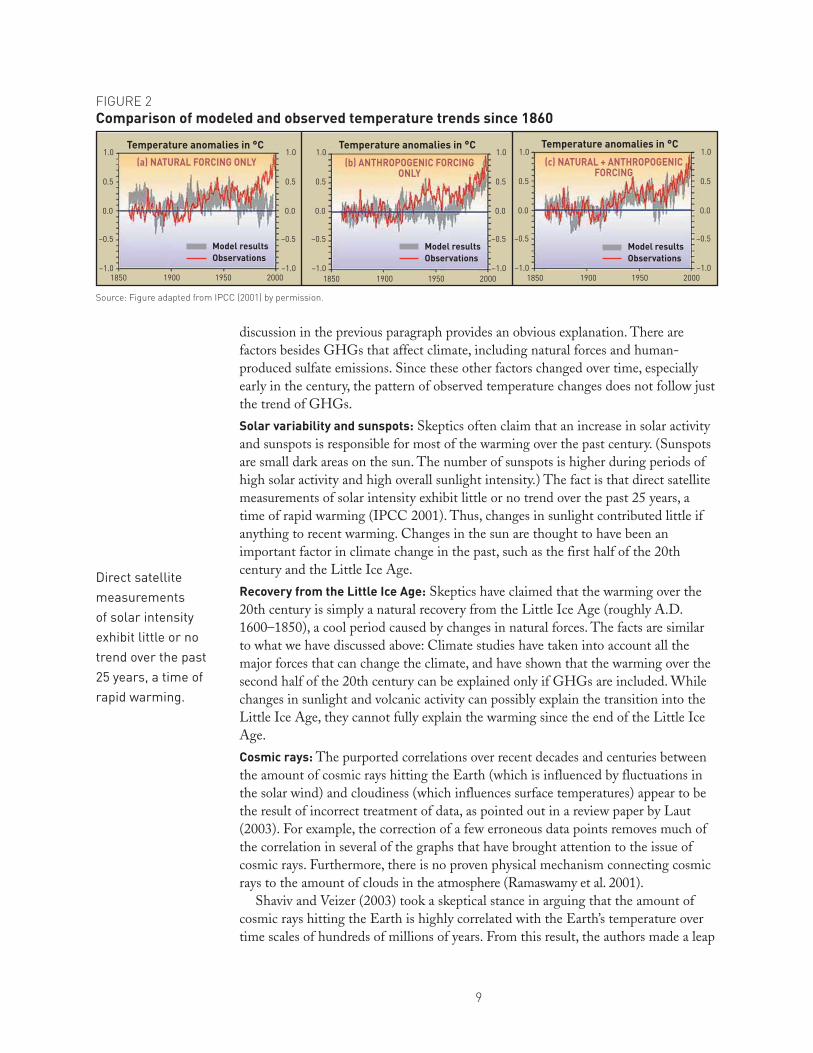
Scientists have conducted studies to calculate how much of the warming over thepast century was caused by GHGs as opposed to natural factors. When humaninfluences (including the effects of GHGs and cooling sulfate particles5) and naturalfactors (including solar variations, volcanic eruptions and random variability) are bothtaken into account in climate models, the simulated temperature changes over thepast 140 years agree closely with observed changes (see Figure 2). If, however, humaninfluences are omitted from the models, the simulated temperature changes do notmatch the observed changes. These results provide strong evidence that humaninfluences have contributed to the observed warming. In fact, it is likely that human-produced GHGs have been the dominant cause of the observed global warming overthe past few decades, as can be seen in Figure 2. Natural factors are unlikely toexplain the increased rate of warming since the middle of the 20th century, as theoverall trend in natural forcing (warming effect) was likely small or even negativeover the last two to four decades, according to measurements (IPCC 2001).
Trends of temperature vs. GHGs: It is true that temperatures have not strictlyfollowed the trend of GHGs—over the past century, temperatures first rose, thenfell slightly, then rose again, while GHGs rose steadily the entire time. But our
PART II
Is global warming being caused by human activities?
5 Human-produced sulfate particles originate primarily from the combustion of fossil fuels,especially coal. Sulfate particles in the air reflect sunlight and cool the Earth.
9
discussion in the previous paragraph provides an obvious explanation. There arefactors besides GHGs that affect climate, including natural forces and human-produced sulfate emissions. Since these other factors changed over time, especiallyearly in the century, the pattern of observed temperature changes does not follow justthe trend of GHGs.
Solar variability and sunspots: Skeptics often claim that an increase in solar activityand sunspots is responsible for most of the warming over the past century. (Sunspotsare small dark areas on the sun. The number of sunspots is higher during periods ofhigh solar activity and high overall sunlight intensity.) The fact is that direct satellitemeasurements of solar intensity exhibit little or no trend over the past 25 years, atime of rapid warming (IPCC 2001). Thus, changes in sunlight contributed little ifanything to recent warming. Changes in the sun are thought to have been animportant factor in climate change in the past, such as the first half of the 20thcentury and the Little Ice Age.
Recovery from the Little Ice Age: Skeptics have claimed that the warming over the20th century is simply a natural recovery from the Little Ice Age (roughly A.D.1600–1850), a cool period caused by changes in natural forces. The facts are similarto what we have discussed above: Climate studies have taken into account all themajor forces that can change the climate, and have shown that the warming over thesecond half of the 20th century can be explained only if GHGs are included. Whilechanges in sunlight and volcanic activity can possibly explain the transition into theLittle Ice Age, they cannot fully explain the warming since the end of the Little IceAge.
Cosmic rays: The purported correlations over recent decades and centuries betweenthe amount of cosmic rays hitting the Earth (which is influenced by fluctuations inthe solar wind) and cloudiness (which influences surface temperatures) appear to bethe result of incorrect treatment of data, as pointed out in a review paper by Laut(2003). For example, the correction of a few erroneous data points removes much ofthe correlation in several of the graphs that have brought attention to the issue ofcosmic rays. Furthermore, there is no proven physical mechanism connecting cosmicrays to the amount of clouds in the atmosphere (Ramaswamy et al. 2001).
Shaviv and Veizer (2003) took a skeptical stance in arguing that the amount ofcosmic rays hitting the Earth is highly correlated with the Earth’s temperature overtime scales of hundreds of millions of years. From this result, the authors made a leap
Temperature anomalies in °C
Model resultsObservations
(a) NATURAL FORCING ONLY1.0
0.5
0.0
–0.5
–1.0
1.0
0.5
0.0
–0.5
–1.01850 1900 1950 2000
Temperature anomalies in °C
Model resultsObservations
1.0
0.5
0.0
–0.5
–1.0
1.0
0.5
0.0
–0.5
–1.01850 1900 1950 2000
(b) ANTHROPOGENIC FORCINGONLY
(c) NATURAL + ANTHROPOGENIC FORCING
Model resultsObservations
Temperature anomalies in °C1.0
0.5
0.0
–0.5
–1.0
1.0
0.5
0.0
–0.5
–1.01850 1900 1950 2000
FIGURE 2Comparison of modeled and observed temperature trends since 1860
Source: Figure adapted from IPCC (2001) by permission.
Direct satellitemeasurementsof solar intensityexhibit little or notrend over the past25 years, a time ofrapid warming.

10
in logic and asserted that the current centuries-long increase in CO2 concentrationsdue to human activities will have only a small warming effect.6 Also, Shaviv andVeizer used questionable methods to obtain a high correlation between cosmic rayflux and temperature (Rahmstorf et al. 2004). Furthermore, Royer et al. (2004)found that the non-standard temperature history used by Shaviv and Veizer containedmajor errors. Royer et al. conclude that there is no reason to revise the conventionalview that CO2 has had a dominant influence on climate variations over the past545 million years.
MYTH #8: The global warming observed for the past century at Earth’s surface has beencaused by urbanization (urban heat island effect) and other changes in land surfaces,such as deforestation, not greenhouse gases.
FACT: It is true that urbanization increases temperatures locally, and can potentiallyaffect the determination of the global trend, since some measurement sites are locatedin urban areas. Buildings and pavement absorb sunlight, heating up theirsurroundings, and dense human settlements release significant amounts of wasteheat. Urban and agricultural areas also replace trees, which cool the Earth’s surface byproviding shade and evaporating water drawn up from the soil. But the claim that theobserved increase in global average temperature is due to these changes in landsurfaces is wrong, since the analyses showing the warming account for and removeany biases caused by urbanization (for example Hansen et al. 1999; Jones et al. 2001).In any case, it has been shown that urbanization has had an insignificant effect onglobal and even regional temperature trends (Peterson 2003). In addition,temperatures have risen significantly over oceans as well as over land, providingfurther evidence that changes in land surfaces are not the primary cause of theobserved warming.7
6 One major flaw in the analysis of Shaviv and Veizer is that the averaging of the data over verylong intervals of 50 million years removes information on shorter-term fluctuations in CO2 andtemperature, such as the high correlation between CO2 and temperature over the past 400,000years. Thus, it is no wonder that they calculated a weak response of temperature to changes inCO2.
7 The warming has been less over oceans than over land, but the size of the land-ocean contrastagrees quite well with what models predict will occur with increasing greenhouse gases (forexample, Karoly et al. 2003).

11
MYTH #9: Models have trouble predicting the weather a few days in advance. Whatmakes us think we can predict the climate many years in advance?
FACT: Climate prediction is different from weather prediction. For example, althoughit is notoriously difficult to predict if it will rain on any particular day at a specificlocation, scientists can predict with near certainty that on average, at high latitudesof the Northern Hemisphere, it will be colder in December than in July. Climatemodels are now sophisticated enough to be able to recreate past global mean climates,including climate change over the last 100 years, with reasonable accuracy. Finally,climate assessments usually report results from a range of models that represent theboundaries of scientific projections. (For example, they report the least that globalaverage temperature is likely to change, and the most). All this adds to our confi-dence that projections of future climate over broad regions are increasingly reliable.
MYTH #10: Climate models have many flaws and cannot even simulate past climatechanges properly, making them useless in predicting global warming.
FACT: Computer models are an integral part of climate science, as well as manyother fields of science, such as astrophysics and biomedicine. Climate models consistof mathematical representations of physical, chemical and biological processes. Thefirst models to simulate the effects of increasing GHGs on climate were developedin the 1960s (e.g. Manabe and Wetherald 1967), and climate models have improvedsteadily ever since. They include more and more processes, rely on fewer approxi-mations or parameterizations (simplifications), and achieve better spatial resolution(in other words, models compute the climate from place to place in greater andgreater detail, like using “zoomed in” maps rather than less detailed ones) (IPCC2001). State-of-the-art statistical techniques are used in evaluating model results.Recent models have demonstrated the ability to reproduce the climate changesobserved over the past century (see Figure 2) as well as over other periods. Thus,scientists are increasingly confident in the models’ ability to project many of the keyfeatures of future climate over broad regions. Modeling studies are regularly pub-lished in peer-reviewed scientific journals and subject to intensive examination.
Assessments such as those conducted by the Intergovernmental Panel on ClimateChange (IPCC) recognize that “no single model can be considered ‘best’ and it isimportant to utilize results from a range of coupled models.” The models representedin the IPCC Third Assessment Report were developed by separate research groups inthe United States, the United Kingdom, Germany, Japan, France, Canada, Australia,China and Switzerland. The 1.4 to 5.8°C (2.5–10.4°F) range for projected warmingover the next century reflects the results from the various models, taking intoconsideration a wide range of scenarios for future emissions.
MYTH #11: Ian Castles and David Henderson, as well as Bjorn Lomborg, claimthat the growth of emissions in the scenarios chosen for the 2001 IPCC assessment isunrealistically high. For example, the growth of CO2 emissions in the 1990s fell belowthe IPCC projections. Also, most of the scenarios involve significant increases in
PART III
Can we have any confidence in predictions of futureclimate change?

12
methane (CH4) over the next century, whereas recent observations indicate that CH4
has stopped increasing. Lomborg claims that solar and other renewable sources of energywill dominate the market within decades with minimal policy intervention, and thattherefore all but the lowest-emission IPCC scenarios are unlikely.
FACT: It is unrealistic to write off scenarios designed for 100-year analysis based oncomparison with 10 years of data. Short-term fluctuations in economic activity arebound to happen. The economic downturn in transition economies during the pastdecade and the recession in Asia in the late 1990s slowed the growth of CO2 andCH4 emissions (for example, Streets et al. 2001; Wang et al. 2004).8 (Of course,GHG emissions do not always vary in lock-step with economic activity—if aneconomy improves its energy efficiency and increases the use of renewable energy,GHG emissions can fall as the economy grows. The IPCC scenarios do assumevarious levels of increases in energy efficiency and renewables over time.)Furthermore, model analyses indicate that the rate of chemical removal of CH4 fromthe atmosphere has increased over the past decade, further slowing the increase inCH4 concentrations. But this trend may be temporary.9
Castles and Henderson argue that the use of market exchange rates (MER) ratherthan purchasing power parities (PPP) leads to an overestimate of GDP and emissionsfor developing countries in the IPCC projections. But Nakicenovic et al. (2003) replythat both PPP and MER were used in the scenarios development, with littledifference in results between the two methods at the end of the 21st century.
Contrary to Lomborg’s claim, a transition from a fossil fuel-based economy to aneconomy based on renewable energy will not happen automatically. It would takepolitical action to significantly restructure energy systems in a way that wouldguarantee timely and significant reductions in GHG emissions. Thus, those IPCCscenarios with higher emissions represent a real possibility.
MYTH #12: Just a few decades ago, scientists warned that a new ice age wasapproaching or that pollutant dust would cool the climate. What makes scientists thinkthey are right this time?
FACT: Climate science has come a long way since those early studies. Advances havebeen made in theory, modeling and paleoclimate (climate in the distant past)analysis. Even when the idea of a globally cooling climate was being considered,many scientists warned about the consequences of GHG emissions; they just weren’tsure which effect would win out—warming due to GHGs or cooling due toparticulates that reflect sunlight. Although particulates do have a significant effect onclimate in many regions, we now know that overall, the effect of human-producedGHGs is dominant.
8 In addition, reports by the government of China of decreases in coal use in the late 1990s mayhave been inaccurate, as suggested by the subsequent report of a 28% increase in coal use from2001 to 2002. That inaccuracy may have contributed to an underestimate of global growth inCO2 emissions.
9 The increased removal of atmospheric CH4 over the past decade appears to have been drivenlargely by depletion of the stratospheric ozone layer, according to some analyses (for example,Wang et al., 2004). Because the ozone layer is expected to recover within several decades inresponse to the Montreal Protocol ban on substances that deplete ozone, the recent increase inthe removal of atmospheric CH4 is probably temporary.

13
MYTH #13: The science behind the theory of global warming is too uncertain to drawconclusions useful to policy making.
FACT: Uncertainties are an inherent part of scientific knowledge. However, somefindings about global warming are certain:
• The basic physics of the greenhouse effect is well understood. That there has been adramatic increase in the concentrations of GHGs since pre-industrial times, andthat the increase is caused by human activities, is undisputed (IPCC 2001).
• That the global average surface temperature has increased by about 0.6 ± 0.2°C (1.1± 0.4°F) in the past century is certain (IPCC 2001).
• It is likely that natural factors alone cannot explain the warming observed over thepast 50 years. Human-produced GHGs are likely to have been the dominantcontributor to this warming (IPCC 2001).
The primary scientific debate is about how much and how fast, rather thanwhether, additional warming will occur as a result of human-produced GHGemissions. This idea is expressed in assessments published recently by the IPCC,the U.S. National Academy of Sciences, the American Geophysical Union and theAmerican Meteorological Society.
Uncertainty applies to both ends of the climate spectrum—catastrophic climatesurprises are as likely to occur as much smaller-than-expected changes.
In matters other than climate change, policy decisions based on uncertain infor-mation are made routinely by governments to insure against undesirable outcomes.For example, the nations of the world came together to ratify the Montreal Protocol,which resulted in a ban on chemicals that deplete the ozone layer, in order to protectagainst the threat of increased incidence of skin cancer, even while scientists werelearning more about the threat. Countries including the United States bannedimports of meat from other countries in which mad cow disease (bovine spongiformencephalitis) occurred, even though the vast majority of cattle in the afflicted coun-tries were healthy. The reason immediate action is warranted in the case of globalwarming is that the climate system and economic systems need time to adjust.Climate changes occur with a delay but continue inexorably: Emissions in the nearfuture will continue to warm the climate for many decades and to increase sea levelfor centuries. Slowing the growth of emissions will take time, given the large numberof emitters across the world and the typically long replacement times for infra-structure such as power plants. We may have only a narrow window of time, perhapsa decade or so, to act before the levels of emissions reductions needed to preventdangerous and irreversible climatic changes become prohibitively expensive (O’Neilland Oppenheimer 2002). One of the uses of science is providing society with earlywarnings on potentially dangerous occurrences. In most cases, it is not possible toobtain complete knowledge of a threat before it is too late to stop it. In the case ofglobal warming, scientists have given society an early warning, loud and clear, on itspossibly dangerous, irreversible and widespread impacts.
Uncertainty appliesto both ends of theclimate spectrum.

14
MYTH #14: The IPCC predicts an increase in global average temperature of only1.4–5.8°C (2.5–10.4°F) over the next century. This small change, less than thecurrent daily temperature range for many locations, is hardly a cause for concern.
FACT: Global average temperature generally varies little over time. Projectedwarming would be much larger and faster than anything that has occurred overthe past 10,000 years (IPCC 2001). The difference in average temperaturebetween the last major ice age and the present is only about 5°C (9°F); duringthat period, ice a kilometer thick covered much of North America as far south asNew York City. Future warming would be greater at higher latitudes (closer to thepoles) and over continents than for the global average. In several decades, theclimate of Boston, Massachusetts, might resemble that of present-day Raleigh,North Carolina.
MYTH #15: Global warming and increased CO2 would be beneficial, moderating theclimate in cold regions, reducing cold-related deaths, and increasing plant growth(“greening the Earth”).
FACT: A small amount of warming may benefit limited areas. But if society doesnot make an immediate effort to limit further warming, the beneficial effectsprobably would be heavily outweighed by negative effects. Likely effects includeincreases in heat waves, flooding rainstorms, droughts, forest fires, and speciesextinctions. Coastal flooding due to rising sea levels would affect 13 to 88 millionpeople across the globe each year (IPCC 2001; McLean et al. 2001). A lowerprobability exists that warming could trigger abrupt climate changes withcatastrophic effects, such as a shutdown of the ocean currents that moderate theclimate in Europe and other regions (NAS 2002; Sarmiento et al. 2004), and a rapidbreak-up of huge ice sheets in Greenland and Antarctica, leading to a dramatic risein sea level (NAS 2002).
Studies have indicated that increases in average temperature would significantlyincrease the number of heat-related deaths but might not decrease cold-relateddeaths enough to compensate (McGeehin and Mirabelli 2001; Kalkstein andGreene 1997). Current mortality rates are generally higher in the winter than inthe summer, but changes in mortality rates with global warming are expected to besmaller for winter. The reason is that cold-related mortality is complex and not asstrongly tied to the severity of the cold as heat-related mortality is tied to the severityof the heat. For example, hypothermia (a life-threatening drop in body temperature)occurs in warmer regions of the United States as well as in colder ones, and canoccur at temperatures above freezing (McGeehin and Mirabelli 2001). Also, alarge portion of cold-related deaths involves respiratory illnesses, which are alsoinfluenced by factors other than temperature, such as people’s degree of confinementindoors. In fact, there does not appear to be a detectable correlation between thenumber of influenza cases and monthly temperature in the winter (Kalkstein andGreene 1997).
Increasing the amount of CO2 in the air can enhance plant growth under certainconditions; this is referred to as the “CO2 fertilization effect.” But higher CO2
does not necessarily benefit the planet: Experiments have shown that in natural
PART IV
How harmful would the predicted warming be?

15
ecosystems, the CO2 fertilization effect can diminish after a few years, as the plantsacclimate to the higher CO2 levels (Ainsworth et al. 2003; Temperton et al. 2003).Furthermore, elevated CO2 may benefit certain types of plants (such as invasiveweeds) but not others, potentially resulting in the elimination of certain speciesthrough competition.

16
MYTH #16: Society can easily adapt to climate change; after all, human civilization hassurvived through climatic changes in the past. We should put our resources into adaptingto, rather than preventing, climate change.
FACT: While humans as a species have survived through past climatic changes,individual civilizations have collapsed. Many climate and archeological studiesprovide firm evidence that the demise of various civilizations, including the ClassicMaya, Mochica and Anasazi in the Americas and the Akkadian in Mesopotamia, wasdue at least in part to climatic shifts including prolonged droughts (deMenocal2001). If global warming is allowed to continue unrestrained, the rate and amount ofwarming may exceed anything seen in the last 10,000 years, the period during whichhuman civilization has existed (IPCC 2001).
A warming in the middle of the range of IPCC projections would have significantimpacts on many sectors of the economy—agriculture, water supply, coastal andArctic infrastructure, etc. Even more troubling, there might be increased loss of livesdue to heat waves, storms, floods, famine in developing countries and smog-inducedrespiratory diseases (higher temperatures promote the formation of ozone smog). Bythe 2080s, the number of people in the world flooded by coastal storm surges in atypical year could be more than five times higher than today, even if protectivemeasures are included (McLean et al. 2001). The above impacts would occur evenwith moderate, gradual climate change. Obviously, larger or abrupt climate changewould have even more severe consequences.
Poorer countries may not have the resources to adapt. Adaptation measuresfor sea-level rise alone may cost several percent of GDP for certain developingcountries and small island nations (McLean et al. 2001), and would be infeasiblefor many of the latter. Climate change would likely exacerbate economic and politicalproblems. Disasters spawned by global warming could create many refugees,affecting both developed and developing countries. Increased scarcity of resourcessuch as water and food could lead to conflicts across borders that might have broadripple effects.
Natural ecosystems may not have the capacity to adapt to rapid climate change,especially when combined with other human activities already affecting them.
MYTH #17: Forests in the Northern Hemisphere are absorbing as much CO2 as isemitted through the burning of fossil fuels. Therefore, it is developing countries in thesouth that are to blame for increasing CO2.
FACT: The absorption of CO2 by forests in the Northern Hemisphere is not largeenough to completely offset fossil fuel emissions from that hemisphere. For example,one reliable estimate places the U.S. carbon uptake at 0.30 to 0.58 billion metric tonsof carbon per year (Pacala et al. 2001), while U.S. fossil fuel emissions are around1.5 billion metric tons per year.
The carbon uptake in the Northern Hemisphere is thought to arise largelyfrom regrowth on previously deforested land. It would be counterproductive to givenorthern countries credit for this carbon “sink,” which is simply reabsorption of someof the CO2 that accumulated in the atmosphere as a result of past deforestation.
PART V
What should we do about global warming?
Natural ecosystemsmay not have thecapacity to adaptto rapid climatechange.

17
MYTH #18: It would be more effective to wait until we have definitive proof of globalwarming and more advanced technology to solve the problem rather than act now; theenvironment is resilient and recovers if given a chance.
FACT: CO2 has a long lifetime in the atmosphere. A quarter of present-dayemissions will remain in the atmosphere after several centuries (IPCC 2001). Somewill still be there in a millennium. Some other GHGs (such as sulfur hexafluoride)have even longer lifetimes. Delaying action will make it more difficult to stabilizeGHG concentrations at levels that would prevent severe consequences (O’Neill andOppenheimer 2002).
We cannot just sit back and wait for advanced technologies that reduce GHGs—they may never be developed without mandatory emissions limits and incentivesfor developing GHG-reducing technologies. These require public acceptance andpolitical will, both of which take time to develop.
The environment is not always so resilient. For example, species extinctions areirreversible. A recent study suggested that a significant fraction of all species world-wide (15–37% of the 1,103 species they studied) could be pushed toward extinctionby 2050 unless quick action is taken to cut GHG emissions (Thomas et al. 2004).
MYTH #19: Humankind is foolish to believe it is capable of controlling the climate,either to cause warming or to avoid it.
FACT: We are capable of having an immense impact on the climate. CurrentGHG concentrations are higher than at any other time in at least the past 420,000years and possibly the past 20 million years, as a direct consequence of humanactivities (IPCC 2001). The projected future increase in temperature as a result ofincreases in GHGs is much more rapid and larger than any change during the past10,000 years (IPCC 2001), and the increase would occur relative to an already warm,non-ice-age climate.

18
ACIA. 2004. Impacts of a Warming Arctic: Arctic Climate Impact Assessment. Cam-bridge University Press. (http://www.acia.uaf.edu).
Ainsworth, E.A., A. Rogers, H. Blum, J. Nosberger, and S.P. Long. 2003. Variation inacclimation of photosynthesis in Trifolium repens after eight years of exposure toFree Air CO2 Enrichment (FACE). Journal of Experimental Botany, 54, 2769–2774.
Castles, I. and D. Henderson. 2003. The IPCC emission scenarios: An economic-statistical critique. Energy & Environment, 14 (2 & 3).
Christy, J.R., R.W. Spencer, W.B. Norris, W.D. Braswell, and D.E. Parker. 2003.Error estimates of version 5.0 of MSU-AMSU bulk atmospheric temperatures.J. Atmos. Oceanic Technol., 20, 613–629.
Cook, E.R., C. Woodhouse, C.M. Eakin, D.M. Meko, and D.W. Stahle. 2004.Long-term aridity changes in the western United States. Science, 306,1015–1018. Published online 7 October 2004; 10.1126/science.1102586.
deMenocal, P.B. 2001. Cultural responses to climate change during the lateHolocene. Science, 292, 667–673.
Fu, Q., C.M. Johanson, S.G. Warren, and D.J. Seidel. 2004. Contribution of strato-spheric cooling to satellite-inferred tropospheric temperature trends. Nature, 429,55–58.
Global Coral Reef Monitoring Network, Australian Institute of Marine Science.2004. Status of coral reefs of the world: 2004. Edited by C. Wilkinson.(http://www.aims.gov.au/pages/research/coral-bleaching/scr2004/index.html).
Hansen, J., R. Ruedy, J. Clascoe, and M. Sato. 1999. GISS analysis of surface temper-ature change. J. Geophysical Research, 104D, 30997–31022.
Hoegh-Guldberg, O. 1999. Climate change, coral bleaching and the future of theworld’s coral reefs. Marine and Freshwater Res., 50, 839–866.
Hoerling, M. and A. Kumar. 2003. The Perfect Ocean for Drought. Science, 299:691–694.
IPCC. 2001. Climate Change 2001: The Scientific Basis. Contribution of Working GroupI to the Third Assessment Report of the Intergovernmental Panel on Climate Change.Edited by J.T. Houghton, Y. Ding, D.J. Griggs, M. Noguer, P.J. van der Linden,X. Dai, K. Maskell, and C.A. Johnson. Cambridge and New York: CambridgeUniversity Press.
Jones, P.D., T.J. Osborn, K.R. Briffa, C.K. Folland, E.B. Horton, L.V. Alexander,D.E. Parker and N.A. Rayner. 2001. Adjusting for sampling density in grid boxland and ocean surface temperature time series. J. Geophys. Res., 106, 3371–3380.
Kalkstein, L.S. and J.S. Greene. 1997. An evaluation of climate/mortality relation-ships in large U.S. cities and the possible impacts of a climate change. Environ-mental Health Perspectives, 105, 84–93.
Karoly, D.J., K. Braganza, P.A. Stott, J.M. Arblaster, G.A. Meehl, A.J. Broccoli, andK.W. Dixon. 2003. Detection of a human influence on North American climate.Science, 302, 1200–1203.
Laut, P. 2003. Solar activity and terrestrial climate: an analysis of some purportedcorrelations. J. Atmos. Solar-Terr. Phys., 65, 801–812.
Lindzen, R., M.D. Chou and A.Y. Hou. 2001. Does the earth have an adaptiveinfrared iris? Bulletin of the American Meteorological Society, 82(3), 417–432.
References

19
Lomborg, B. 2001. The Skeptical Environmentalist: Measuring the Real State of theWorld. Cambridge: Cambridge University Press.
Luterbacher, J., D. Dietrich, E. Xoplaki, M. Grosjean and H. Wanner. 2004. Euro-pean seasonal and annual temperature variability, trends, and extremes since1500. Science, 303, 1499–1503.
Manabe S. and R.T. Wetherald. 1967. Thermal equilibrium of the atmosphere witha given distribution of relative humidity. Journal of Atmospheric Sciences 24 (3),241–259.
Mann, M.E., R.S. Bradley, and M.K. Hughes. 1998. Global-scale temperature pat-terns and climate forcing over the past six centuries. Nature, 392, 779–787.
Mann, M.E., R.S. Bradley and M.K. Hughes. 1999. Northern hemisphere tempera-tures during the past millennium: inferences, uncertainties, and limitations.Gephys. Res. Lett., 26, 759–762.
Mann, M., C. Ammann, R. Bradley, K. Briffa, P. Jones, T. Osborn, T. Crowley,M. Hughes, M. Oppenheimer, J. Overpeck, S. Rutherford, K. Trenberth andT. Wigley. 2003a. On past temperatures and anomalous late-20th centurywarmth. Eos, 84(27), 256–258.
Mann, M., C. Ammann, R. Bradley, K. Briffa, P. Jones, T. Osborn, T. Crowley, M.Hughes, M. Oppenheimer, J. Overpeck, S. Rutherford, K. Trenberth and T.Wigley. 2003b. Comment on “On past temperatures and anomalous late-20thcentury warmth”: Response. Eos, 84(44), 473–474.
McElroy, M.B. 2002. The Atmospheric Environment: Effects of Human Activity.Princeton: Princeton University Press.
McGeehin, M.A. and M. Mirabelli. 2001. The potential impacts of climate varia-bility and change on temperature-related morbidity and mortality in the UnitedStates. Environmental Health Perspectives, 109, Supplement 2, 185–189.
McIntyre, S. and R. McKitrick. 2003. Corrections to the Mann et al. (1998) proxydata base and Northern Hemispheric average temperature series. Energy &Environment, 14(6), 751–771.
McIntyre, S. and R. McKitrick. 2005. Hockey sticks, principal components, andspurious significance. Geophysical Research Letters, 32, L03710,doi:10.1029/2004GL021750.
McLean, R.F., A. Tsyban, V. Burkett, J.O. Codignotto, D.L. Forbes, N. Mimura,R.J. Beamish, V. Ittekkot, L. Bijlsma and I. Sanchez-Arevalo. 2001. IPCC ThirdAssessment Report, Contribution of Working Group II, Chapter 6.
Mears, C.A., M.C. Schabel and F.J. Wentz. 2003. A reanalysis of the MSU Channel2 tropospheric temperature record. Journal of Climate, 16, 3650–3664.
Moberg, A., D.M. Sonechkin, K. Holmgren, N.M. Datsenko and W. Karlen. 2005.Highly variable Northern Hemisphere temperatures reconstructed from low- andhigh-resolution proxy data. Nature, 433, 613–617.
Monastersky, R. 2003. Storm Brews Over Global Warming. The Chronicle of HigherEducation, 50(2), Sept. 5.
Nakicenovic, N., A. Gruebler, S. Gaffin, T.T. Jung, T. Kram, T. Morita, H. Pitcher,K. Riahi, M. Schlesinger, P.R. Shukla, D. van Vuuren, G. Davis, L. Michaelis,R. Swart and N. Victor. 2003. IPCC SRES revisited: A response. Energy &Environment, 14(2 & 3), 187–214.
National Academy of Sciences (NAS). 2002. Abrupt Climate Change: InevitableSurprises. Washington, DC: National Academy Press.

20
National Climatic Data Center (NCDC). 2004. Climate of 2003 in Historical Per-spective, www.ncdc.noaa.gov/oa/climate/research/2003/ann/ann03.html#Major%20highlights.
National Climatic Data Center (NCDC). 2004. Climate of 2004: Climate PerspectivesReports, http://www.ncdc.noaa.gov/oa/climate/research/2004/perspectives.html.
National Interagency Fire Center (NIFC). 2004. National Fire News, November 1,http://www.nifc.gov/fireinfo/nfn.html.
O’Neill, B.C. and M. Oppenheimer. 2002. Dangerous climate impacts and the KyotoProtocol. Science, 296, 1971–1972.
Osborn, T.J. and K.R. Briffa. 2004. The real color of climate change? Science, 306,621–622. Published online 30 September 2004; 10.1126/science.1104416.
Pacala, S.W., et al. 2001. Consistent land- and atmosphere-based U.S. carbon sinkestimates. Science, 292, 2316–2320.
Peterson, T.C. 2003. Assessment of urban versus rural in situ surface temperatures inthe contiguous United States: No difference found. J. Climate, 16, 2941–2959.
Rahmstorf, S., D. Archer, D.S. Ebel, O. Eugster, J. Jouzel, D. Maraun, U. Neu, G.A.Schmidt, J. Severinghaus, A.J. Weaver and J. Zachos. 2004. Cosmic rays, carbondioxide, and climate. Eos, 85(4), 38.
Ramaswamy, V., O. Boucher, J. Haigh, D. Hauglustaine, J. Haywood, G. Myhre,T. Nakajima, G.Y. Shi and S. Solomon. 2001. Radiative Forcing of ClimateChange in Climate Change 2001: The Scientific Basis. Contribution of WorkingGroup I to the Third Assessment Report of the Intergovernmental Panel on ClimateChange. Edited by J.T. Houghton, Y. Ding, D.J. Griggs, M. Noguer, P.J. van derLinden, X. Dai, K. Maskell, and C.A. Johnson. Cambridge and New York:Cambridge University Press.
Royer, D.L., R.A. Berner, I.P. Montanez, N.J. Tabor and D.J. Beerling. 2004. CO2 asa primary driver of Phanerozoic climate. GSA Today, 14(3), doi: 10.1130/1052–5173.
Rutherford, S., M.E. Mann, T.J. Osborn, R.S. Bradley, K.R. Briffa, M.K. Hughes,and P.D. Jones. 2005 (in press). Proxy-based Northern Hemisphere surface tem-perature reconstructions: Sensitivity to methodology, predictor network, targetseason and target domain. Journal of Climate.
Sarmiento, J.L., N. Gruber, M.A. Brzezinski and J.P. Dunne. 2004. High-latitudecontrols of thermocline nutrients and low latitude biological productivity.Nature, 427, 56–60.
Shaviv, N. J. and J. Veizer. 2003. Celestial driver of Phanerozoic climate? GSA Today,4-10, July.
Soon, W., and S. Baliunas. 2003. Proxy climatic and environmental changes of thepast 1,000 years. Climate Research, 23, 89–110.
Soon, W., S. Baliunas, C. Idso, S. Idso and D.R. Legates. 2003. Reconstructing cli-matic and environmental changes of the past 1000 years: a reappraisal. Energy &Environment, 14, 233–296.
Spencer, R.W. and J.R. Christy. 1990. Precise monitoring of global temperaturetrends from satellites. Science, 247, 1558–1562.
von Storch, H., E. Zorita, J. Jones, Y. Dimitriev, F. Gonzalez-Rouco, and S. Tett.2004. Reconstructing past climate from noisy data. Science, 306, 679–682. Pub-lished online 30 Sept. 2004; 10.1126/science.1096109.
Stott, P.A., D.A. Stone, and M.R. Allen. 2004. Human contribution to the Europeanheatwave of 2003. Nature, 432, 610–614.

21
Streets, D.G., K. Jiang, X. Hu, J.E. Sinton, X.-Q. Zhang, D. Xu, M.Z. Jacobsonand J.E. Hansen. 2001. Recent reductions in China’s greenhouse gas emissions.Science, 294, 1835–1837.
Temperton, V.M., S.J. Grayston, G. Jackson, C.V.M. Barton, P. Millard and P.G.Jarvis. 2003. Effects of elevated carbon dioxide concentration on growth andnitrogen fixation in Alnus glutinosa in a long-term field experiment. TreePhysiology, 23, 1051–1059.
Thomas, C.D., A. Cameron, R.E. Green, M. Bakkenes, L.J. Beaumont, Y.C.Collingham, B.F.N. Erasmus, M.F. de Siqueira, A. Grainger, L. Hannah, L.Hughes, B. Huntley, A.S. van Jaarsveld, G.F. Midgley, L. Miles, M.A. Ortega-Huerta, A. Townsend Peterson, O.L. Phillips and S.E. Williams. 2004. Extinc-tion risk from climate change. Nature, 427, 145–148.
Wang, J. S., J. A. Logan, M. B. McElroy, B. N. Duncan, I. A. Megretskaia and R.M. Yantosca. 2004. A 3-D model analysis of the slowdown and interannualvariability in the methane growth rate from 1988 to 1997. Global BiogeochemicalCycles, 18, GB3011, doi: 10.1029/2003GB002180.

National Headquarters257 Park Avenue SouthNew York, NY 10010212-505-2100
1875 Connecticut Avenue, NWWashington, DC 20009202-387-3500
5655 College AvenueOakland, CA 94618510-658-8008
2334 North BroadwayBoulder, CO 80304303-440-4901
2500 Blue Ridge RoadRaleigh, NC 27607919-881-2601
44 East AvenueAustin, TX 78701512-478-5161
18 Tremont StreetBoston, MA 02108617-723-5111
Project Office3250 Wilshire BoulevardLos Angeles, CA 90010213-386-5501