the latino contribution to u.s. economic dynamism...demonstrating that latinos contribute...
TRANSCRIPT

Jeffrey A. Eisenach, Ph.D. Robert Kulick, Ph.D.March 2019
The Latino Contribution to U.S. Economic Dynamism

About the Authors
Dr. Eisenach is a Managing Director and Co-Chair of NERA’s Communications, Media, and
Internet Practice. He is also an Adjunct Professor at George Mason University Law School,
where he teaches Regulated Industries, and a Visiting Scholar at the American Enterprise
Institute, where he focuses on policies affecting the information technology sector,
innovation, and entrepreneurship. Previously, Dr. Eisenach served in senior policy positions at
the U.S. Federal Trade Commission and the White House Office of Management and Budget,
and on the faculties of Harvard University’s Kennedy School of Government and Virginia
Polytechnic Institute and State University.
Dr. Kulick is a Senior Consultant at NERA and an Adjunct Professor at George Mason
University Law School.
The authors are grateful to Patrick McGervey, John Laurini, Megan Ye, Spencer Louie and Ara
Kharazian for their assistance with this report, and to the Latino Donor Collaborative and
Wells Fargo for sponsorship. The views are exclusively the authors’ and do not necessarily
represent those of NERA Economic Consulting or any of the institutions with which the
authors are affiliated.
1
I. Introduction
This study presents a comprehensive analysis of the contribution made by Latino Americans1 tothe US economy, based on data from a wide variety of government and private sources. The findings are striking: To an extent few appreciate, the US Latino population is growing, young, increasingly educated, employed, connected, entrepreneurial, and upwardly mobile in terms of income as well as consumption.
Consider the following:
• While much of the developed world is facing stagnant population growth and an increasingly elderly age distribution, growth in the Latino population is keeping America both young and growing. Between 1990 and 2015, the Latino population grew from 22 million to 57 million,roughly five times as fast as the population overall. To illustrate this rapid growth, consider that if the Latino population had grown at the same rate as the rest of the US, there would be 30 million fewer Americans today.
• At 28 years old, the median Latino is nine years younger than the population at large and 15years younger than the median white. Millenials make up 26 percent of the Hispanic population, compared to 22 percent for the US population. Economic research suggests that the youthful demographic profile of the Latino population enhances productivity and increases growth in per capita incomes.
• Latinos are responsible for 29 percent of the growth in real income since 2005. They account for roughly 10 cents of every dollar of US national income, and that proportion is rising both due to growth in the Latino population and rising per capita earnings.
• Latinos play a critical role in the labor force, both as employees and, especially, as job creators and entrepreneurs. They are more likely to participate in the labor force (65.9 percent vs. 62.7 percent) and to be employed (61.6 percent vs. 59.3 percent) than the overall US population. While Latinos account for 17 percent of all workers, they account for 21 percent of new entrepreneurs. Latinos accounted for nearly half—46 percent—of the growth in employment from 2011 to 2015.
1 Throughout this report, the words “Hispanic” and “Latino” are used interchangeably to refer to ethnic Latinosin the United States. Further, for simplicity of exposition, the report refers to Hispanics, whites, and other groups as“ethnic” groups (as opposed to “racial” or “racial-ethnic” groups). For statistical purposes, the U.S. Office ofManagement and Budget (OMB) defines “Hispanic or Latino” as a “person of Cuban, Mexican, Puerto Rican, South or Central American, or other Spanish culture or origin, regardless of race. The term, ‘Spanish origin,’ can be used in addition to ‘Hispanic or Latino.’” See Standard for Maintaining, Collecting, and Presenting Federal Data on Raceand Ethncity,” Office of Management and Budget (October 30, 1997) (available athttps://www.whitehouse.gov/sites/default/files/omb/assets/information_and_regulatory_affairs/re_app-a-update.pdf). See also “Revisions to the Standards for the Classification of Federal Data on Race and Ethnicity,” Office ofManagement and Budget (October 30, 1997) (available at https://www.whitehouse.gov/omb/fedreg_1997standards).

CONTENTS
I. INTRODUCTION ....................................................................................................... 1
II. LATINOS AND THE U.S. ECONOMY ............................................................................ 2
A. The Demographic Challenge to American Economic Growth ........................ 3 B. The Latino Population: Growing, Young, Employed,
Entrepreneurial............................................................................................... 7 C. Previous Empirical Studies of the Latino Contribution to Business
Dynamism .................................................................................................... 16
III. ECONOMETRIC ANALYSIS OF THE LATINO EFFECT: MODEL AND RESULTS .................. 18
A. Methodology ................................................................................................ 18 B. Econometric Results: Economic Impact of Hispanic Employment ............... 19
IV. QUANTIFYING THE LATINO CONTRIBUTION TO THE U.S. ECONOMY ............................ 23
A. Hispanic Employment and Population Growth Scenarios ............................ 23 B. Impact of Hispanic Employment and Population Growth on
Economic Performance ................................................................................ 24
V. POLICY IMPLICATIONS AND SUGGESTIONS FOR FURTHER RESEARCH ........................ 30
VI. CONCLUSION ........................................................................................................ 31
APPENDIX A: ECONOMETRIC METHODOLOGY APPENDIX B: ROBUSTNESS TESTS APPENDIX C: METHODOLOGY FOR ESTIMATING HISPANIC EMPLOYMENT EFFECTS


I. Introduction
The growing importance of Hispanic Americans in the U.S. economy is attracting increasing attention from economists and other analysts. 1 Latinos are growing as a proportion of the workforce, and the Latino population is younger, more likely to be employed and, by many measures, more entrepreneurial than the population overall. Prior studies have assembled a broad array of data and analysis to demonstrate the importance of Latinos to America’s current and future prosperity – a phenomenon sometimes referred to as the “Latino effect.”
This study seeks to further advance our understanding of the Latino effect by examining the effects of growth in the Latino workforce on business dynamism and overall economic performance. Specifically, it seeks to determine whether and how growth in Latino employment affects economic performance. To test this hypothesis, it applies a widely-utilized statistical methodology known as “vector auto-regression” (VAR) to Metropolitan Statistical Area (MSA)-level data on labor productivity, new business formation and economic output.
The findings provide strong support for the proposition that growth in Latino employment has a statistically significant and economically material effect on overall economic performance. Specifically:
• Demographic and economic data show that growth in the Latino population, combined withhigh labor force participation rates, are helping to offset low birth rates and the aging of theBaby Boom generation, allowing the U.S. labor force to grow at rates needed to maintainhealthy increases in GDP. Since 2010, the Latino population has grown by 16 percent,compared with three percent for non-Hispanics.
• A substantial body of evidence indicates Latinos are more entrepreneurial – that is, more likelyto be self-employed and more likely to start new businesses – than the overall population.Latinos accounted for nearly a quarter of new entrepreneurs in 2016, despite making up just18 percent of the population.
• The results of our regression show that the more rapid pace of Latino employment andpopulation growth (compared with the overall population) has strong, significant positiveeffects on the U.S. economy. Specifically, because Latino employment and population aregrowing faster than the overall population:
- More new businesses are being formed: By 2025, the U.S. economy will produce over52,000 more new startup businesses.
1 Throughout this report, the words “Hispanic” and “Latino” are used interchangeably to refer to ethnic Latinos in the United States. Further, for simplicity of exposition, the report refers to Hispanics, whites and other groups as “ethnic” groups (as opposed to “racial” or “racial-ethnic” groups). For statistical purposes, the U.S. Office of Management and Budget (OMB) defines “Hispanic or Latino” as a “person of Cuban, Mexican, Puerto Rican, South or Central American, or other Spanish culture or origin, regardless of race. The term, ‘Spanish origin,’ can be used in addition to ‘Hispanic or Latino.’” See Office of Management and Budget, Revisions to the Standards for the Classification of Federal Data on Race and Ethnicity, 62 Fed. Reg. 58782-58790 (October 30, 1997).

2
- Productivity is increasing: Between now and 2025, output per employee will be higher by an average of $1,245 each year.
- Gross Domestic Product (GDP) is rising: Between now and 2025, the U.S. economy will produce an additional $4.9 trillion in real GDP, or about $701 billion annually. Real GDP per capita will be higher by an average of $442 each year.
• Our regression results strongly suggest that the association between Latino employment growth and economic performance is causal in nature, as opposed to the result of mere statistical correlation.
Our analysis may also provide new insight into important aspects of the debate over immigration policy. While about two-thirds of Latinos are native born, they have accounted for a significant proportion of total immigration to the U.S. in recent years: More than 40 percent of all U.S. immigrants came from Mexico, Central America and South America.2 Thus, the economic effects of Latinos and of immigration are closely intertwined. To date, the academic and policy debate over immigration has focused largely on the short-term wage and employment consequences for native workers and the tax receipts paid and benefits used by immigrants. This study focuses instead on the impact of Latino participation in the economy on overall economic growth. By demonstrating that Latinos contribute disproportionately to business dynamism, which in turn is closely tied to increased labor productivity and economic output, our research suggests a largely unexplored channel through which immigration benefits the economy.
The remainder of this study is organized as follows. Section II provides an overview of existing data and previous research on the role of Latinos in the U.S. economy. Section III presents the econometric model and summarizes its results. Section IV puts the results in context by estimating the impact on the U.S. economy if the rate of growth of Latino employment and population were to slow so as to equal the recent trend for the overall economy. Section V contains a brief discussion of policy implications and suggestions for further research. Section VI provides a brief conclusion.
II. Latinos and the U.S. Economy
The Latino contribution to the U.S. economy has drawn increasing attention from economists and other analysts. As discussed in this section, the growth of the Latino population and workforce is important in part because it helps to balance declining birth rates – and thus slower population growth – among other ethnic groups. In addition, demographic and economic data, buttressed by a substantial body of economic research, suggest the Latino effect is qualitative as well as quantitative. That is, Latinos are contributing disproportionately to U.S. economic growth not just because of their increasing numbers but because, as a group, they are younger, more likely to be employed and more entrepreneurial than the overall population.
The first section below briefly describes the demographic challenges facing the U.S. economy. The second section presents some demographic and economic data about the Latino population
2 Gustavo López et al,”Key Findings About U.S. Immigrants,” Pew Research Center (November 30, 2018) (available at http://www.pewresearch.org/fact-tank/2018/11/30/key-findings-about-u-s-immigrants/).
3
and its role in the economy. The third section reviews relevant economic literature on the impact of immigrants in general, and Latinos in particular, on economic performance.
A. The Demographic Challenge to American Economic Growth
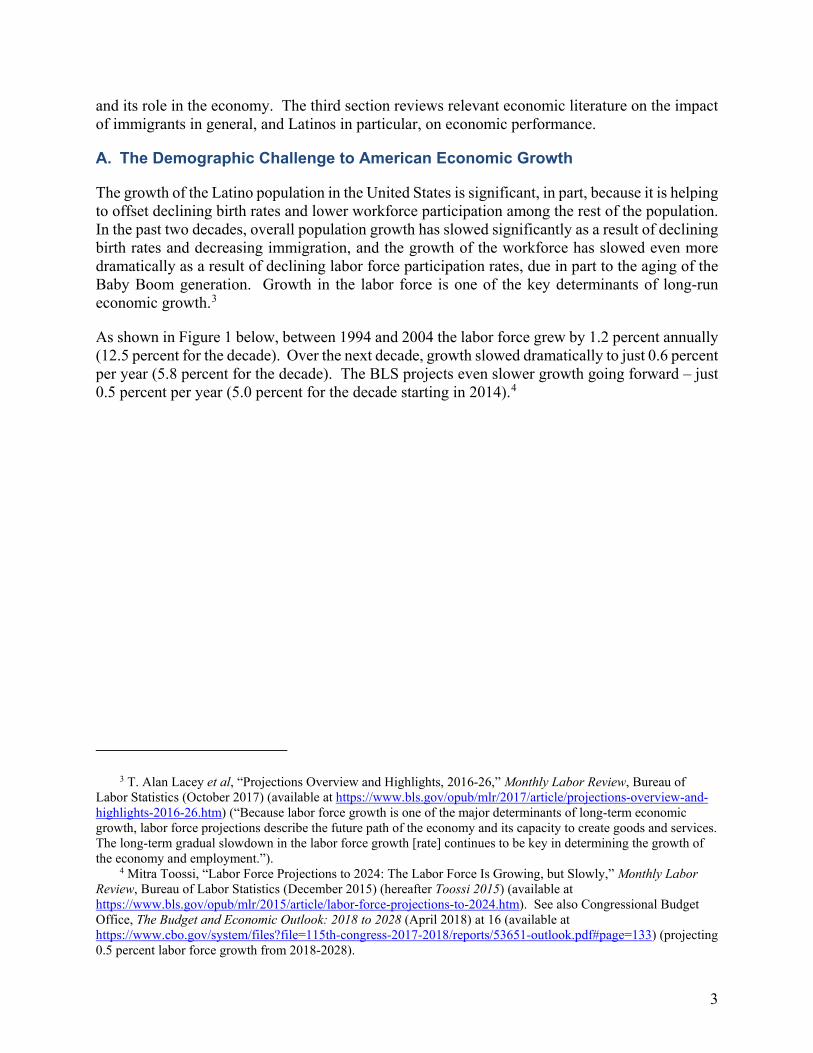
The growth of the Latino population in the United States is significant, in part, because it is helping to offset declining birth rates and lower workforce participation among the rest of the population. In the past two decades, overall population growth has slowed significantly as a result of declining birth rates and decreasing immigration, and the growth of the workforce has slowed even more dramatically as a result of declining labor force participation rates, due in part to the aging of the Baby Boom generation. Growth in the labor force is one of the key determinants of long-run economic growth.3
As shown in Figure 1 below, between 1994 and 2004 the labor force grew by 1.2 percent annually (12.5 percent for the decade). Over the next decade, growth slowed dramatically to just 0.6 percent per year (5.8 percent for the decade). The BLS projects even slower growth going forward – just 0.5 percent per year (5.0 percent for the decade starting in 2014).4
3 T. Alan Lacey et al, “Projections Overview and Highlights, 2016-26,” Monthly Labor Review, Bureau of Labor Statistics (October 2017) (available at https://www.bls.gov/opub/mlr/2017/article/projections-overview-and-highlights-2016-26.htm) (“Because labor force growth is one of the major determinants of long-term economic growth, labor force projections describe the future path of the economy and its capacity to create goods and services. The long-term gradual slowdown in the labor force growth [rate] continues to be key in determining the growth of the economy and employment.”).
4 Mitra Toossi, “Labor Force Projections to 2024: The Labor Force Is Growing, but Slowly,” Monthly Labor Review, Bureau of Labor Statistics (December 2015) (hereafter Toossi 2015) (available at https://www.bls.gov/opub/mlr/2015/article/labor-force-projections-to-2024.htm). See also Congressional Budget Office, The Budget and Economic Outlook: 2018 to 2028 (April 2018) at 16 (available at https://www.cbo.gov/system/files?file=115th-congress-2017-2018/reports/53651-outlook.pdf#page=133) (projecting 0.5 percent labor force growth from 2018-2028).

4
FIGURE 1: U.S. LABOR FORCE, 1994-2018 (MILLIONS)
Source: Bureau of Labor Statistics. Note: [1] Labor force is measured as the civilian labor force aged 16 and older. [2] The figure for 2018 is the average from January to October.
As shown in Figure 2, the primary reason for slowing growth in the labor force growth has been declining participation. For example, between 2007 and 2014 the population grew by more than 16 million (seven percent) while the labor force grew by just three million (two percent). Labor force participation declined from 67.1 percent in 2000 to 62.7 percent in 2015, and has only begun increasing again over the past three years.

5
FIGURE 2: U.S. POPULATION AND LABOR FORCE CHANGES, 1994-2017
Source: Bureau of Labor Statistics; U.S. Census Bureau. Note: Population = civilian, noninstitutional population aged 16 and older; Labor force = civilian labor force aged 16 and older. The reasons for declining labor force participation are a topic of some debate, but one factor is the aging of the U.S. population.5 Figure 3 shows the share of the population by age group for 1996, 2006 and 2016, and the BLS’s projected age distribution in 2026. The share of the population aged 55 and older increased from 26.3 percent in 1996 to 35.2 percent in 2016 and is projected to increase to 39.0 percent in 2026. Conversely, the share of the population aged 25 to 54 decreased from 57.6 percent in 1996 to 49.6 percent in 2016 and is projected to decline further to 47.4 percent in 2026. As discussed further in Section C below, economic research has identified a strong and significant inverse relationship between the age of the population and economic performance.
5 See Toossi 2015. See also Council of Economic Advisers, Economic Report of the President Together with the Annual Report of the Council of Economic Advisers (February 2018) at 109 (hereafter Economic Report of the President 2018) (available at https://www.whitehouse.gov/wp-content/uploads/2018/02/ERP_2018_Final-FINAL.pdf) (“As the members of the Baby Boom generation, those Americans born in the post–World War II era through 1964, have moved into ‘retirement ages,’ the overall participation rate has drifted downward. This movement of the Baby Boom generation into older ages has greatly increased the share of older persons in the overall population, and the employment rates of older persons remain below those of younger persons.”).

6
FIGURE 3: SHARE OF POPULATION BY AGE GROUP, 1996-2026
Source: Bureau of Labor Statistics. Note: Population = civilian, noninstitutional population aged 16 and older. 2026 projected.
Another workforce related challenge facing the U.S. economy is the decline in business dynamism. Recent empirical work has emphasized the importance for productivity growth of entrepreneurship, which reallocates scarce economic resources from less productive to more productive uses. For example, a 2017 study co-authored by one of the authors of this study found that “high-growth-output firms are disproportionately young and these firms make outsized contributions to output and productivity growth.”6 Overall, approximately 50 percent of the increase in labor productivity attributable to the reallocation of resources is driven by young firms that are less than ten years old.7 The productivity enhancing effect of entrepreneurship is driven by an “up-or-out” dynamic wherein young firms are both more likely to grow rapidly and more likely to exit relative to other firms.8
Research by economist John Haltiwanger suggests that the U.S. economy has become less dynamic in recent decades, potentially creating significant headwinds for innovation, job creation and
6 John Haltiwanger, Ron S. Jarmin, Robert Kulick and Javier Miranda, “High-Growth Young Firms: Contribution to Job, Output, and Productivity Growth,” Measuring Entrepreneurial Businesses: Current Knowledge and Challenges (NBER Studies in Income and Wealth, Volume 75), ed. John Haltiwanger, Erik Hurst, Javier Miranda and Antoinette Scholar (Chicago, IL and London, U.K.: University of Chicago Press, 2017) 11-62 at 13.
7 Ibid. at 47. 8 John Haltiwanger, Ron Jarmin and Javier Miranda, “Who Creates Jobs? Small Versus Large Versus Young,”
The Review of Economic Statistics 95;2 (May 2013) 347-361 at 355.
16.1% 16.1% 15.2% 13.6%
57.6%54.6%
49.6%47.4%
26.3%29.3%
35.2%39.0%
0%
10%
20%
30%
40%
50%
60%
70%
1996 2006 2016 2026
16-24 25-54 55+

7
productivity growth in the future.9 Evidence of this trend is presented in Figure 4, which shows a pronounced decline in gross job creation and gross job destruction since the 1980s, indicating a slowdown in the reallocation of firm-level resources.
FIGURE 4: TRENDS IN GROSS AND NET JOB CREATION, 1980-2016
Source: U.S. Census Bureau. Note: [1] This is an updated version of a figure appearing in John Haltiwanger et al, “Historically Large Decline in Job Creation from Startups and Existing Firms in the 2008-09 Recession,” Business Dynamics Statistics Briefing No. 5, Kauffman Foundation (March 2011). [2] Figures represent average values over the period indicated.
To summarize, the slow growth of the U.S. labor force, combined with an aging population and falling rates of entrepreneurship, represent a current and future threat to achieving high rates of economic growth. As the following section discusses, growth of the Latino population has played a key role in offsetting these trends.
B. The Latino Population: Growing, Young, Employed, Entrepreneurial
The impact of Latinos on the U.S. economy is driven, first of all, by demographics: The Latino population is growing more rapidly than other ethnic groups, and is significantly younger. In addition, Latinos have high labor force participation rates and high levels of employment. The data also show that Latinos have high entrepreneurship rates, contributing disproportionately to
9 John Haltiwanger, “Job Creation and Firm Dynamics in the United States,” Innovation Policy and the Economy 12 (April 2012) 17-38 at 29.
18.3%
16.2%16.8%
14.9%15.7%14.8%
13.5%
11.8%
0%
2%
4%
6%
8%
10%
12%
14%
16%
18%
20%
Gross Job Creation Gross Job Destruction
1980-1989 1990-1999 2000-2009 2010-2016

8
new business formation and job creation, and that they are increasingly wealthy, contributing to both consumption and capital formation.10
To begin, the Latino population is growing much more rapidly than the U.S. population overall: Since 2010, the Latino population has grown by 16 percent, compared with three percent for non-Hispanics. As shown in Figure 5, the increase is due mainly to higher birth rates among Latinos. The figure compares the Hispanic and non-Hispanic changes in the U.S. population from 2010 to 2017 by natural factors (births vs. deaths) versus net migration (immigration less emigration). As the figure shows, natural increases accounted for 6.0 million, or 73 percent, of the 8.2 million overall increase in the Hispanic population, while net migration accounted for 27 percent, or 2.2 million. In contrast, the change in the non-Hispanic population has been mostly driven by net international migration, which accounted for 4.5 million, or 56 percent, of the 8.1 million change.
FIGURE 5: HISPANIC VS. NON-HISPANIC POPULATION CHANGE, 2010-2017 (MILLIONS)
Source: U.S. Census Bureau.
10 Much of the evidence about the growing impact of Latinos on the U.S. economy was summarized in a 2016 study by one of the authors of this study. See Jeffrey A. Eisenach, Making America Rich Again: The Latino Effect on Economic Growth, NERA Economic Consulting (December 2016) at 1 (hereafter Eisenach 2016) (available at http://www.nera.com/content/dam/nera/publications/2016/PUB_LDC_Prosperity_1216.pdf); see also Werner Schink and David Hayes-Bautista, Latino Gross Domestic Product (GDP) Report, Latino Donor Collaborative (June 2017) at 3 (available at http://accf.org/wp-content/uploads/2017/08/Latino-GDP-Report-6.28.2017.pdf); Partnership for a New American Economy, Power of the Purse: How Hispanics Contribute to the U.S. Economy (December 2017) at 19 (available at http://research.newamericaneconomy.org/wp-content/uploads/sites/2/2017/12/Hispanic_V5.pdf); Marlene Orozco et al, 2017 State of Latino Entrepreneurship Research Report, Stanford Graduate School of Business Latino Entrepreneurship Initiative (February 2018) (available at https://www.gsb.stanford.edu/sites/gsb/files/publication-pdf/report-slei-state-latino-entrepreneurship-2017.pdf).
6.0
2.2
3.6
4.5
0
1
2
3
4
5
6
7
Natural Increase (Births - Deaths) Net International Migration
Hispanic Non-Hispanic

9
The Latino population is significantly younger than the overall U.S. population. As shown in Figure 6, the median age of Latinos is 29, nine years younger than the median age of the overall U.S. population and 15 years younger than the median non-Hispanic white.
FIGURE 6: MEDIAN AGE BY ETHNIC GROUP, 2017
Source: U.S. Census Bureau.
Indeed, the entire age distribution of Latinos skews significantly younger than the overall population. Figure 7 compares the age distribution of Latinos with the population overall. The top panel shows the proportion of the population comprised of each age group for the Hispanic population and the U.S. overall. In the bottom panel, each bar shows the difference between the proportion of the Latino population that falls into each age group and the proportion of the population overall. More than half of all Latinos are under 30 years old, compared with just 40 percent for the overall population.
2933
38
44
0
5
10
15
20
25
30
35
40
45
50
Hispanic Other Non-Hispanic Total White Non-Hispanic

10
FIGURE 7: AGE DISTRIBUTION OF LATINOS VS. OVERALL POPULATION, 2017
Source: U.S. Census Bureau.
Not surprisingly given their younger age profile, Latinos have a higher labor force participation rate, and are more likely to be employed, than the overall U.S. population. As shown in Figure 8, 66 percent of the Hispanic population is either employed or looking for work, three percentage points higher than the labor force participation rate for the total population and four percentage points higher than for the white, non-Hispanic population. Similarly, 63 percent of Latinos are employed, compared with 60 percent of the population overall.
0%
2%
4%
6%
8%
10% Hispanic U.S. Population
-3%
0%
3%
Diff
eren
ce

11
FIGURE 8: LABOR FORCE PARTICIPATION AND EMPLOYMENT RATES BY ETHNIC GROUP, 2018
Source: Bureau of Labor Statistics. Note: Figures represent the average from January to October 2018.
The combination of these factors – faster population growth and higher labor force participation rates – means that Latinos make up a growing proportion of the workforce. As shown in Figure 9, the Hispanic labor force is growing about three percent annually compared with less than one percent for the rest of the population. By 2034, Latinos are projected to account for 23 percent of the U.S. labor force.11 The same is true of the Hispanic employed population. As shown in Figure 9, the Hispanic employed population is growing about four percent annually compared with just one percent for the rest of the population. As with the labor force, by 2034 Latinos are projected to account for 23 percent of the U.S. employed population.12
11 James Gillula, Hispanic Immigration and US Economic Growth, IHS Economics (February 2015) at 14 (available at https://www.ihs.com/pdf/Hispanic-Immigration-and-Economic-Growth_219008110915583632.pdf).
12 Ibid.
66.2%
62.1%62.6% 62.9%63.1%
60.1%
59.2%
60.4%
54%
56%
58%
60%
62%
64%
66%
68%
Hispanic White Non-Hispanic Other Non-Hispanic Total
Labor Force Participation Employment Rate

12
FIGURE 9: LABOR FORCE AND EMPLOYMENT BY ETHNIC GROUP, 2011-2034 (MILLIONS)
Sources: Bureau of Labor Statistics; IHS Economics. Notes: [1] 2019-2034 projected. [2] The figures for 2018 are averages from January to October. Another perspective on the Latino contribution to the workforce is shown in Figure 10, which breaks total growth in the labor force into its Latino and non-Latino components. As the figure shows, from 2015 through 2019, the labor force grew at about 1.2 percent annually, with Latinos accounting for just under half of the total. Going forward, growth in the labor force is expected to slow, but nearly all of the growth that does occur will be due to Latinos.
120 121 121 123 124 126 127 129 129 131 131 132131 131 131 131 131 132 133 134 136 137 137 139
20 22 23 23 24 25 26 27 28 32 36 3923 24 25 25 26 27 27 28 30 34 38 41
2011 2012 2013 2014 2015 2016 2017 2018 2019 2024 2029 20340
20
40
60
80
100
120
140
160
180
200 Hispanic Labor Force Hispanic EmploymentNon-Hispanic Labor Force Non-Hispanic Employment

13
FIGURE 10: LABOR FORCE GROWTH RATES, 2015-2034
Sources: Bureau of Labor Statistics; IHS Economics.
In addition to constituting a growing proportion of the workforce, Latinos are also more likely than the overall U.S. population to start new businesses. Figure 11 shows the entrepreneurship rate, as calculated by the Kauffman Foundation, by ethnic group from 1996 to 2016.13 In every year since 2002, Latinos have had the highest entrepreneurship rate of any ethnic group in the United States.
13 See Robert W. Fairlie, Arnobio Morelix and Inara Tareque, The Kauffman Index 2017: Startup Activity, Kauffman Foundation (2017) at 7 (hereafter Kauffman 2017) (available at https://www.kauffman.org/kauffman-index/reporting/~/media/c9831094536646528ab012dcbd1f83be.ashx). The Rate of New Entrepreneurs (or “entrepreneurship rate”) is defined as the “percentage of the adult, non-business-owner population that starts a business each month.”
0.7%
0.2%
0.0%
0.2%
0.6%
0.5%
0.4%
0.4%
1.2%
0.7%
0.4%
0.6%
0.0%
0.2%
0.4%
0.6%
0.8%
1.0%
1.2%
1.4%
2015-2019 2020-2024 2025-2029 2030-2034
Ann
ual G
row
th R
ate
Hispanic Contribution
Non-Hispanic Contribution

14
FIGURE 11: ENTREPRENEURSHIP RATE BY ETHNIC GROUP, 1996-2016
Source: Kauffman 2017.
Indeed, as shown in Figure 12, Latinos accounted for nearly a quarter of new entrepreneurs in 2016, despite making up just 18 percent of the population.

15
FIGURE 12: NEW ENTREPRENEURS VS. U.S. POPULATION, 2016
Sources: Kauffman 2017; U.S. Census Bureau.
Latino entrepreneurship is having a disproportionate impact on the U.S. economy. According to the most recent data from the Census Bureau’s Annual Survey of Entrepreneurs, the number of Latino-owned firms grew more than four times faster between 2014 and 2016 than the number of firms overall (13 percent vs. three percent). Over the same period, employment at Latino-owned firms grew more than twice as rapidly as for firms overall, while revenues grew more than five times as fast.14
As a result of Latinos’ high degree of engagement in the economy, Hispanic household income is rising more rapidly than for the rest of the population. Figure 13 shows the growth rate of real median household income by ethnic group from 2016 to 2017. Hispanic household income is growing faster than both the overall population and the white, non-Hispanic population. Recent research attributes the growth in Latino incomes in part to a high level of intergenerational mobility.15
14 U.S. Census Bureau, Statistics for U.S. Employer Firms by Sector, Gender, Ethnicity, Race, Veteran Status, and Employment Size of Firm for the U.S., States, and Top 50 MSAs: 2014 Annual Survey of Entrepreneurs (SE1400CSA04); U.S. Census Bureau, Statistics for U.S. Employer Firms by Sector, Gender, Ethnicity, Race, Veteran Status, and Employment Size of Firm for the U.S., States, and Top 50 MSAs: 2016 Annual Survey of Entrepreneurs (SE1600CSA04).
15 Raj Chetty et al, Race and Economic Opportunity in the United States: An Intergenerational Perspective, NBER Working Paper 24441 (March 2018) at 1 (“Hispanic Americans are moving up significantly in the income distribution across generations because they have relatively high rates of intergenerational mobility.”).

16
FIGURE 13: CHANGE IN REAL MEDIAN HOUSEHOLD INCOME, 2016-2017
Source: U.S. Census Bureau.
C. Previous Empirical Studies of the Latino Contribution to Business Dynamism
The demographic and economic data cited in Section B provide strong prima facie evidence that Latinos contribute positively to the U.S. economy in general and to business dynamism in particular. This finding is strengthened by a growing body of empirical economic research that directly connects the demographic and economic characteristics of the Latino population with economic performance.16
First, several recent academic studies provide support for the hypothesis that the Latino population is disproportionately entrepreneurial.17 For example, Wang shows that from 2002 to 2007 the number of Hispanic-owned businesses grew at more than twice the rate (44 percent) of all new
16 The summary below focuses mainly on the relationship between Latinos and business dynamism. There is a much larger literature on other measures of economic performance, e.g., job creation and wage growth, which is not summarized here. See e.g., Sari Pekkala Kerr and William R. Kerr, Economic Impacts of Immigration: A Survey, NBER Working Paper 16736 (January 2011); Christian Dustmann, Uta Schonberg and Jan Stuhler, “The Impact of Immigration: Why Do Studies Reach Such Different Results,” Journal of Economic Perspectives 30;4 (2016) 31-56 (hereafter Dustman et al).
17 Some studies using data sets from the 1980s and 1990s reported lower rates of entrepreneurship among Hispanic immigrants relative to the population. See e.g., Magnus Lofstrom, “Labor Market Assimilation and the Self-Employment Decisions of Immigrant Entrepreneurs,” Journal of Population Economics 15;1 (2002) 83-114 (hereafter Lofstrom 2002). However, even during this period, the entrepreneurship gap disappeared after controlling for factors like education and financial wealth. See e.g., Magnus Lofstrom and Chunbei Wang, “Mexican-American Self-Employment: A Dynamic Analysis of Business Ownership,” Ethnicity and Labor Market Outcomes (Research in Labor Economics, Volume 29), ed. Amelie F. Constant et al (Bingley, U.K.: Emerald, 2009) 197-227.
3.7%
2.6%
1.8%
0.0%
0.5%
1.0%
1.5%
2.0%
2.5%
3.0%
3.5%
4.0%
Hispanic White Non-Hispanic Total

17
businesses (18 percent).18 Carpenter and Loveridge use sophisticated econometric techniques to assess the interaction of self-employment with immigration and income and conclude that “Hispanics, not other ethnicities, drive much of the self-employment in U.S. cities.”19 Using Census data, Fairlie and Miranda examine hiring activity by start-ups, finding that “Hispanic-owned start-ups have higher rates of hiring their first employee than white-owned start-ups.”20
While two-thirds of Latinos are native born,21 there is also a well-documented positive relationship between immigration and entrepreneurship. An influential early study of the link between immigration and entrepreneurship by Borjas uses data from the 1970 and 1980 Censuses to show that the self-employment rate was higher among immigrants than native born citizens.22 Borjas’ finding has been corroborated by a number of subsequent studies,23 and the most recent research finds that the differential has become more pronounced. For instance, a 2017 study by Lofstrom finds that “more than 90 percent of the total growth in self-employment between 2000 and 2014 can be attributed to immigrants.”24 In another 2017 study, Kerr and Kerr use Census data to find that the “immigrant share of new entrepreneurs rises dramatically in our sample from 16.7 percent in 1995 to 27.1 percent in 2008…”25 The study also estimates that from 2002 to 2008, the share of immigrants engaged in entrepreneurship was approximately three percentage points higher than for the total population.26
As noted above, the Latino population is younger than the overall population. Several recent studies have linked age to economic performance. For instance, using a cross-country data set
18 Qingfang Wang, “Foreign-Born Status, Gender, and Hispanic Business Ownership Across U.S. Metropolitan Labor Markets: A Multilevel Approach,” Economic Development Quarterly 29;4 (2015) 328-340 at 328. Wang also finds that Latino immigrants (especially men) are more likely to be self-employed in MSAs with larger baseline Latino populations. Ibid. at 335.
19 Craig Wesley Carpenter and Scott Loveridge, “Immigrants, Self-Employment, and Growth in American Cities,” The Journal of Regional Analysis and Policy 47;2 (2017) 100-109 at 101. Carpenter and Loveridge estimate their model using both pooled ordinary least-squares (OLS) and the Arellano-Bond dynamic panel data estimator.
20 Robert W. Fairlie and Javier Miranda, “Taking the Leap: The Determinants of Entrepreneurs Hiring Their First Employee,” Journal of Economics and Management Strategy 26;1 (2017) 3-34 at 3.
21 The Census Bureau reports that in 2017 the U.S. Hispanic population was 58.8 million, of which 39.1 million, or 66 percent, were native born.
22 George J. Borjas, “The Self-Employment Experience of Immigrants,” Journal of Human Resources 21;4 (1986) 485-506 at 485.
23 See e.g., Lofstrom 2002; Robert W. Fairlie and Bruce D. Meyer, “The Effect of Immigration on Native Self-Employment,” Journal of Labor Economics 21;3 (2003) 619-650; Herbert Schuetze and Heather Antecol, “Immigration, Entrepreneurship and the Venture Start-up Process,” The Life Cycle of Entrepreneurial Ventures (International Handbook Series of Entrepreneurship, Volume 3), ed. Simon Parker (New York, NY: Springer, 2007) 107-135; Magnus Lofstrom et al, “Why Are Some People More Likely to Become Small-Business Owners than Others: Entrepreneurship Entry and Industry-Specific Barriers,” Journal of Business Venturing 29;2 (2014) 232-251.
24 Magnus Lofstrom, “Immigrant Entrepreneurship: Trends and Contributions,” Cato Journal 37;3 (2017) 503-522 at 508.
25 Sari Pekkala Kerr and William R. Kerr, “Immigrant Entrepreneurship,” Measuring Entrepreneurial Businesses: Current Knowledge and Challenges (NBER Studies in Income and Wealth, Volume 75), ed. John Haltiwanger, Erik Hurst, Javier Miranda and Antoinette Scholar (Chicago, IL and London, U.K.: University of Chicago Press, 2017) 187-249 at 207.
26 Ibid at 208.

18
containing information on entrepreneurial activity and age, Liang, Wang and Lazear find that “a median age that is one standard deviation lower is associated with a 2.5 percentage point higher country rate of entrepreneurship.”27 Karahan, Pugsley and Sahin assess the causes of the overall decline of the firm startup rate in the United States from 1979 to 2007 and conclude that at least half the decline can be explained by the drop in the growth rate of the working age population.28 Maestas, Mullen and Powell use predicted variation in the rate of population aging across U.S. states from 1980 to 2010 to evaluate the effect of aging on economic growth, finding that “a 10% increase in the fraction of the population ages 60+ decreases the growth rate of GDP per capita by 5.5%.”29 Their results suggest that if the age distribution of Latinos was the same as the population overall, the rate of GDP growth per capita would decline by 3.8 percent, implying that U.S. GDP in 2027 would be $823 billion lower.30
III. Econometric Analysis of the Latino Effect: Model and Results
This section reports the estimates from a statistical regression analysis applied to MSA-level data assessing the relationship between Hispanic participation in local labor markets and economic dynamism. Specifically, the model utilizes vector auto-regression (VAR) to quantify the relationship between changes in Hispanic employment and changes in labor productivity, new business formation and GDP per capita. The first part of this section briefly discusses the statistical methodology. (A more complete discussion is in Appendix A). The second part presents the results and assesses the extent to which they can be interpreted as constituting evidence of a causal relationship.
A. Methodology
The statistical analysis in this section is motivated by the hypothesis that differences in the rate of change in Latino employment across geographic areas affect economic performance. The units of observation are MSAs, and the model is estimated using annual data from 2007 to 2014. The independent variables of interest are lagged values of annual changes in (log) Hispanic employment. The dependent variables are annual changes in (log) labor productivity (GDP per
27 James Liang, Hui Wang and Edward P. Lazear, Demographics and Entrepreneurship, NBER Working Paper 20506 (November 2016) at 7.
28 Fatih Karahan, Benjamin Pugsley and Aysegul Sahin, Demographic Origins of the Startup Deficit (2016) at 5.
29 See Nicole Maestas, Kathleen Mullen and David Powell, The Effect of Population Aging on Economic Growth, the Labor Force and Productivity, RAND Labor & Population Working Paper (August 2016) at 1 (hereafter Maestas et al 2016) (available at http://www.rand.org/pubs/working_papers/WR1063-1.html). Approximately one-third of this outcome results from slower labor force growth, while the other two-thirds is explained by slower productivity growth. See Eisenach 2016 at 15.
30 Maestas et al 2016 at 1. Calculations available upon request.

19
employee), new business formation (the number of firms aged three years or less per capita)31 and output (GDP per capita).32
The model is specifically designed to address the econometric challenge of reverse causality. For example, in general, the identification of a statistically significant, positive relationship between Hispanic employment and GDP per capita does not exclude the possibility that increased GDP per capita causes increased Hispanic employment, rather than the other way around. The model applied here, combined with the application of a statistical technique known as the Granger Causality test, can provide statistical evidence as to the direction of the relationship.33
While the Granger Causality test provides insight into the direction of causality, it does not rule out spurious correlation due to an unobserved (“omitted”) variable correlated with Hispanic employment and, for example, GDP per capita. Estimating the model on panel data, however, can mitigate the omitted variable problem by permitting controls for general time trends and MSA-level fixed effects that may be correlated with both Hispanic employment and unobserved factors.34 In addition, a “falsification” or “placebo” test provides further support for a causal interpretation of the results. Specifically, lagged changes in non-Hispanic employment are added to the model so that the contribution of Hispanic and non-Hispanic employment can be compared directly.
As discussed below, the consistent findings across different tests and different estimation procedures provide a high degree of certainty that the estimates presented below are both statistically and economically robust, suggesting a causal relationship. Further robustness tests are reported in Appendix B.
B. Econometric Results: Economic Impact of Hispanic Employment
Table 1 presents summary statistics for the variables used in this study. As noted above, the observations are annual for 2007 to 2014 and represent MSA-level values.35
31 The findings are qualitatively and quantitatively similar if new business formation is defined with respect to firms aged two years or less or firms aged four years or less.
32 As called for in the VAR approach, lagged values of the dependent variables also appear as independent variables on the “right hand side” of the regression model. All specifications of the model employ the Arellano-Bond difference estimator, include time fixed effects and have robust standard errors clustered by MSA. Technical aspects of the methodology are discussed in greater detail in Appendix A.
33 C. W. J. Granger, “Investigating Causal Relations by Econometric Models and Cross-Spectral Methods,” Econometrica 37;3 (1969) 424-438.
34 As discussed in Appendix A, application of the Arellano-Bond estimator allows the regression model to be estimated taking full advantage of the panel setting. See e.g., Fumio Hayashi, Econometrics, 1d. ed. (Princeton, NJ and Oxford, U.K.: Princeton University Press, 2000) at 323-327 (hereafter Hayashi).
35 Because of the time structure of the model, the econometric sample contains one additional year of data for the dependent variables relative to the Hispanic and non-Hispanic employment variables, which only appear as independent variables. Thus, the sample sizes are larger for the measures of economic performance. Furthermore, the new business formation data are not available for as many MSAs as the other measures of economic performance, and, thus, there are fewer new business formation observations.

20
TABLE 1: SUMMARY STATISTICS
Sources: Bureau of Economic Analysis; U.S. Census Bureau. Note: New business formation per capita is per million. There is significant variation in both the independent and the dependent variables. For example, average Hispanic employment in the sample is 122,198 while the tenth percentile Hispanic employment is 10,401 and the 90th percentile is 247,367. Average labor productivity is $96,799, while the tenth percentile is $70,227 and the 90th percentile is $125,690. Thus, the underlying data include MSAs representing a wide range of economic circumstances with sufficient variation to obtain economically meaningful and statistically significant results.
Table 2 presents the coefficients for the lagged Hispanic employment variables for the primary regression specification, which includes four lags of Hispanic employment and four autoregressive terms for each of the dependent variables (the full set of coefficient estimates are presented in Appendix A).36 In each case, the coefficients indicate the effect of a one percent increase in Hispanic employment in a prior year (year T-1, year T-2, etc.) on the dependent variable in the current year (year T). For example, the coefficients in the second column of the table (labor productivity) indicate that a one percent increase in Hispanic employment in year T-1 is associated with an increase in labor productivity in year T of 0.133 percent of the level of labor productivity in year T-1; a one percent increase in Hispanic employment in year T-2 is associated with an increase in labor productivity in year T of 0.097 percent of the level of labor productivity in year T-1; a one percent increase in Hispanic employment in year T-3 is associated with an increase in labor productivity in year T of 0.138 percent of the level of labor productivity in year T-1; and so forth. The sum of the coefficients in each column shows the cumulative effect of a sustained one percent increase in Hispanic employment in each of the prior four years. Thus, again using labor productivity as an example, a sustained one percent increase in Hispanic employment for four years increases labor productivity in year T by 0.491 percent of the previous year’s level. The same interpretation applies to the other dependent variables.
36 The results presented here reflect application of the Arellano-Bond estimator. The model was also estimated using “ordinary least squares” (OLS). The results are qualitatively and quantitatively similar.
Variables Number of Observations
Mean Standard Deviation
10th Percentile 90th Percentile
Hispanic Employment 1,080 122,198 298,447 10,401 247,367Non-Hispanic Employment 1,080 528,252 841,442 43,704 1,331,986
Labor Productivity 1,243 $96,799 $27,700 $70,227 $125,690New Business Formation per Capita 1,220 4,066 1,296 2,657 5,830
GDP per Capita 1,243 $44,520 $15,325 $27,832 $61,224

21
TABLE 2: REGRESSION COEFFICIENT ESTIMATES
Sources: See Table 1 sources; NERA calculations. Notes: [1] Figures do not sum to totals due to rounding. [2] *** Significant at the one percent level; ** Significant at the five-percent level; *Significant at the ten-percent level.
The estimated coefficients on the annual changes in Hispanic employment are uniformly positive and, as indicated by the asterisks, individually statistically significant in all cases.37 The robust pattern of individual statistical significance demonstrates that from a model selection perspective, there is little risk of over-specification in the choice of lag-length and that the total estimated magnitude of the predicted effects across lags is conservative.38 However, the question of primary interest in this study is not the individual significance of the coefficients, but whether there is evidence of a systematic relationship between Hispanic employment and our three measures of economic performance.
The to assess the direction of the relationship, we apply the Granger Causality test, which evaluates the joint significance of a set of time series coefficients. Applying the test here involves specifying the null hypothesis that the coefficients on the lagged Hispanic employment variables are jointly equal to zero.39 If the null hypothesis is rejected, then the Hispanic employment time series has predictive power beyond the regression of the dependent variable on its own lags, and there is a “Granger Causal” relationship from Hispanic employment to the dependent variable.40 As shown in Appendix A, the null hypothesis is rejected at the five percent level for all three dependent variables.
37 The asterisks indicate the level of statistical significance of the coefficients – that is, the level of statistical certainty with which the null hypothesis that the coefficients are not statistically different from zero can be rejected.
38 The standard model selection tools often used to determine lag length involve adding lags until the explanatory power of the marginal lag falls below some pre-specified threshold. For instance, under the “general to specific sequential t rule,” a maximum lag length is specified and then lags are dropped iteratively until the final lag in the time series is significant. See Hayashiat 394-395. As demonstrated in Appendix B, adding a fifth lag to the model results in a positive coefficient estimate for each of the dependent variables and for new business formation per capita, the additional lag is statistically significant. However, because adding additional lags also reduces the sample size, we conservatively have chosen to specify the primary model with four lags.
39 Walter Enders, Applied Econometric Time Series, 3d. ed. (Hoboken, NJ: Wiley, 2010) at 318-319. 40 A relationship between two time series is said to be “Granger Causal” when the past values of the “causal”
time series contain information that helps to forecast future values of the “caused” time series with greater precision than past values of the “caused” time series alone. See Ibid.
Year Labor Productivity New Business Formation per Capita
GDP per Capita
T-1 0.133** 0.087* 0.089***T-2 0.097* 0.084** 0.082***T-3 0.138*** 0.117*** 0.092**T-4 0.123*** 0.090*** 0.084***
Total 0.491 0.378 0.347

22
The coefficients also indicate that the relationship between Hispanic employment and economic performance is economically material. The sums of the lagged coefficients shown in the bottom row of Table 2 indicate that a one percent increase in Hispanic employment in each of the previous four years would increase labor productivity in the current year by approximately 0.5 percent of the level of labor productivity in the previous year, increase new business formation per capita by 0.4 percent of the level of new business formation per capita in the previous year and increase GDP per capita by approximately 0.3 percent of the level of GDP per capita in the previous year.41 Applying these percentages to the current level of each measure of economic performance implies that a one percent increase in Hispanic employment over four years would raise labor productivity by $613 per employee in the following year, raise new business formation per capita by 15 businesses per million, and raise GDP per capita by $208.42
As discussed in Appendix A, the estimation procedure used here controls for endogeneity while exploiting the panel structure of the data to account for the potential effects of omitted variables, thus strengthening the case for a causal interpretation of the results. Further support for a causal interpretation is provided by the application of a “falsification” (or “placebo”) test. Specifically, lagged changes in non-Hispanic employment are added to the model to determine whether the Hispanic employment effect persists after controlling for annual employment changes among the rest of the population. Table 3 presents the results of the falsification test.
41 For concreteness, assume the rate of growth of Hispanic employment is two percent per year under the current trend and one percent per year under a slower growth scenario (a one percentage point difference in the growth rate) for four years, and that the level of Hispanic employment at the beginning of the period was one million. Under the slower growth scenario, Hispanic employment would have risen to 1,040,604 (1,000,000 × (1 + 1%)4) by the end of the period; under the current trend it rises instead to 1,082,432 (1,000,000 × (1 + 2%)4). Assume next that the level of GDP per capita was $50,000 in the last year of the four-year period. In the following year, GDP per capita would have increased by $150 under the slower growth scenario (0.300 × 1% × $50,000) but increased by approximately $300 under the current trend (0.300 × 2% × $50,000). Thus, in the present year, GDP per capita increased by $150 relative to the slower growth scenario due to increased Hispanic employment.
42 The 2017 values are approximately $124,841 for labor productivity and $59,774 for GDP per capita. The most recent year of available data for new business formation per capita is 2016. Using the 2012 to 2016 compound annual growth rate (CAGR) for new business formation per capita of 0.91 percent and the 2016 value of new business formation per capita of 3,965 per million, the projected 2017 value of new business formation per capita is 4,001 per million.

23
TABLE 3: REGRESSION COEFFICIENT ESTIMATES
HISPANIC VS. NON-HISPANIC EMPLOYMENT
Sources: See Table 1 sources; NERA calculations. Notes: [1] Figures do not sum to totals due to rounding. [2] *** Significant at the one percent level; ** Significant at the five-percent level; *Significant at the ten-percent level.
The coefficients on the lags of the Hispanic employment variables are uniformly positive and statistically significant, whereas the lags of non-Hispanic employment variables are generally not statistically significant nor even uniformly positive. The results suggest two conclusions. First, the Latino effect persists after controlling for changes in non-Hispanic employment. Second, there is little evidence of similar effects for the non-Hispanic population, indicating that the U.S. Latino workforce provides a unique contribution to business dynamism and economic growth.
IV. Quantifying the Latino Contribution to the U.S. Economy
This section presents estimates of the contribution of Latino employment growth to economic performance based on the regression results from the previous section. Specifically, it compares a scenario where Hispanic employment continues to increase at its current trend from 2018 to 2024 to a counterfactual scenario where Hispanic employment increases at the rate of the rest of the U.S. population. The results indicate that the higher rate of Hispanic employment growth increases labor productivity by an average of $1,245 per year, increases new business formation by an average of 33,223 firms per year, increases GDP by $4.9 trillion or an average of $701.4 billion per year, and increases GDP per capita by an average of $442 per year from 2019 to 2025.
A. Hispanic Employment and Population Growth Scenarios
To project the effect of Hispanic employment growth on economic performance using the regression results from the previous section, this section compares two growth scenarios. The baseline scenario assumes that Hispanic employment grows from 2018 to 2024 at the current trend – the compound annual growth rate (CAGR) over the last five years of available data, 2013 to 2017. The counterfactual scenario assumes that from 2018 to 2024, Hispanic employment grows
Year Labor Productivity New Business Formation per Capita
GDP per Capita
Hispanic EmploymentT-1 0.138** 0.116*** 0.077**T-2 0.103** 0.117*** 0.072**T-3 0.131*** 0.143*** 0.079**T-4 0.133*** 0.110*** 0.078***
Total 0.506 0.486 0.307Non-Hispanic Employment
T-1 0.136 -0.081 0.164**T-2 0.033 -0.026 0.111T-3 -0.091 -0.109 0.065T-4 0.054 -0.054 0.081
Total 0.133 -0.270 0.421

24
at the CAGR of non-Hispanic employment from 2013 to 2017, which is slower than the current trend of Hispanic employment growth. This scenario is referred to as the “slow growth scenario” in the remainder of this study.
Table 4 shows the actual levels of Hispanic and non-Hispanic employment from 2013 to 2017 and the CAGR over the period. Hispanic employment grew at a rate of 3.8 percent per year while non-Hispanic employment grew at 1.3 percent per year, a difference of 2.5 percentage points.
TABLE 4: HISPANIC VS. NON-HISPANIC EMPLOYMENT, 2013-2017
(MILLIONS)
Source: U.S. Census Bureau.
As described in greater detail below, for the comprehensive calculation of new business formation, it is also necessary to analyze two similar scenarios of Hispanic population growth – the first growing at the current trend and the second growing at the rate of non-Hispanic population growth.
Table 5 shows the actual levels of the Hispanic and non-Hispanic population from 2013 to 2017 and the CAGR over the period. The Hispanic population grew at a rate of 2.2 percent per year while the non-Hispanic population grew at 0.4 percent per year, a difference of 1.7 percentage points.43
TABLE 5: HISPANIC VS. NON-HISPANIC POPULATION, 2013-2017
(MILLIONS)
Source: U.S. Census Bureau. B. Impact of Hispanic Employment and Population Growth on Economic
Performance
This section estimates the incremental contribution of Latinos to the U.S. economy resulting from more rapid employment and population growth relative to the other segments of the population. These projected effects are calculated by taking the difference between the Hispanic employment and population growth rate under the current trend and under the slow growth scenario and
43 The difference between 2.2 percent and 0.4 percent is 1.7 percentage points rather than 1.8 percentage points due to rounding.
2013 2014 2015 2016 2017 2013-2017CAGR
Hispanic 23.1 24.1 25.0 25.7 26.8 3.8%Non-Hispanic 123.0 124.9 126.5 127.8 129.3 1.3%
2013 2014 2015 2016 2017 2013-2017CAGR
Hispanic 54.0 55.3 56.5 57.4 58.8 2.2%Non-Hispanic 262.1 263.6 264.9 265.7 266.9 0.4%

25
applying the coefficient estimates shown in Table 2. The projection procedure is discussed in detail in Appendix C.
Table 6 presents shows the projected effect on labor productivity of higher Latino employment growth from 2019 to 2025.
TABLE 6: EFFECT OF HIGHER HISPANIC EMPLOYMENT GROWTH ON LABOR PRODUCTIVITY,
2019-2025 ($2017)
Sources: See Table 1 sources; NERA calculations. Note: Figures do not sum to totals due to rounding.
For a given year T, rows T-1 through T-4 show the increased labor productivity resulting from higher Latino employment growth in the four previous years. For example, the 2019 value of $421 indicated in row T-1 represents increased labor productivity in 2019 due to higher Latino employment growth in 2018. The labor productivity effects in each column sum to equal the total labor productivity effect in year T, shown in the “Annual Increase” row. Labor productivity (output per employee) increases by an average of $1,245 per year and reaches $1,611 in 2025.
Figure 14 depicts these results graphically, comparing the level of labor productivity under the two Hispanic employment growth scenarios.
FIGURE 14: IMPACT OF HIGHER HISPANIC EMPLOYMENT GROWTH ON PRODUCTIVITY, 2019-2025 ($2017)
Sources: See Table 1 sources; NERA calculations.
Year 2019 2020 2021 2022 2023 2024 2025T-1 $421 $423 $426 $428 $431 $433 $436T-2 $0 $308 $310 $312 $314 $316 $318T-3 $0 $0 $443 $445 $448 $451 $453T-4 $0 $0 $0 $397 $400 $402 $405
Annual Increase $421 $731 $1,178 $1,583 $1,592 $1,602 $1,611
$421
$731
$1,178
$1,583 $1,592 $1,602 $1,611
$0
$200
$400
$600
$800
$1,000
$1,200
$1,400
$1,600
$1,800
2019 2020 2021 2022 2023 2024 2025

26
Table 7 presents the results for new business formation. Because the econometric results imply that increased Hispanic employment increases the propensity for entrepreneurship, the total business formation effect is the combined effect of Latinos on the per capita rate of entrepreneurship and on the increase in population. Table 7 presents comprehensive projections of increased new business formation from 2019 to 2025 due to faster Hispanic employment and population growth under current trends.
TABLE 7: EFFECT OF HIGHER HISPANIC EMPLOYMENT GROWTH ON NEW BUSINESS FORMATION,
2019-2025
Sources: See Table 1 sources; NERA calculations. Note: NBF is an abbreviation for new business formation.
The difference between new business formation under the two growth scenarios is substantial, averaging 33,223 firms per year, and increases every year of the period, ranging from 11,313 firms in 2019 to 52,135 firms in 2025.
Further, Table 7 breaks out the new business formation effect into an effect due to the higher per capita rate of entrepreneurship and an effect due to the higher rate of population growth. The entrepreneurship effect grows rapidly from 2019 to 2022 and remains fairly stable over the rest of the period. However, the population effect increases substantially in every year of the period, from 8,406 firms in 2019 to 38,408 firms in 2025. This result is due to the compounding effects of a higher rate of Hispanic population growth under the current trend compared to the slow growth scenario.
Figure 15 presents a graphical depiction of the new business formation results.
2019 2020 2021 2022 2023 2024 2025∆ NBF 11,313 18,682 27,470 35,638 40,914 46,410 52,135
Entrepreneurship Effect on NBF 2,908 5,791 9,898 13,181 13,360 13,542 13,727Population Effect on NBF 8,406 12,890 17,572 22,457 27,554 32,868 38,408% Entrepreneurship Effect 26% 31% 36% 37% 33% 29% 26%
% Population Effect 74% 69% 64% 63% 67% 71% 74%

27
FIGURE 15: ADDITIONAL NEW BUSINESSES FROM HIGHER HISPANIC EMPLOYMENT AND
POPULATION GROWTH, 2019-2025
Sources: See Table 1 sources; NERA calculations. Similarly, the overall contribution of Latinos to overall GDP growth can be calculated using the labor productivity results and the projected total increase in Latino employment. Table 8 presents the projected effect of higher Hispanic employment on GDP.
TABLE 8: EFFECT OF HIGHER HISPANIC EMPLOYMENT GROWTH ON GDP, 2019-2025
($2017 BILLIONS)
Sources: See Table 1 sources; NERA calculations. Note: Figures do not sum to totals due to rounding.
GDP is projected to increase substantially under the current trend of Hispanic employment growth relative to the slow growth scenario. The difference in GDP under the two scenarios totals $4.9 trillion over the period, or $701.4 billion per year, and reaches $1.1 trillion in 2025.
The GDP estimates can be broken out into a productivity effect and an employment effect. The productivity effect on GDP increases rapidly from 2019 to 2022 and then stabilizes from 2022 to 2025. Meanwhile, the employment effect grows substantially in every year of the entire period, increasing from $174.9 billion in 2019 to $842.9 billion in 2025 due to the compounding effects of a higher rate of Hispanic employment growth under the current trend compared to the slow growth scenario.
2019 2020 2021 2022 2023 2024 2025∆ GDP $242.2 $389.1 $565.5 $742.8 $861.8 $987.7 $1,120.7
Labor Productivity Effect on GDP $67.3 $118.5 $193.3 $262.9 $267.8 $272.8 $277.9Employment Effect on GDP $174.9 $270.6 $372.2 $479.9 $594.0 $714.9 $842.9% Labor Productivity Effect 28% 30% 34% 35% 31% 28% 25%
% Employment Effect 72% 70% 66% 65% 69% 72% 75%

28
Figure 16 presents a graphical depiction of the GDP results.
FIGURE 16: EFFECT OF HIGHER HISPANIC EMPLOYMENT GROWTH ON GDP, 2019-2025
($2017 BILLIONS)
Sources: See Table 1 sources; NERA calculations. Note: Figures do not sum to totals due to rounding.
As demonstrated by the GDP per capita regression results, the increased economic growth attributable to Latinos translates directly into increased prosperity for the overall population. Table 9 presents the results for GDP per capita.
TABLE 9: EFFECT OF HIGHER HISPANIC EMPLOYMENT GROWTH ON GDP PER CAPITA, 2019-2025
($CURRENT)
Sources: See Table 1 sources; NERA calculations. Note: Figures do not sum to totals due to rounding.
Rows T-1 through T-4 have the same interpretation as in Table 6 above. Higher Hispanic employment growth increases GDP per capita by an average of $442 per year, reaching $582 in 2025.
Figure 17 depicts these results graphically, comparing the level of GDP per capita under the two scenarios of Hispanic employment growth.
$174.9$270.6
$372.2$479.9
$594.0$714.9
$842.9
$67.3
$118.5
$193.3
$262.9
$267.8
$272.8
$277.9
$242.2
$389.1
$565.5
$742.8
$861.8
$987.7
$1,120.7
$0
$200
$400
$600
$800
$1,000
$1,200
2019 2020 2021 2022 2023 2024 2025
Productivity EffectEmployment Effect
Year 2019 2020 2021 2022 2023 2024 2025T-1 $137 $139 $141 $143 $146 $148 $150T-2 $0 $127 $129 $131 $133 $135 $137T-3 $0 $0 $146 $148 $150 $153 $155T-4 $0 $0 $0 $134 $136 $138 $140
Annual Increase $137 $266 $416 $556 $565 $573 $582

29
FIGURE 17: EFFECT OF HIGHER HISPANIC EMPLOYMENT GROWTH ON GDP PER CAPITA, 2019-2025
($CURRENT)
Sources: See Table 1 sources; NERA calculations.
Table 10 provides a summary of the projected effects of higher Hispanic employment and population growth on economic performance from 2019 to 2025.
TABLE 10:
SUMMARY OF HISPANIC EMPLOYMENT AND POPULATION GROWTH EFFECTS ON ECONOMIC PERFORMANCE, 2019-2025
Source: See Tables 6-9. As a point of comparison, the impact of higher Latino employment and population growth on GDP (averaging $701.4 billion annually from 2019-2025) is comparable to the estimated effects of the 2017 Tax Cuts and Jobs Act, which the Council of Economic Advisers projects could increase GDP by between $470 billion and $740 billion per year over the next decade.44
44 See Kevin Hassett, Testimony Before the Joint Economic Committee by the Council of Economic Advisers Chairman Kevin Hassett, U.S. Congress Joint Economic Committee (March 7, 2018) at 2 (available at https://www.jec.senate.gov/public/_cache/files/e47e271b-75af-4cff-80e5-cbded7441955/180307---testimony---kevin-hassett-economic-report-of-the-president.pdf). See also Economic Report of the President 2018 at 67-71.
$137
$266
$416
$556 $565 $573 $582
$0
$100
$200
$300
$400
$500
$600
$700
2019 2020 2021 2022 2023 2024 2025
2019 2020 2021 2022 2023 2024 2025 AverageLabor Productivity ($2017) $421 $731 $1,178 $1,583 $1,592 $1,602 $1,611 $1,245New Business Formation 11,313 18,682 27,470 35,638 40,914 46,410 52,135 33,223GDP ($2017 Billions) $242 $389 $565 $743 $862 $988 $1,121 $701GDP per Capita ($Current) $137 $266 $416 $556 $565 $573 $582 $442

30
V. Policy Implications and Suggestions for Further Research
The results reported here have potentially important implications for our understanding of the economic effects of immigration. To date, relatively little focus has been placed on understanding the potential effects of immigration on business dynamism and the resulting impact on productivity and economic growth. The results of this study emphasize the importance of these factors for evaluating the economic effects of immigration. Furthermore, our findings shed new light on two topics that have traditionally been at the forefront of the immigration debate: (a) the impact of immigration on the wages and employment of native workers; and, (b) the connection between the skills and education levels of immigrants, on the one hand, and their economic contributions, on the other.
First, while our results do not allow us formally to distinguish the impact of Latino immigrants as compared to native born Latinos, the fact is that there is significant overlap between the Latino and immigrant cohorts in the U.S. For example, the Pew Foundation reports that immigrants from Mexico, Central America and South America currently account for over 42 percent of all U.S. immigrants, compared with 27 percent for the next largest region of origin (South and East Asia).45 And, Census Bureau data show that 66.4 percent of Hispanics are either first-generation (34.9 percent) or second-generation (31.5 percent) immigrants, roughly triple the proportion for the overall population.46 Furthermore, as discussed in Section II above, there is significant evidence of a positive relationship between immigration and Latino status, on the one hand, and entrepreneurship, on the other. Thus, it is reasonable to infer that the effects we attribute to the “Latino effect” are closely intertwined with immigration.
With this in mind, our results cast new light on the existing research into the wage and employment effects of immigration on native workers. Most of that research relies on partial equilibrium models of the labor market which focus on the effects of increases in the supply of particular types of labor on wages and employment. As one recent article explained, “[t]his model has led to the common view of immigration being potentially harmful for individuals whose skills are most similar to those of immigrants, but possibly beneficial for those whose skills are different.”47 While the empirical results of such studies are mixed, many find at least some short-term harm to native workers from immigration.48
45 Gustavo López et al,”Key Findings About U.S. Immigrants,” Pew Research Center (November 30, 2018) (available at http://www.pewresearch.org/fact-tank/2018/11/30/key-findings-about-u-s-immigrants/) (“By region of birth, immigrants from South and East Asia combined accounted for 27% of all immigrants, a share equal to that of Mexico. Other regions make up smaller shares: Europe/Canada (13%), the Caribbean (10%), Central America (8%), South America (7%), the Middle East (4%) and sub-Saharan Africa (4%).”).
46 Edward Trevelyan et al, Characteristics of the U.S. Population by Generational Status: 2013, U.S. Census Bureau (November 2016) (available at https://www.census.gov/content/dam/Census/library/publications/2016/demo/P23-214.pdf).
47 See Dustmann et al at 31. 48 Dustmann et al at 34-35.

31
Our results suggest that the effects of immigration, or at least of Latino immigration, may be more complex and nuanced than suggested by these partial equibrium models of labor market supply and demand. Specifically, our findings suggest that immigration may result in higher rates of new business formation, leading to increases in employment and incomes for all workers. At a minimum, we believe further research into the relationship between immigration, business dynamism and economic performance, including wage and employment effects, is warranted.
Another potential implication of our work is to inform the question of what types of immigrant labor are optimal from the perspective of improving economic performance, a discussion often framed in terms of a “merit-“ or “skills-based” immigration policy. While it is often assumed that the economic contribution of immigrant labor is a function of skills (e.g., measured by prior income, occupation, or years of experience) and education,49 our findings suggest that Latinos, by virtue of their entrepreneurship, contribute disproportionately to economic growth despite having lower average levels of educational attainment than the overall population. This result suggests that entrepreneurship is another important aspect of “merit” that should be taken into account in crafting immigration policy. Again, we believe further research into these issues is warranted.
Most importantly, our results emphasize the importance of focusing on the overall consequences of immigration for economic growth and productivity, which are the ultimate drivers of employment, wages, and tax receipts, the economic variables that have received the most attention in discussions of immigration policy. A critical finding of this study is that the Latino effect induces substantial “spillover” benefits for the entire U.S. economy. That is, rather than increasing economic activity in proportion to the size of the Hispanic population, Latino engagement in the economy increases the size of the U.S. economic pie. By catalyzing entrepreneurship and contributing to business dynamism, Latinos increase the competitiveness of the U.S. economy, driving economic growth.
VI. Conclusion
There is now a substantial literature that documents the ways in which Latinos contribute to the U.S. economy. This study builds on that literature by assessing the specific mechanisms by whichv Latinos drive economic growth and by providing rigorous quantitative estimates of the relationship between Latino engagement in local labor markets and economic performance. The results show that increased Hispanic employment is associated with economically and statistically significant increases in labor productivity, new business formation and GDP per capita. They also provide evidence that the Latino effect is causal and is mediated by Latino’s contribution to business dynamism. In the face of evidence that demographic changes and reduced economic dynamism will create significant headwinds for the U.S. economy in the future, it seems clear the Latino contribution to the U.S. economy will continue to grow.
49 See, Kevin Hassett, Testimony Before the Joint Economic Committee by the Council of Economic Advisers Chairman Kevin Hassett, U.S. Congress Joint Economic Committee (March 7, 2018) at 4 (available at at 4 (available at https://www.jec.senate.gov/public/_cache/files/e47e271b-75af-4cff-80e5-cbded7441955/180307---testimony---kevin-hassett-economic-report-of-the-president.pdf) (citing Edward P. Lazear, Why Are Some Immigrant Groups More Successful Than Others?, NBER Working Paper No. 23548 (November 2018) (available at https://www.nber.org/papers/w23548.pdf)).

Appendix A: Econometric Methodology
This appendix provides a formal description of the econometric model and provides greater detail on the technical aspects of the methodology.
Econometric Model
The baseline model for this study is a specification where the dependent variable is the change in a measure of economic performance between year t and year t-1, and the right-hand side variables are lags of the dependent variable and lagged annual changes in the logged values of Hispanic employment by MSA. Specifically:
Δln(𝑌𝑌𝑖𝑖𝑖𝑖) = �𝛼𝛼𝜃𝜃Δln(𝑌𝑌𝑖𝑖𝑖𝑖−𝜃𝜃)𝑚𝑚
𝜃𝜃=1
+ �𝛽𝛽𝜃𝜃Δln(𝐻𝐻𝐻𝐻𝐻𝐻𝐻𝐻𝐻𝐻𝐻𝐻𝐻𝐻𝐻𝐻 𝐸𝐸𝐸𝐸𝐻𝐻𝐸𝐸𝐸𝐸𝐸𝐸𝐸𝐸𝐸𝐸𝐻𝐻𝐸𝐸𝑖𝑖𝑖𝑖−𝜃𝜃)𝑚𝑚
𝜃𝜃=1
+ 𝜏𝜏𝑖𝑖 + 𝜇𝜇𝑖𝑖 + 𝜖𝜖𝑖𝑖𝑖𝑖
where ln (𝑌𝑌𝑖𝑖𝑖𝑖) represents the (log) value of one of three measures of economic performance in MSA 𝐻𝐻 and year 𝐸𝐸: labor productivity, new business formation per capita and GDP per capita. The first set of right-hand side variables represent 𝐸𝐸 lags of the dependent variable and the second set of right-hand side variables represent 𝐸𝐸 lags of the change in the (log) value of Hispanic employment. 𝜏𝜏𝑖𝑖 is a year fixed effect, 𝜇𝜇𝑖𝑖 is an MSA fixed effect and 𝜖𝜖𝑖𝑖𝑖𝑖 is the econometric error term.
Variables and Data Sources
The variables used in estimating the model are defined in Table A-1.
TABLE A-1: VARIABLE DEFINITIONS
Sources: Bureau of Economic Analysis; U.S. Census Bureau. As shown in Table A-1, the data used in this study are assembled from various sources. Because years are the finest temporal unit of observation available at the MSA-level across all variables,
Variables Definition SourceDependent
Δ ln(Labor Productivity) Change in log of real Gross Domestic Product in 2009 chained USD per worker BEA, ACSΔ ln(New Business Formation per Capita) Change in log of number of firms aged three years or younger per million people BDS, ACS
Δ ln(GDP per Capita) Change in log of real Gross Domestic Product in 2009 chained USD per person BEAIndependent
Δ ln(Hispanic Employment) Change in log of Hispanic employed population ACSΔ ln(Non-Hispanic Employment) Change in log of non-Hispanic employed population ACS
Δ ln(Total Employment) Change in log of total employed population ACS

A-2
all specifications of the model are estimated annually. 1 Labor productivity is calculated by dividing GDP,2 sourced from the Bureau of Economic Analysis (BEA), by total employment,3 sourced from the Census Bureau’s American Community Survey (ACS). New business formation per capita is calculated by dividing the number of firms aged three years or younger (referred to as “new business formation”),4 sourced from the Census Bureau’s Business Dynamics Statistics (BDS), by the total population in millions, sourced from the ACS. GDP per capita5 data are sourced from the BEA. Data on Hispanic employment6 are sourced from the ACS. Non-Hispanic employment is simply the difference between total employment and Hispanic employment.
Model Estimation
Table A-2 presents the regression results in full.
1 MSAs are a subset of core based statistical areas (CBSAs), which also include micropolitan statistical areas (μSAs). All CBSAs have populations of at least 10,000, but μSAs have populations of less than 50,000 while MSAs have populations of 50,000 or more.
2 GDP is defined as each MSA’s gross product in chained 2009 dollars based on national prices for the goods and services produced within the MSA. See Bureau of Economic Analysis, “Regional Economic Accounts: Regional Definitions – Real GDP by Metropolitan Area” (available at https://apps.bea.gov/regional/definitions/).
3 Total employment as used in this study is defined as the sum of the armed forces and the civilian employed population. See U.S. Census Bureau.
4 Firms are defined as business organizations consisting of one or more domestic establishments that are specified under common ownership or control. Establishments are defined as physical locations where business is conducted or where services or industrial operations are performed. A firm is counted in a given MSA if at least one of its establishments is located in the MSA, so firms with establishments located in multiple MSAs are counted separately in each MSA. The number of firms aged three years or younger is the number of firms whose oldest establishment, regardless of the MSA in which it is located, has reported positive employment for three years or less. See U.S. Census Bureau, “Business Dynamics Statistics – Definitions” (available at https://www.census.gov/ces/dataproducts/bds/definitions.html); U.S. Census Bureau, BDS Variable Codebook (2014/15/16 Releases) (available at https://www.census.gov/ces/pdf/BDS_Codebook.pdf).
5 GDP per capita is defined as each MSA’s gross product in chained 2009 dollars based on national prices for the goods and services produced within the MSA divided by the resident population of the MSA. See Bureau of Economic Analysis, “Regional Economic Accounts: Regional Definitions – Per Capita Real GDP by Metropolitan Area” (available at https://apps.bea.gov/regional/definitions/).
6 Hispanic employment as used in this study is defined as the sum of the armed forces and civilian employed population identifying as Hispanic or Latino. See U.S. Census Bureau.

A-3
TABLE A-2: REGRESSION RESULTS
Sources: See Table A-1 sources; NERA calculations. Notes: *** Significant at the one percent level; ** Significant at the five-percent level; * Significant at the ten-percent level. One of the primary advantages of panel data is that it allows econometricians to control for non-time varying sources of potential endogeneity using fixed-effects. In fixed-effects models, each cross-sectional unit of observation (MSA) is allowed to have its own intercept term, allowing the econometrician to account for individual heterogeneity that would otherwise be relegated to the error term, causing the standard orthogonality assumptions of regression analysis to fail.7 Because fixed effects can control for a wide array of potentially confounding factors, they are a powerful tool for identifying causal relationships.8
It is well understood that in models where lagged values of the dependent variable are included as right-hand side variables, the presence of fixed effects, when combined with the dynamic structure of the model, introduces a new source of potential endogeneity.9 Thus, econometricians have
7 Hayashi at 323-327. 8 James H. Stock and Mark W. Watson, Introduction to Econometrics, 1d. ed. (Boston, MA: Pearson
Education, 2003) at 271-272. 9 Douglas Holtz-Eakin, Whitney Newey, and Harvey S. Rosen, “Estimating Vector Autoregressions with Panel
Data,” Econometrica 56;6 (1988) 1371-1395 at 1374 (hereafter Holtz-Eakin, Newey, and Rosen 1988).
VariablesΔ ln(Labor
Productivityt)Δ ln(New Business
Formation per Capitat)Δ ln(GDP per Capitat)
Δ ln(Y) Lags-0.2748*** 0.0423 -0.0727
(0.1057) (0.0837) (0.0945)-0.1629* -0.0546 -0.1246**(0.0951) (0.0837) (0.0582)-0.0697 -0.1835** -0.0299(0.0774) (0.0760) (0.0552)0.0631 -0.1978*** 0.0816
(0.0739) (0.0654) (0.0576)Δ ln(Hispanic Employment) Lags
0.1328** 0.0869* 0.0895***(0.0563) (0.0463) (0.0297)0.0967* 0.0838** 0.0815***(0.0504) (0.0339) (0.0316)
0.1381*** 0.1172*** 0.0924**(0.0461) (0.0367) (0.0374)
0.1232*** 0.0903*** 0.0838***(0.0413) (0.0302) (0.0300)
Observations 428 425 428
Δ ln(Hispanic Employmentt-3)
Δ ln(Hispanic Employmentt-4)
Δ ln(Yt-1)
Δ ln(Yt-2)
Δ ln(Yt-3)
Δ ln(Yt-4)
Δ ln(Hispanic Employmentt-1)
Δ ln(Hispanic Employmentt-2)

A-4
developed advanced estimation tools to leverage the explanatory power of panel data models.10 Because of its flexibility and its inclusion in common statistical packages like Stata, the methodology developed by Arellano and Bond (1991) has become the standard econometric procedure for estimating dynamic panel models. All results presented in this paper are estimated using the Arellano-Bond procedure. However, the results are qualitatively and quantitatively similar using OLS. Granger Causality
Table A-3 presents the results of the Granger Causality tests for the model. For all three dependent variables the null hypothesis is rejected at the five percent level.
TABLE A-3: GRANGER CAUSALITY TESTS
Sources: See Table A-1 sources; NERA calculations. Note: Test statistics and their respective p-values are based on regressions from Table A-2.
The Granger Causality tests indicate that economic performance responds directly to changes in Hispanic employment rather than changes in Hispanic employment merely reflecting a side effect of economic growth. Combined with the uniformly positive coefficient estimates on the lagged Hispanic employment variables, these results provide evidence that increases in Hispanic employment lead to increases in economic performance.
Arellano-Bond Test
As explained above, the purpose of the Arellano-Bond estimator is to eliminate potential estimation bias resulting from endogeneity in dynamic panel data models. In the primary case studied in Holtz-Eakin, Newey and Rosen, only the first lag of each time series is endogenous in the estimating equation, so that the previous lags can be used as instruments to identify the endogenous variables.11 However, when the model is characterized by higher order autocorrelation beyond the first-order autocorrelation created by the fixed effects, additional lags may become endogenous, leading to inconsistent estimates. The solution to this problem is to use a restricted set of instruments that does not include any of the endogenous variables.
10 See e.g., ibid.; Manuel Arellano and Stephen Bond, “Some Tests of Specification for Panel Data: Monte Carlo Evidence and an Application to Employment Equations,” The Review of Economic Studies 58;2 (1991) 277-297 (hereafter Arellano and Bond 1991); Richard Blundell and Stephen Bond, “Initial Conditions and Moment Restrictions in Dynamic Panel Data Models,” Journal of Econometrics 87 (1998) 115-143. In these models, endogenous lags are estimated using prior lags which are uncorrelated with the current period error term.
11 Holtz-Eakin, Newey and Rosen 1988 at 1375-1376.
Dependent Variable χ2-Stat P-ValueΔ ln(Labor Productivity) 11.91 0.018
Δ ln(New Business Formation per Capita) 11.76 0.019Δ ln(GDP per Capita) 9.66 0.047

A-5
Arellano and Bond developed a test for autocorrelation to help determine whether to consider specifying the model with a restricted set of instruments.12 Table A-4 shows the results of applying the Arellano-Bond test for (second order) autocorrelation to the regression results.
TABLE A-4: ARELLANO-BOND TESTS
Sources: See Table A-1 sources; NERA Calculations. Note: Test statistics and their respective p-values are based on regressions from Table A-2.
The null hypothesis under the test is that there is no autocorrelation. Thus, the failure to reject the null for all three dependent variables indicates that there is a low likelihood of potentially problematic autocorrelation.
12 Arellano and Bond 1991 at 281-283.
Dependent Variable Z-Stat P-ValueΔ ln(Labor Productivity) -0.17 0.865
Δ ln(New Business Formation per Capita) 0.98 0.328Δ ln(GDP per Capita) 0.70 0.487

Appendix B: Robustness Tests
The regression results reported in this section present supplemental analyses demonstrating the robustness of the primary findings.
Table B-1 presents the results for a version of the model that includes lags of Hispanic and non-Hispanic working age labor force as dependent variables.
TABLE B-1: MODEL WITH HISPANIC AND NON-HISPANIC WORKING AGE LABOR FORCE
REGRESSION COEFFICIENTS
Sources: See Table 1 sources; NERA calculations. Notes: [1] Working age labor force is the labor force aged 16 to 64. [2] Figures do not sum to totals due to rounding. [3] *** Significant at the one percent level; ** Significant at the five-percent level; *Significant at the ten-percent level.
Table B-2 presents results for a version of the model with five rather than four lags of Hispanic employment.
Year Labor Productivity New Business Formation per Capita
GDP per Capita
Hispanic Labor ForceT-1 0.106* 0.064 0.085**T-2 0.083 0.077* 0.078*T-3 0.110** 0.098** 0.073T-4 0.113** 0.053 0.074**
Total 0.412 0.291 0.310Non-Hispanic Labor Force
T-1 0.246 -0.023 0.126*T-2 0.093 -0.062 0.053T-3 0.027 -0.116 0.027T-4 0.092 -0.064 0.042
Total 0.458 -0.265 0.249

B-2
TABLE B-2: MODEL WITH HISPANIC EMPLOYMENT AND FIVE LAGS
REGRESSION COEFFICIENTS
Sources: See Table 1 sources; NERA calculations. Notes: [1] Figures do not sum to totals due to rounding. [2] *** Significant at the one percent level; ** Significant at the five-percent level; *Significant at the ten-percent level.
Year Labor Productivity New Business Formation per Capita
GDP per Capita
T-1 0.196** 0.202*** 0.128***T-2 0.150 0.258*** 0.135**T-3 0.241** 0.311*** 0.152**T-4 0.196** 0.309*** 0.156**T-5 0.074 0.144** 0.043
Total 0.783 1.079 0.570

Appendix C: Methodology for Estimating Hispanic Employment Effects
Projecting the effect of Hispanic employment on economic performance involves three steps. Each step is discussed in detail below.
Step One
As described in Section IV.A above, in order to project the effect of Hispanic employment growth on economic performance using the regression results from Section III.B, it is necessary to compare two growth scenarios. In this study, the baseline scenario assumes that Hispanic employment grows from 2018 to 2024 at the current trend – the CAGR over the last five years of available data, 2013 to 2017. The counterfactual scenario, or slow growth scenario, assumes that Hispanic employment grows from 2018 to 2024 at the CAGR of non-Hispanic employment from 2013 to 2017.
Step Two
Since the output of the econometric model is in percentage terms, estimating the level increase in each measure of economic performance requires a forecast of the level to which the percentage output can be applied. This study projects the levels of each measure of economic performance as it does the current trend of Hispanic employment growth by using the CAGR from the last five years of available data. For labor productivity and GDP per capita, the last five years of data are from 2013 to 2017. For new business formation per capita, the last five years of data are from 2012 to 2016.
Step Three
For each year from 2019 to 2025, the lagged Hispanic employment coefficients from the econometric model are multiplied by the difference between the percentage changes in annual Hispanic employment in the current trend scenario and in the slow growth scenario. For example, for 2025 the coefficient estimate on the fourth lag of the Hispanic employment variable is multiplied by the percentage difference between the growth rates of Hispanic employment in 2021 (i.e., the fourth year preceding 2025). The resulting percentage is multiplied by the projected level of the dependent variable in the previous year to estimate the change in the magnitude of the dependent variable for the current year. Using the previous example, this means multiplying by the projected level of the dependent variable in 2024 to estimate the change in magnitude of the dependent variable for 2025.


NERA Economic Consulting (www.nera.com) is a global firm of experts dedicated to applying
economic, finance, and quantitative principles to complex business and legal challenges. For half a
century, NERA’s economists have been creating strategies, studies, reports, expert testimony, and
policy recommendations for government authorities and the world’s leading law firms and
corporations. NERA serves clients from more than 25 offices across North America, Europe, and
Asia Pacific.
The Latino Donor Collaborative (www.latinodonorcollaborative.org), founded in 2010, is a
501(c)(3) non-profit organization dedicated to reshaping the perception of U.S. Latinos as part of
the American social mainstream. The LDC is self-funded and independent, and created by an
accomplished group of U.S. Latino national leaders that generously donate their time to promote
friendly high-level dialogue, with the goal of finding best ways to grow revenue and market share
– by targeting and serving the Latino audiences. We do this through a nonpartisan agenda that
includes outreach to influential people and resource allocators in media, advertising, politics,
corporate America, and civil society by confronting stereotypes and myths with data that brings
understanding and appreciation of the actual roles being played by U.S. Latinos in society, politics,
and commerce. The LDC board is passionate about empowering every Latino and non-Latino to be
the best they can be, and know that by doing this they create a rich, united, and more powerful
United States of America.
Wells Fargo and the Wells Fargo Foundation (www.wellsfargo.com) provide monetary
support, expertise, and volunteers to national and local nonprofit organizations and causes that
align with our business priorities, values, business expertise, and geographies. We focus our
philanthropic activities on creating long-term, strategic relationships with nonprofits and other
organizations to create innovative, sustainable solutions to meet local needs. Our team members
help us make an even bigger impact through their passion, time, and expertise.

Visit www.nera.com to learn
more about our practice areas
and global offices.
© Copyright 2019
National Economic
Research Associates, Inc.
All rights reserved.
Printed in the USA.