the lean enterprise standardized operations/ standard work lean foundations continuous improvement...
TRANSCRIPT
The Lean EnterpriseThe Lean EnterpriseThe Lean EnterpriseThe Lean Enterprise Standardized Operations/ Standard Work
Lean Foundations
Continuous Improvement Training
Lean Foundations
Continuous Improvement Training
freeleansite.com
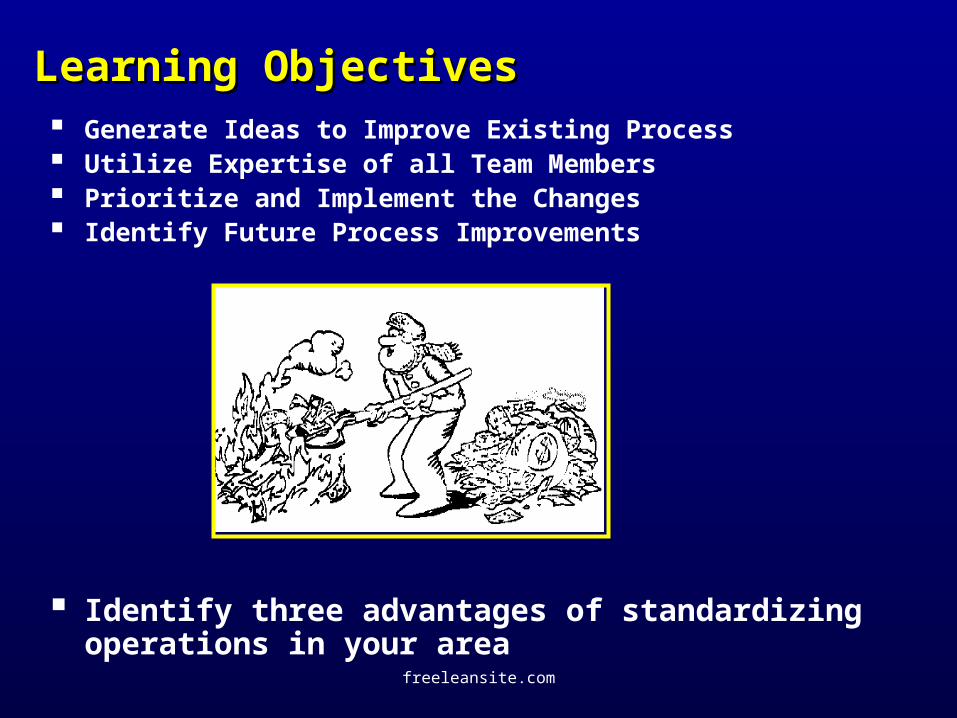
Learning ObjectivesLearning Objectives Generate Ideas to Improve Existing Process Utilize Expertise of all Team Members Prioritize and Implement the Changes Identify Future Process Improvements
Identify three advantages of standardizing operations in your area
freeleansite.com
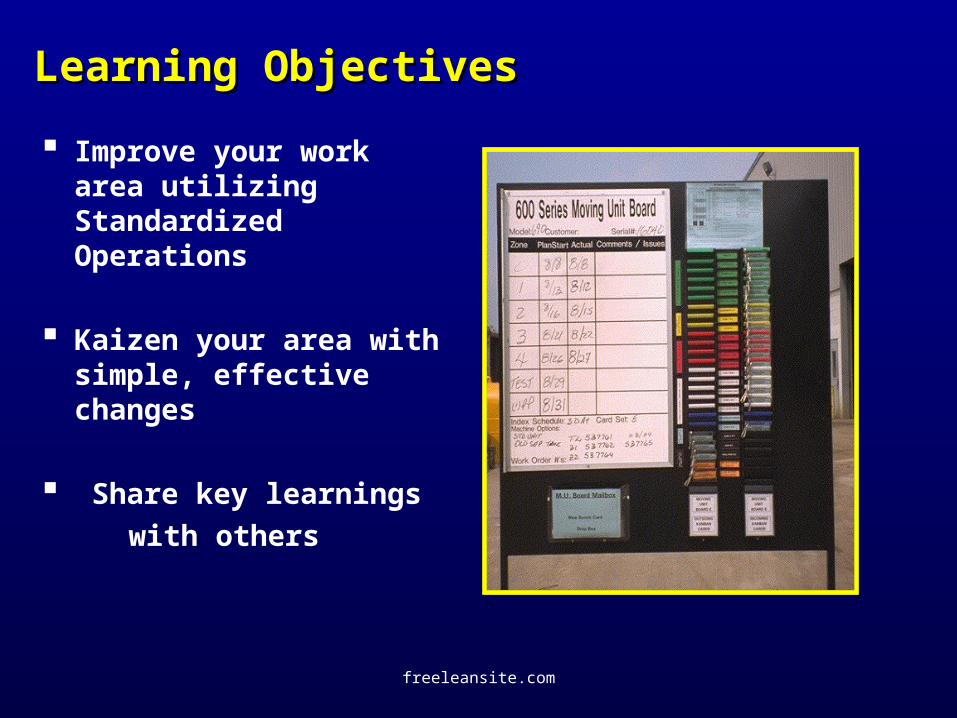
Learning ObjectivesLearning Objectives
Improve your work area utilizing Standardized Operations
Kaizen your area with simple, effective changes
Share key learnings
with others
freeleansite.com
By-Products of unorganized WorkplaceBy-Products of unorganized Workplace
Safety risks due to physical obstacles and hidden hazards
Product defects and equipment breakdowns resulting from a dirty environment
Lost productive time searching for material & tools
Poor customer responsiveness and incorrect shipments
Difficulty in distinguishing between what is good/ bad or needed/ unneeded
freeleansite.com
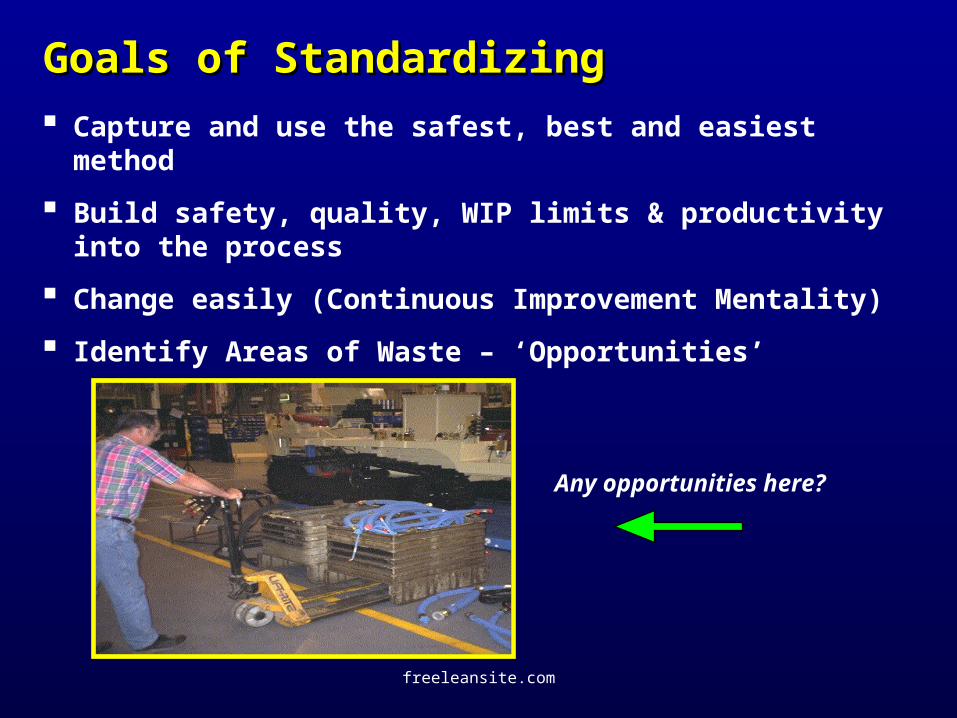
Goals of StandardizingGoals of Standardizing
Capture and use the safest, best and easiest method
Build safety, quality, WIP limits & productivity into the process
Change easily (Continuous Improvement Mentality)
Identify Areas of Waste – ‘Opportunities’
Any opportunities here?
freeleansite.com
Waste Waste
The elements of work that add no value.
Waste only adds cost and time.
Things to remember about Waste
• Waste is not the problem; it is a symptom
• Waste points to problems within the system
(At both process and value stream levels)
• We need to find and address the cause of Waste
freeleansite.com
Simply, ‘Standardization’ is the...Simply, ‘Standardization’ is the...
Fastest
Best
Safest
method to do your job !
freeleansite.com
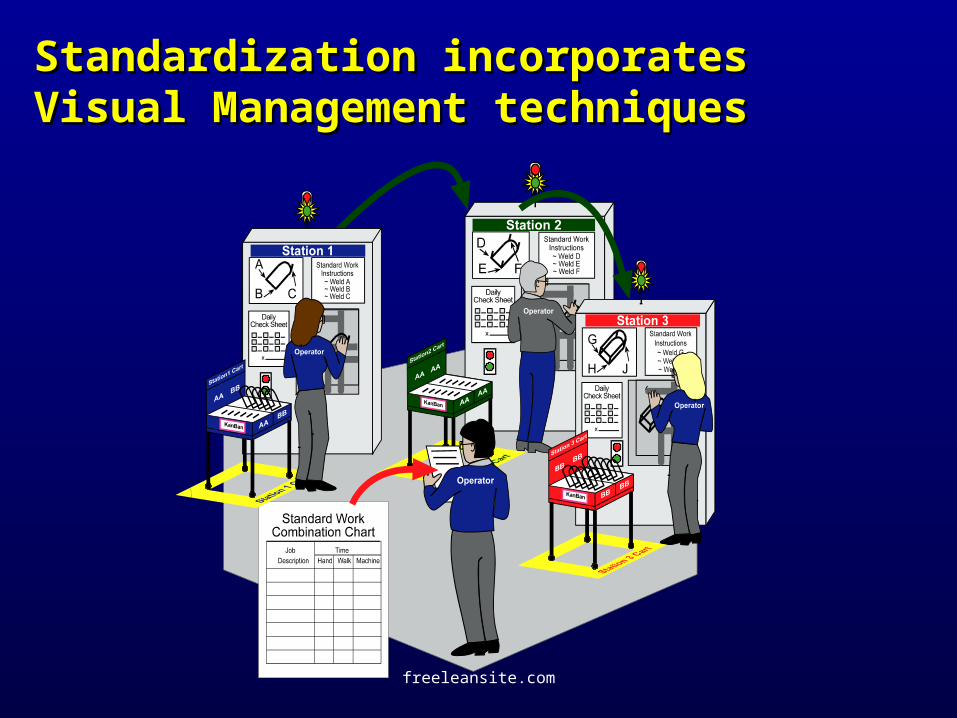
Standardization incorporates Visual Standardization incorporates Visual Management techniquesManagement techniques
freeleansite.com
Benefits of StandardizationBenefits of Standardization
Teamwork Everyone is able to participate and make
improvements
Communication Improved relations between workers and between
workers and management
Education Improved problem solving
freeleansite.com
Benefits of StandardizationBenefits of Standardization
Awareness Understanding of broad issues and objectives
Confidence Stronger feelings of self worth
Empowerment Increased control over the job and work
environment
freeleansite.com
Provides Benefits to All EmployeesProvides Benefits to All Employees
Success of the company – safer operations and better personal job security
Improved quality of life in the workplace
Improvement in solving problems, making decisions and improving product quality due to shorter time frames
Control/ ownership over the improvements in your process/ job function
freeleansite.com
3 Elements of Standardized Operations/ 3 Elements of Standardized Operations/ Standard WorkStandard Work
• Machine Utilization
• Work SequenceWork Sequence
• Standard Work-In-Process StockStandard Work-In-Process Stock
freeleansite.com
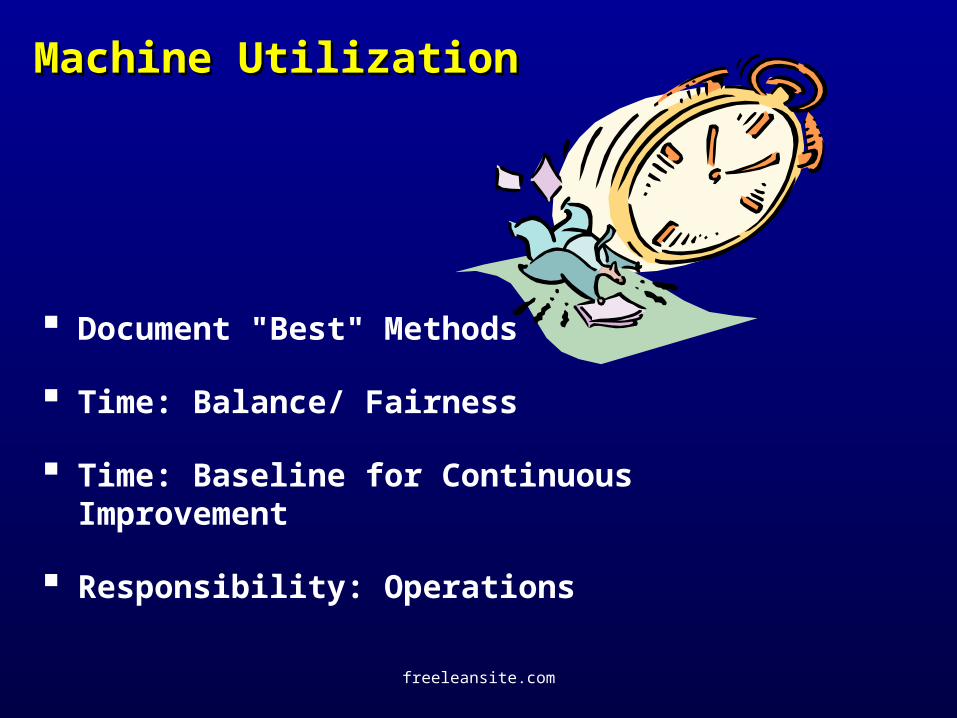
Machine UtilizationMachine Utilization
Document "Best" Methods
Time: Balance/ Fairness
Time: Baseline for Continuous Improvement
Responsibility: Operations
freeleansite.com
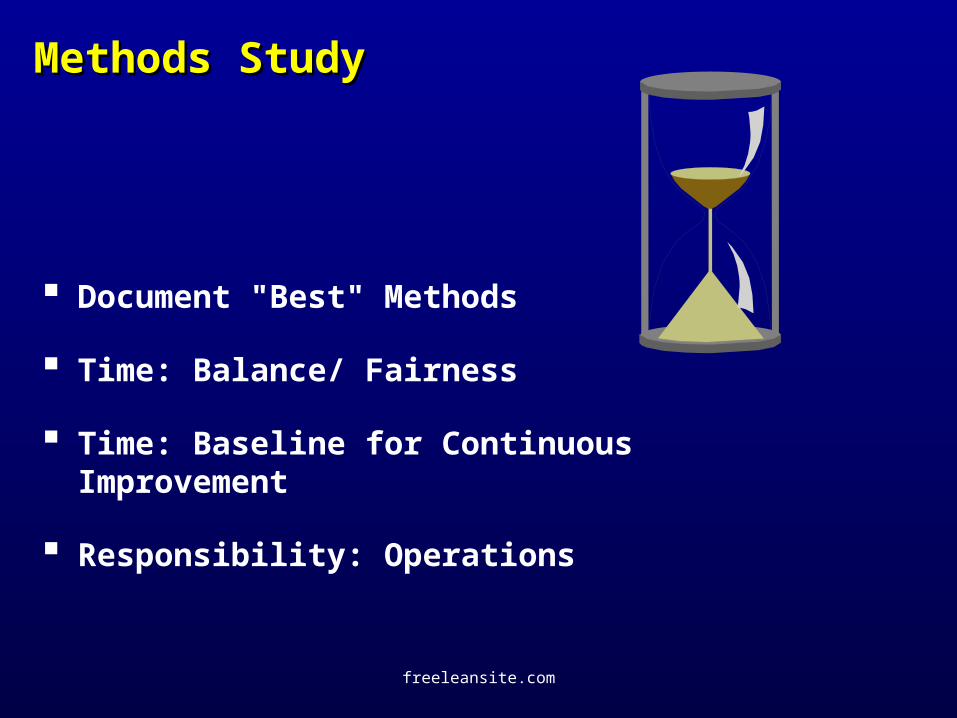
Methods StudyMethods Study
Document "Best" Methods
Time: Balance/ Fairness
Time: Baseline for Continuous Improvement
Responsibility: Operations
freeleansite.com
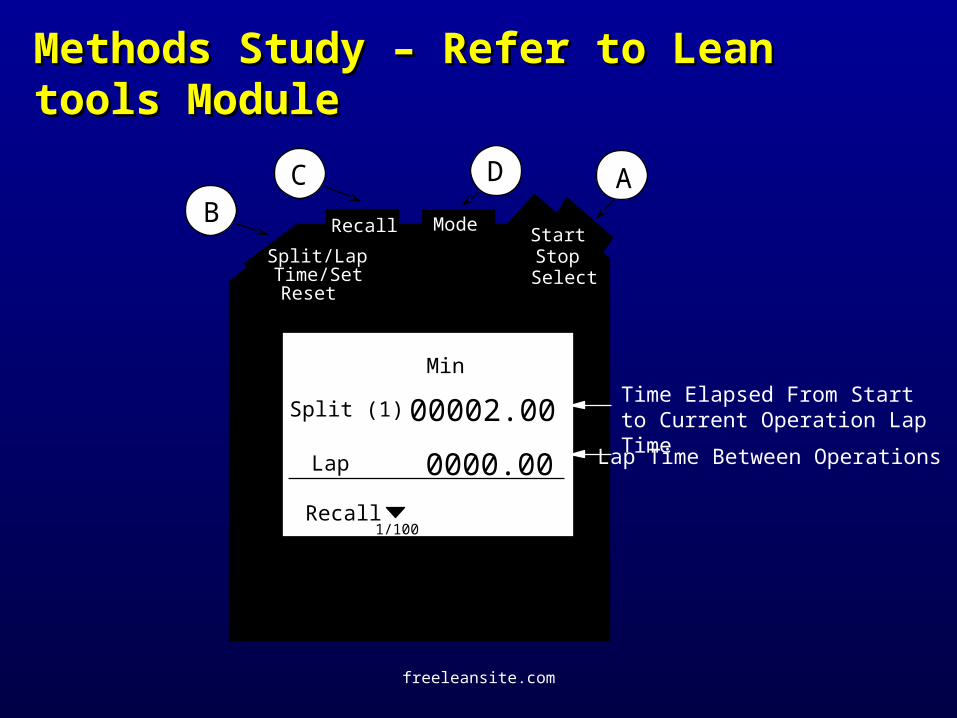
B
Min
Split (1) 00002.00
0000.00Lap
Recall
Time Elapsed From Start to Current Operation Lap Time
Lap Time Between Operations
Split/Lap Time/Set Reset
Recall ModeStartStopSelect
ADC
1/100
Methods Study – Refer to Lean tools Methods Study – Refer to Lean tools ModuleModule
freeleansite.com
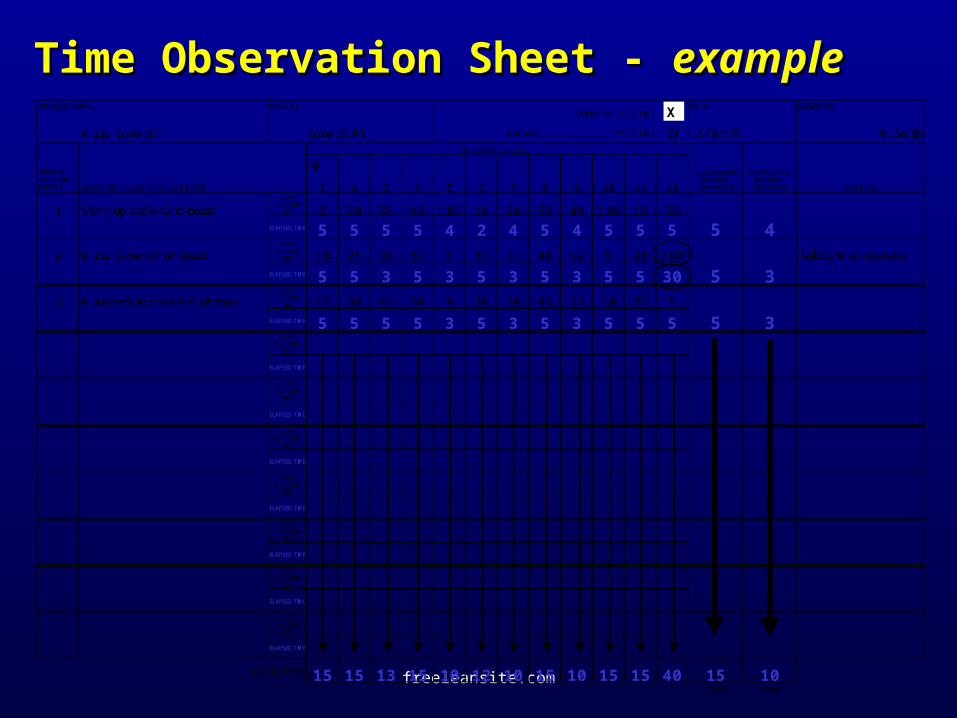
Time Observation Sheet - Time Observation Sheet - exampleexamplePROCESS NAME PART No.
OPERATOR CYCLE TIME o DATE OBSERVER
Write "Growtth" Growtth #1 MACHINE: __________________CYCLE TIME o 3/ 8/ 99 M. Smith OBSERVED CYCLES
ORDER OF OPERATION / ELEMENT OPERATION / ELEMENT DESCRIPTION 1 2 3 4 5 6 7 8 9 10 11 12
Most Repeatable Operation/
Element Time
Best Repeatable Operation/
Element Time REMARKS
1 Stand up and walk to boardCLOCK
RUNNING TIME 5 20 35 48 1:02 10 24 35 49 2:00 15 30
ELAPSED TIME 5 5 5 5 4 2 4 5 4 5 5 5 5 42 Write "Growtth" on board
CLOCK RUNNING
TIME 10 25 38 53 5 15 27 40 52 5 20 3:00 Talking to an operator
ELAPSED TIME 5 5 3 5 3 5 3 5 3 5 5 30 5 33 Walk back to chair and sit down
CLOCK RUNNING
TIME 15 30 43 58 8 20 30 45 55 10 25 5
ELAPSED TIME 5 5 5 5 3 5 3 5 3 5 5 5 5 3CLOCK
RUNNING TIME
ELAPSED TIME
CLOCK RUNNING
TIME
ELAPSED TIME
CLOCK RUNNING
TIME
ELAPSED TIME
CLOCK RUNNING
TIME
ELAPSED TIME
CLOCK RUNNING
TIME
ELAPSED TIME
CLOCK RUNNING
TIME
ELAPSED TIME
CLOCK RUNNING
TIME
ELAPSED TIME
CYCLE TIME 15 15 13 15 10 12 10 15 10 15 15 40 15 10Total Total
0
X
freeleansite.com
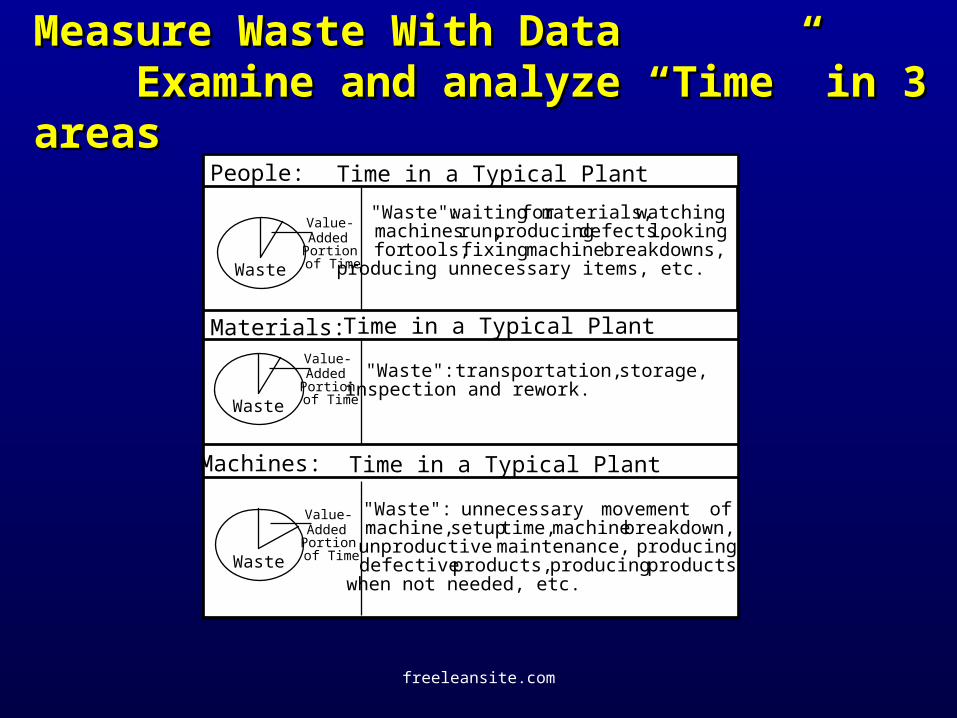
Measure Waste With DataMeasure Waste With Data Examine and analyze “Time” in 3 areas Examine and analyze “Time” in 3 areas
People: Time in a Typical Plant
Materials: Time in a Typical Plant
Time in a Typical PlantMachines:
"Waste": waiting for materials, watching machines run, producing defects, looking for tools, fixing machine breakdowns, producing unnecessary items, etc.
"Waste": transportation, storage, inspection and rework.
"Waste": unnecessary movement of machine, setup time, machine breakdown, unproductive maintenance, producing defective products, producing products when not needed, etc.
Waste
Value-Added Portion of Time
Waste
Value-Added Portion of Time
Waste
Value-Added Portion of Time
freeleansite.com
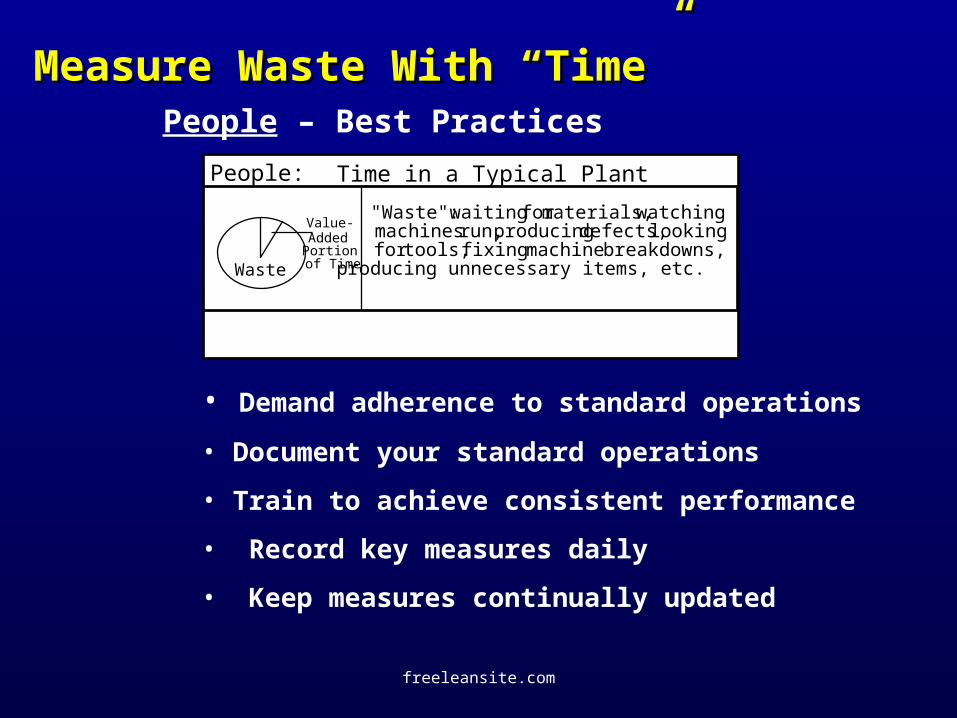
People: Time in a Typical Plant
"Waste": waiting for materials, watching machines run, producing defects, looking for tools, fixing machine breakdowns, producing unnecessary items, etc.Waste
Value-Added Portion of Time
Measure Waste With “Time”Measure Waste With “Time”People – Best Practices
• Demand adherence to standard operations
• Document your standard operations
• Train to achieve consistent performance
• Record key measures daily
• Keep measures continually updated
freeleansite.com
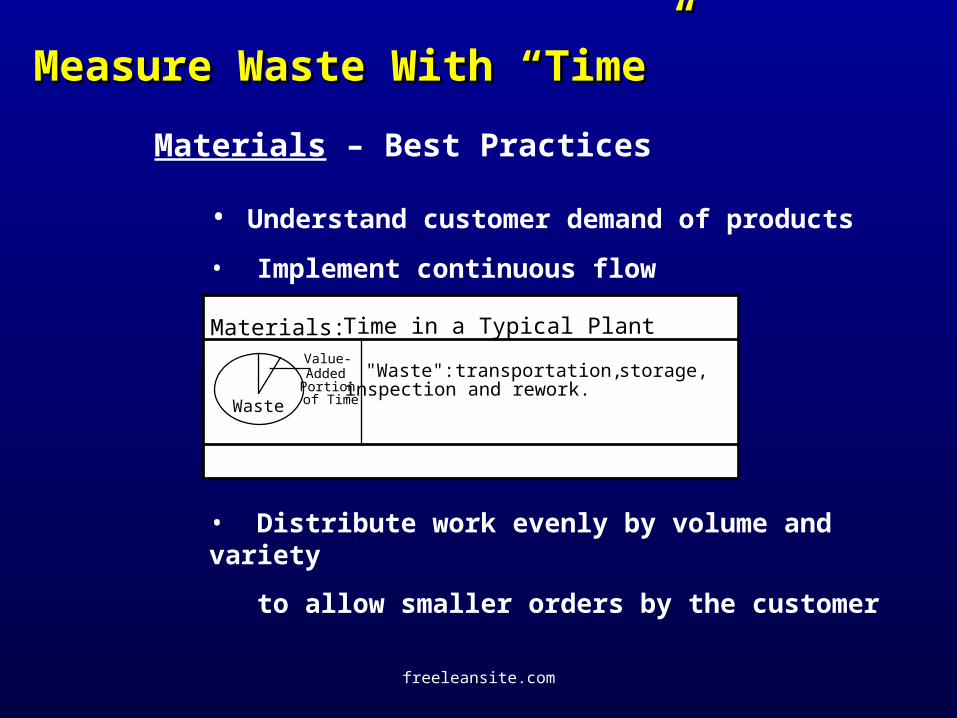
Materials: Time in a Typical Plant
"Waste": transportation, storage, inspection and rework.
Waste
Value-Added Portion of Time
Measure Waste With “Time”Measure Waste With “Time”
Materials – Best Practices
• Distribute work evenly by volume and variety
to allow smaller orders by the customer
• Understand customer demand of products
• Implement continuous flow
freeleansite.com
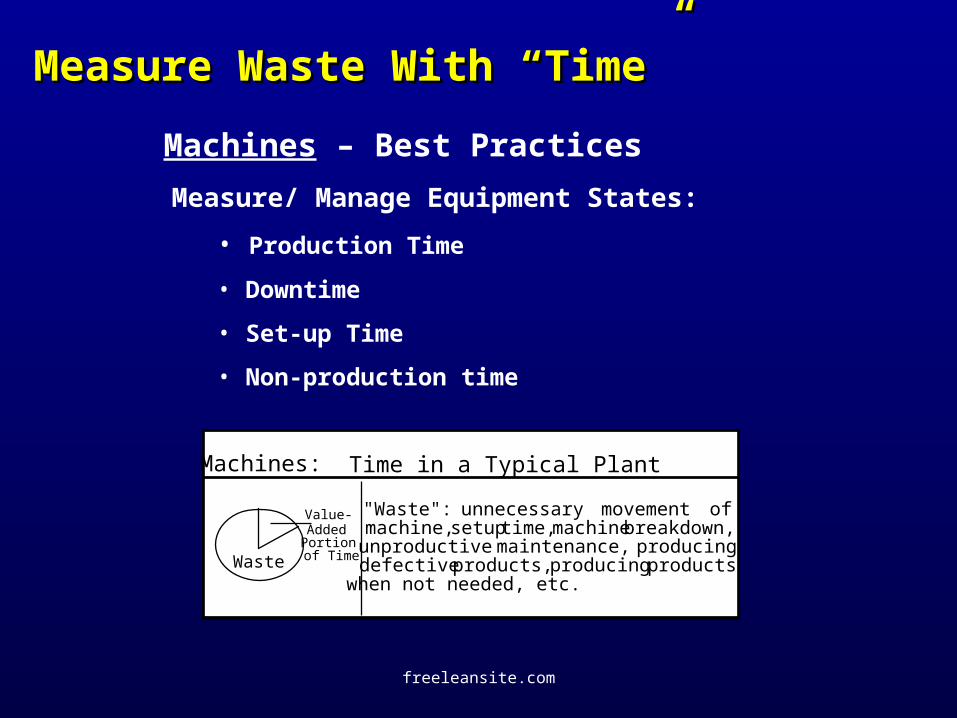
Time in a Typical PlantMachines:
"Waste": unnecessary movement of machine, setup time, machine breakdown, unproductive maintenance, producing defective products, producing products when not needed, etc.
Waste
Value-Added Portion of Time
Measure Waste With “Time”Measure Waste With “Time”
Machines – Best Practices
Measure/ Manage Equipment States:
• Production Time
• Downtime
• Set-up Time
• Non-production time
freeleansite.com
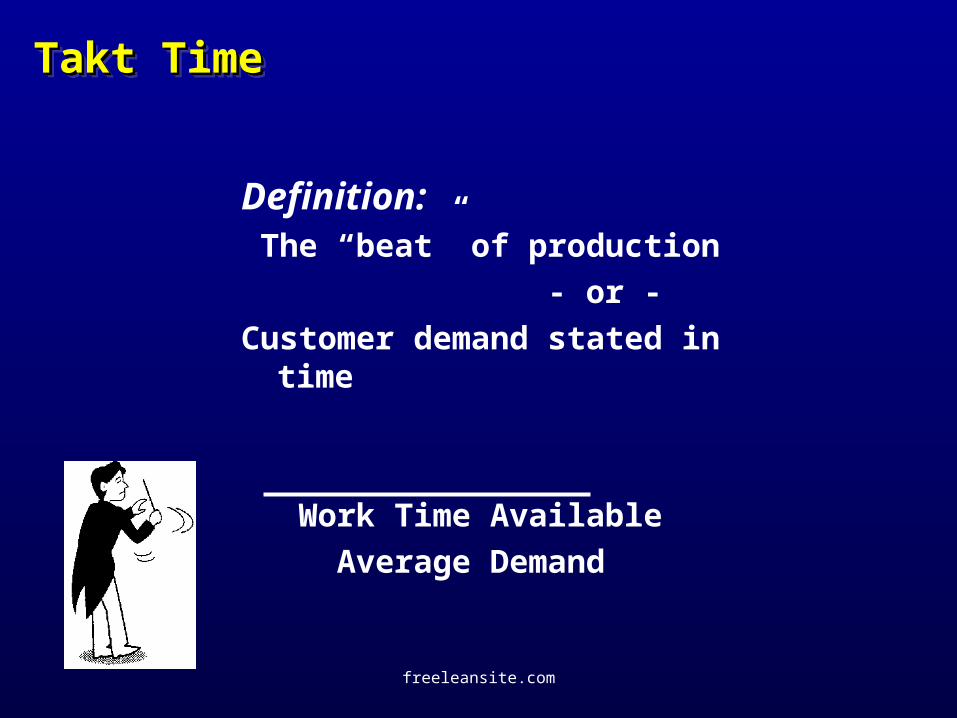
Takt TimeTakt TimeTakt TimeTakt Time
Definition: The “beat” of production
- or -
Customer demand stated in time
Work Time Available
Average Demand
freeleansite.com
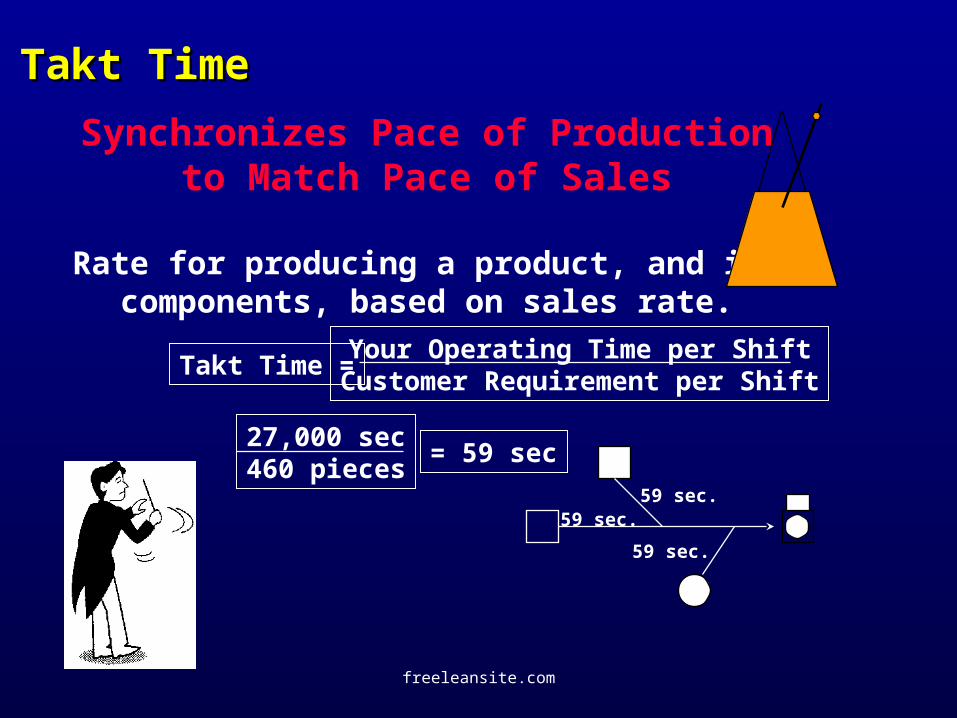
Synchronizes Pace of Productionto Match Pace of Sales
Rate for producing a product, and itscomponents, based on sales rate.
Takt TimeTakt Time
Your Operating Time per ShiftCustomer Requirement per Shift
Takt Time =
27,000 sec460 pieces
= 59 sec
59 sec.59 sec.
59 sec.
freeleansite.com
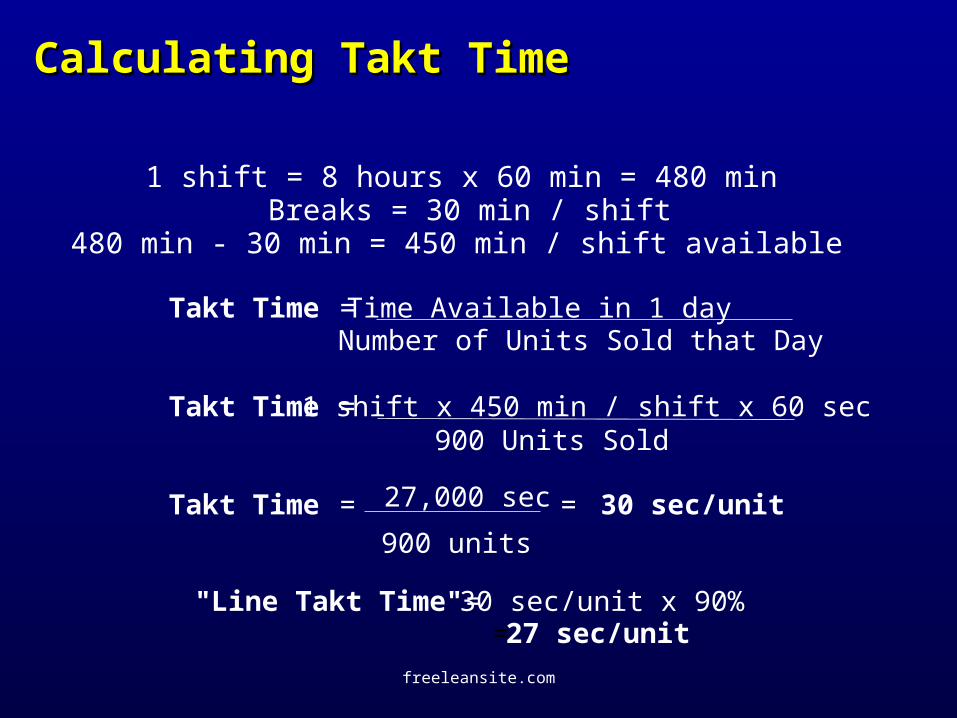
Calculating Takt TimeCalculating Takt Time
1 shift = 8 hours x 60 min = 480 minBreaks = 30 min / shift
480 min - 30 min = 450 min / shift available
Takt Time = Time Available in 1 day Number of Units Sold that Day
Takt Time = 1 shift x 450 min / shift x 60 sec 900 Units Sold
Takt Time = 27,000 sec = 30 sec/unit 900 units
"Line Takt Time" = 30 sec/unit x 90% = 27 sec/unit
freeleansite.com
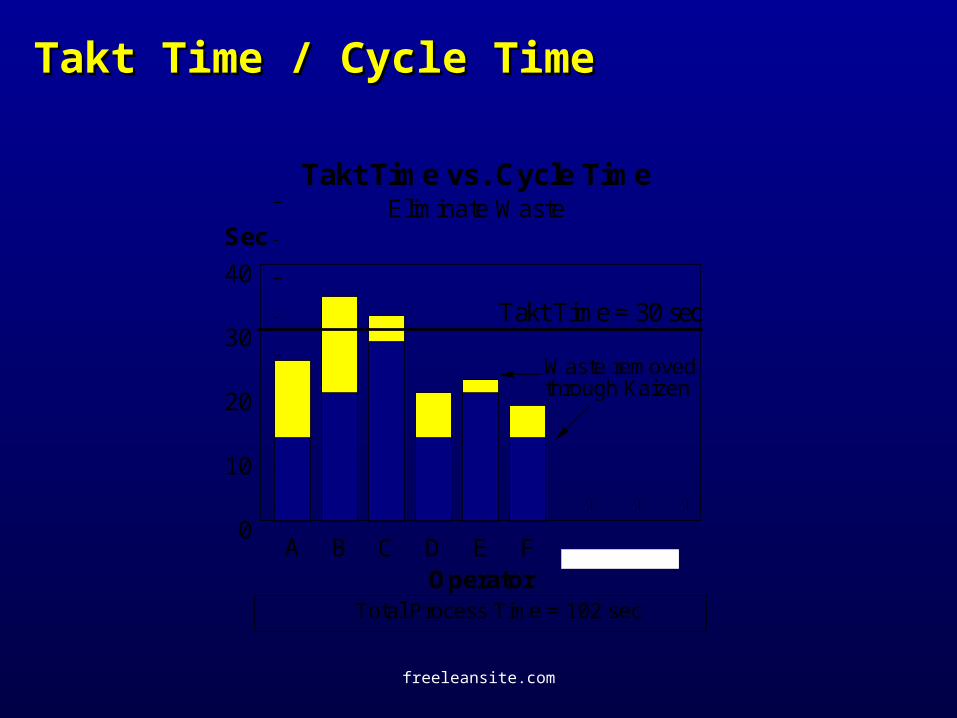
Takt Time / Cycle TimeTakt Time / Cycle Time
Takt Time vs. Cycle TimeEliminate Waste
A B C D E F0
10
20
30
40
Operator
Sec
Takt Time = 30 sec
Total Process Time = 102 sec
Waste removed through Kaizen
freeleansite.com
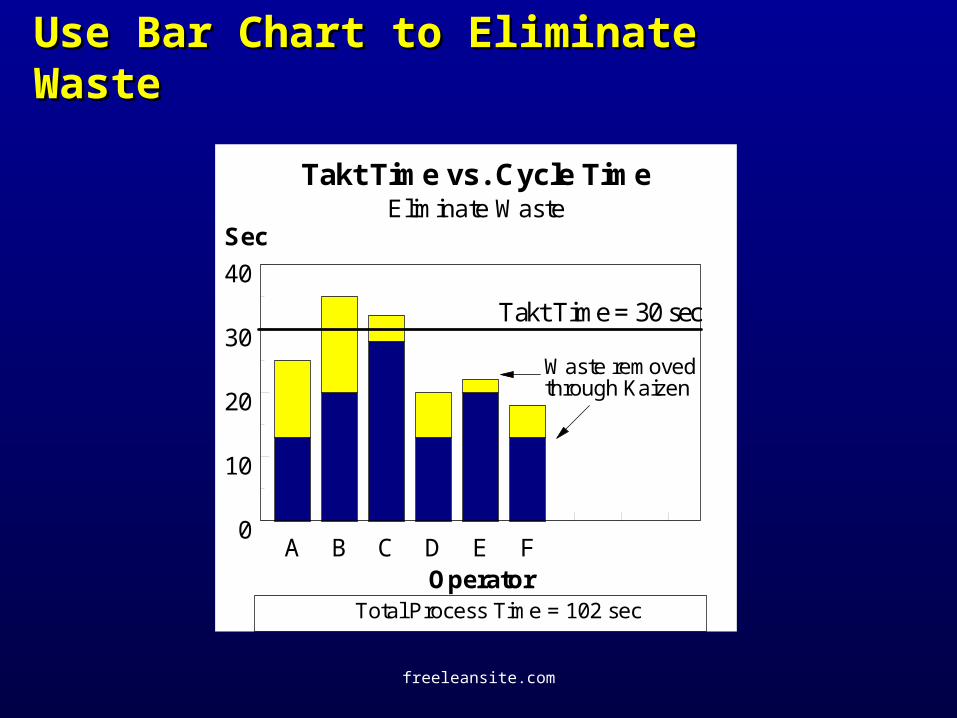
Use Bar Chart to Eliminate WasteUse Bar Chart to Eliminate Waste
Takt Time vs. Cycle TimeEliminate Waste
A B C D E F0
10
20
30
40
Operator
Sec
Takt Time = 30 sec
Total Process Time = 102 sec
Waste removed through Kaizen
freeleansite.com
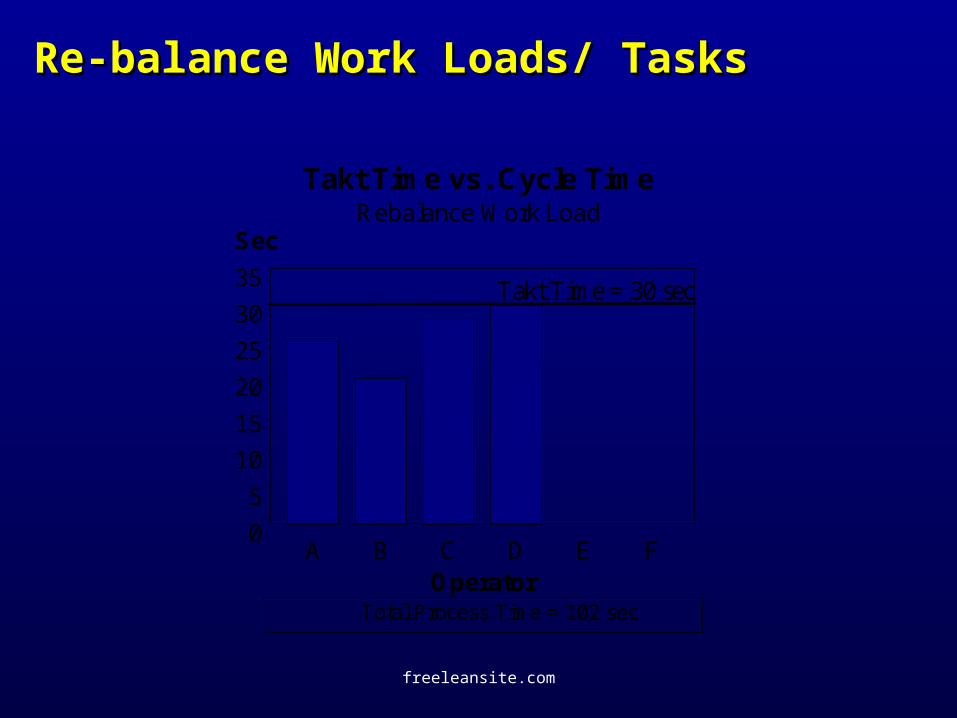
Re-balance Work Loads/ TasksRe-balance Work Loads/ Tasks
Takt Time vs. Cycle TimeRebalance Work Load
A B C D E F0
5
10
15
20
25
30
35
Operator
Sec
Takt Time = 30 sec
Total Process Time = 102 sec
freeleansite.com
3 Elements of Standardized Operations3 Elements of Standardized Operations
• Machine UtilizationMachine Utilization
• Work Sequence
• Standard Work-In-Process StockStandard Work-In-Process Stock
freeleansite.com
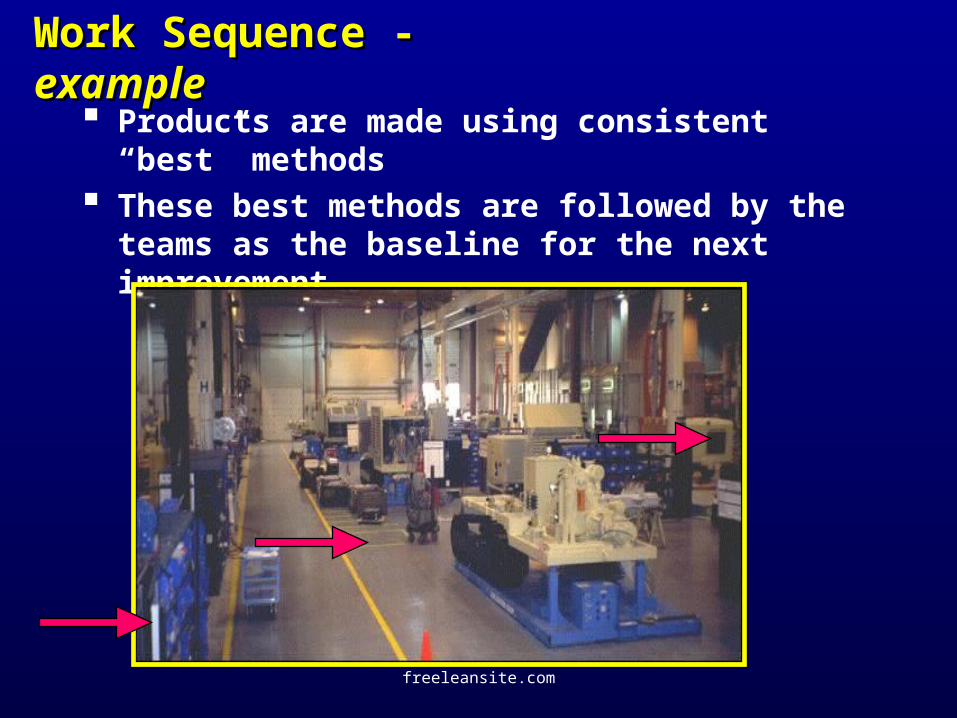
Work Sequence - Work Sequence - exampleexample Products are made using consistent “best”
methods These best methods are followed by the teams as
the baseline for the next improvement
freeleansite.com
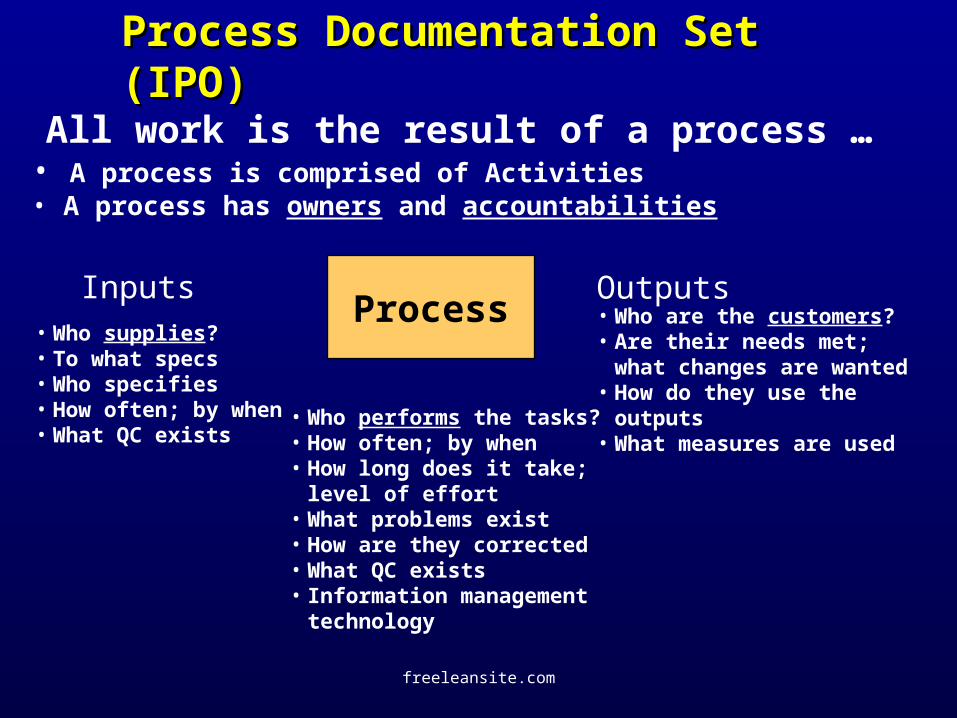
ProcessInputs Outputs
All work is the result of a process …• A process is comprised of Activities• A process has owners and accountabilities
• Who supplies?• To what specs• Who specifies• How often; by when• What QC exists
• Who are the customers?• Are their needs met; what
changes are wanted• How do they use the outputs• What measures are used
• Who performs the tasks?• How often; by when• How long does it take; level of
effort• What problems exist• How are they corrected• What QC exists• Information management
technology
Process Documentation Set (IPO)Process Documentation Set (IPO)
freeleansite.com
Standardized Operations Improvement Standardized Operations Improvement QuestionsQuestions
There are 3 levels of Process Detail
• What follows is a extensive list of Questions to ask at each level and with each action during the Process Analysis team activities
freeleansite.com
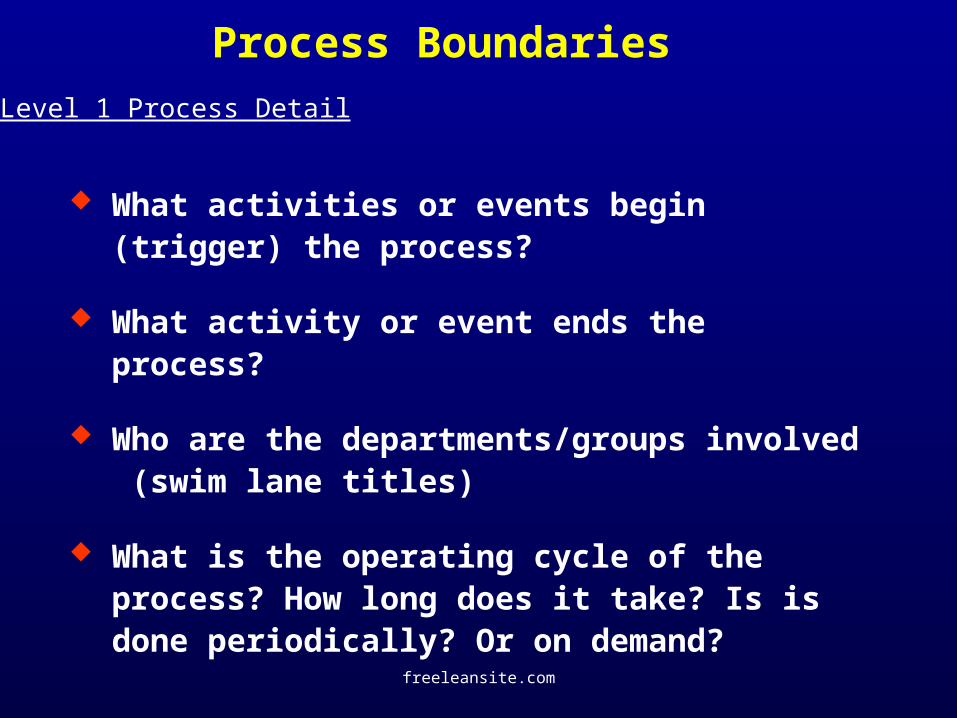
Process Boundaries
What activities or events begin (trigger) the process?
What activity or event ends the process?
Who are the departments/groups involved (swim lane titles)
What is the operating cycle of the process? How long does it take? Is is done periodically? Or on demand?
Level 1 Process Detail
freeleansite.com
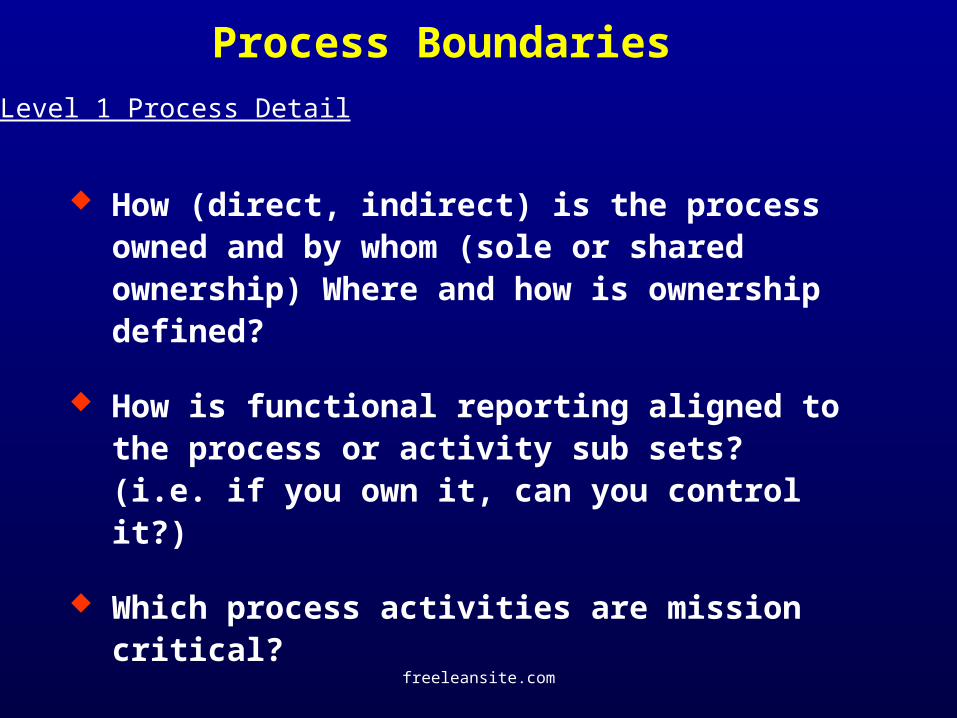
Process Boundaries
How (direct, indirect) is the process owned and by whom (sole or shared ownership) Where and how is ownership defined?
How is functional reporting aligned to the process or activity sub sets? (i.e. if you own it, can you control it?)
Which process activities are mission critical?
Level 1 Process Detail
freeleansite.com
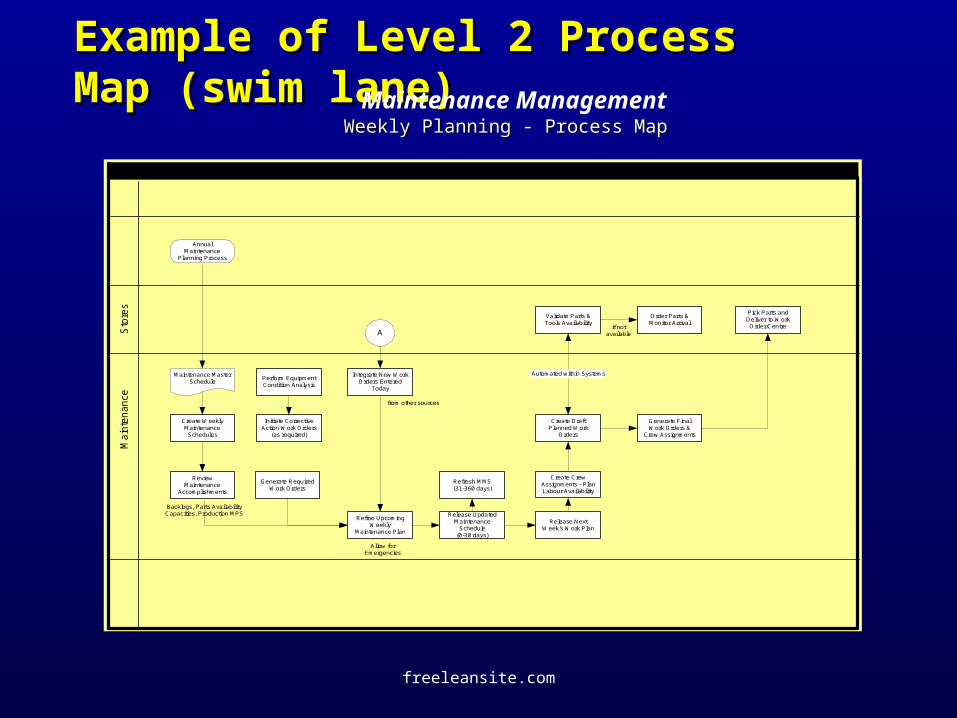
Example of Level 2 Process Map Example of Level 2 Process Map (swim lane)(swim lane)
Weekly Planning - Process MapWeekly Planning - Process MapMaintenance Management
Sto
res
Ma
inte
nan
ce
Backlogs, Parts AvailabilityCapacities, Production MPS
Create WeeklyMaintenanceSchedules
Maintenance MasterSchedule
Initiate CorrectiveAction Work Orders
(as required)
ReviewMaintenance
Accomplishments
Refine UpcomingWeekly
Maintenance Plan
Create DraftPlanned Work
Orders
Validate Parts &Tools Availability
Create CrewAssignments - PlanLabour Availability
Generate FinalWork Orders &
Crew Assignments
Perform EquipmentCondition Analysis
Allow forEmergencies
Order Parts &Monitor Arrival
Pick Parts andDeliver to WorkOrder/Centre
Integrate New WorkOrders Entered
Today
Generate RequiredWork Orders
Release UpdatedMaintenance
Schedule(0-30 days)
Refresh MMS(31-360 days)
Release NextWeek's Work Plan
Automated within Systems
if notavailable
from other sources
A
AnnualMaintenance
Planning Process
freeleansite.com
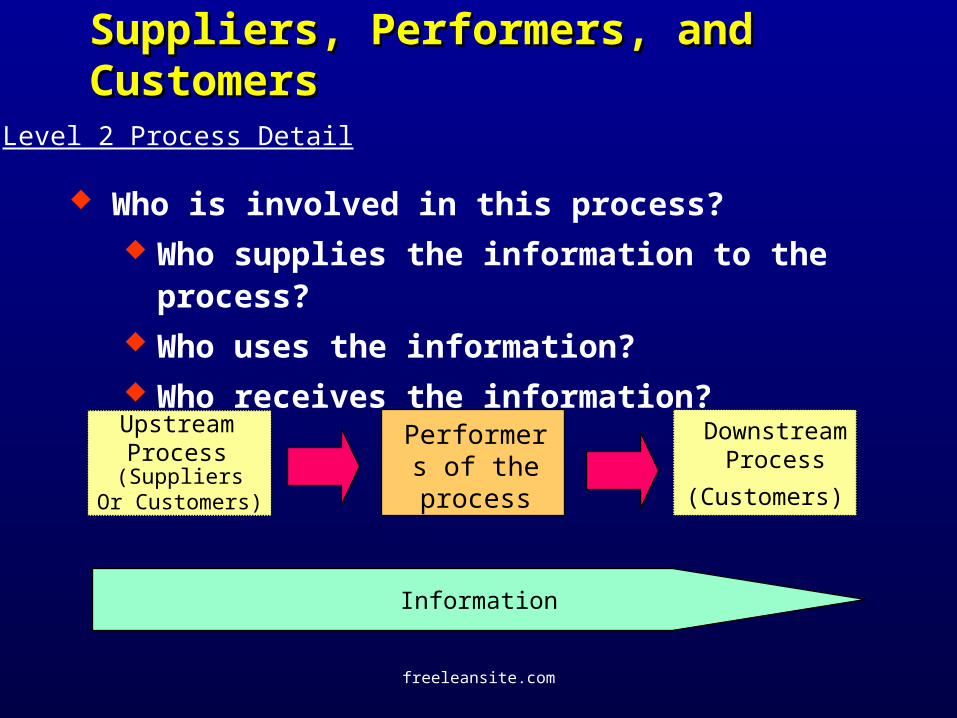
Suppliers, Performers, and CustomersSuppliers, Performers, and Customers
Who is involved in this process? Who supplies the information to the process? Who uses the information? Who receives the information?
Level 2 Process Detail
Performers of the
process (Customers)
Information
(SuppliersOr Customers)
Upstream Process
Downstream Process
freeleansite.com
Process Measures and Calculation Definition
What are the process measures? How are they used? What are the specific measures for the individual
process activities? What considerations does the process owner use
to judge the process?
Level 2 Process Detail
freeleansite.com
Process Measures and Calculation Definition
What process metrics and stats do you get from other plants? What else would you like to get?
Do you feel the present process measures reflect, accurately, the operation of the plant and its production variances?
What process measures are monitored daily; weekly; monthly; annually?
Level 2 Process Detail
freeleansite.com
Information Management Technical Information Management Technical DimensionsDimensions
What software (commercial, home grown) tools are used for each activity?
control, monitoring, reporting, remediation What hardware platforms are those software
pieces resident on (LAN, WAN, PC)? If information is transmitted off-site, which
network is it done on?
Level 2 Process
freeleansite.com
Information Management Technical Information Management Technical DimensionsDimensions
What volume and frequency of use is required of the network?
Who supports the software in the plant? Who supports the hardware in the plant? What problems have been encountered in the
recent past with software or hardware? How was the problem rectified and how well?
Level 2 Process
freeleansite.com
Problems, Issues,and Changes Required Problems, Issues,and Changes Required to current processto current process
What problems exist with the process and where? Where do most of the difficulties arise? What are the impacts/consequences of these
problems? When problems arise, how are they currently
resolved? Who is responsible for resolving these problems?
Level 2 Process
freeleansite.com
Problems, Issues,and Changes Required Problems, Issues,and Changes Required to current processto current process
Are the problems information related or operationally related?
Can these problems be resolved by redefining the process?
What improvements do you require for this process? (enhancements)
What is the perceived benefits of the changes?
Level 2 Process
freeleansite.com
Deployment (roles & responsibilities)Deployment (roles & responsibilities)
For each activity, what is the role of the individuals involved
How is each person involved in the process (RACI)
How much time is spent on each activity by each person
Is the role and responsibility level suited to that person’s skill level
Level 2 Process
freeleansite.com
Level 3: Process Activity SequenceLevel 3: Process Activity Sequence
What are the activities (sequence) in each box of the preceding level 1 diagram?
What is the elapsed time for the whole process: where are there critical due dates?
Which are key activities; which are support activities? (internal view)
Which processes are sequential and which are parallel?
Level 3 Process Detail
freeleansite.com
Level 3: Process Activity SequenceLevel 3: Process Activity Sequence
Are there any checkpoints in the process - where? How is failure mode evident in the process or at
critical activities? What are the rework or failure correction
activities? Which activities are valued added vs non value
added? (external view)
Level 3 Process Detail
freeleansite.com
Level 3: Activity Inputs, Processing and Level 3: Activity Inputs, Processing and OutputsOutputs
For each of the activities,
What are the inputs, procedures, and outputs: who is involved?
Documentation examples relevant to the process areas
What internal quality control mechanisms are employed in these processes? (e.g. error feedback)
Level 3 Process Detail
freeleansite.com
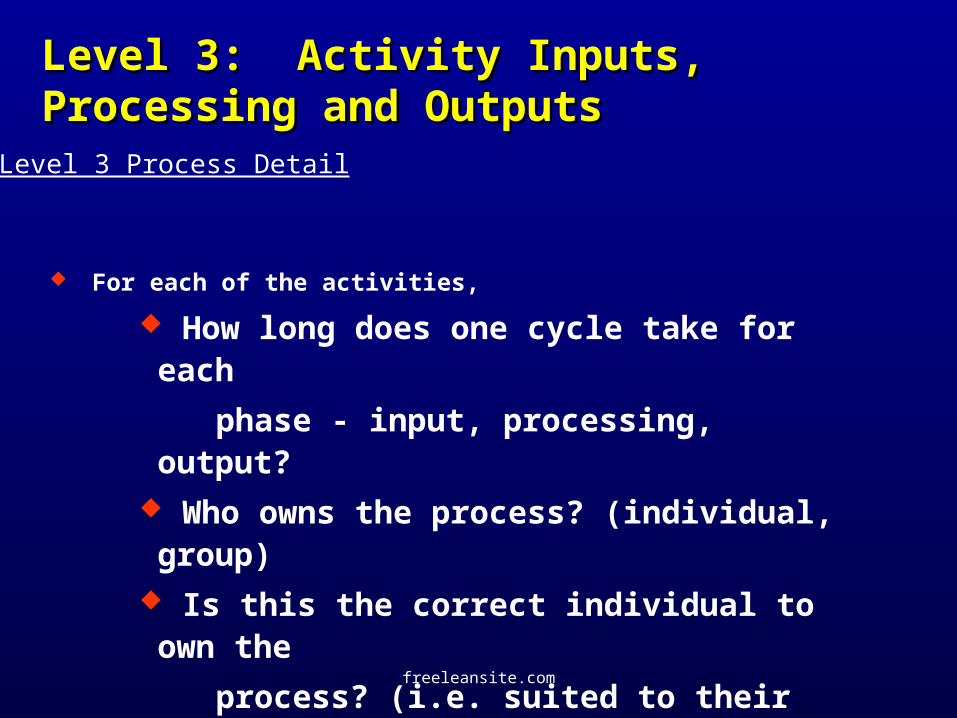
Level 3: Activity Inputs, Processing and Level 3: Activity Inputs, Processing and OutputsOutputs
For each of the activities,
How long does one cycle take for each
phase - input, processing, output? Who owns the process? (individual, group) Is this the correct individual to own the
process? (i.e. suited to their skill level)
Level 3 Process Detail
freeleansite.com
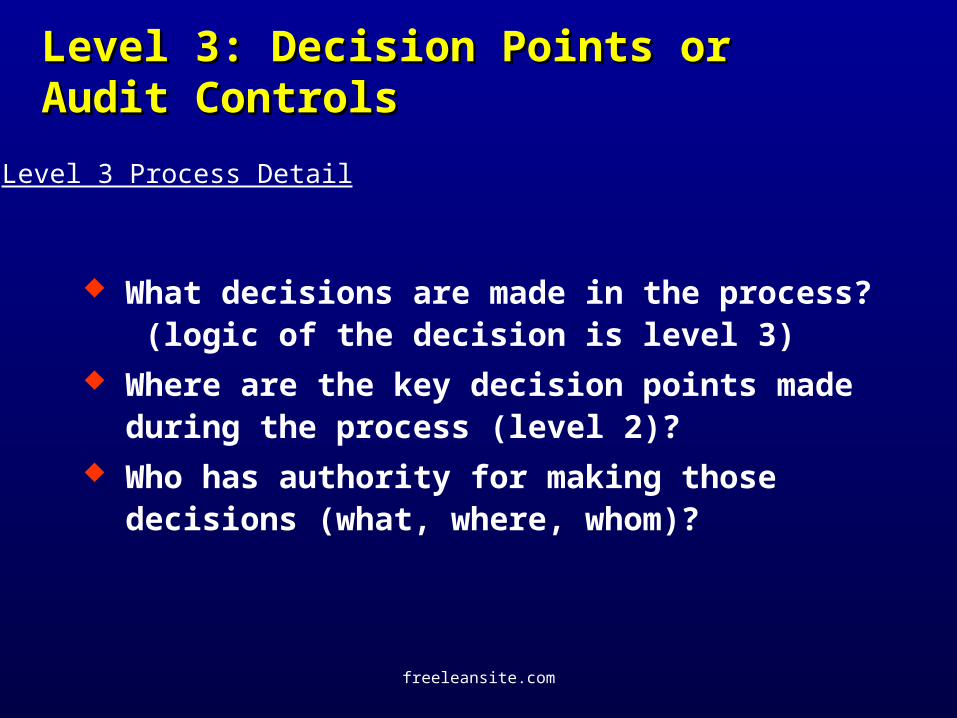
Level 3: Decision Points or Audit Level 3: Decision Points or Audit ControlsControls
What decisions are made in the process? (logic of the decision is level 3)
Where are the key decision points made during the process (level 2)?
Who has authority for making those decisions (what, where, whom)?
Level 3 Process Detail
freeleansite.com
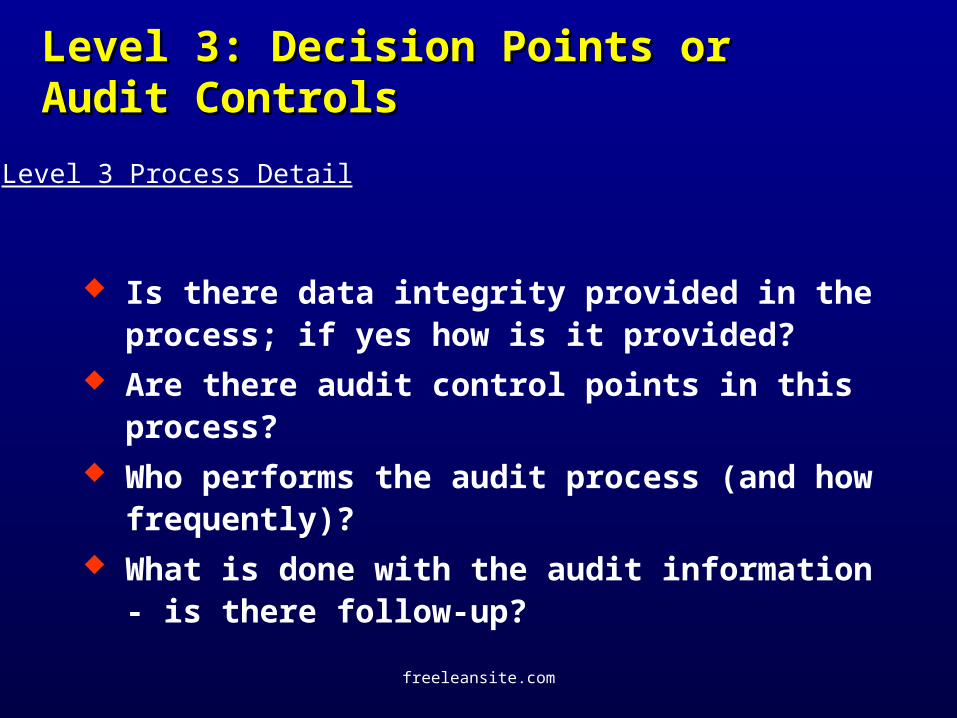
Level 3: Decision Points or Audit Level 3: Decision Points or Audit ControlsControls
Is there data integrity provided in the process; if yes how is it provided?
Are there audit control points in this process? Who performs the audit process (and how
frequently)? What is done with the audit information - is there
follow-up?
Level 3 Process Detail
freeleansite.com
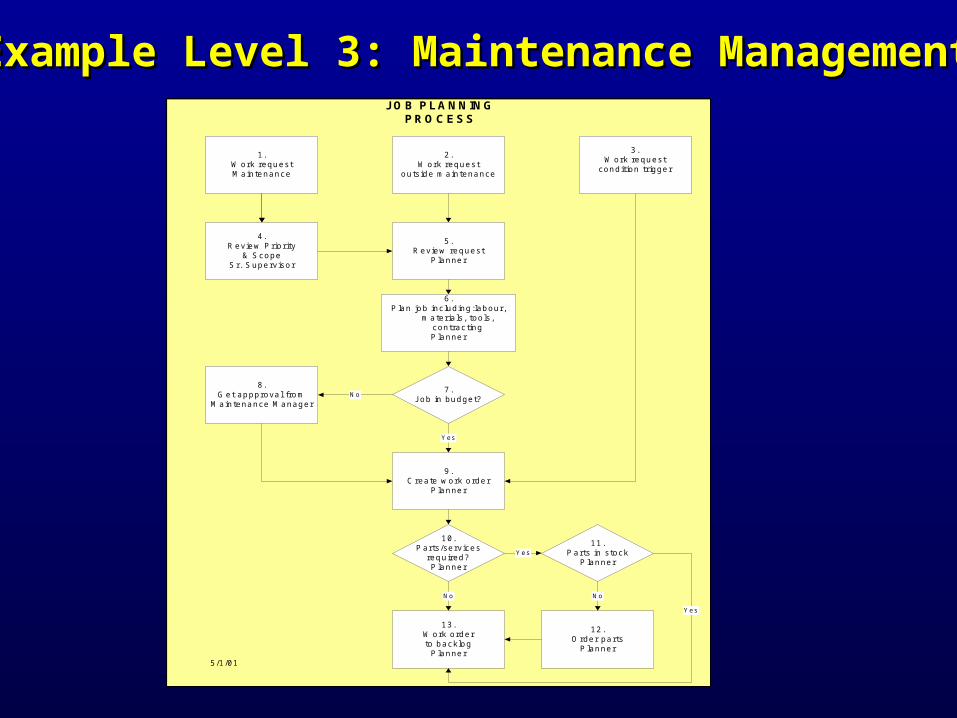
JOB PLANNINGPROCESS
1.W ork requestM aintenance
2.W ork request
outs ide m aintenance
3.W ork request
condition trigger
4.R eview Priority
& ScopeSr. Superv isor
5.R eview request
P lanner
6.P lan job inc lud ing:labour,
m ateria ls , too ls ,contractingP lanner
9.C reate w ork order
P lanner
10.Parts /serv ices
required?P lanner
11.Parts in s tock
P lanner
13.W ork orderto backlog
P lanner
12.O rder parts
P lanner
Yes
No No
Yes
Yes
5/1/01
7.Job in budget?
8.G et appproval from
M aintenance M anagerNo
Example Level 3: Maintenance ManagementExample Level 3: Maintenance Management
freeleansite.com
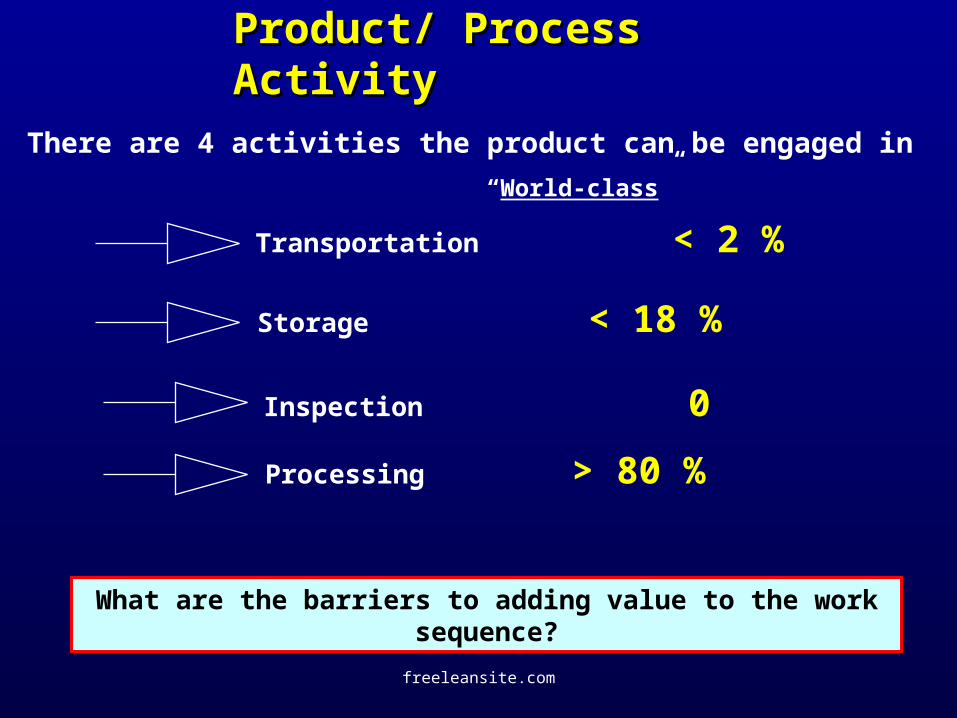
There are 4 activities the product can be engaged in
Transportation < 2 %
Product/ Process ActivityProduct/ Process Activity
Storage < 18 %
Inspection 0
Processing > 80 %
“World-class”
What are the barriers to adding value to the work sequence?
freeleansite.com
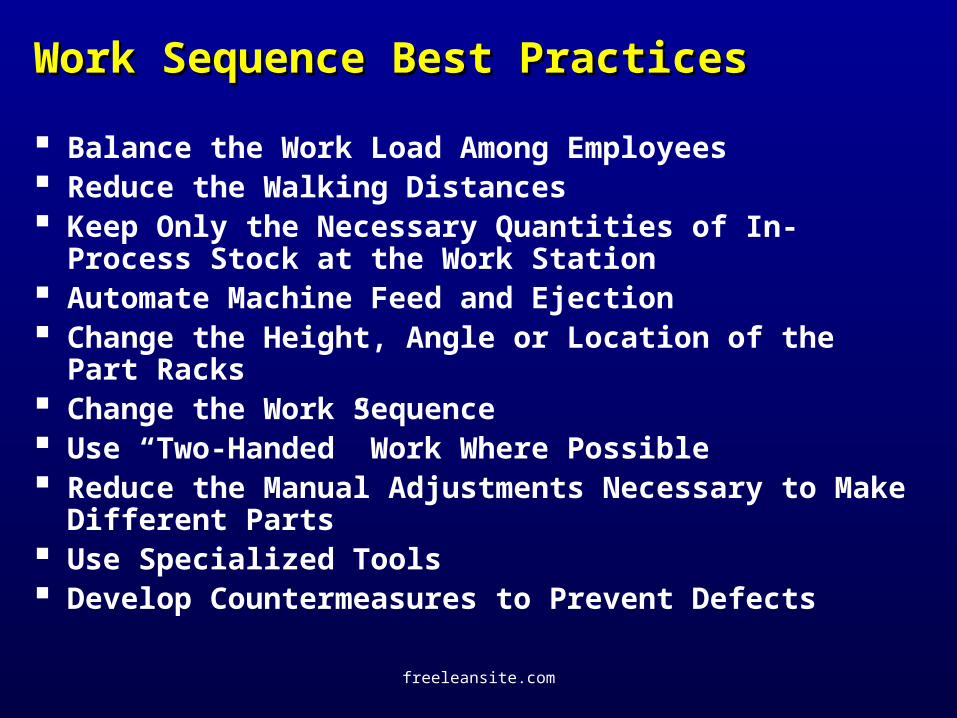
Work Sequence Best PracticesWork Sequence Best Practices
Balance the Work Load Among Employees Reduce the Walking Distances Keep Only the Necessary Quantities of In-Process
Stock at the Work Station Automate Machine Feed and Ejection Change the Height, Angle or Location of the Part Racks Change the Work Sequence Use “Two-Handed” Work Where Possible Reduce the Manual Adjustments Necessary to Make
Different Parts Use Specialized Tools Develop Countermeasures to Prevent Defects
freeleansite.com
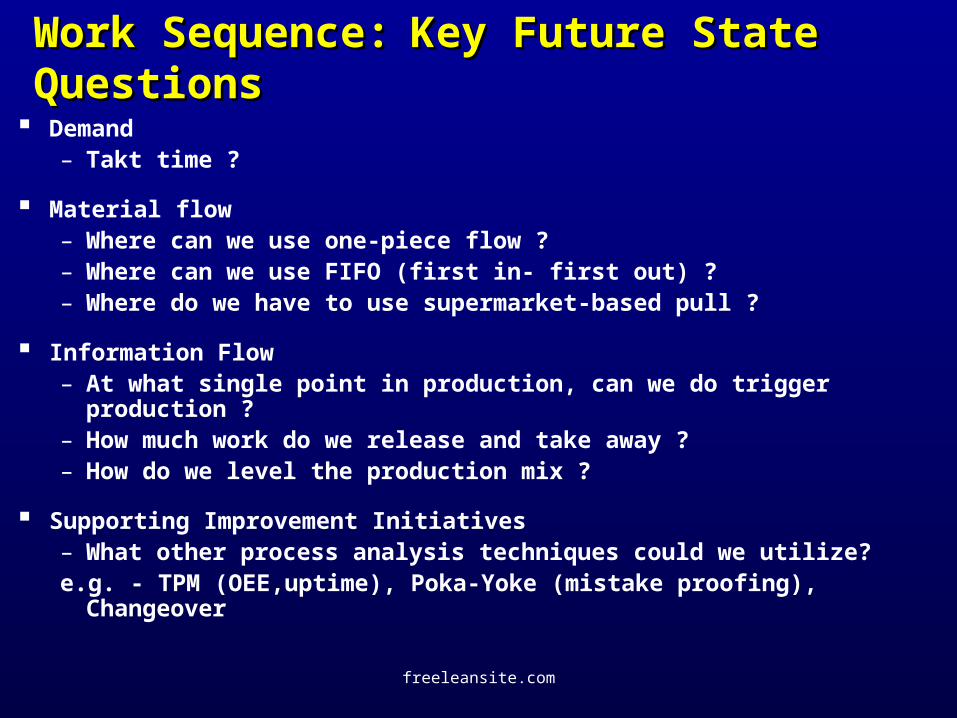
Work Sequence:Work Sequence: Key Future State QuestionsKey Future State Questions
Demand– Takt time ?
Material flow– Where can we use one-piece flow ?– Where can we use FIFO (first in- first out) ?– Where do we have to use supermarket-based pull ?
Information Flow– At what single point in production, can we do trigger production ?– How much work do we release and take away ?– How do we level the production mix ?
Supporting Improvement Initiatives– What other process analysis techniques could we utilize?e.g. - TPM (OEE,uptime), Poka-Yoke (mistake proofing), Changeover
freeleansite.com
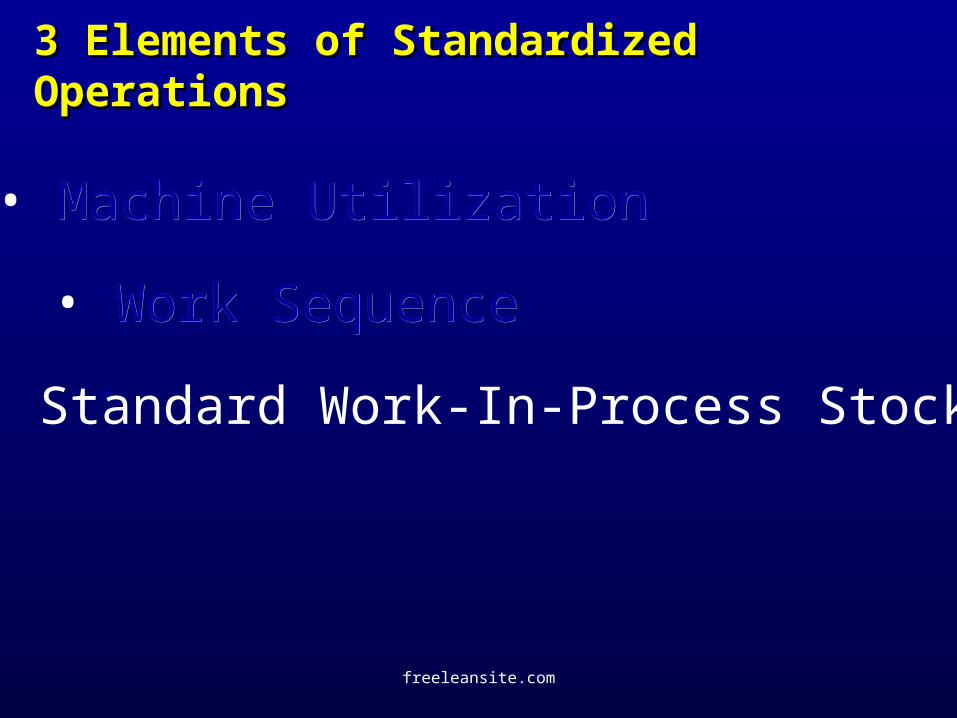
3 Elements of Standardized Operations3 Elements of Standardized Operations
• Machine UtilizationMachine Utilization
• Work SequenceWork Sequence
• Standard Work-In-Process Stock
freeleansite.com
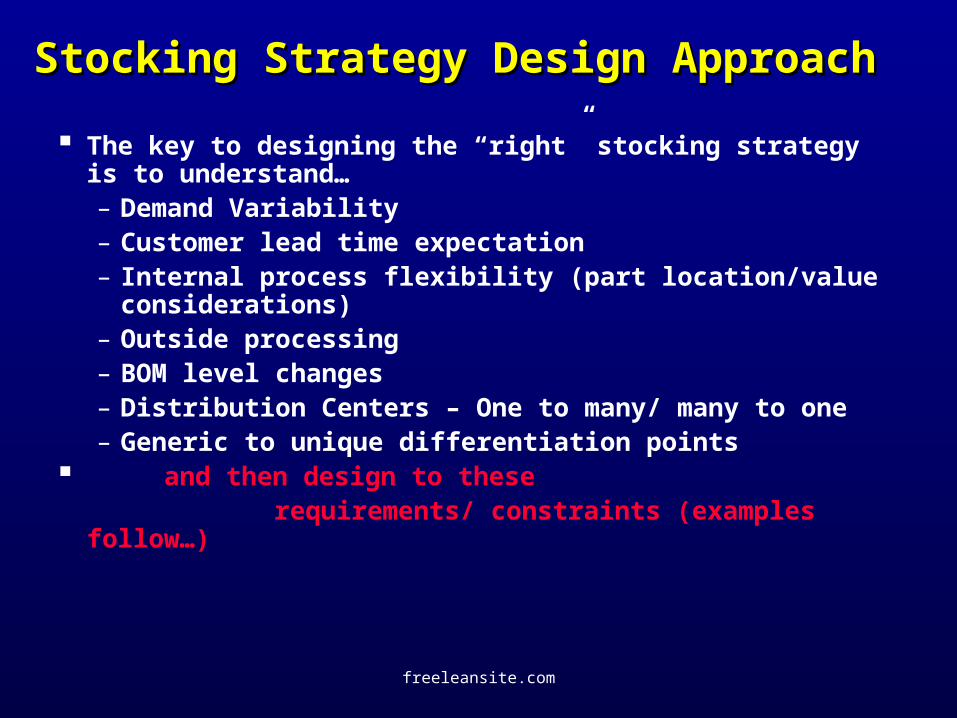
Stocking Strategy Design ApproachStocking Strategy Design Approach
The key to designing the “right” stocking strategy is to understand…– Demand Variability– Customer lead time expectation– Internal process flexibility (part location/value
considerations)– Outside processing– BOM level changes– Distribution Centers – One to many/ many to one– Generic to unique differentiation points
and then design to these requirements/ constraints (examples follow…)
freeleansite.com
0
100
200
300
400
500
600
700
800
11/4
/96
11/8
/96
11/1
2/96
11/1
6/96
11/2
0/96
11/2
4/96
11/2
8/96
12/2
/96
12/6
/96
12/1
0/96
12/1
4/96
12/1
8/96
12/2
2/96
12/2
6/96
12/3
0/96
1/3/
97
1/7/
97
1/11
/97
1/15
/97
1/19
/97
1/23
/97
1/27
/97
1/31
/97
2/4/
97
2/8/
97
2/12
/97
2/16
/97
2/20
/97
2/24
/97
2/28
/97
3/4/
97
3/10
/97
3/19
/97
3/26
/97
4/4/
97
Un
its
/Da
y
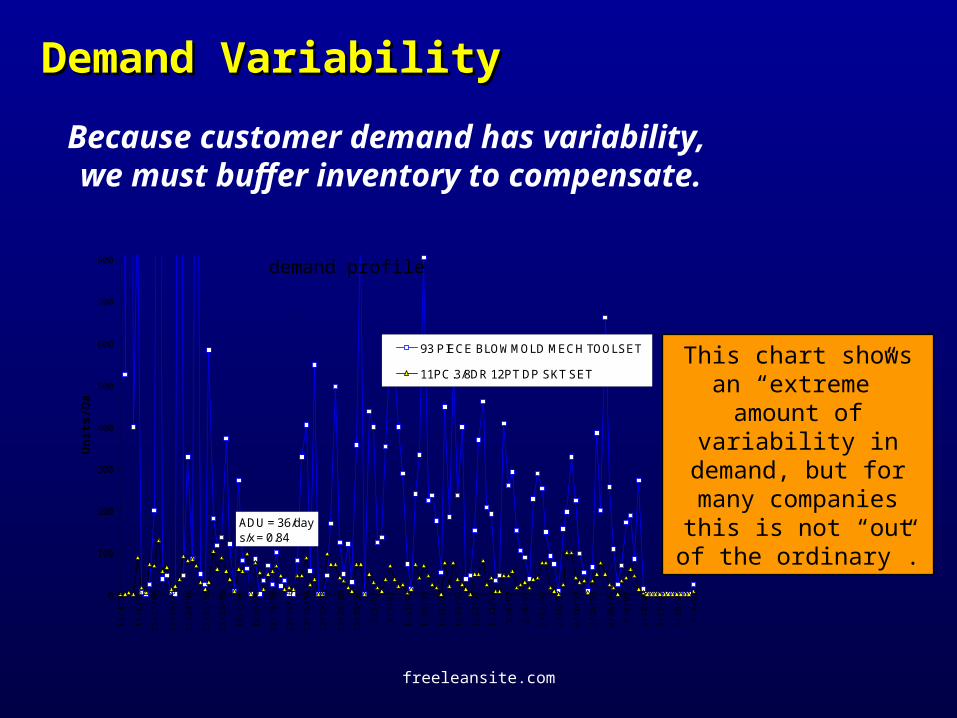
93 PIECE BLOWMOLD MECH TOOLSET
11PC.3/8DR 12PT DP SKT SET
ADU = 271/days/x = 1.98
ADU = 36/days/x = 0.84
Demand VariabilityDemand Variability
Because customer demand has variability, we must buffer inventory to compensate.
This chart shows an “extreme” amount
of variability in demand, but for many companies this is not “out of
the ordinary”.
demand profile
freeleansite.com
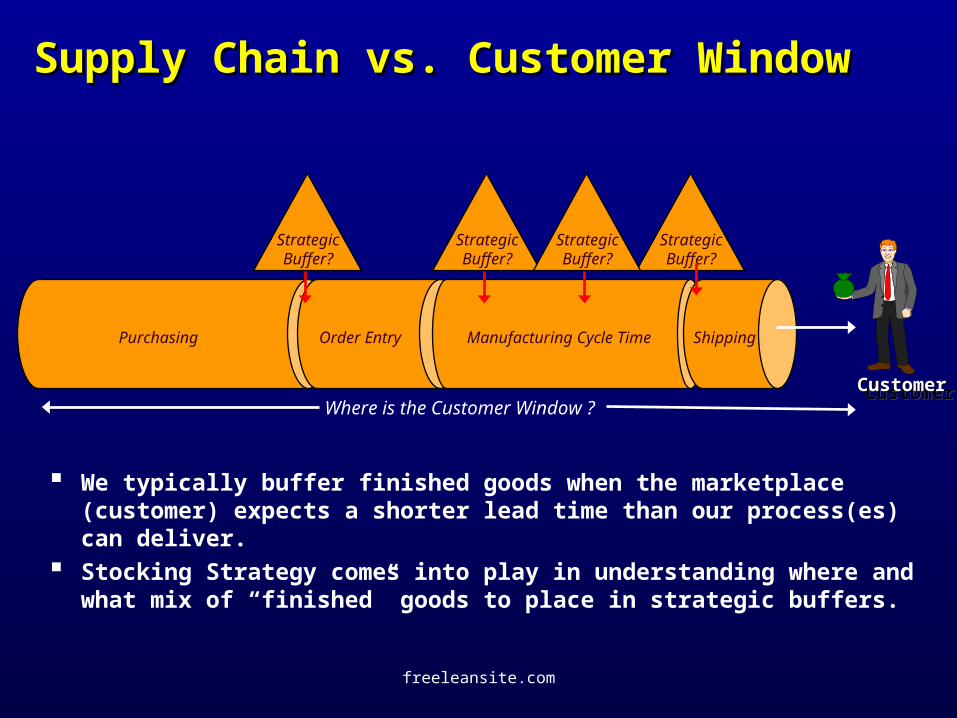
Purchasing
Supply Chain vs. Customer WindowSupply Chain vs. Customer Window
We typically buffer finished goods when the marketplace (customer) expects a shorter lead time than our process(es) can deliver.
Stocking Strategy comes into play in understanding where and what mix of “finished” goods to place in strategic buffers.
Where is the Customer Window ?
Order Entry
Shipping
Strategic
Buffer?
Manufacturing Cycle Time
Strategic
Buffer?
Strategic
Buffer?
Strategic
Buffer?
CustomeCustomerr
CustomeCustomerr
freeleansite.com
AssemblyAssembly
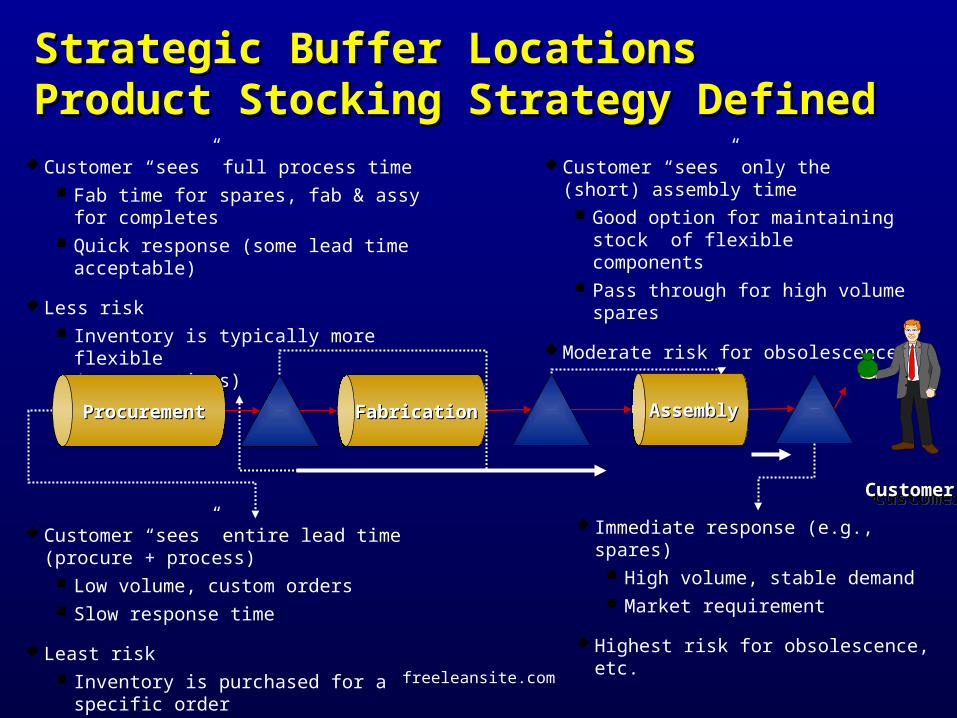
Customer “sees” entire lead time (procure + process)
Low volume, custom orders Slow response time
Least risk Inventory is purchased for a specific order
Immediate response (e.g., spares) High volume, stable demand Market requirement
Highest risk for obsolescence, etc.
Customer “sees” full process time Fab time for spares, fab & assy for
completes Quick response (some lead time
acceptable)
Less risk Inventory is typically more flexible
(e.g. castings)
Strategic Buffer LocationsStrategic Buffer LocationsProduct Stocking Strategy DefinedProduct Stocking Strategy Defined
ProcurementProcurement FabricationFabrication
Customer “sees” only the (short) assembly time
Good option for maintaining stock of flexible components
Pass through for high volume spares
Moderate risk for obsolescence
CustomeCustomerr
CustomeCustomerr
freeleansite.com
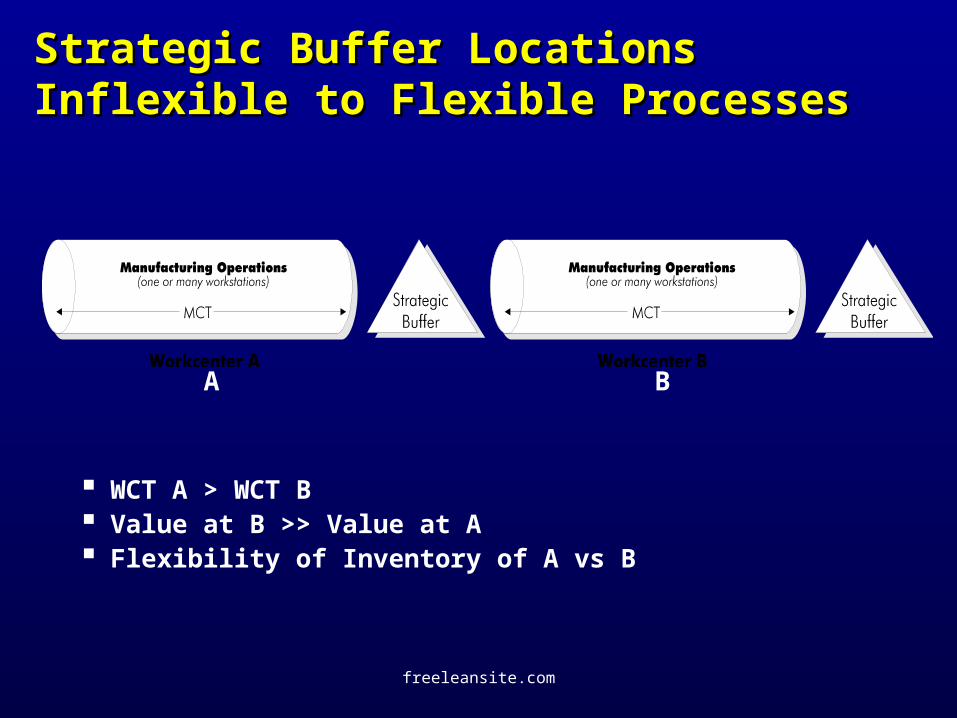
Strategic Buffer Locations Strategic Buffer Locations Inflexible to Flexible ProcessesInflexible to Flexible Processes
WCT A > WCT B Value at B >> Value at A Flexibility of Inventory of A vs B
A B
freeleansite.com
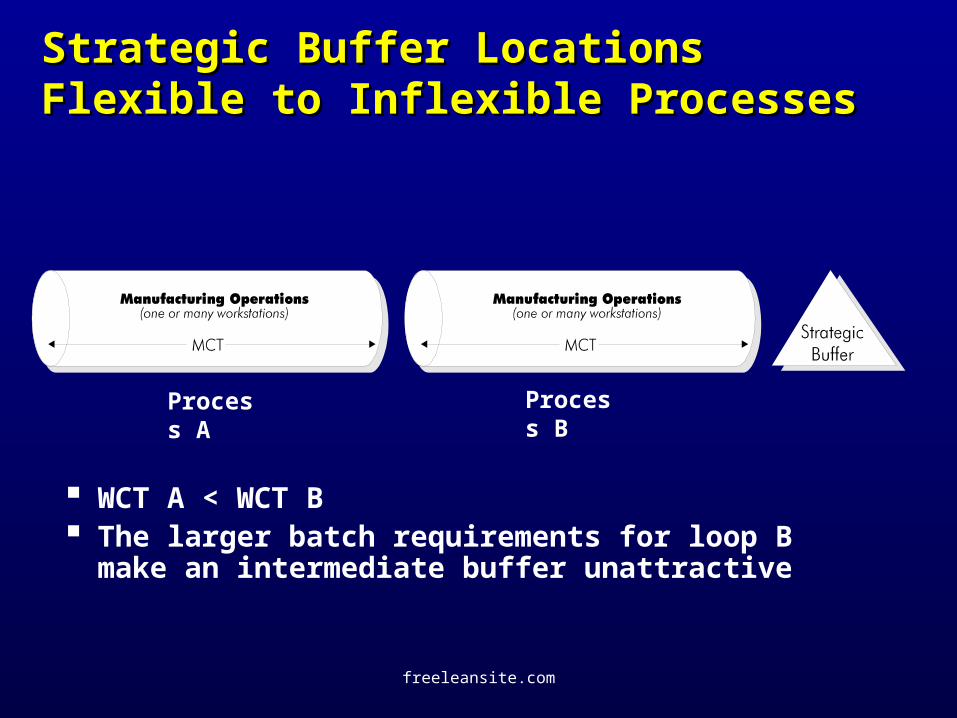
Strategic Buffer Locations Strategic Buffer Locations Flexible to Inflexible ProcessesFlexible to Inflexible Processes
WCT A < WCT B The larger batch requirements for loop B
make an intermediate buffer unattractive
Process B
Process A
freeleansite.com
In-House Operations
OutsideProcessingOutside
Processing
StrategicBuffer
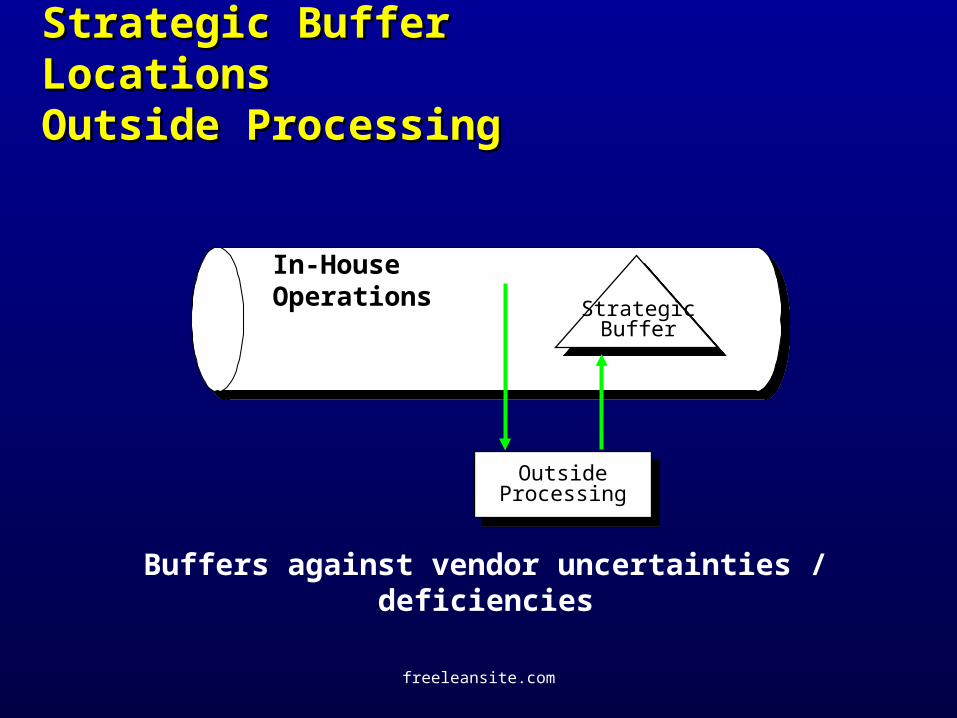
Strategic Buffer Locations Strategic Buffer Locations Outside ProcessingOutside Processing
Buffers against vendor uncertainties / deficiencies
freeleansite.com
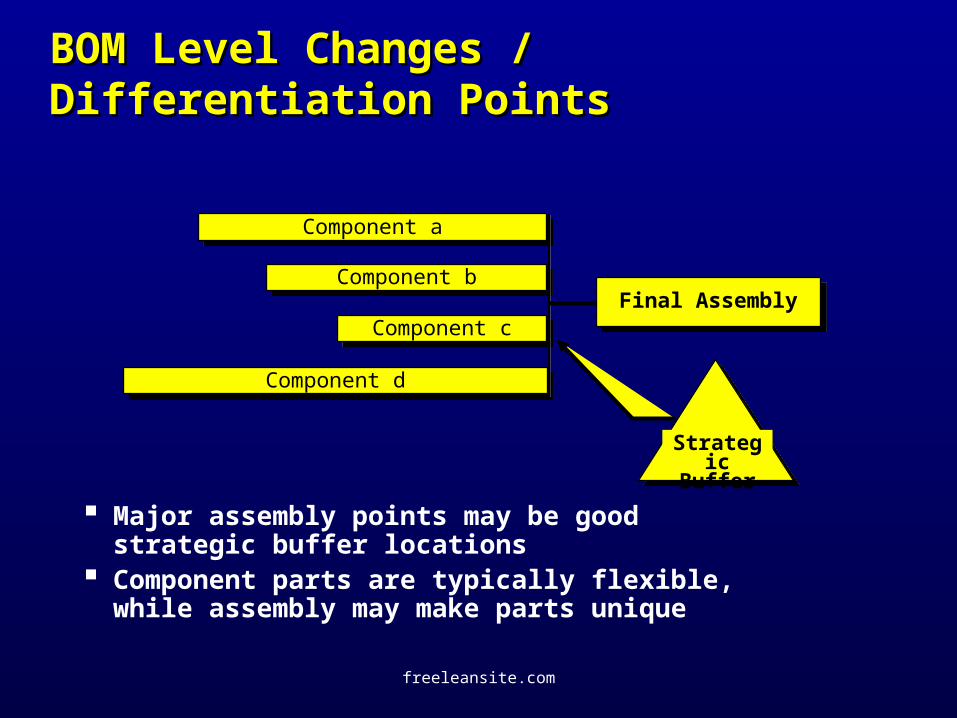
BOM Level Changes / BOM Level Changes / Differentiation PointsDifferentiation Points
Major assembly points may be good strategic buffer locations
Component parts are typically flexible, while assembly may make parts unique
Component aComponent a
Component bComponent b
Component cComponent c
Component dComponent d
Final AssemblyFinal Assembly
Strategic Buffer
freeleansite.com
DCMin Ship (min SS)
DCMin Ship (min SS)
DCMin Ship (min SS)
DCMin Ship (min SS)
DCMin Ship (min SS)
DCMin Ship (min SS)
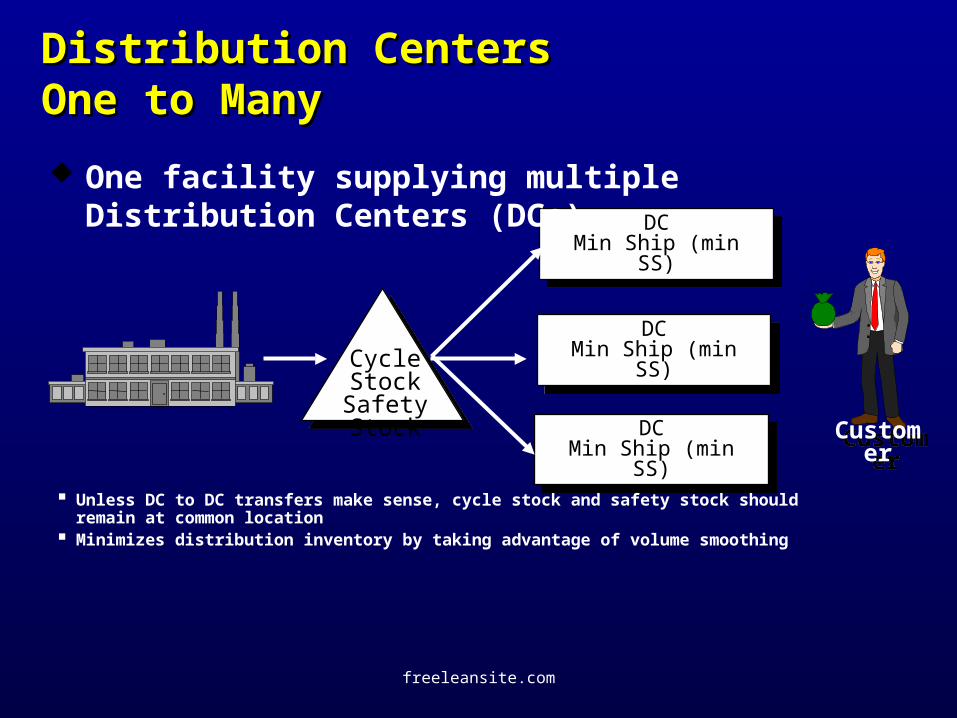
Distribution CentersDistribution CentersOne to ManyOne to Many
Unless DC to DC transfers make sense, cycle stock and safety stock should remain at common location
Minimizes distribution inventory by taking advantage of volume smoothing
CycleStock
Safety Stock
One facility supplying multiple Distribution Centers (DCs)
CustomerCustomer
freeleansite.com
DCSafety Stock + Min Ship
DCSafety Stock + Min Ship
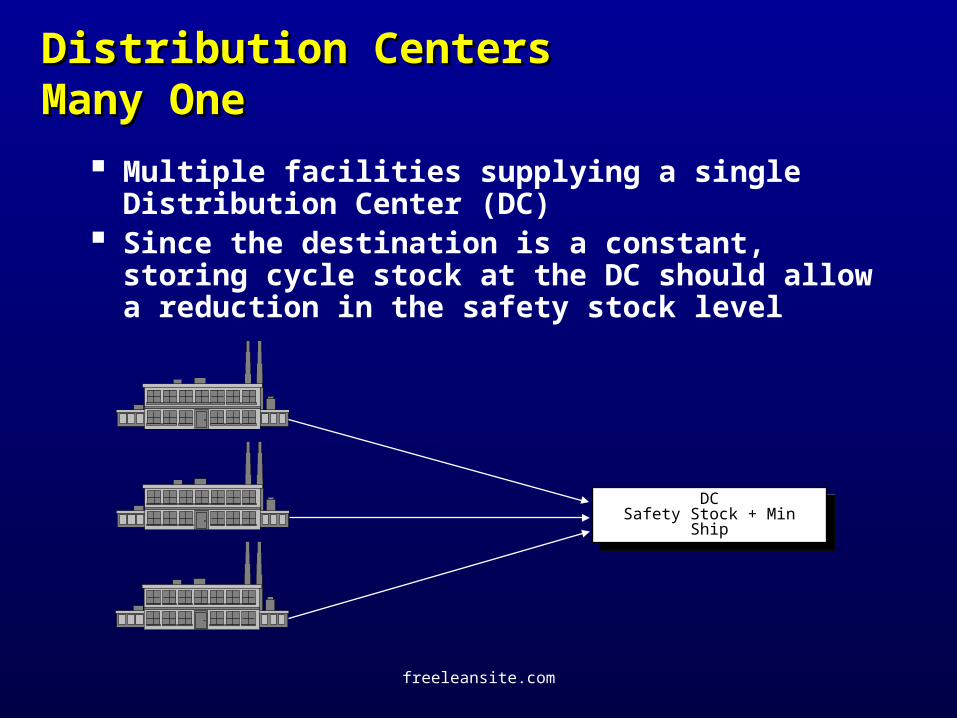
Distribution CentersDistribution CentersMany OneMany One
Multiple facilities supplying a single Distribution Center (DC)
Since the destination is a constant, storing cycle stock at the DC should allow a reduction in the safety stock level
freeleansite.com
CycleStock
CycleStock
CycleStock DC
Safety Stock + Min ShipDC
Safety Stock + Min Ship
DCSafety Stock + Min Ship
DCSafety Stock + Min Ship
DCSafety Stock + Min Ship
DCSafety Stock + Min Ship
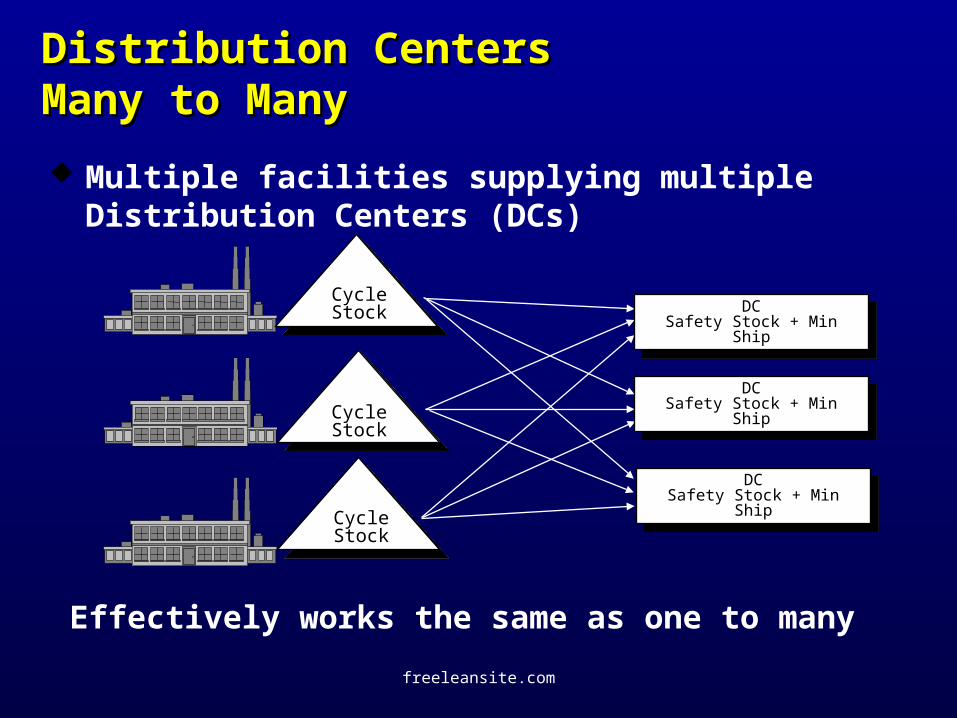
Distribution CentersDistribution CentersMany to ManyMany to Many
Effectively works the same as one to many
Multiple facilities supplying multiple Distribution Centers (DCs)
freeleansite.com
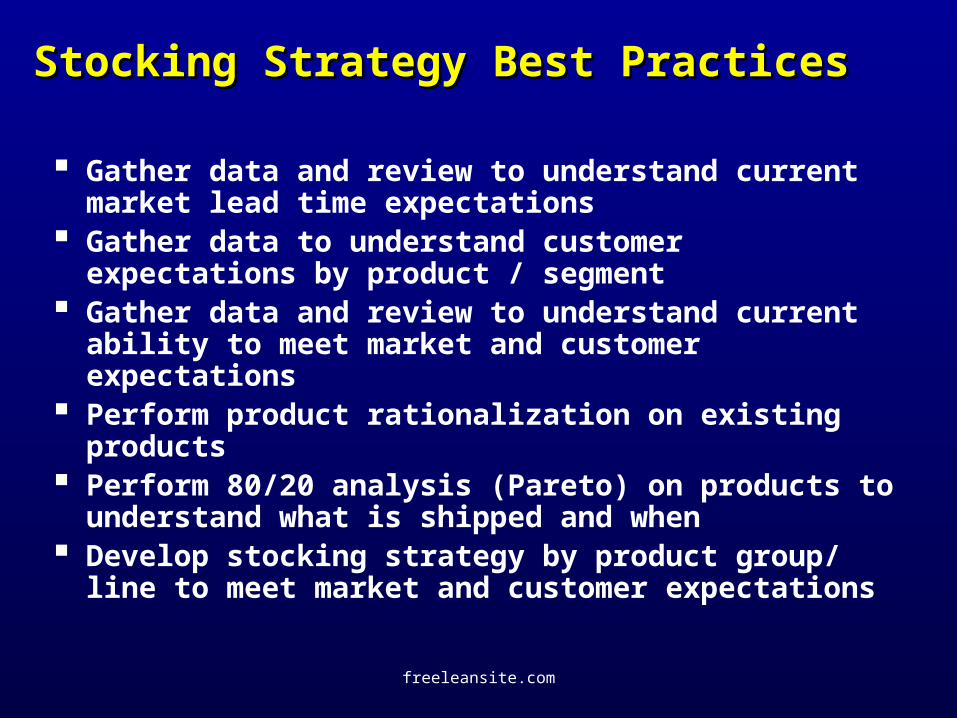
Stocking Strategy Best PracticesStocking Strategy Best Practices
Gather data and review to understand current market lead time expectations
Gather data to understand customer expectations by product / segment
Gather data and review to understand current ability to meet market and customer expectations
Perform product rationalization on existing products Perform 80/20 analysis (Pareto) on products to
understand what is shipped and when Develop stocking strategy by product group/ line to
meet market and customer expectations
freeleansite.com
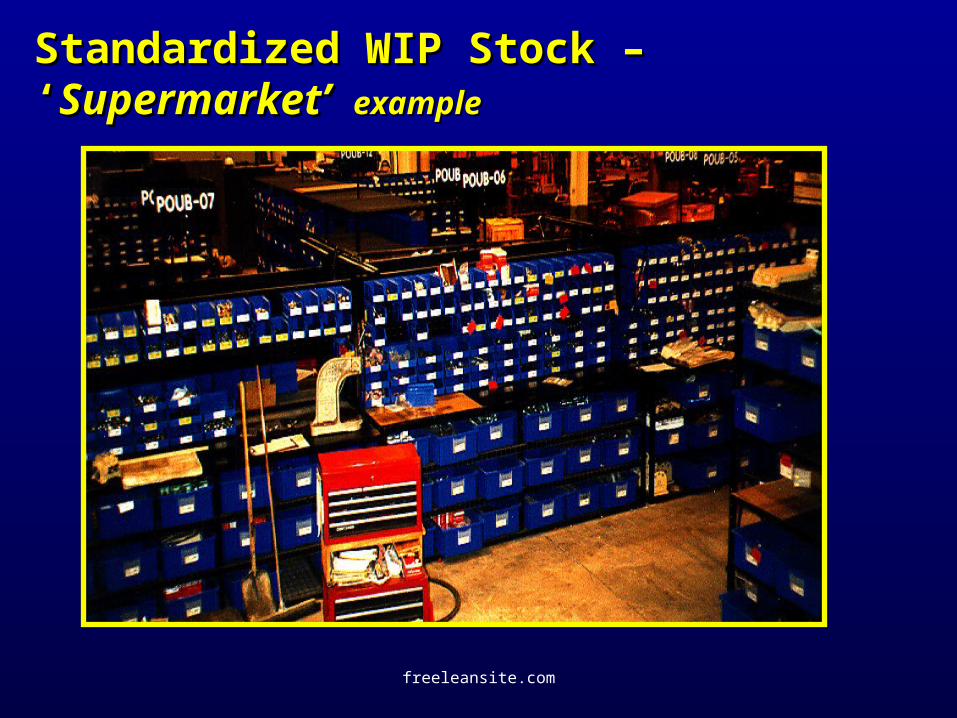
Standardized WIP Stock – ‘Standardized WIP Stock – ‘Supermarket’ Supermarket’ exampleexample
freeleansite.com
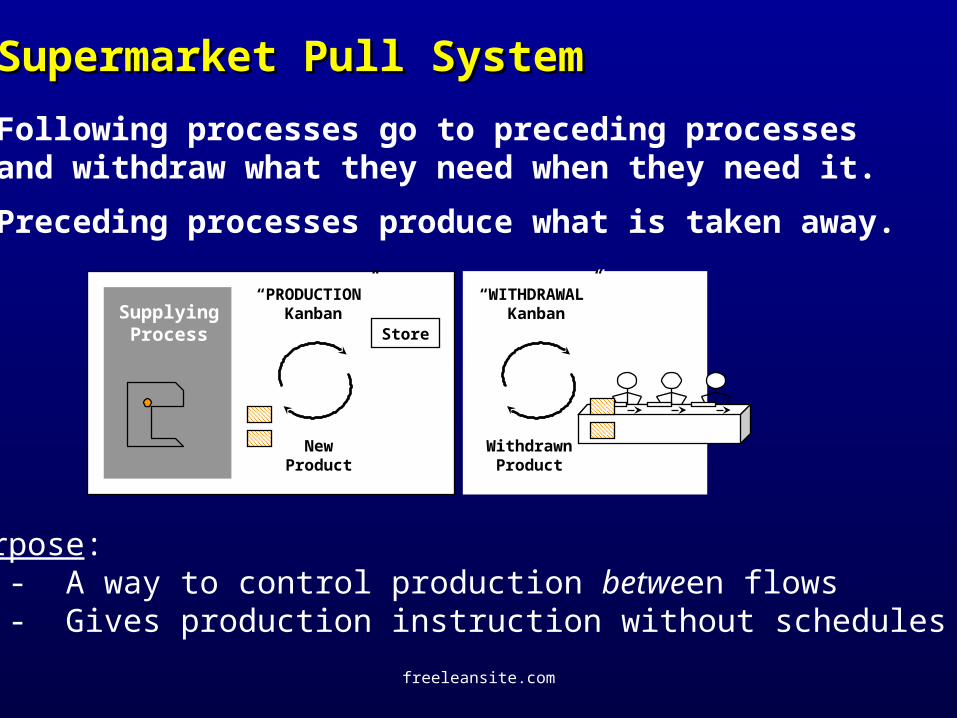
Supermarket Pull SystemSupermarket Pull System
Following processes go to preceding processesand withdraw what they need when they need it.
Preceding processes produce what is taken away.
Purpose: - A way to control production between flows - Gives production instruction without schedules
“Customer” Process
“WITHDRAWAL”Kanban
WithdrawnProduct
SupplyingProcess
“PRODUCTION”Kanban
NewProduct
Store
freeleansite.com
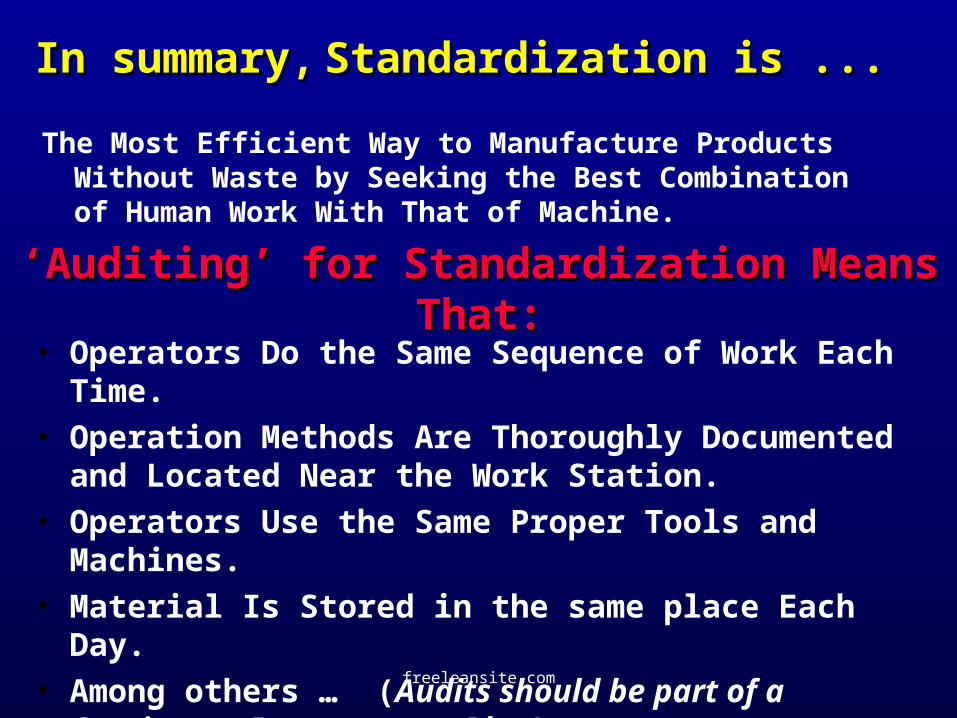
The Most Efficient Way to Manufacture Products Without Waste by Seeking the Best Combination of Human Work With That of Machine.
In summary,In summary, Standardization is ...Standardization is ...
• Operators Do the Same Sequence of Work Each Time.• Operation Methods Are Thoroughly Documented and
Located Near the Work Station.• Operators Use the Same Proper Tools and Machines.• Material Is Stored in the same place Each Day.• Among others … (Audits should be part of a
Continuous Improvement Plan)
‘‘Auditing’ for Standardization Means That:Auditing’ for Standardization Means That:
freeleansite.com
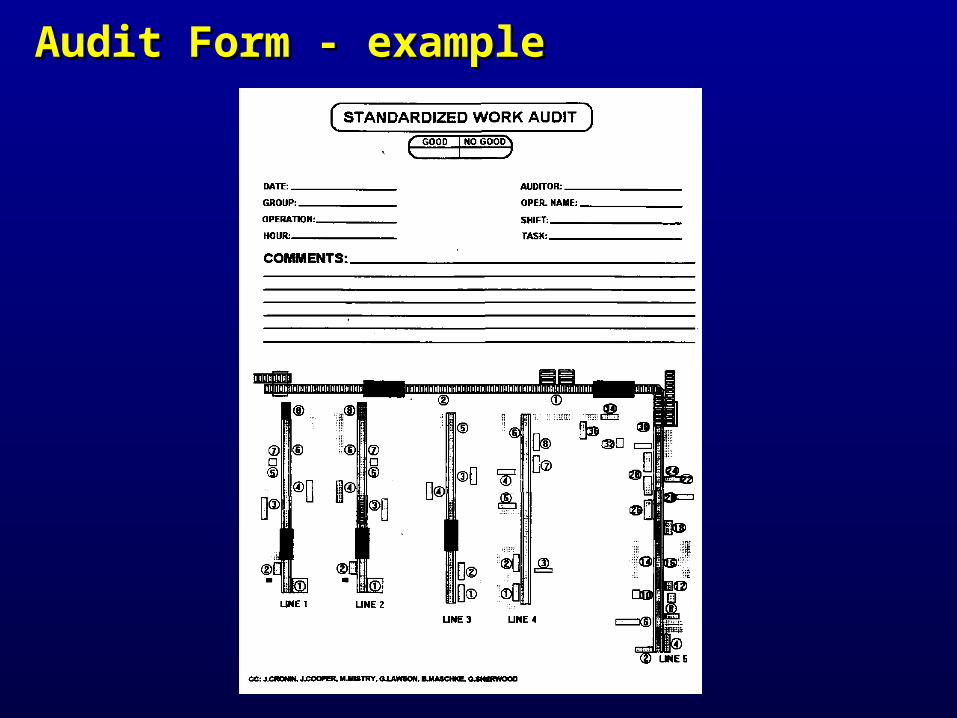
Audit Form - exampleAudit Form - example
freeleansite.com
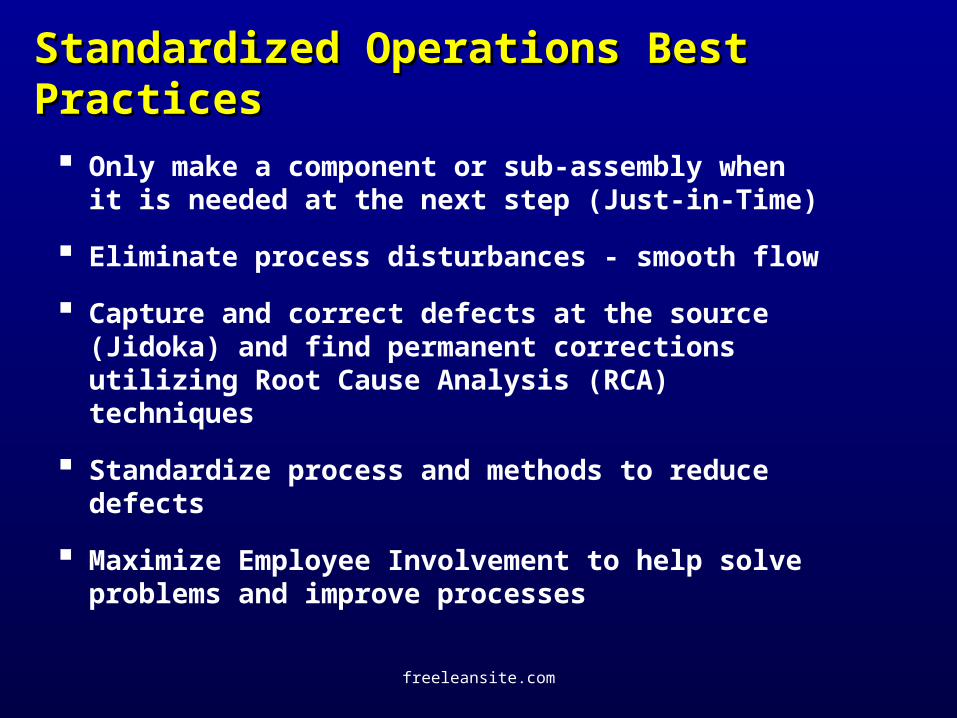
Standardized Operations Best PracticesStandardized Operations Best Practices
Only make a component or sub-assembly when it is needed at the next step (Just-in-Time)
Eliminate process disturbances - smooth flow
Capture and correct defects at the source (Jidoka) and find permanent corrections utilizing Root Cause Analysis (RCA) techniques
Standardize process and methods to reduce defects
Maximize Employee Involvement to help solve problems and improve processes
freeleansite.com
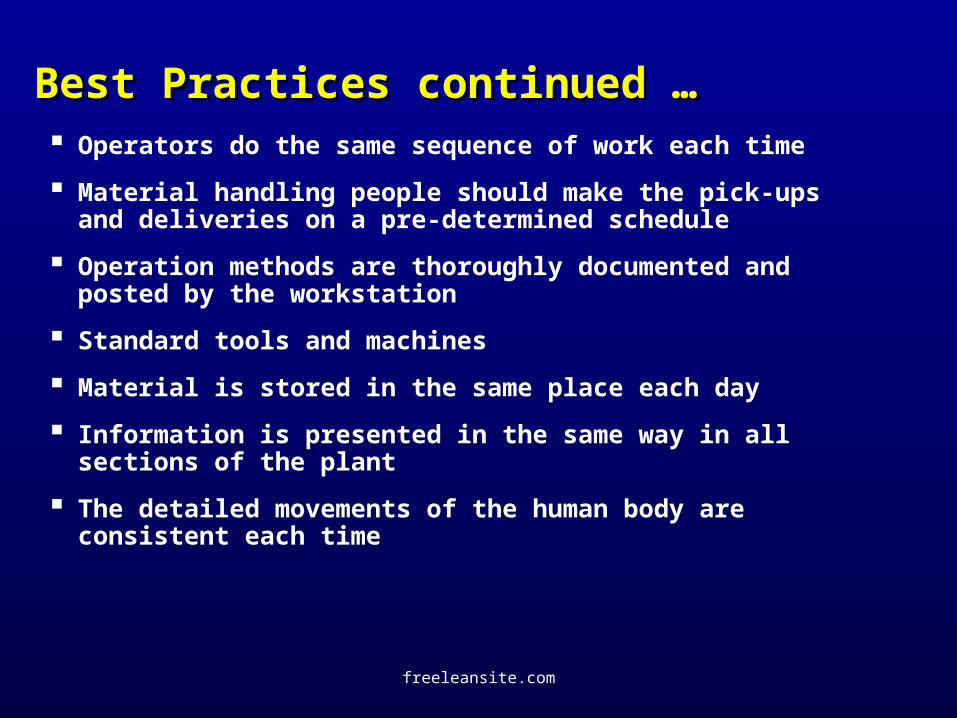
Operators do the same sequence of work each time
Material handling people should make the pick-ups and deliveries on a pre-determined schedule
Operation methods are thoroughly documented and posted by the workstation
Standard tools and machines
Material is stored in the same place each day
Information is presented in the same way in all sections of the plant
The detailed movements of the human body are consistent each time
Best Practices continued …Best Practices continued …
freeleansite.com
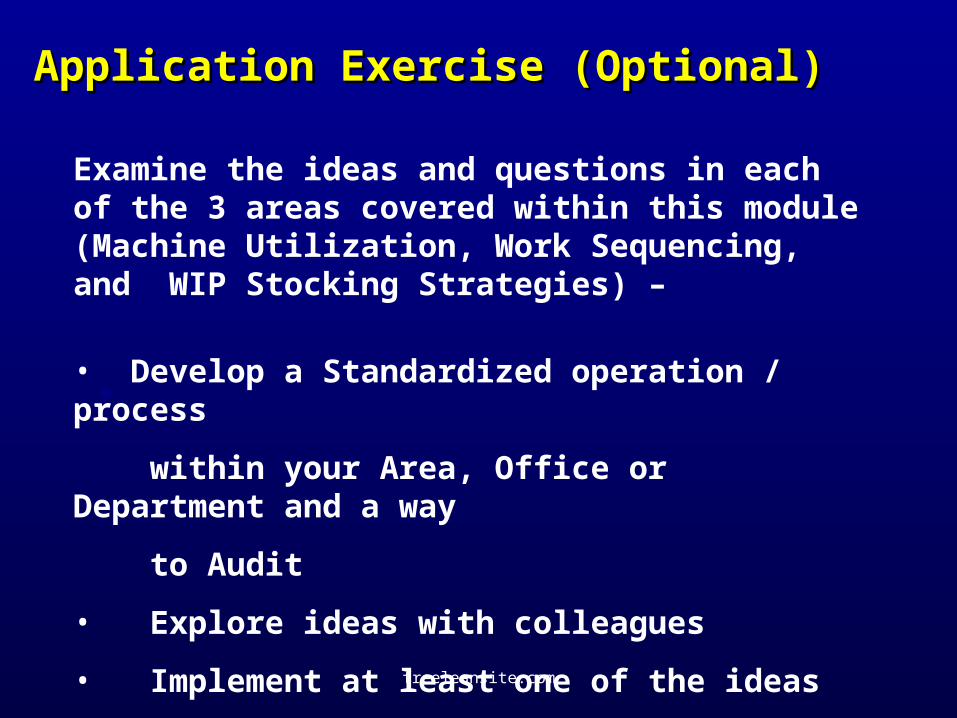
Application Exercise (Optional)Application Exercise (Optional)
Examine the ideas and questions in each of the 3 areas covered within this module (Machine Utilization, Work Sequencing, and WIP Stocking Strategies) –
• Develop a Standardized operation / process
within your Area, Office or Department and a way
to Audit
• Explore ideas with colleagues
• Implement at least one of the ideas
The Lean EnterpriseThe Lean EnterpriseThe Lean EnterpriseThe Lean EnterpriseStandardized Operations/ Standard Work
Lean Foundations
Continuous Improvement Training
Lean Foundations
Continuous Improvement Training