the liberalization of retail services in india: a cge model background and literature review 2.1...
TRANSCRIPT
No. 2013-03A
OFFICE OF ECONOMICS WORKING PAPER U.S. INTERNATIONAL TRADE COMMISSION
Csilla Lakatos* Center for Global Trade Analysis, Purdue University,
and U.S. International Trade Commission
Tani Fukui* U.S. International Trade Commission
March 2013
*The authors are with the Office of Economics of the U.S. International Trade Commission. Office of Economics working papers are the result of the ongoing professional research of USITC Staff and are solely meant to represent the opinions and professional research of individual authors. These papers are not meant to represent in any way the views of the U.S. International Trade Commission or any of its individual Commissioners. Working papers are circulated to promote the active exchange of ideas between USITC Staff and recognized experts outside the USITC, and to promote professional development of Office staff by encouraging outside professional critique of staff research.
Address correspondence to: Office of Economics
U.S. International Trade Commission Washington, DC 20436 USA
Liberalization of Retail Services in India: a CGE Model

The Liberalization of Retail Services in India: a CGE
model
Csilla Lakatos∗1and Tani Fukui
†2
1Center for Global Trade Analysis, Purdue University
2US International Trade Commission
February 2013
Abstract
In order to address the signi�cant increase in importance of FDI and of MNC-
related policies, we develop an extended GTAPmodel and associated global database
that accounts for both foreign direct investment and multinational companies dif-
ferentiated by the region of ownership. The model is calibrated on the GTAP v8
database augmented by global foreign a�liate statistics data described in Fukui and
Lakatos (2012) and the FDI stocks data of Boumellassa et al. (2007). To illustrate
the model's behaviour, we examine the recent policy debate with respect to allow-
ing foreign direct investment in multi-brand retailing in India. We �nd that the
∗Corresponding author. Csilla Lakatos ([email protected]) is a Research Economist at the Center
for Global Trade Analysis at Purdue University and a Visiting Fellow at the U.S. International Trade
Commission.†Tani Fukui is an economist at the U.S. International Trade Commission from the O�ce of Economics.
The views expressed in this paper are strictly those of the authors and do not represent the opinions of
the U.S. International Trade Commission or of any of its Commissioners.
1
unilateral reduction of barriers to FDI in distribution services in India bene�ts the
economy as a whole, consumers and foreign producers but hurts domestic distrib-
utors. Nevertheless, when we consider the associated productivity improvements
documented in the literature to downstream and upstream industries, we �nd that
domestic producers are expected to bene�t from the liberalization of the distribution
sector as well.
JEL Classi�cation: F23 C68
1 Introduction
Nationwide protests erupted in December 2011 in India against the government's deci-
sion to allow 51 percent foreign direct investment (FDI) in multi-brand retailing, with
protestors labeling FDI a "fast death instrument" for the Indian economy. As a result of
the intense political and social pressure, the Government of India revoked its decision to
allow global supermarket chains such as Wal-Mart, Carrefour or Tesco to set up business
in India. In 2012, the Cabinet revived this policy and it has once again become a hot
debate. Many questions have been raised by this debate: at the aggregate level, is FDI
in retail services good for India? What bene�ts, and costs, should the Indian government
expect? What is the magnitude of the e�ect? Who will win and who will lose? We
address some of these issues in this paper.
The debate over liberalizing barriers to foreign investment in India is not a new one.
The 2011 policy proposal was made sixteen years after the �rst time it was proposed, and
has been blocked numerous times by those portions of the economy fearing negative con-
sequences1. Foreign investment policy changed dramatically with the economic reforms
of 1991 which liberalized many of the highly protected public sectors by removing entry
barriers to private participation and by allowing foreign investment in 35 high-priority
manufacturing sectors. While these measures managed to attract foreign investment and
1As reported in "UPA Opens doors for global retailers" in the Times of India, November 25, 2011.
2

technology in manufacturing sectors it capped foreign ownership at 51 percent and left
most of the services sectors including retailing, highly protected. Since 1991, barriers to
foreign investment were further relaxed. This included progressive de-licensing, allowing
100 percent foreign ownership in certain sectors, and broadening the liberalized sectors
to include services.
In 1997, 100 percent foreign ownership was permitted in FDI in "cash and carry"
and wholesale trading. Single brand retailing was opened to foreign investment in 2006
but the rate of foreign participation was capped at 51 percent. This limitation was
�nally removed in November 2011 at the same time the government attempted to allow
51 percent ownership in multi-brand retailing. The multi-brand retailing measure was
met with strong opposition of the di�erent stakeholders and was reversed after only four
months.
On the one hand, permitting the entry of foreign retailers is seen to threaten the
existence of millions of small traditional stores and street vendors that dominate the
Indian retailing industry. On the other hand, foreign retailers can improve the e�ciency of
the retail services industry and therefore lower prices for Indian consumers while bringing
investment and know-how.
Many observers anticipate the main losers of liberalization to be the small independent
shop owners and possibly their employees, as well as traders and middlemen that service
the independent shop owners. Winners of the new policy potentially include customers
who may face lower prices, and farmers who would receive a greater share of the �nal con-
sumer price and may bene�t from the productivity improvements imposed or encouraged
by foreign retailers.
The academic literature has attempted to quantify the e�ects of FDI liberalization in
a number of ways. There are two distinct lines of research. The �rst examines economet-
rically the e�ects of FDI on countries. This literature is predominantly concerned with
the productivity improvements that may be generated by FDI in the host country. The
second set of literature examines FDI in the context of the general equilibrium modeling.
In this study, we examine both aspects, using the direct e�ects of FDI estimated by the
3

econometric literature to obtain quanti�ed e�ects on the broader global economy.
This study sheds light on whether opening up multi-brand retailing and more gen-
erally trade to foreign investors in India would indeed be a "fast death instrument" in
harming certain sectors or stakeholders. We quantify the economic impacts of the removal
of barriers to foreign investment in a comparative static computable general equilibrium
(CGE) framework developed exclusively for better representing multinationals and FDI.
More speci�cally, we develop an extended GTAP model and associated global database
that accounts for both foreign direct investment and multinational companies di�erenti-
ated by the region of ownership which use di�erent production technologies to produce a
given a good. The model is calibrated on the GTAP v8 database augmented by global
foreign a�liate statistics data described in Fukui and Lakatos (2012) and the FDI stocks
data from Boumellassa et al. (2007). We �nd that the unilateral reduction of barriers
to FDI in distribution services in India bene�ts the economy as a whole, consumers and
foreign producers but hurts domestic distributors. Nevertheless, when we consider the
associated productivity improvements documented in the literature to downstream and
upstream industries, we �nd that domestic producers are expected to bene�t from the
liberalization of the distribution sector as well.
The rest of the paper is organized as follows. Section 1 introduces the paper and
Section 2 reviews some of the existing literature on the advantages and disadvantages
of allowing FDI in multi-brand retailing. Section 3 and Section 4 describe in detail the
modeling framework and the databases used in calibrating the model. Section 5 provides
details about the design of the simulations carried out in the paper while Section 6 analyzes
the economic impact of the elimination of the barriers to FDI in retailing in India. Finally,
Section 7 concludes.
4
2 Background and Literature Review
2.1 India's Retail Services Sector
The distribution sector, including both wholesale and retail, is one of most important
sectors of the Indian economy, accounting for 16 percent of GDP and 14 percent of total
employment2. It is also growing rapidly: according to some industry experts, the retail
services sector expects an 11-15 percent annualized growth rate over the next several
years3.
Despite the growth, foreign multinational �rms face daunting challenges in the Indian
economy. A unique feature of the Indian retail sector is the small share of "organized
retail" in the sector. The term organized retail is used to denote branded stores with
multiple outlets. Foreign multinationals, if they are permitted to enter the market, would
�t within this category; however, even domestic organized retail �rms have had very little
luck obtaining market share. McKinsey & Company (2008) estimated the 2007 share of
organized retail to be 4-5 percent of total retail sales, and Singh and Mall (2011) estimated
the 2010 share to be 6-7 percent; permitted foreign retailers (i.e. single-brand retailers)
take up only a fraction of this share4.
The penetration of the organized varies by good. Food is particularly con�ned to the
unorganized retail sector, relative to other goods. According to Sharma (2011), less than
1 percent of food was sold in organized retail stores, while 19 percent of clothing and
footwear was sold in organized retail stores.
2Central Statistics O�ce estimates for 2008-20093McKinsey & Company (2008) and Singh and Mall (2011).4This can be contrasted with other countries, even other developing countries, where the share of
organized retail is substantially higher: Sharma (2011) reports China has a 20 percent penetration of
organized retail in the retail sector, while Vietnam has a 22 percent penetration, and Brazil a 36 percent
penetration.
5

2.2 Liberalization and Controversy
Foreign investment policy was dramatically liberalized beginning with the economic re-
forms of 1991 which liberalized many of the highly protected public sectors by removing
entry barriers to private participation and by allowing foreign investment in 35 high-
priority manufacturing sectors. While these measures managed to attract foreign invest-
ment and technology in manufacturing sectors, the policy capped foreign ownership at 51
percent and left most of the services sectors, including retail services, highly protected.
Since 1991, barriers to foreign investment were further relaxed by progressive de-licensing
and allowing 100 percent foreign ownership in certain sectors.
Firms in "cash and carry" and wholesale trading have been permitted to have 100
percent foreign ownership since 1997. Single brand retailing was also opened up to foreign
investment in 2006 but the rate of foreign participation was capped at 51 percent.
In 2011, liberalization of multi-brand retail was contemplated in earnest. In the �rst
formal step toward a policy change, the Cabinet of India approved measures to permit
majority ownership in multi-brand retail �rms on November 24, 20115. The proposed
changes included permitting up to 51 percent foreign ownership in multi-brand retail
as well as 100 percent ownership in single brand retail. Several restrictions were pro-
posed alongside this liberalization, including small and medium sized business content
requirements for the foreign retailers, as well as and geographic restrictions on store lo-
cations. Moreover, the policy implementation depended on the further approval of state
governments. However, the uproar from various interested parties, particularly traders
and politicians, against this policy almost immediately forced the Cabinet to suspend the
decision only a few weeks later6. On September 14, 2012 the Cabinet revived this policy
but as of November 2012 it had not yet been formally adopted7.
5Times of India, "UPA opens the door for global retailers", November 25, 20116The decision was suspended on December 7, 2011. Times of India, "FDI in retail put on hold",
December 7, 2011.7Cited in Economic Times, September 14, 2012. "FDI in retail: Anand Sharma announces relax-
ation of norms for single brand." Formal adoption of foreign investment policy is made via "Press
6
There has been a substantial discussion in the popular press and industry experts
about the potential costs and bene�ts to various sectors in the economy. There are many
groups who fear losing out as a result of FDI in retail. The small traditional stores and
street vendors that dominate the Indian retailing industry are threatened by the potential
competition of foreign owned organized retail. Although small �rms are expected to lose
market share, they may still see continued sales growth as the total retail sales sector is
expected to expand.
Another major concern raised by the entry of foreign retailers is labor displacement
and wages. The retail sector is major employer in the Indian economy, and disruptions to
employment and wages can have serious implications for other segments of the economy.
Additionally, labor movement is a politically sensitive topic, and politicians are loath to
implement policy changes that may cause even temporary uncertainty in the labor market.
Finally, the liberalization of FDI may threaten the workers in the many links in the
supply chain between farmer (or producer) and retailer. These may be cut out of the
supply chain as foreign retailers establish direct links between themselves and farmers
and other producers. Less drastically, they will face pressure on their pro�t margins as
foreign multinationals begin to push for increased e�ciency from the supply chain.
On the other hand, competition from foreigners could also be a driver of improvements
in the productivity of the retail sector. Foreign organized retailers may be able to lower
prices for Indian consumers and improve the e�ciency of the retail services industry while
bringing investment and know-how to India. Upstream suppliers - farmers, in particular
- are expected by many observers to gain from FDI. Much store is set by Wal-Mart
and other �rms' attention to so called "farm-to-fork" strategies, whereby the retail �rm
selects and guides promising farmers toward more productive technologies8. In addition
to productivity improvements, there is an enormous amount of waste in the supply chain
Notes" issued by the Department of Industrial Policy and Promotion (DIPP (2010)), Government
of India. See Palit (2009). The Press Notes are posted to the DIPP website upon adoption.
http://dipp.nic.in/English/Policies/Policy.aspx8Times of India (2011). FDI in Retail: War-mart. December 3, 2011.
7
between farm and consumer, with an estimated $10 billion worth of farm produce going
to waste between the two points. This amounts to approximately 35-40 percent of fruits
and vegetables and about 10 percent of food grains9. It is hoped that foreign-owned
retailers will tackle this problem as well by investing in cold-chain transportation and
storage facilities to eliminate such waste.
Improvements in the supply chain are expected to be at least partially passed on to
consumers. Various experts have claimed cost savings of between 3 and 6 percent10. Other
observers such as Chand and Ganguly (2011) have expressed the expectation that the
periodic episodes of food in�ation may in part be mitigated by improvement in supply
chain management. Although the estimated price changes are not large and may be
smaller than in�ation rates, improved linkages between farm and consumer can improve
supply management.
Finally, consumers are expected to bene�t through improvements in price, quality
and access to a wider range of varieties. Existing research (e.g. Joseph et al. (2008)) has
found that while foreign �rm entry in organized retail is associated with an increase in
purchasing power across all income groups, lower income consumers bene�t the most.
Much of the commentary in the popular press discusses improvements to agricultural
productivity as a results of liberalizing the retail services sector. In our paper as well,
we focus our attention on the backward linkages to agriculture. This is understandable
because food is the sector that is least often sold through the organized sector and may
bene�t the most. However, other goods such as furniture and apparel are currently being
sold through organized retail �rms at a much higher rate than agricultural products, and
liberalization may a�ect these sectors as well. Future work would bene�t from analyzing
9Times of India (2011). FDI in Retail: War-mart. December 3, 2011.10Times of India (2011). FDI in Retail: War-mart. December 3, 2011. In 2011, BCG co-authored a
report ("Building a New India: The Role of Organized Retail in Driving Growth") with the Confederation
of Indian Industry, a broad-based industry association of over 7,100 Indian-based �rms of all sizes and
industries. This report estimated that consumer costs would decline by an average of 4-6 percent. Kishore
Biyani, a prominent retail entrepreneur also cited in the Times of India article, estimates that prices in
the organized sector are on average 3-4 percent lower than in kiranas (small independent local shops).
8

the liberalization e�ects of distribution on other sectors.
2.3 Economic Literature
A dominant theme in the economic literature is the search for knowledge spillovers gen-
erated by FDI. The essential thesis is that a foreign �rm with world-class expertise in
a particular sector will provide - deliberately or inadvertently - knowledge to the host
country and will thereby provide a productivity boost to �rms in that country. Despite a
wealth of anecdotes and a general acknowledgement that knowledge transfers occur (see
e.g. Javorcik and Tybout (2008) and Lipsey (2002)), there have been mixed results in
attempts to quantify the e�ect. The major literature review by Lipsey (2002) �nds that
evidence of "knowledge spillovers" is not so clear, and depends on a variety of factors as
explained below.
Stage of development seems to matter: studies of developed countries tend to show
positive spillovers while studies of developing countries do not. The analysis by Keller and
Yeaple (2009) obtains positive spillovers for U.S. inward FDI, as does Haskel and Slaugh-
ter (2007) for the UK. These are both for developed countries as hosts; for developing
countries many studies obtain either negative or insigni�cant spillover e�ects. Aitken and
Harrison (1999) for Venezuela, Javorcik and Spatareanu (2008) for Romania and Blalock
and Gertler (2008) for Indonesia did not �nd positive same sector spillovers.
Alfaro and Chen (2012) examine knowledge spillovers in combination with "selection"
issues. They note that there are several forces that may a�ect average productivity. First,
domestic �rms may be learning from foreign �rms in the same sector. Second, domestic
�rms may be persuaded to be more e�cient due to increased competition. This would also
appear as a productivity increase but represents something less than a knowledge spillover.
Third, increased competition will push out the least productive �rms. This again does not
necessarily imply knowledge spillovers per se. Alfaro and Chen (2012) aim to disentangle
two of the possible sources of average productivity improvement: knowledge spillovers
and the increased competition produced by FDI. They �nd that same sector knowledge
spillovers are estimated to account for the majority of the productivity improvement.
9
The e�ects of FDI on host economies manifest themselves in other measures as well.
Lipsey (2002) �nds that there is substantial evidence that wages increase as a result of
increased FDI. Foreign-owned �rms are more productive, and this higher productivity
permits them to recruit workers at above market rates. On the other hand, at least one
article has found the opposite to be true: Chari and Raghavan (2012) �nd that each
Wal-Mart worker replaces approximately 1.4 retail workers while pushing down wages.
Economic growth is associated with increases in FDI, as noted by Chakraborty and Nun-
nenkamp (2008), Blonigen and Wang (2004), and Alfaro et al. (2010). In our paper we
focus on productivity e�ects which are the root cause of most other observed e�ects.
3 Modeling Framework
On the one hand, FDI is associated with the international mobility of capital and on the
other hand, FDI implies �rms operating across national borders. In our modeling of FDI
in CGE we cover both of these aspects.
The pioneering work of Petri (1997) laid the groundwork for many subsequent CGE
models representing foreign direct investment. The Petri model was the �rst to consider
foreign commercial presence in a CGE framework. It employed the Armington assumption
of national product di�erentiation to distinguish between product varieties di�erentiated
not only by the �rm location but also by �rm ownership. The standard GTAP model
distinguishes product varieties by �rm location only. In addition, Petri de�nes investor
preferences as a nested imperfect transformation function that allocates a given investment
budget across sectors and regions.
Examples of CGEmodels that use a Petri-type speci�cation of FDI are FTAP (Hanslow
et al., 2000), the Michigan model (Brown and Stern, 2001), MIRAGE (Bchir et al., 2002)
and WorldScan (Lejour et al., 2006). The FTAP model is a version of the standard GTAP
model which incorporates FDI based mostly on the assumptions of Petri. A key di�er-
ence lies in the ordering of choices among regions of location and ownership (modi�ed
Petri assumption): FTAP assumes that foreign a�liates located in a given region are
10

closer substitutes for domestic �rms located in that region than they are for the �rm of
the region of ownership (parent company) while the Petri speci�cation implies that �rms
with the same region of ownership are closer substitutes for each other irrespective of lo-
cation. Brown and Stern (2001) also use a modi�ed Petri assumption to incorporate FDI
in the Michigan Model of World Production and Trade. Lejour et al. (2008) use the same
framework to analyze the liberalization of the EU services market with the WorldScan
model.
The speci�cation of FDI we propose follows closely that of Petri (1997) and Hanslow
et al. (2000). One major di�erence compared to the existing literature arises from the
fact that we represent heterogeneous production technologies for �rms di�erentiated by
the region of ownership. While this assumption has been already considered in the single-
country CGE literature such as Jensen et al. (2007), Rutherford and Tarr (2008), Latorre
et al. (2009) and Latorre (2010), it is a signi�cant improvement on existing modeling
techniques in the global CGE literature.
The next subsections describe the structure of investor preferences and the structure
of supply. We brie�y describe the relevant features of the GTAP model, the di�erences
introduced by our model, and their implications.
3.1 Mobility of capital
GTAP is a real assets model. That is, investment is only associated with equity rather
than debt and there is no explicit �nancial market structure in the model. In the standard
GTAP model the "global trust" collects the savings of all the regional households and
allocates it on their behalf to capital investment. Capital markets clear globally, and
capital is assumed to be internationally mobile.
For the speci�cation of the supply of FDI we use the same constant elasticity of
transformation (CET) function as in Petri (1997). The capital owner's goal is to maximize
net wealth subject to diversi�cation constraints. Total wealth is distributed across sectors
and regions as a function of relative rates of return subject to the diversi�cation constraints
imposed by a CET function. Total supply of capital in region r is then allocated to
11
domestic/foreign regions and sectors based on a constant elasticity function determined
by relative rates of return. Average rate of return is a weighted sum of rates of return
on assets across destinations. Rates of return are the ratio between the rental price of
capital and the price of capital goods. Note that we do not represent explicit dynamics
as this speci�cation would imply intrinsic dynamics of savings and capital accumulation.
McDougall (1993) derives accumulation equations that express end-of-period wealth as a
function of the saving ratio, real income and prices.
3.2 Foreign commercial presence
The traditional Armington assumption used in most CGE models to specify international
trade �ows implies that products are di�erentiated only by the country of production.
When considering the speci�cation of FDI, however, the distinction between �rm loca-
tion and �rm ownership becomes important. The novelty in our speci�cation of foreign
commercial presence lies in that we move away from the representative �rm assumption
as we are able to explicitly represent �rms di�erentiated by the region of ownership that
use di�erent production technologies in producing a good.
3.2.1 The structure of aggregate demand
In the standard GTAP model, economic agents such as consumers, producers and gov-
ernment allocate expenditure between domestically produced and imported goods. The
sourcing of imports occurs at the border. In the FDI version of the model, demand
is more complex as it is complemented with an additional level of nesting representing
the country of ownership. Suppose Figure 1 describes the structure of U.S. aggregate
demand for retail services. In a �rst stage, �rms and consumers allocate expenditure
between domestically produced and imported retail services. Then, in a second stage
(at the border), expenditure on imported cars is allocated across varieties produced by
each trading partner. Finally, imported cars are allocated across ownership categories to
various multinationals.
12

3.2.2 The structure of supply
Compared with the standard GTAP model where in a given region and sector there is one
representative �rm that produces a single consumption good, in the GTAP model with
FDI we di�erentiate between domestic �rms and foreign owned a�liates of multinational
companies that produce a composite consumption good. As represented in Figure 2,
for instance domestic supply of retail services in the US is a composite output of both
domestic (Wal-Mart and Amazon) and foreign owned �rms located in the US. Foreign
owned �rms located in the US are further di�erentiated by the country of ownership
(a�liates of Japanese MNCs such as Uniqlo, a�liates of British MNCs such as Topshop
or Marks&Spencer etc. that operate in the US). Further, each of these �rms combine
value added and intermediate inputs using a Leontief technology to produce a good.
Our proposed speci�cation implies that intermediate inputs (just as �nal demand) are
di�erentiated not only by the regions of �rm location, but also by the region of �rm
ownership.
From a modeling point of view, this implies the following modi�cations to the speci�-
cation of the supply side. Instead of one representative �rm that produces a commodity
i combining intermediate inputs and value added, in this speci�cation total output is
a composite of the output of domestic and foreign a�liate �rms. Further, the output
of foreign a�liates in region r is a composite of the output of di�erent �rms owned by
di�erent regions s. Firms' technology di�er by value added intensity.
4 Data Sources
Overall, the speci�cation of FDI described here requires the following data:
• capital stocks disaggregated by region of ownership/location and sector
• cost and sales structure of domestic �rms and foreign a�liates
Bilateral and sector speci�c FDI stocks data is available at the GTAP sector/region
aggregation (Boumellassa et al., 2007). Data on the cost and sales structure of foreign
13
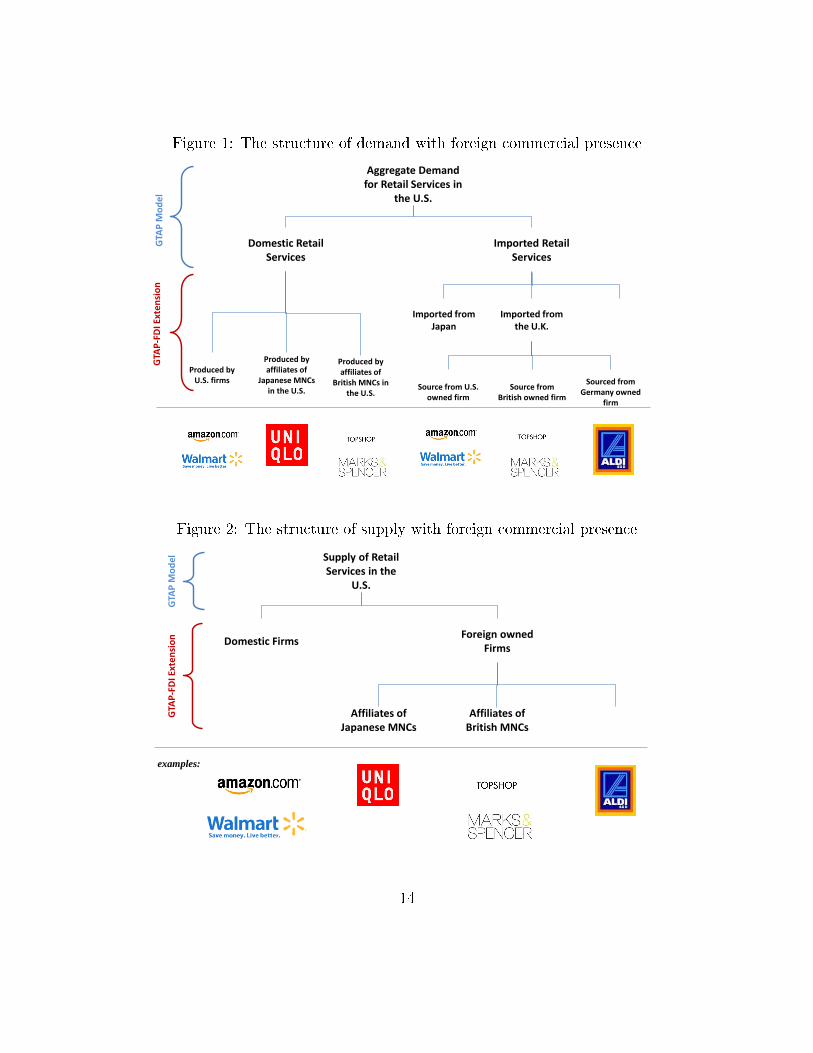
Figure 1: The structure of demand with foreign commercial presence
1
Aggregate Demand for Retail Services in
the U.S.
Imported Retail Services
Domestic Retail Services
Imported from Japan
Imported from the U.K.
Produced by U.S. firms
Produced by affiliates of
Japanese MNCs in the U.S.
Produced by affiliates of
British MNCs in the U.S.
Source from U.S. owned firm
Source from British owned firm
Sourced from Germany owned
firm
GTA
P M
od
el
GTA
P-F
DI E
xte
nsi
on
Figure 2: The structure of supply with foreign commercial presence
Supply of Retail Services in the
U.S.
Foreign owned Firms
Domestic Firms
Affiliates of Japanese MNCs
Affiliates of British MNCs
GTA
P M
od
el
GTA
P-F
DI E
xte
nsi
on
examples:
14

a�liates originates from (Fukui and Lakatos, 2012).
The lack of available data on the activities of foreign a�liates has often compelled
researchers to use FDI data as a proxy for foreign a�liate operations data. Many ex-
isting CGE studies use FDI stocks/�ows data to infer structural information about the
production characteristics of foreign �rms as well as their sales patterns. Nevertheless,
as pointed out in Beugelsdijk et al. (2010), FDI stocks are a biased measure of FAS as
the degree to which they over- or underestimate the activity of multinational varies with
host-country characteristics. More speci�cally, FDI statistics measure only movements
of capital between direct investors and their a�liates, and not funds from una�liated
persons. This can lead to an underestimation of the activity of foreign a�liate activity
in countries with well-developed �nancial markets. In addition, FDI in countries that
are tax havens generate no actual productive activity - leading to an overestimation of
the activity of foreign a�liates in these countries. Finally, variation in labor productivity
across countries leads to an overestimation of a�liate activity in countries where labor is
more productive and underestimation where labor is relatively less productive.
The data collection/estimation and building e�orts with respect to the activities and
technology used of foreign a�liates by Fukui and Lakatos (2012) now allows us to sig-
ni�cantly improve on existing modelling speci�cations of MNCs in CGE. As a result, we
now produce a GTAP database that is disaggregated to include not only capital stocks
disaggregated by industry, host and source country but also domestic and foreign �rms
disaggregated by region of ownership and use heterogeneous production technologies.
In the next sections, we provide further details about the structure of the data used to
disaggregate the GTAP database at the level of aggregation chosen for our simulations.
4.1 FDI stocks data
FDI data documented in Boumellassa et al. (2007) is used to disaggregate capital stocks
by industry, host and source country in the GTAP database.
A closer look at the data reveals interesting �ndings. As illustrated in Table 1, ag-
gregate world FDI stocks amounted to $12.4 trillion in 2004. As a region, the EU27 is
15

the most signi�cant host and source of FDI with 53% and 47%, respectively followed by
the US and the rest of the world. With respect to the distribution sector (Table 2), the
pattern follow that of the global FDI stocks. A sectoral decomposition of the data further
shows that distribution services account for 6.7% of total FDI stocks.
India as a host attracted FDI stocks worth $43 billion but it is not a signi�cant source
of FDI ($10 billion).
Table 1: FDI stocks and turnover of a�liates: a comparative view (USD million)
Total by host Total by source
Turnover FDI stocks Share Turnover FDI stocks Share
USA 3,616,247 2,751,935 0.76 5,522,695 3,215,075 0.58
China 530,903 523,856 0.99 151,551 52,370 0.35
India 157,370 43,103 0.27 54,141 10,084 0.19
East Asia 1,745,425 679,587 0.39 2,277,923 895,024 0.39
ASEAN 1,047,444 318,293 0.30 440,208 127,121 0.29
AusNz 671,009 312,270 0.47 572,950 216,800 0.38
EU27 7,838,070 5,938,146 0.76 8,741,512 6,685,702 0.76
ROW 5,686,533 1,866,477 0.33 3,532,020 1,231,493 0.35
Total 21,293,000 12,433,667 0.58 21,293,000 12,433,668 0.58
Source: Boumellassa et al. (2007) and Fukui and Lakatos (2012). FDI stocks data re�ect 2004 values,
while turnover data are averages for the period 2004-2007
16
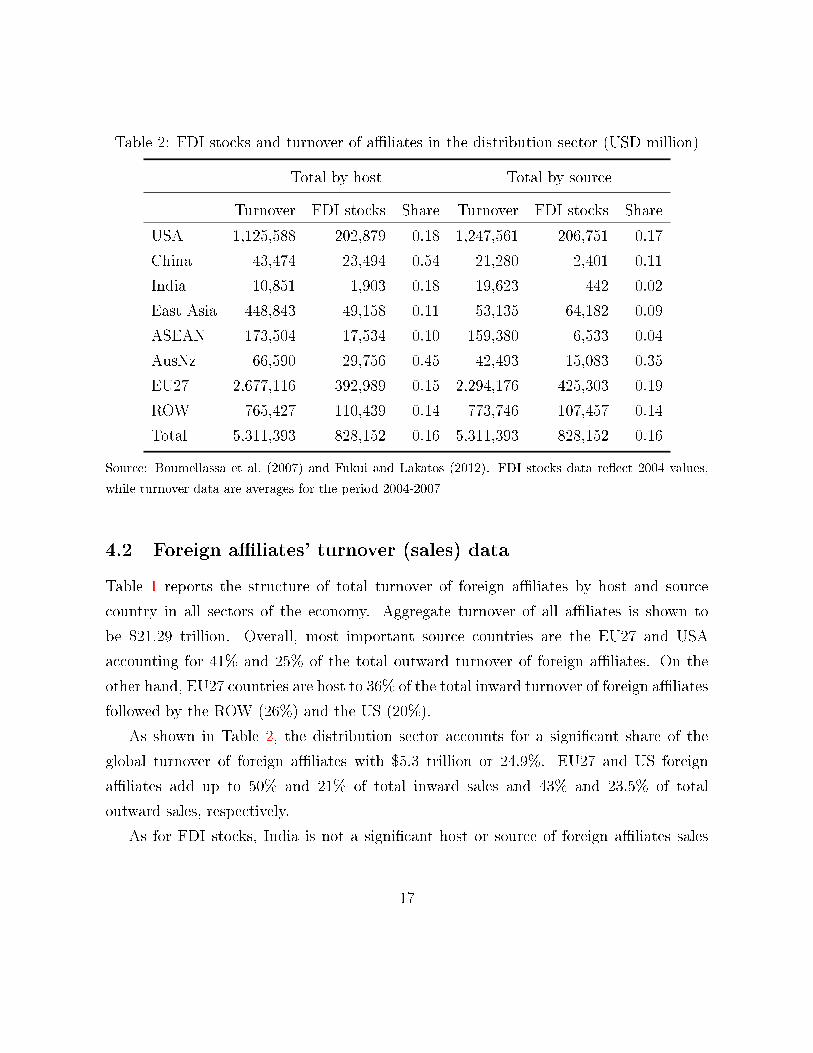
Table 2: FDI stocks and turnover of a�liates in the distribution sector (USD million)
Total by host Total by source
Turnover FDI stocks Share Turnover FDI stocks Share
USA 1,125,588 202,879 0.18 1,247,561 206,751 0.17
China 43,474 23,494 0.54 21,280 2,401 0.11
India 10,851 1,903 0.18 19,623 442 0.02
East Asia 448,843 49,158 0.11 53,135 64,182 0.09
ASEAN 173,504 17,534 0.10 159,380 6,533 0.04
AusNz 66,590 29,756 0.45 42,493 15,083 0.35
EU27 2,677,116 392,989 0.15 2,294,176 425,303 0.19
ROW 765,427 110,439 0.14 773,746 107,457 0.14
Total 5,311,393 828,152 0.16 5,311,393 828,152 0.16
Source: Boumellassa et al. (2007) and Fukui and Lakatos (2012). FDI stocks data re�ect 2004 values,
while turnover data are averages for the period 2004-2007
4.2 Foreign a�liates' turnover (sales) data
Table 1 reports the structure of total turnover of foreign a�liates by host and source
country in all sectors of the economy. Aggregate turnover of all a�liates is shown to
be $21.29 trillion. Overall, most important source countries are the EU27 and USA
accounting for 41% and 25% of the total outward turnover of foreign a�liates. On the
other hand, EU27 countries are host to 36% of the total inward turnover of foreign a�liates
followed by the ROW (26%) and the US (20%).
As shown in Table 2, the distribution sector accounts for a signi�cant share of the
global turnover of foreign a�liates with $5.3 trillion or 24.9%. EU27 and US foreign
a�liates add up to 50% and 21% of total inward sales and 43% and 23.5% of total
outward sales, respectively.
As for FDI stocks, India is not a signi�cant host or source of foreign a�liates sales
17

in the global economy. Further, we �nd that distribution only accounts for only 6% of
total inward a�liate sales in India - signi�cantly below the world average of 24.9%. This
�nding points toward the fact that India is among the most highly protected economies
in distribution services in the world only topped by Tunisia, Jordan and Indonesia (see
Figure 3).
4.3 Foreign a�liates value added data
Apart from using a�liates' sales data to disaggregate production and sales in the GTAP
database, we also use information about labour and capital shares in order to make
inferences about the production technology of foreign a�liates.
The construction of the value added database in described in detail in Fukui and
Lakatos (2012). The database provides information about labour (and implicitly capital)
shares in total value added by industry, host and source country. As illustrated in Table
3 for instance, the share of labour in total value added varies signi�cantly by host and
source country in the distribution sector ranging from 31% for ASEAN's a�liates located
in EU27 countries to 72% for Australia and New Zealand's a�liates located in ASEAN
countries.
Representing heterogeneous production technologies for foreign a�liates is a novel
approach that is �rst employed in this paper (as far as we are aware) and is a signi�cant
improvement on the existing modelling techniques.
18
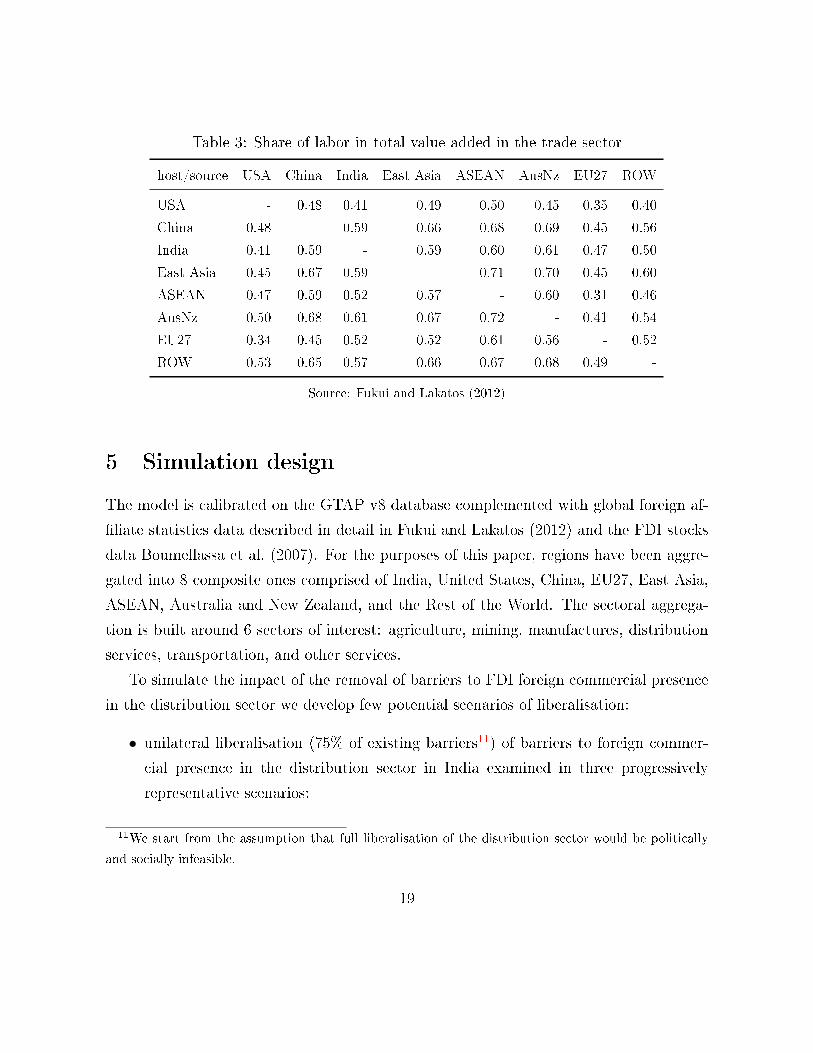
Table 3: Share of labor in total value added in the trade sector
host/source USA China India East Asia ASEAN AusNz EU27 ROW
USA - 0.48 0.41 0.49 0.50 0.45 0.35 0.40
China 0.48 - 0.59 0.66 0.68 0.69 0.45 0.56
India 0.41 0.59 - 0.59 0.60 0.61 0.47 0.50
East Asia 0.45 0.67 0.59 - 0.71 0.70 0.45 0.60
ASEAN 0.47 0.59 0.52 0.57 - 0.60 0.31 0.46
AusNz 0.50 0.68 0.61 0.67 0.72 - 0.41 0.54
EU27 0.34 0.45 0.52 0.52 0.61 0.56 - 0.52
ROW 0.53 0.65 0.57 0.66 0.67 0.68 0.49 -
Source: Fukui and Lakatos (2012)
5 Simulation design
The model is calibrated on the GTAP v8 database complemented with global foreign af-
�liate statistics data described in detail in Fukui and Lakatos (2012) and the FDI stocks
data Boumellassa et al. (2007). For the purposes of this paper, regions have been aggre-
gated into 8 composite ones comprised of India, United States, China, EU27, East Asia,
ASEAN, Australia and New Zealand, and the Rest of the World. The sectoral aggrega-
tion is built around 6 sectors of interest: agriculture, mining, manufactures, distribution
services, transportation, and other services.
To simulate the impact of the removal of barriers to FDI foreign commercial presence
in the distribution sector we develop few potential scenarios of liberalisation:
• unilateral liberalisation (75% of existing barriers11) of barriers to foreign commer-
cial presence in the distribution sector in India examined in three progressively
representative scenarios:
11We start from the assumption that full liberalisation of the distribution sector would be politically
and socially infeasible.
19
� Scenario 1a (S1a): unilateral liberalisation of barriers to foreign commercial
presence in the distribution sector in India;
� Scenario 1b (S1b): S1a + an accompanying productivity spillover to the
domestic distribution sector in India;
� Scenario 1c (S1c): S1b + an associated productivity gain in upstream sup-
plying industries (agriculture) in India;
• multilateral liberalisation (75% of existing barriers) of barriers to foreign commercial
presence in the distribution sector worldwide: Scenario 2 (S2).
5.1 The nature of barriers to FDI and MNCs
While restrictions on the international movement of capital and operations of multina-
tional companies have been declining over the years, there are still signi�cant barriers
that remain.
Internationally, FDI is mostly regulated by an extensive web of preferential investment
treaties: as of 2010 the number of international investment agreements (IIA) reached a
total of 6,092, among which there were 2,807 bilateral investment treaties (BITs), 2,976
double taxation treaties (DTTs) and 309 free trade agreements (FTAs) with provision
with respect to liberalisation of FDI (UNCTAD, 2011).
Based on the classi�cation developed by UNCTAD (1996) we distinguish three broad
categories of measures that have an impact on foreign investment and the operations of
MNCs:
• measures relating to entry and establishment such as closing certain sectors to FDI;
minimum capital requirements; screening, authorisation and registration of invest-
ment or restrictions on forms of entry (mergers and acquisitions might not be al-
lowed) etc.
• measures relating to the ownership and control would include barriers such as re-
strictions on foreign ownership; compulsory joint ventures; restrictions on foreign
shareholders' rights; restrictions on the licensing of foreign technology etc.
20
• measures relating to ongoing operations of multinational companies such as restric-
tions on employment of foreign personnel, restrictions on imports of capital goods;
rules of origin; ceilings on royalties and technical assistance fees etc.
As suggested by the examples above, most of the restrictions are of NTM (non-tari�
measure) type and thus in comparison with restrictions on trade �ows they are di�cult
to quantify. FDI restrictiveness indexes are among the most common measures that are
used to summarise the overall (relative) restrictiveness of a given sector and/or economy.
In this paper, our starting point for quantifying the impact of barriers to FDI and
MNCs is the FDI restrictiveness index developed by OECD (Kalinova et al., 2010). The
database provides information on the relative restrictiveness of OECD and other G20
countries decomposed by sector. Individual measures are scored based on their degree of
restrictiveness and weighted. The four types of measures covered by OECD's FDI Restric-
tiveness Index are foreign equity restrictions, screening and prior approval requirements,
rules for key personnel and other restrictions.
As shown in Figure 3 the countries with the highest FDI restrictiveness index in dis-
tribution services are Tunisia (0.625), Jordan (0.56), Indonesia (0.435) and India (0.394).
On the other extreme, there are numerous countries that are shown to have no restrictions
on FDI in retail and wholesale among which there are 19 EU countries, United States,
Chile, Argentina, Egypt and Morocco.
21

Figure 3: FDI Restrictiveness Index in Distribution Services
ArgentinaAustria
ChileColombia
CzechRepublicDenmark
EgyptEstoniaFrance
GermanyGreece
HungaryIreland
ItalyJapanKorea
LuxembourgMorocco
NetherlandsNorwayPoland
PortugalRomania
SlovakRepublicSlovenia
SpainSweden
SwitzerlandTurkey
UnitedStatesFinland
LithuaniaSouthAfrica
LatviaIsrael
BelgiumUnitedKingdom
BrazilKyrgyzRepublic
KazakhstanPeru
RussiaAustraliaMongoliaCanadaIcelandUkraineMexico
NewZealandSaudiArabia
ChinaIndia
IndonesiaJordanTunisia
0.0 0.2 0.4 0.6
●●
●●
●●
●●
●●
●●●
●●●
●●
●●
●●
●●
●
●●
●●
●●●●●●●●●●
●●●●
●●●●●●●
●
●
●
●
●
Source: OECD
22
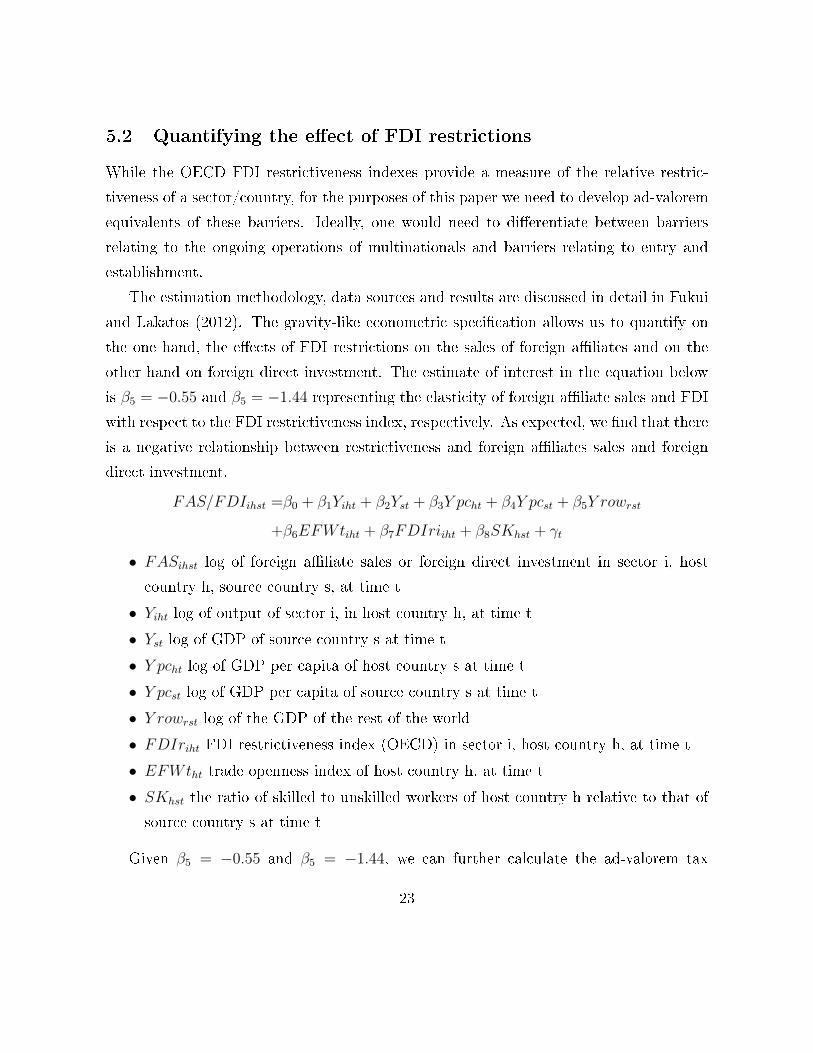
5.2 Quantifying the e�ect of FDI restrictions
While the OECD FDI restrictiveness indexes provide a measure of the relative restric-
tiveness of a sector/country, for the purposes of this paper we need to develop ad-valorem
equivalents of these barriers. Ideally, one would need to di�erentiate between barriers
relating to the ongoing operations of multinationals and barriers relating to entry and
establishment.
The estimation methodology, data sources and results are discussed in detail in Fukui
and Lakatos (2012). The gravity-like econometric speci�cation allows us to quantify on
the one hand, the e�ects of FDI restrictions on the sales of foreign a�liates and on the
other hand on foreign direct investment. The estimate of interest in the equation below
is β5 = −0.55 and β5 = −1.44 representing the elasticity of foreign a�liate sales and FDI
with respect to the FDI restrictiveness index, respectively. As expected, we �nd that there
is a negative relationship between restrictiveness and foreign a�liates sales and foreign
direct investment.
FAS/FDIihst =β0 + β1Yiht + β2Yst + β3Y pcht + β4Y pcst + β5Y rowrst
+β6EFWtiht + β7FDIriiht + β8SKhst + γt
• FASihst log of foreign a�liate sales or foreign direct investment in sector i, host
country h, source country s, at time t
• Yiht log of output of sector i, in host country h, at time t
• Yst log of GDP of source country s at time t
• Y pcht log of GDP per capita of host country s at time t
• Y pcst log of GDP per capita of source country s at time t
• Y rowrst log of the GDP of the rest of the world
• FDIriht FDI restrictiveness index (OECD) in sector i, host country h, at time t
• EFWtht trade openness index of host country h, at time t
• SKhst the ratio of skilled to unskilled workers of host country h relative to that of
source country s at time t
Given β5 = −0.55 and β5 = −1.44, we can further calculate the ad-valorem tax
23

equivalents of barriers to FDI on foreign a�liate sales and FDI, respectively. Results are
reported in detail in Table 4. We �nd for instance that full liberalisation of barriers to
FDI would lead to a 21.67% increase in the sales of foreign a�liates and a 56.91% increase
in FDI in India.
Table 4: Tax equivalents of barriers in the distribution sector
OECD Authors' estimates
Index % Sales % FDI
USA 0 0 0
China 0.238 13.09% 34.38%
India 0.394 21.67% 56.91%
East Asia 0.087 4.79% 12.57%
ASEAN 0.158 8.68% 22.82%
AusNz 0.099 5.43% 14.30%
EU27 0.013 0.71% 1.88%
ROW 0.075 4.15% 10.83%
Source: OECD and authors' own calculations
6 Economy wide impacts of the liberalisation of the
distribution sector
The distribution sector plays an crucial role in the economy with strong intra- and inter-
industry linkages both upstream and downstream. Overall, it accounts for 9% of total
world output, 11% of consumer spending and 11% of total sectoral value added (see
Table 5). In India, the importance of the distribution sector is even more pronounced
than the world average with 10% ($227 billion) and 14% ($100 billion) of total output and
consumer spending, respectively and 14% of sectoral value added. As such, any policy
measure that directly impacts the functioning of the distribution sector will trickle down
24

to consumers, suppliers upstream and downstream and internationally through trade �ows
and commercial presence.
Table 5: An overview of distribution sector (USD billion, 2007)
Output Share Exports Share Value added Share Consumption Share
USA 2895 12% 17 1.2% 1693 13% 1592 16%
China 450 5% 22 1.8% 219 7% 153 13%
India 227 10% 3 1.1% 161 14% 100 14%
East Asia 1438 12% 77 4.8% 830 15% 725 22%
ASEAN 309 11% 18 2.1% 171 14% 120 18%
AusNz 253 13% 7 3.3% 109 13% 135 27%
EU27 2580 8% 130 2.2% 1118 7% 1780 20%
ROW 2071 10% 38 1.1% 1310 13% 1017 16%
World 10224 9% 311 2% 5610 11% 5622 18%
Source: GTAP v8 database
It is important to note that the distribution sector relies heavily on establishing com-
mercial presence abroad as mode of delivering services to international markets. As a
result, it is not surprising to �nd that the share of exports of distribution services in
total trade is not signi�cant (2% world average). The global database on foreign a�liate
sales (Fukui and Lakatos, 2012) allows us to further decompose the regional and sectoral
distribution of foreign a�liates worldwide. We �nd that distribution services account for
25% of global foreign a�liate sales ($5.3 trillion) with 34% in EU27 countries, 31% in
the United States. In India, due to prohibitive barriers to entry foreign a�liate sales in
distribution are only 6% of total while manufacturing and other services are important
destination sectors for foreign a�liates.
Table 6 reports the share of foreign a�liates in each host country for distribution
services and all sectors of the economy. As expected, the regional distribution of source
countries is quite concentrated in favour of EU27 and US. For instance, we �nd that in
distribution services US and EU27 a�liates capture 99% of the Indian market with 69%
25
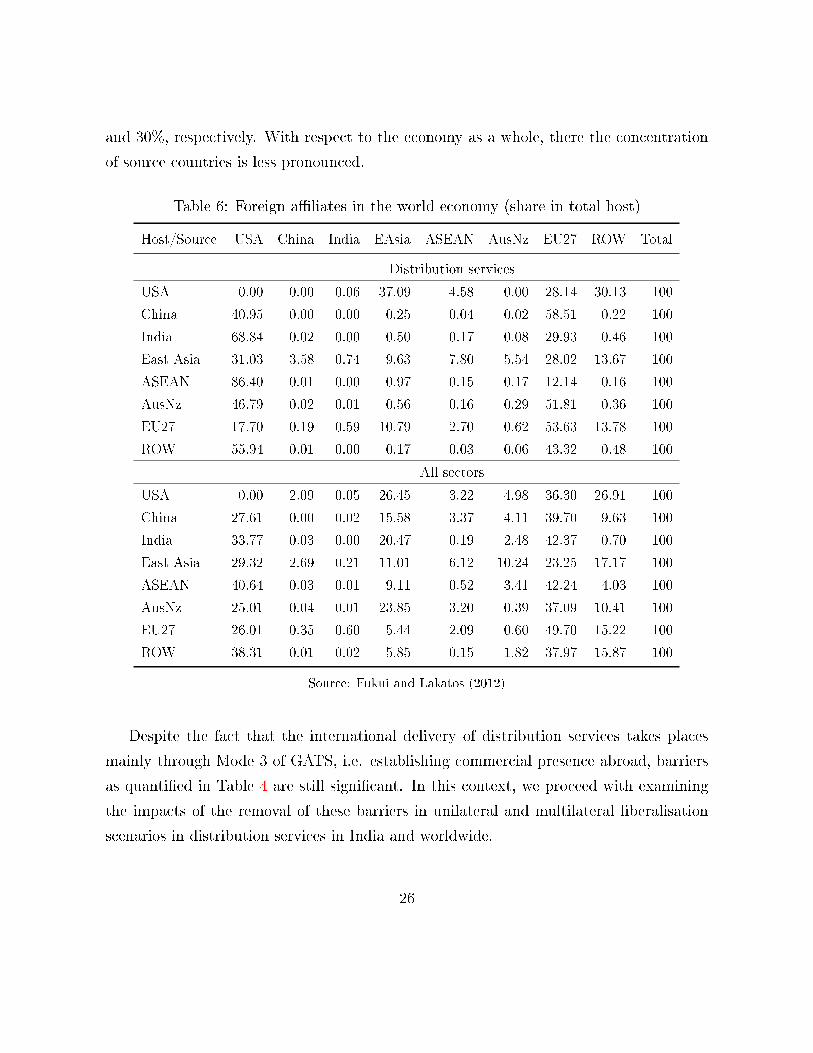
and 30%, respectively. With respect to the economy as a whole, there the concentration
of source countries is less pronounced.
Table 6: Foreign a�liates in the world economy (share in total host)
Host/Source USA China India EAsia ASEAN AusNz EU27 ROW Total
Distribution services
USA 0.00 0.00 0.06 37.09 4.58 0.00 28.14 30.13 100
China 40.95 0.00 0.00 0.25 0.04 0.02 58.51 0.22 100
India 68.84 0.02 0.00 0.50 0.17 0.08 29.93 0.46 100
East Asia 31.03 3.58 0.74 9.63 7.80 5.54 28.02 13.67 100
ASEAN 86.40 0.01 0.00 0.97 0.15 0.17 12.14 0.16 100
AusNz 46.79 0.02 0.01 0.56 0.16 0.29 51.81 0.36 100
EU27 17.70 0.19 0.59 10.79 2.70 0.62 53.63 13.78 100
ROW 55.94 0.01 0.00 0.17 0.03 0.06 43.32 0.48 100
All sectors
USA 0.00 2.09 0.05 26.45 3.22 4.98 36.30 26.91 100
China 27.61 0.00 0.02 15.58 3.37 4.11 39.70 9.63 100
India 33.77 0.03 0.00 20.47 0.19 2.48 42.37 0.70 100
East Asia 29.32 2.69 0.21 11.01 6.12 10.24 23.25 17.17 100
ASEAN 40.64 0.03 0.01 9.11 0.52 3.41 42.24 4.03 100
AusNz 25.01 0.04 0.01 23.85 3.20 0.39 37.09 10.41 100
EU27 26.01 0.35 0.60 5.44 2.09 0.60 49.70 15.22 100
ROW 38.31 0.01 0.02 5.85 0.15 1.82 37.97 15.87 100
Source: Fukui and Lakatos (2012)
Despite the fact that the international delivery of distribution services takes places
mainly through Mode 3 of GATS, i.e. establishing commercial presence abroad, barriers
as quanti�ed in Table 4 are still signi�cant. In this context, we proceed with examining
the impacts of the removal of these barriers in unilateral and multilateral liberalisation
scenarios in distribution services in India and worldwide.
26

6.1 Unilateral liberalisation of distribution services in India
Despite the recent controversy about opening up the distribution sector to foreign retailers,
there is political will that remains in favour of pushing through the reforms in India.
The present section describes the impacts of unilateral liberalisation of the distribution
sector in following three progressive scenarios:
• scenario 1a (S1a): removal of 75% of existing barriers to foreign commercial presence
in the distribution sector in India;
• scenario 1b (S1b): S1a + 3.8% productivity growth in the domestic distribution
industry in India;
• scenario 1c (S1c): S1b + 3.8% productivity growth in agriculture in India
In scenarios S1b and S1c we consider additional productivity spillovers in the domestic
Indian retailing industry and upstream food supplying sectors in order to provide a more
holistic impact assessment of the associated results of liberalisation not explicitly consid-
ered in our existing CGE framework. The productivity spillovers considered here are in
line with existing research that has shown that FDI and the presence of multinationals
are sources of positive productivity spillovers for domestic economies. More speci�cally,
Javorcik and Li (2008) �nd that the presence of foreign chains in the retail industry in Ro-
mania increases total factor productivity (TFP) of food supplying sectors by 3.8-4.7%. In
addition, there is evidence that foreign direct investment leads to productivity spillovers
in upstream and downstream industries but also increases the productivity of domestic
�rms in the same sector (Javorcik, 2004).
As a �rst step, we consider the changes in output in distribution services and agri-
culture as a result of unilateral liberalisation across di�erent scenarios as shown in Table
7. Note that foreign a�liates of di�erent countries have di�erentiated responses even if
the degree of liberalisation is assumed to be homogeneous for each source country, i.e.
we assume that barriers are in line with MFN treatment. The output of domestically
owned distribution �rms in India decreases by -1.6% while the output of foreign a�liates
expand by 65.46%. Other sectors such as agriculture and transport services bene�t from
27

the overall expansion of distribution services. In scenario S1b, as a result of the produc-
tivity spillover to domestically owned distribution sector, we �nd an increase in output of
Indian owned distribution services by 0.18% while the output of foreign a�liates increases
by slightly less (53.73%) than in the previous scenario. Finally, the productivity increase
simulated in scenario S1c in agriculture results not only in the growth in output of this
sector but also an additional expansion of the domestically owned distribution sector in
India. Also, note that the mining sector in India is the only one that su�ers as a result
of the liberalization of FDI in distribution services and contracts systematically across all
scenarios.
Table 7: Unilateral liberalisation: output in India (% change)
Domestic output Foreign a�liates
S1a S1b S1c S1a S1b S1c
Agriculture 0.12 0.45 2.05 0.13 0.47 1.89
Mining -0.05 -0.26 -0.40 -0.06 -0.39 -0.79
Manufactures 0.16 0.68 1.48 0.14 0.64 1.41
Distribution -1.60 0.18 0.81 65.46 53.73 54.82
Transport 0.16 0.58 1.07 0.11 0.46 0.97
Other services 0.12 0.45 0.71 0.10 0.45 0.82
Source: Authors' simulations
We proceed with the analysis of unilateral liberalisation on consumers in India as
depicted in Figures 4 and 5. As output in the distribution sector expands, consumers reap
the bene�ts of liberalisation through increased consumption and lower prices. As a result
of the reduction of barriers to FDI and activities of MNCs, consumer prices of distribution
services fall by -0.89% in India. Furthermore, as we simulate the impact of additional
productivity spillovers in the domestically owned distribution sector, consumption in India
increases by 2.51% while average consumer prices in the distribution sector fall by -
4.61%. Given that the distribution sector has important inter-industry linkages across
28

the economy, other sectors also bene�t from the liberalisation and the spillovers. Finally,
in scenario S1c we �nd that agricultural consumer prices fall by -4.35% and consumption
increases by 2.21%.
Liberalisation has an impact on investment in India through the price of capital goods
and the rental price of capital. As di�erent foreign a�liates expand their output in sce-
nario S1a, overall foreign direct investment in the distribution sector in India expands by
120.28% and at the same time domestic investment falls by -3.14% as Indian distributors
become less competitive.
Table 8: Unilateral liberalisation: investment in India (% changes)
Domestic investment Foreign investment
S1a S1b S1c S1a S1b S1c
Agriculture 0.34 1.28 -2.49 0.39 1.40 -3.20
Mining 0.02 -0.03 -0.24 0.01 -0.40 -1.38
Manufactures 0.30 1.39 2.84 0.31 1.45 2.97
Distribution -3.14 -4.83 -3.67 120.28 89.90 92.56
Transport 0.24 1.11 2.19 0.27 1.24 2.47
Other services 0.24 1.05 1.85 0.20 0.96 1.77
Source: Authors' simulations
In terms of aggregate impacts on the economy as a whole (see Figure 6) India's GDP
is expected to increase by 0.16% in scenario S1a and more signi�cantly by 1.71% in S1c,
largely due to the productivity improvements in agriculture and distribution the distri-
bution sector make up approximately 10% and 11.4% of India's economy, respectively.
Finally, consumers bene�t from a general reduction in the level of consumer prices rein-
forced by the increase in wages.
29
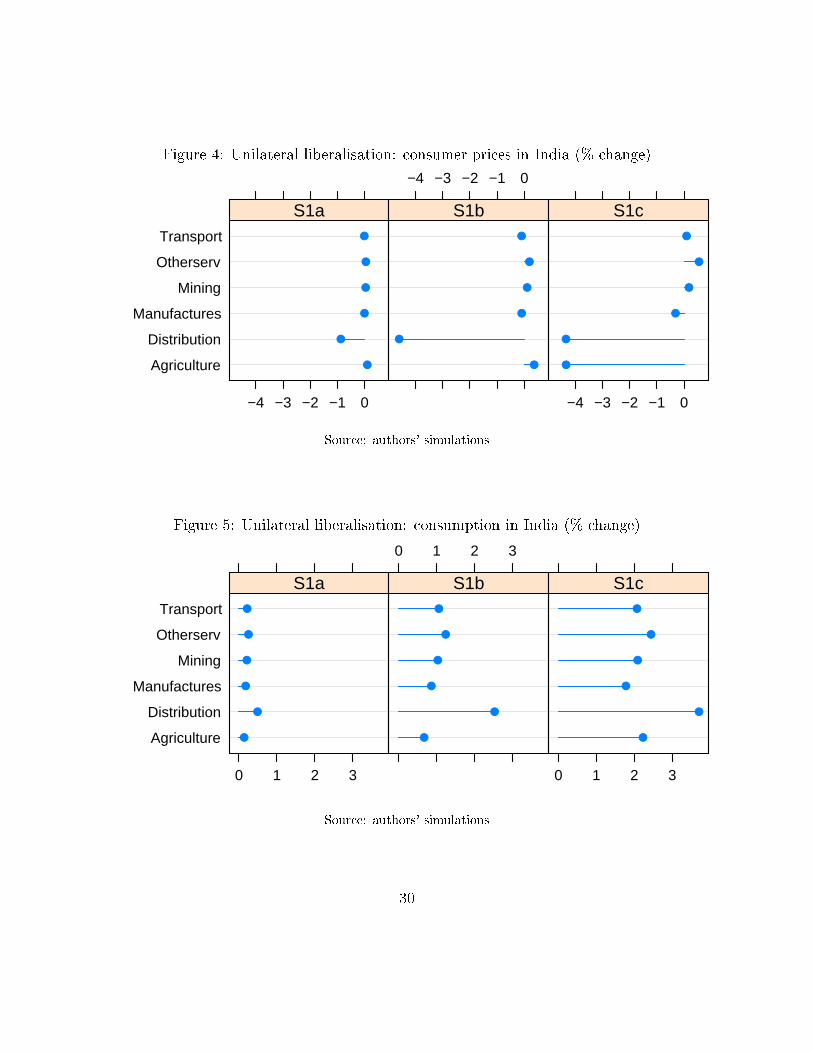
Figure 4: Unilateral liberalisation: consumer prices in India (% change)
Agriculture
Distribution
Manufactures
Mining
Otherserv
Transport
−4 −3 −2 −1 0
●
●
●
●
●
●
S1a
−4 −3 −2 −1 0
●
●
●
●
●
●
S1b
−4 −3 −2 −1 0
●
●
●
●
●
●
S1c
Source: authors' simulations
Figure 5: Unilateral liberalisation: consumption in India (% change)
Agriculture
Distribution
Manufactures
Mining
Otherserv
Transport
0 1 2 3
●
●
●
●
●
●
S1a
0 1 2 3
●
●
●
●
●
●
S1b
0 1 2 3
●
●
●
●
●
●
S1c
Source: authors' simulations
30

Figure 6: Unilateral liberalisation: macro indicators India (% change)
S1a
S1b
S1c
−0.8 −0.6 −0.4 −0.2 0.0
●
●
●
Consumerprice
S1a
S1b
S1c
0.0 0.5 1.0 1.5
●
●
●
RealGDP
S1a
S1b
S1c
0.0 0.5 1.0 1.5 2.0 2.5
●
●
●
RealWages
Source: authors' simulations
6.2 Multilateral liberalisation of distribution services
The multilateral liberalisation of services trade, including that of distribution services,
is internationally regulated by the General Agreement on Trade in Services (GATS) ne-
gotiations that began in 2000. Distribution services attracted a relatively low level of
commitments from 68 WTO member countries and there are still some product exclu-
sions and exemptions from MFN (Most Favored Nation) that remain (WTO, 2010). India
and other WTO members that still impose signi�cant barriers to distribution services did
not take any commitments in this sector.
In this section, we consider the multilateral removal of 75% barriers to distribution
services worldwide.
We �rst consider the impacts of multilateral liberalisation on output by sectors and
countries presented in Table 9. The changes in the output of distribution services is as
expected: countries with the highest initial barriers gain competitiveness and expand their
output the most. Given that in the US barriers to establishing foreign commercial presence
in distribution services are assumed to be zero, we �nd that output of distribution services
31

slightly declines as both domestic producers and foreign a�liates become less competitive.
Furthermore, we note that given the importance of backward and forward linkages of the
distribution sector with the rest of the economy, we �nd that other sectors bene�t from
an expanding distribution sector.
Table 9: Multilateral liberalisation: output (% changes)
Agric Mining Manuf Distrib Transport Other serv
USA 0.06 0.15 0.01 -0.02 0.01 0.00
China 0.18 0.17 0.15 1.10 0.20 0.22
India 0.13 0.12 0.16 0.32 0.17 0.12
East Asia 0.06 0.24 0.07 0.00 0.08 0.03
ASEAN 0.13 -0.02 0.25 1.11 0.40 0.36
AusNz -0.02 -0.26 0.00 0.64 0.13 0.26
EU27 0.04 0.16 0.03 -0.02 0.04 0.01
ROW 0.13 0.10 0.15 0.11 0.16 0.17
Source: Authors' simulations
Changes in domestic and foreign investment by host and sector are depicted in Table
10. As expected, the distribution sector attracts foreign direct investment as result of the
multilateral liberalisation of the sector while domestic investment in this sector declines.
For instance, FDI in India increases the most by 120%, followed by China (71.6%) and
ASEAN (36.7%). As FDI �ows surge, domestic investment is expected to decline by -3.2%
in India, -4.82% in ASEAN and -9.07% in China. Finally, other sectors also bene�t from
the multilateral liberalisation of distribution services and are expected to attract more
FDI.
32

Table 10: Multilateral liberalisation: investment by host and sector (% changes)
Host/Sector Agric Mining Manuf Distrib Transp OServ
Domestic investment
USA 0.04 0.20 -0.07 -0.10 -0.07 -0.08
China 0.40 0.39 0.23 -9.07 0.29 0.29
India 0.31 0.31 0.24 -3.25 0.19 0.18
East Asia 0.14 0.47 0.07 -0.53 0.05 0.02
ASEAN 0.71 0.40 0.66 -4.82 0.83 0.76
AusNz 0.80 0.36 0.57 -2.96 0.63 0.87
EU27 0.03 0.25 -0.03 -0.56 -0.02 -0.05
ROW 0.34 0.28 0.25 -3.09 0.21 0.23
Foreign direct investment
USA 0.06 0.35 -0.07 -0.10 -0.07 -0.08
China 0.38 0.76 0.21 71.60 0.25 0.31
India 0.37 0.50 0.32 120.08 0.21 0.14
East Asia 0.19 0.61 0.10 23.37 0.11 0.03
ASEAN 0.86 1.45 0.71 36.79 0.48 0.77
AusNz 0.97 0.75 0.57 24.62 0.67 0.86
EU27 0.01 0.49 -0.05 2.90 -0.02 -0.04
ROW 0.31 0.57 0.19 18.60 0.17 0.25
Source: Authors' simulations
We conclude our analysis with examining the impacts of the multilateral liberalisa-
tion of the distribution sector on macroeconomic aggregates (see Figure 7). All countries
experience a real GDP growth, however the magnitude of changes is small. These small
impacts are expected given that foreign ownership in the distribution sector is still rela-
tively small across the liberalising countries ranging from 30% in ASEAN countries, 13%
in China to 10% in EU27 and US and 8% in East Asian countries. Thus, we �nd that
33
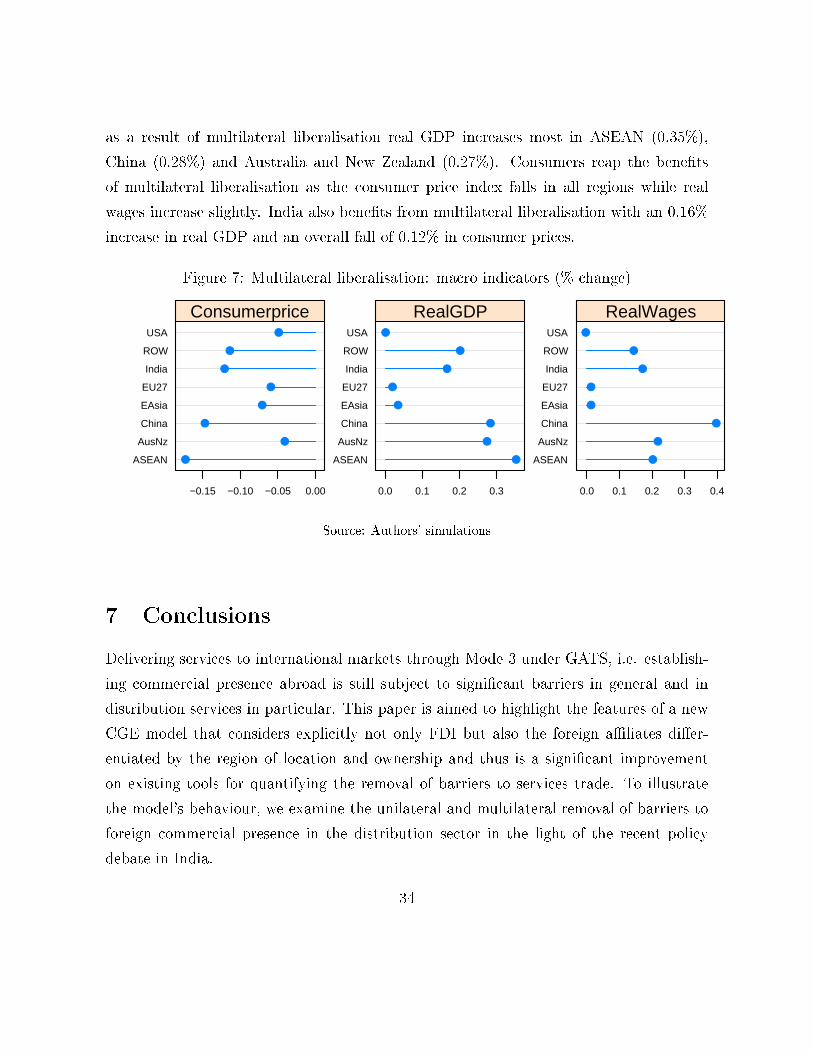
as a result of multilateral liberalisation real GDP increases most in ASEAN (0.35%),
China (0.28%) and Australia and New Zealand (0.27%). Consumers reap the bene�ts
of multilateral liberalisation as the consumer price index falls in all regions while real
wages increase slightly. India also bene�ts from multilateral liberalisation with an 0.16%
increase in real GDP and an overall fall of 0.12% in consumer prices.
Figure 7: Multilateral liberalisation: macro indicators (% change)
ASEAN
AusNz
China
EAsia
EU27
India
ROW
USA
−0.15 −0.10 −0.05 0.00
●
●
●
●
●
●
●
●
Consumerprice
ASEAN
AusNz
China
EAsia
EU27
India
ROW
USA
0.0 0.1 0.2 0.3
●
●
●
●
●
●
●
●
RealGDP
ASEAN
AusNz
China
EAsia
EU27
India
ROW
USA
0.0 0.1 0.2 0.3 0.4
●
●
●
●
●
●
●
●
RealWages
Source: Authors' simulations
7 Conclusions
Delivering services to international markets through Mode 3 under GATS, i.e. establish-
ing commercial presence abroad is still subject to signi�cant barriers in general and in
distribution services in particular. This paper is aimed to highlight the features of a new
CGE model that considers explicitly not only FDI but also the foreign a�liates di�er-
entiated by the region of location and ownership and thus is a signi�cant improvement
on existing tools for quantifying the removal of barriers to services trade. To illustrate
the model's behaviour, we examine the unilateral and multilateral removal of barriers to
foreign commercial presence in the distribution sector in the light of the recent policy
debate in India.
34
References
Aitken, B. and A. Harrison (1999). Do domestic �rms bene�t from direct foreign invest-
ment? evidence from venezuela. American economic review , 605�618.
Alfaro, L., A. Chanda, S. Kalemli-Ozcan, and S. Sayek (2010, March). Does foreign
direct investment promote growth? exploring the role of �nancial markets on linkages.
Journal of Development Economics 91 (2), 242�256.
Alfaro, L. and M. Chen (2012). Selection, reallocation, and knowledge spillover: Identi-
fying the sources of productivity gains from multinational activity. Mimeo.
Bchir, M., Y. Decreux, J. Guérin, and S. Jean (2002). MIRAGE, a Computable General
Equilibrium Model for Trade Policy Analysis. CEPII, Document de travail 17.
Beugelsdijk, S., J. Hennart, A. Slangen, and R. Smeets (2010). Why and How FDI Stocks
are a Biased Measure of MNE A�liate Activity. Journal of International Business
Studies 41 (9), 1444�1459.
Blalock, G. and P. Gertler (2008). Welfare gains from foreign direct investment through
technology transfer to local suppliers. Journal of International Economics 74 (2), 402�
421.
Blonigen, B. and M. Wang (2004). Inappropriate pooling of wealthy and poor countries
in empirical fdi studies. NBER Working Paper 10378 .
Boumellassa, H., C. Gouel, and D. Laborde (2007). A Multisector, Multicountry FDI
database for GTAP. 10th Annual GTAP Conference Paper.
Brown, D. and R. Stern (2001). Measurement and Modeling of the Economic E�ects of
Trade and Investment Barriers in Services. Review of International Economics 9 (2),
262�286.
Chakraborty, C. and P. Nunnenkamp (2008). Economic reforms, fdi, and economic growth
in india: A sector level analysis. World Development 36, 1192�1212.
35
Chand, Ramesh, P. S. A. G. and K. Ganguly (2011). Managing Food In�ation in India.
National Centre for Agricultural Economics and Policy Research.
Chari, A. and T. C. A. M. Raghavan (2012). Foreign Direct Investment in India's Retail
Bazaar: Opportunities and Challenges. The World Economy 35 (1), 79�90.
DIPP (2010). Foreign Direct Investment (FDI) in Multi-Brand Retail Trading. Discussion
paper, Ministry of Commerce and Industry Governement of India.
Fukui, T. and C. Lakatos (2012). A Global Database of Foreign A�liate Activity. GTAP
Research Memorandum Nr.24 .
Hanslow, K., T. Phamduc, and G. Verikios (2000). The Structure of the FTAP Model.
Economic Analysis 27, 30.
Haskel, Jonathan E., S. C. P. and M. J. Slaughter (2007). Does inward foreign direct
investment boost the producitivity of domestic �rms? Review of Economicsand Statis-
tics 89(3), 482�496.
Javorcik, B. (2004). Does foreign direct investment increase the productivity of domestic
�rms? in search of spillovers through backward linkages. The American Economic
Review 94 (3), 605�627.
Javorcik, B. and Y. Li (2008). Do the Biggest Aisles Serve a Brighter Future: Global Retail
Chains and Their Implications for Romania. World Bank Policy Research Working
Paper 4650.
Javorcik, B. and M. Spatareanu (2008). To share or not to share: Does local partici-
pation matter for spillovers from foreign direct investment? Journal of development
Economics 85 (1), 194�217.
Javorcik, B.S., W. K. and J. Tybout (2008). Openness and industrial response in a wal-
mart world: A case study of mexican soaps, detergents and surfectant producers. The
World Economy , 1558�1580.
36
Jensen, J., T. Rutherford, and D. Tarr (2007). The impact of liberalizing barriers to
foreign direct investment in services: the case of russian accession to the world trade
organization. Review of Development Economics 11 (3), 482�506.
Joseph, M., N. Soundararajan, M. Gupta, and S. Sahu (2008). Impact of Organized
Retailing on the Unorganized Sector. Technical report, Indian Council for Research on
International Economic Relations.
Kalinova, B., A. Palerm, and S. Thomsen (2010). OECD's Foreign Direct Investment Re-
strictiveness Index: 2010 Update. OECD Working Papers on International Investment.
Keller, W. and S. Yeaple (2009). Multinational enterprises, intenrational trade and pro-
ductivity growth: Firm-level evidence from the united states. Review of Economics and
Statstics 91, 821�831.
Latorre, M. (2010). The impact of foreign-owned companies on host economies: A com-
putable general equilibrium approach.
Latorre, M., O. Bajo-Rubio, and A. Gómez-Plana (2009). The e�ects of multinationals
on host economies: A cge approach. Economic modelling 26 (5), 851�864.
Lejour, A., H. Rojas-Romagosa, and G. Verweij (2008). Opening Services Markets within
Europe: Modelling Foreign Establishments in a CGE Framework. Economic Mod-
elling 25 (5), 1022�1039.
Lejour, A., P. Veenendaal, and N. Verweij, G.and van Leeuwen (2006). WorldScan:
A Model for International Economic Policy Analysis. CPB Netherlands Bureau for
Economic Policy Analysis.
Lipsey, R. (2002). Home and host country e�ects of fdi. NBER Working Paper No. 9293 .
McDougall, R. (1993). Incorporating International Capital Mobility Into SALTER. Aus-
tralia Industry Commission.
McKinsey & Company, I. (2008). The Great Indian Bazaar. McKinsey & Company, Inc.
37
Petri, P. (1997). Foreign Direct Investment in a Computable General Equilibrium Frame-
work. Conference, Making APEC Work: Economic Challenges and Policy Alternatives.
Rutherford, T. and D. Tarr (2008). Poverty e�ects of russia's wto accession: Model-
ing "real" households with endogenous productivity e�ects. Journal of International
Economics 75 (1), 131�150.
Sharma, P. (2011). Retail: Organized vs Unorganized or co-existence of Organized &
Unorganized? Zee Research Group.
Singh, A. and A. Mall (2011). Building a New India: The Role of Organized Retail in
Driving Inclusive Growth. Boston Consulting Group.
UNCTAD (1996). World Investment Report 1996: Investment, Trade and International
Policy Arrangements. United Nations.
UNCTAD (2011). World Investment Report 2011: Non-Equity Modes of International
Production and Development. United Nations.
WTO (2010). Distribution Services, Background Note by the Secretariat. S/C/W/326 .
38