the linkage between human element of service...
TRANSCRIPT

International Journal of Academic Research in Business and Social Sciences October 2014, Vol. 4, No. 10
ISSN: 2222-6990
644 www.hrmars.com
The Linkage between Human Element of Service Delivery and Customer Satisfaction in Private
Institutions of Higher Learning
Shahimi Bin Mohtar University Utara Malaysia
Email: [email protected]
Mazhar Abbas Ph.D Scholar, University Utara Malaysia
Email: [email protected]
Muhammad Shahid Nawaz Ph.D Scholar, University Utara Malaysia
Email: [email protected]
DOI: 10.6007/IJARBSS/v4-i10/1261 URL: http://dx.doi.org/10.6007/IJARBSS/v4-i10/1261
Abstract The present study explores the relationship between human element of service delivery and customer satisfaction in private institutes of higher education. Human element of service delivery is important for higher education institutions in Malaysia as they themselves are preparing to become exporters of premier educational services. The data were collected by the method of the survey. Survey questionnaires were delivered by hand the respondents who volunteered to be participants in this study. Respondents were given information sheets, along with verbal and written instructions. They were to complete the questionnaires and return to a mailbox on campus. A total of 331 representative samples were obtained from private institutions of higher education, using the private institutions of higher education directory as a sampling frame, after leaving the number of private institutions of higher education, which had ceased their operations. Data were analyzed using descriptive statistics and inferential analysis. The statistical analyzes used, were the Pearson correlation and multiple regression. Descriptive statistics were employed. The results revealed that the human element of service delivery has a relationship with the customer satisfaction. Using multiple regression analysis, the predictor variable indicated that the variables can explain 44.9% of variation that occurred in customer satisfaction. Whereas, the relationship between the predictor variables and customer satisfaction, there was a 13.7% variation explained. Human element of service delivery has significant and positive relationship with customer satisfaction. Therefore, this variable deserves to be monitored and appropriate adjustments in order to improve organizational performance through customer satisfaction. In conclusion, this study provides an overview greater understanding on how to improve organizational performance through the

International Journal of Academic Research in Business and Social Sciences October 2014, Vol. 4, No. 10
ISSN: 2222-6990
645 www.hrmars.com
implementation of excellent human element of management practices of service delivery and, at the same time, it gives due emphasis to customer satisfaction.
Keywords: Service Delivery, Customer Satisfaction, Organizational Performance, Human Element of Service Delivery.
Introduction This research explores the relationship among human element of service delivery and consumer satisfaction in the private institutions of higher education. Human element of service delivery is very significant to the higher education institutions in Malaysia as per they are gear up themselves to be a good exporters of highest higher education services. This research has been carried out in the area of Northern Peninsular Malaysia. The key aim of this research was double: (a) to investigate the relationship among human element of service provision and consumer satisfaction in private institutions of higher education; and (b) to quantitatively measure/model the relationship among human element of service delivery and customer satisfaction in private institutions of higher education.
Background of the Problem The 21st century where competing on the global market has grown organizations are demanding more skilful and skilled workers to enhance their competitive advantage. Consequently, institutions of higher learning are expected to provide training sessions that is sensitive to the competition and challenges. Malaysia has a great number of private establishments of higher learning compared with other Southern countries East Asia. Number of private institutes of higher learning has surfaced significantly in recent years. In addition, a series of leading international institutions of higher learning also have put in subsidiary campuses in Malaysia. In the academic year 2000/2001, student enrolment in public universities was 3,059,231(Yoke & Boey 2001). There were 2,320,692 students enrolled in private institutions of higher learning as at 31 May 2001 (Yoke & Boey 2001). For the private higher learning institutions, six hundred and fifty-two were private colleges, ten private universities, and four foreign university branch campuses (Yoke & Boey 2001). However, for the public institutions of higher learning, there were only 14 public universities, all of which are fully funded, and one international university partially funded by the government (Yoke & Boey 2001). Private institutions of higher learning are not funded by the government, but fully funded by the private entities. Private institutions of higher learning can be classified into four categories: private colleges, private universities and university colleges, branch campuses of foreign universities and distance learning centres. The private higher learning institutions offer higher education to students leading to the awards of qualifications ranging from certificate levels to postgraduate levels. Some of these institutions run their own academic programmes. Others offer the programmes moderated by or franchised by foreign or local universities. They chose to collaborate either with the local or foreign partners because they cannot afford to offer these academic programmes on their own.
According to Boey & Yoke, (2001) during the academic year 2000/2001, the student enrolment was 3,059,231 in public universities of Malaysia. Furthermore, with respect to Boey & Yoke, (2001) reported that there were 2,320,692 students enrolled in private institution of higher

International Journal of Academic Research in Business and Social Sciences October 2014, Vol. 4, No. 10
ISSN: 2222-6990
646 www.hrmars.com
education till 31 May, 2001. In addition Boey & Yoke, (2001) revealed that in private higher learning education there were 652 private schools have 10 private universities and four branches of every university having campuses abroad. On the other hand in lieu of public universities in higher learning or education there were merely fourteen public bodies in, that are all completely funded and an international bodies or institutions partially funded through the government of Malaysia (Boey & Yoke, 2001). Private institutions of higher education have not supported through the government up till now completely funded by private bodies. Private institutions of higher education might be categorized into four type’s private schools, private institution of higher education and other different colleges and universities, branches as well as campuses of foreign institution of higher education and centres of the education at a distance. Therefore for the private higher education institutions providing good higher education for students that direct to premiums of degrees that start from certification to graduate level of education. Few of these entities retain their academic programs. More programs providing be moderated by franchises the local or foreign university. They have chosen to working with either local or foreign partners as they may afford to offer these programs in their academia. Human element service provision is an important element competitive edge in private establishments of higher education. It 'broadly acknowledged as key determinant in the success private establishments of higher education in today's competitive business setting. Superb service stands with a higher education institution by its competitors in a manner that is vital for customers. Human element of service delivery it is also one of critical factors to be considered when the Malaysian private establishments of the higher education wanting to venture in the international market as centres of the educational excellence. Importance of the Study This study is important because the private institutions of higher education play a key role in Malaysian economy. It is also important for the institutions to provide the service to meet the customer's expectations by providing services for customers. The results of this research should help institutions to measure their human element of the provision of services in order to ensure that their function effectively and efficiently in the highly competitive environment. The human element of the provision of services, facilitate the private institutions of higher learning to improve their competitive advantage and increase their market share. It was observed that many of the institutions are not able to provide good services to their customers; they do not understand the needs of their customers. The institutions need to listen to and help customers to take part in decision-making processes. This type of research could also help the institutions to understand what their customers want in order to allow them the generation of strategies for addressing the needs of their customers. Finally, other researchers in Malaysia may use the results of this study as references for further study the human element of the service delivery and customer satisfaction in private institutions of higher learning. Conditions and Limits The following limitations and the hypothesis of this study were identified:
The study is limited only to private institutions of higher learning in Malaysia.

International Journal of Academic Research in Business and Social Sciences October 2014, Vol. 4, No. 10
ISSN: 2222-6990
647 www.hrmars.com
The theme of the instruments is designed to specifically address the issues of private institutions of higher learning in Malaysia.
The responses were requested by the customers of private institutions of higher learning in Malaysia, which is a developing country. The perception of the people in Malaysia compared to the human factor of the service and customer satisfaction may differ from those in developed countries like the United States, Great Britain or Australia.
This study was correlation in nature and therefore not on inference of causality. Analysis of the Literature The variable and human element of the provision of the service delivery and customer satisfaction in private institutes of higher education are discussed. This variable refers to all aspects which fall under the domain of the human element in the delivery of the service. The second variable is composed of seventeen members. The elements suggested by Sureshchandar et al. (2001, 2002) are:
1. Provision of services as promised. 2. The effectiveness of workers' skills and the ability for actions when critical incidents. 3. Each time that an accident occurs, the degree to which the private institution of
higher learning manages to bring the condition returns to normal of customer satisfaction.
4. Provide services right the first time. 5. Provide planning services for the promise. 6. Apprising the buyers. 7. Prompt service to clients. 8. Willingness to help customers and the willingness to respond to the requests of
clients. 9. To what extent the customer feedback are used to improve the quality of services. 10. Apprising the regularly customers information on the human element of the actual
provision of services and service performance in relation to the objectives of the private institutions of higher learning.
11. Employees who inspire confidence in customers of correct behaviour. 12. For customers to feel safe and secure for their operations. 13. Employees who are always pleasant and courteous. 14. Employees who have the knowledge and skills to respond to the specific demands of
customers and orders. 15. Efficiency of customer joinder of the procedures and processes. 16. With care and individual attention to customers with customers interests at heart. 17. Employees who understand the needs of their customers. (Sureshchandar et al.
2002) The authorization was granted by Sureshchandar, Anantharaman and Rajendran at the Department of Philosophy and Social Sciences, Indian Institute of Technology, Madras, the August 6, 2003 for this study to use the tool developed by them (see Appendix J page 191). Permission was also granted to the originator of the SERVQUAL, Parasuman, Zeithaml and Berry for this study to adapt, translate, and use your own instrument. Therefore, the
International Journal of Academic Research in Business and Social Sciences October 2014, Vol. 4, No. 10
ISSN: 2222-6990
648 www.hrmars.com
elements for the distribution of services in this study are almost literally with respect to Sureshchandar et al (2001, 2002) research tools. Human Element in the Provision of Services of the Institutions of Higher Education The human element in the provision of services is very important for the institutions of higher education in order to operate efficiently and effectively in a highly competitive environment. The human elements in the concept of providing higher education services are strongly linked to the competitive service and the success of an institution (Parasuraman et al. 1988). The introduction of the Higher Education Ministry Malay has been described as expected for a long time by the operators of the sector that has said that it was time to start working on improving the country training services. (Indramalar, Gomez & Khoo 2004 p. 10) In this research, human elements of service delivery are defined as the judgment about the higher education institution of the overall excellence and superiority. In addition, the concept of the interested parties rather than the customer is still more popular than educational analysis. According to the concerned, the students are not only customers. Customers of institutes of higher education: parents, employers of graduates, research sponsors, legislators and other members of the staff, teachers and taxpayers. Sallis (1993) classifies customers of the institutions of higher learning in three levels: Major customers: Students Secondary customers: Parents, governors and employers Customer Services: The labour market, the government and society IT IS, however, the concept of student as the primary customer of higher education, the research, where the higher education institutions may have their greatest challenge. Students are also considered as the main customers of higher education in the United Kingdom (Hill 1995). Wallace (1999) concur with Hill (1995) that the main customers of higher education are the students. The importance of students from private institutions of higher education in Malaysia is irrefutable. The progress of private institutions of higher learning depends entirely on the number of their students. The lack of students also has caused 123 private higher educations in Malaysia to fold and the other 30 private higher educations are in critical situation (Kumar & Termizi 2005). As a result, the Malaysian government has established a task force to examine the issue. Without the students for teaching, there is no business for the institutes of higher education, research of behaviour or provide services. Without perceived value, there is no reason for students to choose our institution in a growing number of similar institutions. (Martensen, Gronholdt, Eskildsen & Kristensen 2000 p. 372) To date, very limited amount of empirical research that exists that is in relation with human elements of service delivery in institutes of higher education mainly in Malaysia. Most of the work published on human elements of service delivery in institutes of higher education has concentrated on the provision of courses effective mechanisms, and the quality of courses and teaching (Soutar & Mc Neil 1996, Kwan & Ng 1999, Ford, Joseph & Joseph 1999). The research literature on human elements of service delivery in higher education institutions has identified numerous models by several researchers.

International Journal of Academic Research in Business and Social Sciences October 2014, Vol. 4, No. 10
ISSN: 2222-6990
649 www.hrmars.com
Customer Satisfaction Concepts Customer Satisfaction has long been recognized to play an essential role in the success and survival in today's competitive environment. Customers are the lifeblood of any organization, private companies or public administrations, because your satisfaction is the key to the survival of the organization continues. Satisfaction is particularly important with regard to organizations that offer services rather than goods. (Nicholls, Gilbert & Roslow 1998 p. 242) Numerous studies on the relationship between human element of the service and customer satisfaction have been conducted by researchers (see Cronin & Taylor 1992, 1994; Baroque Palace et al. , 1993; Kellogg, Youngdahl & Bowen 1997; Strauss & Neuhaus 1997; Roest & Pieters 1997). Nicholls, Gilbert, & Roslow (1998) emphasized the importance of customer satisfaction in relation to private institutions of higher education that provide services. However, a review of the literature revealed more than 40 different scales were used to measure satisfaction with the service (Devlin, Dong & Brown 1993). The satisfaction has been warned by a person who lived a performance (or result) that has made his or her expectations. Satisfaction is therefore a function of relative levels of expectation and perceived performance. Customer satisfaction is also the fulfilment. This is a judgment that a product or service or the product or the service itself, providing a pleasant level of consumption-related fulfilment (levels below or completion (Oliver 1997). Satisfaction or dissatisfaction is more of a reaction to the actual quality of the performance of a product or service. The historical centre and the current definitions of satisfaction of the customer centre on the concepts of expectations, experience, perception, and the consequent evaluation. Hempel (1977) recognizes that customer satisfaction is determined by the degree of realization of the benefits of service that customers expect from this service. Kotler (1996) recognizes that what is called the satisfaction and emotional perception of the customer and the results of the comparison between the customer perceptions of service functionality, with what the service. Solomon (1991) recognized customer satisfaction has been the general attitude of the individual toward the service purchased. In this study, the satisfaction of the customer will apply depending on usage and not at the time of purchase. This is important for two reasons. In the first place, customers often use services without direct payments for these services (or those of third parties, such as parents, often can fund these costs when they occur). Secondly, the level of customer satisfaction in the context of services will focus much less of the concept of value that in a retail environment. The tool used for this study has called for answers' perception of the real level of customer satisfaction on seven-point Likert scale. Likert scale is a method used in attitude scales that requires the individual to accept or not accept a series of statements. Salkind (2000 p. 132) In this study, a set of instructions that uses a scale seven points, where 1 = very high dissatisfaction, 2 =high dissatisfaction, 3 =unsatisfactory, 4 = neither happy nor satisfied, 5 =unsatisfactory, 6 = high satisfaction and 7 = very a high level of satisfaction was used. The elements corresponding to six factors of customer satisfaction:
1. Overall satisfaction level as regards higher education institution 2. The perception of the higher education institution

International Journal of Academic Research in Business and Social Sciences October 2014, Vol. 4, No. 10
ISSN: 2222-6990
650 www.hrmars.com
3. THE human element of overall service delivery of higher education institution 4. The decision to attend the high school of the institution 5. I recommend to friends and relatives who wish to deepen their studies at this
learning institution 6. I/they will not be further my studies in this institute.
Conceptual Model Proposed On the basis of the review of the literature, this final section proposes an alternative conceptual model as shown in Figure 1. Figure 1 Conceptual Model proposed The relationship between human elements of service delivery to the customer's satisfaction is evident in Figure 1. The model shows that human elements of service delivery variable as independent variable. In order to apply this model in this research, some changes to the search tool. The literature was used to selectively focus on issues of most interest to the researcher. On the basis of research objectives, research questions and analysis of the literature, some verifiable hypotheses were formulated. Second Salkind (COM (2000), hypothesis is defined as an educated guess to test. HA1 There is a correlation between the customer perceptions of the human element of the service delivery with the degree of customer satisfaction. Research and Methodology Design Research In general, the study can be conducted through exploratory, descriptive and inferential analysis or (Malhostra 1999; Sekaran 2000). An exploratory study is carried out in an area that is relatively new. This research generally uses a combination of the three methods. The research model is the tool used in this study is adapted from Sureshchandar et al. (2002). Sureshchandar et al. (2002) is suitable for analogies of education systems, and is in progress in developing countries. A survey conducted by Sureshchandar et al. (2002) and one of the most extensive and thorough research in human element of the provision of the service. Furthermore previous author have conducted a wide criticism on customer perceptions of the human element of service provision (Sureshchandar et al. 2001). Sureshchandar also developed a framework of total quality service in his doctoral thesis. Sureshchandar et al. (2002) also published a document on the determinants of customer-perceived human element of the provision of the service: an approach to factor analysis confirms. They have also
CUSTOMER
SATISFACTION
HUMAN ELEMENT OF
SERVICE DELIVERY

International Journal of Academic Research in Business and Social Sciences October 2014, Vol. 4, No. 10
ISSN: 2222-6990
651 www.hrmars.com
published a document on a holistic model of total quality of the service. In this study, changes were made to Sureshchandar et al.., 2002) instruments. Changes are made to the original Sureshchandar et al. (2002) the tools for the following reasons:
There are differences in facilities provided by the institutions of higher education.
There are differences of courses provided by the institutions of higher education.
There are no differences between the requirements laid down by the governments. Consequently, the researcher decides not to attempt to measure the expectations, and:
1. Use only perception. 2. Redefine a series of perception domains so as to reflect the situation of the particular
service better and provide the variables best criterion. 3. Suggest a solution to low cost reduced version of the questionnaire made with the best
elements of perception more relevant areas that can be used by institutions of higher education to follow the evolution of quality on a regular basis.
4. Shed new evidence regarding the relationship between human element overall service and customer satisfaction.
The study focuses on the relationship between elements of service delivery to the customer's satisfaction. Second Brehm, Kassin & Fein (1999), a study on the relationship between the variables can be conducted through correlation research. A study in the form of a report has many advantages (Brehm et al.. 1999). The report provides the facts of course and cannot be changed or manipulated. Therefore, a ratio study is selected for this study. Population Research This study is conducted with the collaboration of private institutions of higher learning in the northern region of the Malay Peninsula. Salkind (2000) defines the research population as the entirety of some groups. A list of institutions was collected from the Directory of Higher Education Malaysia (3ª edition). A letter of introduction, datasheet, consensus, and a letter explaining the details of the research were sent to the participants. The population defined for this study consists of students from private institutions of higher education located in the northern region of the Malay Peninsula. The unit analysis in this study is composed of students from private institutions of higher education. Sampling Scheme The sampling for this study and the entire population of the private institutions of higher learning are taken from the northern region of Malaysia. Cavana et al.. (2001) defines the sampling scheme such as a list of all the elements of the population from which the sample is drawn. The selection of private institutions of higher learning is based on their willingness to participate in the study, the existence of the institutions and the number of their customers. The number of respondents for each institute is based on the ratio between their clients and the total population of the participants. Section 2.3 discusses the concept of student as the primary customer of higher education. Participants must be enrolled in 2004. They may be of any academic program. The selection includes students from the first year until the last year.

International Journal of Academic Research in Business and Social Sciences October 2014, Vol. 4, No. 10
ISSN: 2222-6990
652 www.hrmars.com
The names of the institutions, the population of respondents and the number of samples collected are shown in Table 1. Table 1: Private institutions of higher learning
Institution
Population Sample Collected
Customers (N)
% Customers
(N) %
1 Institut Perdagangan Systematic 465 9.46 29 8.76
2 Entrepreneurs Development Institute 586. 11.92 36 10.88
3 Skills Development Center Penang 596 12.12 39 11.78
4 Advance Kemayan Tertiary College 150 3.05 6
From 1.81
5 Kolej RIFA, Seberang Perai 230 4.68 19 5.74
6 INTI International College 1100 22.38 91 27.49
7 ITTAR 1464 29.78 92 27.79
8 Computer Science College 325 6.61 19 5.74
Total Views: 4916 100 331 100
Source: Table was generated on the basis of data from field survey Sample Size A total of 331 usable questionnaires were collected for customers in various private institutions of higher learning. Eight private institutions of higher education were chosen for the purpose of this study. A sample of 331 usable questionnaires and appropriate to the size of the sample table generated by Krejcie & Morgan (1970) (cited by Sekaran 2000) for the population of N = 5000. The table was developed on the basis of the guideline scientific (Sekaran 2000). Validity and Reliability Reliability refers to how all the elements of the variable related to each other (Churchill 1999). Sekaran (2000) stated that the reliability has two aspects: stability and consistency. There are four types of methods that can be used to test reliability. They are evidence of repeat test, in parallel to form, divided in half, and internal consistency (Churchill 1979; Sekaran 2000). For a
International Journal of Academic Research in Business and Social Sciences October 2014, Vol. 4, No. 10
ISSN: 2222-6990
653 www.hrmars.com
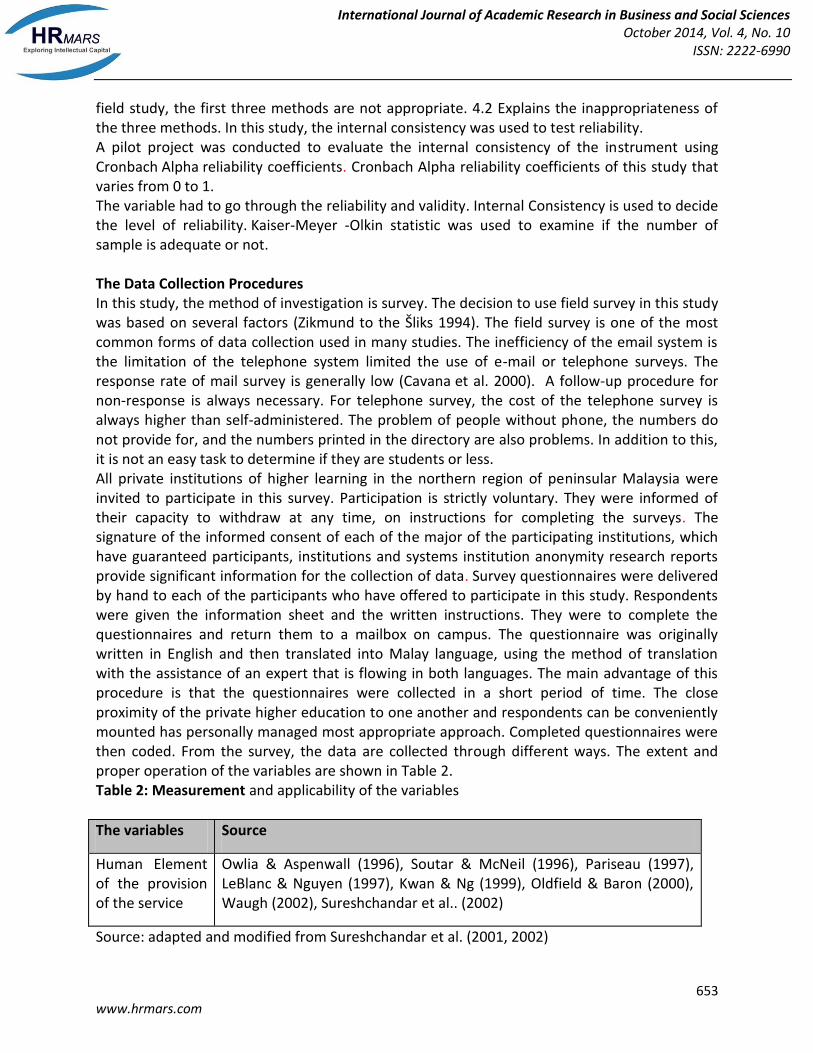
field study, the first three methods are not appropriate. 4.2 Explains the inappropriateness of the three methods. In this study, the internal consistency was used to test reliability. A pilot project was conducted to evaluate the internal consistency of the instrument using Cronbach Alpha reliability coefficients. Cronbach Alpha reliability coefficients of this study that varies from 0 to 1. The variable had to go through the reliability and validity. Internal Consistency is used to decide the level of reliability. Kaiser-Meyer -Olkin statistic was used to examine if the number of sample is adequate or not. The Data Collection Procedures In this study, the method of investigation is survey. The decision to use field survey in this study was based on several factors (Zikmund to the Šliks 1994). The field survey is one of the most common forms of data collection used in many studies. The inefficiency of the email system is the limitation of the telephone system limited the use of e-mail or telephone surveys. The response rate of mail survey is generally low (Cavana et al. 2000). A follow-up procedure for non-response is always necessary. For telephone survey, the cost of the telephone survey is always higher than self-administered. The problem of people without phone, the numbers do not provide for, and the numbers printed in the directory are also problems. In addition to this, it is not an easy task to determine if they are students or less. All private institutions of higher learning in the northern region of peninsular Malaysia were invited to participate in this survey. Participation is strictly voluntary. They were informed of their capacity to withdraw at any time, on instructions for completing the surveys. The signature of the informed consent of each of the major of the participating institutions, which have guaranteed participants, institutions and systems institution anonymity research reports provide significant information for the collection of data. Survey questionnaires were delivered by hand to each of the participants who have offered to participate in this study. Respondents were given the information sheet and the written instructions. They were to complete the questionnaires and return them to a mailbox on campus. The questionnaire was originally written in English and then translated into Malay language, using the method of translation with the assistance of an expert that is flowing in both languages. The main advantage of this procedure is that the questionnaires were collected in a short period of time. The close proximity of the private higher education to one another and respondents can be conveniently mounted has personally managed most appropriate approach. Completed questionnaires were then coded. From the survey, the data are collected through different ways. The extent and proper operation of the variables are shown in Table 2. Table 2: Measurement and applicability of the variables
The variables Source
Human Element of the provision of the service
Owlia & Aspenwall (1996), Soutar & McNeil (1996), Pariseau (1997), LeBlanc & Nguyen (1997), Kwan & Ng (1999), Oldfield & Baron (2000), Waugh (2002), Sureshchandar et al.. (2002)
Source: adapted and modified from Sureshchandar et al. (2001, 2002)
International Journal of Academic Research in Business and Social Sciences October 2014, Vol. 4, No. 10
ISSN: 2222-6990
654 www.hrmars.com
A total of n=331 representative samples of the population were obtained from private institutions of higher education, using the private institutions of higher learning directory sampling, after the insertion of a number of private institutions of higher learning that had ceased operations. The search tool is shown in Appendices A, B and C. Analysis of the Data In this study, data were analysed using descriptive statistics and inferential analysis. The descriptive analysis takes into account the means, standard deviations and the percentages. Correlation and multiple regressions are used in inferential analysis. The data are analyzed using statistical package for social sciences or SPSS the reliability testing of the matter is determined by using Cronbach alpha coefficient. Second Sekaran (2000 p. 324), The correction on questionnaires with poor reliability and developed again before it is distributed to the participants. The corrections are in order to increase the reliability of the study. After the correction and check the reliability of Cronbach alpha's, the questionnaires distributed to the participants. Descriptive and inferential statistics are used to determine the data collected from the respondents. The collected data is then entered in SPSS package to obtain the results. These methods are used to measure the change in frequency is the percentage. Static Analysis description indicates the percentage of returned questionnaires, the numbers of respondents by gender, year of study and courses pursued. Correlation analysis is used to achieve the objective of this study. Pearson correlation is used to measure the significance of linear between two dependent variables and independent variables. The coefficient of quantitative correlation provides a brief summary of the report in order to understand and interpret statistical measure. Multiple regression analysis is also used to achieve the objective of this study. In this study, the more regressions are used to identify relationships between the dependent variables and independent from the point of view of the level, the direction and strength of the relationship. The multiple regressions are also used to decide the most important independent variable in order to explain the relationship of dependent variable (Kleinbaum, Kupper & Muller 1988). Bailan (1982) and Kerlinger (1986) argued that multiple regression analysis is a powerful and practical, realistic and in many research especially in behavioural science research. Analysis and Results The data collected by research in the field are analysed to address the research objectives, questions and hypotheses. The first section concerns the personal data and presentation of descriptive data. This is followed by inferential analysis. Descriptive Analysis This section contains a description of the data used to answer the research questions posed to the study. This section also includes profiles of the defendant. Table 3 provides the researcher an idea about the profiles of the participants. The frequencies are used to describe the profile of the participants and these frequencies alert the researcher to possible inaccuracy of the data. A summary of the results presented in this section. Table 4 presents the main descriptive

International Journal of Academic Research in Business and Social Sciences October 2014, Vol. 4, No. 10
ISSN: 2222-6990
655 www.hrmars.com
characteristics of the independent and dependent variables of the study. This section also includes profiles of the defendant. Respondents’ Profiles This section provides general information on the participants who participated in the survey. The profiles examined include the sex, age, marital status, and education, year of study and field of study. Females (56.2 %) slightly exceed male respondents (see Table 3). As expected, the majority of respondents between the ages of 18 and 24 years. Over 90% of the respondents were married. More than half of the respondents have a minimum qualification examination Malaysian, because it is a basic requirement before you can pursue higher education. Forty percent of respondents are students who are in the first year of their education. Only one percent of the respondents were the fifth and sixth year of study. This is understandable, as almost all programs of study offered by the private higher education can be completed within three years. Engineering and information technology and computer science is the field of study preferred among the respondents. Only nine per cent of respondents obtain a cumulative grade average of 3.5 or higher. A surprising finding is that more than ten per cent (12.4 %) of the respondents were in evidence (or their average is less than 2.00). The details of the profiles are presented in Table 3. Table 3 Demographic Information
Demographic Data Frequency (n= 331) Valid Percentage
Sex:
Male
Female
145
186
43.8
56.2
Age :
18 - 24 years
25 - 34 years
35 - 44 years
45 - 54 years
55 - 64 years
283
40
5
2
1
85.5
With a screen size of 12.1
1.5
0.6
0.3
Marital Status:
Married
Single
32
299
9.7 YEARS
90.3
Academic qualification

International Journal of Academic Research in Business and Social Sciences October 2014, Vol. 4, No. 10
ISSN: 2222-6990
656 www.hrmars.com
Lower Secondary
Upper Secondary
Pre-university
Diploma
Degree
Post-graduate training
7
204
36
66
16
2
2.1.
61.3
10.9
Are obtained 19.9
4.8
0.6
Year of study
First year
Second year
Third year
Fourth year
Fifth year
Sixth year
134
132
46
15
2
2
40.5.
39.9
X 13.9
4.5
0.6
0.6
Field of Study
Accounting and Finance
Business Studies and management
Computer Science & Information Technology
Engineering
Social Sciences
Science also
Law
The Other
51
35
120
68
5
19
10
24
From 15.4
10.6
36,3 °
From 20.5
1.5
5.7
From 2.7
7.3.
Cumulative Average
1.0 - 1.49 1.50 - 1.99
2.00 - 2.49
4
37
74
1.2.
11.2
22.4 MILLION

International Journal of Academic Research in Business and Social Sciences October 2014, Vol. 4, No. 10
ISSN: 2222-6990
657 www.hrmars.com
2.50 - 2.99
3.00 - 3.49
3.50 - 4.00
97
89
30
29.3
From 26.9
9.1
Source: Table was generated on the basis of data from field survey Summary Descriptive Statistics This section provides descriptive statistics summary for theoretical variables such as human element of the provision of service and customer satisfaction. The following scoring procedure is used to analyse the independent variables: 1= very poor, 2 =low, 3= slightly low, 4= medium, 5= quite good, 6 = good and 7= very good. This classification and the procedure used to calculate the frequencies, mean scores, standard deviation, and asymmetry for the human element of the provision of the service. Skewness is a measure of the deviation from the symmetry of a distribution (Cooper 2000). In most cases, the comparison is done with a normal distribution. Similarly, the data relating to the satisfaction of customers are analysed using the following scoring: 1= very high dissatisfaction, 2= high dissatisfaction, 3= little satisfied, 4= neither happy nor satisfied, 5= little satisfied, 6= a high level of satisfaction, 7= a very high level of satisfaction. This classification and the procedure used to calculate the frequencies, mean scores, standard deviation, and asymmetry for the human element of the provision of the service. The descriptive statistics results are reported in Appendix D. Descriptive statistics of understudied variables are shown in Table 4. Table 4 Descriptive Statistics
N Min Max Media Std. Dev Asymmetry The Kurtosis
Stat Stat Stat Statistics Std. Error
Statistics Statistics Std. Error
Statistics Std. Error
Human Element of the provision of the service
331 1.00 7.00 A.M.
4.687 0.057 1.043 -0.528 0.134 0.665 0.267
Customer Satisfaction
331 1.00 7.00 A.M.
4.717 0.062 1.127 -0.430 0.134 0.567 0.267
Source: Table was generated on the basis of data from field survey Table 4 shows that the average of the population perceives the human factor of the provision of services such as nearly good enough (4.687). This variable refers to all aspects (reliability, responsiveness, reliability empathy, moments of truth, critical incidents, and recovery) that fall under the domain of the human element in the delivery of the service. The standard deviation

International Journal of Academic Research in Business and Social Sciences October 2014, Vol. 4, No. 10
ISSN: 2222-6990
658 www.hrmars.com
for this variable is 1.043. The difference between the largest and the smallest score distribution and there are about 6,000. The variance is 1.088. The value is between 1000 and 7000. The kurtosis (0.665) reflected that the distribution of human element in the delivery of the service and leptokurtic. On the basis of statistical evidence, the human element of the supply of services appears to be normally distributed. Fifty-seven percent 57.1 % of respondents believe that the effectiveness of employees' skills and the ability for actions when a problem occurs and above average on customer perception but slightly less. Forty-three per cent of respondents believe that the effectiveness of employees' skills and the ability for actions when a problem occurs and in media perception. Fifty per cent of respondents perceive their institutions of higher education services provided to the first time and above average on customer perception but slightly less. Seventy per cent of respondents perceive their institutions of higher education are to provide planning services for the promise. Sixteen percent of respondents believe that their institutions of higher education do not provide quick service to customers. Fifty per cent of respondents perceive their institutions of higher education will help customers and the willingness to respond to customer requests and above average on the perception. Eighty per cent of respondents believe that their institutions of higher education are regularly appraising the users’ information on the human element of the actual provision of services and the performance of the service with respect to the objectives of the private institutions of higher learning. Eighty-four percent of persons receiving the employees of higher education institutions are always pleasant and courteous. Sixty per cent of respondents also believe that employees who have the knowledge and expertise to meet the specific needs of its customers and requests are above the average perception. Eighty-five percent of respondents believe that their institutions of higher education that care and individual attention to customers with customers interests at heart. Customer Satisfaction has been warned by a person who lived a performance (or result) that has made his or her expectations. Customer satisfaction is also the fulfilment. Table 4 shows that the number of valid samples for customer satisfaction and 331. The average customer satisfaction score is 4.717 and the standard deviation is 1.127. The range for customer satisfaction is 6.00. The variance is equal to 1.27. Customer satisfaction score values between 1.00 and 7.00. The distribution of the data for customer satisfaction and leptokurtic kurtosis based on the value 0.567. Therefore, the conclusion can be made so that the data are normally distributed. Only four per cent of respondents have experienced a strong dissatisfaction with regard to their higher education institution. Overall, sixteen percent of respondents are not satisfied with their choice of institution of higher education. Eighteen percent of respondents perceived the human element of the overall provision of services to higher education institution is not satisfactory. Sixty per cent of the respondents recommended that relatives and friends who wish to further their studies in their learning. Fifty-three per cent of respondents expressed a desire to deepen their studies in this institute. Reliability Analysis and Validity A pilot project was conducted to evaluate the internal consistency of the instrument using alpha Cronbach reliability coefficients. Table 5 shows the value of alpha for each variable. Therefore, the internal consistency reliability of the measure used in this study can be considered good. The complete analysis is given in Table 5 below.

International Journal of Academic Research in Business and Social Sciences October 2014, Vol. 4, No. 10
ISSN: 2222-6990
659 www.hrmars.com
Table 5 level of reliability of the instrument panel
The variables Cronbach's Alpha
A pilot study Studies
Human Element of service delivery 0.949 0.946
Customer Satisfaction 0.895 0.908
Source: Table was generated on the basis of data from field survey Table 6 shows that human element of the provision of services has the value of KTH (Kaiser-Meyer -Olkin) greater than 0.65. Kaiser-Meyer -Olkin statistic is used to check if the number of sample is adequate or not. As Nunnally (1978), the value of KTH 0.65 or more indicates that the number of sample is adequate. Adequacy of the sample is reasonable in this case. In the next section, Pearson correlation was used in order to achieve the research objectives. Table 6 Validity Variable
The variables No article KTH Value
Human Element of service delivery 12 0.932
Customer Satisfaction 6 0.885
Source: Table was generated on the basis of data from field survey Multivariate Hypothesis Tests on the Correlation between Human Element of the Service Delivery and Customer Satisfaction Several assumptions must be made before the multivariate technique can be used. Hypotheses are linearity, homoscedasticity, normalcy and multicolinearity. Normality of the data refers to the shape of the distribution of the data for an individual variable and the correspondence with the normal distribution (hair et al. 1998). All hypotheses are tested using the method proposed by Norusis (1997) and hair et al. (1998). Norusis According (1997), scatter graph is a good way to show that a straight line fits to the data. Multicolinearity is a prerequisite. There should be no multicolinearity. Table 7 shows the results of the test multicolinearity.
International Journal of Academic Research in Business and Social Sciences October 2014, Vol. 4, No. 10
ISSN: 2222-6990
660 www.hrmars.com
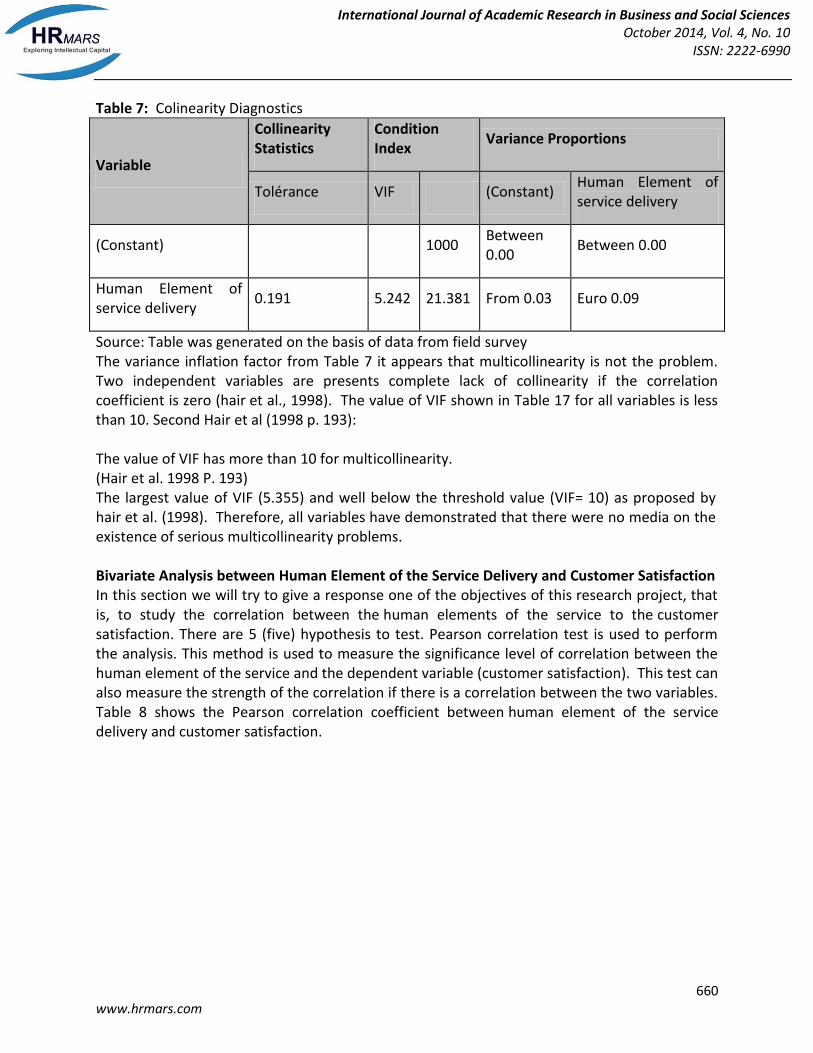
Table 7: Colinearity Diagnostics
Variable
Collinearity Statistics
Condition Index
Variance Proportions
Tolérance VIF (Constant) Human Element of service delivery
(Constant) 1000 Between 0.00
Between 0.00
Human Element of service delivery
0.191 5.242 21.381 From 0.03 Euro 0.09
Source: Table was generated on the basis of data from field survey The variance inflation factor from Table 7 it appears that multicollinearity is not the problem. Two independent variables are presents complete lack of collinearity if the correlation coefficient is zero (hair et al., 1998). The value of VIF shown in Table 17 for all variables is less than 10. Second Hair et al (1998 p. 193): The value of VIF has more than 10 for multicollinearity. (Hair et al. 1998 P. 193) The largest value of VIF (5.355) and well below the threshold value (VIF= 10) as proposed by hair et al. (1998). Therefore, all variables have demonstrated that there were no media on the existence of serious multicollinearity problems. Bivariate Analysis between Human Element of the Service Delivery and Customer Satisfaction In this section we will try to give a response one of the objectives of this research project, that is, to study the correlation between the human elements of the service to the customer satisfaction. There are 5 (five) hypothesis to test. Pearson correlation test is used to perform the analysis. This method is used to measure the significance level of correlation between the human element of the service and the dependent variable (customer satisfaction). This test can also measure the strength of the correlation if there is a correlation between the two variables. Table 8 shows the Pearson correlation coefficient between human element of the service delivery and customer satisfaction.

International Journal of Academic Research in Business and Social Sciences October 2014, Vol. 4, No. 10
ISSN: 2222-6990
661 www.hrmars.com
Table 8: Pearson correlation coefficient between human element of the service delivery and customer satisfaction
Human Element of service delivery
Customer Satisfaction
Human Element of service delivery 1 0,610 ( ** )
Customer Satisfaction 1
** P < 0.01 (2 students). Source: Table was generated on the basis of data from field survey The second hypothesis was the correlation between the perceptions of the participants of the human element of the service delivery with the degree of customer satisfaction, THE hypothesis has been declared in the form of alternative hypothesis as follows: HA1 There is a correlation between the customer perceptions of the human element of the service delivery with the degree of customer satisfaction. There was a significant and positive correlation between the perceptions of the participants of the human element of the provision of the service with the degree of customer satisfaction on the basis of the analysis of the results. Therefore, the alternative hypothesis has been confirmed. The coefficient correlation was r = 0.610 (r = 0.610, a value of p < 0.01). This shows that the distribution of services had 61 percent a significant correlation with the level of customer satisfaction. The correlation of 0.610 also indicates that the variable could explain the variance of one another to the extent of 37 percent. The results of this directional correlational matrix showed that, as the perception of the participants of the human element of the provision of the service increases, the level of customer satisfaction. Table 9 shows the summary of the hypothesis test for human element of the provision of service to customer satisfaction. Table 9: Summary of the hypothesis Test for the satisfaction of the customer
Alternative Hypotheses Correlation coefficient
The decision
HA1 There is a correlation between the customer perceptions of the human element of the service delivery with the degree of customer satisfaction.
0,610 ( ** ) Significant
** P < 0.01 (2 students) Source: Table was generated on the basis of data from field survey

International Journal of Academic Research in Business and Social Sciences October 2014, Vol. 4, No. 10
ISSN: 2222-6990
662 www.hrmars.com
Summary of the Results The second hypothesis was the correlation between the perceptions of the participants of the human element of the service delivery with the degree of customer satisfaction. There is also a positive correlation between the customer perceptions of the human element of the service delivery with the degree of customer satisfaction. Improvements in all aspects (reliability, responsiveness, reliability empathy, moments of truth, critical incidents, and recovery) that fall under the domain of the human element in the service delivery, customer satisfaction will also be improved. The coefficient correlation was r = 0.610 (p-value < 0.01). This shows that the human element of the supply of services had 61 percent meaning correlation with the level of customer satisfaction. The correlation of 0.610 also indicates that the variable could explain the variance of one another to the extent of 37 percent. The synthesis of correlation analysis is shown in Table 10. Table 10: hypothesis test results
Alternative Hypotheses Correlation coefficient
The decision
HA1 There is a correlation between the customer perceptions of the human element of the service delivery with the degree of customer satisfaction.
0,610 ( ** ) Significant
** P < 0.01 (2 students). Source: Table was generated on the basis of data from field survey A diagram which illustrates the correlation and multiple regression coefficients between the variable is shown in Figure 2. Source: Table was generated on the basis of data from field survey Figure 2: Summary of human and the relationship between elements of service delivery to the customer's satisfaction. Conclusions and implications One of the visions of the current government and establish the Malaysia as international centre of educational excellence. In order to realize his visions, private higher education plays a very important role. They should strive to offer an excellent service. Excellent Service distinguishes a higher learning institution by competitors in the region: Singapore and Thailand. However, a strong statement of Wahid (2003) is given on the conditions of human elements in the
Customer Satisfaction
(POPULATION TOTAL
Ŷ CS)
Human Element in the delivery of
the service ( X2)
0.610

International Journal of Academic Research in Business and Social Sciences October 2014, Vol. 4, No. 10
ISSN: 2222-6990
663 www.hrmars.com
provision of services to Malaysian companies. A newspaper article (Kumar & Termizi 2005) that 123 private higher education in Malaysia had closed and another 30 are struggling to survive due to lack of customers and even shocking. The report has become before news of a Malaysian newspaper. Managing human elements in the delivery of service is essential for inducing potential students to enter or enrol in a university. Athiyaman (2000 p. 54) The institutions need to listen and help customers to participate in the decision-making process to obtain positive results from their customers. As Slade, Harker & Harker (COM (2000), customers of higher education can have a view more instrumental of education as a way to improve their lives along the incomes and their enjoyment of life. Therefore, customers are demanding more of any higher education institution. This research helps the institutions to look at what their customers want in order to help institutions generate a strategy which addresses the needs of customers and successfully implement human elements in the provision of services in the field of education. Conclusion Concerning the Hypothesis The hypothesis about the relationship between elements of service delivery with the degree of customer satisfaction is proved. Multiple regression analysis was carried out in order to test the hypothesis. An interesting finding from the data and not all elements of the human person in service delivery are important variables factors that determine the level of customer satisfaction. There are other important additional variables to explain to the customer satisfactions that were not taken into consideration in the present study. However, all variables have consequences for the satisfaction of the customer. These results are consistent with studies that indicate human elements of service delivery are closely linked to customer satisfaction. The result of this study agrees with Khatibi, Ismail and Thyagaran (2002). Khatibi et al. (2002) found that the human perception of service delivery variable elements have a direct and positive impact on overall customer satisfaction. They also noted that not all human elements of service delivery are significant variables. Only four elements in human service delivery elements were identified as the main predictors of customer satisfaction. The results of this study also provide interesting results that our knowledge of human elements of service delivery, particularly in private higher education. Understanding customers' perception of human elements in the provision of services can help to improve the current private higher education services and increase customer satisfaction. The results of this research may indicate more precisely the sources of dissatisfaction of the private higher education, customers. Realize that customer satisfaction is crucial; this model will help managers assess the perceptions of customers more clearly. The results of this research is consistent with Khatibi et al. (2002) and Sureshchandar et al. (2002) that human elements of service delivery items are identified as the main predictors of customer satisfaction. Research Interpretation and limits This research work within a private institutions of higher learning in the region to the north of peninsular Malaysia, adds to the growing literature, which calls for an examination of how to manage human elements of service delivery. The results of this study cannot be accepted as

International Journal of Academic Research in Business and Social Sciences October 2014, Vol. 4, No. 10
ISSN: 2222-6990
664 www.hrmars.com
completely relevant and applicable to all services, due to the limited size of the sample, the sampling procedure and, in particular, his attention on the institutions of higher education. Therefore, caution is necessary to generalize the results of all educational institutions, let alone other services industries. Therefore, the conclusions reached must be compared and reviewed in future studies. One of the main limitations of this study and the testing of search tools was developed and validated in the United States and India. While most of the articles are generic, and some may not be fully relevant to the institutions of higher education in Malaysia. Other specific items Malaysian could also have been inadvertently omitted. Another limitation of the modified scale and the methodology adopted for the development. References Abouchedid, K. & Nasser, R. (2002) Assuring quality service in higher education: Registration and
advising attitudes in a private university in Lebanon. Quality Assurance in Education, vol. 10 no. 4 pp. 198-206.
Athiyaman, A. (2000) Perceived service quality in the higher education sector: An empirical analysis. ANZMAC 2000 Visionary Marketing for the 21st Century: Facing the Challenge, pp. 50 –57.
Bailan, E. S. (1982) How to design, Analyze, and Write Doctoral Research. University Press America
Boulding, W., Kalra, A., Staelin, R. & Zeithaml, V. A. (1993). A dynamic process model of service quality: From expectations to behavioural intentions. Journal of Marketing Research. vol. 30, pp. 7-27.
Brehm, S.S., Kassin, S. M. & Fein, S. (1999) Social Psychology. (4th ed.) Boston: Houghton Mifflin.
Cavana, R. Y., Delahaye, B. L. & Sekaran (2001) Applied business research: Qualitative and quantitative methods. Australia, John Wiley & Sons.
Churchill, G. A. Jr. (1979) A paradigm for developing better measures of marketing constructs. Journal of Marketing Research, vol. 16, no 1, pp. 64-73
Churchill, G. A. Jr. & Surprenant, C. (1982) An investigation into the determinants of customer satisfaction. Journal of Marketing Research, vol. 19(November), pp. 491-504.
Cooper, D. R. & Schindler, P. S. (2001) Business Research Methods. 7th ed. Boston, McGraw-Hill Irwin.
Cronin, J. & Taylor, S. (1992) Measuring service quality: A re-examination and extension. Journal of Marketing. vol. 56(July), pp. 55-68.
Cronin, J. & Taylor, S. (1994) An empirical assessment of the SERVPERF scale. Journal of Marketing

International Journal of Academic Research in Business and Social Sciences October 2014, Vol. 4, No. 10
ISSN: 2222-6990
665 www.hrmars.com
Theory and Practice. Fall, pp. 52-69.
Cronin, J. & Taylor, S. (1994) SERVPERF versus SERVQUAL reconciling performance-based and perceptions-minus-expectations measurement of service quality. Journal of Marketing. vol. 58(January), pp. 125-131.
Crosby, P. B. (1979) Quality is Free, London, McGraw-Hill.
Deming, W. E.(1986) Out of the Crisis. Cambridge, MA. MIT Centre for Advanced Engineering Study.
Devlin, S.J., Dong, H.K. & Brown, M. (1993) Selecting a scale for measuring quality, Marketing research: A Magazine of Management and Applications. vol. 5 no. 3, pp. 12-17.
Ford, J.W., Joseph, M. & Joseph, B. (1993) Service quality in higher education: a comparison of universities in the United States and New Zealand using SERVQUAL Norfolk, VA. Unpublished manuscript, Old Dominion University.
Gale, B. T. (1994), Managing customer value: Creating quality and service that customers can see. New York, NY. The Free Press.
Hair, J. F. Jr., Anderson, R. E., Tatham, R. L., & Black, W. C. (1998) Multivariate Data Analysis with Readings (5th ed.) New Jersey: Prentice Hall, Inc.
Hempel, D.J. (1997), Customer satisfaction with the home buying process conceptualization and measurement: The conceptualization of consumer satisfaction and dissatisfaction. Cambridge, MA., Marketing Science Institute.
Hill, F. (1995) Managing service quality in higher education: the role of the student as primary consumer. Quality Assurance in Education. vol. 3 no. 3 pp. 10-21.
Indramalar, S., Gomez, G. & Khoo, J. (2004) New Education Ministry long overdue. The Star , Star Publications Ltd, Kuala Lumpur, Wednesday 31st March p.10.
Juran, J. M. (1988), Juran on Planning for Quality. New York Macmillan, Free Press
Kellogg, D. L., Youngdahl, W. E., & Bowen, D. E. (1997) On the correlation between customer participation and satisfaction: Two frameworks. International, Journal of Service Industry Management. vol. 8 no. 3 pp: 206-19
Kerlinger, F. (1986) Foundations of Behavioral Research, New York: Holt, Rinehart & Winston
Khatibi, A. A., Ismail, H. & Thyagarajan (2002) What drives customer loyalty: An analysis from telecommunications industry. Journal of Targeting, Measurement and Analysis for Marketing vol. 11 no. 1 pp. 34-44.
Kleinbaum, D. G., Kupper, L. & Muller, K. (1988) Applied Regression Analysis and Other Multivariate Methods Boston: PWS-KENT
Kotler, P. (1996) Marketing Management: Analysis, planning, implementation, and control 9th ed.

International Journal of Academic Research in Business and Social Sciences October 2014, Vol. 4, No. 10
ISSN: 2222-6990
666 www.hrmars.com
Englewoods Cliffs, NJ. Prentice-Hall.
Krejcie, R.& Morgan, D. (1970) Determining sample size for research activities. Educational and Psychological Measurement vol. 30 no. 3:pp. 607-610.
Kumar, S. A. & Termizi, A. T. (2005) Langkah selamatkan institusi pengajian tinggi, Utusan Malaysia , Saturday 4th of June 2005, p. 1
Kwan, P. Y. K. & Ng, P. W. K. (1999) Quality indicators in Higher Education: Comparing Hong Kong and China’s students. Managerial Auditing Journal vol. 14 no. 1/2 pp. 20-27.
Malhostra, N. K. (1999) Marketing research: An applied orientation (3rd ed.) New Jersey: Prentice Hall
Martensen, A., Gronholdt, L., Eskildsen, J. K. and Kristensen, K. (2000) Measuring student oriented quality in higher education: Application of the ESCI methodology. Sinergie rapporti di ricerca n. 9/2000 pp.371-383
Nicholls, J. A. F., Gilbert, G. R. & Roslow, S. (1998) Parsimonious measurement of customer satisfaction with personal service and the service setting. Journal of Consumer Marketing, vol. 15, no.3, pp. 239-252.
Norusis, M. J. (1997) SPSS for Windows: Guide to Data Analysis Release 7.5 New Jersey: Prentice Hall
Nunnally, J. (1978) Psychometric theory (2nd ed.). New York: McGraw Hill
Oakland, J. S. & Oakland, S. (1998), The links between people management, customer satisfaction and business results. Total Quality Management vol. 9, no. 4-5, pp. 185 –190.
Oliver, R. L. (1980) A cognitive model of the antecedents and consequences of satisfaction decisions. Journal of Marketing Research. vol. 17(November), pp. 460-9.
Oliver, R. L. (1989) Processing of the satisfaction responses in consumption: a suggested framework and research propositions. Journal of Consumer Satisfaction, Dissatisfaction and Complaining Behaviour. vol. 2, pp. 1-16.
Oliver R. L. (1996). Satisfaction: A behavioral perspective on the customer. New York.
McGraw-Hill.
Oliver, R. L. (1997). Satisfaction: A behavioural perspective on the consumer. New York, NY, McGraw Hill
Parasuraman, A., Zeithaml, V. & Berry, L. (1985) A Conceptual Model of Service Quality and Its Implications for Future Research. Journal of Marketing. vol. 49, pp. 41-50.
Parasuraman, A., Zeithaml, V. & Berry, L. (1988) SERVQUAL: A multiple-item scale for measuring

International Journal of Academic Research in Business and Social Sciences October 2014, Vol. 4, No. 10
ISSN: 2222-6990
667 www.hrmars.com
consumer perceptions of service quality. Journal of Retailing. vol. 64 no. 1, Spring pp. 12-40.
Parasuraman, A., Berry, L. L., & Zeithaml, V. (1990) Guidelines for conducting service research, Marketing Research. vol. December, pp. 34-44.
Parasuraman, A., Berry, L. & Zeithaml, V. (1991a) Understanding customer’s expectations of service. Sloan Management Review Spring, pp.39-48
Parasuraman, A., Berry, L. & Zeithaml, V. (1991b) Refinement and reassessment of the SERVQUAL scale. Journal of Retailing. vol 67, no. 4, Winter, pp. 420-450.
Parasuraman, A., Berry, L. & Zeithaml, V. (1993) More on improving service quality measurement. Journal of Retailing. vol. 69, no. 1, pp. 140-147.
Parasuraman, A., Zeithaml, V. A., & Berry, L. L. (1994a) Reassessment of expectations as a comparison standard in measuring service quality: Implication for future research. Journal of Marketing. Vol. 58, January, pp. 111-24.
Parasuraman, A., Zeithaml, V. A., & Berry, L. L. (1994b), Moving forward in service quality research: Measuring different customers’ expectation levels, comparing alternative scales and examining the performance behavioural intentions link. Cambridge, Mass: Marketing Science Institute.
Roest, H., Pieters, R., (1997) The nomological of perceived service quality, International Journal of Service Industry Management. vol. 8, no. 4, pp. 336-51.
Salkind, N.J. (2000) Exploring research. 4th ed, New Jersey, Prentice Hall.
Sallis, E., (1993) Total quality Management in education. London: Kogan Page Educational Management Series.
Sekaran (2000) Research Methods for Business: A Skill Building Approach. 3rd ed New York : John Wiley & Sons, Inc.
Slade, P., Harker, M. & Harker, D. (2000) Why do they leave, why do they stay? Perceptions of service quality at a new university, ANZMAC 2000 Visionary Marketing for the 21st Century: Facing the Challenge pp. 1197-1200
Solomon, M. R. (1991), Consumer behaviour: Buying, Having, and Being. Boston, MA. Allyn and Bacon..
Soutar, G. & McNeil, M. (1996) Measuring service quality in a tertiary institution. Journal of Educational Administration. vol. 34, no 1, pp. 72-82.
Stauss, B. & Neuhaus, P. (1997) The qualitative satisfaction model. International Journal of Service Industry Management. vol. 8, no. 3, pp. 236-49.
Sureshchandar, G. S., Rajendran, C. & Anantharaman, R. N. (2001) A holistic model for quality service. International Journal of Service Industry Management vol.22, no. 4, pp. 378-412.

International Journal of Academic Research in Business and Social Sciences October 2014, Vol. 4, No. 10
ISSN: 2222-6990
668 www.hrmars.com
Sureshchandar, G. S., Rajendran, C. & Anantharaman, R. N. (2002) Determinants of customer-perceived service quality: a confirmatory factor analysis approach. Journal of Services Marketing. vol. 16 no. 1, pp. 9-34.
The global ranking of the World’s 200 Best Universities of The Times Higher Education Supplement (THES) 2004 [Online] Available:http://www.thes.co.uk/in.November 2004 [Accessed 18 December 2004]
Wahid, R. A. (2003) Improving service quality. New Straits Times (Malaysia). April 19, 2003, Appointments; p. 2-EX
Wallace, J. B. (1999) The case for student as customer. Quality Progress vol 32, February, pp 57-51
Yoke, L. M., & Boey, J. (2001) Study in Malaysia Handbook: Your essential guide to studying and living in Malaysia. Petaling Jaya. 2nd International Edition Challenger Concept.
Zikmund, W. G.(1994) Business Research Methods 4th ed. ; International Edition. Fort Worth. The Dryden Press: Harcourt Brace College Publishers.