the little data book on information and communication ... · iv 2014 the little data book on...
TRANSCRIPT


2014 THE LITTLE DATA BOOKON INFORMATION ANDCOMMUNICATIONTECHNOLOGY

© 2014 International Bank for Reconstruction and Development / The World Bank1818 H Street NW, Washington DC 20433Telephone: 202-473-1000; Internet: www.worldbank.orgSome rights reserved1 2 3 4 17 16 15 14
This work is a product of the staff of The World Bank with external contributions. The find-ings, interpretations, and conclusions expressed in this work do not necessarily reflect the views of The World Bank, its Board of Executive Directors, or the governments they repre-sent. The World Bank does not guarantee the accuracy of the data included in this work. The boundaries, colors, denominations, and other information shown on any map in this work do not imply any judgment on the part of The World Bank concerning the legal status of any territory or the endorsement or acceptance of such boundaries.
Nothing herein shall constitute or be considered to be a limitation upon or waiver of the privileges and immunities of The World Bank, all of which are specifically reserved.
Rights and Permissions
This work is available under the Creative Commons Attribution 3.0 IGO license (CC BY 3.0 IGO) http://creativecommons.org/licenses/by/3.0/igo. Under the Creative Commons Attribution license, you are free to copy, distribute, transmit, and adapt this work, including for commercial purposes, under the following conditions:
Attribution—Please cite the work as follows: The Little Data Book on Information and
Communication Technology 2014. 2014. Washington, DC: World Bank. doi:10.1596/978-1-4648-0177-8. License: Creative Commons Attribution CC BY 3.0 IGO
Translations—If you create a translation of this work, please add the following disclaimer along with the attribution: This translation was not created by The World Bank and
should not be considered an official World Bank translation. The World Bank shall not
be liable for any content or error in this translation.
Adaptations—If you create an adaptation of this work, please add the following disclaimer along with the attribution: This is an adaptation of an original work by The World Bank.
Responsibility for the views and opinions expressed in the adaptation rests solely with
the author or authors of the adaptation and are not endorsed by The World Bank.
Third-party content—The World Bank does not necessarily own each component of the content contained within the work. The World Bank therefore does not warrant that the use of any third-party-owned individual component or part contained in the work will not infringe on the rights of those third parties. The risk of claims resulting from such infringement rests solely with you. If you wish to re-use a component of the work, it is your responsibility to determine whether permission is needed for that re-use and to obtain permission from the copyright owner. Examples of components can include, but are not limited to, tables, figures, or images.
All queries on rights and licenses should be addressed to the Publishing and Knowledge Division, The World Bank, 1818 H Street NW, Washington, DC 20433, USA; fax: 202-522-2625; e-mail: [email protected].
ISBN (paper): 978-1-4648-0177-8ISBN (electronic): 978-1-4648-0178-5DOI: 10.1596/978-1-4648-0177-8
Design by Communications Development Incorporated, Washington, D.C.

iiiThe Little Data Book on Information and Communication Technology 2014
Acknowledgments . . . . . . . . . . . . . . . . . . . . . . . . . . . . . . . . . . . . . . . . . iv
Preface. . . . . . . . . . . . . . . . . . . . . . . . . . . . . . . . . . . . . . . . . . . . . . . . . .v
Data notes . . . . . . . . . . . . . . . . . . . . . . . . . . . . . . . . . . . . . . . . . . . . . . vi
Regional tables . . . . . . . . . . . . . . . . . . . . . . . . . . . . . . . . . . . . . . . . . . . 1
World . . . . . . . . . . . . . . . . . . . . . . . . . . . . . . . . . . . . . . . . . . . . . . . 2
East Asia and Pacific . . . . . . . . . . . . . . . . . . . . . . . . . . . . . . . . . . . . 3
Europe and Central Asia. . . . . . . . . . . . . . . . . . . . . . . . . . . . . . . . . . 4
Latin America and the Caribbean . . . . . . . . . . . . . . . . . . . . . . . . . . . 5
Middle East and North Africa . . . . . . . . . . . . . . . . . . . . . . . . . . . . . . 6
South Asia . . . . . . . . . . . . . . . . . . . . . . . . . . . . . . . . . . . . . . . . . . . 7
Sub-Saharan Africa . . . . . . . . . . . . . . . . . . . . . . . . . . . . . . . . . . . . . 8
Income group tables . . . . . . . . . . . . . . . . . . . . . . . . . . . . . . . . . . . . . . . 9
Low income. . . . . . . . . . . . . . . . . . . . . . . . . . . . . . . . . . . . . . . . . . 10
Middle income. . . . . . . . . . . . . . . . . . . . . . . . . . . . . . . . . . . . . . . . 11
Lower middle income . . . . . . . . . . . . . . . . . . . . . . . . . . . . . . . . . . . 12
Upper middle income. . . . . . . . . . . . . . . . . . . . . . . . . . . . . . . . . . . 13
Low and middle income . . . . . . . . . . . . . . . . . . . . . . . . . . . . . . . . . 14
High income . . . . . . . . . . . . . . . . . . . . . . . . . . . . . . . . . . . . . . . . . 15
Euro area . . . . . . . . . . . . . . . . . . . . . . . . . . . . . . . . . . . . . . . . . . . 16
Country tables (in alphabetical order) . . . . . . . . . . . . . . . . . . . . . . . . . . 17
Notes. . . . . . . . . . . . . . . . . . . . . . . . . . . . . . . . . . . . . . . . . . . . . . . . 232
Glossary. . . . . . . . . . . . . . . . . . . . . . . . . . . . . . . . . . . . . . . . . . . . . . 233
Contents

iv 2014 The Little Data Book on Information and Communication Technology
The Little Data Book on Information and Communication Technology 2014 is a joint publication between the World Bank and the International Telecommunication Union (ITU).
For the World Bank team, the work was the result of close collaboration between the staff of the Development Data Group of the Development Economics Vice Presidency and the Transport, Water, and Information Communication Technologies Sector Unit of the World Bank. The Development Data Group team included Azita Amjadi, Federico Escaler, Buyant Erdene Khaltarkhuu, Leila Rafei, Jomo Tariku, and William Prince. The Information and Communication Technologies team included Tim Kelly and Kaoru Kimura. The work was carried out under the management of Haishan Fu and Jose Luis Irigoyen. Nora Ridolfi, Paola Scalabrin, and Janice Tuten from World Bank’s Publishing and Knowledge Division oversaw publication and dissemination of the book.
The ITU contribution was provided by the ICT Data and Statistics Division of the Telecommunication Development Bureau. The team included Susan Teltscher (Head of Division), Vanessa Gray, Esperanza Magpantay, and Ivan Vallejo. Regulatory data were provided by the Regulatory and Market Environment Division of the Telecommunication Development Bureau. The team included Makhtar Fall (Head of Division), Nancy Sundberg, and Youlia Lozanova.
The World Bank and ITU acknowledge the data provided by other sources: IMF, Netcraft, OECD, UNCTAD, UNDESA/UNPAN, UNESCO, UNPD, and UNSD.
Acknowledgments

vThe Little Data Book on Information and Communication Technology 2014
PrefaceSince the late 1990s access to information and communication technologies (ICTs) has seen tremendous growth—driven primarily by the wireless technologies and liberalization of telecommunications markets. Mobile communications have evolved from simple voice and text services to diversified innovative applications and mobile broadband Internet. By the end of 2013, there were an estimated 6.8 billion mobile-cellular subscriptions globally. The number of individuals using the Internet has risen constantly and reached an estimated 2.7 billion while the number of fixed (wired)- broadband subscriptions reached almost 700 million at the end of 2013.
The impacts of ICTs cross all sectors. Research has shown that investment in information and communication technologies is associated with such economic benefits as higher productivity, lower costs, new economic opportunities, job creation, innovation, and increased trade. ICTs also help provide better services in health and education, and strengthen social cohesion.
The Little Data Book on Information and Communication Technology 2014
illustrates the progress of this revolution for 214 economies around the world. It provides comparable statistics on the sector for 2005 and 2012 across a range of indicators, enabling readers to readily compare economies.
This book includes indicators covering the economic and social context, the structure of the information and communication technology sector, sector efficiency and capacity, and sector performance related to access, usage, quality, affordability, trade, and applications. The glossary contains definitions of the terms used in the tables.
For more information and other World Bank data publications, visit our data Web site at data.worldbank.org or the Web site of the Information and Communication Technologies Department at www.worldbank.org/ict.
For more statistics on information and communication technology infrastructure, access and usage, as well as analytical reports such as the annual Measuring the Information Society report, visit ITU’s Web site at www.itu.int/en/ITU-D/Statistics/Pages/default.aspx and the ITU ICT Eye at www.itu.int/icteye.

vi 2014 The Little Data Book on Information and Communication Technology
Data notesThe data in this book are for 2005 and 2012 or the most recent year unless
otherwise noted in the table or the glossary.
• Growth rates are proportional changes from the previous year unless
otherwise noted.
• Regional aggregates include data for low- and middle-income
economies only.
• Figures in italics indicate data for years or periods other than those
specified.
Symbols used:
.. indicates that data are not available or that aggregates cannot
be calculated because of missing data.
0 or 0.0 indicates zero or small enough that the number would round to
zero at the displayed number of decimal places.
$ indicates current U.S. dollars.
Lettered notes on some country tables can be found in the notes on
page 232.
Data are shown for economies with populations greater than 30,000 or for
smaller economies if they are members of the World Bank or the ITU. The
term country (used interchangeably with economy) does not imply political
independence or official recognition by the World Bank or the ITU but refers
to any economy for which the authorities report separate social or economic
statistics.
Aggregates for groups of economies are based on the World Bank’s regional
and income classifications. Because of missing data, aggregates should
be treated as approximations of unknown totals or average values. The
aggregation method for each indicator is noted in the glossary. Sums (s)
are simple totals of available data. Weighted averages (w) are calculated
using the value of the denominator or, in some cases, another indicator as
the weight. Median (m) calculations are based on available data and exclude
economies with populations below 1 million. For more information about
aggregation methods visit datahelpdesk.worldbank.org.
The cutoff date for data is March 1, 2014.

1The Little Data Book on Information and Communication Technology 2014
The country composition of regions is based on the World Bank’s analytical
regions and may differ from common geographic usage. These regions include
low- and middle-income economies only.
East Asia and Pacific
American Samoa, Cambodia, China, Fiji, Indonesia, Kiribati, Democratic
People’s Republic of Korea, Lao People’s Democratic Republic, Malaysia,
Marshall Islands, Federated States of Micronesia, Mongolia, Myanmar,
Palau, Papua New Guinea, the Philippines, Samoa, Solomon Islands,
Thailand, Timor-Leste, Tonga, Tuvalu, Vanuatu, Vietnam
Europe and Central Asia
Albania, Armenia, Azerbaijan, Belarus, Bosnia and Herzegovina, Bulgaria, Georgia, Hungary, Kazakhstan, Kosovo, Kyrgyz Republic, Former Yugoslav Republic of Macedonia, Moldova, Montenegro, Romania, Serbia, Tajikistan, Turkey, Turkmenistan, Ukraine, Uzbekistan
Latin America and the Caribbean
Argentina, Belize, Bolivia, Brazil, Colombia, Costa Rica, Cuba, Dominica, Dominican Republic, Ecuador, El Salvador, Grenada, Guatemala, Guyana, Haiti, Honduras, Jamaica, Mexico, Nicaragua, Panama, Paraguay, Peru, St. Lucia, St. Vincent and the Grenadines, Suriname, República Bolivariana de Venezuela
Middle East and North Africa
Algeria, Djibouti, Arab Republic of Egypt, Islamic Republic of Iran, Iraq, Jordan, Lebanon, Libya, Morocco, Syrian Arab Republic, Tunisia, West Bank and Gaza, Republic of Yemen
South Asia
Afghanistan, Bangladesh, Bhutan, India, Maldives, Nepal, Pakistan, Sri Lanka
Sub-Saharan Africa
Angola, Benin, Botswana, Burkina Faso, Burundi, Cabo Verde, Cameroon, Central African Republic, Chad, Comoros, Democratic Republic of Congo, Republic of Congo, Côte d’Ivoire, Eritrea, Ethiopia, Gabon, The Gambia, Ghana, Guinea, Guinea-Bissau, Kenya, Lesotho, Liberia, Madagascar, Malawi, Mali, Mauritania, Mauritius, Mozambique, Namibia, Niger, Nigeria, Rwanda, São Tomé and Príncipe, Senegal, Seychelles, Sierra Leone, Somalia, South Africa, South Sudan, Sudan, Swaziland, Tanzania, Togo, Uganda, Zambia, Zimbabwe
Regional tables

2 2014 The Little Data Book on Information and Communication Technology
2005 2012
Economic and social contextPopulation (millions)Urban population (% of total)GNI per capita, World Bank Atlas method ($)GDP growth, 2000–05 and 2005–12 (avg. annual %)Adult literacy rate (% ages 15 and older) Gross primary, secondary, tertiary school enrollment (%)
Sector structureSeparate telecommunications/ICT regulatorStatus of main fixed-line telephone operatorLevel of competition (competition, partial comp., monopoly) International gateway(s) Mobile telephone service Internet serviceForeign ownership (not allowed, restricted, allowed)Reg. treatment of VoIP (banned, closed, no framework, allowed)
Sector efficiency and capacityTelecommunications revenue (% of GDP)Telecommunications investment (% of revenue)
Sector performanceAccess
Fixed-telephone subscriptions (per 100 people)Mobile-cellular telephone subscriptions (per 100 people)Fixed (wired)-broadband subscriptions (per 100 people)Households with a computer (%)Households with Internet access at home (%)Usage
Int’l. voice traffic, total (minutes/subscription/month)Domestic mobile traffic (minutes/subscription/month)Individuals using the Internet (%)Quality
Population covered by a mobile-cellular network (%)Fixed (wired)-broadband subscriptions (% of total Internet)International Internet bandwidth (bit/s per Internet user)Affordability
Fixed-telephone sub-basket ($ a month)Mobile-cellular sub-basket ($ a month)Fixed-broadband sub-basket ($ a month)Trade
ICT goods exports (% of total goods exports)ICT goods imports (% of total goods imports)ICT service exports (% of total service exports)Applications
Online service index (0–1, 1=highest presence)Secure Internet servers (per million people)
World
6,491 7,04449 53
7,208 10,1812.9 2.182 84
67 71
3.0 2.6
17.9 17.7
19.4 16.733.9 89.3
3.4 9.227.6 40.318.9 37.4
.. 7.1
.. ..15.8 35.5
67 93
49.7 93.34,848 41,190
.. 10.4
.. 14.6
.. 23.2
13.6 10.413.8 11.228.6 31.7
0.45 0.4164.9 160.4
3The Little Data Book on Information and Communication Technology 2014
2005 2012
Economic and social contextPopulation (millions)Urban population (% of total)GNI per capita, World Bank Atlas method ($)GDP growth, 2000–05 and 2005–12 (avg. annual %)Adult literacy rate (% ages 15 and older) Gross primary, secondary, tertiary school enrollment (%)
Sector structureSeparate telecommunications/ICT regulatorStatus of main fixed-line telephone operatorLevel of competition (competition, partial comp., monopoly) International gateway(s) Mobile telephone service Internet serviceForeign ownership (not allowed, restricted, allowed)Reg. treatment of VoIP (banned, closed, no framework, allowed)
Sector efficiency and capacityTelecommunications revenue (% of GDP)Telecommunications investment (% of revenue)
Sector performanceAccess
Fixed-telephone subscriptions (per 100 people)Mobile-cellular telephone subscriptions (per 100 people)Fixed (wired)-broadband subscriptions (per 100 people)Households with a computer (%)Households with Internet access at home (%)Usage
Int’l. voice traffic, total (minutes/subscription/month)Domestic mobile traffic (minutes/subscription/month)Individuals using the Internet (%)Quality
Population covered by a mobile-cellular network (%)Fixed (wired)-broadband subscriptions (% of total Internet)International Internet bandwidth (bit/s per Internet user)Affordability
Fixed-telephone sub-basket ($ a month)Mobile-cellular sub-basket ($ a month)Fixed-broadband sub-basket ($ a month)Trade
ICT goods exports (% of total goods exports)ICT goods imports (% of total goods imports)ICT service exports (% of total service exports)Applications
Online service index (0–1, 1=highest presence)Secure Internet servers (per million people)
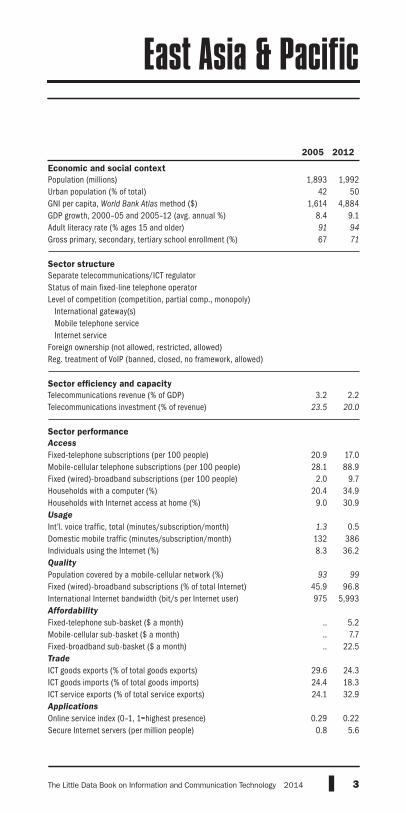
East Asia & Pacific
1,893 1,99242 50
1,614 4,8848.4 9.191 94
67 71
3.2 2.223.5 20.0
20.9 17.028.1 88.9
2.0 9.720.4 34.9
9.0 30.9
1.3 0.5132 3868.3 36.2
93 99
45.9 96.8975 5,993
.. 5.2
.. 7.7
.. 22.5
29.6 24.324.4 18.324.1 32.9
0.29 0.220.8 5.6

4 2014 The Little Data Book on Information and Communication Technology
2005 2012
Economic and social contextPopulation (millions)Urban population (% of total)GNI per capita, World Bank Atlas method ($)GDP growth, 2000–05 and 2005–12 (avg. annual %)Adult literacy rate (% ages 15 and older) Gross primary, secondary, tertiary school enrollment (%)
Sector structureSeparate telecommunications/ICT regulatorStatus of main fixed-line telephone operatorLevel of competition (competition, partial comp., monopoly) International gateway(s) Mobile telephone service Internet serviceForeign ownership (not allowed, restricted, allowed)Reg. treatment of VoIP (banned, closed, no framework, allowed)
Sector efficiency and capacityTelecommunications revenue (% of GDP)Telecommunications investment (% of revenue)
Sector performanceAccess
Fixed-telephone subscriptions (per 100 people)Mobile-cellular telephone subscriptions (per 100 people)Fixed (wired)-broadband subscriptions (per 100 people)Households with a computer (%)Households with Internet access at home (%)Usage
Int’l. voice traffic, total (minutes/subscription/month)Domestic mobile traffic (minutes/subscription/month)Individuals using the Internet (%)Quality
Population covered by a mobile-cellular network (%)Fixed (wired)-broadband subscriptions (% of total Internet)International Internet bandwidth (bit/s per Internet user)Affordability
Fixed-telephone sub-basket ($ a month)Mobile-cellular sub-basket ($ a month)Fixed-broadband sub-basket ($ a month)Trade
ICT goods exports (% of total goods exports)ICT goods imports (% of total goods imports)ICT service exports (% of total service exports)Applications
Online service index (0–1, 1=highest presence)Secure Internet servers (per million people)
260 27158 60
3,491 6,6645.8 3.197 98
77 80
3.5 2.4
23.0 19.6
22.1 21.449.6 108.51.2 10.1
14.7 44.86.8 41.4
.. ..
.. 95
12.0 43.3
92 99
30.7 92.22,797 42,572
.. 3.7
.. 12.5
.. 12.1
7.6 5.38.0 6.7
10.5 16.6
0.46 0.467.8 42.0
Europe & Central Asia

5The Little Data Book on Information and Communication Technology 2014
2005 2012
Economic and social contextPopulation (millions)Urban population (% of total)GNI per capita, World Bank Atlas method ($)GDP growth, 2000–05 and 2005–12 (avg. annual %)Adult literacy rate (% ages 15 and older) Gross primary, secondary, tertiary school enrollment (%)
Sector structureSeparate telecommunications/ICT regulatorStatus of main fixed-line telephone operatorLevel of competition (competition, partial comp., monopoly) International gateway(s) Mobile telephone service Internet serviceForeign ownership (not allowed, restricted, allowed)Reg. treatment of VoIP (banned, closed, no framework, allowed)
Sector efficiency and capacityTelecommunications revenue (% of GDP)Telecommunications investment (% of revenue)
Sector performanceAccess
Fixed-telephone subscriptions (per 100 people)Mobile-cellular telephone subscriptions (per 100 people)Fixed (wired)-broadband subscriptions (per 100 people)Households with a computer (%)Households with Internet access at home (%)Usage
Int’l. voice traffic, total (minutes/subscription/month)Domestic mobile traffic (minutes/subscription/month)Individuals using the Internet (%)Quality
Population covered by a mobile-cellular network (%)Fixed (wired)-broadband subscriptions (% of total Internet)International Internet bandwidth (bit/s per Internet user)Affordability
Fixed-telephone sub-basket ($ a month)Mobile-cellular sub-basket ($ a month)Fixed-broadband sub-basket ($ a month)Trade
ICT goods exports (% of total goods exports)ICT goods imports (% of total goods imports)ICT service exports (% of total service exports)Applications
Online service index (0–1, 1=highest presence)Secure Internet servers (per million people)
536 58177 79
4,368 9,0702.5 3.690 91
81 83
3.3 3.0
20.3 16.2
17.3 17.842.1 108.11.4 8.0
16.8 38.79.4 33.1
.. ..43 93
16.0 42.7
89 9953.8 89.3
1,156 28,238
.. 7.9
.. 14.9
.. 20.4
8.5 8.413.7 12.6
.. ..
0.47 0.439.8 36.4
Latin America & Caribbean

6 2014 The Little Data Book on Information and Communication Technology
2005 2012
Economic and social contextPopulation (millions)Urban population (% of total)GNI per capita, World Bank Atlas method ($)GDP growth, 2000–05 and 2005–12 (avg. annual %)Adult literacy rate (% ages 15 and older) Gross primary, secondary, tertiary school enrollment (%)
Sector structureSeparate telecommunications/ICT regulatorStatus of main fixed-line telephone operatorLevel of competition (competition, partial comp., monopoly) International gateway(s) Mobile telephone service Internet serviceForeign ownership (not allowed, restricted, allowed)Reg. treatment of VoIP (banned, closed, no framework, allowed)
Sector efficiency and capacityTelecommunications revenue (% of GDP)Telecommunications investment (% of revenue)
Sector performanceAccess
Fixed-telephone subscriptions (per 100 people)Mobile-cellular telephone subscriptions (per 100 people)Fixed (wired)-broadband subscriptions (per 100 people)Households with a computer (%)Households with Internet access at home (%)Usage
Int’l. voice traffic, total (minutes/subscription/month)Domestic mobile traffic (minutes/subscription/month)Individuals using the Internet (%)Quality
Population covered by a mobile-cellular network (%)Fixed (wired)-broadband subscriptions (% of total Internet)International Internet bandwidth (bit/s per Internet user)Affordability
Fixed-telephone sub-basket ($ a month)Mobile-cellular sub-basket ($ a month)Fixed-broadband sub-basket ($ a month)Trade
ICT goods exports (% of total goods exports)ICT goods imports (% of total goods imports)ICT service exports (% of total service exports)Applications
Online service index (0–1, 1=highest presence)Secure Internet servers (per million people)
301 34058 60
1,996 3,450
4.5 4.268 77
68 72
3.2 2.7
21.7 15.6
14.4 16.122.4 95.1
0.4 2.915.4 34.78.9 27.9
8.5 6.1
.. ..8.5 30.7
79 97.. 53.8
645 7,114
.. 4.5
.. 10.9
.. 14.4
0.7 0.8
5.2 4.1
.. ..
0.35 0.340.6 3.5
Middle East & North Africa

7The Little Data Book on Information and Communication Technology 2014
2005 2012
Economic and social contextPopulation (millions)Urban population (% of total)GNI per capita, World Bank Atlas method ($)GDP growth, 2000–05 and 2005–12 (avg. annual %)Adult literacy rate (% ages 15 and older) Gross primary, secondary, tertiary school enrollment (%)
Sector structureSeparate telecommunications/ICT regulatorStatus of main fixed-line telephone operatorLevel of competition (competition, partial comp., monopoly) International gateway(s) Mobile telephone service Internet serviceForeign ownership (not allowed, restricted, allowed)Reg. treatment of VoIP (banned, closed, no framework, allowed)
Sector efficiency and capacityTelecommunications revenue (% of GDP)Telecommunications investment (% of revenue)
Sector performanceAccess
Fixed-telephone subscriptions (per 100 people)Mobile-cellular telephone subscriptions (per 100 people)Fixed (wired)-broadband subscriptions (per 100 people)Households with a computer (%)Households with Internet access at home (%)Usage
Int’l. voice traffic, total (minutes/subscription/month)Domestic mobile traffic (minutes/subscription/month)Individuals using the Internet (%)Quality
Population covered by a mobile-cellular network (%)Fixed (wired)-broadband subscriptions (% of total Internet)International Internet bandwidth (bit/s per Internet user)Affordability
Fixed-telephone sub-basket ($ a month)Mobile-cellular sub-basket ($ a month)Fixed-broadband sub-basket ($ a month)Trade
ICT goods exports (% of total goods exports)ICT goods imports (% of total goods imports)ICT service exports (% of total service exports)Applications
Online service index (0–1, 1=highest presence)Secure Internet servers (per million people)
1,499 1,64929 31
700 1,4376.3 7.158 62
56 62
2.4 2.3
37.8 36.3
4.0 2.67.8 68.90.1 1.12.0 10.31.4 8.6
5.3 6.0
.. ..2.5 11.6
37 85
14.9 56.9560 5,284
.. 3.0
.. 3.5
.. 7.0
1.0 1.77.6 5.0
61.6 62.0
0.31 0.360.5 3.3
South Asia

8 2014 The Little Data Book on Information and Communication Technology
2005 2012
Economic and social contextPopulation (millions)Urban population (% of total)GNI per capita, World Bank Atlas method ($)GDP growth, 2000–05 and 2005–12 (avg. annual %)Adult literacy rate (% ages 15 and older) Gross primary, secondary, tertiary school enrollment (%)
Sector structureSeparate telecommunications/ICT regulatorStatus of main fixed-line telephone operatorLevel of competition (competition, partial comp., monopoly) International gateway(s) Mobile telephone service Internet serviceForeign ownership (not allowed, restricted, allowed)Reg. treatment of VoIP (banned, closed, no framework, allowed)
Sector efficiency and capacityTelecommunications revenue (% of GDP)Telecommunications investment (% of revenue)
Sector performanceAccess
Fixed-telephone subscriptions (per 100 people)Mobile-cellular telephone subscriptions (per 100 people)Fixed (wired)-broadband subscriptions (per 100 people)Households with a computer (%)Households with Internet access at home (%)Usage
Int’l. voice traffic, total (minutes/subscription/month)Domestic mobile traffic (minutes/subscription/month)Individuals using the Internet (%)Quality
Population covered by a mobile-cellular network (%)Fixed (wired)-broadband subscriptions (% of total Internet)International Internet bandwidth (bit/s per Internet user)Affordability
Fixed-telephone sub-basket ($ a month)Mobile-cellular sub-basket ($ a month)Fixed-broadband sub-basket ($ a month)Trade
ICT goods exports (% of total goods exports)ICT goods imports (% of total goods imports)ICT service exports (% of total service exports)Applications
Online service index (0–1, 1=highest presence)Secure Internet servers (per million people)
757 91134 37
763 1,3504.6 4.757 60
52 58
4.7 3.8
.. 23.8
1.5 1.212.0 59.3
0.0 0.23.6 8.11.1 8.0
.. 5.1
.. 302
2.1 14.8
51 84.. 39.8
232 6,430
.. 10.5
.. 14.6
.. 46.6
0.6 0.57.6 5.8
12.5 14.4
0.25 0.272.1 6.8
Sub-Saharan Africa

9The Little Data Book on Information and Communication Technology 2014
For operational and analytical purposes the World Bank’s main criterion
for classifying economies is gross national income (GNI) per capita. Every
economy in The Little Data Book on Information and Communication Technology
is classified as low income, middle income, or high income. Low- and middle-
income economies are sometimes referred to as developing economies. The
use of the term is convenient; it is not intended to imply that all economies in
the group are experiencing similar development or that other economies have
reached a preferred or final stage of development. Classification by income
does not necessarily reflect development status. Note: Classifications are
fixed during the World Bank’s fiscal year (ending on June 30), thus countries
remain in the categories in which they are classified irrespective of any
revisions to their per capita income data.
Low-income economies are those with a GNI per capita of $1,035 or less in 2012.
Middle-income economies are those with a GNI per capita of more than $1,035 but less than $12,616. Lower-middle-income and upper-middle income economies are separated at a GNI per capita of $4,085.
High-income economies are those with a GNI per capita of $12,616 or more.
Euro area includes the member states of the Economic and Monetary Union of the European Union that have adopted the euro as their currency: Austria, Belgium, Cyprus, Estonia, Finland, France, Germany, Greece, Ireland, Italy, Latvia, Luxembourg, Malta, the Netherlands, Portugal, Slovak Republic, Slovenia, and Spain.
Income group tables

10 2014 The Little Data Book on Information and Communication Technology
2005 2012
Economic and social contextPopulation (millions)Urban population (% of total)GNI per capita, World Bank Atlas method ($)GDP growth, 2000–05 and 2005–12 (avg. annual %)Adult literacy rate (% ages 15 and older) Gross primary, secondary, tertiary school enrollment (%)
Sector structureSeparate telecommunications/ICT regulatorStatus of main fixed-line telephone operatorLevel of competition (competition, partial comp., monopoly) International gateway(s) Mobile telephone service Internet serviceForeign ownership (not allowed, restricted, allowed)Reg. treatment of VoIP (banned, closed, no framework, allowed)
Sector efficiency and capacityTelecommunications revenue (% of GDP)Telecommunications investment (% of revenue)
Sector performanceAccess
Fixed-telephone subscriptions (per 100 people)Mobile-cellular telephone subscriptions (per 100 people)Fixed (wired)-broadband subscriptions (per 100 people)Households with a computer (%)Households with Internet access at home (%)Usage
Int’l. voice traffic, total (minutes/subscription/month)Domestic mobile traffic (minutes/subscription/month)Individuals using the Internet (%)Quality
Population covered by a mobile-cellular network (%)Fixed (wired)-broadband subscriptions (% of total Internet)International Internet bandwidth (bit/s per Internet user)Affordability
Fixed-telephone sub-basket ($ a month)Mobile-cellular sub-basket ($ a month)Fixed-broadband sub-basket ($ a month)Trade
ICT goods exports (% of total goods exports)ICT goods imports (% of total goods imports)ICT service exports (% of total service exports)Applications
Online service index (0–1, 1=highest presence)Secure Internet servers (per million people)
727 84626 28
330 5904.8 5.957 61
51 60
2.5 5.0
.. ..
0.9 1.04.6 47.20.0 0.21.0 4.20.3 3.4
.. ..
.. 700.9 6.2
51 ..4.5 30.9
208 9,141
.. 8.9
.. 11.9
.. 46.9
0.2 ..4.8 ..
.. ..
0.22 0.200.1 1.1
Low income

11The Little Data Book on Information and Communication Technology 2014
2005 2012
Economic and social contextPopulation (millions)Urban population (% of total)GNI per capita, World Bank Atlas method ($)GDP growth, 2000–05 and 2005–12 (avg. annual %)Adult literacy rate (% ages 15 and older) Gross primary, secondary, tertiary school enrollment (%)
Sector structureSeparate telecommunications/ICT regulatorStatus of main fixed-line telephone operatorLevel of competition (competition, partial comp., monopoly) International gateway(s) Mobile telephone service Internet serviceForeign ownership (not allowed, restricted, allowed)Reg. treatment of VoIP (banned, closed, no framework, allowed)
Sector efficiency and capacityTelecommunications revenue (% of GDP)Telecommunications investment (% of revenue)
Sector performanceAccess
Fixed-telephone subscriptions (per 100 people)Mobile-cellular telephone subscriptions (per 100 people)Fixed (wired)-broadband subscriptions (per 100 people)Households with a computer (%)Households with Internet access at home (%)Usage
Int’l. voice traffic, total (minutes/subscription/month)Domestic mobile traffic (minutes/subscription/month)Individuals using the Internet (%)Quality
Population covered by a mobile-cellular network (%)Fixed (wired)-broadband subscriptions (% of total Internet)International Internet bandwidth (bit/s per Internet user)Affordability
Fixed-telephone sub-basket ($ a month)Mobile-cellular sub-basket ($ a month)Fixed-broadband sub-basket ($ a month)Trade
ICT goods exports (% of total goods exports)ICT goods imports (% of total goods imports)ICT service exports (% of total service exports)Applications
Online service index (0–1, 1=highest presence)Secure Internet servers (per million people)
4,518 4,89845 50
1,835 4,3705.5 6.180 83
65 69
3.3 2.5
22.1 20.0
14.3 12.324.9 87.71.2 6.0
14.9 29.37.1 25.7
3.9 4.0
.. ..7.7 29.9
86 92
42.2 91.81,084 12,511
.. 6.9
.. 13.1
.. 18.3
17.9 15.216.5 13.126.0 35.2
0.42 0.372.4 11.3
Middle income

12 2014 The Little Data Book on Information and Communication Technology
2005 2012
Economic and social contextPopulation (millions)Urban population (% of total)GNI per capita, World Bank Atlas method ($)GDP growth, 2000–05 and 2005–12 (avg. annual %)Adult literacy rate (% ages 15 and older) Gross primary, secondary, tertiary school enrollment (%)
Sector structureSeparate telecommunications/ICT regulatorStatus of main fixed-line telephone operatorLevel of competition (competition, partial comp., monopoly) International gateway(s) Mobile telephone service Internet serviceForeign ownership (not allowed, restricted, allowed)Reg. treatment of VoIP (banned, closed, no framework, allowed)
Sector efficiency and capacityTelecommunications revenue (% of GDP)Telecommunications investment (% of revenue)
Sector performanceAccess
Fixed-telephone subscriptions (per 100 people)Mobile-cellular telephone subscriptions (per 100 people)Fixed (wired)-broadband subscriptions (per 100 people)Households with a computer (%)Households with Internet access at home (%)Usage
Int’l. voice traffic, total (minutes/subscription/month)Domestic mobile traffic (minutes/subscription/month)Individuals using the Internet (%)Quality
Population covered by a mobile-cellular network (%)Fixed (wired)-broadband subscriptions (% of total Internet)International Internet bandwidth (bit/s per Internet user)Affordability
Fixed-telephone sub-basket ($ a month)Mobile-cellular sub-basket ($ a month)Fixed-broadband sub-basket ($ a month)Trade
ICT goods exports (% of total goods exports)ICT goods imports (% of total goods imports)ICT service exports (% of total service exports)Applications
Online service index (0–1, 1=highest presence)Secure Internet servers (per million people)
2,253 2,50736 39
876 1,8935.7 6.068 71
60 64
3.1 2.5
23.6 20.5
5.2 5.413.7 83.1
0.1 1.43.5 15.02.4 12.4
6.9 6.5
.. ..4.0 18.7
50 86
10.7 58.2
514 8,076
.. 4.9
.. 10.5
.. 20.6
7.4 4.69.7 7.2
36.8 47.1
0.35 0.320.7 4.4
Lower middle income

13The Little Data Book on Information and Communication Technology 2014
2005 2012
Economic and social contextPopulation (millions)Urban population (% of total)GNI per capita, World Bank Atlas method ($)GDP growth, 2000–05 and 2005–12 (avg. annual %)Adult literacy rate (% ages 15 and older) Gross primary, secondary, tertiary school enrollment (%)
Sector structureSeparate telecommunications/ICT regulatorStatus of main fixed-line telephone operatorLevel of competition (competition, partial comp., monopoly) International gateway(s) Mobile telephone service Internet serviceForeign ownership (not allowed, restricted, allowed)Reg. treatment of VoIP (banned, closed, no framework, allowed)
Sector efficiency and capacityTelecommunications revenue (% of GDP)Telecommunications investment (% of revenue)
Sector performanceAccess
Fixed-telephone subscriptions (per 100 people)Mobile-cellular telephone subscriptions (per 100 people)Fixed (wired)-broadband subscriptions (per 100 people)Households with a computer (%)Households with Internet access at home (%)Usage
Int’l. voice traffic, total (minutes/subscription/month)Domestic mobile traffic (minutes/subscription/month)Individuals using the Internet (%)Quality
Population covered by a mobile-cellular network (%)Fixed (wired)-broadband subscriptions (% of total Internet)International Internet bandwidth (bit/s per Internet user)Affordability
Fixed-telephone sub-basket ($ a month)Mobile-cellular sub-basket ($ a month)Fixed-broadband sub-basket ($ a month)Trade
ICT goods exports (% of total goods exports)ICT goods imports (% of total goods imports)ICT service exports (% of total service exports)Applications
Online service index (0–1, 1=highest presence)Secure Internet servers (per million people)
2,265 2,39154 61
2,788 6,9695.4 6.291 94
72 76
3.3 2.5
20.5 18.2
23.0 19.436.1 92.42.3 10.8
22.0 40.610.2 36.3
2.6 1.398 284
11.3 41.6
94 99
49.7 95.51,283 14,580
.. 9.4
.. 14.9
.. 17.8
20.0 17.618.5 14.720.8 29.1
0.47 0.424.1 18.5
Upper middle income
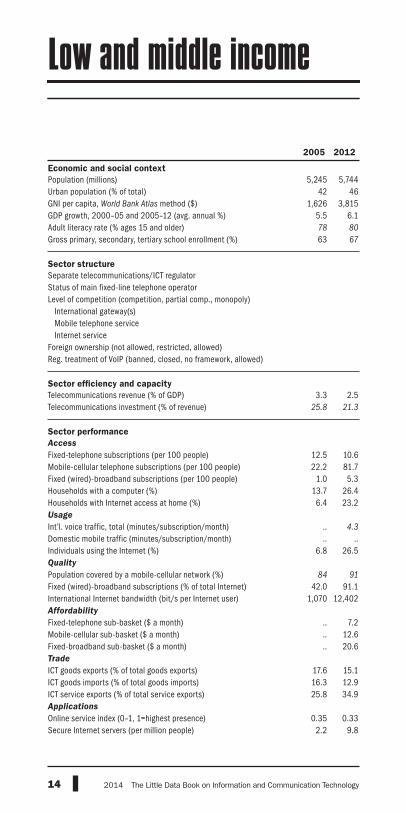
14 2014 The Little Data Book on Information and Communication Technology
2005 2012
Economic and social contextPopulation (millions)Urban population (% of total)GNI per capita, World Bank Atlas method ($)GDP growth, 2000–05 and 2005–12 (avg. annual %)Adult literacy rate (% ages 15 and older) Gross primary, secondary, tertiary school enrollment (%)
Sector structureSeparate telecommunications/ICT regulatorStatus of main fixed-line telephone operatorLevel of competition (competition, partial comp., monopoly) International gateway(s) Mobile telephone service Internet serviceForeign ownership (not allowed, restricted, allowed)Reg. treatment of VoIP (banned, closed, no framework, allowed)
Sector efficiency and capacityTelecommunications revenue (% of GDP)Telecommunications investment (% of revenue)
Sector performanceAccess
Fixed-telephone subscriptions (per 100 people)Mobile-cellular telephone subscriptions (per 100 people)Fixed (wired)-broadband subscriptions (per 100 people)Households with a computer (%)Households with Internet access at home (%)Usage
Int’l. voice traffic, total (minutes/subscription/month)Domestic mobile traffic (minutes/subscription/month)Individuals using the Internet (%)Quality
Population covered by a mobile-cellular network (%)Fixed (wired)-broadband subscriptions (% of total Internet)International Internet bandwidth (bit/s per Internet user)Affordability
Fixed-telephone sub-basket ($ a month)Mobile-cellular sub-basket ($ a month)Fixed-broadband sub-basket ($ a month)Trade
ICT goods exports (% of total goods exports)ICT goods imports (% of total goods imports)ICT service exports (% of total service exports)Applications
Online service index (0–1, 1=highest presence)Secure Internet servers (per million people)
5,245 5,74442 46
1,626 3,8155.5 6.178 80
63 67
3.3 2.5
25.8 21.3
12.5 10.622.2 81.7
1.0 5.313.7 26.46.4 23.2
.. 4.3
.. ..6.8 26.5
84 91
42.0 91.11,070 12,402
.. 7.2
.. 12.6
.. 20.6
17.6 15.116.3 12.925.8 34.9
0.35 0.332.2 9.8
Low and middle income

15The Little Data Book on Information and Communication Technology 2014
2005 2012
Economic and social contextPopulation (millions)Urban population (% of total)GNI per capita, World Bank Atlas method ($)GDP growth, 2000–05 and 2005–12 (avg. annual %)Adult literacy rate (% ages 15 and older) Gross primary, secondary, tertiary school enrollment (%)
Sector structureSeparate telecommunications/ICT regulatorStatus of main fixed-line telephone operatorLevel of competition (competition, partial comp., monopoly) International gateway(s) Mobile telephone service Internet serviceForeign ownership (not allowed, restricted, allowed)Reg. treatment of VoIP (banned, closed, no framework, allowed)
Sector efficiency and capacityTelecommunications revenue (% of GDP)Telecommunications investment (% of revenue)
Sector performanceAccess
Fixed-telephone subscriptions (per 100 people)Mobile-cellular telephone subscriptions (per 100 people)Fixed (wired)-broadband subscriptions (per 100 people)Households with a computer (%)Households with Internet access at home (%)Usage
Int’l. voice traffic, total (minutes/subscription/month)Domestic mobile traffic (minutes/subscription/month)Individuals using the Internet (%)Quality
Population covered by a mobile-cellular network (%)Fixed (wired)-broadband subscriptions (% of total Internet)International Internet bandwidth (bit/s per Internet user)Affordability
Fixed-telephone sub-basket ($ a month)Mobile-cellular sub-basket ($ a month)Fixed-broadband sub-basket ($ a month)Trade
ICT goods exports (% of total goods exports)ICT goods imports (% of total goods imports)ICT service exports (% of total service exports)Applications
Online service index (0–1, 1=highest presence)Secure Internet servers (per million people)
1,246 1,30078 80
30,693 38,4122.3 1.0
.. ..90 93
3.0 2.7
14.4 17.6
48.1 43.683.4 122.913.5 26.260.1 77.749.5 75.5
.. ..
.. 114
53.8 75.4
98 10037.9 95.9
7,041 85,990
.. 25.2
.. 20.6
.. 29.2
12.3 8.913.1 10.829.3 30.8
0.66 0.67313.4 827.6
High income

16 2014 The Little Data Book on Information and Communication Technology
2005 2012
Economic and social contextPopulation (millions)Urban population (% of total)GNI per capita, World Bank Atlas method ($)GDP growth, 2000–05 and 2005–12 (avg. annual %)Adult literacy rate (% ages 15 and older) Gross primary, secondary, tertiary school enrollment (%)
Sector structureSeparate telecommunications/ICT regulatorStatus of main fixed-line telephone operatorLevel of competition (competition, partial comp., monopoly) International gateway(s) Mobile telephone service Internet serviceForeign ownership (not allowed, restricted, allowed)Reg. treatment of VoIP (banned, closed, no framework, allowed)
Sector efficiency and capacityTelecommunications revenue (% of GDP)Telecommunications investment (% of revenue)
Sector performanceAccess
Fixed-telephone subscriptions (per 100 people)Mobile-cellular telephone subscriptions (per 100 people)Fixed (wired)-broadband subscriptions (per 100 people)Households with a computer (%)Households with Internet access at home (%)Usage
Int’l. voice traffic, total (minutes/subscription/month)Domestic mobile traffic (minutes/subscription/month)Individuals using the Internet (%)Quality
Population covered by a mobile-cellular network (%)Fixed (wired)-broadband subscriptions (% of total Internet)International Internet bandwidth (bit/s per Internet user)Affordability
Fixed-telephone sub-basket ($ a month)Mobile-cellular sub-basket ($ a month)Fixed-broadband sub-basket ($ a month)Trade
ICT goods exports (% of total goods exports)ICT goods imports (% of total goods imports)ICT service exports (% of total service exports)Applications
Online service index (0–1, 1=highest presence)Secure Internet servers (per million people)
327 33374 76
31,548 38,0301.5 0.4
.. 99
92 94
2.8 1.9
12.1 16.5
51.5 48.497.5 120.313.2 29.758.2 79.246.4 76.5
.. ..84 117
51.4 75.9
99 9958.6 97.6
9,606 100,322
.. 27.8
.. 25.2
.. 31.3
8.2 4.810.1 6.930.0 35.8
0.70 0.66144.1 662.3
Euro area

17The Little Data Book on Information and Communication Technology 2014
Cabo Verde
Cabo Verde is the new name for the country previously listed as Cape Verde.
China
Data for China do not include data for Hong Kong SAR, China; Macao SAR, China; or Taiwan, China.
Cyprus
GNI and GDP data and data calculated using GNI and GDP refer to the area controlled by the government of the Republic of Cyprus.
Georgia
GNI, GDP, and population data and data calculated using GNI, GDP, and population exclude Abkhazia and South Ossetia.
Kosovo, Montenegro, and Serbia
Montenegro declared independence from Serbia and Montenegro on June 3, 2006. Where available, data for each country are shown separately. However, some indicators for Serbia prior to 2006 include data for Montenegro. Moreover, data for most indicators for Serbia from 1999 onward exclude data for Kosovo, which in 1999 became a territory under international administration pursuant to UN Security Council Resolution 1244 (1999). Kosovo became a member of the World Bank on June 29, 2009, and its data are shown where available.
Moldova
GNI, GDP, and population data and data calculated using GNI, GDP, and population exclude Transnistria.
Morocco
GNI and GDP data and data calculated using GNI and GDP include Former Spanish Sahara.
South Sudan and Sudan
South Sudan declared its independence on July 9, 2011. Data are shown separately for South Sudan where available. However, data reported for Sudan include South Sudan unless otherwise noted.
Tanzania
GNI and GDP data and data calculated using GNI and GDP refer to mainland Tanzania only.
For more information, see World Development Indicators 2014 or data.worldbank.org.
Country tables

Economic and social contextPopulation (millions)Urban population (% of total)GNI per capita, World Bank Atlas method ($)GDP growth, 2000–05 and 2005–12 (avg. annual %)Adult literacy rate (% ages 15 and older) Gross primary, secondary, tertiary school enrollment (%)
Sector structureSeparate telecommunications/ICT regulatorStatus of main fixed-line telephone operatorLevel of competition (competition, partial comp., monopoly) International gateway(s) Mobile telephone service Internet serviceForeign ownership (not allowed, restricted, allowed)Reg. treatment of VoIP (banned, closed, no framework, allowed)
Sector efficiency and capacityTelecommunications revenue (% of GDP)Telecommunications investment (% of revenue)
Sector performanceAccess
Fixed-telephone subscriptions (per 100 people)Mobile-cellular telephone subscriptions (per 100 people)Fixed (wired)-broadband subscriptions (per 100 people)Households with a computer (%)Households with Internet access at home (%)Usage Int’l. voice traffic, total (minutes/subscription/month)Domestic mobile traffic (minutes/subscription/month)Individuals using the Internet (%)Quality Population covered by a mobile-cellular network (%)Fixed (wired)-broadband subscriptions (% of total Internet)International Internet bandwidth (bit/s per Internet user)Affordability
Fixed-telephone sub-basket ($ a month)Mobile-cellular sub-basket ($ a month)Fixed-broadband sub-basket ($ a month)Trade
ICT goods exports (% of total goods exports)ICT goods imports (% of total goods imports)ICT service exports (% of total service exports)Applications
Online service index (0–1, 1=highest presence)Secure Internet servers (per million people)
25 30 84622 24 28
250 680 5906.2 10.5 5.9
.. .. 61
53 62 60
Yes Yes
Public Public
P P
P P
P P
A A.. C
6.0 .. 5.0
37.8 .. ..
0.2 0.0 1.04.8 60.4 47.20.0 0.0 0.20.8 2.3a 4.20.8 1.9a 3.4
.. .. ..28.8 .. 70.1
1.2 5.5a 6.2
72 85 ..18.3 50.0 30.9
13 1,229 9,141
.. 1.9 8.9
.. 9.7 11.9
.. 53.5 46.9
.. .. ..
.. 0.2 ..
.. 51.6 ..
0.20 0.24 0.200.0 1.0 1.1
18 2014 The Little Data Book on Information and Communication Technology
South Asia Low income
Afghanistan
2005 2012 2012
Low-
income
groupCountry data

Economic and social contextPopulation (millions)Urban population (% of total)GNI per capita, World Bank Atlas method ($)GDP growth, 2000–05 and 2005–12 (avg. annual %)Adult literacy rate (% ages 15 and older) Gross primary, secondary, tertiary school enrollment (%)
Sector structureSeparate telecommunications/ICT regulatorStatus of main fixed-line telephone operatorLevel of competition (competition, partial comp., monopoly) International gateway(s) Mobile telephone service Internet serviceForeign ownership (not allowed, restricted, allowed)Reg. treatment of VoIP (banned, closed, no framework, allowed)
Sector efficiency and capacityTelecommunications revenue (% of GDP)Telecommunications investment (% of revenue)
Sector performanceAccess
Fixed-telephone subscriptions (per 100 people)Mobile-cellular telephone subscriptions (per 100 people)Fixed (wired)-broadband subscriptions (per 100 people)Households with a computer (%)Households with Internet access at home (%)Usage Int’l. voice traffic, total (minutes/subscription/month)Domestic mobile traffic (minutes/subscription/month)Individuals using the Internet (%)Quality Population covered by a mobile-cellular network (%)Fixed (wired)-broadband subscriptions (% of total Internet)International Internet bandwidth (bit/s per Internet user)Affordability
Fixed-telephone sub-basket ($ a month)Mobile-cellular sub-basket ($ a month)Fixed-broadband sub-basket ($ a month)Trade
ICT goods exports (% of total goods exports)ICT goods imports (% of total goods imports)ICT service exports (% of total service exports)Applications
Online service index (0–1, 1=highest presence)Secure Internet servers (per million people)
3 3 2,39147 54 61
2,540 4,030 6,9695.3 4.4 6.299 97 94
66 .. 76
Yes Yes
Public Mixed
P P
P P
C C
R RNo A
6.1 4.3 2.5
11.2 28.4 18.2
8.7 9.9 19.447.9 110.7 92.40.0 5.1 10.87.0 20.0a 40.65.0 20.5a 36.3
41.0 21.1 1.321.5 .. 284.46.0 54.7a 41.6
91 99 99
25.0 91.8 95.562 17,358 14,580
.. 7.5 9.4
.. 25.9 14.9
.. 11.9 17.8
0.6 0.4 17.63.8 3.0 14.7
10.3 10.9 29.1
0.47 0.42 0.420.3 16.1 18.5
19The Little Data Book on Information and Communication Technology 2014
Europe & Central Asia Upper middle income
Albania
2005 2012 2012
Upper
middle-
income
groupCountry data

Economic and social contextPopulation (millions)Urban population (% of total)GNI per capita, World Bank Atlas method ($)GDP growth, 2000–05 and 2005–12 (avg. annual %)Adult literacy rate (% ages 15 and older) Gross primary, secondary, tertiary school enrollment (%)
Sector structureSeparate telecommunications/ICT regulatorStatus of main fixed-line telephone operatorLevel of competition (competition, partial comp., monopoly) International gateway(s) Mobile telephone service Internet serviceForeign ownership (not allowed, restricted, allowed)Reg. treatment of VoIP (banned, closed, no framework, allowed)
Sector efficiency and capacityTelecommunications revenue (% of GDP)Telecommunications investment (% of revenue)
Sector performanceAccess
Fixed-telephone subscriptions (per 100 people)Mobile-cellular telephone subscriptions (per 100 people)Fixed (wired)-broadband subscriptions (per 100 people)Households with a computer (%)Households with Internet access at home (%)Usage Int’l. voice traffic, total (minutes/subscription/month)Domestic mobile traffic (minutes/subscription/month)Individuals using the Internet (%)Quality Population covered by a mobile-cellular network (%)Fixed (wired)-broadband subscriptions (% of total Internet)International Internet bandwidth (bit/s per Internet user)Affordability
Fixed-telephone sub-basket ($ a month)Mobile-cellular sub-basket ($ a month)Fixed-broadband sub-basket ($ a month)Trade
ICT goods exports (% of total goods exports)ICT goods imports (% of total goods imports)ICT service exports (% of total service exports)Applications
Online service index (0–1, 1=highest presence)Secure Internet servers (per million people)
34 38 2,39167 74 61
2,660 5,020 6,9695.6 2.6 6.273 .. 94
69 79 76
Yes Yes
Public Public
P P
P P
C C
.. ..A A
3.7 2.9 2.5
36.0 .. 18.2
7.6 8.3 19.440.2 97.9 92.4
0.4 2.9 10.87.1 24.2a 40.61.2 19.4a 36.3
8.1 6.8 1.312.4 191.1 284.45.8 15.2a 41.6
42 .. 99
71.1 .. 95.579 7,679 14,580
.. 6.4 9.4
.. 14.1 14.9
.. 14.1 17.8
0.0 0.0 17.67.9 4.0 14.7
29.2 59.4 29.1
0.35 0.25 0.420.1 1.5 18.5
20 2014 The Little Data Book on Information and Communication Technology
Middle East & North Africa Upper middle income
Algeria
2005 2012 2012
Upper
middle-
income
groupCountry data

Economic and social contextPopulation (millions)Urban population (% of total)GNI per capita, World Bank Atlas method ($)GDP growth, 2000–05 and 2005–12 (avg. annual %)Adult literacy rate (% ages 15 and older) Gross primary, secondary, tertiary school enrollment (%)
Sector structureSeparate telecommunications/ICT regulatorStatus of main fixed-line telephone operatorLevel of competition (competition, partial comp., monopoly) International gateway(s) Mobile telephone service Internet serviceForeign ownership (not allowed, restricted, allowed)Reg. treatment of VoIP (banned, closed, no framework, allowed)
Sector efficiency and capacityTelecommunications revenue (% of GDP)Telecommunications investment (% of revenue)
Sector performanceAccess
Fixed-telephone subscriptions (per 100 people)Mobile-cellular telephone subscriptions (per 100 people)Fixed (wired)-broadband subscriptions (per 100 people)Households with a computer (%)Households with Internet access at home (%)Usage Int’l. voice traffic, total (minutes/subscription/month)Domestic mobile traffic (minutes/subscription/month)Individuals using the Internet (%)Quality Population covered by a mobile-cellular network (%)Fixed (wired)-broadband subscriptions (% of total Internet)International Internet bandwidth (bit/s per Internet user)Affordability
Fixed-telephone sub-basket ($ a month)Mobile-cellular sub-basket ($ a month)Fixed-broadband sub-basket ($ a month)Trade
ICT goods exports (% of total goods exports)ICT goods imports (% of total goods imports)ICT service exports (% of total service exports)Applications
Online service index (0–1, 1=highest presence)Secure Internet servers (per million people)
0.06 0.06 2,39191 93 61
.. .. 6,969
.. .. 6.2
.. .. 94
.. .. 76
.. .... ..
.. ..
.. ..
.. ..
.. ..
.. ..
.. .. 2.5.. .. 18.2
17.6 18.1 19.43.8 .. 92.4
.. .. 10.8
.. .. 40.6
.. .. 36.3
.. .. 1.3
.. .. 284.4
.. .. 41.6
.. .. 99
.. .. 95.5
.. .. 14,580
.. .. 9.4
.. .. 14.9
.. .. 17.8
.. .. 17.6
.. .. 14.7
.. .. 29.1
.. .. 0.4269.1 36.4 18.5
21The Little Data Book on Information and Communication Technology 2014
East Asia & Pacific Upper middle income
American Samoa
2005 2012 2012
Upper
middle-
income
groupCountry data

Economic and social contextPopulation (millions)Urban population (% of total)GNI per capita, World Bank Atlas method ($)GDP growth, 2000–05 and 2005–12 (avg. annual %)Adult literacy rate (% ages 15 and older) Gross primary, secondary, tertiary school enrollment (%)
Sector structureSeparate telecommunications/ICT regulatorStatus of main fixed-line telephone operatorLevel of competition (competition, partial comp., monopoly) International gateway(s) Mobile telephone service Internet serviceForeign ownership (not allowed, restricted, allowed)Reg. treatment of VoIP (banned, closed, no framework, allowed)
Sector efficiency and capacityTelecommunications revenue (% of GDP)Telecommunications investment (% of revenue)
Sector performanceAccess
Fixed-telephone subscriptions (per 100 people)Mobile-cellular telephone subscriptions (per 100 people)Fixed (wired)-broadband subscriptions (per 100 people)Households with a computer (%)Households with Internet access at home (%)Usage Int’l. voice traffic, total (minutes/subscription/month)Domestic mobile traffic (minutes/subscription/month)Individuals using the Internet (%)Quality Population covered by a mobile-cellular network (%)Fixed (wired)-broadband subscriptions (% of total Internet)International Internet bandwidth (bit/s per Internet user)Affordability
Fixed-telephone sub-basket ($ a month)Mobile-cellular sub-basket ($ a month)Fixed-broadband sub-basket ($ a month)Trade
ICT goods exports (% of total goods exports)ICT goods imports (% of total goods imports)ICT service exports (% of total service exports)Applications
Online service index (0–1, 1=highest presence)Secure Internet servers (per million people)
0.08 0.08 1,30090 87 80
31,310 43,110 38,4127.1 .. 1.0
.. .. ..
.. .. 93
No No
Public Public
.. MM M.. M
No A.. ..
3.9 3.6 2.7
.. .. 17.6
43.6 48.9 43.679.5 81.5 122.912.7 34.3 26.2
.. .. 77.7
.. .. 75.5
112.6 80.2 ..65.4 53.6 113.6
37.6 86.4a 75.4
91 99 10060.7 99.4 95.9
13,750 38,388 85,990
.. .. 25.2
.. .. 20.6
.. .. 29.2
18.8 .. 8.914.0 .. 10.8
.. .. 30.8
0.52 0.31 0.67418.6 645.6 827.6
22 2014 The Little Data Book on Information and Communication Technology
High income
Andorra
2005 2012 2012
High-
income
groupCountry data

Economic and social contextPopulation (millions)Urban population (% of total)GNI per capita, World Bank Atlas method ($)GDP growth, 2000–05 and 2005–12 (avg. annual %)Adult literacy rate (% ages 15 and older) Gross primary, secondary, tertiary school enrollment (%)
Sector structureSeparate telecommunications/ICT regulatorStatus of main fixed-line telephone operatorLevel of competition (competition, partial comp., monopoly) International gateway(s) Mobile telephone service Internet serviceForeign ownership (not allowed, restricted, allowed)Reg. treatment of VoIP (banned, closed, no framework, allowed)
Sector efficiency and capacityTelecommunications revenue (% of GDP)Telecommunications investment (% of revenue)
Sector performanceAccess
Fixed-telephone subscriptions (per 100 people)Mobile-cellular telephone subscriptions (per 100 people)Fixed (wired)-broadband subscriptions (per 100 people)Households with a computer (%)Households with Internet access at home (%)Usage Int’l. voice traffic, total (minutes/subscription/month)Domestic mobile traffic (minutes/subscription/month)Individuals using the Internet (%)Quality Population covered by a mobile-cellular network (%)Fixed (wired)-broadband subscriptions (% of total Internet)International Internet bandwidth (bit/s per Internet user)Affordability
Fixed-telephone sub-basket ($ a month)Mobile-cellular sub-basket ($ a month)Fixed-broadband sub-basket ($ a month)Trade
ICT goods exports (% of total goods exports)ICT goods imports (% of total goods imports)ICT service exports (% of total service exports)Applications
Online service index (0–1, 1=highest presence)Secure Internet servers (per million people)
17 21 2,39154 60 61
1,270 4,580 6,96910.1 9.4 6.2
67 70 94
.. 73 76
Yes Yes
Public Public
C M
P C
C C
R RNo C
2.2 .. 2.5
25.3 .. 18.2
0.6 1.5 19.49.7 47.1 92.40.0 0.2 10.84.0 8.5a 40.61.4a 7.2a 36.3
.. .. 1.3
.. .. 284.41.1 16.9a 41.6
40 .. 99
0.0 6.3 95.5359 567 14,580
.. 16.9 9.4
.. 20.0 14.9
.. 53.2 17.8
.. .. 17.6
.. .. 14.79.3 4.5 29.1
0.33 0.33 0.420.3 3.9 18.5
23The Little Data Book on Information and Communication Technology 2014
Sub-Saharan Africa Upper middle income
Angola
2005 2012 2012
Upper
middle-
income
groupCountry data

Economic and social contextPopulation (millions)Urban population (% of total)GNI per capita, World Bank Atlas method ($)GDP growth, 2000–05 and 2005–12 (avg. annual %)Adult literacy rate (% ages 15 and older) Gross primary, secondary, tertiary school enrollment (%)
Sector structureSeparate telecommunications/ICT regulatorStatus of main fixed-line telephone operatorLevel of competition (competition, partial comp., monopoly) International gateway(s) Mobile telephone service Internet serviceForeign ownership (not allowed, restricted, allowed)Reg. treatment of VoIP (banned, closed, no framework, allowed)
Sector efficiency and capacityTelecommunications revenue (% of GDP)Telecommunications investment (% of revenue)
Sector performanceAccess
Fixed-telephone subscriptions (per 100 people)Mobile-cellular telephone subscriptions (per 100 people)Fixed (wired)-broadband subscriptions (per 100 people)Households with a computer (%)Households with Internet access at home (%)Usage Int’l. voice traffic, total (minutes/subscription/month)Domestic mobile traffic (minutes/subscription/month)Individuals using the Internet (%)Quality Population covered by a mobile-cellular network (%)Fixed (wired)-broadband subscriptions (% of total Internet)International Internet bandwidth (bit/s per Internet user)Affordability
Fixed-telephone sub-basket ($ a month)Mobile-cellular sub-basket ($ a month)Fixed-broadband sub-basket ($ a month)Trade
ICT goods exports (% of total goods exports)ICT goods imports (% of total goods imports)ICT service exports (% of total service exports)Applications
Online service index (0–1, 1=highest presence)Secure Internet servers (per million people)
0.08 0.09 1,30031 30 80
12,000 12,480 38,4123.9 –1.7 1.099 99 ..
.. 82 93
No No
Public Public
M PC PC PA AB A
.. .. 2.7.. .. 17.6
44.2 37.2 43.6104.2 143.0 122.9
1.0a 4.6 26.2.. 56.1a 77.7.. 48.2a 75.5
.. 19.0 ..
.. 138.9 113.6
27.0a 59.0a 75.4
100 100 1008.8 91.6 95.9
24,896 97,620 85,990
.. 12.8 25.2
.. 25.3 20.6
.. 54.9 29.2
4.6 11.6 8.93.9 5.5 10.89.6 6.5 30.8
0.45 0.31 0.67859.9 688.9 827.6
24 2014 The Little Data Book on Information and Communication Technology
High income
Antigua and Barbuda
2005 2012 2012
High-
income
groupCountry data

Economic and social contextPopulation (millions)Urban population (% of total)GNI per capita, World Bank Atlas method ($)GDP growth, 2000–05 and 2005–12 (avg. annual %)Adult literacy rate (% ages 15 and older) Gross primary, secondary, tertiary school enrollment (%)
Sector structureSeparate telecommunications/ICT regulatorStatus of main fixed-line telephone operatorLevel of competition (competition, partial comp., monopoly) International gateway(s) Mobile telephone service Internet serviceForeign ownership (not allowed, restricted, allowed)Reg. treatment of VoIP (banned, closed, no framework, allowed)
Sector efficiency and capacityTelecommunications revenue (% of GDP)Telecommunications investment (% of revenue)
Sector performanceAccess
Fixed-telephone subscriptions (per 100 people)Mobile-cellular telephone subscriptions (per 100 people)Fixed (wired)-broadband subscriptions (per 100 people)Households with a computer (%)Households with Internet access at home (%)Usage Int’l. voice traffic, total (minutes/subscription/month)Domestic mobile traffic (minutes/subscription/month)Individuals using the Internet (%)Quality Population covered by a mobile-cellular network (%)Fixed (wired)-broadband subscriptions (% of total Internet)International Internet bandwidth (bit/s per Internet user)Affordability
Fixed-telephone sub-basket ($ a month)Mobile-cellular sub-basket ($ a month)Fixed-broadband sub-basket ($ a month)Trade
ICT goods exports (% of total goods exports)ICT goods imports (% of total goods imports)ICT service exports (% of total service exports)Applications
Online service index (0–1, 1=highest presence)Secure Internet servers (per million people)
39 41 2,39191 93 61
4,480 .. 6,9692.2 6.3 6.297 98 94
89 97 76
Yes YesPrivate Private
.. ..C C
C C
A RA A
3.1 2.9 2.5.. 15.3 18.2
24.4 23.5 19.457.3 151.9 92.42.4 10.9 10.8
32.0 56.0a 40.613.3a 47.5a 36.3
.. .. 1.3
.. 19.6 284.417.7 55.8a 41.6
94 .. 99
38.3 92.2 95.51,788 21,983 14,580
.. 4.5 9.4
.. 39.4 14.9
.. 24.3 17.8
0.2 0.1 17.611.6 8.3 14.731.1 46.0 29.1
0.58 0.53 0.4210.8 42.9 18.5
25The Little Data Book on Information and Communication Technology 2014
Latin America & Caribbean Upper middle income
Argentina
2005 2012 2012
Upper
middle-
income
groupCountry data

Economic and social contextPopulation (millions)Urban population (% of total)GNI per capita, World Bank Atlas method ($)GDP growth, 2000–05 and 2005–12 (avg. annual %)Adult literacy rate (% ages 15 and older) Gross primary, secondary, tertiary school enrollment (%)
Sector structureSeparate telecommunications/ICT regulatorStatus of main fixed-line telephone operatorLevel of competition (competition, partial comp., monopoly) International gateway(s) Mobile telephone service Internet serviceForeign ownership (not allowed, restricted, allowed)Reg. treatment of VoIP (banned, closed, no framework, allowed)
Sector efficiency and capacityTelecommunications revenue (% of GDP)Telecommunications investment (% of revenue)
Sector performanceAccess
Fixed-telephone subscriptions (per 100 people)Mobile-cellular telephone subscriptions (per 100 people)Fixed (wired)-broadband subscriptions (per 100 people)Households with a computer (%)Households with Internet access at home (%)Usage Int’l. voice traffic, total (minutes/subscription/month)Domestic mobile traffic (minutes/subscription/month)Individuals using the Internet (%)Quality Population covered by a mobile-cellular network (%)Fixed (wired)-broadband subscriptions (% of total Internet)International Internet bandwidth (bit/s per Internet user)Affordability
Fixed-telephone sub-basket ($ a month)Mobile-cellular sub-basket ($ a month)Fixed-broadband sub-basket ($ a month)Trade
ICT goods exports (% of total goods exports)ICT goods imports (% of total goods imports)ICT service exports (% of total service exports)Applications
Online service index (0–1, 1=highest presence)Secure Internet servers (per million people)
3 3 2,50764 64 39
1,500 3,720 1,89312.3 2.8 6.0
99 100 71
73 78 64
No YesMixed Mixed
.. ..P P
C C
A AC A
3.0 4.2 2.5
23.6 19.7 20.5
19.7 19.7 5.410.5 111.9 83.1
0.1 6.7 1.45.5a 34.0a 15.02.9a 25.4a 12.4
.. 20.5 6.5
58.0 171.7 ..5.3 39.2a 18.7
85 100 86
1.1 95.5 58.2
459 40,373 8,076
.. 3.0 4.9
.. 8.8 10.5
.. 12.1 20.6
0.3 1.3 4.63.6 3.7 7.2
14.3 13.5 47.1
0.42 0.33 0.321.3 40.3 4.4
26 2014 The Little Data Book on Information and Communication Technology
Europe & Central Asia Lower middle income
Armenia
2005 2012 2012
Lower
middle-
income
groupCountry data

Economic and social contextPopulation (millions)Urban population (% of total)GNI per capita, World Bank Atlas method ($)GDP growth, 2000–05 and 2005–12 (avg. annual %)Adult literacy rate (% ages 15 and older) Gross primary, secondary, tertiary school enrollment (%)
Sector structureSeparate telecommunications/ICT regulatorStatus of main fixed-line telephone operatorLevel of competition (competition, partial comp., monopoly) International gateway(s) Mobile telephone service Internet serviceForeign ownership (not allowed, restricted, allowed)Reg. treatment of VoIP (banned, closed, no framework, allowed)
Sector efficiency and capacityTelecommunications revenue (% of GDP)Telecommunications investment (% of revenue)
Sector performanceAccess
Fixed-telephone subscriptions (per 100 people)Mobile-cellular telephone subscriptions (per 100 people)Fixed (wired)-broadband subscriptions (per 100 people)Households with a computer (%)Households with Internet access at home (%)Usage Int’l. voice traffic, total (minutes/subscription/month)Domestic mobile traffic (minutes/subscription/month)Individuals using the Internet (%)Quality Population covered by a mobile-cellular network (%)Fixed (wired)-broadband subscriptions (% of total Internet)International Internet bandwidth (bit/s per Internet user)Affordability
Fixed-telephone sub-basket ($ a month)Mobile-cellular sub-basket ($ a month)Fixed-broadband sub-basket ($ a month)Trade
ICT goods exports (% of total goods exports)ICT goods imports (% of total goods imports)ICT service exports (% of total service exports)Applications
Online service index (0–1, 1=highest presence)Secure Internet servers (per million people)
0.10 0.10 1,30047 47 80
.. .. 38,4122.0 –3.9 1.097 97 ..84 84 93
.. ..
.. ..
.. ..
.. ..
.. ..
.. ..
.. ..
53.0 5.6 2.71.2 15.8 17.6
38.2 35.2a 43.6103.4 131.9a 122.912.3 18.9 26.245.0 73.1a 77.736.7 69.6a 75.5
.. .. ..
.. .. 113.6
25.4a 74.0a 75.4
90 99 100100.0 100.0 95.9
7,084 67,578 85,990
.. .. 25.2
.. .. 20.6
.. .. 29.2
.. 0.7 8.9
.. 4.4 10.810.2 13.9 30.8
.. .. 0.67289.9 281.6 827.6
27The Little Data Book on Information and Communication Technology 2014
High income
Aruba
2005 2012 2012
High-
income
groupCountry data

Economic and social contextPopulation (millions)Urban population (% of total)GNI per capita, World Bank Atlas method ($)GDP growth, 2000–05 and 2005–12 (avg. annual %)Adult literacy rate (% ages 15 and older) Gross primary, secondary, tertiary school enrollment (%)
Sector structureSeparate telecommunications/ICT regulatorStatus of main fixed-line telephone operatorLevel of competition (competition, partial comp., monopoly) International gateway(s) Mobile telephone service Internet serviceForeign ownership (not allowed, restricted, allowed)Reg. treatment of VoIP (banned, closed, no framework, allowed)
Sector efficiency and capacityTelecommunications revenue (% of GDP)Telecommunications investment (% of revenue)
Sector performanceAccess
Fixed-telephone subscriptions (per 100 people)Mobile-cellular telephone subscriptions (per 100 people)Fixed (wired)-broadband subscriptions (per 100 people)Households with a computer (%)Households with Internet access at home (%)Usage Int’l. voice traffic, total (minutes/subscription/month)Domestic mobile traffic (minutes/subscription/month)Individuals using the Internet (%)Quality Population covered by a mobile-cellular network (%)Fixed (wired)-broadband subscriptions (% of total Internet)International Internet bandwidth (bit/s per Internet user)Affordability
Fixed-telephone sub-basket ($ a month)Mobile-cellular sub-basket ($ a month)Fixed-broadband sub-basket ($ a month)Trade
ICT goods exports (% of total goods exports)ICT goods imports (% of total goods imports)ICT service exports (% of total service exports)Applications
Online service index (0–1, 1=highest presence)Secure Internet servers (per million people)
20 23 1,30088 89 80
30,280 59,260 38,4123.4 2.8 1.0
.. .. ..112 112 93
Yes YesMixed Mixed
C CC CC CA AA A
3.8 2.9 2.716.7 20.5 17.6
49.3 45.4 43.689.8 105.6 122.9
9.8 24.3 26.267.0 85.2a 77.756.0 81.4a 75.5
.. .. ..
.. .. 113.6
63.0 82.3a 75.4
98 99 10033.7 92.9 95.9
7,794 69,066 85,990
.. 33.0 25.2
.. 20.3 20.6
.. 61.9 29.2
1.7 0.9 8.911.8 8.9 10.816.0 18.6 30.8
0.81 0.86 0.67498.1 1,265.3 827.6
28 2014 The Little Data Book on Information and Communication Technology
High income
Australia
2005 2012 2012
High-
income
groupCountry data

Economic and social contextPopulation (millions)Urban population (% of total)GNI per capita, World Bank Atlas method ($)GDP growth, 2000–05 and 2005–12 (avg. annual %)Adult literacy rate (% ages 15 and older) Gross primary, secondary, tertiary school enrollment (%)
Sector structureSeparate telecommunications/ICT regulatorStatus of main fixed-line telephone operatorLevel of competition (competition, partial comp., monopoly) International gateway(s) Mobile telephone service Internet serviceForeign ownership (not allowed, restricted, allowed)Reg. treatment of VoIP (banned, closed, no framework, allowed)
Sector efficiency and capacityTelecommunications revenue (% of GDP)Telecommunications investment (% of revenue)
Sector performanceAccess
Fixed-telephone subscriptions (per 100 people)Mobile-cellular telephone subscriptions (per 100 people)Fixed (wired)-broadband subscriptions (per 100 people)Households with a computer (%)Households with Internet access at home (%)Usage Int’l. voice traffic, total (minutes/subscription/month)Domestic mobile traffic (minutes/subscription/month)Individuals using the Internet (%)Quality Population covered by a mobile-cellular network (%)Fixed (wired)-broadband subscriptions (% of total Internet)International Internet bandwidth (bit/s per Internet user)Affordability
Fixed-telephone sub-basket ($ a month)Mobile-cellular sub-basket ($ a month)Fixed-broadband sub-basket ($ a month)Trade
ICT goods exports (% of total goods exports)ICT goods imports (% of total goods imports)ICT service exports (% of total service exports)Applications
Online service index (0–1, 1=highest presence)Secure Internet servers (per million people)
8 8 1,30067 68 80
37,210 47,850 38,4121.7 1.1 1.0
.. .. ..88 94 93
Yes YesMixed Mixed
C CC CC CA AA A
2.4 1.4 2.712.7 12.5 17.6
45.4 39.7 43.6105.2 160.5 122.9
14.2 25.0 26.263.1 81.0 77.746.7 79.0 75.5
16.1 .. ..107.5 140.0 113.6
58.0 81.0 75.4
99 99 10066.3 85.4 95.9
11,430 108,084 85,990
.. 27.8 25.2
.. 14.7 20.6
.. 41.6 29.2
5.5 3.9 8.97.7 5.1 10.8
24.8 30.7 30.8
0.74 0.75 0.67231.7 1,079.2 827.6
29The Little Data Book on Information and Communication Technology 2014
High income
Austria
2005 2012 2012
High-
income
groupCountry data

Economic and social contextPopulation (millions)Urban population (% of total)GNI per capita, World Bank Atlas method ($)GDP growth, 2000–05 and 2005–12 (avg. annual %)Adult literacy rate (% ages 15 and older) Gross primary, secondary, tertiary school enrollment (%)
Sector structureSeparate telecommunications/ICT regulatorStatus of main fixed-line telephone operatorLevel of competition (competition, partial comp., monopoly) International gateway(s) Mobile telephone service Internet serviceForeign ownership (not allowed, restricted, allowed)Reg. treatment of VoIP (banned, closed, no framework, allowed)
Sector efficiency and capacityTelecommunications revenue (% of GDP)Telecommunications investment (% of revenue)
Sector performanceAccess
Fixed-telephone subscriptions (per 100 people)Mobile-cellular telephone subscriptions (per 100 people)Fixed (wired)-broadband subscriptions (per 100 people)Households with a computer (%)Households with Internet access at home (%)Usage Int’l. voice traffic, total (minutes/subscription/month)Domestic mobile traffic (minutes/subscription/month)Individuals using the Internet (%)Quality Population covered by a mobile-cellular network (%)Fixed (wired)-broadband subscriptions (% of total Internet)International Internet bandwidth (bit/s per Internet user)Affordability
Fixed-telephone sub-basket ($ a month)Mobile-cellular sub-basket ($ a month)Fixed-broadband sub-basket ($ a month)Trade
ICT goods exports (% of total goods exports)ICT goods imports (% of total goods imports)ICT service exports (% of total service exports)Applications
Online service index (0–1, 1=highest presence)Secure Internet servers (per million people)
8 9 2,39152 54 61
1,270 6,220 6,96912.7 10.8 6.2100 100 94
72 71 76
No NoPublic Public
M M
P P
C C
R RNo A
3.6 2.5 2.56.8 24.7 18.2
12.8 18.5 19.426.2 108.8 92.4
0.0 14.1 10.87.3 45.0a 40.66.3 46.8a 36.3
7.6 6.4 1.33.1 179.7 284.48.0 54.2a 41.6
99 100 99
3.0 77.3 95.5436 40,591 14,580
.. 2.5 9.4
.. 10.4 14.9
.. 12.7 17.8
0.0 0.0 17.64.6 3.3 14.7
38.8 15.0 29.1
0.46 0.37 0.420.5 8.6 18.5
30 2014 The Little Data Book on Information and Communication Technology
Europe & Central Asia Upper middle income
Azerbaijan
2005 2012 2012
Upper
middle-
income
groupCountry data

Economic and social contextPopulation (millions)Urban population (% of total)GNI per capita, World Bank Atlas method ($)GDP growth, 2000–05 and 2005–12 (avg. annual %)Adult literacy rate (% ages 15 and older) Gross primary, secondary, tertiary school enrollment (%)
Sector structureSeparate telecommunications/ICT regulatorStatus of main fixed-line telephone operatorLevel of competition (competition, partial comp., monopoly) International gateway(s) Mobile telephone service Internet serviceForeign ownership (not allowed, restricted, allowed)Reg. treatment of VoIP (banned, closed, no framework, allowed)
Sector efficiency and capacityTelecommunications revenue (% of GDP)Telecommunications investment (% of revenue)
Sector performanceAccess
Fixed-telephone subscriptions (per 100 people)Mobile-cellular telephone subscriptions (per 100 people)Fixed (wired)-broadband subscriptions (per 100 people)Households with a computer (%)Households with Internet access at home (%)Usage Int’l. voice traffic, total (minutes/subscription/month)Domestic mobile traffic (minutes/subscription/month)Individuals using the Internet (%)Quality Population covered by a mobile-cellular network (%)Fixed (wired)-broadband subscriptions (% of total Internet)International Internet bandwidth (bit/s per Internet user)Affordability
Fixed-telephone sub-basket ($ a month)Mobile-cellular sub-basket ($ a month)Fixed-broadband sub-basket ($ a month)Trade
ICT goods exports (% of total goods exports)ICT goods imports (% of total goods imports)ICT service exports (% of total service exports)Applications
Online service index (0–1, 1=highest presence)Secure Internet servers (per million people)
0.33 0.37 1,30083 84 80
23,680 20,600 38,4121.3 –0.3 1.0
.. .. ..
.. .. 93
Yes YesPublic Mixed
M CM MC CA AC A
.. .. 2.7
.. .. 17.6
40.4 36.3 43.669.2 80.7a 122.9
4.1 4.2a 26.2.. .. 77.7.. .. 75.5
.. .. ..
.. .. 113.6
25.0a 71.7a 75.4
95 100 10049.2 100.0 95.9
1,094 3,747 85,990
.. 16.3 25.2
.. 17.5 20.6
.. 30.0 29.2
0.3 0.2 8.93.2 3.9 10.8
.. .. 30.8
0.49 0.47 0.67148.9 267.9 827.6
31The Little Data Book on Information and Communication Technology 2014
High income
Bahamas, The
2005 2012 2012
High-
income
groupCountry data

Economic and social contextPopulation (millions)Urban population (% of total)GNI per capita, World Bank Atlas method ($)GDP growth, 2000–05 and 2005–12 (avg. annual %)Adult literacy rate (% ages 15 and older) Gross primary, secondary, tertiary school enrollment (%)
Sector structureSeparate telecommunications/ICT regulatorStatus of main fixed-line telephone operatorLevel of competition (competition, partial comp., monopoly) International gateway(s) Mobile telephone service Internet serviceForeign ownership (not allowed, restricted, allowed)Reg. treatment of VoIP (banned, closed, no framework, allowed)
Sector efficiency and capacityTelecommunications revenue (% of GDP)Telecommunications investment (% of revenue)
Sector performanceAccess
Fixed-telephone subscriptions (per 100 people)Mobile-cellular telephone subscriptions (per 100 people)Fixed (wired)-broadband subscriptions (per 100 people)Households with a computer (%)Households with Internet access at home (%)Usage Int’l. voice traffic, total (minutes/subscription/month)Domestic mobile traffic (minutes/subscription/month)Individuals using the Internet (%)Quality Population covered by a mobile-cellular network (%)Fixed (wired)-broadband subscriptions (% of total Internet)International Internet bandwidth (bit/s per Internet user)Affordability
Fixed-telephone sub-basket ($ a month)Mobile-cellular sub-basket ($ a month)Fixed-broadband sub-basket ($ a month)Trade
ICT goods exports (% of total goods exports)ICT goods imports (% of total goods imports)ICT service exports (% of total service exports)Applications
Online service index (0–1, 1=highest presence)Secure Internet servers (per million people)
0.88 1 1,30088 89 80
16,730 19,560 38,4126.1 4.8 1.087 95 ..
.. .. 93
Yes YesMixed Mixed
C C
P P
C C
A AC A
3.9 3.6 2.714.9 13.0 17.6
22.0 22.7 43.687.2 161.2 122.92.4 13.2 26.2
44.0 92.7 77.732.0 79.0 75.5
.. 100.6 ..117.3 227.6 113.6
21.3 88.0 75.4
100 100 10042.6 100.0 95.9
2,183 18,108 85,990
.. 4.8 25.2
.. 15.0 20.6
.. 26.6 29.2
0.1 0.6 8.92.1 3.3 10.8
25.1 22.8 30.8
0.57 0.86 0.6739.8 141.9 827.6
32 2014 The Little Data Book on Information and Communication Technology
High income
Bahrain
2005 2012 2012
High-
income
groupCountry data

33The Little Data Book on Information and Communication Technology 2014
Economic and social contextPopulation (millions)Urban population (% of total)GNI per capita, World Bank Atlas method ($)GDP growth, 2000–05 and 2005–12 (avg. annual %)Adult literacy rate (% ages 15 and older) Gross primary, secondary, tertiary school enrollment (%)
Sector structureSeparate telecommunications/ICT regulatorStatus of main fixed-line telephone operatorLevel of competition (competition, partial comp., monopoly) International gateway(s) Mobile telephone service Internet serviceForeign ownership (not allowed, restricted, allowed)Reg. treatment of VoIP (banned, closed, no framework, allowed)
Sector efficiency and capacityTelecommunications revenue (% of GDP)Telecommunications investment (% of revenue)
Sector performanceAccess
Fixed-telephone subscriptions (per 100 people)Mobile-cellular telephone subscriptions (per 100 people)Fixed (wired)-broadband subscriptions (per 100 people)Households with a computer (%)Households with Internet access at home (%)Usage Int’l. voice traffic, total (minutes/subscription/month)Domestic mobile traffic (minutes/subscription/month)Individuals using the Internet (%)Quality Population covered by a mobile-cellular network (%)Fixed (wired)-broadband subscriptions (% of total Internet)International Internet bandwidth (bit/s per Internet user)Affordability
Fixed-telephone sub-basket ($ a month)Mobile-cellular sub-basket ($ a month)Fixed-broadband sub-basket ($ a month)Trade
ICT goods exports (% of total goods exports)ICT goods imports (% of total goods imports)ICT service exports (% of total service exports)Applications
Online service index (0–1, 1=highest presence)Secure Internet servers (per million people)
South Asia Low income
2005 2012 2012
Country data
143 155 84626 29 28
470 840 5905.4 6.2 5.947 58 61
51 59 60
Yes YesPublic Public
M PC CC CA AB A
1.5 7.5 5.0
.. 8.8 ..
0.7 0.6 1.06.3 62.8 47.20.0 0.4 0.21.4 4.8a 4.20.2 3.2a 3.4
.. 21.3 ..
.. 96.2 70.10.2a 6.3a 6.2
80 99 ..0.0 25.8 30.9
173 3,032 9,141
.. 2.6 8.9
.. 1.6 11.9
.. 4.7 46.9
0.1 .. ..6.2 .. ..
18.2 26.7 ..
0.29 0.44 0.200.0 0.8 1.1
BangladeshLow-
income
group

34 2014 The Little Data Book on Information and Communication Technology
Economic and social contextPopulation (millions)Urban population (% of total)GNI per capita, World Bank Atlas method ($)GDP growth, 2000–05 and 2005–12 (avg. annual %)Adult literacy rate (% ages 15 and older) Gross primary, secondary, tertiary school enrollment (%)
Sector structureSeparate telecommunications/ICT regulatorStatus of main fixed-line telephone operatorLevel of competition (competition, partial comp., monopoly) International gateway(s) Mobile telephone service Internet serviceForeign ownership (not allowed, restricted, allowed)Reg. treatment of VoIP (banned, closed, no framework, allowed)
Sector efficiency and capacityTelecommunications revenue (% of GDP)Telecommunications investment (% of revenue)
Sector performanceAccess
Fixed-telephone subscriptions (per 100 people)Mobile-cellular telephone subscriptions (per 100 people)Fixed (wired)-broadband subscriptions (per 100 people)Households with a computer (%)Households with Internet access at home (%)Usage Int’l. voice traffic, total (minutes/subscription/month)Domestic mobile traffic (minutes/subscription/month)Individuals using the Internet (%)Quality Population covered by a mobile-cellular network (%)Fixed (wired)-broadband subscriptions (% of total Internet)International Internet bandwidth (bit/s per Internet user)Affordability
Fixed-telephone sub-basket ($ a month)Mobile-cellular sub-basket ($ a month)Fixed-broadband sub-basket ($ a month)Trade
ICT goods exports (% of total goods exports)ICT goods imports (% of total goods imports)ICT service exports (% of total service exports)Applications
Online service index (0–1, 1=highest presence)Secure Internet servers (per million people)
2005 2012 2012
Country data
0.27 0.28 1,30041 45 80
13,640 15,080 38,4121.2 0.1 1.0
.. .. ..94 96 93
Yes YesMixed Mixed
P ..C P
C ..A R
No A
4.6 .. 2.714.0 .. 17.6
49.3 50.8 43.675.4 122.5a 122.911.7 23.1a 26.242.6a 69.2a 77.737.2a 62.9a 75.5
.. .. ..
.. .. 113.6
52.5a 73.3a 75.4
100 99 10071.2 94.0 95.9
3,481 67,410 85,990
.. 22.0 25.2
.. 24.6 20.6
.. 45.2 29.2
4.9 0.8 8.97.8 4.4 10.8
15.3 25.9 30.8
0.57 0.37 0.67204.7 340.4 827.6
High income
BarbadosHigh-
income
group

Economic and social contextPopulation (millions)Urban population (% of total)GNI per capita, World Bank Atlas method ($)GDP growth, 2000–05 and 2005–12 (avg. annual %)Adult literacy rate (% ages 15 and older) Gross primary, secondary, tertiary school enrollment (%)
Sector structureSeparate telecommunications/ICT regulatorStatus of main fixed-line telephone operatorLevel of competition (competition, partial comp., monopoly) International gateway(s) Mobile telephone service Internet serviceForeign ownership (not allowed, restricted, allowed)Reg. treatment of VoIP (banned, closed, no framework, allowed)
Sector efficiency and capacityTelecommunications revenue (% of GDP)Telecommunications investment (% of revenue)
Sector performanceAccess
Fixed-telephone subscriptions (per 100 people)Mobile-cellular telephone subscriptions (per 100 people)Fixed (wired)-broadband subscriptions (per 100 people)Households with a computer (%)Households with Internet access at home (%)Usage Int’l. voice traffic, total (minutes/subscription/month)Domestic mobile traffic (minutes/subscription/month)Individuals using the Internet (%)Quality Population covered by a mobile-cellular network (%)Fixed (wired)-broadband subscriptions (% of total Internet)International Internet bandwidth (bit/s per Internet user)Affordability
Fixed-telephone sub-basket ($ a month)Mobile-cellular sub-basket ($ a month)Fixed-broadband sub-basket ($ a month)Trade
ICT goods exports (% of total goods exports)ICT goods imports (% of total goods imports)ICT service exports (% of total service exports)Applications
Online service index (0–1, 1=highest presence)Secure Internet servers (per million people)
10 9 2,39172 75 61
2,810 6,530 6,9697.6 6.1 6.2
.. 100 94
.. 100 76
No NoPublic Public
M M
P C
C C
R RB C
1.3 1.7 2.541.3 26.8 18.2
34.0 46.9 19.442.4 113.5 92.40.0 26.9 10.89.6 51.7 40.67.0 48.3 36.3
6.6 5.6 1.3116.2 202.6 284.4
19.7 46.9 41.6
90 100 99
4.2 96.1 95.51,356 79,337 14,580
.. 1.4 9.4
.. 8.4 14.9
.. 11.9 17.8
1.0 0.6 17.62.4 2.4 14.7
15.0 18.0 29.1
0.52 0.41 0.420.5 26.4 18.5
35The Little Data Book on Information and Communication Technology 2014
Europe & Central Asia Upper middle income
Belarus
2005 2012 2012
Upper
middle-
income
groupCountry data

Economic and social contextPopulation (millions)Urban population (% of total)GNI per capita, World Bank Atlas method ($)GDP growth, 2000–05 and 2005–12 (avg. annual %)Adult literacy rate (% ages 15 and older) Gross primary, secondary, tertiary school enrollment (%)
Sector structureSeparate telecommunications/ICT regulatorStatus of main fixed-line telephone operatorLevel of competition (competition, partial comp., monopoly) International gateway(s) Mobile telephone service Internet serviceForeign ownership (not allowed, restricted, allowed)Reg. treatment of VoIP (banned, closed, no framework, allowed)
Sector efficiency and capacityTelecommunications revenue (% of GDP)Telecommunications investment (% of revenue)
Sector performanceAccess
Fixed-telephone subscriptions (per 100 people)Mobile-cellular telephone subscriptions (per 100 people)Fixed (wired)-broadband subscriptions (per 100 people)Households with a computer (%)Households with Internet access at home (%)Usage Int’l. voice traffic, total (minutes/subscription/month)Domestic mobile traffic (minutes/subscription/month)Individuals using the Internet (%)Quality Population covered by a mobile-cellular network (%)Fixed (wired)-broadband subscriptions (% of total Internet)International Internet bandwidth (bit/s per Internet user)Affordability
Fixed-telephone sub-basket ($ a month)Mobile-cellular sub-basket ($ a month)Fixed-broadband sub-basket ($ a month)Trade
ICT goods exports (% of total goods exports)ICT goods imports (% of total goods imports)ICT service exports (% of total service exports)Applications
Online service index (0–1, 1=highest presence)Secure Internet servers (per million people)
10 11 1,30097 98 80
36,610 44,720 38,4121.6 0.9 1.0
.. .. ..93 95 93
Yes YesMixed Mixed
.. CP CC CA AA A
3.0 1.6 2.711.6 20.4 17.6
45.6 41.9 43.691.4 111.3 122.919.1 33.3 26.257.0 80.0 77.750.2 78.0 75.5
.. .. ..70.2 92.5 113.6
55.8a 82.0 75.4
99 100 10088.1 99.7 95.9
20,038 180,389 85,990
.. 36.1 25.2
.. 39.7 20.6
.. 34.7 29.2
3.9 2.1 8.94.6 3.1 10.8
34.5 43.1 30.8
0.68 0.65 0.67117.9 749.3 827.6
36 2014 The Little Data Book on Information and Communication Technology
High income
Belgium
2005 2012 2012
High-
income
groupCountry data

Economic and social contextPopulation (millions)Urban population (% of total)GNI per capita, World Bank Atlas method ($)GDP growth, 2000–05 and 2005–12 (avg. annual %)Adult literacy rate (% ages 15 and older) Gross primary, secondary, tertiary school enrollment (%)
Sector structureSeparate telecommunications/ICT regulatorStatus of main fixed-line telephone operatorLevel of competition (competition, partial comp., monopoly) International gateway(s) Mobile telephone service Internet serviceForeign ownership (not allowed, restricted, allowed)Reg. treatment of VoIP (banned, closed, no framework, allowed)
Sector efficiency and capacityTelecommunications revenue (% of GDP)Telecommunications investment (% of revenue)
Sector performanceAccess
Fixed-telephone subscriptions (per 100 people)Mobile-cellular telephone subscriptions (per 100 people)Fixed (wired)-broadband subscriptions (per 100 people)Households with a computer (%)Households with Internet access at home (%)Usage Int’l. voice traffic, total (minutes/subscription/month)Domestic mobile traffic (minutes/subscription/month)Individuals using the Internet (%)Quality Population covered by a mobile-cellular network (%)Fixed (wired)-broadband subscriptions (% of total Internet)International Internet bandwidth (bit/s per Internet user)Affordability
Fixed-telephone sub-basket ($ a month)Mobile-cellular sub-basket ($ a month)Fixed-broadband sub-basket ($ a month)Trade
ICT goods exports (% of total goods exports)ICT goods imports (% of total goods imports)ICT service exports (% of total service exports)Applications
Online service index (0–1, 1=highest presence)Secure Internet servers (per million people)
0.27 0.32 2,39146 45 61
4,770 4,490 6,9695.7 2.8 6.2
.. .. 94
79 82 76
Yes YesMixed Mixed
.. C
M C
M C
R RNo C
5.7 4.8 2.523.8 19.4 18.2
12.4 7.8 19.435.3 53.2 92.4
1.8 3.1 10.8.. .. 40.6.. .. 36.3
.. 34.3 1.315.3 .. 284.4
9.2 25.0a 41.6
.. .. 99
73.5 71.7 95.55,390 34,562 14,580
.. 19.2 9.4
.. 31.3 14.9
.. 50.0 17.8
0.0 0.5 17.65.9 3.6 14.7
12.3 11.0 29.1
0.41 0.40 0.42275.8 177.7 18.5
37The Little Data Book on Information and Communication Technology 2014
Latin America & Caribbean Upper middle income
Belize
2005 2012 2012
Upper
middle-
income
groupCountry data

Economic and social contextPopulation (millions)Urban population (% of total)GNI per capita, World Bank Atlas method ($)GDP growth, 2000–05 and 2005–12 (avg. annual %)Adult literacy rate (% ages 15 and older) Gross primary, secondary, tertiary school enrollment (%)
Sector structureSeparate telecommunications/ICT regulatorStatus of main fixed-line telephone operatorLevel of competition (competition, partial comp., monopoly) International gateway(s) Mobile telephone service Internet serviceForeign ownership (not allowed, restricted, allowed)Reg. treatment of VoIP (banned, closed, no framework, allowed)
Sector efficiency and capacityTelecommunications revenue (% of GDP)Telecommunications investment (% of revenue)
Sector performanceAccess
Fixed-telephone subscriptions (per 100 people)Mobile-cellular telephone subscriptions (per 100 people)Fixed (wired)-broadband subscriptions (per 100 people)Households with a computer (%)Households with Internet access at home (%)Usage Int’l. voice traffic, total (minutes/subscription/month)Domestic mobile traffic (minutes/subscription/month)Individuals using the Internet (%)Quality Population covered by a mobile-cellular network (%)Fixed (wired)-broadband subscriptions (% of total Internet)International Internet bandwidth (bit/s per Internet user)Affordability
Fixed-telephone sub-basket ($ a month)Mobile-cellular sub-basket ($ a month)Fixed-broadband sub-basket ($ a month)Trade
ICT goods exports (% of total goods exports)ICT goods imports (% of total goods imports)ICT service exports (% of total service exports)Applications
Online service index (0–1, 1=highest presence)Secure Internet servers (per million people)
8 10 84641 46 28
530 750 5904.0 3.8 5.929 .. 61
54 68 60
Yes YesPublic Public
.. P
C C
.. P
.. ANo B
1.4 6.3 5.0
35.0 32.2 ..
0.9 1.6 1.07.3 83.7 47.20.0 0.1 0.21.6a 4.2a 4.20.0a 2.4a 3.4
.. 6.4 ..
.. 30.9 70.11.3 3.8a 6.2
43 99 ..2.9 11.9 30.9
452 3,249 9,141
.. 13.4 8.9
.. 14.4 11.9
.. 53.0 46.9
0.0 0.0 ..2.9 1.3 ..
20.1 21.1 ..
0.19 0.20 0.200.1 1.1 1.1
38 2014 The Little Data Book on Information and Communication Technology
Sub-Saharan Africa Low income
Benin
2005 2012 2012
Low-
income
groupCountry data
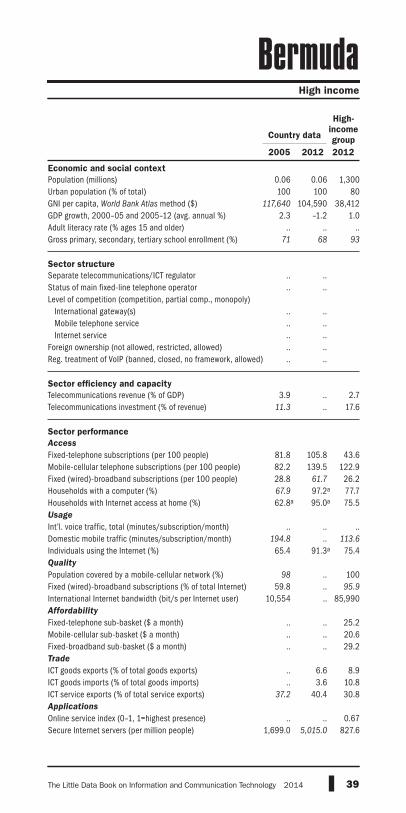
Economic and social contextPopulation (millions)Urban population (% of total)GNI per capita, World Bank Atlas method ($)GDP growth, 2000–05 and 2005–12 (avg. annual %)Adult literacy rate (% ages 15 and older) Gross primary, secondary, tertiary school enrollment (%)
Sector structureSeparate telecommunications/ICT regulatorStatus of main fixed-line telephone operatorLevel of competition (competition, partial comp., monopoly) International gateway(s) Mobile telephone service Internet serviceForeign ownership (not allowed, restricted, allowed)Reg. treatment of VoIP (banned, closed, no framework, allowed)
Sector efficiency and capacityTelecommunications revenue (% of GDP)Telecommunications investment (% of revenue)
Sector performanceAccess
Fixed-telephone subscriptions (per 100 people)Mobile-cellular telephone subscriptions (per 100 people)Fixed (wired)-broadband subscriptions (per 100 people)Households with a computer (%)Households with Internet access at home (%)Usage Int’l. voice traffic, total (minutes/subscription/month)Domestic mobile traffic (minutes/subscription/month)Individuals using the Internet (%)Quality Population covered by a mobile-cellular network (%)Fixed (wired)-broadband subscriptions (% of total Internet)International Internet bandwidth (bit/s per Internet user)Affordability
Fixed-telephone sub-basket ($ a month)Mobile-cellular sub-basket ($ a month)Fixed-broadband sub-basket ($ a month)Trade
ICT goods exports (% of total goods exports)ICT goods imports (% of total goods imports)ICT service exports (% of total service exports)Applications
Online service index (0–1, 1=highest presence)Secure Internet servers (per million people)
0.06 0.06 1,300100 100 80
117,640 104,590 38,4122.3 –1.2 1.0
.. .. ..71 68 93
.. ..
.. ..
.. ..
.. ..
.. ..
.. ..
.. ..
3.9 .. 2.711.3 .. 17.6
81.8 105.8 43.682.2 139.5 122.928.8 61.7 26.267.9 97.2a 77.762.8a 95.0a 75.5
.. .. ..194.8 .. 113.6
65.4 91.3a 75.4
98 .. 10059.8 .. 95.9
10,554 .. 85,990
.. .. 25.2
.. .. 20.6
.. .. 29.2
.. 6.6 8.9
.. 3.6 10.837.2 40.4 30.8
.. .. 0.671,699.0 5,015.0 827.6
39The Little Data Book on Information and Communication Technology 2014
High income
Bermuda
2005 2012 2012
High-
income
groupCountry data

Economic and social contextPopulation (millions)Urban population (% of total)GNI per capita, World Bank Atlas method ($)GDP growth, 2000–05 and 2005–12 (avg. annual %)Adult literacy rate (% ages 15 and older) Gross primary, secondary, tertiary school enrollment (%)
Sector structureSeparate telecommunications/ICT regulatorStatus of main fixed-line telephone operatorLevel of competition (competition, partial comp., monopoly) International gateway(s) Mobile telephone service Internet serviceForeign ownership (not allowed, restricted, allowed)Reg. treatment of VoIP (banned, closed, no framework, allowed)
Sector efficiency and capacityTelecommunications revenue (% of GDP)Telecommunications investment (% of revenue)
Sector performanceAccess
Fixed-telephone subscriptions (per 100 people)Mobile-cellular telephone subscriptions (per 100 people)Fixed (wired)-broadband subscriptions (per 100 people)Households with a computer (%)Households with Internet access at home (%)Usage Int’l. voice traffic, total (minutes/subscription/month)Domestic mobile traffic (minutes/subscription/month)Individuals using the Internet (%)Quality Population covered by a mobile-cellular network (%)Fixed (wired)-broadband subscriptions (% of total Internet)International Internet bandwidth (bit/s per Internet user)Affordability
Fixed-telephone sub-basket ($ a month)Mobile-cellular sub-basket ($ a month)Fixed-broadband sub-basket ($ a month)Trade
ICT goods exports (% of total goods exports)ICT goods imports (% of total goods imports)ICT service exports (% of total service exports)Applications
Online service index (0–1, 1=highest presence)Secure Internet servers (per million people)
0.65 0.74 2,50731 36 39
1,230 2,420 1,8937.9 9.3 6.053 .. 71
54 69 64
Yes YesPublic Public
M C
M C
P C
R RB A
2.0 2.8 2.5
81.1 35.1 20.5
5.1 3.6 5.45.5 75.6 83.10.0 2.3 1.42.6 16.4 15.01.2 11.6 12.4
.. 21.3 6.5
56.1 44.6 ..3.8 25.4a 18.7
5 100 86
0.0 98.1 58.2
240 3,286 8,076
.. 1.7 4.9
.. 3.5 10.5
.. 10.7 20.6
0.9 15.9 4.65.3 2.4 7.25.8 3.9 47.1
0.31 0.35 0.32.. 9.3 4.4
40 2014 The Little Data Book on Information and Communication Technology
South Asia Lower middle income
Bhutan
2005 2012 2012
Lower
middle-
income
groupCountry data
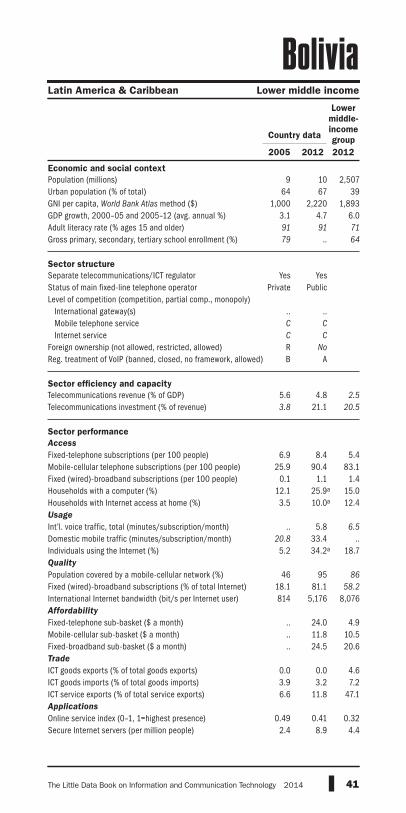
Economic and social contextPopulation (millions)Urban population (% of total)GNI per capita, World Bank Atlas method ($)GDP growth, 2000–05 and 2005–12 (avg. annual %)Adult literacy rate (% ages 15 and older) Gross primary, secondary, tertiary school enrollment (%)
Sector structureSeparate telecommunications/ICT regulatorStatus of main fixed-line telephone operatorLevel of competition (competition, partial comp., monopoly) International gateway(s) Mobile telephone service Internet serviceForeign ownership (not allowed, restricted, allowed)Reg. treatment of VoIP (banned, closed, no framework, allowed)
Sector efficiency and capacityTelecommunications revenue (% of GDP)Telecommunications investment (% of revenue)
Sector performanceAccess
Fixed-telephone subscriptions (per 100 people)Mobile-cellular telephone subscriptions (per 100 people)Fixed (wired)-broadband subscriptions (per 100 people)Households with a computer (%)Households with Internet access at home (%)Usage Int’l. voice traffic, total (minutes/subscription/month)Domestic mobile traffic (minutes/subscription/month)Individuals using the Internet (%)Quality Population covered by a mobile-cellular network (%)Fixed (wired)-broadband subscriptions (% of total Internet)International Internet bandwidth (bit/s per Internet user)Affordability
Fixed-telephone sub-basket ($ a month)Mobile-cellular sub-basket ($ a month)Fixed-broadband sub-basket ($ a month)Trade
ICT goods exports (% of total goods exports)ICT goods imports (% of total goods imports)ICT service exports (% of total service exports)Applications
Online service index (0–1, 1=highest presence)Secure Internet servers (per million people)
9 10 2,50764 67 39
1,000 2,220 1,8933.1 4.7 6.091 91 71
79 .. 64
Yes YesPrivate Public
.. ..C C
C C
R No
B A
5.6 4.8 2.5
3.8 21.1 20.5
6.9 8.4 5.425.9 90.4 83.1
0.1 1.1 1.412.1 25.9a 15.03.5 10.0a 12.4
.. 5.8 6.5
20.8 33.4 ..5.2 34.2a 18.7
46 95 86
18.1 81.1 58.2
814 5,176 8,076
.. 24.0 4.9
.. 11.8 10.5
.. 24.5 20.6
0.0 0.0 4.63.9 3.2 7.26.6 11.8 47.1
0.49 0.41 0.322.4 8.9 4.4
41The Little Data Book on Information and Communication Technology 2014
Latin America & Caribbean Lower middle income
Bolivia
2005 2012 2012
Lower
middle-
income
groupCountry data

Economic and social contextPopulation (millions)Urban population (% of total)GNI per capita, World Bank Atlas method ($)GDP growth, 2000–05 and 2005–12 (avg. annual %)Adult literacy rate (% ages 15 and older) Gross primary, secondary, tertiary school enrollment (%)
Sector structureSeparate telecommunications/ICT regulatorStatus of main fixed-line telephone operatorLevel of competition (competition, partial comp., monopoly) International gateway(s) Mobile telephone service Internet serviceForeign ownership (not allowed, restricted, allowed)Reg. treatment of VoIP (banned, closed, no framework, allowed)
Sector efficiency and capacityTelecommunications revenue (% of GDP)Telecommunications investment (% of revenue)
Sector performanceAccess
Fixed-telephone subscriptions (per 100 people)Mobile-cellular telephone subscriptions (per 100 people)Fixed (wired)-broadband subscriptions (per 100 people)Households with a computer (%)Households with Internet access at home (%)Usage Int’l. voice traffic, total (minutes/subscription/month)Domestic mobile traffic (minutes/subscription/month)Individuals using the Internet (%)Quality Population covered by a mobile-cellular network (%)Fixed (wired)-broadband subscriptions (% of total Internet)International Internet bandwidth (bit/s per Internet user)Affordability
Fixed-telephone sub-basket ($ a month)Mobile-cellular sub-basket ($ a month)Fixed-broadband sub-basket ($ a month)Trade
ICT goods exports (% of total goods exports)ICT goods imports (% of total goods imports)ICT service exports (% of total service exports)Applications
Online service index (0–1, 1=highest presence)Secure Internet servers (per million people)
4 4 2,39145 49 61
2,940 4,750 6,9695.0 2.1 6.297 98 94
.. .. 76
Yes YesPublic Mixed
.. ..P PC CA AB A
6.1 4.7 2.536.5 22.7 18.2
25.0 23.1 19.441.1 87.6 92.40.4 10.6 10.8
20.0 39.8a 40.66.2a 39.7a 36.3
.. 20.4 1.336.3 59.2 284.421.3 65.4a 41.6
97 100 99
7.6 83.3 95.5187 23,945 14,580
.. 10.4 9.4
.. 15.4 14.9
.. 8.3 17.8
0.3 0.2 17.64.2 2.7 14.7
18.1 5.5 29.1
0.45 0.37 0.423.4 24.0 18.5
42 2014 The Little Data Book on Information and Communication Technology
Europe & Central Asia Upper middle income
Bosnia and Herzegovina
2005 2012 2012
Upper
middle-
income
groupCountry data

Economic and social contextPopulation (millions)Urban population (% of total)GNI per capita, World Bank Atlas method ($)GDP growth, 2000–05 and 2005–12 (avg. annual %)Adult literacy rate (% ages 15 and older) Gross primary, secondary, tertiary school enrollment (%)
Sector structureSeparate telecommunications/ICT regulatorStatus of main fixed-line telephone operatorLevel of competition (competition, partial comp., monopoly) International gateway(s) Mobile telephone service Internet serviceForeign ownership (not allowed, restricted, allowed)Reg. treatment of VoIP (banned, closed, no framework, allowed)
Sector efficiency and capacityTelecommunications revenue (% of GDP)Telecommunications investment (% of revenue)
Sector performanceAccess
Fixed-telephone subscriptions (per 100 people)Mobile-cellular telephone subscriptions (per 100 people)Fixed (wired)-broadband subscriptions (per 100 people)Households with a computer (%)Households with Internet access at home (%)Usage Int’l. voice traffic, total (minutes/subscription/month)Domestic mobile traffic (minutes/subscription/month)Individuals using the Internet (%)Quality Population covered by a mobile-cellular network (%)Fixed (wired)-broadband subscriptions (% of total Internet)International Internet bandwidth (bit/s per Internet user)Affordability
Fixed-telephone sub-basket ($ a month)Mobile-cellular sub-basket ($ a month)Fixed-broadband sub-basket ($ a month)Trade
ICT goods exports (% of total goods exports)ICT goods imports (% of total goods imports)ICT service exports (% of total service exports)Applications
Online service index (0–1, 1=highest presence)Secure Internet servers (per million people)
2 2 2,39157 62 61
4,730 7,650 6,9693.9 3.7 6.281 85 94
71 .. 76
Yes YesPublic Public
M PC PC CA AB A
3.2 4.2 2.548.9 14.4 18.2
7.3 8.0 19.430.1 153.8 92.4
0.1 0.9 10.86.5a 12.3a 40.60.1a 9.1a 36.3
.. .. 1.345.5 56.4 284.4
3.3a 11.5a 41.6
99 96 99
.. 100.0 95.5490 6,509 14,580
.. 17.9 9.4
.. 13.0 14.9
.. 57.3 17.8
0.2 0.2 17.64.7 2.4 14.7
12.8 40.9 29.1
0.36 0.36 0.421.6 10.4 18.5
43The Little Data Book on Information and Communication Technology 2014
Sub-Saharan Africa Upper middle income
Botswana
2005 2012 2012
Upper
middle-
income
groupCountry data

Economic and social contextPopulation (millions)Urban population (% of total)GNI per capita, World Bank Atlas method ($)GDP growth, 2000–05 and 2005–12 (avg. annual %)Adult literacy rate (% ages 15 and older) Gross primary, secondary, tertiary school enrollment (%)
Sector structureSeparate telecommunications/ICT regulatorStatus of main fixed-line telephone operatorLevel of competition (competition, partial comp., monopoly) International gateway(s) Mobile telephone service Internet serviceForeign ownership (not allowed, restricted, allowed)Reg. treatment of VoIP (banned, closed, no framework, allowed)
Sector efficiency and capacityTelecommunications revenue (% of GDP)Telecommunications investment (% of revenue)
Sector performanceAccess
Fixed-telephone subscriptions (per 100 people)Mobile-cellular telephone subscriptions (per 100 people)Fixed (wired)-broadband subscriptions (per 100 people)Households with a computer (%)Households with Internet access at home (%)Usage Int’l. voice traffic, total (minutes/subscription/month)Domestic mobile traffic (minutes/subscription/month)Individuals using the Internet (%)Quality Population covered by a mobile-cellular network (%)Fixed (wired)-broadband subscriptions (% of total Internet)International Internet bandwidth (bit/s per Internet user)Affordability
Fixed-telephone sub-basket ($ a month)Mobile-cellular sub-basket ($ a month)Fixed-broadband sub-basket ($ a month)Trade
ICT goods exports (% of total goods exports)ICT goods imports (% of total goods imports)ICT service exports (% of total service exports)Applications
Online service index (0–1, 1=highest presence)Secure Internet servers (per million people)
186 199 2,39183 85 61
3,960 11,630 6,9692.8 3.8 6.290 90 94
.. .. 76
Yes YesPrivate Private
.. C
C CC CA AA A
4.1 2.9 2.517.4 13.1 18.2
21.4 22.3 19.446.3 125.0 92.4
1.7 9.2 10.818.5 49.9a 40.613.6 45.4a 36.3
.. 0.2 1.330.9 56.9 284.421.0 49.8a 41.6
88 100 99
74.1 81.4 95.5716 44,837 14,580
.. 29.8 9.4
.. 60.2 14.9
.. 17.8 17.8
3.1 0.5 17.612.1 8.8 14.743.0 55.7 29.1
0.57 0.67 0.4214.2 57.4 18.5
44 2014 The Little Data Book on Information and Communication Technology
Latin America & Caribbean Upper middle income
Brazil
2005 2012 2012
Upper
middle-
income
groupCountry data

Economic and social contextPopulation (millions)Urban population (% of total)GNI per capita, World Bank Atlas method ($)GDP growth, 2000–05 and 2005–12 (avg. annual %)Adult literacy rate (% ages 15 and older) Gross primary, secondary, tertiary school enrollment (%)
Sector structureSeparate telecommunications/ICT regulatorStatus of main fixed-line telephone operatorLevel of competition (competition, partial comp., monopoly) International gateway(s) Mobile telephone service Internet serviceForeign ownership (not allowed, restricted, allowed)Reg. treatment of VoIP (banned, closed, no framework, allowed)
Sector efficiency and capacityTelecommunications revenue (% of GDP)Telecommunications investment (% of revenue)
Sector performanceAccess
Fixed-telephone subscriptions (per 100 people)Mobile-cellular telephone subscriptions (per 100 people)Fixed (wired)-broadband subscriptions (per 100 people)Households with a computer (%)Households with Internet access at home (%)Usage Int’l. voice traffic, total (minutes/subscription/month)Domestic mobile traffic (minutes/subscription/month)Individuals using the Internet (%)Quality Population covered by a mobile-cellular network (%)Fixed (wired)-broadband subscriptions (% of total Internet)International Internet bandwidth (bit/s per Internet user)Affordability
Fixed-telephone sub-basket ($ a month)Mobile-cellular sub-basket ($ a month)Fixed-broadband sub-basket ($ a month)Trade
ICT goods exports (% of total goods exports)ICT goods imports (% of total goods imports)ICT service exports (% of total service exports)Applications
Online service index (0–1, 1=highest presence)Secure Internet servers (per million people)
0.37 0.41 1,30074 76 80
22,920 31,590 38,4122.2 0.6 1.093 95 ..81 81 93
Yes YesPublic Public
P P
M M
P P
R RA A
.. .. 2.7
.. .. 17.6
22.8 17.2 43.663.3 113.9 122.9
2.2 4.8 26.255.0 86.9a 77.750.0 72.4a 75.5
.. .. ..
.. .. 113.6
36.5 60.3a 75.4
.. .. 10045.2 84.5 95.9
4,138 39,925 85,990
.. 12.5 25.2
.. 20.8 20.6
.. 51.7 29.2
0.1 0.3 8.96.1 4.1 10.8
17.0 21.4 30.8
0.47 0.59 0.6713.6 117.2 827.6
45The Little Data Book on Information and Communication Technology 2014
High income
Brunei Darussalam
2005 2012 2012
High-
income
groupCountry data

Economic and social contextPopulation (millions)Urban population (% of total)GNI per capita, World Bank Atlas method ($)GDP growth, 2000–05 and 2005–12 (avg. annual %)Adult literacy rate (% ages 15 and older) Gross primary, secondary, tertiary school enrollment (%)
Sector structureSeparate telecommunications/ICT regulatorStatus of main fixed-line telephone operatorLevel of competition (competition, partial comp., monopoly) International gateway(s) Mobile telephone service Internet serviceForeign ownership (not allowed, restricted, allowed)Reg. treatment of VoIP (banned, closed, no framework, allowed)
Sector efficiency and capacityTelecommunications revenue (% of GDP)Telecommunications investment (% of revenue)
Sector performanceAccess
Fixed-telephone subscriptions (per 100 people)Mobile-cellular telephone subscriptions (per 100 people)Fixed (wired)-broadband subscriptions (per 100 people)Households with a computer (%)Households with Internet access at home (%)Usage Int’l. voice traffic, total (minutes/subscription/month)Domestic mobile traffic (minutes/subscription/month)Individuals using the Internet (%)Quality Population covered by a mobile-cellular network (%)Fixed (wired)-broadband subscriptions (% of total Internet)International Internet bandwidth (bit/s per Internet user)Affordability
Fixed-telephone sub-basket ($ a month)Mobile-cellular sub-basket ($ a month)Fixed-broadband sub-basket ($ a month)Trade
ICT goods exports (% of total goods exports)ICT goods imports (% of total goods imports)ICT service exports (% of total service exports)Applications
Online service index (0–1, 1=highest presence)Secure Internet servers (per million people)
8 7 2,39170 74 61
3,640 6,840 6,9695.5 1.8 6.298 98 94
77 82 76
Yes YesMixed Mixed
.. PP PC CA A
No A
6.0 3.0 2.534.5 23.9 18.2
32.4 29.3 19.481.3 148.1 92.42.2 17.9 10.8
17.9a 52.0 40.613.3a 51.0 36.3
5.9 6.8 1.337.8 122.8 284.420.0 55.1 41.6
100 100 99
80.0 100.0 95.5888 85,424 14,580
.. 11.9 9.4
.. 34.8 14.9
.. 10.5 17.8
1.5 2.0 17.65.5 6.2 14.7
12.5 22.8 29.1
0.57 0.49 0.428.7 146.8 18.5
46 2014 The Little Data Book on Information and Communication Technology
Europe & Central Asia Upper middle income
Bulgaria
2005 2012 2012
Upper
middle-
income
groupCountry data

Economic and social contextPopulation (millions)Urban population (% of total)GNI per capita, World Bank Atlas method ($)GDP growth, 2000–05 and 2005–12 (avg. annual %)Adult literacy rate (% ages 15 and older) Gross primary, secondary, tertiary school enrollment (%)
Sector structureSeparate telecommunications/ICT regulatorStatus of main fixed-line telephone operatorLevel of competition (competition, partial comp., monopoly) International gateway(s) Mobile telephone service Internet serviceForeign ownership (not allowed, restricted, allowed)Reg. treatment of VoIP (banned, closed, no framework, allowed)
Sector efficiency and capacityTelecommunications revenue (% of GDP)Telecommunications investment (% of revenue)
Sector performanceAccess
Fixed-telephone subscriptions (per 100 people)Mobile-cellular telephone subscriptions (per 100 people)Fixed (wired)-broadband subscriptions (per 100 people)Households with a computer (%)Households with Internet access at home (%)Usage Int’l. voice traffic, total (minutes/subscription/month)Domestic mobile traffic (minutes/subscription/month)Individuals using the Internet (%)Quality Population covered by a mobile-cellular network (%)Fixed (wired)-broadband subscriptions (% of total Internet)International Internet bandwidth (bit/s per Internet user)Affordability
Fixed-telephone sub-basket ($ a month)Mobile-cellular sub-basket ($ a month)Fixed-broadband sub-basket ($ a month)Trade
ICT goods exports (% of total goods exports)ICT goods imports (% of total goods imports)ICT service exports (% of total service exports)Applications
Online service index (0–1, 1=highest presence)Secure Internet servers (per million people)
13 16 84622 27 28
410 670 5906.4 5.5 5.924 .. 61
29 45 60
Yes YesPublic Mixed
M CC CC CR RB C
3.5 .. 5.0
55.8 .. ..
0.7 0.9 1.04.7 60.6 47.20.0 0.1 0.21.4 3.4a 4.20.0a 2.8a 3.4
.. .. ..27.7 30.2 70.10.5 3.7a 6.2
26 .. ..4.6 47.7 30.9
1,142 1,812 9,141
.. 14.8 8.9
.. 12.2 11.9
.. 46.6 46.9
0.2 0.0 ..4.5 3.2 ..8.9 21.1 ..
0.15 0.29 0.200.1 0.8 1.1
47The Little Data Book on Information and Communication Technology 2014
Sub-Saharan Africa Low income
Burkina Faso
2005 2012 2012
Low-
income
groupCountry data

48 2014 The Little Data Book on Information and Communication Technology
2005 2012 2012
Country data
Economic and social contextPopulation (millions)Urban population (% of total)GNI per capita, World Bank Atlas method ($)GDP growth, 2000–05 and 2005–12 (avg. annual %)Adult literacy rate (% ages 15 and older) Gross primary, secondary, tertiary school enrollment (%)
Sector structureSeparate telecommunications/ICT regulatorStatus of main fixed-line telephone operatorLevel of competition (competition, partial comp., monopoly) International gateway(s) Mobile telephone service Internet serviceForeign ownership (not allowed, restricted, allowed)Reg. treatment of VoIP (banned, closed, no framework, allowed)
Sector efficiency and capacityTelecommunications revenue (% of GDP)Telecommunications investment (% of revenue)
Sector performanceAccess
Fixed-telephone subscriptions (per 100 people)Mobile-cellular telephone subscriptions (per 100 people)Fixed (wired)-broadband subscriptions (per 100 people)Households with a computer (%)Households with Internet access at home (%)Usage
Int’l. voice traffic, total (minutes/subscription/month)Domestic mobile traffic (minutes/subscription/month)Individuals using the Internet (%)Quality
Population covered by a mobile-cellular network (%)Fixed (wired)-broadband subscriptions (% of total Internet)International Internet bandwidth (bit/s per Internet user)Affordability
Fixed-telephone sub-basket ($ a month)Mobile-cellular sub-basket ($ a month)Fixed-broadband sub-basket ($ a month)Trade
ICT goods exports (% of total goods exports)ICT goods imports (% of total goods imports)ICT service exports (% of total service exports)Applications
Online service index (0–1, 1=highest presence)Secure Internet servers (per million people)
8 10 8469 11 28
130 240 5902.2 4.3 5.959 87 61
36 59 60
Yes YesPublic Public
.. CC CC CA AB B
.. 2.3 5.0
.. .. ..
0.4a 0.2 1.02.0 22.8 47.20.0 0.0 0.2
.. 0.1a 4.2
.. 0.1a 3.4
.. .. ..
.. 35.1 70.10.5 1.2a 6.2
82 83 ..0.0 0.6 30.9
95 3,462 9,141
.. .. 8.9
.. .. 11.9
.. .. 46.9
0.1 0.2 ..5.6 1.9 ..
.. 6.6 ..
0.18 0.15 0.200.1 0.3 1.1
Sub-Saharan Africa Low income
BurundiLow-
income
group

49The Little Data Book on Information and Communication Technology 2014
2005 2012 2012
Economic and social contextPopulation (millions)Urban population (% of total)GNI per capita, World Bank Atlas method ($)GDP growth, 2000–05 and 2005–12 (avg. annual %)Adult literacy rate (% ages 15 and older) Gross primary, secondary, tertiary school enrollment (%)
Sector structureSeparate telecommunications/ICT regulatorStatus of main fixed-line telephone operatorLevel of competition (competition, partial comp., monopoly) International gateway(s) Mobile telephone service Internet serviceForeign ownership (not allowed, restricted, allowed)Reg. treatment of VoIP (banned, closed, no framework, allowed)
Sector efficiency and capacityTelecommunications revenue (% of GDP)Telecommunications investment (% of revenue)
Sector performanceAccess
Fixed-telephone subscriptions (per 100 people)Mobile-cellular telephone subscriptions (per 100 people)Fixed (wired)-broadband subscriptions (per 100 people)Households with a computer (%)Households with Internet access at home (%)Usage
Int’l. voice traffic, total (minutes/subscription/month)Domestic mobile traffic (minutes/subscription/month)Individuals using the Internet (%)Quality
Population covered by a mobile-cellular network (%)Fixed (wired)-broadband subscriptions (% of total Internet)International Internet bandwidth (bit/s per Internet user)Affordability
Fixed-telephone sub-basket ($ a month)Mobile-cellular sub-basket ($ a month)Fixed-broadband sub-basket ($ a month)Trade
ICT goods exports (% of total goods exports)ICT goods imports (% of total goods imports)ICT service exports (% of total service exports)Applications
Online service index (0–1, 1=highest presence)Secure Internet servers (per million people)
0.48 0.49 2,50758 63 39
2,330 3,830 1,8935.9 5.9 6.080 85 71
71 77 64
Yes YesMixed Mixed
M C
C C
C C
R AB A
6.7 7.9 2.5
19.1 23.9 20.5
15.0 14.2 5.417.1 86.0 83.1
0.2 4.0 1.46.7a 26.5a 15.01.4a 13.7a 12.4
33.8 22.6 6.5
46.6 72.1 ..6.1 34.7a 18.7
85 96 86
14.4 100.0 58.2
482 6,317 8,076
.. 10.8 4.9
.. 32.9 10.5
.. 33.3 20.6
0.5 .. 4.63.9 3.7 7.27.8 4.6 47.1
0.42 0.44 0.322.1 26.1 4.4
Sub-Saharan Africa Lower middle income
Cabo VerdeLower
middle-
income
groupCountry data

50 2014 The Little Data Book on Information and Communication Technology
2005 2012 2012
Country data
Economic and social contextPopulation (millions)Urban population (% of total)GNI per capita, World Bank Atlas method ($)GDP growth, 2000–05 and 2005–12 (avg. annual %)Adult literacy rate (% ages 15 and older) Gross primary, secondary, tertiary school enrollment (%)
Sector structureSeparate telecommunications/ICT regulatorStatus of main fixed-line telephone operatorLevel of competition (competition, partial comp., monopoly) International gateway(s) Mobile telephone service Internet serviceForeign ownership (not allowed, restricted, allowed)Reg. treatment of VoIP (banned, closed, no framework, allowed)
Sector efficiency and capacityTelecommunications revenue (% of GDP)Telecommunications investment (% of revenue)
Sector performanceAccess
Fixed-telephone subscriptions (per 100 people)Mobile-cellular telephone subscriptions (per 100 people)Fixed (wired)-broadband subscriptions (per 100 people)Households with a computer (%)Households with Internet access at home (%)Usage
Int’l. voice traffic, total (minutes/subscription/month)Domestic mobile traffic (minutes/subscription/month)Individuals using the Internet (%)Quality
Population covered by a mobile-cellular network (%)Fixed (wired)-broadband subscriptions (% of total Internet)International Internet bandwidth (bit/s per Internet user)Affordability
Fixed-telephone sub-basket ($ a month)Mobile-cellular sub-basket ($ a month)Fixed-broadband sub-basket ($ a month)Trade
ICT goods exports (% of total goods exports)ICT goods imports (% of total goods imports)ICT service exports (% of total service exports)Applications
Online service index (0–1, 1=highest presence)Secure Internet servers (per million people)
13 15 84619 20 28
460 880 5909.1 6.2 5.974 74 61
62 64 60
No YesPublic Public
.. C
P C
P C
R AB A
0.4 5.5 5.0
.. 69.8 ..
0.2 3.9 1.08.0 128.5 47.20.0 0.2 0.21.8a 5.4a 4.2
.. 3.9a 3.4
.. .. ..11.1 .. 70.1
0.3 4.9a 6.2
75 99 ..11.7 46.8 30.9
425 13,619 9,141
.. 3.8 8.9
.. 7.5 11.9
.. 23.5 46.9
0.0 0.2 ..2.3 1.7 ..6.5 8.4 ..
0.30 0.19 0.200.1 2.0 1.1
East Asia & Pacific Low income
CambodiaLow-
income
group

51The Little Data Book on Information and Communication Technology 2014
2005 2012 2012
Country data
18 22 2,50749 53 39
900 1,170 1,8933.8 3.2 6.071 71 71
51 62 64
Yes YesPublic Public
.. ..C C
C C
A A
B B
3.1 3.5 2.5
28.3 24.2 20.5
0.6 3.4 5.412.4 60.4 83.1
0.0 0.6 1.43.0 8.3a 15.01.1a 3.5a 12.4
.. 4.4 6.5
1.6 9.3 ..1.4 5.7a 18.7
54 .. 86
1.3 .. 58.2
609 260 8,076
.. 17.9 4.9
.. 18.8 10.5
.. 58.1 20.6
0.0 0.0 4.63.3 2.7 7.2
19.1 29.7 47.1
0.27 0.30 0.320.1 1.5 4.4
Economic and social contextPopulation (millions)Urban population (% of total)GNI per capita, World Bank Atlas method ($)GDP growth, 2000–05 and 2005–12 (avg. annual %)Adult literacy rate (% ages 15 and older) Gross primary, secondary, tertiary school enrollment (%)
Sector structureSeparate telecommunications/ICT regulatorStatus of main fixed-line telephone operatorLevel of competition (competition, partial comp., monopoly) International gateway(s) Mobile telephone service Internet serviceForeign ownership (not allowed, restricted, allowed)Reg. treatment of VoIP (banned, closed, no framework, allowed)
Sector efficiency and capacityTelecommunications revenue (% of GDP)Telecommunications investment (% of revenue)
Sector performanceAccess
Fixed-telephone subscriptions (per 100 people)Mobile-cellular telephone subscriptions (per 100 people)Fixed (wired)-broadband subscriptions (per 100 people)Households with a computer (%)Households with Internet access at home (%)Usage
Int’l. voice traffic, total (minutes/subscription/month)Domestic mobile traffic (minutes/subscription/month)Individuals using the Internet (%)Quality
Population covered by a mobile-cellular network (%)Fixed (wired)-broadband subscriptions (% of total Internet)International Internet bandwidth (bit/s per Internet user)Affordability
Fixed-telephone sub-basket ($ a month)Mobile-cellular sub-basket ($ a month)Fixed-broadband sub-basket ($ a month)Trade
ICT goods exports (% of total goods exports)ICT goods imports (% of total goods imports)ICT service exports (% of total service exports)Applications
Online service index (0–1, 1=highest presence)Secure Internet servers (per million people)
Sub-Saharan Africa Lower middle income
CameroonLower
middle-
income
group

52 2014 The Little Data Book on Information and Communication Technology
2005 2012 2012
Country data
Economic and social contextPopulation (millions)Urban population (% of total)GNI per capita, World Bank Atlas method ($)GDP growth, 2000–05 and 2005–12 (avg. annual %)Adult literacy rate (% ages 15 and older) Gross primary, secondary, tertiary school enrollment (%)
Sector structureSeparate telecommunications/ICT regulatorStatus of main fixed-line telephone operatorLevel of competition (competition, partial comp., monopoly) International gateway(s) Mobile telephone service Internet serviceForeign ownership (not allowed, restricted, allowed)Reg. treatment of VoIP (banned, closed, no framework, allowed)
Sector efficiency and capacityTelecommunications revenue (% of GDP)Telecommunications investment (% of revenue)
Sector performanceAccess
Fixed-telephone subscriptions (per 100 people)Mobile-cellular telephone subscriptions (per 100 people)Fixed (wired)-broadband subscriptions (per 100 people)Households with a computer (%)Households with Internet access at home (%)Usage
Int’l. voice traffic, total (minutes/subscription/month)Domestic mobile traffic (minutes/subscription/month)Individuals using the Internet (%)Quality
Population covered by a mobile-cellular network (%)Fixed (wired)-broadband subscriptions (% of total Internet)International Internet bandwidth (bit/s per Internet user)Affordability
Fixed-telephone sub-basket ($ a month)Mobile-cellular sub-basket ($ a month)Fixed-broadband sub-basket ($ a month)Trade
ICT goods exports (% of total goods exports)ICT goods imports (% of total goods imports)ICT service exports (% of total service exports)Applications
Online service index (0–1, 1=highest presence)Secure Internet servers (per million people)
32 35 1,30080 81 80
33,110 51,570 38,4122.5 1.2 1.0
.. .. ..
.. .. 93
Yes YesPublic Private
C CC CC CR RA A
2.5 2.5 2.716.2 21.9 17.6
56.3 50.7 43.652.8 80.1 122.921.7 32.5 26.272.0 86.6a 77.764.3 83.0a 75.5
.. .. ..
.. 357.1 113.6
71.7 86.8a 75.4
97 99 10078.9 97.9 95.9
9,411 100,505 85,990
.. 29.3 25.2
.. 40.8 20.6
.. 40.4 29.2
3.9 2.3 8.99.1 7.3 10.8
39.3 41.2 30.8
0.82 0.89 0.67569.1 1,040.6 827.6
High income
CanadaHigh-
income
group

53The Little Data Book on Information and Communication Technology 2014
2005 2012 2012
High-
income
groupCountry data
0.05 0.06 1,300100 100 80
.. .. 38,412
.. .. 1.099 .. ..
.. .. 93
.. ..
.. ..
.. ..
.. ..
.. ..
.. ..No No
.. .. 2.7
.. .. 17.6
78.2a 65.0 43.6166.5 171.7 122.9
.. 33.6 26.254.8 74.5a 77.750.7a 66.0a 75.5
.. .. ..
.. .. 113.6
38.0 74.1a 75.4
100 100 100.. .. 95.9
.. .. 85,990
.. .. 25.2
.. .. 20.6
.. .. 29.2
.. .. 8.9
.. .. 10.8
.. .. 30.8
.. .. 0.67843.2 2,103.4 827.6
Economic and social contextPopulation (millions)Urban population (% of total)GNI per capita, World Bank Atlas method ($)GDP growth, 2000–05 and 2005–12 (avg. annual %)Adult literacy rate (% ages 15 and older) Gross primary, secondary, tertiary school enrollment (%)
Sector structureSeparate telecommunications/ICT regulatorStatus of main fixed-line telephone operatorLevel of competition (competition, partial comp., monopoly) International gateway(s) Mobile telephone service Internet serviceForeign ownership (not allowed, restricted, allowed)Reg. treatment of VoIP (banned, closed, no framework, allowed)
Sector efficiency and capacityTelecommunications revenue (% of GDP)Telecommunications investment (% of revenue)
Sector performanceAccess
Fixed-telephone subscriptions (per 100 people)Mobile-cellular telephone subscriptions (per 100 people)Fixed (wired)-broadband subscriptions (per 100 people)Households with a computer (%)Households with Internet access at home (%)Usage
Int’l. voice traffic, total (minutes/subscription/month)Domestic mobile traffic (minutes/subscription/month)Individuals using the Internet (%)Quality
Population covered by a mobile-cellular network (%)Fixed (wired)-broadband subscriptions (% of total Internet)International Internet bandwidth (bit/s per Internet user)Affordability
Fixed-telephone sub-basket ($ a month)Mobile-cellular sub-basket ($ a month)Fixed-broadband sub-basket ($ a month)Trade
ICT goods exports (% of total goods exports)ICT goods imports (% of total goods imports)ICT service exports (% of total service exports)Applications
Online service index (0–1, 1=highest presence)Secure Internet servers (per million people)
High income
Cayman Islands

54 2014 The Little Data Book on Information and Communication Technology
2005 2012 2012
Country data
Economic and social contextPopulation (millions)Urban population (% of total)GNI per capita, World Bank Atlas method ($)GDP growth, 2000–05 and 2005–12 (avg. annual %)Adult literacy rate (% ages 15 and older) Gross primary, secondary, tertiary school enrollment (%)
Sector structureSeparate telecommunications/ICT regulatorStatus of main fixed-line telephone operatorLevel of competition (competition, partial comp., monopoly) International gateway(s) Mobile telephone service Internet serviceForeign ownership (not allowed, restricted, allowed)Reg. treatment of VoIP (banned, closed, no framework, allowed)
Sector efficiency and capacityTelecommunications revenue (% of GDP)Telecommunications investment (% of revenue)
Sector performanceAccess
Fixed-telephone subscriptions (per 100 people)Mobile-cellular telephone subscriptions (per 100 people)Fixed (wired)-broadband subscriptions (per 100 people)Households with a computer (%)Households with Internet access at home (%)Usage
Int’l. voice traffic, total (minutes/subscription/month)Domestic mobile traffic (minutes/subscription/month)Individuals using the Internet (%)Quality
Population covered by a mobile-cellular network (%)Fixed (wired)-broadband subscriptions (% of total Internet)International Internet bandwidth (bit/s per Internet user)Affordability
Fixed-telephone sub-basket ($ a month)Mobile-cellular sub-basket ($ a month)Fixed-broadband sub-basket ($ a month)Trade
ICT goods exports (% of total goods exports)ICT goods imports (% of total goods imports)ICT service exports (% of total service exports)Applications
Online service index (0–1, 1=highest presence)Secure Internet servers (per million people)
4 5 84638 39 28
340 510 5901.5 6.7 5.951 57 61
.. 43 60
Yes YesMixed Mixed
.. CC CC C.. A.. C
1.1 2.2 5.0
.. 56.3 ..
0.3 0.0 1.02.5 25.3 47.20.0 0.0 0.2
.. 2.9a 4.2
.. 2.4a 3.4
.. 5.2 ..
.. 29.8 70.10.3a 3.0a 6.2
19 63 ..0.0 0.0 30.9
145 162 9,141
.. 10.1 8.9
.. 12.9 11.9
.. 1,329.5 46.9
0.0 0.2 ..2.4 5.9 ..
.. .. ..
0.14 0.00 0.200.2 0.2 1.1
Sub-Saharan Africa Low income
Central African RepublicLow-
income
group

55The Little Data Book on Information and Communication Technology 2014
2005 2012 2012
Country data
Economic and social contextPopulation (millions)Urban population (% of total)GNI per capita, World Bank Atlas method ($)GDP growth, 2000–05 and 2005–12 (avg. annual %)Adult literacy rate (% ages 15 and older) Gross primary, secondary, tertiary school enrollment (%)
Sector structureSeparate telecommunications/ICT regulatorStatus of main fixed-line telephone operatorLevel of competition (competition, partial comp., monopoly) International gateway(s) Mobile telephone service Internet serviceForeign ownership (not allowed, restricted, allowed)Reg. treatment of VoIP (banned, closed, no framework, allowed)
Sector efficiency and capacityTelecommunications revenue (% of GDP)Telecommunications investment (% of revenue)
Sector performanceAccess
Fixed-telephone subscriptions (per 100 people)Mobile-cellular telephone subscriptions (per 100 people)Fixed (wired)-broadband subscriptions (per 100 people)Households with a computer (%)Households with Internet access at home (%)Usage
Int’l. voice traffic, total (minutes/subscription/month)Domestic mobile traffic (minutes/subscription/month)Individuals using the Internet (%)Quality
Population covered by a mobile-cellular network (%)Fixed (wired)-broadband subscriptions (% of total Internet)International Internet bandwidth (bit/s per Internet user)Affordability
Fixed-telephone sub-basket ($ a month)Mobile-cellular sub-basket ($ a month)Fixed-broadband sub-basket ($ a month)Trade
ICT goods exports (% of total goods exports)ICT goods imports (% of total goods imports)ICT service exports (% of total service exports)Applications
Online service index (0–1, 1=highest presence)Secure Internet servers (per million people)
10 12 84622 22 28
360 770 59017.2 4.9 5.9
28 35 61
36 47 60
Yes YesPublic Public
.. ..C ..C C
A AB B
.. 2.1 5.0
.. .. ..
0.1 0.2 1.02.1 35.4 47.20.0 0.2 0.2
.. 2.5a 4.2
.. 2.3a 3.4
.. 3.4 ..
.. .. 70.10.4 2.1a 6.2
24 36 ..0.0 100.0 30.9
88 490 9,141
.. 16.7 8.9
.. 15.4 11.9
.. 11.8 46.9
.. .. ..
.. .. ..
.. .. ..
0.10 0.10 0.20.. .. 1.1
Sub-Saharan Africa Low income
ChadLow-
income
group

56 2014 The Little Data Book on Information and Communication Technology
2005 2012 2012
Country data
Economic and social contextPopulation (millions)Urban population (% of total)GNI per capita, World Bank Atlas method ($)GDP growth, 2000–05 and 2005–12 (avg. annual %)Adult literacy rate (% ages 15 and older) Gross primary, secondary, tertiary school enrollment (%)
Sector structureSeparate telecommunications/ICT regulatorStatus of main fixed-line telephone operatorLevel of competition (competition, partial comp., monopoly) International gateway(s) Mobile telephone service Internet serviceForeign ownership (not allowed, restricted, allowed)Reg. treatment of VoIP (banned, closed, no framework, allowed)
Sector efficiency and capacityTelecommunications revenue (% of GDP)Telecommunications investment (% of revenue)
Sector performanceAccess
Fixed-telephone subscriptions (per 100 people)Mobile-cellular telephone subscriptions (per 100 people)Fixed (wired)-broadband subscriptions (per 100 people)Households with a computer (%)Households with Internet access at home (%)Usage
Int’l. voice traffic, total (minutes/subscription/month)Domestic mobile traffic (minutes/subscription/month)Individuals using the Internet (%)Quality
Population covered by a mobile-cellular network (%)Fixed (wired)-broadband subscriptions (% of total Internet)International Internet bandwidth (bit/s per Internet user)Affordability
Fixed-telephone sub-basket ($ a month)Mobile-cellular sub-basket ($ a month)Fixed-broadband sub-basket ($ a month)Trade
ICT goods exports (% of total goods exports)ICT goods imports (% of total goods imports)ICT service exports (% of total service exports)Applications
Online service index (0–1, 1=highest presence)Secure Internet servers (per million people)
0.15 0.16 1,30031 31 80
55,320 .. 38,412–1.2 .. 1.0
.. .. ..
.. .. 93
.. ..
.. ..
.. ..
.. ..
.. ..
.. ..
.. ..
.. .. 2.7
.. .. 17.6
.. .. 43.6
.. .. 122.9
.. .. 26.2
.. .. 77.7
.. .. 75.5
.. .. ..
.. .. 113.6
.. .. 75.4
.. .. 100
.. .. 95.9
.. .. 85,990
.. .. 25.2
.. .. 20.6
.. .. 29.2
.. .. 8.9
.. .. 10.8
.. .. 30.8
.. .. 0.67
.. .. 827.6
High income
Channel IslandsHigh-
income
groupCountry data

57The Little Data Book on Information and Communication Technology 2014
2005 2012 2012
Country data
Economic and social contextPopulation (millions)Urban population (% of total)GNI per capita, World Bank Atlas method ($)GDP growth, 2000–05 and 2005–12 (avg. annual %)Adult literacy rate (% ages 15 and older) Gross primary, secondary, tertiary school enrollment (%)
Sector structureSeparate telecommunications/ICT regulatorStatus of main fixed-line telephone operatorLevel of competition (competition, partial comp., monopoly) International gateway(s) Mobile telephone service Internet serviceForeign ownership (not allowed, restricted, allowed)Reg. treatment of VoIP (banned, closed, no framework, allowed)
Sector efficiency and capacityTelecommunications revenue (% of GDP)Telecommunications investment (% of revenue)
Sector performanceAccess
Fixed-telephone subscriptions (per 100 people)Mobile-cellular telephone subscriptions (per 100 people)Fixed (wired)-broadband subscriptions (per 100 people)Households with a computer (%)Households with Internet access at home (%)Usage
Int’l. voice traffic, total (minutes/subscription/month)Domestic mobile traffic (minutes/subscription/month)Individuals using the Internet (%)Quality
Population covered by a mobile-cellular network (%)Fixed (wired)-broadband subscriptions (% of total Internet)International Internet bandwidth (bit/s per Internet user)Affordability
Fixed-telephone sub-basket ($ a month)Mobile-cellular sub-basket ($ a month)Fixed-broadband sub-basket ($ a month)Trade
ICT goods exports (% of total goods exports)ICT goods imports (% of total goods imports)ICT service exports (% of total service exports)Applications
Online service index (0–1, 1=highest presence)Secure Internet servers (per million people)
16 17 1,30088 89 80
6,250 14,310 38,4124.2 3.8 1.096 99 ..83 88 93
Yes YesPrivate Private
C C
C C
C C
A ANo A
.. .. 2.7
.. .. 17.6
21.0 18.8 43.664.7 138.2 122.9
4.3 12.4 26.230.1a 53.7a 77.716.7a 45.3a 75.5
3.7 1.9 ..55.9 91.5 113.6
31.2a 61.4a 75.4
100 100 10078.2 98.9 95.9
2,494 40,460 85,990
.. 35.1 25.2
.. 22.8 20.6
.. 25.8 29.2
0.5 0.3 8.98.2 7.3 10.8
18.4 21.1 30.8
0.58 0.75 0.6721.0 93.6 827.6
High income
ChileHigh-
income
group

58 2014 The Little Data Book on Information and Communication Technology
2005 2012 2012
Country data
Economic and social contextPopulation (millions)Urban population (% of total)GNI per capita, World Bank Atlas method ($)GDP growth, 2000–05 and 2005–12 (avg. annual %)Adult literacy rate (% ages 15 and older) Gross primary, secondary, tertiary school enrollment (%)
Sector structureSeparate telecommunications/ICT regulatorStatus of main fixed-line telephone operatorLevel of competition (competition, partial comp., monopoly) International gateway(s) Mobile telephone service Internet serviceForeign ownership (not allowed, restricted, allowed)Reg. treatment of VoIP (banned, closed, no framework, allowed)
Sector efficiency and capacityTelecommunications revenue (% of GDP)Telecommunications investment (% of revenue)
Sector performanceAccess
Fixed-telephone subscriptions (per 100 people)Mobile-cellular telephone subscriptions (per 100 people)Fixed (wired)-broadband subscriptions (per 100 people)Households with a computer (%)Households with Internet access at home (%)Usage
Int’l. voice traffic, total (minutes/subscription/month)Domestic mobile traffic (minutes/subscription/month)Individuals using the Internet (%)Quality
Population covered by a mobile-cellular network (%)Fixed (wired)-broadband subscriptions (% of total Internet)International Internet bandwidth (bit/s per Internet user)Affordability
Fixed-telephone sub-basket ($ a month)Mobile-cellular sub-basket ($ a month)Fixed-broadband sub-basket ($ a month)Trade
ICT goods exports (% of total goods exports)ICT goods imports (% of total goods imports)ICT service exports (% of total service exports)Applications
Online service index (0–1, 1=highest presence)Secure Internet servers (per million people)
1,304 1,351 2,39143 52 61
1,740 5,720 6,9699.8 10.4 6.291 95 94
64 74 76
No NoMixed Mixed
.. P
P ..C ..R RB C
3.2 2.1 2.535.9 33.6 18.2
26.6 20.2 19.429.8 80.8 92.4
2.8 12.7 10.825.0 40.9a 40.611.0 37.4a 36.3
1.3 0.4 1.3132.5 415.4 284.4
8.5 42.3a 41.6
97 99 99
51.2 96.8 95.51,211 3,261 14,580
.. 4.9 9.4
.. 2.3 14.9
.. 23.2 17.8
30.7 27.1 17.625.3 19.6 14.724.9 34.9 29.1
0.50 0.53 0.420.3 3.9 18.5
East Asia & Pacific Upper middle income
ChinaUpper
middle-
income
group

59The Little Data Book on Information and Communication Technology 2014
2005 2012 2012
Country data
Economic and social contextPopulation (millions)Urban population (% of total)GNI per capita, World Bank Atlas method ($)GDP growth, 2000–05 and 2005–12 (avg. annual %)Adult literacy rate (% ages 15 and older) Gross primary, secondary, tertiary school enrollment (%)
Sector structureSeparate telecommunications/ICT regulatorStatus of main fixed-line telephone operatorLevel of competition (competition, partial comp., monopoly) International gateway(s) Mobile telephone service Internet serviceForeign ownership (not allowed, restricted, allowed)Reg. treatment of VoIP (banned, closed, no framework, allowed)
Sector efficiency and capacityTelecommunications revenue (% of GDP)Telecommunications investment (% of revenue)
Sector performanceAccess
Fixed-telephone subscriptions (per 100 people)Mobile-cellular telephone subscriptions (per 100 people)Fixed (wired)-broadband subscriptions (per 100 people)Households with a computer (%)Households with Internet access at home (%)Usage
Int’l. voice traffic, total (minutes/subscription/month)Domestic mobile traffic (minutes/subscription/month)Individuals using the Internet (%)Quality
Population covered by a mobile-cellular network (%)Fixed (wired)-broadband subscriptions (% of total Internet)International Internet bandwidth (bit/s per Internet user)Affordability
Fixed-telephone sub-basket ($ a month)Mobile-cellular sub-basket ($ a month)Fixed-broadband sub-basket ($ a month)Trade
ICT goods exports (% of total goods exports)ICT goods imports (% of total goods imports)ICT service exports (% of total service exports)Applications
Online service index (0–1, 1=highest presence)Secure Internet servers (per million people)
43 48 2,39174 76 61
2,930 7,020 6,9693.7 4.5 6.293 94 94
79 82 76
Yes YesPublic Mixed
.. CP CC CR A
No A
4.3 5.4 2.5.. 17.8 18.2
17.8 13.0 19.450.6 102.9 92.4
0.7 8.2 10.814.6 38.4 40.6
6.2 32.1 36.3
.. 5.7 1.348.4 353.4 284.411.0 49.0 41.6
82 100 99
46.3 99.9 95.54,686 20,370 14,580
.. 10.0 9.4
.. 22.7 14.9
.. 18.7 17.8
0.2 0.1 17.613.0 9.0 14.714.6 18.6 29.1
0.53 0.84 0.424.4 33.5 18.5
Latin America & Caribbean Upper middle income
Colombia
2005 2012 2012
Upper
middle-
income
group

60 2014 The Little Data Book on Information and Communication Technology
2005 2012 2012
Country data
Economic and social contextPopulation (millions)Urban population (% of total)GNI per capita, World Bank Atlas method ($)GDP growth, 2000–05 and 2005–12 (avg. annual %)Adult literacy rate (% ages 15 and older) Gross primary, secondary, tertiary school enrollment (%)
Sector structureSeparate telecommunications/ICT regulatorStatus of main fixed-line telephone operatorLevel of competition (competition, partial comp., monopoly) International gateway(s) Mobile telephone service Internet serviceForeign ownership (not allowed, restricted, allowed)Reg. treatment of VoIP (banned, closed, no framework, allowed)
Sector efficiency and capacityTelecommunications revenue (% of GDP)Telecommunications investment (% of revenue)
Sector performanceAccess
Fixed-telephone subscriptions (per 100 people)Mobile-cellular telephone subscriptions (per 100 people)Fixed (wired)-broadband subscriptions (per 100 people)Households with a computer (%)Households with Internet access at home (%)Usage
Int’l. voice traffic, total (minutes/subscription/month)Domestic mobile traffic (minutes/subscription/month)Individuals using the Internet (%)Quality
Population covered by a mobile-cellular network (%)Fixed (wired)-broadband subscriptions (% of total Internet)International Internet bandwidth (bit/s per Internet user)Affordability
Fixed-telephone sub-basket ($ a month)Mobile-cellular sub-basket ($ a month)Fixed-broadband sub-basket ($ a month)Trade
ICT goods exports (% of total goods exports)ICT goods imports (% of total goods imports)ICT service exports (% of total service exports)Applications
Online service index (0–1, 1=highest presence)Secure Internet servers (per million people)
0.60 0.72 84628 28 28
650 840 5902.6 1.6 5.968 76 61
64 78 60
No YesPublic Public
.. M
.. M
M M
No AB C
4.0 5.5 5.0
25.6 13.8 ..
2.8 3.3a 1.02.6 39.5 47.20.0 0.2 0.23.0 6.4a 4.20.8a 3.4a 3.4
.. .. ..
.. 49.4 70.12.0a 6.0a 6.2
40 .. ..0.3 60.6 30.9
166 7,231 9,141
.. 10.0 8.9
.. 13.5 11.9
.. 80.2 46.9
0.0 0.9 ..2.7 7.0 ..
.. .. ..
0.19 0.08 0.205.0 1.4 1.1
Sub-Saharan Africa Low income
ComorosLow-
income
group

61The Little Data Book on Information and Communication Technology 2014
2005 2012 2012
Country data
54 66 84631 35 28
130 230 5904.6 5.8 5.961 .. 61
53 63 60
Yes YesPublic Public
.. C
C C
C C
No R
B A
5.5 5.8 5.0
89.2 49.4 ..
0.0 0.1 1.05.1 30.6 47.20.0 0.0 0.20.2a 1.3a 4.20.2a 1.3a 3.4
9.5 3.0 ..51.2 35.6 70.1
0.2a 1.7a 6.2
50 50 ..6.3 .. 30.9
39 725 9,141
.. 9.9 8.9
.. 11.9 11.9
.. 400.2 46.9
.. .. ..
.. .. ..
.. .. ..
0.22 0.18 0.200.1 0.3 1.1
Economic and social contextPopulation (millions)Urban population (% of total)GNI per capita, World Bank Atlas method ($)GDP growth, 2000–05 and 2005–12 (avg. annual %)Adult literacy rate (% ages 15 and older) Gross primary, secondary, tertiary school enrollment (%)
Sector structureSeparate telecommunications/ICT regulatorStatus of main fixed-line telephone operatorLevel of competition (competition, partial comp., monopoly) International gateway(s) Mobile telephone service Internet serviceForeign ownership (not allowed, restricted, allowed)Reg. treatment of VoIP (banned, closed, no framework, allowed)
Sector efficiency and capacityTelecommunications revenue (% of GDP)Telecommunications investment (% of revenue)
Sector performanceAccess
Fixed-telephone subscriptions (per 100 people)Mobile-cellular telephone subscriptions (per 100 people)Fixed (wired)-broadband subscriptions (per 100 people)Households with a computer (%)Households with Internet access at home (%)Usage
Int’l. voice traffic, total (minutes/subscription/month)Domestic mobile traffic (minutes/subscription/month)Individuals using the Internet (%)Quality
Population covered by a mobile-cellular network (%)Fixed (wired)-broadband subscriptions (% of total Internet)International Internet bandwidth (bit/s per Internet user)Affordability
Fixed-telephone sub-basket ($ a month)Mobile-cellular sub-basket ($ a month)Fixed-broadband sub-basket ($ a month)Trade
ICT goods exports (% of total goods exports)ICT goods imports (% of total goods imports)ICT service exports (% of total service exports)Applications
Online service index (0–1, 1=highest presence)Secure Internet servers (per million people)
Sub-Saharan Africa Low income
Congo, Dem. Rep.Low-
income
group
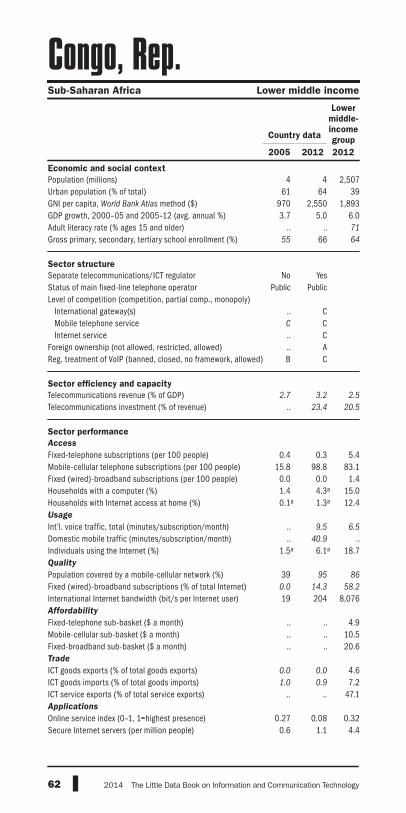
62 2014 The Little Data Book on Information and Communication Technology
2005 2012 2012
Country data
Economic and social contextPopulation (millions)Urban population (% of total)GNI per capita, World Bank Atlas method ($)GDP growth, 2000–05 and 2005–12 (avg. annual %)Adult literacy rate (% ages 15 and older) Gross primary, secondary, tertiary school enrollment (%)
Sector structureSeparate telecommunications/ICT regulatorStatus of main fixed-line telephone operatorLevel of competition (competition, partial comp., monopoly) International gateway(s) Mobile telephone service Internet serviceForeign ownership (not allowed, restricted, allowed)Reg. treatment of VoIP (banned, closed, no framework, allowed)
Sector efficiency and capacityTelecommunications revenue (% of GDP)Telecommunications investment (% of revenue)
Sector performanceAccess
Fixed-telephone subscriptions (per 100 people)Mobile-cellular telephone subscriptions (per 100 people)Fixed (wired)-broadband subscriptions (per 100 people)Households with a computer (%)Households with Internet access at home (%)Usage
Int’l. voice traffic, total (minutes/subscription/month)Domestic mobile traffic (minutes/subscription/month)Individuals using the Internet (%)Quality
Population covered by a mobile-cellular network (%)Fixed (wired)-broadband subscriptions (% of total Internet)International Internet bandwidth (bit/s per Internet user)Affordability
Fixed-telephone sub-basket ($ a month)Mobile-cellular sub-basket ($ a month)Fixed-broadband sub-basket ($ a month)Trade
ICT goods exports (% of total goods exports)ICT goods imports (% of total goods imports)ICT service exports (% of total service exports)Applications
Online service index (0–1, 1=highest presence)Secure Internet servers (per million people)
4 4 2,50761 64 39
970 2,550 1,8933.7 5.0 6.0
.. .. 71
55 66 64
No YesPublic Public
.. CC C.. C.. AB C
2.7 3.2 2.5
.. 23.4 20.5
0.4 0.3 5.415.8 98.8 83.1
0.0 0.0 1.41.4 4.3a 15.00.1a 1.3a 12.4
.. 9.5 6.5
.. 40.9 ..1.5a 6.1a 18.7
39 95 86
0.0 14.3 58.2
19 204 8,076
.. .. 4.9
.. .. 10.5
.. .. 20.6
0.0 0.0 4.61.0 0.9 7.2
.. .. 47.1
0.27 0.08 0.320.6 1.1 4.4
Sub-Saharan Africa Lower middle income
Congo, Rep.Lower
middle-
income
group

63The Little Data Book on Information and Communication Technology 2014
2005 2012 2012
Country data
Economic and social contextPopulation (millions)Urban population (% of total)GNI per capita, World Bank Atlas method ($)GDP growth, 2000–05 and 2005–12 (avg. annual %)Adult literacy rate (% ages 15 and older) Gross primary, secondary, tertiary school enrollment (%)
Sector structureSeparate telecommunications/ICT regulatorStatus of main fixed-line telephone operatorLevel of competition (competition, partial comp., monopoly) International gateway(s) Mobile telephone service Internet serviceForeign ownership (not allowed, restricted, allowed)Reg. treatment of VoIP (banned, closed, no framework, allowed)
Sector efficiency and capacityTelecommunications revenue (% of GDP)Telecommunications investment (% of revenue)
Sector performanceAccess
Fixed-telephone subscriptions (per 100 people)Mobile-cellular telephone subscriptions (per 100 people)Fixed (wired)-broadband subscriptions (per 100 people)Households with a computer (%)Households with Internet access at home (%)Usage
Int’l. voice traffic, total (minutes/subscription/month)Domestic mobile traffic (minutes/subscription/month)Individuals using the Internet (%)Quality
Population covered by a mobile-cellular network (%)Fixed (wired)-broadband subscriptions (% of total Internet)International Internet bandwidth (bit/s per Internet user)Affordability
Fixed-telephone sub-basket ($ a month)Mobile-cellular sub-basket ($ a month)Fixed-broadband sub-basket ($ a month)Trade
ICT goods exports (% of total goods exports)ICT goods imports (% of total goods imports)ICT service exports (% of total service exports)Applications
Online service index (0–1, 1=highest presence)Secure Internet servers (per million people)
4 5 2,39162 65 61
4,810 8,820 6,9694.3 4.1 6.295 96 94
74 85 76
Yes YesPublic Public
.. CM CM CR RB A
2.3 2.3 2.525.8 98.2 18.2
32.1 20.7 19.425.5 111.9 92.4
1.0 9.3 10.827.0 49.0 40.610.2 47.3 36.3
19.2 13.0 1.3152.2 120.0 284.4
22.1 47.5 41.6
86 70 99
60.6 100.0 95.5687 29,890 14,580
.. 4.7 9.4
.. 3.8 14.9
.. 15.8 17.8
23.7 19.4 17.623.7 18.3 14.713.3 32.2 29.1
0.51 0.50 0.4261.8 79.0 18.5
Latin America & Caribbean Upper middle income
Costa RicaUpper
middle-
income
group

64 2014 The Little Data Book on Information and Communication Technology
2005 2012 2012
Country data
Economic and social contextPopulation (millions)Urban population (% of total)GNI per capita, World Bank Atlas method ($)GDP growth, 2000–05 and 2005–12 (avg. annual %)Adult literacy rate (% ages 15 and older) Gross primary, secondary, tertiary school enrollment (%)
Sector structureSeparate telecommunications/ICT regulatorStatus of main fixed-line telephone operatorLevel of competition (competition, partial comp., monopoly) International gateway(s) Mobile telephone service Internet serviceForeign ownership (not allowed, restricted, allowed)Reg. treatment of VoIP (banned, closed, no framework, allowed)
Sector efficiency and capacityTelecommunications revenue (% of GDP)Telecommunications investment (% of revenue)
Sector performanceAccess
Fixed-telephone subscriptions (per 100 people)Mobile-cellular telephone subscriptions (per 100 people)Fixed (wired)-broadband subscriptions (per 100 people)Households with a computer (%)Households with Internet access at home (%)Usage
Int’l. voice traffic, total (minutes/subscription/month)Domestic mobile traffic (minutes/subscription/month)Individuals using the Internet (%)Quality
Population covered by a mobile-cellular network (%)Fixed (wired)-broadband subscriptions (% of total Internet)International Internet bandwidth (bit/s per Internet user)Affordability
Fixed-telephone sub-basket ($ a month)Mobile-cellular sub-basket ($ a month)Fixed-broadband sub-basket ($ a month)Trade
ICT goods exports (% of total goods exports)ICT goods imports (% of total goods imports)ICT service exports (% of total service exports)Applications
Online service index (0–1, 1=highest presence)Secure Internet servers (per million people)
17 20 2,50747 52 39
900 1,220 1,893–0.2 1.9 6.0
49 57 71
.. .. 64
Yes YesMixed Mixed
.. MP PC CA AB No
5.0 7.0 2.5
29.1 15.4 20.5
1.5 1.4 5.413.5 91.2 83.1
0.0 0.1 1.41.3 2.3a 15.00.2a 1.3a 12.4
.. 5.9 6.5
106.4 66.5 ..1.0 2.4a 18.7
55 95 86
6.9 .. 58.2
307 16,950 8,076
.. 20.7 4.9
.. 20.1 10.5
.. 42.4 20.6
0.6 0.1 4.63.8 3.1 7.2
33.7 28.5 47.1
0.19 0.33 0.320.3 2.0 4.4
Sub-Saharan Africa Lower middle income
Côte d’IvoireLower
middle-
income
group

65The Little Data Book on Information and Communication Technology 2014
2005 2012 2012
Country data
Economic and social contextPopulation (millions)Urban population (% of total)GNI per capita, World Bank Atlas method ($)GDP growth, 2000–05 and 2005–12 (avg. annual %)Adult literacy rate (% ages 15 and older) Gross primary, secondary, tertiary school enrollment (%)
Sector structureSeparate telecommunications/ICT regulatorStatus of main fixed-line telephone operatorLevel of competition (competition, partial comp., monopoly) International gateway(s) Mobile telephone service Internet serviceForeign ownership (not allowed, restricted, allowed)Reg. treatment of VoIP (banned, closed, no framework, allowed)
Sector efficiency and capacityTelecommunications revenue (% of GDP)Telecommunications investment (% of revenue)
Sector performanceAccess
Fixed-telephone subscriptions (per 100 people)Mobile-cellular telephone subscriptions (per 100 people)Fixed (wired)-broadband subscriptions (per 100 people)Households with a computer (%)Households with Internet access at home (%)Usage
Int’l. voice traffic, total (minutes/subscription/month)Domestic mobile traffic (minutes/subscription/month)Individuals using the Internet (%)Quality
Population covered by a mobile-cellular network (%)Fixed (wired)-broadband subscriptions (% of total Internet)International Internet bandwidth (bit/s per Internet user)Affordability
Fixed-telephone sub-basket ($ a month)Mobile-cellular sub-basket ($ a month)Fixed-broadband sub-basket ($ a month)Trade
ICT goods exports (% of total goods exports)ICT goods imports (% of total goods imports)ICT service exports (% of total service exports)Applications
Online service index (0–1, 1=highest presence)Secure Internet servers (per million people)
4 4 1,30056 58 80
9,690 13,490 38,4124.6 –0.4 1.098 99 ..79 85 93
Yes YesMixed Mixed
C C
C CC C
A AA A
4.9 3.6 2.714.5 18.3 17.6
42.9 37.9 43.683.2 115.4 122.9
2.6 20.7 26.232.7 68.0 77.725.0 66.0 75.5
16.5 8.4 ..65.7 115.0 113.6
33.1 63.0 75.4
100 100 10012.2 95.6 95.9
3,280 28,743 85,990
.. 15.3 25.2
.. 17.6 20.6
.. 19.0 29.2
2.6 1.9 8.96.1 4.4 10.8
12.5 14.5 30.8
0.57 0.64 0.6739.6 188.5 827.6
High income
CroatiaHigh-
income
group

66 2014 The Little Data Book on Information and Communication Technology
2005 2012 2012
Country data
Economic and social contextPopulation (millions)Urban population (% of total)GNI per capita, World Bank Atlas method ($)GDP growth, 2000–05 and 2005–12 (avg. annual %)Adult literacy rate (% ages 15 and older) Gross primary, secondary, tertiary school enrollment (%)
Sector structureSeparate telecommunications/ICT regulatorStatus of main fixed-line telephone operatorLevel of competition (competition, partial comp., monopoly) International gateway(s) Mobile telephone service Internet serviceForeign ownership (not allowed, restricted, allowed)Reg. treatment of VoIP (banned, closed, no framework, allowed)
Sector efficiency and capacityTelecommunications revenue (% of GDP)Telecommunications investment (% of revenue)
Sector performanceAccess
Fixed-telephone subscriptions (per 100 people)Mobile-cellular telephone subscriptions (per 100 people)Fixed (wired)-broadband subscriptions (per 100 people)Households with a computer (%)Households with Internet access at home (%)Usage
Int’l. voice traffic, total (minutes/subscription/month)Domestic mobile traffic (minutes/subscription/month)Individuals using the Internet (%)Quality
Population covered by a mobile-cellular network (%)Fixed (wired)-broadband subscriptions (% of total Internet)International Internet bandwidth (bit/s per Internet user)Affordability
Fixed-telephone sub-basket ($ a month)Mobile-cellular sub-basket ($ a month)Fixed-broadband sub-basket ($ a month)Trade
ICT goods exports (% of total goods exports)ICT goods imports (% of total goods imports)ICT service exports (% of total service exports)Applications
Online service index (0–1, 1=highest presence)Secure Internet servers (per million people)
11 11 2,39176 75 61
3,950 5,890 6,9694.6 4.4 6.2
100 100 94
86 85 76
No NoPrivate Mixed
.. ..M MP PR RB A
2.9 .. 2.57.5 .. 18.2
7.6 10.8 19.41.2 14.9 92.40.0 0.0 10.80.2a 4.6a 40.60.0 3.8a 36.3
26.5 11.9 1.353.0 36.6 284.4
9.7 25.6a 41.6
71 85 99
5.8 11.9 95.595 158 14,580
.. 0.3 9.4
.. 26.5 14.9
.. 1,760.4 17.8
0.9 .. 17.62.6 .. 14.7
.. .. 29.1
0.40 0.31 0.420.1 0.4 18.5
Latin America & Caribbean Upper middle income
CubaUpper
middle-
income
group

67The Little Data Book on Information and Communication Technology 2014
2005 2012 2012
Country data
Economic and social contextPopulation (millions)Urban population (% of total)GNI per capita, World Bank Atlas method ($)GDP growth, 2000–05 and 2005–12 (avg. annual %)Adult literacy rate (% ages 15 and older) Gross primary, secondary, tertiary school enrollment (%)
Sector structureSeparate telecommunications/ICT regulatorStatus of main fixed-line telephone operatorLevel of competition (competition, partial comp., monopoly) International gateway(s) Mobile telephone service Internet serviceForeign ownership (not allowed, restricted, allowed)Reg. treatment of VoIP (banned, closed, no framework, allowed)
Sector efficiency and capacityTelecommunications revenue (% of GDP)Telecommunications investment (% of revenue)
Sector performanceAccess
Fixed-telephone subscriptions (per 100 people)Mobile-cellular telephone subscriptions (per 100 people)Fixed (wired)-broadband subscriptions (per 100 people)Households with a computer (%)Households with Internet access at home (%)Usage
Int’l. voice traffic, total (minutes/subscription/month)Domestic mobile traffic (minutes/subscription/month)Individuals using the Internet (%)Quality
Population covered by a mobile-cellular network (%)Fixed (wired)-broadband subscriptions (% of total Internet)International Internet bandwidth (bit/s per Internet user)Affordability
Fixed-telephone sub-basket ($ a month)Mobile-cellular sub-basket ($ a month)Fixed-broadband sub-basket ($ a month)Trade
ICT goods exports (% of total goods exports)ICT goods imports (% of total goods imports)ICT service exports (% of total service exports)Applications
Online service index (0–1, 1=highest presence)Secure Internet servers (per million people)
0.14 0.15 1,300.. .. 80.. .. 38,412.. .. 1.0.. .. .... .. 93
.. ..
.. ..
.. ..
.. ..
.. ..
.. ..
.. ..
.. .. 2.7
.. .. 17.6
.. .. 43.6
.. .. 122.9
.. .. 26.2
.. .. 77.7
.. .. 75.5
.. .. ..
.. .. 113.6
.. .. 75.4
.. .. 100
.. .. 95.9
.. .. 85,990
.. .. 25.2
.. .. 20.6
.. .. 29.2
.. .. 8.9
.. .. 10.8
.. .. 30.8
.. .. 0.67
.. 187.5 827.6
High income
CuraçaoHigh-
income
group

68 2014 The Little Data Book on Information and Communication Technology
2005 2012 2012
Country data
Economic and social contextPopulation (millions)Urban population (% of total)GNI per capita, World Bank Atlas method ($)GDP growth, 2000–05 and 2005–12 (avg. annual %)Adult literacy rate (% ages 15 and older) Gross primary, secondary, tertiary school enrollment (%)
Sector structureSeparate telecommunications/ICT regulatorStatus of main fixed-line telephone operatorLevel of competition (competition, partial comp., monopoly) International gateway(s) Mobile telephone service Internet serviceForeign ownership (not allowed, restricted, allowed)Reg. treatment of VoIP (banned, closed, no framework, allowed)
Sector efficiency and capacityTelecommunications revenue (% of GDP)Telecommunications investment (% of revenue)
Sector performanceAccess
Fixed-telephone subscriptions (per 100 people)Mobile-cellular telephone subscriptions (per 100 people)Fixed (wired)-broadband subscriptions (per 100 people)Households with a computer (%)Households with Internet access at home (%)Usage
Int’l. voice traffic, total (minutes/subscription/month)Domestic mobile traffic (minutes/subscription/month)Individuals using the Internet (%)Quality
Population covered by a mobile-cellular network (%)Fixed (wired)-broadband subscriptions (% of total Internet)International Internet bandwidth (bit/s per Internet user)Affordability
Fixed-telephone sub-basket ($ a month)Mobile-cellular sub-basket ($ a month)Fixed-broadband sub-basket ($ a month)Trade
ICT goods exports (% of total goods exports)ICT goods imports (% of total goods imports)ICT service exports (% of total service exports)Applications
Online service index (0–1, 1=highest presence)Secure Internet servers (per million people)
1 1 1,30069 71 80
21,490 26,110 38,4123.1 1.5 1.097 99 ..78 78 93
Yes YesPublic Public
.. CP PC CA A
No A
2.9 3.1 2.715.0 11.9 17.6
40.7 33.1 43.675.8 98.4 122.9
3.1 19.2 26.246.0 70.0 77.731.7 62.0 75.5
57.5 40.2 ..174.0 228.7 113.6
32.8 61.0 75.4
100 100 10035.0 96.5 95.9
1,328 69,698 85,990
.. 25.2 25.2
.. 8.4 20.6
.. 21.9 29.2
25.0 3.5 8.910.8 4.1 10.821.1 25.1 30.8
0.60 0.56 0.67175.3 621.4 827.6
High income
CyprusHigh-
income
group

69The Little Data Book on Information and Communication Technology 2014
2005 2012 2012
Country data
Economic and social contextPopulation (millions)Urban population (% of total)GNI per capita, World Bank Atlas method ($)GDP growth, 2000–05 and 2005–12 (avg. annual %)Adult literacy rate (% ages 15 and older) Gross primary, secondary, tertiary school enrollment (%)
Sector structureSeparate telecommunications/ICT regulatorStatus of main fixed-line telephone operatorLevel of competition (competition, partial comp., monopoly) International gateway(s) Mobile telephone service Internet serviceForeign ownership (not allowed, restricted, allowed)Reg. treatment of VoIP (banned, closed, no framework, allowed)
Sector efficiency and capacityTelecommunications revenue (% of GDP)Telecommunications investment (% of revenue)
Sector performanceAccess
Fixed-telephone subscriptions (per 100 people)Mobile-cellular telephone subscriptions (per 100 people)Fixed (wired)-broadband subscriptions (per 100 people)Households with a computer (%)Households with Internet access at home (%)Usage
Int’l. voice traffic, total (minutes/subscription/month)Domestic mobile traffic (minutes/subscription/month)Individuals using the Internet (%)Quality
Population covered by a mobile-cellular network (%)Fixed (wired)-broadband subscriptions (% of total Internet)International Internet bandwidth (bit/s per Internet user)Affordability
Fixed-telephone sub-basket ($ a month)Mobile-cellular sub-basket ($ a month)Fixed-broadband sub-basket ($ a month)Trade
ICT goods exports (% of total goods exports)ICT goods imports (% of total goods imports)ICT service exports (% of total service exports)Applications
Online service index (0–1, 1=highest presence)Secure Internet servers (per million people)
10 11 1,30074 73 80
11,920 18,130 38,4123.9 1.6 1.0
.. .. ..83 88 93
Yes YesPrivate Private
C ..C PC CA RA A
3.8 1.9 2.711.7 20.8 17.6
31.4 19.9 43.6115.1 126.8 122.9
6.9 16.4 26.230.0 75.0a 77.719.1 71.0 75.5
7.4 9.7 ..50.3 97.8 113.6
35.3 75.0 75.4
100 100 10030.1 100.0 95.9
13,620 100,062 85,990
.. 29.1 25.2
.. 27.7 20.6
.. 22.6 29.2
11.1 14.5 8.911.2 14.7 10.824.4 36.1 30.8
0.67 0.54 0.6741.6 559.3 827.6
High income
Czech RepublicHigh-
income
group

70 2014 The Little Data Book on Information and Communication Technology
2005 2012 2012
Country data
Economic and social contextPopulation (millions)Urban population (% of total)GNI per capita, World Bank Atlas method ($)GDP growth, 2000–05 and 2005–12 (avg. annual %)Adult literacy rate (% ages 15 and older) Gross primary, secondary, tertiary school enrollment (%)
Sector structureSeparate telecommunications/ICT regulatorStatus of main fixed-line telephone operatorLevel of competition (competition, partial comp., monopoly) International gateway(s) Mobile telephone service Internet serviceForeign ownership (not allowed, restricted, allowed)Reg. treatment of VoIP (banned, closed, no framework, allowed)
Sector efficiency and capacityTelecommunications revenue (% of GDP)Telecommunications investment (% of revenue)
Sector performanceAccess
Fixed-telephone subscriptions (per 100 people)Mobile-cellular telephone subscriptions (per 100 people)Fixed (wired)-broadband subscriptions (per 100 people)Households with a computer (%)Households with Internet access at home (%)Usage
Int’l. voice traffic, total (minutes/subscription/month)Domestic mobile traffic (minutes/subscription/month)Individuals using the Internet (%)Quality
Population covered by a mobile-cellular network (%)Fixed (wired)-broadband subscriptions (% of total Internet)International Internet bandwidth (bit/s per Internet user)Affordability
Fixed-telephone sub-basket ($ a month)Mobile-cellular sub-basket ($ a month)Fixed-broadband sub-basket ($ a month)Trade
ICT goods exports (% of total goods exports)ICT goods imports (% of total goods imports)ICT service exports (% of total service exports)Applications
Online service index (0–1, 1=highest presence)Secure Internet servers (per million people)
5 6 1,30086 87 80
48,590 59,870 38,4121.2 –0.4 1.0
.. .. ..103 100 93
Yes YesPrivate Private
C C
P P
C C
A AA A
2.6 2.0 2.717.2 17.2 17.6
61.8 43.4 43.6100.6 117.6 122.9
24.8 38.8 26.284.0 92.2a 77.774.9 92.0 75.5
.. 18.2 ..99.1 146.1 113.6
82.7 93.0 75.4
.. .. 10074.3 96.3 95.9
42,041 174,801 85,990
.. 30.5 25.2
.. 10.3 20.6
.. 46.4 29.2
7.1 3.5 8.912.4 8.2 10.8
.. .. 30.8
0.91 0.86 0.67411.3 2,104.5 827.6
High income
DenmarkHigh-
income
group

71The Little Data Book on Information and Communication Technology 2014
2005 2012 2012
Country data
Economic and social contextPopulation (millions)Urban population (% of total)GNI per capita, World Bank Atlas method ($)GDP growth, 2000–05 and 2005–12 (avg. annual %)Adult literacy rate (% ages 15 and older) Gross primary, secondary, tertiary school enrollment (%)
Sector structureSeparate telecommunications/ICT regulatorStatus of main fixed-line telephone operatorLevel of competition (competition, partial comp., monopoly) International gateway(s) Mobile telephone service Internet serviceForeign ownership (not allowed, restricted, allowed)Reg. treatment of VoIP (banned, closed, no framework, allowed)
Sector efficiency and capacityTelecommunications revenue (% of GDP)Telecommunications investment (% of revenue)
Sector performanceAccess
Fixed-telephone subscriptions (per 100 people)Mobile-cellular telephone subscriptions (per 100 people)Fixed (wired)-broadband subscriptions (per 100 people)Households with a computer (%)Households with Internet access at home (%)Usage
Int’l. voice traffic, total (minutes/subscription/month)Domestic mobile traffic (minutes/subscription/month)Individuals using the Internet (%)Quality
Population covered by a mobile-cellular network (%)Fixed (wired)-broadband subscriptions (% of total Internet)International Internet bandwidth (bit/s per Internet user)Affordability
Fixed-telephone sub-basket ($ a month)Mobile-cellular sub-basket ($ a month)Fixed-broadband sub-basket ($ a month)Trade
ICT goods exports (% of total goods exports)ICT goods imports (% of total goods imports)ICT service exports (% of total service exports)Applications
Online service index (0–1, 1=highest presence)Secure Internet servers (per million people)
0.78 0.86 2,50777 77 39
1,030 .. 1,8933.0 .. 6.0
.. .. 71
25 37 64
No NoPublic Public
.. M
.. M
M M
No NoB C
4.8 .. 2.5
25.6 14.3 20.5
1.4 2.3 5.45.7 24.7 83.10.0 1.7 1.46.8 15.5a 15.00.6 5.1a 12.4
.. 124.9 6.5
50.2 32.0 ..1.0 8.3a 18.7
75 95 86
1.2 79.6 58.2
6,076 11,960 8,076
.. 6.9 4.9
.. 13.2 10.5
.. 31.6 20.6
.. 0.1 4.6
.. 5.4 7.25.1 .. 47.1
0.23 0.20 0.321.3 4.6 4.4
Middle East & North Africa Lower middle income
DjiboutiLower
middle-
income
group
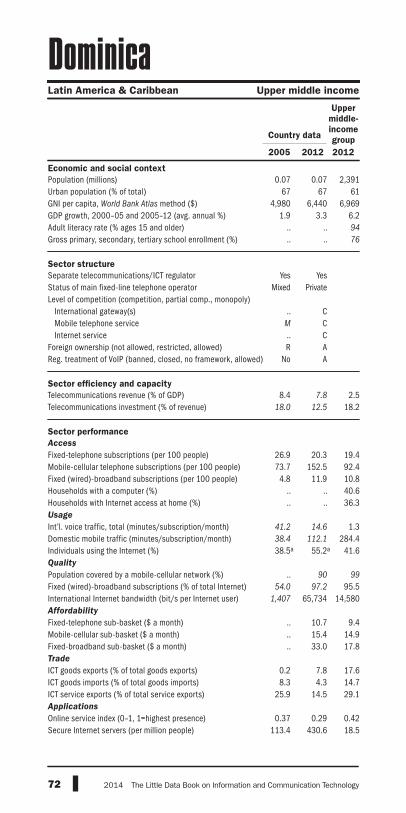
72 2014 The Little Data Book on Information and Communication Technology
2005 2012 2012
Upper
middle-
income
groupCountry data
Economic and social contextPopulation (millions)Urban population (% of total)GNI per capita, World Bank Atlas method ($)GDP growth, 2000–05 and 2005–12 (avg. annual %)Adult literacy rate (% ages 15 and older) Gross primary, secondary, tertiary school enrollment (%)
Sector structureSeparate telecommunications/ICT regulatorStatus of main fixed-line telephone operatorLevel of competition (competition, partial comp., monopoly) International gateway(s) Mobile telephone service Internet serviceForeign ownership (not allowed, restricted, allowed)Reg. treatment of VoIP (banned, closed, no framework, allowed)
Sector efficiency and capacityTelecommunications revenue (% of GDP)Telecommunications investment (% of revenue)
Sector performanceAccess
Fixed-telephone subscriptions (per 100 people)Mobile-cellular telephone subscriptions (per 100 people)Fixed (wired)-broadband subscriptions (per 100 people)Households with a computer (%)Households with Internet access at home (%)Usage
Int’l. voice traffic, total (minutes/subscription/month)Domestic mobile traffic (minutes/subscription/month)Individuals using the Internet (%)Quality
Population covered by a mobile-cellular network (%)Fixed (wired)-broadband subscriptions (% of total Internet)International Internet bandwidth (bit/s per Internet user)Affordability
Fixed-telephone sub-basket ($ a month)Mobile-cellular sub-basket ($ a month)Fixed-broadband sub-basket ($ a month)Trade
ICT goods exports (% of total goods exports)ICT goods imports (% of total goods imports)ICT service exports (% of total service exports)Applications
Online service index (0–1, 1=highest presence)Secure Internet servers (per million people)
0.07 0.07 2,39167 67 61
4,980 6,440 6,9691.9 3.3 6.2
.. .. 94
.. .. 76
Yes YesMixed Private
.. CM C.. CR A
No A
8.4 7.8 2.518.0 12.5 18.2
26.9 20.3 19.473.7 152.5 92.4
4.8 11.9 10.8.. .. 40.6.. .. 36.3
41.2 14.6 1.338.4 112.1 284.438.5a 55.2a 41.6
.. 90 99
54.0 97.2 95.51,407 65,734 14,580
.. 10.7 9.4
.. 15.4 14.9
.. 33.0 17.8
0.2 7.8 17.68.3 4.3 14.7
25.9 14.5 29.1
0.37 0.29 0.42113.4 430.6 18.5
Latin America & Caribbean Upper middle income
Dominica

73The Little Data Book on Information and Communication Technology 2014
2005 2012 2012
Country data
Economic and social contextPopulation (millions)Urban population (% of total)GNI per capita, World Bank Atlas method ($)GDP growth, 2000–05 and 2005–12 (avg. annual %)Adult literacy rate (% ages 15 and older) Gross primary, secondary, tertiary school enrollment (%)
Sector structureSeparate telecommunications/ICT regulatorStatus of main fixed-line telephone operatorLevel of competition (competition, partial comp., monopoly) International gateway(s) Mobile telephone service Internet serviceForeign ownership (not allowed, restricted, allowed)Reg. treatment of VoIP (banned, closed, no framework, allowed)
Sector efficiency and capacityTelecommunications revenue (% of GDP)Telecommunications investment (% of revenue)
Sector performanceAccess
Fixed-telephone subscriptions (per 100 people)Mobile-cellular telephone subscriptions (per 100 people)Fixed (wired)-broadband subscriptions (per 100 people)Households with a computer (%)Households with Internet access at home (%)Usage
Int’l. voice traffic, total (minutes/subscription/month)Domestic mobile traffic (minutes/subscription/month)Individuals using the Internet (%)Quality
Population covered by a mobile-cellular network (%)Fixed (wired)-broadband subscriptions (% of total Internet)International Internet bandwidth (bit/s per Internet user)Affordability
Fixed-telephone sub-basket ($ a month)Mobile-cellular sub-basket ($ a month)Fixed-broadband sub-basket ($ a month)Trade
ICT goods exports (% of total goods exports)ICT goods imports (% of total goods imports)ICT service exports (% of total service exports)Applications
Online service index (0–1, 1=highest presence)Secure Internet servers (per million people)
9 10 2,39166 70 61
2,880 5,470 6,9693.1 6.0 6.288 90 94
.. .. 76
Yes YesPrivate Private
C CC CC CA A
No A
0.4 3.3 2.5192.0 16.1 18.2
9.6 10.4 19.438.8 86.9 92.4
0.6 4.3 10.88.7 19.8a 40.63.1 13.7a 36.3
.. 12.8 1.3
.. 26.1 284.411.5 45.0a 41.6
.. 95 99
45.1 90.4 95.52,889 14,874 14,580
.. 16.6 9.4
.. 14.9 14.9
.. 23.3 17.8
7.2 0.9 17.64.2 3.2 14.72.8 4.3 29.1
0.49 0.54 0.425.6 20.4 18.5
Latin America & Caribbean Upper middle income
Dominican RepublicUpper
middle-
income
group
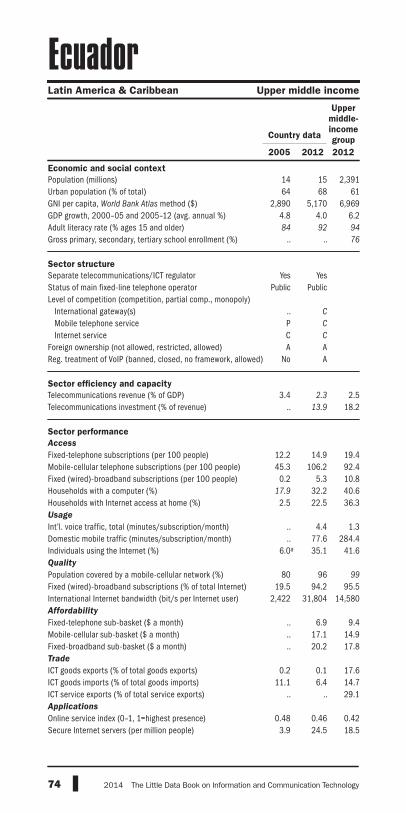
74 2014 The Little Data Book on Information and Communication Technology
2005 2012 2012
Upper
middle-
income
groupCountry data
Economic and social contextPopulation (millions)Urban population (% of total)GNI per capita, World Bank Atlas method ($)GDP growth, 2000–05 and 2005–12 (avg. annual %)Adult literacy rate (% ages 15 and older) Gross primary, secondary, tertiary school enrollment (%)
Sector structureSeparate telecommunications/ICT regulatorStatus of main fixed-line telephone operatorLevel of competition (competition, partial comp., monopoly) International gateway(s) Mobile telephone service Internet serviceForeign ownership (not allowed, restricted, allowed)Reg. treatment of VoIP (banned, closed, no framework, allowed)
Sector efficiency and capacityTelecommunications revenue (% of GDP)Telecommunications investment (% of revenue)
Sector performanceAccess
Fixed-telephone subscriptions (per 100 people)Mobile-cellular telephone subscriptions (per 100 people)Fixed (wired)-broadband subscriptions (per 100 people)Households with a computer (%)Households with Internet access at home (%)Usage
Int’l. voice traffic, total (minutes/subscription/month)Domestic mobile traffic (minutes/subscription/month)Individuals using the Internet (%)Quality
Population covered by a mobile-cellular network (%)Fixed (wired)-broadband subscriptions (% of total Internet)International Internet bandwidth (bit/s per Internet user)Affordability
Fixed-telephone sub-basket ($ a month)Mobile-cellular sub-basket ($ a month)Fixed-broadband sub-basket ($ a month)Trade
ICT goods exports (% of total goods exports)ICT goods imports (% of total goods imports)ICT service exports (% of total service exports)Applications
Online service index (0–1, 1=highest presence)Secure Internet servers (per million people)
14 15 2,39164 68 61
2,890 5,170 6,9694.8 4.0 6.284 92 94
.. .. 76
Yes YesPublic Public
.. C
P C
C C
A ANo A
3.4 2.3 2.5.. 13.9 18.2
12.2 14.9 19.445.3 106.2 92.4
0.2 5.3 10.817.9 32.2 40.6
2.5 22.5 36.3
.. 4.4 1.3
.. 77.6 284.46.0a 35.1 41.6
80 96 99
19.5 94.2 95.52,422 31,804 14,580
.. 6.9 9.4
.. 17.1 14.9
.. 20.2 17.8
0.2 0.1 17.611.1 6.4 14.7
.. .. 29.1
0.48 0.46 0.423.9 24.5 18.5
Latin America & Caribbean Upper middle income
Ecuador
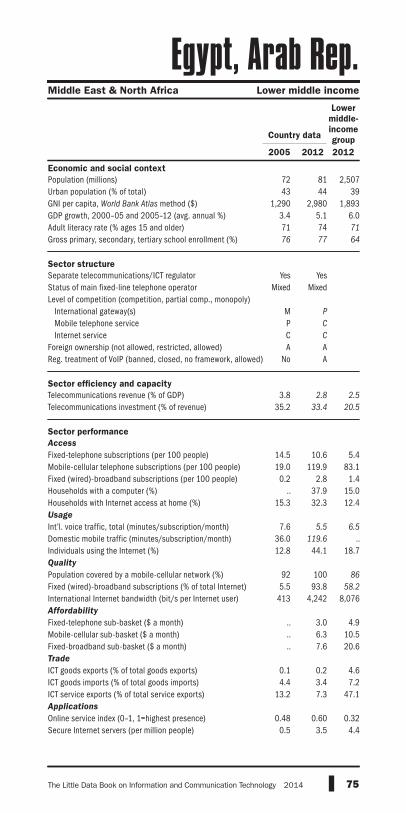
75The Little Data Book on Information and Communication Technology 2014
2005 2012 2012
Country data
Economic and social contextPopulation (millions)Urban population (% of total)GNI per capita, World Bank Atlas method ($)GDP growth, 2000–05 and 2005–12 (avg. annual %)Adult literacy rate (% ages 15 and older) Gross primary, secondary, tertiary school enrollment (%)
Sector structureSeparate telecommunications/ICT regulatorStatus of main fixed-line telephone operatorLevel of competition (competition, partial comp., monopoly) International gateway(s) Mobile telephone service Internet serviceForeign ownership (not allowed, restricted, allowed)Reg. treatment of VoIP (banned, closed, no framework, allowed)
Sector efficiency and capacityTelecommunications revenue (% of GDP)Telecommunications investment (% of revenue)
Sector performanceAccess
Fixed-telephone subscriptions (per 100 people)Mobile-cellular telephone subscriptions (per 100 people)Fixed (wired)-broadband subscriptions (per 100 people)Households with a computer (%)Households with Internet access at home (%)Usage
Int’l. voice traffic, total (minutes/subscription/month)Domestic mobile traffic (minutes/subscription/month)Individuals using the Internet (%)Quality
Population covered by a mobile-cellular network (%)Fixed (wired)-broadband subscriptions (% of total Internet)International Internet bandwidth (bit/s per Internet user)Affordability
Fixed-telephone sub-basket ($ a month)Mobile-cellular sub-basket ($ a month)Fixed-broadband sub-basket ($ a month)Trade
ICT goods exports (% of total goods exports)ICT goods imports (% of total goods imports)ICT service exports (% of total service exports)Applications
Online service index (0–1, 1=highest presence)Secure Internet servers (per million people)
72 81 2,50743 44 39
1,290 2,980 1,8933.4 5.1 6.071 74 71
76 77 64
Yes YesMixed Mixed
M P
P C
C C
A ANo A
3.8 2.8 2.5
35.2 33.4 20.5
14.5 10.6 5.419.0 119.9 83.1
0.2 2.8 1.4.. 37.9 15.0
15.3 32.3 12.4
7.6 5.5 6.5
36.0 119.6 ..12.8 44.1 18.7
92 100 86
5.5 93.8 58.2
413 4,242 8,076
.. 3.0 4.9
.. 6.3 10.5
.. 7.6 20.6
0.1 0.2 4.64.4 3.4 7.2
13.2 7.3 47.1
0.48 0.60 0.320.5 3.5 4.4
Middle East & North Africa Lower middle income
Egypt, Arab Rep.Lower
middle-
income
group

76 2014 The Little Data Book on Information and Communication Technology
2005 2012 2012
Country data
Economic and social contextPopulation (millions)Urban population (% of total)GNI per capita, World Bank Atlas method ($)GDP growth, 2000–05 and 2005–12 (avg. annual %)Adult literacy rate (% ages 15 and older) Gross primary, secondary, tertiary school enrollment (%)
Sector structureSeparate telecommunications/ICT regulatorStatus of main fixed-line telephone operatorLevel of competition (competition, partial comp., monopoly) International gateway(s) Mobile telephone service Internet serviceForeign ownership (not allowed, restricted, allowed)Reg. treatment of VoIP (banned, closed, no framework, allowed)
Sector efficiency and capacityTelecommunications revenue (% of GDP)Telecommunications investment (% of revenue)
Sector performanceAccess
Fixed-telephone subscriptions (per 100 people)Mobile-cellular telephone subscriptions (per 100 people)Fixed (wired)-broadband subscriptions (per 100 people)Households with a computer (%)Households with Internet access at home (%)Usage
Int’l. voice traffic, total (minutes/subscription/month)Domestic mobile traffic (minutes/subscription/month)Individuals using the Internet (%)Quality
Population covered by a mobile-cellular network (%)Fixed (wired)-broadband subscriptions (% of total Internet)International Internet bandwidth (bit/s per Internet user)Affordability
Fixed-telephone sub-basket ($ a month)Mobile-cellular sub-basket ($ a month)Fixed-broadband sub-basket ($ a month)Trade
ICT goods exports (% of total goods exports)ICT goods imports (% of total goods imports)ICT service exports (% of total service exports)Applications
Online service index (0–1, 1=highest presence)Secure Internet servers (per million people)
6 6 2,50762 65 39
2,810 3,590 1,8932.3 1.2 6.084 84 71
72 71 64
Yes YesMixed Mixed
.. CC CC CA A
No A
4.1 3.8 2.5
13.6 17.7 20.5
16.0 16.8 5.439.7 137.3 83.1
0.7 3.8 1.47.4 15.3a 15.02.1 15.0a 12.4
.. 27.5 6.5
33.2 86.9 ..4.2a 25.5a 18.7
95 .. 86
33.2 99.3 58.2
608 6,850 8,076
.. 6.9 4.9
.. 14.7 10.5
.. 20.3 20.6
0.2 0.4 4.63.6 5.0 7.28.4 11.5 47.1
0.50 0.67 0.326.1 18.8 4.4
Latin America & Caribbean Lower middle income
El SalvadorLower
middle-
income
group

77The Little Data Book on Information and Communication Technology 2014
2005 2012 2012
Country data
Economic and social contextPopulation (millions)Urban population (% of total)GNI per capita, World Bank Atlas method ($)GDP growth, 2000–05 and 2005–12 (avg. annual %)Adult literacy rate (% ages 15 and older) Gross primary, secondary, tertiary school enrollment (%)
Sector structureSeparate telecommunications/ICT regulatorStatus of main fixed-line telephone operatorLevel of competition (competition, partial comp., monopoly) International gateway(s) Mobile telephone service Internet serviceForeign ownership (not allowed, restricted, allowed)Reg. treatment of VoIP (banned, closed, no framework, allowed)
Sector efficiency and capacityTelecommunications revenue (% of GDP)Telecommunications investment (% of revenue)
Sector performanceAccess
Fixed-telephone subscriptions (per 100 people)Mobile-cellular telephone subscriptions (per 100 people)Fixed (wired)-broadband subscriptions (per 100 people)Households with a computer (%)Households with Internet access at home (%)Usage
Int’l. voice traffic, total (minutes/subscription/month)Domestic mobile traffic (minutes/subscription/month)Individuals using the Internet (%)Quality
Population covered by a mobile-cellular network (%)Fixed (wired)-broadband subscriptions (% of total Internet)International Internet bandwidth (bit/s per Internet user)Affordability
Fixed-telephone sub-basket ($ a month)Mobile-cellular sub-basket ($ a month)Fixed-broadband sub-basket ($ a month)Trade
ICT goods exports (% of total goods exports)ICT goods imports (% of total goods imports)ICT service exports (% of total service exports)Applications
Online service index (0–1, 1=highest presence)Secure Internet servers (per million people)
0.60 0.74 1,30039 40 80
5,250 13,560 38,41226.0 3.1 1.0
88 94 .... .. 93
No YesMixed Mixed
.. P
.. CM C
No RB No
.. .. 2.7
.. .. 17.6
1.7 2.0 43.616.1 68.1 122.9
0.0 0.2 26.2.. .. 77.7.. .. 75.5
.. .. ..
.. .. 113.6
1.1 13.9a 75.4
.. .. 10015.0 .. 95.9
2,421 2,123 85,990
.. .. 25.2
.. .. 20.6
.. .. 29.2
.. .. 8.9
.. .. 10.8
.. .. 30.8
0.29 0.10 0.67.. 1.3 827.6
High income
Equatorial GuineaHigh-
income
group

78 2014 The Little Data Book on Information and Communication Technology
2005 2012 2012
Country data
Economic and social contextPopulation (millions)Urban population (% of total)GNI per capita, World Bank Atlas method ($)GDP growth, 2000–05 and 2005–12 (avg. annual %)Adult literacy rate (% ages 15 and older) Gross primary, secondary, tertiary school enrollment (%)
Sector structureSeparate telecommunications/ICT regulatorStatus of main fixed-line telephone operatorLevel of competition (competition, partial comp., monopoly) International gateway(s) Mobile telephone service Internet serviceForeign ownership (not allowed, restricted, allowed)Reg. treatment of VoIP (banned, closed, no framework, allowed)
Sector efficiency and capacityTelecommunications revenue (% of GDP)Telecommunications investment (% of revenue)
Sector performanceAccess
Fixed-telephone subscriptions (per 100 people)Mobile-cellular telephone subscriptions (per 100 people)Fixed (wired)-broadband subscriptions (per 100 people)Households with a computer (%)Households with Internet access at home (%)Usage
Int’l. voice traffic, total (minutes/subscription/month)Domestic mobile traffic (minutes/subscription/month)Individuals using the Internet (%)Quality
Population covered by a mobile-cellular network (%)Fixed (wired)-broadband subscriptions (% of total Internet)International Internet bandwidth (bit/s per Internet user)Affordability
Fixed-telephone sub-basket ($ a month)Mobile-cellular sub-basket ($ a month)Fixed-broadband sub-basket ($ a month)Trade
ICT goods exports (% of total goods exports)ICT goods imports (% of total goods imports)ICT service exports (% of total service exports)Applications
Online service index (0–1, 1=highest presence)Secure Internet servers (per million people)
5 6 84619 22 28
230 450 5901.9 1.2 5.953 69 61
30 25 60
Yes YesPublic Public
M M
P P
P P
.. ..B B
3.1 3.1 5.0
57.6 70.0 ..
0.8 1.0 1.00.8 5.0 47.20.0 0.0 0.20.2 1.5a 4.20.2a 1.1a 3.4
.. 76.5 ..81.4 88.7 70.1
0.4a 0.8a 6.2
2 85 ..0.0 13.0 30.9
562 1,284 9,141
.. 4.1 8.9
.. 11.8 11.9
.. 1,596.5 46.9
0.2 .. ..3.0 .. ..
.. .. ..
0.20 0.21 0.20.. .. 1.1
Sub-Saharan Africa Low income
EritreaLow-
income
group

79The Little Data Book on Information and Communication Technology 2014
2005 2012 2012
Country data
Economic and social contextPopulation (millions)Urban population (% of total)GNI per capita, World Bank Atlas method ($)GDP growth, 2000–05 and 2005–12 (avg. annual %)Adult literacy rate (% ages 15 and older) Gross primary, secondary, tertiary school enrollment (%)
Sector structureSeparate telecommunications/ICT regulatorStatus of main fixed-line telephone operatorLevel of competition (competition, partial comp., monopoly) International gateway(s) Mobile telephone service Internet serviceForeign ownership (not allowed, restricted, allowed)Reg. treatment of VoIP (banned, closed, no framework, allowed)
Sector efficiency and capacityTelecommunications revenue (% of GDP)Telecommunications investment (% of revenue)
Sector performanceAccess
Fixed-telephone subscriptions (per 100 people)Mobile-cellular telephone subscriptions (per 100 people)Fixed (wired)-broadband subscriptions (per 100 people)Households with a computer (%)Households with Internet access at home (%)Usage
Int’l. voice traffic, total (minutes/subscription/month)Domestic mobile traffic (minutes/subscription/month)Individuals using the Internet (%)Quality
Population covered by a mobile-cellular network (%)Fixed (wired)-broadband subscriptions (% of total Internet)International Internet bandwidth (bit/s per Internet user)Affordability
Fixed-telephone sub-basket ($ a month)Mobile-cellular sub-basket ($ a month)Fixed-broadband sub-basket ($ a month)Trade
ICT goods exports (% of total goods exports)ICT goods imports (% of total goods imports)ICT service exports (% of total service exports)Applications
Online service index (0–1, 1=highest presence)Secure Internet servers (per million people)
1 1 1,30069 70 80
9,690 16,270 38,4127.1 0.3 1.0
100 100 ..95 96 93
Yes YesMixed Mixed
C ..C C
C C
A AA A
5.5 2.6 2.78.2 26.0 17.6
33.4 34.7 43.6109.1 160.4 122.9
13.5 25.5 26.243.0 76.0 77.738.7 75.0 75.5
6.9 9.0 ..75.0 115.0 113.6
61.5 79.0 75.4
99 100 10091.0 95.6 95.9
5,895 26,478 85,990
.. 12.8 25.2
.. 24.6 20.6
.. 22.2 29.2
17.0 10.9 8.913.0 10.7 10.817.2 26.2 30.8
0.76 0.82 0.67101.4 749.2 827.6
High income
EstoniaHigh-
income
group

80 2014 The Little Data Book on Information and Communication Technology
2005 2012 2012
Country data
Economic and social contextPopulation (millions)Urban population (% of total)GNI per capita, World Bank Atlas method ($)GDP growth, 2000–05 and 2005–12 (avg. annual %)Adult literacy rate (% ages 15 and older) Gross primary, secondary, tertiary school enrollment (%)
Sector structureSeparate telecommunications/ICT regulatorStatus of main fixed-line telephone operatorLevel of competition (competition, partial comp., monopoly) International gateway(s) Mobile telephone service Internet serviceForeign ownership (not allowed, restricted, allowed)Reg. treatment of VoIP (banned, closed, no framework, allowed)
Sector efficiency and capacityTelecommunications revenue (% of GDP)Telecommunications investment (% of revenue)
Sector performanceAccess
Fixed-telephone subscriptions (per 100 people)Mobile-cellular telephone subscriptions (per 100 people)Fixed (wired)-broadband subscriptions (per 100 people)Households with a computer (%)Households with Internet access at home (%)Usage
Int’l. voice traffic, total (minutes/subscription/month)Domestic mobile traffic (minutes/subscription/month)Individuals using the Internet (%)Quality
Population covered by a mobile-cellular network (%)Fixed (wired)-broadband subscriptions (% of total Internet)International Internet bandwidth (bit/s per Internet user)Affordability
Fixed-telephone sub-basket ($ a month)Mobile-cellular sub-basket ($ a month)Fixed-broadband sub-basket ($ a month)Trade
ICT goods exports (% of total goods exports)ICT goods imports (% of total goods imports)ICT service exports (% of total service exports)Applications
Online service index (0–1, 1=highest presence)Secure Internet servers (per million people)
76 92 84616 17 28
160 380 5905.6 9.7 5.930 .. 61
43 .. 60
Yes NoPublic Public
M MM M
M MNo NoB B
2.2 1.7 5.0
82.1 36.2 ..
0.8 0.9 1.00.5 22.4 47.20.0 0.0 0.20.2 2.1a 4.20.0a 1.9a 3.4
13.5 3.1 ..90.9 55.8 70.1
0.2 1.5a 6.2
10 73 ..0.3 3.2 30.9
347 4,779 9,141
.. 1.0 8.9
.. 3.8 11.9
.. 23.7 46.9
0.0 0.2 ..7.0 3.5 ..
10.9 6.5 ..
0.19 0.47 0.200.0 0.2 1.1
Sub-Saharan Africa Low income
EthiopiaLow-
income
group

81The Little Data Book on Information and Communication Technology 2014
2005 2012 2012
Country data
Economic and social contextPopulation (millions)Urban population (% of total)GNI per capita, World Bank Atlas method ($)GDP growth, 2000–05 and 2005–12 (avg. annual %)Adult literacy rate (% ages 15 and older) Gross primary, secondary, tertiary school enrollment (%)
Sector structureSeparate telecommunications/ICT regulatorStatus of main fixed-line telephone operatorLevel of competition (competition, partial comp., monopoly) International gateway(s) Mobile telephone service Internet serviceForeign ownership (not allowed, restricted, allowed)Reg. treatment of VoIP (banned, closed, no framework, allowed)
Sector efficiency and capacityTelecommunications revenue (% of GDP)Telecommunications investment (% of revenue)
Sector performanceAccess
Fixed-telephone subscriptions (per 100 people)Mobile-cellular telephone subscriptions (per 100 people)Fixed (wired)-broadband subscriptions (per 100 people)Households with a computer (%)Households with Internet access at home (%)Usage
Int’l. voice traffic, total (minutes/subscription/month)Domestic mobile traffic (minutes/subscription/month)Individuals using the Internet (%)Quality
Population covered by a mobile-cellular network (%)Fixed (wired)-broadband subscriptions (% of total Internet)International Internet bandwidth (bit/s per Internet user)Affordability
Fixed-telephone sub-basket ($ a month)Mobile-cellular sub-basket ($ a month)Fixed-broadband sub-basket ($ a month)Trade
ICT goods exports (% of total goods exports)ICT goods imports (% of total goods imports)ICT service exports (% of total service exports)Applications
Online service index (0–1, 1=highest presence)Secure Internet servers (per million people)
0.05 0.05 1,30040 41 80
.. .. 38,412
.. .. 1.0
.. .. ..
.. .. 93
.. ..
.. ..
.. ..
.. ..
.. ..
.. ..
.. ..
3.5 .. 2.7.. .. 17.6
48.5 37.7 43.685.5 118.6 122.911.9 33.0 26.2
.. .. 77.7
.. .. 75.5
.. .. ..73.1 122.4 113.6
67.9a 85.3a 75.4
100 100 10049.2 100.0 95.9
4,793 .. 85,990
.. .. 25.2
.. .. 20.6
.. .. 29.2
0.0 0.0 8.94.3 4.3 10.8
30.1 25.8 30.8
.. .. 0.6761.5 1,632.7 827.6
High income
Faeroe IslandsHigh-
income
group

82 2014 The Little Data Book on Information and Communication Technology
2005 2012 2012
Country data
Economic and social contextPopulation (millions)Urban population (% of total)GNI per capita, World Bank Atlas method ($)GDP growth, 2000–05 and 2005–12 (avg. annual %)Adult literacy rate (% ages 15 and older) Gross primary, secondary, tertiary school enrollment (%)
Sector structureSeparate telecommunications/ICT regulatorStatus of main fixed-line telephone operatorLevel of competition (competition, partial comp., monopoly) International gateway(s) Mobile telephone service Internet serviceForeign ownership (not allowed, restricted, allowed)Reg. treatment of VoIP (banned, closed, no framework, allowed)
Sector efficiency and capacityTelecommunications revenue (% of GDP)Telecommunications investment (% of revenue)
Sector performanceAccess
Fixed-telephone subscriptions (per 100 people)Mobile-cellular telephone subscriptions (per 100 people)Fixed (wired)-broadband subscriptions (per 100 people)Households with a computer (%)Households with Internet access at home (%)Usage
Int’l. voice traffic, total (minutes/subscription/month)Domestic mobile traffic (minutes/subscription/month)Individuals using the Internet (%)Quality
Population covered by a mobile-cellular network (%)Fixed (wired)-broadband subscriptions (% of total Internet)International Internet bandwidth (bit/s per Internet user)Affordability
Fixed-telephone sub-basket ($ a month)Mobile-cellular sub-basket ($ a month)Fixed-broadband sub-basket ($ a month)Trade
ICT goods exports (% of total goods exports)ICT goods imports (% of total goods imports)ICT service exports (% of total service exports)Applications
Online service index (0–1, 1=highest presence)Secure Internet servers (per million people)
0.82 0.87 2,39150 53 61
3,590 4,110 6,9692.6 0.4 6.2
.. .. 94
78 88 76
No YesMixed Mixed
.. CM C.. C.. AB A
4.7 .. 2.520.2 .. 18.2
13.7 10.1 19.424.9 98.2 92.4
0.9 1.5 10.813.0 31.7a 40.6
8.0 24.4a 36.3
.. .. 1.3
.. .. 284.48.5 33.7a 41.6
60 .. 99
52.6 59.6 95.51,036 9,232 14,580
.. 6.9 9.4
.. 21.1 14.9
.. 19.5 17.8
0.3 0.8 17.64.7 4.2 14.75.4 4.3 29.1
0.42 0.36 0.428.5 30.6 18.5
East Asia & Pacific Upper middle income
FijiUpper
middle-
income
group

83The Little Data Book on Information and Communication Technology 2014
2005 2012 2012
Country data
Economic and social contextPopulation (millions)Urban population (% of total)GNI per capita, World Bank Atlas method ($)GDP growth, 2000–05 and 2005–12 (avg. annual %)Adult literacy rate (% ages 15 and older) Gross primary, secondary, tertiary school enrollment (%)
Sector structureSeparate telecommunications/ICT regulatorStatus of main fixed-line telephone operatorLevel of competition (competition, partial comp., monopoly) International gateway(s) Mobile telephone service Internet serviceForeign ownership (not allowed, restricted, allowed)Reg. treatment of VoIP (banned, closed, no framework, allowed)
Sector efficiency and capacityTelecommunications revenue (% of GDP)Telecommunications investment (% of revenue)
Sector performanceAccess
Fixed-telephone subscriptions (per 100 people)Mobile-cellular telephone subscriptions (per 100 people)Fixed (wired)-broadband subscriptions (per 100 people)Households with a computer (%)Households with Internet access at home (%)Usage
Int’l. voice traffic, total (minutes/subscription/month)Domestic mobile traffic (minutes/subscription/month)Individuals using the Internet (%)Quality
Population covered by a mobile-cellular network (%)Fixed (wired)-broadband subscriptions (% of total Internet)International Internet bandwidth (bit/s per Internet user)Affordability
Fixed-telephone sub-basket ($ a month)Mobile-cellular sub-basket ($ a month)Fixed-broadband sub-basket ($ a month)Trade
ICT goods exports (% of total goods exports)ICT goods imports (% of total goods imports)ICT service exports (% of total service exports)Applications
Online service index (0–1, 1=highest presence)Secure Internet servers (per million people)
5 5 1,30083 84 80
38,550 46,490 38,4122.6 0.4 1.0
.. .. ..101 101 93
Yes YesMixed Mixed
C CP CC CA AA A
2.7 2.0 2.79.8 15.0 17.6
40.4 16.4 43.6100.5 172.3 122.9
22.4 30.3 26.263.9 88.0 77.754.1 87.0 75.5
.. .. ..171.5 177.5 113.6
74.5 91.0 75.4
99 100 10057.1 .. 95.9
5,788 159,294 85,990
.. 31.4 25.2
.. 13.8 20.6
.. 37.4 29.2
20.3 4.0 8.914.3 6.9 10.832.3 45.7 30.8
0.75 0.88 0.67308.2 1,554.7 827.6
High income
FinlandHigh-
income
group

84 2014 The Little Data Book on Information and Communication Technology
2005 2012 2012
Country data
Economic and social contextPopulation (millions)Urban population (% of total)GNI per capita, World Bank Atlas method ($)GDP growth, 2000–05 and 2005–12 (avg. annual %)Adult literacy rate (% ages 15 and older) Gross primary, secondary, tertiary school enrollment (%)
Sector structureSeparate telecommunications/ICT regulatorStatus of main fixed-line telephone operatorLevel of competition (competition, partial comp., monopoly) International gateway(s) Mobile telephone service Internet serviceForeign ownership (not allowed, restricted, allowed)Reg. treatment of VoIP (banned, closed, no framework, allowed)
Sector efficiency and capacityTelecommunications revenue (% of GDP)Telecommunications investment (% of revenue)
Sector performanceAccess
Fixed-telephone subscriptions (per 100 people)Mobile-cellular telephone subscriptions (per 100 people)Fixed (wired)-broadband subscriptions (per 100 people)Households with a computer (%)Households with Internet access at home (%)Usage
Int’l. voice traffic, total (minutes/subscription/month)Domestic mobile traffic (minutes/subscription/month)Individuals using the Internet (%)Quality
Population covered by a mobile-cellular network (%)Fixed (wired)-broadband subscriptions (% of total Internet)International Internet bandwidth (bit/s per Internet user)Affordability
Fixed-telephone sub-basket ($ a month)Mobile-cellular sub-basket ($ a month)Fixed-broadband sub-basket ($ a month)Trade
ICT goods exports (% of total goods exports)ICT goods imports (% of total goods imports)ICT service exports (% of total service exports)Applications
Online service index (0–1, 1=highest presence)Secure Internet servers (per million people)
63 66 1,30082 86 80
34,850 41,750 38,4121.5 0.5 1.0
.. .. ..93 94 93
Yes YesMixed Mixed
C CC CC CA RA A
2.4 2.1 2.715.6 17.6 17.6
54.9 61.5 43.678.3 97.4 122.915.4 37.5 26.254.3a 81.0 77.734.4 80.0 75.5
13.6 19.5 ..138.0 160.4 113.6
42.9 83.0 75.4
99 99 10071.7 99.1 95.9
7,593 83,918 85,990
.. 28.1 25.2
.. 42.2 20.6
.. 29.2 29.2
6.3 4.1 8.98.5 6.2 10.8
23.8 32.6 30.8
0.80 0.88 0.6776.1 487.0 827.6
High income
FranceHigh-
income
group

85The Little Data Book on Information and Communication Technology 2014
2005 2012 2012
Country data
Economic and social contextPopulation (millions)Urban population (% of total)GNI per capita, World Bank Atlas method ($)GDP growth, 2000–05 and 2005–12 (avg. annual %)Adult literacy rate (% ages 15 and older) Gross primary, secondary, tertiary school enrollment (%)
Sector structureSeparate telecommunications/ICT regulatorStatus of main fixed-line telephone operatorLevel of competition (competition, partial comp., monopoly) International gateway(s) Mobile telephone service Internet serviceForeign ownership (not allowed, restricted, allowed)Reg. treatment of VoIP (banned, closed, no framework, allowed)
Sector efficiency and capacityTelecommunications revenue (% of GDP)Telecommunications investment (% of revenue)
Sector performanceAccess
Fixed-telephone subscriptions (per 100 people)Mobile-cellular telephone subscriptions (per 100 people)Fixed (wired)-broadband subscriptions (per 100 people)Households with a computer (%)Households with Internet access at home (%)Usage
Int’l. voice traffic, total (minutes/subscription/month)Domestic mobile traffic (minutes/subscription/month)Individuals using the Internet (%)Quality
Population covered by a mobile-cellular network (%)Fixed (wired)-broadband subscriptions (% of total Internet)International Internet bandwidth (bit/s per Internet user)Affordability
Fixed-telephone sub-basket ($ a month)Mobile-cellular sub-basket ($ a month)Fixed-broadband sub-basket ($ a month)Trade
ICT goods exports (% of total goods exports)ICT goods imports (% of total goods imports)ICT service exports (% of total service exports)Applications
Online service index (0–1, 1=highest presence)Secure Internet servers (per million people)
0.25 0.27 1,30052 51 80
.. .. 38,412
.. .. 1.0
.. .. ..
.. .. 93
.. ..
.. ..
.. ..
.. ..
.. ..
.. ..
.. ..
.. .. 2.7
.. .. 17.6
20.9 20.1 43.647.1 82.5 122.9
4.3 14.7 26.245.0 .. 77.7
.. .. 75.5
9.1 9.4 ..116.7 103.8 113.6
21.5 52.9a 75.4
96 98 10059.5 98.5 95.9
1,639 13,814 85,990
.. .. 25.2
.. .. 20.6
.. .. 29.2
0.2 0.4 8.95.1 5.2 10.8
13.5 9.7 30.8
.. .. 0.6758.9 133.6 827.6
High income
French PolynesiaHigh-
income
group

86 2014 The Little Data Book on Information and Communication Technology
2005 2012 2012
Country data
1 2 2,39183 86 61
5,080 10,040 6,9691.6 3.1 6.284 89 94
.. .. 76
Yes YesPublic Mixed
.. CC CC CA AB C
1.7 .. 2.512.4 .. 18.2
2.8 1.0 19.453.4 179.5a 92.4
0.1 0.3a 10.83.0 10.1a 40.62.0 7.9a 36.3
.. 1.6 1.3
.. .. 284.44.9 8.6a 41.6
78 .. 99
17.7 18.4 95.52,963 5,509 14,580
.. 52.9 9.4
.. 23.3 14.9
.. 31.8 17.8
0.0 0.0 17.63.7 3.5 14.7
37.7 .. 29.1
0.32 0.19 0.425.8 9.6 18.5
Sub-Saharan Africa Upper middle income
GabonUpper
middle-
income
group
Economic and social contextPopulation (millions)Urban population (% of total)GNI per capita, World Bank Atlas method ($)GDP growth, 2000–05 and 2005–12 (avg. annual %)Adult literacy rate (% ages 15 and older) Gross primary, secondary, tertiary school enrollment (%)
Sector structureSeparate telecommunications/ICT regulatorStatus of main fixed-line telephone operatorLevel of competition (competition, partial comp., monopoly) International gateway(s) Mobile telephone service Internet serviceForeign ownership (not allowed, restricted, allowed)Reg. treatment of VoIP (banned, closed, no framework, allowed)
Sector efficiency and capacityTelecommunications revenue (% of GDP)Telecommunications investment (% of revenue)
Sector performanceAccess
Fixed-telephone subscriptions (per 100 people)Mobile-cellular telephone subscriptions (per 100 people)Fixed (wired)-broadband subscriptions (per 100 people)Households with a computer (%)Households with Internet access at home (%)Usage
Int’l. voice traffic, total (minutes/subscription/month)Domestic mobile traffic (minutes/subscription/month)Individuals using the Internet (%)Quality
Population covered by a mobile-cellular network (%)Fixed (wired)-broadband subscriptions (% of total Internet)International Internet bandwidth (bit/s per Internet user)Affordability
Fixed-telephone sub-basket ($ a month)Mobile-cellular sub-basket ($ a month)Fixed-broadband sub-basket ($ a month)Trade
ICT goods exports (% of total goods exports)ICT goods imports (% of total goods imports)ICT service exports (% of total service exports)Applications
Online service index (0–1, 1=highest presence)Secure Internet servers (per million people)

87The Little Data Book on Information and Communication Technology 2014
2005 2012 2012
Country data
1 2 84653 58 28
410 510 5903.2 3.8 5.937 51 61
.. 58 60
Yes YesPublic Public
M M
P C
C C
A AB B
.. .. 5.0
.. .. ..
3.1 3.6 1.017.2 85.2 47.2
0.0 0.0 0.22.3 7.4a 4.21.0a 6.7a 3.4
.. .. ..14.7 .. 70.1
3.8a 12.4a 6.2
70 .. ..7.6 .. 30.9
165 2,117 9,141
.. 3.5 8.9
.. 6.0 11.9
.. 280.3 46.9
1.2 0.1 ..5.0 1.9 ..
.. .. ..
0.23 0.32 0.201.3 4.3 1.1
Sub-Saharan Africa Low income
Gambia, TheLow-
income
group
Economic and social contextPopulation (millions)Urban population (% of total)GNI per capita, World Bank Atlas method ($)GDP growth, 2000–05 and 2005–12 (avg. annual %)Adult literacy rate (% ages 15 and older) Gross primary, secondary, tertiary school enrollment (%)
Sector structureSeparate telecommunications/ICT regulatorStatus of main fixed-line telephone operatorLevel of competition (competition, partial comp., monopoly) International gateway(s) Mobile telephone service Internet serviceForeign ownership (not allowed, restricted, allowed)Reg. treatment of VoIP (banned, closed, no framework, allowed)
Sector efficiency and capacityTelecommunications revenue (% of GDP)Telecommunications investment (% of revenue)
Sector performanceAccess
Fixed-telephone subscriptions (per 100 people)Mobile-cellular telephone subscriptions (per 100 people)Fixed (wired)-broadband subscriptions (per 100 people)Households with a computer (%)Households with Internet access at home (%)Usage
Int’l. voice traffic, total (minutes/subscription/month)Domestic mobile traffic (minutes/subscription/month)Individuals using the Internet (%)Quality
Population covered by a mobile-cellular network (%)Fixed (wired)-broadband subscriptions (% of total Internet)International Internet bandwidth (bit/s per Internet user)Affordability
Fixed-telephone sub-basket ($ a month)Mobile-cellular sub-basket ($ a month)Fixed-broadband sub-basket ($ a month)Trade
ICT goods exports (% of total goods exports)ICT goods imports (% of total goods imports)ICT service exports (% of total service exports)Applications
Online service index (0–1, 1=highest presence)Secure Internet servers (per million people)

88 2014 The Little Data Book on Information and Communication Technology
2005 2012 2012
Country data
Georgia
4 4 2,50752 53 39
1,360 3,290 1,8937.5 4.7 6.0
100 100 71
77 72 64
Yes YesPublic Mixed
.. CC CC CA AA No
6.2 2.7 2.5
30.9 19.6 20.5
12.7 29.3 5.426.2 107.8 83.1
0.1 8.7 1.41.8a 32.7 15.01.0a 32.0 12.4
.. 6.1 6.5
.. 116.5 ..6.1a 45.5a 18.7
95 99 86
1.3 100.0 58.2
118 52,946 8,076
.. 2.4 4.9
.. 6.0 10.5
.. 11.9 20.6
0.1 0.5 4.64.4 4.9 7.24.0 4.6 47.1
0.46 0.60 0.324.6 29.3 4.4
Europe & Central Asia Lower middle income
Lower
middle-
income
group
Economic and social contextPopulation (millions)Urban population (% of total)GNI per capita, World Bank Atlas method ($)GDP growth, 2000–05 and 2005–12 (avg. annual %)Adult literacy rate (% ages 15 and older) Gross primary, secondary, tertiary school enrollment (%)
Sector structureSeparate telecommunications/ICT regulatorStatus of main fixed-line telephone operatorLevel of competition (competition, partial comp., monopoly) International gateway(s) Mobile telephone service Internet serviceForeign ownership (not allowed, restricted, allowed)Reg. treatment of VoIP (banned, closed, no framework, allowed)
Sector efficiency and capacityTelecommunications revenue (% of GDP)Telecommunications investment (% of revenue)
Sector performanceAccess
Fixed-telephone subscriptions (per 100 people)Mobile-cellular telephone subscriptions (per 100 people)Fixed (wired)-broadband subscriptions (per 100 people)Households with a computer (%)Households with Internet access at home (%)Usage
Int’l. voice traffic, total (minutes/subscription/month)Domestic mobile traffic (minutes/subscription/month)Individuals using the Internet (%)Quality
Population covered by a mobile-cellular network (%)Fixed (wired)-broadband subscriptions (% of total Internet)International Internet bandwidth (bit/s per Internet user)Affordability
Fixed-telephone sub-basket ($ a month)Mobile-cellular sub-basket ($ a month)Fixed-broadband sub-basket ($ a month)Trade
ICT goods exports (% of total goods exports)ICT goods imports (% of total goods imports)ICT service exports (% of total service exports)Applications
Online service index (0–1, 1=highest presence)Secure Internet servers (per million people)

89The Little Data Book on Information and Communication Technology 2014
2005 2012 2012
Country data
High-
income
group
High income
Germany
82 80 1,30073 74 80
34,780 45,070 38,4120.5 1.2 1.0
.. .. ..
.. 90 93
Yes YesPrivate Mixed
C CC CC CA AA A
3.0 1.5 2.78.6 15.3 17.6
65.4 60.5 43.694.6 111.6 122.912.9 33.7 26.270.0 87.0 77.761.6 85.0 75.5
.. .. ..43.0 99.1 113.6
68.7 84.0 75.4
99 99 10053.9 .. 95.9
9,827 74,793 85,990
.. 28.6 25.2
.. 18.9 20.6
.. 41.7 29.2
7.9 4.4 8.911.5 7.6 10.829.7 33.7 30.8
0.71 0.75 0.67274.2 1,060.5 827.6
Economic and social contextPopulation (millions)Urban population (% of total)GNI per capita, World Bank Atlas method ($)GDP growth, 2000–05 and 2005–12 (avg. annual %)Adult literacy rate (% ages 15 and older) Gross primary, secondary, tertiary school enrollment (%)
Sector structureSeparate telecommunications/ICT regulatorStatus of main fixed-line telephone operatorLevel of competition (competition, partial comp., monopoly) International gateway(s) Mobile telephone service Internet serviceForeign ownership (not allowed, restricted, allowed)Reg. treatment of VoIP (banned, closed, no framework, allowed)
Sector efficiency and capacityTelecommunications revenue (% of GDP)Telecommunications investment (% of revenue)
Sector performanceAccess
Fixed-telephone subscriptions (per 100 people)Mobile-cellular telephone subscriptions (per 100 people)Fixed (wired)-broadband subscriptions (per 100 people)Households with a computer (%)Households with Internet access at home (%)Usage
Int’l. voice traffic, total (minutes/subscription/month)Domestic mobile traffic (minutes/subscription/month)Individuals using the Internet (%)Quality
Population covered by a mobile-cellular network (%)Fixed (wired)-broadband subscriptions (% of total Internet)International Internet bandwidth (bit/s per Internet user)Affordability
Fixed-telephone sub-basket ($ a month)Mobile-cellular sub-basket ($ a month)Fixed-broadband sub-basket ($ a month)Trade
ICT goods exports (% of total goods exports)ICT goods imports (% of total goods imports)ICT service exports (% of total service exports)Applications
Online service index (0–1, 1=highest presence)Secure Internet servers (per million people)

90 2014 The Little Data Book on Information and Communication Technology
2005 2012 2012
Country data
Lower
middle-
income
group
Sub-Saharan Africa Lower middle income
Ghana
21 25 2,50748 53 39
470 1,550 1,8935.1 7.9 6.058 71 71
54 66 64
Yes YesMixed Mixed
.. CP CC CA AC C
.. 2.4 2.5
.. 98.7 20.5
1.5 1.1 5.413.4 101.0 83.1
0.0 0.3 1.42.0 13.8 15.00.2a 11.0a 12.4
14.6 6.5 6.5
.. 67.5 ..1.8 17.1a 18.7
59 87 86
17.8 100.0 58.2
429 230 8,076
.. 5.2 4.9
.. 6.6 10.5
.. 43.0 20.6
0.0 0.1 4.64.8 4.4 7.2
.. .. 47.1
0.30 0.30 0.320.1 2.6 4.4
Economic and social contextPopulation (millions)Urban population (% of total)GNI per capita, World Bank Atlas method ($)GDP growth, 2000–05 and 2005–12 (avg. annual %)Adult literacy rate (% ages 15 and older) Gross primary, secondary, tertiary school enrollment (%)
Sector structureSeparate telecommunications/ICT regulatorStatus of main fixed-line telephone operatorLevel of competition (competition, partial comp., monopoly) International gateway(s) Mobile telephone service Internet serviceForeign ownership (not allowed, restricted, allowed)Reg. treatment of VoIP (banned, closed, no framework, allowed)
Sector efficiency and capacityTelecommunications revenue (% of GDP)Telecommunications investment (% of revenue)
Sector performanceAccess
Fixed-telephone subscriptions (per 100 people)Mobile-cellular telephone subscriptions (per 100 people)Fixed (wired)-broadband subscriptions (per 100 people)Households with a computer (%)Households with Internet access at home (%)Usage
Int’l. voice traffic, total (minutes/subscription/month)Domestic mobile traffic (minutes/subscription/month)Individuals using the Internet (%)Quality
Population covered by a mobile-cellular network (%)Fixed (wired)-broadband subscriptions (% of total Internet)International Internet bandwidth (bit/s per Internet user)Affordability
Fixed-telephone sub-basket ($ a month)Mobile-cellular sub-basket ($ a month)Fixed-broadband sub-basket ($ a month)Trade
ICT goods exports (% of total goods exports)ICT goods imports (% of total goods imports)ICT service exports (% of total service exports)Applications
Online service index (0–1, 1=highest presence)Secure Internet servers (per million people)

91The Little Data Book on Information and Communication Technology 2014
2005 2012 2012
Country data
High-
income
group
High income
Greece
11 11 1,30060 62 80
21,400 23,660 38,4124.2 –2.2 1.096 97 ..
100 .. 93
Yes YesMixed Mixed
C CP PC CA AA A
4.0 3.1 2.79.4 12.2 17.6
57.2 49.1 43.692.9 120.0 122.9
1.5 24.1 26.233.0 57.4 77.721.7 54.0 75.5
13.9 13.9 ..49.3 34.0 113.6
24.0 56.0 75.4
100a 100 10018.1 98.7 95.9
2,458 64,208 85,990
.. 25.4 25.2
.. 43.3 20.6
.. 23.7 29.2
2.8 1.7 8.95.7 5.1 10.86.6 7.9 30.8
0.57 0.58 0.6731.4 133.1 827.6
Economic and social contextPopulation (millions)Urban population (% of total)GNI per capita, World Bank Atlas method ($)GDP growth, 2000–05 and 2005–12 (avg. annual %)Adult literacy rate (% ages 15 and older) Gross primary, secondary, tertiary school enrollment (%)
Sector structureSeparate telecommunications/ICT regulatorStatus of main fixed-line telephone operatorLevel of competition (competition, partial comp., monopoly) International gateway(s) Mobile telephone service Internet serviceForeign ownership (not allowed, restricted, allowed)Reg. treatment of VoIP (banned, closed, no framework, allowed)
Sector efficiency and capacityTelecommunications revenue (% of GDP)Telecommunications investment (% of revenue)
Sector performanceAccess
Fixed-telephone subscriptions (per 100 people)Mobile-cellular telephone subscriptions (per 100 people)Fixed (wired)-broadband subscriptions (per 100 people)Households with a computer (%)Households with Internet access at home (%)Usage
Int’l. voice traffic, total (minutes/subscription/month)Domestic mobile traffic (minutes/subscription/month)Individuals using the Internet (%)Quality
Population covered by a mobile-cellular network (%)Fixed (wired)-broadband subscriptions (% of total Internet)International Internet bandwidth (bit/s per Internet user)Affordability
Fixed-telephone sub-basket ($ a month)Mobile-cellular sub-basket ($ a month)Fixed-broadband sub-basket ($ a month)Trade
ICT goods exports (% of total goods exports)ICT goods imports (% of total goods imports)ICT service exports (% of total service exports)Applications
Online service index (0–1, 1=highest presence)Secure Internet servers (per million people)

92 2014 The Little Data Book on Information and Communication Technology
2005 2012 2012
Country data
High-
income
group
High income
Greenland
0.06 0.06 1,30083 85 80
29,690 26,020 38,4120.7 1.5 1.0
.. .. ..
.. .. 93
.. ..
.. ..
.. ..
.. ..
.. ..
.. ..
.. ..
.. .. 2.7
.. .. 17.6
56.5 33.3 43.681.6 104.7 122.912.5 19.9 26.2
.. .. 77.732.0 76.7a 75.5
.. .. ..
.. 87.9 113.6
57.7 64.9a 75.4
90 100 100100.0 100.0 95.9
913 18,995 85,990
.. .. 25.2
.. .. 20.6
.. .. 29.2
0.1 0.0 8.95.6 3.9 10.8
.. .. 30.8
.. .. 0.67212.2 1,478.6 827.6
Economic and social contextPopulation (millions)Urban population (% of total)GNI per capita, World Bank Atlas method ($)GDP growth, 2000–05 and 2005–12 (avg. annual %)Adult literacy rate (% ages 15 and older) Gross primary, secondary, tertiary school enrollment (%)
Sector structureSeparate telecommunications/ICT regulatorStatus of main fixed-line telephone operatorLevel of competition (competition, partial comp., monopoly) International gateway(s) Mobile telephone service Internet serviceForeign ownership (not allowed, restricted, allowed)Reg. treatment of VoIP (banned, closed, no framework, allowed)
Sector efficiency and capacityTelecommunications revenue (% of GDP)Telecommunications investment (% of revenue)
Sector performanceAccess
Fixed-telephone subscriptions (per 100 people)Mobile-cellular telephone subscriptions (per 100 people)Fixed (wired)-broadband subscriptions (per 100 people)Households with a computer (%)Households with Internet access at home (%)Usage
Int’l. voice traffic, total (minutes/subscription/month)Domestic mobile traffic (minutes/subscription/month)Individuals using the Internet (%)Quality
Population covered by a mobile-cellular network (%)Fixed (wired)-broadband subscriptions (% of total Internet)International Internet bandwidth (bit/s per Internet user)Affordability
Fixed-telephone sub-basket ($ a month)Mobile-cellular sub-basket ($ a month)Fixed-broadband sub-basket ($ a month)Trade
ICT goods exports (% of total goods exports)ICT goods imports (% of total goods imports)ICT service exports (% of total service exports)Applications
Online service index (0–1, 1=highest presence)Secure Internet servers (per million people)

93The Little Data Book on Information and Communication Technology 2014
2005 2012 2012
Country data
Upper
middle-
income
group
Latin America & Caribbean Upper middle income
Grenada
0.10 0.11 2,39137 39 61
6,800 7,220 6,9694.6 –0.4 6.2
.. .. 94
.. 91 76
Yes YesMixed Mixed
.. ..M C
.. C
.. ANo No
5.8 6.7 2.519.1 13.4 18.2
26.6 27.0a 19.445.5 121.3 92.4
3.1 13.7a 10.8.. .. 40.6.. .. 36.3
100.5 46.6 1.3133.5 200.9 284.4
20.5a 42.1a 41.6
.. .. 99
57.3 100.0 95.519,463 90,094 14,580
.. 13.4 9.4
.. 14.7 14.9
.. 29.4 17.8
1.5 2.0 17.64.8 4.4 14.7
15.8 15.9 29.1
0.45 0.35 0.4229.1 28.3 18.5
Economic and social contextPopulation (millions)Urban population (% of total)GNI per capita, World Bank Atlas method ($)GDP growth, 2000–05 and 2005–12 (avg. annual %)Adult literacy rate (% ages 15 and older) Gross primary, secondary, tertiary school enrollment (%)
Sector structureSeparate telecommunications/ICT regulatorStatus of main fixed-line telephone operatorLevel of competition (competition, partial comp., monopoly) International gateway(s) Mobile telephone service Internet serviceForeign ownership (not allowed, restricted, allowed)Reg. treatment of VoIP (banned, closed, no framework, allowed)
Sector efficiency and capacityTelecommunications revenue (% of GDP)Telecommunications investment (% of revenue)
Sector performanceAccess
Fixed-telephone subscriptions (per 100 people)Mobile-cellular telephone subscriptions (per 100 people)Fixed (wired)-broadband subscriptions (per 100 people)Households with a computer (%)Households with Internet access at home (%)Usage
Int’l. voice traffic, total (minutes/subscription/month)Domestic mobile traffic (minutes/subscription/month)Individuals using the Internet (%)Quality
Population covered by a mobile-cellular network (%)Fixed (wired)-broadband subscriptions (% of total Internet)International Internet bandwidth (bit/s per Internet user)Affordability
Fixed-telephone sub-basket ($ a month)Mobile-cellular sub-basket ($ a month)Fixed-broadband sub-basket ($ a month)Trade
ICT goods exports (% of total goods exports)ICT goods imports (% of total goods imports)ICT service exports (% of total service exports)Applications
Online service index (0–1, 1=highest presence)Secure Internet servers (per million people)

94 2014 The Little Data Book on Information and Communication Technology
2005 2012 2012
Country data
High-
income
group
High income
Guam
0.16 0.16 1,30093 93 80
.. .. 38,412
.. .. 1.0
.. .. ..
.. .. 93
.. ..
.. ..
.. ..
.. ..
.. ..
.. ..
.. ..
.. .. 2.7
.. .. 17.6
41.4 41.2 43.661.9 .. 122.9
1.7 1.9 26.2.. .. 77.7.. .. 75.5
.. .. ..
.. .. 113.6
38.6 61.5a 75.4
.. .. 100
.. .. 95.9
.. .. 85,990
.. .. 25.2
.. .. 20.6
.. .. 29.2
.. .. 8.9
.. .. 10.8
.. .. 30.8
.. .. 0.67113.6 242.4 827.6
Economic and social contextPopulation (millions)Urban population (% of total)GNI per capita, World Bank Atlas method ($)GDP growth, 2000–05 and 2005–12 (avg. annual %)Adult literacy rate (% ages 15 and older) Gross primary, secondary, tertiary school enrollment (%)
Sector structureSeparate telecommunications/ICT regulatorStatus of main fixed-line telephone operatorLevel of competition (competition, partial comp., monopoly) International gateway(s) Mobile telephone service Internet serviceForeign ownership (not allowed, restricted, allowed)Reg. treatment of VoIP (banned, closed, no framework, allowed)
Sector efficiency and capacityTelecommunications revenue (% of GDP)Telecommunications investment (% of revenue)
Sector performanceAccess
Fixed-telephone subscriptions (per 100 people)Mobile-cellular telephone subscriptions (per 100 people)Fixed (wired)-broadband subscriptions (per 100 people)Households with a computer (%)Households with Internet access at home (%)Usage
Int’l. voice traffic, total (minutes/subscription/month)Domestic mobile traffic (minutes/subscription/month)Individuals using the Internet (%)Quality
Population covered by a mobile-cellular network (%)Fixed (wired)-broadband subscriptions (% of total Internet)International Internet bandwidth (bit/s per Internet user)Affordability
Fixed-telephone sub-basket ($ a month)Mobile-cellular sub-basket ($ a month)Fixed-broadband sub-basket ($ a month)Trade
ICT goods exports (% of total goods exports)ICT goods imports (% of total goods imports)ICT service exports (% of total service exports)Applications
Online service index (0–1, 1=highest presence)Secure Internet servers (per million people)

95The Little Data Book on Information and Communication Technology 2014
2005 2012 2012
Country data
Lower
middle-
income
group
Latin America & Caribbean Lower middle income
Guatemala
13 15 2,50747 50 39
2,070 3,120 1,8933.1 3.4 6.069 76 71
71 .. 64
Yes YesPrivate Private
.. CC CC CA A
No A
.. .. 2.5
.. .. 20.5
9.8 11.6 5.435.6 137.8 83.1
0.2 1.8 1.48.4 19.2a 15.02.1 9.3a 12.4
32.1 11.5 6.5
51.4 77.6 ..5.7 16.0a 18.7
76 100 86
.. .. 58.2
977 6,630 8,076
.. 5.8 4.9
.. 19.8 10.5
.. 20.6 20.6
0.3 0.3 4.66.0 5.7 7.2
19.3 21.9 47.1
0.43 0.46 0.325.5 13.3 4.4
Economic and social contextPopulation (millions)Urban population (% of total)GNI per capita, World Bank Atlas method ($)GDP growth, 2000–05 and 2005–12 (avg. annual %)Adult literacy rate (% ages 15 and older) Gross primary, secondary, tertiary school enrollment (%)
Sector structureSeparate telecommunications/ICT regulatorStatus of main fixed-line telephone operatorLevel of competition (competition, partial comp., monopoly) International gateway(s) Mobile telephone service Internet serviceForeign ownership (not allowed, restricted, allowed)Reg. treatment of VoIP (banned, closed, no framework, allowed)
Sector efficiency and capacityTelecommunications revenue (% of GDP)Telecommunications investment (% of revenue)
Sector performanceAccess
Fixed-telephone subscriptions (per 100 people)Mobile-cellular telephone subscriptions (per 100 people)Fixed (wired)-broadband subscriptions (per 100 people)Households with a computer (%)Households with Internet access at home (%)Usage
Int’l. voice traffic, total (minutes/subscription/month)Domestic mobile traffic (minutes/subscription/month)Individuals using the Internet (%)Quality
Population covered by a mobile-cellular network (%)Fixed (wired)-broadband subscriptions (% of total Internet)International Internet bandwidth (bit/s per Internet user)Affordability
Fixed-telephone sub-basket ($ a month)Mobile-cellular sub-basket ($ a month)Fixed-broadband sub-basket ($ a month)Trade
ICT goods exports (% of total goods exports)ICT goods imports (% of total goods imports)ICT service exports (% of total service exports)Applications
Online service index (0–1, 1=highest presence)Secure Internet servers (per million people)

96 2014 The Little Data Book on Information and Communication Technology
2005 2012 2012
Country data
Low-
income
group
Sub-Saharan Africa Low income
Guinea
10 11 84633 36 28
340 440 5903.0 2.5 5.930 25 61
44 52 60
No YesMixed Mixed
.. C
P C
C C
.. RNo A
.. .. 5.0
.. .. ..
0.3 0.2 1.02.0 41.8 47.20.0 0.0 0.2
.. 2.1a 4.20.0a 1.3a 3.4
.. .. ..
.. .. 70.10.5 1.5a 6.2
80 80 ..0.0 .. 30.9
39 2,051 9,141
.. 1.6 8.9
.. 4.1 11.9
.. 800.0 46.9
0.0 0.0 ..0.7 5.2 ..1.1 64.9 ..
0.14 0.00 0.20.. 0.1 1.1
Economic and social contextPopulation (millions)Urban population (% of total)GNI per capita, World Bank Atlas method ($)GDP growth, 2000–05 and 2005–12 (avg. annual %)Adult literacy rate (% ages 15 and older) Gross primary, secondary, tertiary school enrollment (%)
Sector structureSeparate telecommunications/ICT regulatorStatus of main fixed-line telephone operatorLevel of competition (competition, partial comp., monopoly) International gateway(s) Mobile telephone service Internet serviceForeign ownership (not allowed, restricted, allowed)Reg. treatment of VoIP (banned, closed, no framework, allowed)
Sector efficiency and capacityTelecommunications revenue (% of GDP)Telecommunications investment (% of revenue)
Sector performanceAccess
Fixed-telephone subscriptions (per 100 people)Mobile-cellular telephone subscriptions (per 100 people)Fixed (wired)-broadband subscriptions (per 100 people)Households with a computer (%)Households with Internet access at home (%)Usage
Int’l. voice traffic, total (minutes/subscription/month)Domestic mobile traffic (minutes/subscription/month)Individuals using the Internet (%)Quality
Population covered by a mobile-cellular network (%)Fixed (wired)-broadband subscriptions (% of total Internet)International Internet bandwidth (bit/s per Internet user)Affordability
Fixed-telephone sub-basket ($ a month)Mobile-cellular sub-basket ($ a month)Fixed-broadband sub-basket ($ a month)Trade
ICT goods exports (% of total goods exports)ICT goods imports (% of total goods imports)ICT service exports (% of total service exports)Applications
Online service index (0–1, 1=highest presence)Secure Internet servers (per million people)

97The Little Data Book on Information and Communication Technology 2014
2005 2012 2012
Country data
Low-
income
group
Sub-Saharan Africa Low income
Guinea-Bissau
1 2 84640 45 28
390 510 5900.7 3.1 5.941 55 61
59 .. 60
Yes YesMixed Mixed
P P
P P
C C
A AB B
.. .. 5.0
.. .. ..
0.7 0.3 1.07.0 63.1 47.20.0 0.0 0.2
.. 2.3a 4.20.7 1.6a 3.4
.. .. ..
.. .. 70.11.9 2.9a 6.2
65 65 .... 0.0 30.9
2 3,220 9,141
.. .. 8.9
.. .. 11.9
.. .. 46.9
.. .. ..1.8 .. ..
10.5 55.4 ..
0.15 0.10 0.20.. 1.2 1.1
Economic and social contextPopulation (millions)Urban population (% of total)GNI per capita, World Bank Atlas method ($)GDP growth, 2000–05 and 2005–12 (avg. annual %)Adult literacy rate (% ages 15 and older) Gross primary, secondary, tertiary school enrollment (%)
Sector structureSeparate telecommunications/ICT regulatorStatus of main fixed-line telephone operatorLevel of competition (competition, partial comp., monopoly) International gateway(s) Mobile telephone service Internet serviceForeign ownership (not allowed, restricted, allowed)Reg. treatment of VoIP (banned, closed, no framework, allowed)
Sector efficiency and capacityTelecommunications revenue (% of GDP)Telecommunications investment (% of revenue)
Sector performanceAccess
Fixed-telephone subscriptions (per 100 people)Mobile-cellular telephone subscriptions (per 100 people)Fixed (wired)-broadband subscriptions (per 100 people)Households with a computer (%)Households with Internet access at home (%)Usage
Int’l. voice traffic, total (minutes/subscription/month)Domestic mobile traffic (minutes/subscription/month)Individuals using the Internet (%)Quality
Population covered by a mobile-cellular network (%)Fixed (wired)-broadband subscriptions (% of total Internet)International Internet bandwidth (bit/s per Internet user)Affordability
Fixed-telephone sub-basket ($ a month)Mobile-cellular sub-basket ($ a month)Fixed-broadband sub-basket ($ a month)Trade
ICT goods exports (% of total goods exports)ICT goods imports (% of total goods imports)ICT service exports (% of total service exports)Applications
Online service index (0–1, 1=highest presence)Secure Internet servers (per million people)

98 2014 The Little Data Book on Information and Communication Technology
2005 2012 2012
Country data
Economic and social contextPopulation (millions)Urban population (% of total)GNI per capita, World Bank Atlas method ($)GDP growth, 2000–05 and 2005–12 (avg. annual %)Adult literacy rate (% ages 15 and older) Gross primary, secondary, tertiary school enrollment (%)
Sector structureSeparate telecommunications/ICT regulatorStatus of main fixed-line telephone operatorLevel of competition (competition, partial comp., monopoly) International gateway(s) Mobile telephone service Internet serviceForeign ownership (not allowed, restricted, allowed)Reg. treatment of VoIP (banned, closed, no framework, allowed)
Sector efficiency and capacityTelecommunications revenue (% of GDP)Telecommunications investment (% of revenue)
Sector performanceAccess
Fixed-telephone subscriptions (per 100 people)Mobile-cellular telephone subscriptions (per 100 people)Fixed (wired)-broadband subscriptions (per 100 people)Households with a computer (%)Households with Internet access at home (%)Usage
Int’l. voice traffic, total (minutes/subscription/month)Domestic mobile traffic (minutes/subscription/month)Individuals using the Internet (%)Quality
Population covered by a mobile-cellular network (%)Fixed (wired)-broadband subscriptions (% of total Internet)International Internet bandwidth (bit/s per Internet user)Affordability
Fixed-telephone sub-basket ($ a month)Mobile-cellular sub-basket ($ a month)Fixed-broadband sub-basket ($ a month)Trade
ICT goods exports (% of total goods exports)ICT goods imports (% of total goods imports)ICT service exports (% of total service exports)Applications
Online service index (0–1, 1=highest presence)Secure Internet servers (per million people)
Lower
middle-
income
group
Latin America & Caribbean Lower middle income
0.76 0.80 2,50728 28 39
1,070 3,410 1,8930.8 2.8 6.0
.. 85 71
77 68 64
Yes YesMixed Mixed
.. M
C P
.. P
.. ..B C
6.3 5.2 2.5
50.0 19.2 20.5
14.5 19.4 5.437.0 68.8 83.1
0.3 3.7 1.411.6a 22.9a 15.010.4a 20.6a 12.4
21.7 15.1 6.5
24.7 35.2 ..13.8a 33.0a 18.7
95 97 86
4.2 68.2 58.2
339 8,382 8,076
.. 3.1 4.9
.. 9.0 10.5
.. 24.5 20.6
0.0 0.1 4.61.9 5.8 7.2
42.4 41.4 47.1
0.44 0.25 0.321.3 12.5 4.4
Guyana

99The Little Data Book on Information and Communication Technology 2014
2005 2012 2012
Country data
Economic and social contextPopulation (millions)Urban population (% of total)GNI per capita, World Bank Atlas method ($)GDP growth, 2000–05 and 2005–12 (avg. annual %)Adult literacy rate (% ages 15 and older) Gross primary, secondary, tertiary school enrollment (%)
Sector structureSeparate telecommunications/ICT regulatorStatus of main fixed-line telephone operatorLevel of competition (competition, partial comp., monopoly) International gateway(s) Mobile telephone service Internet serviceForeign ownership (not allowed, restricted, allowed)Reg. treatment of VoIP (banned, closed, no framework, allowed)
Sector efficiency and capacityTelecommunications revenue (% of GDP)Telecommunications investment (% of revenue)
Sector performanceAccess
Fixed-telephone subscriptions (per 100 people)Mobile-cellular telephone subscriptions (per 100 people)Fixed (wired)-broadband subscriptions (per 100 people)Households with a computer (%)Households with Internet access at home (%)Usage
Int’l. voice traffic, total (minutes/subscription/month)Domestic mobile traffic (minutes/subscription/month)Individuals using the Internet (%)Quality
Population covered by a mobile-cellular network (%)Fixed (wired)-broadband subscriptions (% of total Internet)International Internet bandwidth (bit/s per Internet user)Affordability
Fixed-telephone sub-basket ($ a month)Mobile-cellular sub-basket ($ a month)Fixed-broadband sub-basket ($ a month)Trade
ICT goods exports (% of total goods exports)ICT goods imports (% of total goods imports)ICT service exports (% of total service exports)Applications
Online service index (0–1, 1=highest presence)Secure Internet servers (per million people)
Latin America & Caribbean Low income
Low-
income
group
9 10 84644 55 28
410 760 590–0.7 1.4 5.9
49 .. 61
.. .. 60
Yes YesPublic Mixed
.. C
P C
C C
.. RNo A
.. 3.7 5.0
.. .. ..
1.6 0.5 1.05.4 59.9 47.20.0 0.0 0.22.0 7.3a 4.21.0 3.4a 3.4
.. .. ..
.. .. 70.16.4a 9.8a 6.2
.. .. ..0.0 .. 30.9
229 .. 9,141
.. 5.6 8.9
.. 12.6 11.9
.. 47.8 46.9
.. .. ..
.. .. ..
.. .. ..
0.21 0.09 0.200.6 1.1 1.1
Haiti

100 2014 The Little Data Book on Information and Communication Technology
2005 2012 2012
Country data
Economic and social contextPopulation (millions)Urban population (% of total)GNI per capita, World Bank Atlas method ($)GDP growth, 2000–05 and 2005–12 (avg. annual %)Adult literacy rate (% ages 15 and older) Gross primary, secondary, tertiary school enrollment (%)
Sector structureSeparate telecommunications/ICT regulatorStatus of main fixed-line telephone operatorLevel of competition (competition, partial comp., monopoly) International gateway(s) Mobile telephone service Internet serviceForeign ownership (not allowed, restricted, allowed)Reg. treatment of VoIP (banned, closed, no framework, allowed)
Sector efficiency and capacityTelecommunications revenue (% of GDP)Telecommunications investment (% of revenue)
Sector performanceAccess
Fixed-telephone subscriptions (per 100 people)Mobile-cellular telephone subscriptions (per 100 people)Fixed (wired)-broadband subscriptions (per 100 people)Households with a computer (%)Households with Internet access at home (%)Usage
Int’l. voice traffic, total (minutes/subscription/month)Domestic mobile traffic (minutes/subscription/month)Individuals using the Internet (%)Quality
Population covered by a mobile-cellular network (%)Fixed (wired)-broadband subscriptions (% of total Internet)International Internet bandwidth (bit/s per Internet user)Affordability
Fixed-telephone sub-basket ($ a month)Mobile-cellular sub-basket ($ a month)Fixed-broadband sub-basket ($ a month)Trade
ICT goods exports (% of total goods exports)ICT goods imports (% of total goods imports)ICT service exports (% of total service exports)Applications
Online service index (0–1, 1=highest presence)Secure Internet servers (per million people)
Lower
middle-
income
group
Latin America & Caribbean Lower middle income
7 8 2,50749 53 39
1,380 2,120 1,8934.7 3.2 6.084 85 71
.. 71 64
Yes YesPublic Public
.. ..M C
C C
A RB C
5.1 5.4 2.5
23.5 9.1 20.5
7.2 7.7 5.418.6 92.9 83.1
0.0 0.8 1.46.3 15.1a 15.01.5 13.2a 12.4
25.3 24.7 6.5
43.0 186.5 ..6.5 18.1a 18.7
90 .. 86
0.0 81.1 58.2
1,115 4,173 8,076
.. 6.3 4.9
.. 17.0 10.5
.. 19.0 20.6
1.1 0.3 4.65.6 5.0 7.28.1 11.2 47.1
0.40 0.38 0.324.3 9.1 4.4
Honduras

101The Little Data Book on Information and Communication Technology 2014
2005 2012 2012
Country data
Economic and social contextPopulation (millions)Urban population (% of total)GNI per capita, World Bank Atlas method ($)GDP growth, 2000–05 and 2005–12 (avg. annual %)Adult literacy rate (% ages 15 and older) Gross primary, secondary, tertiary school enrollment (%)
Sector structureSeparate telecommunications/ICT regulatorStatus of main fixed-line telephone operatorLevel of competition (competition, partial comp., monopoly) International gateway(s) Mobile telephone service Internet serviceForeign ownership (not allowed, restricted, allowed)Reg. treatment of VoIP (banned, closed, no framework, allowed)
Sector efficiency and capacityTelecommunications revenue (% of GDP)Telecommunications investment (% of revenue)
Sector performanceAccess
Fixed-telephone subscriptions (per 100 people)Mobile-cellular telephone subscriptions (per 100 people)Fixed (wired)-broadband subscriptions (per 100 people)Households with a computer (%)Households with Internet access at home (%)Usage
Int’l. voice traffic, total (minutes/subscription/month)Domestic mobile traffic (minutes/subscription/month)Individuals using the Internet (%)Quality
Population covered by a mobile-cellular network (%)Fixed (wired)-broadband subscriptions (% of total Internet)International Internet bandwidth (bit/s per Internet user)Affordability
Fixed-telephone sub-basket ($ a month)Mobile-cellular sub-basket ($ a month)Fixed-broadband sub-basket ($ a month)Trade
ICT goods exports (% of total goods exports)ICT goods imports (% of total goods imports)ICT service exports (% of total service exports)Applications
Online service index (0–1, 1=highest presence)Secure Internet servers (per million people)
High income
High-
income
group
7 7 1,300100 100 80
28,890 36,560 38,4124.2 3.4 1.0
.. .. ..72 90 93
.. Yes
.. ..
.. ..
.. ..
.. ..
.. ..A A
3.6 3.6 2.718.3 12.9 17.6
55.0 61.3 43.6123.9 229.2 122.9
24.1 31.2 26.270.1 80.3 77.764.6 78.6 75.5
.. 61.2 ..
.. 102.5 113.6
56.9 72.8 75.4
100 100 10063.1 75.6 95.9
16,723 1,426,554 85,990
.. 14.1 25.2
.. 1.8 20.6
.. 21.6 29.2
38.3 42.2 8.938.2 40.8 10.818.4 15.3 30.8
.. .. 0.67162.3 627.0 827.6
Hong Kong SAR, China

102 2014 The Little Data Book on Information and Communication Technology
2005 2012 2012
Country data
Economic and social contextPopulation (millions)Urban population (% of total)GNI per capita, World Bank Atlas method ($)GDP growth, 2000–05 and 2005–12 (avg. annual %)Adult literacy rate (% ages 15 and older) Gross primary, secondary, tertiary school enrollment (%)
Sector structureSeparate telecommunications/ICT regulatorStatus of main fixed-line telephone operatorLevel of competition (competition, partial comp., monopoly) International gateway(s) Mobile telephone service Internet serviceForeign ownership (not allowed, restricted, allowed)Reg. treatment of VoIP (banned, closed, no framework, allowed)
Sector efficiency and capacityTelecommunications revenue (% of GDP)Telecommunications investment (% of revenue)
Sector performanceAccess
Fixed-telephone subscriptions (per 100 people)Mobile-cellular telephone subscriptions (per 100 people)Fixed (wired)-broadband subscriptions (per 100 people)Households with a computer (%)Households with Internet access at home (%)Usage
Int’l. voice traffic, total (minutes/subscription/month)Domestic mobile traffic (minutes/subscription/month)Individuals using the Internet (%)Quality
Population covered by a mobile-cellular network (%)Fixed (wired)-broadband subscriptions (% of total Internet)International Internet bandwidth (bit/s per Internet user)Affordability
Fixed-telephone sub-basket ($ a month)Mobile-cellular sub-basket ($ a month)Fixed-broadband sub-basket ($ a month)Trade
ICT goods exports (% of total goods exports)ICT goods imports (% of total goods imports)ICT service exports (% of total service exports)Applications
Online service index (0–1, 1=highest presence)Secure Internet servers (per million people)
Upper
middle-
income
group
Europe & Central Asia Upper middle income
10 10 2,39166 70 61
10,220 12,410 6,9694.2 -0.5 6.299 99 94
89 90 76
Yes YesPrivate Private
C CP PC CA AA A
4.6 3.4 2.59.1 15.8 18.2
33.8 29.7 19.492.3 116.1 92.4
6.5 22.9 10.842.0 71.0 40.622.1 69.0 36.3
6.8 8.9 1.384.5 129.5 284.439.0 72.0 41.6
99 99 99
66.7 99.4 95.58,896 15,314 14,580
.. 25.3 9.4
.. 25.1 14.9
.. 31.0 17.8
25.6 17.4 17.618.7 16.2 14.720.3 27.7 29.1
0.65 0.69 0.4230.0 248.7 18.5
Hungary

103The Little Data Book on Information and Communication Technology 2014
2005 2012 2012
Country data
Economic and social contextPopulation (millions)Urban population (% of total)GNI per capita, World Bank Atlas method ($)GDP growth, 2000–05 and 2005–12 (avg. annual %)Adult literacy rate (% ages 15 and older) Gross primary, secondary, tertiary school enrollment (%)
Sector structureSeparate telecommunications/ICT regulatorStatus of main fixed-line telephone operatorLevel of competition (competition, partial comp., monopoly) International gateway(s) Mobile telephone service Internet serviceForeign ownership (not allowed, restricted, allowed)Reg. treatment of VoIP (banned, closed, no framework, allowed)
Sector efficiency and capacityTelecommunications revenue (% of GDP)Telecommunications investment (% of revenue)
Sector performanceAccess
Fixed-telephone subscriptions (per 100 people)Mobile-cellular telephone subscriptions (per 100 people)Fixed (wired)-broadband subscriptions (per 100 people)Households with a computer (%)Households with Internet access at home (%)Usage
Int’l. voice traffic, total (minutes/subscription/month)Domestic mobile traffic (minutes/subscription/month)Individuals using the Internet (%)Quality
Population covered by a mobile-cellular network (%)Fixed (wired)-broadband subscriptions (% of total Internet)International Internet bandwidth (bit/s per Internet user)Affordability
Fixed-telephone sub-basket ($ a month)Mobile-cellular sub-basket ($ a month)Fixed-broadband sub-basket ($ a month)Trade
ICT goods exports (% of total goods exports)ICT goods imports (% of total goods imports)ICT service exports (% of total service exports)Applications
Online service index (0–1, 1=highest presence)Secure Internet servers (per million people)
High-
income
group
High income
0.30 0.32 1,30093 94 80
49,620 38,270 38,4124.0 -0.1 1.0
.. .. ..95 98 93
Yes YesMixed Private
.. CC CC CA AC A
2.8 2.0 2.719.5 14.6 17.6
65.3 55.2 43.695.4 108.1 122.926.3 34.3 26.289.0 96.0 77.784.4 95.0 75.5
18.7 13.9 ..125.4 178.7 113.6
87.0 96.2 75.4
99 99 10089.6 95.9 95.9
4,803 318,962 85,990
.. 21.0 25.2
.. 21.9 20.6
.. 31.8 29.2
0.1 0.2 8.96.4 4.1 10.8
21.4 27.1 30.8
0.72 0.54 0.671,004.3 2,869.3 827.6
Iceland

104 2014 The Little Data Book on Information and Communication Technology
2005 2012 2012
Country data
Economic and social contextPopulation (millions)Urban population (% of total)GNI per capita, World Bank Atlas method ($)GDP growth, 2000–05 and 2005–12 (avg. annual %)Adult literacy rate (% ages 15 and older) Gross primary, secondary, tertiary school enrollment (%)
Sector structureSeparate telecommunications/ICT regulatorStatus of main fixed-line telephone operatorLevel of competition (competition, partial comp., monopoly) International gateway(s) Mobile telephone service Internet serviceForeign ownership (not allowed, restricted, allowed)Reg. treatment of VoIP (banned, closed, no framework, allowed)
Sector efficiency and capacityTelecommunications revenue (% of GDP)Telecommunications investment (% of revenue)
Sector performanceAccess
Fixed-telephone subscriptions (per 100 people)Mobile-cellular telephone subscriptions (per 100 people)Fixed (wired)-broadband subscriptions (per 100 people)Households with a computer (%)Households with Internet access at home (%)Usage
Int’l. voice traffic, total (minutes/subscription/month)Domestic mobile traffic (minutes/subscription/month)Individuals using the Internet (%)Quality
Population covered by a mobile-cellular network (%)Fixed (wired)-broadband subscriptions (% of total Internet)International Internet bandwidth (bit/s per Internet user)Affordability
Fixed-telephone sub-basket ($ a month)Mobile-cellular sub-basket ($ a month)Fixed-broadband sub-basket ($ a month)Trade
ICT goods exports (% of total goods exports)ICT goods imports (% of total goods imports)ICT service exports (% of total service exports)Applications
Online service index (0–1, 1=highest presence)Secure Internet servers (per million people)
Lower
middle-
income
group
South Asia Lower middle income
1,127 1,237 2,50729 32 39
740 1,550 1,8936.7 7.6 6.063 .. 71
63 70 64
Yes YesMixed Mixed
C CC CC CR RA A
2.4 2.1 2.5
42.8 17.6 20.5
4.5 2.5 5.48.0 69.9 83.10.1 1.2 1.42.0a 10.9a 15.01.6a 9.5a 12.4
5.6 4.9 6.5
.. .. ..2.4a 12.6a 18.7
31 83 86
19.4 59.1 58.2
743 5,277 8,076
.. 3.2 4.9
.. 3.5 10.5
.. 6.0 20.6
1.1 2.0 4.67.6 5.3 7.2
67.2 65.9 47.1
0.38 0.54 0.320.6 3.9 4.4
India

105The Little Data Book on Information and Communication Technology 2014
2005 2012 2012
Country data
Economic and social contextPopulation (millions)Urban population (% of total)GNI per capita, World Bank Atlas method ($)GDP growth, 2000–05 and 2005–12 (avg. annual %)Adult literacy rate (% ages 15 and older) Gross primary, secondary, tertiary school enrollment (%)
Sector structureSeparate telecommunications/ICT regulatorStatus of main fixed-line telephone operatorLevel of competition (competition, partial comp., monopoly) International gateway(s) Mobile telephone service Internet serviceForeign ownership (not allowed, restricted, allowed)Reg. treatment of VoIP (banned, closed, no framework, allowed)
Sector efficiency and capacityTelecommunications revenue (% of GDP)Telecommunications investment (% of revenue)
Sector performanceAccess
Fixed-telephone subscriptions (per 100 people)Mobile-cellular telephone subscriptions (per 100 people)Fixed (wired)-broadband subscriptions (per 100 people)Households with a computer (%)Households with Internet access at home (%)Usage
Int’l. voice traffic, total (minutes/subscription/month)Domestic mobile traffic (minutes/subscription/month)Individuals using the Internet (%)Quality
Population covered by a mobile-cellular network (%)Fixed (wired)-broadband subscriptions (% of total Internet)International Internet bandwidth (bit/s per Internet user)Affordability
Fixed-telephone sub-basket ($ a month)Mobile-cellular sub-basket ($ a month)Fixed-broadband sub-basket ($ a month)Trade
ICT goods exports (% of total goods exports)ICT goods imports (% of total goods imports)ICT service exports (% of total service exports)Applications
Online service index (0–1, 1=highest presence)Secure Internet servers (per million people)
Lower
middle-
income
group
East Asia & Pacific Lower middle income
224 247 2,50746 51 39
1,230 3,420 1,8934.7 5.9 6.092 93 71
67 77 64
Yes YesMixed Mixed
C C
C C
C C
.. ..A A
2.2 1.9 2.5
28.3 18.6 20.5
6.0 15.4 5.420.9 114.2 83.1
0.0 1.2 1.43.7 15.1 15.01.0 6.5 12.4
.. .. 6.5
.. .. ..3.6 15.4 18.7
90 100 86
5.8 57.5 58.2
186 17,063 8,076
.. 4.8 4.9
.. 7.9 10.5
.. 22.2 20.6
8.1 4.1 4.63.6 7.1 7.2
29.7 38.2 47.1
0.41 0.50 0.320.5 4.1 4.4
Indonesia

106 2014 The Little Data Book on Information and Communication Technology
2005 2012 2012
Country data
Economic and social contextPopulation (millions)Urban population (% of total)GNI per capita, World Bank Atlas method ($)GDP growth, 2000–05 and 2005–12 (avg. annual %)Adult literacy rate (% ages 15 and older) Gross primary, secondary, tertiary school enrollment (%)
Sector structureSeparate telecommunications/ICT regulatorStatus of main fixed-line telephone operatorLevel of competition (competition, partial comp., monopoly) International gateway(s) Mobile telephone service Internet serviceForeign ownership (not allowed, restricted, allowed)Reg. treatment of VoIP (banned, closed, no framework, allowed)
Sector efficiency and capacityTelecommunications revenue (% of GDP)Telecommunications investment (% of revenue)
Sector performanceAccess
Fixed-telephone subscriptions (per 100 people)Mobile-cellular telephone subscriptions (per 100 people)Fixed (wired)-broadband subscriptions (per 100 people)Households with a computer (%)Households with Internet access at home (%)Usage
Int’l. voice traffic, total (minutes/subscription/month)Domestic mobile traffic (minutes/subscription/month)Individuals using the Internet (%)Quality
Population covered by a mobile-cellular network (%)Fixed (wired)-broadband subscriptions (% of total Internet)International Internet bandwidth (bit/s per Internet user)Affordability
Fixed-telephone sub-basket ($ a month)Mobile-cellular sub-basket ($ a month)Fixed-broadband sub-basket ($ a month)Trade
ICT goods exports (% of total goods exports)ICT goods imports (% of total goods imports)ICT service exports (% of total service exports)Applications
Online service index (0–1, 1=highest presence)Secure Internet servers (per million people)
Upper
middle-
income
group
Middle East & North Africa Upper middle income
70 76 2,39168 69 61
2,530 4,330 6,9695.9 3.7 6.282 85 94
64 87 76
Yes YesPublic Public
M M
P C
P C
R RB B
1.4 2.0 2.574.5 95.4 18.2
29.0 37.6 19.412.1 76.1 92.4
0.1 4.0 10.819.0a 37.0a 40.66.6a 26.5a 36.3
2.9 2.6 1.3.. 109.4 284.4
8.1a 26.0a 41.6
75 96 99
.. 33.8 95.5600 3,731 14,580
.. 0.2 9.4
.. 5.0 14.9
.. 17.8 17.8
0.0 0.0 17.64.6 4.6 14.7
.. .. 29.1
0.41 0.49 0.420.3 1.3 18.5
Iran, Islamic Rep.

107The Little Data Book on Information and Communication Technology 2014
2005 2012 2012
Country data
Economic and social contextPopulation (millions)Urban population (% of total)GNI per capita, World Bank Atlas method ($)GDP growth, 2000–05 and 2005–12 (avg. annual %)Adult literacy rate (% ages 15 and older) Gross primary, secondary, tertiary school enrollment (%)
Sector structureSeparate telecommunications/ICT regulatorStatus of main fixed-line telephone operatorLevel of competition (competition, partial comp., monopoly) International gateway(s) Mobile telephone service Internet serviceForeign ownership (not allowed, restricted, allowed)Reg. treatment of VoIP (banned, closed, no framework, allowed)
Sector efficiency and capacityTelecommunications revenue (% of GDP)Telecommunications investment (% of revenue)
Sector performanceAccess
Fixed-telephone subscriptions (per 100 people)Mobile-cellular telephone subscriptions (per 100 people)Fixed (wired)-broadband subscriptions (per 100 people)Households with a computer (%)Households with Internet access at home (%)Usage
Int’l. voice traffic, total (minutes/subscription/month)Domestic mobile traffic (minutes/subscription/month)Individuals using the Internet (%)Quality
Population covered by a mobile-cellular network (%)Fixed (wired)-broadband subscriptions (% of total Internet)International Internet bandwidth (bit/s per Internet user)Affordability
Fixed-telephone sub-basket ($ a month)Mobile-cellular sub-basket ($ a month)Fixed-broadband sub-basket ($ a month)Trade
ICT goods exports (% of total goods exports)ICT goods imports (% of total goods imports)ICT service exports (% of total service exports)Applications
Online service index (0–1, 1=highest presence)Secure Internet servers (per million people)
Upper
middle-
income
group
Middle East & North Africa Upper middle income
27 33 2,39167 66 61
1,990 6,130 6,969–1.1 6.7 6.2
74 78 94
63 .. 76
Yes YesPublic Public
.. M
.. P
.. P
.. RB B
.. .. 2.5
.. .. 18.2
4.1 5.7a 19.45.6 81.6a 92.40.0 0.0 10.85.0 23.3a 40.6
.. 15.6a 36.3
.. .. 1.3
.. .. 284.40.9a 7.1a 41.6
68 .. 99
72.1 28.5 95.5130 43 14,580
.. 0.4 9.4
.. 12.5 14.9
.. 211.3 17.8
.. .. 17.6
.. .. 14.75.0 12.0 29.1
0.27 0.29 0.420.0 0.3 18.5
Iraq

108 2014 The Little Data Book on Information and Communication Technology
2005 2012 2012
Country data
Economic and social contextPopulation (millions)Urban population (% of total)GNI per capita, World Bank Atlas method ($)GDP growth, 2000–05 and 2005–12 (avg. annual %)Adult literacy rate (% ages 15 and older) Gross primary, secondary, tertiary school enrollment (%)
Sector structureSeparate telecommunications/ICT regulatorStatus of main fixed-line telephone operatorLevel of competition (competition, partial comp., monopoly) International gateway(s) Mobile telephone service Internet serviceForeign ownership (not allowed, restricted, allowed)Reg. treatment of VoIP (banned, closed, no framework, allowed)
Sector efficiency and capacityTelecommunications revenue (% of GDP)Telecommunications investment (% of revenue)
Sector performanceAccess
Fixed-telephone subscriptions (per 100 people)Mobile-cellular telephone subscriptions (per 100 people)Fixed (wired)-broadband subscriptions (per 100 people)Households with a computer (%)Households with Internet access at home (%)Usage
Int’l. voice traffic, total (minutes/subscription/month)Domestic mobile traffic (minutes/subscription/month)Individuals using the Internet (%)Quality
Population covered by a mobile-cellular network (%)Fixed (wired)-broadband subscriptions (% of total Internet)International Internet bandwidth (bit/s per Internet user)Affordability
Fixed-telephone sub-basket ($ a month)Mobile-cellular sub-basket ($ a month)Fixed-broadband sub-basket ($ a month)Trade
ICT goods exports (% of total goods exports)ICT goods imports (% of total goods imports)ICT service exports (% of total service exports)Applications
Online service index (0–1, 1=highest presence)Secure Internet servers (per million people)
High-
income
group
High income
4 5 1,30060 63 80
42,380 39,020 38,4124.7 -0.4 1.0
.. .. ..96 106 93
Yes YesPrivate Private
C C
C C
C C
A RA A
2.4 1.6 2.710.1 23.9 17.6
49.4 43.9 43.6102.7 107.2 122.9
7.8 22.7 26.255.0 83.0 77.747.2 81.0 75.5
.. .. ..115.4 167.1 113.6
41.6 79.0 75.4
99 99 10034.8 93.1 95.9
14,211 97,097 85,990
.. 27.8 25.2
.. 46.0 20.6
.. 34.8 29.2
22.4 5.8 8.923.8 9.0 10.857.1 66.3 30.8
0.73 0.54 0.67353.9 700.5 827.6
Ireland

109The Little Data Book on Information and Communication Technology 2014
2005 2012 2012
Country data
Economic and social contextPopulation (millions)Urban population (% of total)GNI per capita, World Bank Atlas method ($)GDP growth, 2000–05 and 2005–12 (avg. annual %)Adult literacy rate (% ages 15 and older) Gross primary, secondary, tertiary school enrollment (%)
Sector structureSeparate telecommunications/ICT regulatorStatus of main fixed-line telephone operatorLevel of competition (competition, partial comp., monopoly) International gateway(s) Mobile telephone service Internet serviceForeign ownership (not allowed, restricted, allowed)Reg. treatment of VoIP (banned, closed, no framework, allowed)
Sector efficiency and capacityTelecommunications revenue (% of GDP)Telecommunications investment (% of revenue)
Sector performanceAccess
Fixed-telephone subscriptions (per 100 people)Mobile-cellular telephone subscriptions (per 100 people)Fixed (wired)-broadband subscriptions (per 100 people)Households with a computer (%)Households with Internet access at home (%)Usage
Int’l. voice traffic, total (minutes/subscription/month)Domestic mobile traffic (minutes/subscription/month)Individuals using the Internet (%)Quality
Population covered by a mobile-cellular network (%)Fixed (wired)-broadband subscriptions (% of total Internet)International Internet bandwidth (bit/s per Internet user)Affordability
Fixed-telephone sub-basket ($ a month)Mobile-cellular sub-basket ($ a month)Fixed-broadband sub-basket ($ a month)Trade
ICT goods exports (% of total goods exports)ICT goods imports (% of total goods imports)ICT service exports (% of total service exports)Applications
Online service index (0–1, 1=highest presence)Secure Internet servers (per million people)
High-
income
group
High income
0.08 0.09 1,30051 51 80
38,440 .. 38,4125.8 .. 1.0
.. .. ..
.. .. 93
.. ..
.. ..
.. ..
.. ..
.. ..
.. ..
.. ..
.. .. 2.7
.. .. 17.6
.. .. 43.6
.. .. 122.9
.. .. 26.2
.. .. 77.7
.. .. 75.5
.. .. ..
.. .. 113.6
.. .. 75.4
.. .. 100
.. .. 95.9
.. .. 85,990
.. .. 25.2
.. .. 20.6
.. .. 29.2
.. .. 8.9
.. .. 10.8
.. .. 30.8
.. .. 0.6724.9 2,220.9 827.6
Isle of Man

110 2014 The Little Data Book on Information and Communication Technology
2005 2012 2012
Country data
Economic and social contextPopulation (millions)Urban population (% of total)GNI per capita, World Bank Atlas method ($)GDP growth, 2000–05 and 2005–12 (avg. annual %)Adult literacy rate (% ages 15 and older) Gross primary, secondary, tertiary school enrollment (%)
Sector structureSeparate telecommunications/ICT regulatorStatus of main fixed-line telephone operatorLevel of competition (competition, partial comp., monopoly) International gateway(s) Mobile telephone service Internet serviceForeign ownership (not allowed, restricted, allowed)Reg. treatment of VoIP (banned, closed, no framework, allowed)
Sector efficiency and capacityTelecommunications revenue (% of GDP)Telecommunications investment (% of revenue)
Sector performanceAccess
Fixed-telephone subscriptions (per 100 people)Mobile-cellular telephone subscriptions (per 100 people)Fixed (wired)-broadband subscriptions (per 100 people)Households with a computer (%)Households with Internet access at home (%)Usage
Int’l. voice traffic, total (minutes/subscription/month)Domestic mobile traffic (minutes/subscription/month)Individuals using the Internet (%)Quality
Population covered by a mobile-cellular network (%)Fixed (wired)-broadband subscriptions (% of total Internet)International Internet bandwidth (bit/s per Internet user)Affordability
Fixed-telephone sub-basket ($ a month)Mobile-cellular sub-basket ($ a month)Fixed-broadband sub-basket ($ a month)Trade
ICT goods exports (% of total goods exports)ICT goods imports (% of total goods imports)ICT service exports (% of total service exports)Applications
Online service index (0–1, 1=highest presence)Secure Internet servers (per million people)
High-
income
group
High income
7 8 1,30092 92 80
20,140 32,030 38,4122.0 4.4 1.0
.. .. ..92 92 93
No NoMixed Mixed
.. CC CC CR RA A
4.1 2.6 2.7.. 12.0 17.6
44.5 47.0 43.6117.5 120.7 122.9
18.6 25.3 26.260.0 82.1a 77.742.0 73.4a 75.5
.. .. ..
.. .. 113.6
25.2 73.4a 75.4
99 99 10073.3 100.0 95.9
10,218 56,170 85,990
.. 18.2 25.2
.. 36.2 20.6
.. 38.3 29.2
7.5 11.7 8.99.7 8.9 10.8
55.4 59.3 30.8
0.74 0.85 0.67162.8 275.4 827.6
Israel

111The Little Data Book on Information and Communication Technology 2014
2005 2012 2012
Country data
Economic and social contextPopulation (millions)Urban population (% of total)GNI per capita, World Bank Atlas method ($)GDP growth, 2000–05 and 2005–12 (avg. annual %)Adult literacy rate (% ages 15 and older) Gross primary, secondary, tertiary school enrollment (%)
Sector structureSeparate telecommunications/ICT regulatorStatus of main fixed-line telephone operatorLevel of competition (competition, partial comp., monopoly) International gateway(s) Mobile telephone service Internet serviceForeign ownership (not allowed, restricted, allowed)Reg. treatment of VoIP (banned, closed, no framework, allowed)
Sector efficiency and capacityTelecommunications revenue (% of GDP)Telecommunications investment (% of revenue)
Sector performanceAccess
Fixed-telephone subscriptions (per 100 people)Mobile-cellular telephone subscriptions (per 100 people)Fixed (wired)-broadband subscriptions (per 100 people)Households with a computer (%)Households with Internet access at home (%)Usage
Int’l. voice traffic, total (minutes/subscription/month)Domestic mobile traffic (minutes/subscription/month)Individuals using the Internet (%)Quality
Population covered by a mobile-cellular network (%)Fixed (wired)-broadband subscriptions (% of total Internet)International Internet bandwidth (bit/s per Internet user)Affordability
Fixed-telephone sub-basket ($ a month)Mobile-cellular sub-basket ($ a month)Fixed-broadband sub-basket ($ a month)Trade
ICT goods exports (% of total goods exports)ICT goods imports (% of total goods imports)ICT service exports (% of total service exports)Applications
Online service index (0–1, 1=highest presence)Secure Internet servers (per million people)
High-
income
group
High income
59 60 1,30068 69 80
30,880 34,640 38,4120.9 -0.7 1.098 99 ..90 90 93
Yes YesMixed Mixed
.. ..C P
C C
A AA A
2.4 1.8 2.723.2 21.3 17.6
42.7 35.4 43.6121.9 159.8 122.9
11.6 22.1 26.246.0 67.0 77.738.6 63.0 75.5
.. .. ..87.7 108.8 113.6
35.0 58.0 75.4
100 99 10038.5 97.5 95.9
5,834 76,346 85,990
.. 28.8 25.2
.. 31.9 20.6
.. 28.0 29.2
3.1 2.1 8.97.1 6.2 10.8
34.2 34.9 30.8
0.67 0.58 0.6744.2 200.3 827.6
Italy

112 2014 The Little Data Book on Information and Communication Technology
2005 2012 2012
Upper
middle-
income
groupCountry data
Economic and social contextPopulation (millions)Urban population (% of total)GNI per capita, World Bank Atlas method ($)GDP growth, 2000–05 and 2005–12 (avg. annual %)Adult literacy rate (% ages 15 and older) Gross primary, secondary, tertiary school enrollment (%)
Sector structureSeparate telecommunications/ICT regulatorStatus of main fixed-line telephone operatorLevel of competition (competition, partial comp., monopoly) International gateway(s) Mobile telephone service Internet serviceForeign ownership (not allowed, restricted, allowed)Reg. treatment of VoIP (banned, closed, no framework, allowed)
Sector efficiency and capacityTelecommunications revenue (% of GDP)Telecommunications investment (% of revenue)
Sector performanceAccess
Fixed-telephone subscriptions (per 100 people)Mobile-cellular telephone subscriptions (per 100 people)Fixed (wired)-broadband subscriptions (per 100 people)Households with a computer (%)Households with Internet access at home (%)Usage
Int’l. voice traffic, total (minutes/subscription/month)Domestic mobile traffic (minutes/subscription/month)Individuals using the Internet (%)Quality
Population covered by a mobile-cellular network (%)Fixed (wired)-broadband subscriptions (% of total Internet)International Internet bandwidth (bit/s per Internet user)Affordability
Fixed-telephone sub-basket ($ a month)Mobile-cellular sub-basket ($ a month)Fixed-broadband sub-basket ($ a month)Trade
ICT goods exports (% of total goods exports)ICT goods imports (% of total goods imports)ICT service exports (% of total service exports)Applications
Online service index (0–1, 1=highest presence)Secure Internet servers (per million people)
Latin America & Caribbean Upper middle income
3 3 2,39152 52 61
.. 5,130 6,969
.. –1.0 6.2
.. 87 94
80 .. 76
Yes YesMixed Mixed
C CC CC CA A
No A
6.6 4.2 2.519.0 23.2 18.2
11.9 9.6 19.473.9 96.3 92.4
1.7 4.3 10.812.7a 32.6a 40.6
5.1a 23.0a 36.3
41.3 80.8 1.333.5 194.7 284.412.8a 46.5a 41.6
95 .. 99
96.4 97.9 95.55,826 20,193 14,580
.. 15.0 9.4
.. 10.5 14.9
.. 29.2 17.8
0.3 0.4 17.65.0 2.5 14.78.3 9.4 29.1
0.47 0.31 0.4214.4 44.3 18.5
Jamaica

113The Little Data Book on Information and Communication Technology 2014
2005 2012 2012
High-
income
groupCountry data
Economic and social contextPopulation (millions)Urban population (% of total)GNI per capita, World Bank Atlas method ($)GDP growth, 2000–05 and 2005–12 (avg. annual %)Adult literacy rate (% ages 15 and older) Gross primary, secondary, tertiary school enrollment (%)
Sector structureSeparate telecommunications/ICT regulatorStatus of main fixed-line telephone operatorLevel of competition (competition, partial comp., monopoly) International gateway(s) Mobile telephone service Internet serviceForeign ownership (not allowed, restricted, allowed)Reg. treatment of VoIP (banned, closed, no framework, allowed)
Sector efficiency and capacityTelecommunications revenue (% of GDP)Telecommunications investment (% of revenue)
Sector performanceAccess
Fixed-telephone subscriptions (per 100 people)Mobile-cellular telephone subscriptions (per 100 people)Fixed (wired)-broadband subscriptions (per 100 people)Households with a computer (%)Households with Internet access at home (%)Usage
Int’l. voice traffic, total (minutes/subscription/month)Domestic mobile traffic (minutes/subscription/month)Individuals using the Internet (%)Quality
Population covered by a mobile-cellular network (%)Fixed (wired)-broadband subscriptions (% of total Internet)International Internet bandwidth (bit/s per Internet user)Affordability
Fixed-telephone sub-basket ($ a month)Mobile-cellular sub-basket ($ a month)Fixed-broadband sub-basket ($ a month)Trade
ICT goods exports (% of total goods exports)ICT goods imports (% of total goods imports)ICT service exports (% of total service exports)Applications
Online service index (0–1, 1=highest presence)Secure Internet servers (per million people)
High income
128 128 1,30086 92 80
39,140 47,870 38,4121.3 0.1 1.0
.. .. ..86 89 93
No NoPrivate Private
C CC CC CA AA A
2.9 2.8 2.714.3 10.8 17.6
45.7 50.5 43.676.0 110.9 122.918.4 27.7 26.280.5 80.0 77.757.0 86.0 75.5
23.6 1.9 ..97.6 90.4 113.6
66.9 79.1 75.4
99 100 10044.0 89.9 95.9
2,589 32,827 85,990
.. 29.0 25.2
.. 30.7 20.6
.. 26.6 29.2
16.9 9.1 8.913.5 10.2 10.819.8 20.7 30.8
0.77 0.86 0.67257.7 741.6 827.6
Japan

114 2014 The Little Data Book on Information and Communication Technology
2005 2012 2012
Country data
Economic and social contextPopulation (millions)Urban population (% of total)GNI per capita, World Bank Atlas method ($)GDP growth, 2000–05 and 2005–12 (avg. annual %)Adult literacy rate (% ages 15 and older) Gross primary, secondary, tertiary school enrollment (%)
Sector structureSeparate telecommunications/ICT regulatorStatus of main fixed-line telephone operatorLevel of competition (competition, partial comp., monopoly) International gateway(s) Mobile telephone service Internet serviceForeign ownership (not allowed, restricted, allowed)Reg. treatment of VoIP (banned, closed, no framework, allowed)
Sector efficiency and capacityTelecommunications revenue (% of GDP)Telecommunications investment (% of revenue)
Sector performanceAccess
Fixed-telephone subscriptions (per 100 people)Mobile-cellular telephone subscriptions (per 100 people)Fixed (wired)-broadband subscriptions (per 100 people)Households with a computer (%)Households with Internet access at home (%)Usage
Int’l. voice traffic, total (minutes/subscription/month)Domestic mobile traffic (minutes/subscription/month)Individuals using the Internet (%)Quality
Population covered by a mobile-cellular network (%)Fixed (wired)-broadband subscriptions (% of total Internet)International Internet bandwidth (bit/s per Internet user)Affordability
Fixed-telephone sub-basket ($ a month)Mobile-cellular sub-basket ($ a month)Fixed-broadband sub-basket ($ a month)Trade
ICT goods exports (% of total goods exports)ICT goods imports (% of total goods imports)ICT service exports (% of total service exports)Applications
Online service index (0–1, 1=highest presence)Secure Internet servers (per million people)
Upper
middle-
income
group
Middle East & North Africa Upper middle income
5 6 2,39181 83 61
2,490 4,670 6,9696.3 5.2 6.291 96 94
83 79 76
Yes YesMixed Mixed
C C
P P
C C
A AA A
8.5 5.4 2.520.5 12.0 18.2
12.0 6.2 19.459.9 128.2 92.4
0.4 2.8 10.823.0 54.6a 40.6
8.0 43.6a 36.3
15.4 16.0 1.3111.8 297.2 284.4
12.9 41.0a 41.6
99 99 99
12.0 99.6 95.5457 5,219 14,580
.. 9.4 9.4
.. 7.8 14.9
.. 18.7 17.8
3.2 1.5 17.66.9 4.1 14.7
.. .. 29.1
0.55 0.39 0.423.7 25.8 18.5
Jordan

115The Little Data Book on Information and Communication Technology 2014
2005 2012 2012
Country data
Economic and social contextPopulation (millions)Urban population (% of total)GNI per capita, World Bank Atlas method ($)GDP growth, 2000–05 and 2005–12 (avg. annual %)Adult literacy rate (% ages 15 and older) Gross primary, secondary, tertiary school enrollment (%)
Sector structureSeparate telecommunications/ICT regulatorStatus of main fixed-line telephone operatorLevel of competition (competition, partial comp., monopoly) International gateway(s) Mobile telephone service Internet serviceForeign ownership (not allowed, restricted, allowed)Reg. treatment of VoIP (banned, closed, no framework, allowed)
Sector efficiency and capacityTelecommunications revenue (% of GDP)Telecommunications investment (% of revenue)
Sector performanceAccess
Fixed-telephone subscriptions (per 100 people)Mobile-cellular telephone subscriptions (per 100 people)Fixed (wired)-broadband subscriptions (per 100 people)Households with a computer (%)Households with Internet access at home (%)Usage
Int’l. voice traffic, total (minutes/subscription/month)Domestic mobile traffic (minutes/subscription/month)Individuals using the Internet (%)Quality
Population covered by a mobile-cellular network (%)Fixed (wired)-broadband subscriptions (% of total Internet)International Internet bandwidth (bit/s per Internet user)Affordability
Fixed-telephone sub-basket ($ a month)Mobile-cellular sub-basket ($ a month)Fixed-broadband sub-basket ($ a month)Trade
ICT goods exports (% of total goods exports)ICT goods imports (% of total goods imports)ICT service exports (% of total service exports)Applications
Online service index (0–1, 1=highest presence)Secure Internet servers (per million people)
Upper
middle-
income
group
Europe & Central Asia Upper middle income
15 17 2,39155 54 61
2,930 9,780 6,96910.1 5.7 6.2
.. 100 94
92 92 76
Yes NoMixed Mixed
.. C
C P
.. C
.. RNo A
2.8 2.0 2.55.3 18.0 18.2
18.0 26.8 19.435.8 185.8 92.4
0.0 9.8 10.815.6a 63.0a 40.6
5.0 52.6a 36.3
7.2 .. 1.341.1 97.0 284.4
3.0 53.3a 41.6
81 95 99
1.0 96.5 95.5108 32,028 14,580
.. 3.2 9.4
.. 11.3 14.9
.. 13.2 17.8
0.1 0.4 17.64.0 5.8 14.7
11.2 10.6 29.1
0.47 0.78 0.420.9 9.5 18.5
Kazakhstan

116 2014 The Little Data Book on Information and Communication Technology
2005 2012 2012
Country data
Economic and social contextPopulation (millions)Urban population (% of total)GNI per capita, World Bank Atlas method ($)GDP growth, 2000–05 and 2005–12 (avg. annual %)Adult literacy rate (% ages 15 and older) Gross primary, secondary, tertiary school enrollment (%)
Sector structureSeparate telecommunications/ICT regulatorStatus of main fixed-line telephone operatorLevel of competition (competition, partial comp., monopoly) International gateway(s) Mobile telephone service Internet serviceForeign ownership (not allowed, restricted, allowed)Reg. treatment of VoIP (banned, closed, no framework, allowed)
Sector efficiency and capacityTelecommunications revenue (% of GDP)Telecommunications investment (% of revenue)
Sector performanceAccess
Fixed-telephone subscriptions (per 100 people)Mobile-cellular telephone subscriptions (per 100 people)Fixed (wired)-broadband subscriptions (per 100 people)Households with a computer (%)Households with Internet access at home (%)Usage
Int’l. voice traffic, total (minutes/subscription/month)Domestic mobile traffic (minutes/subscription/month)Individuals using the Internet (%)Quality
Population covered by a mobile-cellular network (%)Fixed (wired)-broadband subscriptions (% of total Internet)International Internet bandwidth (bit/s per Internet user)Affordability
Fixed-telephone sub-basket ($ a month)Mobile-cellular sub-basket ($ a month)Fixed-broadband sub-basket ($ a month)Trade
ICT goods exports (% of total goods exports)ICT goods imports (% of total goods imports)ICT service exports (% of total service exports)Applications
Online service index (0–1, 1=highest presence)Secure Internet servers (per million people)
Low-
income
group
Sub-Saharan Africa Low income
36 43 84622 24 28
520 860 5903.4 4.3 5.972 .. 61
59 67 60
Yes YesPublic Mixed
P CP CC CR RA A
4.7 4.1 5.0
76.3 48.0 ..
0.8 0.6 1.012.9 71.2 47.2
0.0 0.1 0.22.6 10.8a 4.21.2 11.5a 3.4
3.8 3.8 ..12.7 78.1 70.1
3.1 32.1a 6.2
62 89 ..6.7 61.6 30.9
102 23,715 9,141
.. 12.6 8.9
.. 3.7 11.9
.. 33.7 46.9
0.2 1.4 ..4.1 7.2 ..
.. .. ..
0.35 0.43 0.200.3 4.8 1.1
Kenya

117The Little Data Book on Information and Communication Technology 2014
2005 2012 2012
Country data
Economic and social contextPopulation (millions)Urban population (% of total)GNI per capita, World Bank Atlas method ($)GDP growth, 2000–05 and 2005–12 (avg. annual %)Adult literacy rate (% ages 15 and older) Gross primary, secondary, tertiary school enrollment (%)
Sector structureSeparate telecommunications/ICT regulatorStatus of main fixed-line telephone operatorLevel of competition (competition, partial comp., monopoly) International gateway(s) Mobile telephone service Internet serviceForeign ownership (not allowed, restricted, allowed)Reg. treatment of VoIP (banned, closed, no framework, allowed)
Sector efficiency and capacityTelecommunications revenue (% of GDP)Telecommunications investment (% of revenue)
Sector performanceAccess
Fixed-telephone subscriptions (per 100 people)Mobile-cellular telephone subscriptions (per 100 people)Fixed (wired)-broadband subscriptions (per 100 people)Households with a computer (%)Households with Internet access at home (%)Usage
Int’l. voice traffic, total (minutes/subscription/month)Domestic mobile traffic (minutes/subscription/month)Individuals using the Internet (%)Quality
Population covered by a mobile-cellular network (%)Fixed (wired)-broadband subscriptions (% of total Internet)International Internet bandwidth (bit/s per Internet user)Affordability
Fixed-telephone sub-basket ($ a month)Mobile-cellular sub-basket ($ a month)Fixed-broadband sub-basket ($ a month)Trade
ICT goods exports (% of total goods exports)ICT goods imports (% of total goods imports)ICT service exports (% of total service exports)Applications
Online service index (0–1, 1=highest presence)Secure Internet servers (per million people)
Lower
middle-
income
group
East Asia & Pacific Lower middle income
0.09 0.10 2,50744 44 39
1,800 2,520 1,8932.0 1.5 6.0
.. .. 71
77 75 64
No YesPublic Public
.. ..
.. P
.. C
.. ..No No
.. .. 2.5
.. .. 20.5
4.6 8.9 5.40.7 15.9 83.10.4 1.0 1.46.0 .. 15.02.5 .. 12.4
.. .. 6.5
.. .. ..4.0a 10.7a 18.7
.. .. 86
.. .. 58.2
.. 4,155 8,076
.. 12.9 4.9
.. 18.1 10.5
.. 428.3 20.6
0.9 1.9 4.61.3 1.5 7.2
.. .. 47.1
0.00 0.07 0.32.. 9.8 4.4
Kiribati

118 2014 The Little Data Book on Information and Communication Technology
2005 2012 2012
Country data
Economic and social contextPopulation (millions)Urban population (% of total)GNI per capita, World Bank Atlas method ($)GDP growth, 2000–05 and 2005–12 (avg. annual %)Adult literacy rate (% ages 15 and older) Gross primary, secondary, tertiary school enrollment (%)
Sector structureSeparate telecommunications/ICT regulatorStatus of main fixed-line telephone operatorLevel of competition (competition, partial comp., monopoly) International gateway(s) Mobile telephone service Internet serviceForeign ownership (not allowed, restricted, allowed)Reg. treatment of VoIP (banned, closed, no framework, allowed)
Sector efficiency and capacityTelecommunications revenue (% of GDP)Telecommunications investment (% of revenue)
Sector performanceAccess
Fixed-telephone subscriptions (per 100 people)Mobile-cellular telephone subscriptions (per 100 people)Fixed (wired)-broadband subscriptions (per 100 people)Households with a computer (%)Households with Internet access at home (%)Usage
Int’l. voice traffic, total (minutes/subscription/month)Domestic mobile traffic (minutes/subscription/month)Individuals using the Internet (%)Quality
Population covered by a mobile-cellular network (%)Fixed (wired)-broadband subscriptions (% of total Internet)International Internet bandwidth (bit/s per Internet user)Affordability
Fixed-telephone sub-basket ($ a month)Mobile-cellular sub-basket ($ a month)Fixed-broadband sub-basket ($ a month)Trade
ICT goods exports (% of total goods exports)ICT goods imports (% of total goods imports)ICT service exports (% of total service exports)Applications
Online service index (0–1, 1=highest presence)Secure Internet servers (per million people)
Low-
income
group
East Asia & Pacific Low income
24 25 84660 60 28
.. .. 590
.. .. 5.9
.. 100 61
.. .. 60
No NoPublic Public
.. ..
.. ..
.. ..
.. NoB B
.. .. 5.0
.. .. ..
4.2 4.8 1.00.0 6.9 47.20.0 0.0 0.2
.. .. 4.2
.. .. 3.4
.. .. ..
.. .. 70.10.0 0.0a 6.2
0 .. .... .. 30.9
.. .. 9,141
.. .. 8.9
.. .. 11.9
.. .. 46.9
.. .. ..
.. .. ..
.. .. ..
0.00 0.12 0.20.. 0.0 1.1
Korea, Dem. People’s Rep.

119The Little Data Book on Information and Communication Technology 2014
2005 2012 2012
Country data
Economic and social contextPopulation (millions)Urban population (% of total)GNI per capita, World Bank Atlas method ($)GDP growth, 2000–05 and 2005–12 (avg. annual %)Adult literacy rate (% ages 15 and older) Gross primary, secondary, tertiary school enrollment (%)
Sector structureSeparate telecommunications/ICT regulatorStatus of main fixed-line telephone operatorLevel of competition (competition, partial comp., monopoly) International gateway(s) Mobile telephone service Internet serviceForeign ownership (not allowed, restricted, allowed)Reg. treatment of VoIP (banned, closed, no framework, allowed)
Sector efficiency and capacityTelecommunications revenue (% of GDP)Telecommunications investment (% of revenue)
Sector performanceAccess
Fixed-telephone subscriptions (per 100 people)Mobile-cellular telephone subscriptions (per 100 people)Fixed (wired)-broadband subscriptions (per 100 people)Households with a computer (%)Households with Internet access at home (%)Usage
Int’l. voice traffic, total (minutes/subscription/month)Domestic mobile traffic (minutes/subscription/month)Individuals using the Internet (%)Quality
Population covered by a mobile-cellular network (%)Fixed (wired)-broadband subscriptions (% of total Internet)International Internet bandwidth (bit/s per Internet user)Affordability
Fixed-telephone sub-basket ($ a month)Mobile-cellular sub-basket ($ a month)Fixed-broadband sub-basket ($ a month)Trade
ICT goods exports (% of total goods exports)ICT goods imports (% of total goods imports)ICT service exports (% of total service exports)Applications
Online service index (0–1, 1=highest presence)Secure Internet servers (per million people)
High-
income
group
High income
48 50 1,30081 83 80
16,900 22,670 38,4124.5 3.4 1.0
.. .. ..98 100 93
Yes YesPrivate Private
.. C
C P
C C
R RA A
4.7 4.3 2.714.4 15.7 17.6
50.8 61.4 43.681.5 109.4 122.925.9 37.2 26.279.7a 82.3 77.792.7 97.4 75.5
3.2 3.2 ..175.8 163.0 113.6
73.5 84.1 75.4
80 100 100100.0 100.0 95.9
1,440 25,815 85,990
.. 6.1 25.2
.. 7.4 20.6
.. 27.1 29.2
30.0 17.2 8.915.2 9.8 10.819.9 21.6 30.8
0.83 1.00 0.6720.0 1,999.1 827.6
Korea, Rep.
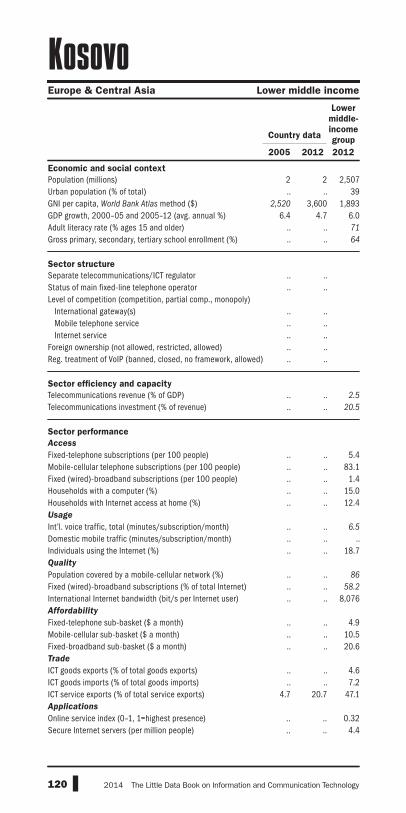
120 2014 The Little Data Book on Information and Communication Technology
2005 2012 2012
Country data
Economic and social contextPopulation (millions)Urban population (% of total)GNI per capita, World Bank Atlas method ($)GDP growth, 2000–05 and 2005–12 (avg. annual %)Adult literacy rate (% ages 15 and older) Gross primary, secondary, tertiary school enrollment (%)
Sector structureSeparate telecommunications/ICT regulatorStatus of main fixed-line telephone operatorLevel of competition (competition, partial comp., monopoly) International gateway(s) Mobile telephone service Internet serviceForeign ownership (not allowed, restricted, allowed)Reg. treatment of VoIP (banned, closed, no framework, allowed)
Sector efficiency and capacityTelecommunications revenue (% of GDP)Telecommunications investment (% of revenue)
Sector performanceAccess
Fixed-telephone subscriptions (per 100 people)Mobile-cellular telephone subscriptions (per 100 people)Fixed (wired)-broadband subscriptions (per 100 people)Households with a computer (%)Households with Internet access at home (%)Usage
Int’l. voice traffic, total (minutes/subscription/month)Domestic mobile traffic (minutes/subscription/month)Individuals using the Internet (%)Quality
Population covered by a mobile-cellular network (%)Fixed (wired)-broadband subscriptions (% of total Internet)International Internet bandwidth (bit/s per Internet user)Affordability
Fixed-telephone sub-basket ($ a month)Mobile-cellular sub-basket ($ a month)Fixed-broadband sub-basket ($ a month)Trade
ICT goods exports (% of total goods exports)ICT goods imports (% of total goods imports)ICT service exports (% of total service exports)Applications
Online service index (0–1, 1=highest presence)Secure Internet servers (per million people)
Lower
middle-
income
group
Europe & Central Asia Lower middle income
2 2 2,507.. .. 39
2,520 3,600 1,8936.4 4.7 6.0
.. .. 71
.. .. 64
.. ..
.. ..
.. ..
.. ..
.. ..
.. ..
.. ..
.. .. 2.5
.. .. 20.5
.. .. 5.4
.. .. 83.1
.. .. 1.4
.. .. 15.0
.. .. 12.4
.. .. 6.5
.. .. ..
.. .. 18.7
.. .. 86
.. .. 58.2
.. .. 8,076
.. .. 4.9
.. .. 10.5
.. .. 20.6
.. .. 4.6
.. .. 7.24.7 20.7 47.1
.. .. 0.32
.. .. 4.4
Kosovo

121The Little Data Book on Information and Communication Technology 2014
2005 2012 2012
Country data
Economic and social contextPopulation (millions)Urban population (% of total)GNI per capita, World Bank Atlas method ($)GDP growth, 2000–05 and 2005–12 (avg. annual %)Adult literacy rate (% ages 15 and older) Gross primary, secondary, tertiary school enrollment (%)
Sector structureSeparate telecommunications/ICT regulatorStatus of main fixed-line telephone operatorLevel of competition (competition, partial comp., monopoly) International gateway(s) Mobile telephone service Internet serviceForeign ownership (not allowed, restricted, allowed)Reg. treatment of VoIP (banned, closed, no framework, allowed)
Sector efficiency and capacityTelecommunications revenue (% of GDP)Telecommunications investment (% of revenue)
Sector performanceAccess
Fixed-telephone subscriptions (per 100 people)Mobile-cellular telephone subscriptions (per 100 people)Fixed (wired)-broadband subscriptions (per 100 people)Households with a computer (%)Households with Internet access at home (%)Usage
Int’l. voice traffic, total (minutes/subscription/month)Domestic mobile traffic (minutes/subscription/month)Individuals using the Internet (%)Quality
Population covered by a mobile-cellular network (%)Fixed (wired)-broadband subscriptions (% of total Internet)International Internet bandwidth (bit/s per Internet user)Affordability
Fixed-telephone sub-basket ($ a month)Mobile-cellular sub-basket ($ a month)Fixed-broadband sub-basket ($ a month)Trade
ICT goods exports (% of total goods exports)ICT goods imports (% of total goods imports)ICT service exports (% of total service exports)Applications
Online service index (0–1, 1=highest presence)Secure Internet servers (per million people)
High-
income
group
High income
2 3 1,30098 98 80
34,160 44,880 38,4129.0 1.4 1.093 94 ..86 .. 93
No NoPublic Public
M M
P M
P P
R RB B
3.5 .. 2.727.0 .. 17.6
22.0 15.7 43.660.2 156.9 122.9
1.1 1.4 26.232.0 75.0a 77.727.0 65.2a 75.5
.. .. ..
.. .. 113.6
25.9 79.2a 75.4
100 100a 1008.8 .. 95.9
1,481 5,444 85,990
.. 8.6 25.2
.. 7.8 20.6
.. 19.2 29.2
0.2 0.3 8.95.0 6.4 10.8
52.2 34.5 30.8
0.52 0.58 0.6734.8 184.9 827.6
Kuwait

122 2014 The Little Data Book on Information and Communication Technology
2005 2012 2012
Country data
Economic and social contextPopulation (millions)Urban population (% of total)GNI per capita, World Bank Atlas method ($)GDP growth, 2000–05 and 2005–12 (avg. annual %)Adult literacy rate (% ages 15 and older) Gross primary, secondary, tertiary school enrollment (%)
Sector structureSeparate telecommunications/ICT regulatorStatus of main fixed-line telephone operatorLevel of competition (competition, partial comp., monopoly) International gateway(s) Mobile telephone service Internet serviceForeign ownership (not allowed, restricted, allowed)Reg. treatment of VoIP (banned, closed, no framework, allowed)
Sector efficiency and capacityTelecommunications revenue (% of GDP)Telecommunications investment (% of revenue)
Sector performanceAccess
Fixed-telephone subscriptions (per 100 people)Mobile-cellular telephone subscriptions (per 100 people)Fixed (wired)-broadband subscriptions (per 100 people)Households with a computer (%)Households with Internet access at home (%)Usage
Int’l. voice traffic, total (minutes/subscription/month)Domestic mobile traffic (minutes/subscription/month)Individuals using the Internet (%)Quality
Population covered by a mobile-cellular network (%)Fixed (wired)-broadband subscriptions (% of total Internet)International Internet bandwidth (bit/s per Internet user)Affordability
Fixed-telephone sub-basket ($ a month)Mobile-cellular sub-basket ($ a month)Fixed-broadband sub-basket ($ a month)Trade
ICT goods exports (% of total goods exports)ICT goods imports (% of total goods imports)ICT service exports (% of total service exports)Applications
Online service index (0–1, 1=highest presence)Secure Internet servers (per million people)
Low-
income
group
Europe & Central Asia Low income
5 6 84635 35 28
450 990 5904.1 4.2 5.9
.. 99 61
79 75 60
Yes YesMixed Mixed
C C
C C
C C
R ANo No
4.5 6.7 5.0
3.2 18.6 ..
8.7 8.9 1.010.7 124.2 47.2
0.0 0.9 0.21.0a 6.9a 4.20.8a 6.3a 3.4
.. 14.8 ..
.. 394.7 70.110.5 21.7a 6.2
42 98 ..16.2 33.6 30.9
516 3,875 9,141
.. 1.4 8.9
.. 5.7 11.9
.. 12.5 46.9
0.1 0.1 ..3.3 2.3 ..
26.4 15.9 ..
0.42 0.42 0.200.6 5.5 1.1
Kyrgyz Republic

123The Little Data Book on Information and Communication Technology 2014
2005 2012 2012
Country data
Economic and social contextPopulation (millions)Urban population (% of total)GNI per capita, World Bank Atlas method ($)GDP growth, 2000–05 and 2005–12 (avg. annual %)Adult literacy rate (% ages 15 and older) Gross primary, secondary, tertiary school enrollment (%)
Sector structureSeparate telecommunications/ICT regulatorStatus of main fixed-line telephone operatorLevel of competition (competition, partial comp., monopoly) International gateway(s) Mobile telephone service Internet serviceForeign ownership (not allowed, restricted, allowed)Reg. treatment of VoIP (banned, closed, no framework, allowed)
Sector efficiency and capacityTelecommunications revenue (% of GDP)Telecommunications investment (% of revenue)
Sector performanceAccess
Fixed-telephone subscriptions (per 100 people)Mobile-cellular telephone subscriptions (per 100 people)Fixed (wired)-broadband subscriptions (per 100 people)Households with a computer (%)Households with Internet access at home (%)Usage
Int’l. voice traffic, total (minutes/subscription/month)Domestic mobile traffic (minutes/subscription/month)Individuals using the Internet (%)Quality
Population covered by a mobile-cellular network (%)Fixed (wired)-broadband subscriptions (% of total Internet)International Internet bandwidth (bit/s per Internet user)Affordability
Fixed-telephone sub-basket ($ a month)Mobile-cellular sub-basket ($ a month)Fixed-broadband sub-basket ($ a month)Trade
ICT goods exports (% of total goods exports)ICT goods imports (% of total goods imports)ICT service exports (% of total service exports)Applications
Online service index (0–1, 1=highest presence)Secure Internet servers (per million people)
Lower
middle-
income
group
East Asia & Pacific Lower middle income
6 7 2,50727 35 39
450 1,270 1,8936.2 8.0 6.073 .. 71
58 60 64
No YesPublic Mixed
M M
P P
P P
R RB No
1.7 1.7 2.5
63.0 8.9 20.5
1.6 1.8 5.411.4 64.7 83.1
0.0 0.1 1.42.0 8.7a 15.01.0 5.1a 12.4
.. 5.9 6.5
59.6 11.2 ..0.9 10.7a 18.7
55 72 86
5.0 27.6 58.2
406 9,397 8,076
.. 4.6 4.9
.. 6.2 10.5
.. 97.2 20.6
.. .. 4.6
.. .. 7.2
.. .. 47.1
0.24 0.22 0.320.3 1.0 4.4
Lao PDR

124 2014 The Little Data Book on Information and Communication Technology
2005 2012 2012
High-
income
groupCountry data
Economic and social contextPopulation (millions)Urban population (% of total)GNI per capita, World Bank Atlas method ($)GDP growth, 2000–05 and 2005–12 (avg. annual %)Adult literacy rate (% ages 15 and older) Gross primary, secondary, tertiary school enrollment (%)
Sector structureSeparate telecommunications/ICT regulatorStatus of main fixed-line telephone operatorLevel of competition (competition, partial comp., monopoly) International gateway(s) Mobile telephone service Internet serviceForeign ownership (not allowed, restricted, allowed)Reg. treatment of VoIP (banned, closed, no framework, allowed)
Sector efficiency and capacityTelecommunications revenue (% of GDP)Telecommunications investment (% of revenue)
Sector performanceAccess
Fixed-telephone subscriptions (per 100 people)Mobile-cellular telephone subscriptions (per 100 people)Fixed (wired)-broadband subscriptions (per 100 people)Households with a computer (%)Households with Internet access at home (%)Usage
Int’l. voice traffic, total (minutes/subscription/month)Domestic mobile traffic (minutes/subscription/month)Individuals using the Internet (%)Quality
Population covered by a mobile-cellular network (%)Fixed (wired)-broadband subscriptions (% of total Internet)International Internet bandwidth (bit/s per Internet user)Affordability
Fixed-telephone sub-basket ($ a month)Mobile-cellular sub-basket ($ a month)Fixed-broadband sub-basket ($ a month)Trade
ICT goods exports (% of total goods exports)ICT goods imports (% of total goods imports)ICT service exports (% of total service exports)Applications
Online service index (0–1, 1=highest presence)Secure Internet servers (per million people)
High income
2 2 1,30068 68 80
7,000 14,060 38,4128.0 -1.1 1.0
100 100 ..95 89 93
Yes YesMixed Mixed
.. ..C PC CA AA A
4.0 3.6 2.7.. 25.9 17.6
32.8 24.3a 43.684.0 112.1a 122.9
2.7 23.3a 26.232.0 70.0 77.730.5 69.0 75.5
3.7 .. ..72.2 .. 113.6
46.0 74.0 75.4
98 .. 10083.2 .. 95.9
2,713 59,027 85,990
.. 10.9 25.2
.. 13.3 20.6
.. 13.8 29.2
2.0 6.1 8.95.8 6.0 10.8
15.9 20.5 30.8
0.59 0.59 0.6738.9 266.1 827.6
Latvia
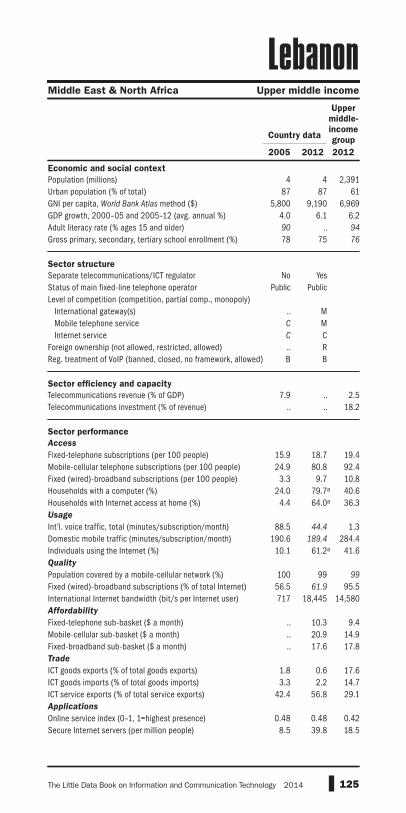
125The Little Data Book on Information and Communication Technology 2014
2005 2012 2012
Upper
middle-
income
groupCountry data
Economic and social contextPopulation (millions)Urban population (% of total)GNI per capita, World Bank Atlas method ($)GDP growth, 2000–05 and 2005–12 (avg. annual %)Adult literacy rate (% ages 15 and older) Gross primary, secondary, tertiary school enrollment (%)
Sector structureSeparate telecommunications/ICT regulatorStatus of main fixed-line telephone operatorLevel of competition (competition, partial comp., monopoly) International gateway(s) Mobile telephone service Internet serviceForeign ownership (not allowed, restricted, allowed)Reg. treatment of VoIP (banned, closed, no framework, allowed)
Sector efficiency and capacityTelecommunications revenue (% of GDP)Telecommunications investment (% of revenue)
Sector performanceAccess
Fixed-telephone subscriptions (per 100 people)Mobile-cellular telephone subscriptions (per 100 people)Fixed (wired)-broadband subscriptions (per 100 people)Households with a computer (%)Households with Internet access at home (%)Usage
Int’l. voice traffic, total (minutes/subscription/month)Domestic mobile traffic (minutes/subscription/month)Individuals using the Internet (%)Quality
Population covered by a mobile-cellular network (%)Fixed (wired)-broadband subscriptions (% of total Internet)International Internet bandwidth (bit/s per Internet user)Affordability
Fixed-telephone sub-basket ($ a month)Mobile-cellular sub-basket ($ a month)Fixed-broadband sub-basket ($ a month)Trade
ICT goods exports (% of total goods exports)ICT goods imports (% of total goods imports)ICT service exports (% of total service exports)Applications
Online service index (0–1, 1=highest presence)Secure Internet servers (per million people)
Middle East & North Africa Upper middle income
4 4 2,39187 87 61
5,800 9,190 6,9694.0 6.1 6.290 .. 94
78 75 76
No YesPublic Public
.. MC MC C.. RB B
7.9 .. 2.5.. .. 18.2
15.9 18.7 19.424.9 80.8 92.4
3.3 9.7 10.824.0 79.7a 40.6
4.4 64.0a 36.3
88.5 44.4 1.3190.6 189.4 284.4
10.1 61.2a 41.6
100 99 99
56.5 61.9 95.5717 18,445 14,580
.. 10.3 9.4
.. 20.9 14.9
.. 17.6 17.8
1.8 0.6 17.63.3 2.2 14.7
42.4 56.8 29.1
0.48 0.48 0.428.5 39.8 18.5
Lebanon

126 2014 The Little Data Book on Information and Communication Technology
2005 2012 2012
Country data
Economic and social contextPopulation (millions)Urban population (% of total)GNI per capita, World Bank Atlas method ($)GDP growth, 2000–05 and 2005–12 (avg. annual %)Adult literacy rate (% ages 15 and older) Gross primary, secondary, tertiary school enrollment (%)
Sector structureSeparate telecommunications/ICT regulatorStatus of main fixed-line telephone operatorLevel of competition (competition, partial comp., monopoly) International gateway(s) Mobile telephone service Internet serviceForeign ownership (not allowed, restricted, allowed)Reg. treatment of VoIP (banned, closed, no framework, allowed)
Sector efficiency and capacityTelecommunications revenue (% of GDP)Telecommunications investment (% of revenue)
Sector performanceAccess
Fixed-telephone subscriptions (per 100 people)Mobile-cellular telephone subscriptions (per 100 people)Fixed (wired)-broadband subscriptions (per 100 people)Households with a computer (%)Households with Internet access at home (%)Usage
Int’l. voice traffic, total (minutes/subscription/month)Domestic mobile traffic (minutes/subscription/month)Individuals using the Internet (%)Quality
Population covered by a mobile-cellular network (%)Fixed (wired)-broadband subscriptions (% of total Internet)International Internet bandwidth (bit/s per Internet user)Affordability
Fixed-telephone sub-basket ($ a month)Mobile-cellular sub-basket ($ a month)Fixed-broadband sub-basket ($ a month)Trade
ICT goods exports (% of total goods exports)ICT goods imports (% of total goods imports)ICT service exports (% of total service exports)Applications
Online service index (0–1, 1=highest presence)Secure Internet servers (per million people)
Lower
middle-
income
group
Sub-Saharan Africa Lower middle income
2 2 2,50723 28 39
910 1,380 1,8932.8 5.0 6.086 76 71
64 65 64
Yes YesMixed Mixed
M CC CC CA AB No
0.6 4.5 2.5
20.9 12.2 20.5
2.5 2.5 5.413.0 75.3 83.1
0.0 0.1 1.43.0 5.9a 15.00.6 3.7a 12.4
.. 31.1 6.5
26.2 21.4 ..2.6a 4.6a 18.7
29 81 86
1.8 4.1 58.2
86 6,330 8,076
.. 13.8 4.9
.. 19.8 10.5
.. 85.4 20.6
3.3 5.8 4.61.1 2.7 7.2
11.9 18.0 47.1
0.38 0.30 0.320.5 0.5 4.4
Lesotho

127The Little Data Book on Information and Communication Technology 2014
2005 2012 2012
Country data
Economic and social contextPopulation (millions)Urban population (% of total)GNI per capita, World Bank Atlas method ($)GDP growth, 2000–05 and 2005–12 (avg. annual %)Adult literacy rate (% ages 15 and older) Gross primary, secondary, tertiary school enrollment (%)
Sector structureSeparate telecommunications/ICT regulatorStatus of main fixed-line telephone operatorLevel of competition (competition, partial comp., monopoly) International gateway(s) Mobile telephone service Internet serviceForeign ownership (not allowed, restricted, allowed)Reg. treatment of VoIP (banned, closed, no framework, allowed)
Sector efficiency and capacityTelecommunications revenue (% of GDP)Telecommunications investment (% of revenue)
Sector performanceAccess
Fixed-telephone subscriptions (per 100 people)Mobile-cellular telephone subscriptions (per 100 people)Fixed (wired)-broadband subscriptions (per 100 people)Households with a computer (%)Households with Internet access at home (%)Usage
Int’l. voice traffic, total (minutes/subscription/month)Domestic mobile traffic (minutes/subscription/month)Individuals using the Internet (%)Quality
Population covered by a mobile-cellular network (%)Fixed (wired)-broadband subscriptions (% of total Internet)International Internet bandwidth (bit/s per Internet user)Affordability
Fixed-telephone sub-basket ($ a month)Mobile-cellular sub-basket ($ a month)Fixed-broadband sub-basket ($ a month)Trade
ICT goods exports (% of total goods exports)ICT goods imports (% of total goods imports)ICT service exports (% of total service exports)Applications
Online service index (0–1, 1=highest presence)Secure Internet servers (per million people)
Low-
income
group
Sub-Saharan Africa Low income
3 4 84646 49 28
120 370 590–1.0 11.6 5.9
55 .. 61
.. .. 60
Yes YesPublic Public
.. C
C P
.. C
A NoB C
8.1 .. 5.0
.. .. ..
0.1 0.0 1.04.9 57.1 47.20.0 0.0 0.20.8 2.0a 4.2
.. 1.5a 3.4
.. 11.1 ..0.0 52.0 70.10.6a 3.8a 6.2
16 .. .... .. 30.9
.. 2,006 9,141
.. .. 8.9
.. .. 11.9
.. .. 46.9
.. .. ..
.. .. ..
.. .. ..
0.22 0.19 0.20.. 0.9 1.1
Liberia

128 2014 The Little Data Book on Information and Communication Technology
2005 2012 2012
Country data
Economic and social contextPopulation (millions)Urban population (% of total)GNI per capita, World Bank Atlas method ($)GDP growth, 2000–05 and 2005–12 (avg. annual %)Adult literacy rate (% ages 15 and older) Gross primary, secondary, tertiary school enrollment (%)
Sector structureSeparate telecommunications/ICT regulatorStatus of main fixed-line telephone operatorLevel of competition (competition, partial comp., monopoly) International gateway(s) Mobile telephone service Internet serviceForeign ownership (not allowed, restricted, allowed)Reg. treatment of VoIP (banned, closed, no framework, allowed)
Sector efficiency and capacityTelecommunications revenue (% of GDP)Telecommunications investment (% of revenue)
Sector performanceAccess
Fixed-telephone subscriptions (per 100 people)Mobile-cellular telephone subscriptions (per 100 people)Fixed (wired)-broadband subscriptions (per 100 people)Households with a computer (%)Households with Internet access at home (%)Usage
Int’l. voice traffic, total (minutes/subscription/month)Domestic mobile traffic (minutes/subscription/month)Individuals using the Internet (%)Quality
Population covered by a mobile-cellular network (%)Fixed (wired)-broadband subscriptions (% of total Internet)International Internet bandwidth (bit/s per Internet user)Affordability
Fixed-telephone sub-basket ($ a month)Mobile-cellular sub-basket ($ a month)Fixed-broadband sub-basket ($ a month)Trade
ICT goods exports (% of total goods exports)ICT goods imports (% of total goods imports)ICT service exports (% of total service exports)Applications
Online service index (0–1, 1=highest presence)Secure Internet servers (per million people)
Upper
middle-
income
group
Middle East & North Africa Upper middle income
6 6 2,39177 78 61
6,660 12,930 6,9694.7 4.5 6.286 90 94
94 .. 76
No YesPublic Public
.. ..M M
.. ..
.. ..B B
.. .. 2.5
.. .. 18.2
15.2a 13.2a 19.435.7 155.8a 92.4
0.0 1.1a 10.85.0 17.6a 40.63.0 13.7a 36.3
13.4 .. 1.384.0 .. 284.4
3.9a 14.0a 41.6
71 98 99
.. 8.2 95.5456 14,044 14,580
.. .. 9.4
.. .. 14.9
.. .. 17.8
.. .. 17.64.8 3.6 14.7
.. .. 29.1
0.35 0.00 0.420.2 3.4 18.5
Libya

129The Little Data Book on Information and Communication Technology 2014
2005 2012 2012
Country data
Economic and social contextPopulation (millions)Urban population (% of total)GNI per capita, World Bank Atlas method ($)GDP growth, 2000–05 and 2005–12 (avg. annual %)Adult literacy rate (% ages 15 and older) Gross primary, secondary, tertiary school enrollment (%)
Sector structureSeparate telecommunications/ICT regulatorStatus of main fixed-line telephone operatorLevel of competition (competition, partial comp., monopoly) International gateway(s) Mobile telephone service Internet serviceForeign ownership (not allowed, restricted, allowed)Reg. treatment of VoIP (banned, closed, no framework, allowed)
Sector efficiency and capacityTelecommunications revenue (% of GDP)Telecommunications investment (% of revenue)
Sector performanceAccess
Fixed-telephone subscriptions (per 100 people)Mobile-cellular telephone subscriptions (per 100 people)Fixed (wired)-broadband subscriptions (per 100 people)Households with a computer (%)Households with Internet access at home (%)Usage
Int’l. voice traffic, total (minutes/subscription/month)Domestic mobile traffic (minutes/subscription/month)Individuals using the Internet (%)Quality
Population covered by a mobile-cellular network (%)Fixed (wired)-broadband subscriptions (% of total Internet)International Internet bandwidth (bit/s per Internet user)Affordability
Fixed-telephone sub-basket ($ a month)Mobile-cellular sub-basket ($ a month)Fixed-broadband sub-basket ($ a month)Trade
ICT goods exports (% of total goods exports)ICT goods imports (% of total goods imports)ICT service exports (% of total service exports)Applications
Online service index (0–1, 1=highest presence)Secure Internet servers (per million people)
High-
income
group
High income
0.03 0.04 1,30015 14 80
92,660 136,770 38,4120.5 3.0 1.0
.. .. ..86 88 93
Yes YesPublic Public
.. CP CC C.. A.. ..
0.8 .. 2.7.. .. 17.6
57.6 50.4 43.679.2 97.4 122.924.8 30.5 26.2
.. .. 77.7
.. .. 75.5
.. .. ..
.. 11.7 113.6
63.4 89.4a 75.4
94 100 10054.9 92.7 95.9
6,813 6,022 85,990
.. 29.0 25.2
.. 23.4 20.6
.. 47.1 29.2
.. .. 8.9
.. .. 10.8
.. .. 30.8
0.55 0.59 0.671,410.5 8,216.2 827.6
Liechtenstein

130 2014 The Little Data Book on Information and Communication Technology
2005 2012 2012
High-
income
groupCountry data
Economic and social contextPopulation (millions)Urban population (% of total)GNI per capita, World Bank Atlas method ($)GDP growth, 2000–05 and 2005–12 (avg. annual %)Adult literacy rate (% ages 15 and older) Gross primary, secondary, tertiary school enrollment (%)
Sector structureSeparate telecommunications/ICT regulatorStatus of main fixed-line telephone operatorLevel of competition (competition, partial comp., monopoly) International gateway(s) Mobile telephone service Internet serviceForeign ownership (not allowed, restricted, allowed)Reg. treatment of VoIP (banned, closed, no framework, allowed)
Sector efficiency and capacityTelecommunications revenue (% of GDP)Telecommunications investment (% of revenue)
Sector performanceAccess
Fixed-telephone subscriptions (per 100 people)Mobile-cellular telephone subscriptions (per 100 people)Fixed (wired)-broadband subscriptions (per 100 people)Households with a computer (%)Households with Internet access at home (%)Usage
Int’l. voice traffic, total (minutes/subscription/month)Domestic mobile traffic (minutes/subscription/month)Individuals using the Internet (%)Quality
Population covered by a mobile-cellular network (%)Fixed (wired)-broadband subscriptions (% of total Internet)International Internet bandwidth (bit/s per Internet user)Affordability
Fixed-telephone sub-basket ($ a month)Mobile-cellular sub-basket ($ a month)Fixed-broadband sub-basket ($ a month)Trade
ICT goods exports (% of total goods exports)ICT goods imports (% of total goods imports)ICT service exports (% of total service exports)Applications
Online service index (0–1, 1=highest presence)Secure Internet servers (per million people)
High income
3 3 1,30067 67 80
7,590 13,820 38,4128.0 0.8 1.0
100 100 ..96 97 93
Yes YesMixed Mixed
C ..C C
C C
A AA A
3.5 1.7 2.715.6 138.3 17.6
24.4 22.3 43.6132.5 165.1 122.9
7.1 21.1 26.232.0 64.0 77.715.8 62.0 75.5
6.0 6.1 ..55.7 124.5 113.6
36.2 68.0 75.4
100 98 10090.9 99.4 95.9
4,188 76,193 85,990
.. 13.9 25.2
.. 10.8 20.6
.. 12.1 29.2
5.3 2.3 8.96.4 3.6 10.88.2 9.0 30.8
0.66 0.70 0.6722.3 248.6 827.6
Lithuania

131The Little Data Book on Information and Communication Technology 2014
2005 2012 2012
Country data
Economic and social contextPopulation (millions)Urban population (% of total)GNI per capita, World Bank Atlas method ($)GDP growth, 2000–05 and 2005–12 (avg. annual %)Adult literacy rate (% ages 15 and older) Gross primary, secondary, tertiary school enrollment (%)
Sector structureSeparate telecommunications/ICT regulatorStatus of main fixed-line telephone operatorLevel of competition (competition, partial comp., monopoly) International gateway(s) Mobile telephone service Internet serviceForeign ownership (not allowed, restricted, allowed)Reg. treatment of VoIP (banned, closed, no framework, allowed)
Sector efficiency and capacityTelecommunications revenue (% of GDP)Telecommunications investment (% of revenue)
Sector performanceAccess
Fixed-telephone subscriptions (per 100 people)Mobile-cellular telephone subscriptions (per 100 people)Fixed (wired)-broadband subscriptions (per 100 people)Households with a computer (%)Households with Internet access at home (%)Usage
Int’l. voice traffic, total (minutes/subscription/month)Domestic mobile traffic (minutes/subscription/month)Individuals using the Internet (%)Quality
Population covered by a mobile-cellular network (%)Fixed (wired)-broadband subscriptions (% of total Internet)International Internet bandwidth (bit/s per Internet user)Affordability
Fixed-telephone sub-basket ($ a month)Mobile-cellular sub-basket ($ a month)Fixed-broadband sub-basket ($ a month)Trade
ICT goods exports (% of total goods exports)ICT goods imports (% of total goods imports)ICT service exports (% of total service exports)Applications
Online service index (0–1, 1=highest presence)Secure Internet servers (per million people)
High-
income
group
High income
0.47 0.53 1,30084 86 80
69,180 71,640 38,4123.5 0.9 1.0
.. .. ..76 78 93
Yes YesPublic Public
C CC CC CA AA A
1.5 1.2 2.718.3 25.9 17.6
53.4 50.9 43.6111.4 145.4 122.9
15.3 32.4 26.275.0 92.0 77.764.6 93.0 75.5
74.2 69.1 ..79.7 84.4 113.6
70.0 92.0 75.4
99 100 10058.9 100.0 95.9
29,486 4,088,456 85,990
.. 28.5 25.2
.. 27.7 20.6
.. 40.3 29.2
7.9 2.7 8.98.4 4.1 10.8
16.4 21.7 30.8
0.75 0.70 0.67473.0 2,258.1 827.6
Luxembourg

132 2014 The Little Data Book on Information and Communication Technology
2005 2012 2012
Country data
Economic and social contextPopulation (millions)Urban population (% of total)GNI per capita, World Bank Atlas method ($)GDP growth, 2000–05 and 2005–12 (avg. annual %)Adult literacy rate (% ages 15 and older) Gross primary, secondary, tertiary school enrollment (%)
Sector structureSeparate telecommunications/ICT regulatorStatus of main fixed-line telephone operatorLevel of competition (competition, partial comp., monopoly) International gateway(s) Mobile telephone service Internet serviceForeign ownership (not allowed, restricted, allowed)Reg. treatment of VoIP (banned, closed, no framework, allowed)
Sector efficiency and capacityTelecommunications revenue (% of GDP)Telecommunications investment (% of revenue)
Sector performanceAccess
Fixed-telephone subscriptions (per 100 people)Mobile-cellular telephone subscriptions (per 100 people)Fixed (wired)-broadband subscriptions (per 100 people)Households with a computer (%)Households with Internet access at home (%)Usage
Int’l. voice traffic, total (minutes/subscription/month)Domestic mobile traffic (minutes/subscription/month)Individuals using the Internet (%)Quality
Population covered by a mobile-cellular network (%)Fixed (wired)-broadband subscriptions (% of total Internet)International Internet bandwidth (bit/s per Internet user)Affordability
Fixed-telephone sub-basket ($ a month)Mobile-cellular sub-basket ($ a month)Fixed-broadband sub-basket ($ a month)Trade
ICT goods exports (% of total goods exports)ICT goods imports (% of total goods imports)ICT service exports (% of total service exports)Applications
Online service index (0–1, 1=highest presence)Secure Internet servers (per million people)
High-
income
group
High income
0.47 0.56 1,300100 100 80
24,080 55,720 38,41212.8 12.6 1.0
93 96 ..92 82 93
.. ..
.. ..
.. ..
.. ..
.. ..
.. ..No No
2.5 1.7 2.716.8 11.2 17.6
37.3 29.2 43.6113.8 289.8 122.9
14.5 26.0 26.268.1 85.8a 77.756.9a 81.0a 75.5
37.5 30.1 ..123.1 .. 113.6
34.9 64.3a 75.4
100 100 10076.8 99.6 95.9
9,803 59,233 85,990
.. 8.4 25.2
.. 5.7 20.6
.. 7.9 29.2
2.8 14.9 8.99.7 14.5 10.80.9 1.3 30.8
.. .. 0.6755.5 311.0 827.6
Macao SAR, China

133The Little Data Book on Information and Communication Technology 2014
2005 2012 2012
Upper
middle-
income
groupCountry data
Economic and social contextPopulation (millions)Urban population (% of total)GNI per capita, World Bank Atlas method ($)GDP growth, 2000–05 and 2005–12 (avg. annual %)Adult literacy rate (% ages 15 and older) Gross primary, secondary, tertiary school enrollment (%)
Sector structureSeparate telecommunications/ICT regulatorStatus of main fixed-line telephone operatorLevel of competition (competition, partial comp., monopoly) International gateway(s) Mobile telephone service Internet serviceForeign ownership (not allowed, restricted, allowed)Reg. treatment of VoIP (banned, closed, no framework, allowed)
Sector efficiency and capacityTelecommunications revenue (% of GDP)Telecommunications investment (% of revenue)
Sector performanceAccess
Fixed-telephone subscriptions (per 100 people)Mobile-cellular telephone subscriptions (per 100 people)Fixed (wired)-broadband subscriptions (per 100 people)Households with a computer (%)Households with Internet access at home (%)Usage
Int’l. voice traffic, total (minutes/subscription/month)Domestic mobile traffic (minutes/subscription/month)Individuals using the Internet (%)Quality
Population covered by a mobile-cellular network (%)Fixed (wired)-broadband subscriptions (% of total Internet)International Internet bandwidth (bit/s per Internet user)Affordability
Fixed-telephone sub-basket ($ a month)Mobile-cellular sub-basket ($ a month)Fixed-broadband sub-basket ($ a month)Trade
ICT goods exports (% of total goods exports)ICT goods imports (% of total goods imports)ICT service exports (% of total service exports)Applications
Online service index (0–1, 1=highest presence)Secure Internet servers (per million people)
Europe & Central Asia Upper middle income
2 2 2,39159 59 61
2,830 4,620 6,9691.9 2.9 6.296 97 94
68 70 76
Yes YesMixed Mixed
M ..C C
C C
A ..No A
5.5 4.9 2.59.8 14.0 18.2
25.5 19.4 19.454.1 106.2 92.4
0.6 13.7 10.824.9 58.4a 40.612.5 56.8a 36.3
.. 9.0 1.328.7 149.3 284.426.5a 63.1a 41.6
99 100 99
11.5 92.2 95.562 30,836 14,580
.. 9.1 9.4
.. 13.3 14.9
.. 13.5 17.8
0.4 0.3 17.64.3 4.0 14.7
20.7 24.0 29.1
0.49 0.45 0.420.5 51.7 18.5
Macedonia, FYR

134 2014 The Little Data Book on Information and Communication Technology
2005 2012 2012
Country data
Economic and social contextPopulation (millions)Urban population (% of total)GNI per capita, World Bank Atlas method ($)GDP growth, 2000–05 and 2005–12 (avg. annual %)Adult literacy rate (% ages 15 and older) Gross primary, secondary, tertiary school enrollment (%)
Sector structureSeparate telecommunications/ICT regulatorStatus of main fixed-line telephone operatorLevel of competition (competition, partial comp., monopoly) International gateway(s) Mobile telephone service Internet serviceForeign ownership (not allowed, restricted, allowed)Reg. treatment of VoIP (banned, closed, no framework, allowed)
Sector efficiency and capacityTelecommunications revenue (% of GDP)Telecommunications investment (% of revenue)
Sector performanceAccess
Fixed-telephone subscriptions (per 100 people)Mobile-cellular telephone subscriptions (per 100 people)Fixed (wired)-broadband subscriptions (per 100 people)Households with a computer (%)Households with Internet access at home (%)Usage
Int’l. voice traffic, total (minutes/subscription/month)Domestic mobile traffic (minutes/subscription/month)Individuals using the Internet (%)Quality
Population covered by a mobile-cellular network (%)Fixed (wired)-broadband subscriptions (% of total Internet)International Internet bandwidth (bit/s per Internet user)Affordability
Fixed-telephone sub-basket ($ a month)Mobile-cellular sub-basket ($ a month)Fixed-broadband sub-basket ($ a month)Trade
ICT goods exports (% of total goods exports)ICT goods imports (% of total goods imports)ICT service exports (% of total service exports)Applications
Online service index (0–1, 1=highest presence)Secure Internet servers (per million people)
Low-
income
group
Sub-Saharan Africa Low income
18 22 84629 33 28
290 430 5902.0 2.3 5.971 64 61
60 66 60
Yes YesMixed Mixed
C ..C C
C C
R RB C
2.6 3.2 5.0
32.8 31.3 ..
0.5 1.1 1.02.8 39.4 47.20.0 0.0 0.20.5 2.9a 4.20.4a 2.7a 3.4
14.7 0.9 ..7.7 2.4 70.10.6a 2.1a 6.2
23 .. ..0.0 65.0 30.9
327 493 9,141
.. 8.8 8.9
.. 17.7 11.9
.. 63.7 46.9
0.3 0.1 ..4.6 2.4 ..
19.6 .. ..
0.31 0.32 0.200.2 0.7 1.1
Madagascar

135The Little Data Book on Information and Communication Technology 2014
2005 2012 2012
Country data
Economic and social contextPopulation (millions)Urban population (% of total)GNI per capita, World Bank Atlas method ($)GDP growth, 2000–05 and 2005–12 (avg. annual %)Adult literacy rate (% ages 15 and older) Gross primary, secondary, tertiary school enrollment (%)
Sector structureSeparate telecommunications/ICT regulatorStatus of main fixed-line telephone operatorLevel of competition (competition, partial comp., monopoly) International gateway(s) Mobile telephone service Internet serviceForeign ownership (not allowed, restricted, allowed)Reg. treatment of VoIP (banned, closed, no framework, allowed)
Sector efficiency and capacityTelecommunications revenue (% of GDP)Telecommunications investment (% of revenue)
Sector performanceAccess
Fixed-telephone subscriptions (per 100 people)Mobile-cellular telephone subscriptions (per 100 people)Fixed (wired)-broadband subscriptions (per 100 people)Households with a computer (%)Households with Internet access at home (%)Usage
Int’l. voice traffic, total (minutes/subscription/month)Domestic mobile traffic (minutes/subscription/month)Individuals using the Internet (%)Quality
Population covered by a mobile-cellular network (%)Fixed (wired)-broadband subscriptions (% of total Internet)International Internet bandwidth (bit/s per Internet user)Affordability
Fixed-telephone sub-basket ($ a month)Mobile-cellular sub-basket ($ a month)Fixed-broadband sub-basket ($ a month)Trade
ICT goods exports (% of total goods exports)ICT goods imports (% of total goods imports)ICT service exports (% of total service exports)Applications
Online service index (0–1, 1=highest presence)Secure Internet servers (per million people)
Low-
income
group
Sub-Saharan Africa Low income
13 16 84615 16 28
220 320 5902.5 3.6 5.9
.. 61 61
64 69 60
Yes YesPublic Mixed
.. C
P P
P P
R RB C
3.4 3.4 5.0
.. .. ..
0.8 1.4 1.03.3 29.2 47.20.0 0.0 0.2
.. 4.0 4.2
.. 5.5 3.4
.. .. ..
.. 5.2 70.10.4 4.4a 6.2
70 85 ..2.7 0.3 30.9
392 2,803 9,141
.. 21.5 8.9
.. 21.0 11.9
.. 48.1 46.9
0.2 0.2 ..3.5 3.5 ..6.7 27.1 ..
0.29 0.22 0.200.2 0.9 1.1
Malawi

136 2014 The Little Data Book on Information and Communication Technology
2005 2012 2012
Upper
middle-
income
groupCountry data
Economic and social contextPopulation (millions)Urban population (% of total)GNI per capita, World Bank Atlas method ($)GDP growth, 2000–05 and 2005–12 (avg. annual %)Adult literacy rate (% ages 15 and older) Gross primary, secondary, tertiary school enrollment (%)
Sector structureSeparate telecommunications/ICT regulatorStatus of main fixed-line telephone operatorLevel of competition (competition, partial comp., monopoly) International gateway(s) Mobile telephone service Internet serviceForeign ownership (not allowed, restricted, allowed)Reg. treatment of VoIP (banned, closed, no framework, allowed)
Sector efficiency and capacityTelecommunications revenue (% of GDP)Telecommunications investment (% of revenue)
Sector performanceAccess
Fixed-telephone subscriptions (per 100 people)Mobile-cellular telephone subscriptions (per 100 people)Fixed (wired)-broadband subscriptions (per 100 people)Households with a computer (%)Households with Internet access at home (%)Usage
Int’l. voice traffic, total (minutes/subscription/month)Domestic mobile traffic (minutes/subscription/month)Individuals using the Internet (%)Quality
Population covered by a mobile-cellular network (%)Fixed (wired)-broadband subscriptions (% of total Internet)International Internet bandwidth (bit/s per Internet user)Affordability
Fixed-telephone sub-basket ($ a month)Mobile-cellular sub-basket ($ a month)Fixed-broadband sub-basket ($ a month)Trade
ICT goods exports (% of total goods exports)ICT goods imports (% of total goods imports)ICT service exports (% of total service exports)Applications
Online service index (0–1, 1=highest presence)Secure Internet servers (per million people)
East Asia & Pacific Upper middle income
26 29 2,39168 73 61
5,240 9,820 6,9695.1 4.4 6.289 93 94
71 .. 76
Yes YesMixed Private
C CC CC CR RA A
4.6 4.6 2.522.5 14.4 18.2
16.9 15.7 19.475.6 141.3 92.4
1.9 8.4 10.828.2 66.9 40.615.0a 64.7 36.3
.. .. 1.3
.. .. 284.448.6 65.8 41.6
93 97 99
11.6 27.6 95.5254 16,424 14,580
.. 5.4 9.4
.. 7.4 14.9
.. 21.6 17.8
43.4 27.9 17.638.0 23.1 14.719.4 27.9 29.1
0.61 0.79 0.4214.6 66.8 18.5
Malaysia

137The Little Data Book on Information and Communication Technology 2014
2005 2012 2012
Upper
middle-
income
groupCountry data
Economic and social contextPopulation (millions)Urban population (% of total)GNI per capita, World Bank Atlas method ($)GDP growth, 2000–05 and 2005–12 (avg. annual %)Adult literacy rate (% ages 15 and older) Gross primary, secondary, tertiary school enrollment (%)
Sector structureSeparate telecommunications/ICT regulatorStatus of main fixed-line telephone operatorLevel of competition (competition, partial comp., monopoly) International gateway(s) Mobile telephone service Internet serviceForeign ownership (not allowed, restricted, allowed)Reg. treatment of VoIP (banned, closed, no framework, allowed)
Sector efficiency and capacityTelecommunications revenue (% of GDP)Telecommunications investment (% of revenue)
Sector performanceAccess
Fixed-telephone subscriptions (per 100 people)Mobile-cellular telephone subscriptions (per 100 people)Fixed (wired)-broadband subscriptions (per 100 people)Households with a computer (%)Households with Internet access at home (%)Usage
Int’l. voice traffic, total (minutes/subscription/month)Domestic mobile traffic (minutes/subscription/month)Individuals using the Internet (%)Quality
Population covered by a mobile-cellular network (%)Fixed (wired)-broadband subscriptions (% of total Internet)International Internet bandwidth (bit/s per Internet user)Affordability
Fixed-telephone sub-basket ($ a month)Mobile-cellular sub-basket ($ a month)Fixed-broadband sub-basket ($ a month)Trade
ICT goods exports (% of total goods exports)ICT goods imports (% of total goods imports)ICT service exports (% of total service exports)Applications
Online service index (0–1, 1=highest presence)Secure Internet servers (per million people)
South Asia Upper middle income
0.30 0.34 2,39134 42 61
3,420 5,750 6,9697.1 7.0 6.298 .. 94
77 .. 76
Yes YesMixed Mixed
.. ..M P
M .... AB C
9.6 .. 2.515.2 .. 18.2
10.9 6.8 19.468.4 165.6 92.4
1.1 5.3 10.826.1a 67.2a 40.6
7.0a 34.3a 36.3
.. 32.7 1.355.8 218.4 284.4
6.9 38.9a 41.6
91 100 99
71.7 100.0 95.52,593 25,479 14,580
.. 3.6 9.4
.. 6.0 14.9
.. 8.2 17.8
0.2 .. 17.611.2 4.3 14.7
.. .. 29.1
0.45 0.33 0.426.7 87.0 18.5
Maldives

138 2014 The Little Data Book on Information and Communication Technology
2005 2012 2012
Country data
Economic and social contextPopulation (millions)Urban population (% of total)GNI per capita, World Bank Atlas method ($)GDP growth, 2000–05 and 2005–12 (avg. annual %)Adult literacy rate (% ages 15 and older) Gross primary, secondary, tertiary school enrollment (%)
Sector structureSeparate telecommunications/ICT regulatorStatus of main fixed-line telephone operatorLevel of competition (competition, partial comp., monopoly) International gateway(s) Mobile telephone service Internet serviceForeign ownership (not allowed, restricted, allowed)Reg. treatment of VoIP (banned, closed, no framework, allowed)
Sector efficiency and capacityTelecommunications revenue (% of GDP)Telecommunications investment (% of revenue)
Sector performanceAccess
Fixed-telephone subscriptions (per 100 people)Mobile-cellular telephone subscriptions (per 100 people)Fixed (wired)-broadband subscriptions (per 100 people)Households with a computer (%)Households with Internet access at home (%)Usage
Int’l. voice traffic, total (minutes/subscription/month)Domestic mobile traffic (minutes/subscription/month)Individuals using the Internet (%)Quality
Population covered by a mobile-cellular network (%)Fixed (wired)-broadband subscriptions (% of total Internet)International Internet bandwidth (bit/s per Internet user)Affordability
Fixed-telephone sub-basket ($ a month)Mobile-cellular sub-basket ($ a month)Fixed-broadband sub-basket ($ a month)Trade
ICT goods exports (% of total goods exports)ICT goods imports (% of total goods imports)ICT service exports (% of total service exports)Applications
Online service index (0–1, 1=highest presence)Secure Internet servers (per million people)
Low-
income
group
Sub-Saharan Africa Low income
12 15 84631 36 28
440 660 5905.9 4.4 5.926 33 61
48 57 60
Yes YesPublic Mixed
.. P
P P
C C
.. AB B
4.7 6.3 5.0
25.8 24.2 ..
0.6 0.8 1.06.4 98.4 47.20.0 0.0 0.21.0a 7.7a 4.20.7a 2.5a 3.4
5.0 5.2 ..9.9 19.3 70.10.5 2.2a 6.2
20 .. ..45.7 11.3 30.9
429 5,292 9,141
.. 8.3 8.9
.. 15.5 11.9
.. 50.0 46.9
0.2 0.0 ..2.2 3.6 ..
21.9 33.9 ..
0.16 0.32 0.200.1 1.0 1.1
Mali

139The Little Data Book on Information and Communication Technology 2014
2005 2012 2012
Country data
Economic and social contextPopulation (millions)Urban population (% of total)GNI per capita, World Bank Atlas method ($)GDP growth, 2000–05 and 2005–12 (avg. annual %)Adult literacy rate (% ages 15 and older) Gross primary, secondary, tertiary school enrollment (%)
Sector structureSeparate telecommunications/ICT regulatorStatus of main fixed-line telephone operatorLevel of competition (competition, partial comp., monopoly) International gateway(s) Mobile telephone service Internet serviceForeign ownership (not allowed, restricted, allowed)Reg. treatment of VoIP (banned, closed, no framework, allowed)
Sector efficiency and capacityTelecommunications revenue (% of GDP)Telecommunications investment (% of revenue)
Sector performanceAccess
Fixed-telephone subscriptions (per 100 people)Mobile-cellular telephone subscriptions (per 100 people)Fixed (wired)-broadband subscriptions (per 100 people)Households with a computer (%)Households with Internet access at home (%)Usage
Int’l. voice traffic, total (minutes/subscription/month)Domestic mobile traffic (minutes/subscription/month)Individuals using the Internet (%)Quality
Population covered by a mobile-cellular network (%)Fixed (wired)-broadband subscriptions (% of total Internet)International Internet bandwidth (bit/s per Internet user)Affordability
Fixed-telephone sub-basket ($ a month)Mobile-cellular sub-basket ($ a month)Fixed-broadband sub-basket ($ a month)Trade
ICT goods exports (% of total goods exports)ICT goods imports (% of total goods imports)ICT service exports (% of total service exports)Applications
Online service index (0–1, 1=highest presence)Secure Internet servers (per million people)
High-
income
group
High income
0.40 0.42 1,30094 95 80
14,380 19,710 38,4120.8 1.9 1.092 .. ..77 81 93
Yes YesMixed Private
C CC CC CA AA A
5.4 3.0 2.715.1 22.3 17.6
48.7 53.7 43.678.1 127.0 122.912.4 32.0 26.246.0 78.0 77.740.6 77.0 75.5
.. 10.3 ..40.3 86.3 113.6
41.2 70.0 75.4
99 100 10057.9 100.0 95.9
4,531 625,752 85,990
.. 13.6 25.2
.. 28.2 20.6
.. 19.3 29.2
45.2 20.2 8.925.5 10.9 10.815.3 12.3 30.8
0.66 0.61 0.67331.8 1,488.0 827.6
Malta

140 2014 The Little Data Book on Information and Communication Technology
2005 2012 2012
Country data
Economic and social contextPopulation (millions)Urban population (% of total)GNI per capita, World Bank Atlas method ($)GDP growth, 2000–05 and 2005–12 (avg. annual %)Adult literacy rate (% ages 15 and older) Gross primary, secondary, tertiary school enrollment (%)
Sector structureSeparate telecommunications/ICT regulatorStatus of main fixed-line telephone operatorLevel of competition (competition, partial comp., monopoly) International gateway(s) Mobile telephone service Internet serviceForeign ownership (not allowed, restricted, allowed)Reg. treatment of VoIP (banned, closed, no framework, allowed)
Sector efficiency and capacityTelecommunications revenue (% of GDP)Telecommunications investment (% of revenue)
Sector performanceAccess
Fixed-telephone subscriptions (per 100 people)Mobile-cellular telephone subscriptions (per 100 people)Fixed (wired)-broadband subscriptions (per 100 people)Households with a computer (%)Households with Internet access at home (%)Usage
Int’l. voice traffic, total (minutes/subscription/month)Domestic mobile traffic (minutes/subscription/month)Individuals using the Internet (%)Quality
Population covered by a mobile-cellular network (%)Fixed (wired)-broadband subscriptions (% of total Internet)International Internet bandwidth (bit/s per Internet user)Affordability
Fixed-telephone sub-basket ($ a month)Mobile-cellular sub-basket ($ a month)Fixed-broadband sub-basket ($ a month)Trade
ICT goods exports (% of total goods exports)ICT goods imports (% of total goods imports)ICT service exports (% of total service exports)Applications
Online service index (0–1, 1=highest presence)Secure Internet servers (per million people)
Upper
middle-
income
group
East Asia & Pacific Upper middle income
0.05 0.05 2,39170 72 61
3,560 4,040 6,9691.8 1.2 6.2
.. .. 94
69 .. 76
No NoMixed Mixed
.. M
.. M
.. M
.. AB B
5.0 .. 2.5.. .. 18.2
10.6 .. 19.41.3 .. 92.40.0 0.0 10.8
.. .. 40.6
.. .. 36.3
.. .. 1.3
.. .. 284.43.9 10.0a 41.6
.. .. 99
0.0 .. 95.51,153 8,562 14,580
.. 45.8 9.4
.. 22.2 14.9
.. 50.0 17.8
.. .. 17.6
.. .. 14.7
.. .. 29.1
0.00 0.14 0.4219.2 113.2 18.5
Marshall Islands

141The Little Data Book on Information and Communication Technology 2014
2005 2012 2012
Country data
Economic and social contextPopulation (millions)Urban population (% of total)GNI per capita, World Bank Atlas method ($)GDP growth, 2000–05 and 2005–12 (avg. annual %)Adult literacy rate (% ages 15 and older) Gross primary, secondary, tertiary school enrollment (%)
Sector structureSeparate telecommunications/ICT regulatorStatus of main fixed-line telephone operatorLevel of competition (competition, partial comp., monopoly) International gateway(s) Mobile telephone service Internet serviceForeign ownership (not allowed, restricted, allowed)Reg. treatment of VoIP (banned, closed, no framework, allowed)
Sector efficiency and capacityTelecommunications revenue (% of GDP)Telecommunications investment (% of revenue)
Sector performanceAccess
Fixed-telephone subscriptions (per 100 people)Mobile-cellular telephone subscriptions (per 100 people)Fixed (wired)-broadband subscriptions (per 100 people)Households with a computer (%)Households with Internet access at home (%)Usage
Int’l. voice traffic, total (minutes/subscription/month)Domestic mobile traffic (minutes/subscription/month)Individuals using the Internet (%)Quality
Population covered by a mobile-cellular network (%)Fixed (wired)-broadband subscriptions (% of total Internet)International Internet bandwidth (bit/s per Internet user)Affordability
Fixed-telephone sub-basket ($ a month)Mobile-cellular sub-basket ($ a month)Fixed-broadband sub-basket ($ a month)Trade
ICT goods exports (% of total goods exports)ICT goods imports (% of total goods imports)ICT service exports (% of total service exports)Applications
Online service index (0–1, 1=highest presence)Secure Internet servers (per million people)
Lower
middle-
income
group
Sub-Saharan Africa Lower middle income
3 4 2,50740 42 39
690 1,110 1,8934.5 4.2 6.051 59 71
45 49 64
Yes YesMixed Mixed
C C
C C
C C
A AB C
5.8 5.7 2.5
19.2 20.0 20.5
1.3 1.7 5.423.7 106.0 83.1
0.0 0.2 1.41.6a 3.7a 15.00.6a 3.4a 12.4
8.7 5.3 6.5
47.1 68.0 ..0.7 5.4a 18.7
26 62 86
7.2 95.5 58.2
2,135 3,042 8,076
.. 17.6 4.9
.. 14.6 10.5
.. 22.3 20.6
.. .. 4.61.4 1.2 7.2
.. .. 47.1
0.20 0.08 0.320.3 2.1 4.4
Mauritania

142 2014 The Little Data Book on Information and Communication Technology
2005 2012 2012
Upper
middle-
income
groupCountry data
Economic and social contextPopulation (millions)Urban population (% of total)GNI per capita, World Bank Atlas method ($)GDP growth, 2000–05 and 2005–12 (avg. annual %)Adult literacy rate (% ages 15 and older) Gross primary, secondary, tertiary school enrollment (%)
Sector structureSeparate telecommunications/ICT regulatorStatus of main fixed-line telephone operatorLevel of competition (competition, partial comp., monopoly) International gateway(s) Mobile telephone service Internet serviceForeign ownership (not allowed, restricted, allowed)Reg. treatment of VoIP (banned, closed, no framework, allowed)
Sector efficiency and capacityTelecommunications revenue (% of GDP)Telecommunications investment (% of revenue)
Sector performanceAccess
Fixed-telephone subscriptions (per 100 people)Mobile-cellular telephone subscriptions (per 100 people)Fixed (wired)-broadband subscriptions (per 100 people)Households with a computer (%)Households with Internet access at home (%)Usage
Int’l. voice traffic, total (minutes/subscription/month)Domestic mobile traffic (minutes/subscription/month)Individuals using the Internet (%)Quality
Population covered by a mobile-cellular network (%)Fixed (wired)-broadband subscriptions (% of total Internet)International Internet bandwidth (bit/s per Internet user)Affordability
Fixed-telephone sub-basket ($ a month)Mobile-cellular sub-basket ($ a month)Fixed-broadband sub-basket ($ a month)Trade
ICT goods exports (% of total goods exports)ICT goods imports (% of total goods imports)ICT service exports (% of total service exports)Applications
Online service index (0–1, 1=highest presence)Secure Internet servers (per million people)
Sub-Saharan Africa Upper middle income
1 1 2,39142 42 61
5,360 8,570 6,9693.3 4.3 6.284 89 94
77 86 76
Yes YesMixed Mixed
C CC CC CA AA A
4.4 3.1 2.512.9 55.5 18.2
29.5 28.2 19.454.2 119.9 92.4
0.4 11.2 10.822.5a 40.6a 40.615.0a 42.0a 36.3
14.5 11.6 1.380.8 125.1 284.415.2a 41.4a 41.6
100 99 99
6.3 96.2 95.5832 16,125 14,580
.. 5.4 9.4
.. 6.5 14.9
.. 12.2 17.8
13.3 0.8 17.612.8 5.1 14.718.5 35.4 29.1
0.51 0.43 0.4218.5 127.3 18.5
Mauritius
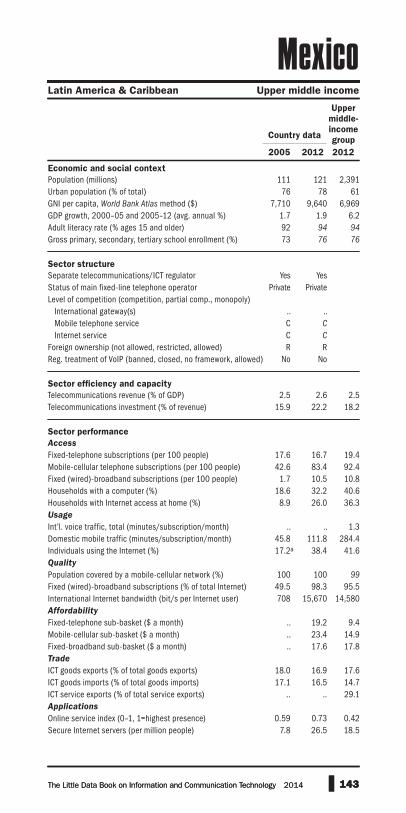
143The Little Data Book on Information and Communication Technology 2014
2005 2012 2012
Country data
Economic and social contextPopulation (millions)Urban population (% of total)GNI per capita, World Bank Atlas method ($)GDP growth, 2000–05 and 2005–12 (avg. annual %)Adult literacy rate (% ages 15 and older) Gross primary, secondary, tertiary school enrollment (%)
Sector structureSeparate telecommunications/ICT regulatorStatus of main fixed-line telephone operatorLevel of competition (competition, partial comp., monopoly) International gateway(s) Mobile telephone service Internet serviceForeign ownership (not allowed, restricted, allowed)Reg. treatment of VoIP (banned, closed, no framework, allowed)
Sector efficiency and capacityTelecommunications revenue (% of GDP)Telecommunications investment (% of revenue)
Sector performanceAccess
Fixed-telephone subscriptions (per 100 people)Mobile-cellular telephone subscriptions (per 100 people)Fixed (wired)-broadband subscriptions (per 100 people)Households with a computer (%)Households with Internet access at home (%)Usage
Int’l. voice traffic, total (minutes/subscription/month)Domestic mobile traffic (minutes/subscription/month)Individuals using the Internet (%)Quality
Population covered by a mobile-cellular network (%)Fixed (wired)-broadband subscriptions (% of total Internet)International Internet bandwidth (bit/s per Internet user)Affordability
Fixed-telephone sub-basket ($ a month)Mobile-cellular sub-basket ($ a month)Fixed-broadband sub-basket ($ a month)Trade
ICT goods exports (% of total goods exports)ICT goods imports (% of total goods imports)ICT service exports (% of total service exports)Applications
Online service index (0–1, 1=highest presence)Secure Internet servers (per million people)
111 121 2,39176 78 61
7,710 9,640 6,9691.7 1.9 6.292 94 94
73 76 76
Yes YesPrivate Private
.. ..C C
C C
R RNo No
2.5 2.6 2.515.9 22.2 18.2
17.6 16.7 19.442.6 83.4 92.4
1.7 10.5 10.818.6 32.2 40.6
8.9 26.0 36.3
.. .. 1.345.8 111.8 284.417.2a 38.4 41.6
100 100 99
49.5 98.3 95.5708 15,670 14,580
.. 19.2 9.4
.. 23.4 14.9
.. 17.6 17.8
18.0 16.9 17.617.1 16.5 14.7
.. .. 29.1
0.59 0.73 0.427.8 26.5 18.5
143The Little Data Book on Information and Communication Technology 2014
Latin America & Caribbean Upper middle income
MexicoUpper
middle-
income
group

144 2014 The Little Data Book on Information and Communication Technology
2005 2012 2012
Country data
Economic and social contextPopulation (millions)Urban population (% of total)GNI per capita, World Bank Atlas method ($)GDP growth, 2000–05 and 2005–12 (avg. annual %)Adult literacy rate (% ages 15 and older) Gross primary, secondary, tertiary school enrollment (%)
Sector structureSeparate telecommunications/ICT regulatorStatus of main fixed-line telephone operatorLevel of competition (competition, partial comp., monopoly) International gateway(s) Mobile telephone service Internet serviceForeign ownership (not allowed, restricted, allowed)Reg. treatment of VoIP (banned, closed, no framework, allowed)
Sector efficiency and capacityTelecommunications revenue (% of GDP)Telecommunications investment (% of revenue)
Sector performanceAccess
Fixed-telephone subscriptions (per 100 people)Mobile-cellular telephone subscriptions (per 100 people)Fixed (wired)-broadband subscriptions (per 100 people)Households with a computer (%)Households with Internet access at home (%)Usage
Int’l. voice traffic, total (minutes/subscription/month)Domestic mobile traffic (minutes/subscription/month)Individuals using the Internet (%)Quality
Population covered by a mobile-cellular network (%)Fixed (wired)-broadband subscriptions (% of total Internet)International Internet bandwidth (bit/s per Internet user)Affordability
Fixed-telephone sub-basket ($ a month)Mobile-cellular sub-basket ($ a month)Fixed-broadband sub-basket ($ a month)Trade
ICT goods exports (% of total goods exports)ICT goods imports (% of total goods imports)ICT service exports (% of total service exports)Applications
Online service index (0–1, 1=highest presence)Secure Internet servers (per million people)
0.11 0.10 2,50722 23 39
2,550 3,230 1,8930.4 0.2 6.0
.. .. 71
75 .. 64
No NoPublic Public
.. M
C M
.. M
.. RNo A
4.8 .. 2.5
13.2 .. 20.5
11.7 8.1 5.413.3 30.2 83.1
0.0 1.0 1.4.. .. 15.0.. .. 12.4
.. .. 6.5
44.2 .. ..11.9 26.0a 18.7
.. .. 86
2.0 46.9 58.2
476 1,930 8,076
.. 147.0 4.9
.. 13.6 10.5
.. 33.0 20.6
.. .. 4.6
.. .. 7.2
.. .. 47.1
0.00 0.21 0.3218.8 19.2 4.4
144 2014 The Little Data Book on Information and Communication Technology
East Asia & Pacific Lower middle income
Micronesia, Fed. Sts.Lower
middle-
income
group

145The Little Data Book on Information and Communication Technology 2014
2005 2012 2012
Country data
Economic and social contextPopulation (millions)Urban population (% of total)GNI per capita, World Bank Atlas method ($)GDP growth, 2000–05 and 2005–12 (avg. annual %)Adult literacy rate (% ages 15 and older) Gross primary, secondary, tertiary school enrollment (%)
Sector structureSeparate telecommunications/ICT regulatorStatus of main fixed-line telephone operatorLevel of competition (competition, partial comp., monopoly) International gateway(s) Mobile telephone service Internet serviceForeign ownership (not allowed, restricted, allowed)Reg. treatment of VoIP (banned, closed, no framework, allowed)
Sector efficiency and capacityTelecommunications revenue (% of GDP)Telecommunications investment (% of revenue)
Sector performanceAccess
Fixed-telephone subscriptions (per 100 people)Mobile-cellular telephone subscriptions (per 100 people)Fixed (wired)-broadband subscriptions (per 100 people)Households with a computer (%)Households with Internet access at home (%)Usage
Int’l. voice traffic, total (minutes/subscription/month)Domestic mobile traffic (minutes/subscription/month)Individuals using the Internet (%)Quality
Population covered by a mobile-cellular network (%)Fixed (wired)-broadband subscriptions (% of total Internet)International Internet bandwidth (bit/s per Internet user)Affordability
Fixed-telephone sub-basket ($ a month)Mobile-cellular sub-basket ($ a month)Fixed-broadband sub-basket ($ a month)Trade
ICT goods exports (% of total goods exports)ICT goods imports (% of total goods imports)ICT service exports (% of total service exports)Applications
Online service index (0–1, 1=highest presence)Secure Internet servers (per million people)
4 4 2,50743 48 39
890 2,070 1,8937.1 3.1 6.097 99 71
71 64 64
Yes YesPublic Public
C CC CC CA A
No A
9.7 4.7 2.5
31.4 42.0 20.5
24.7 34.3 5.428.9 102.0 83.1
0.3 11.9 1.47.0 44.5a 15.02.3a 42.0a 12.4
22.2 17.2 6.5
36.4 103.1 ..14.6 43.4a 18.7
97 .. 86
17.0 100.0 58.2
744 94,175 8,076
.. 0.5 4.9
.. 13.2 10.5
.. 12.8 20.6
0.3 0.3 4.63.6 3.3 7.2
21.2 25.3 47.1
0.45 0.52 0.324.2 25.3 4.4
145The Little Data Book on Information and Communication Technology 2014
Europe & Central Asia Lower middle income
MoldovaLower
middle-
income
group

146 2014 The Little Data Book on Information and Communication Technology
2005 2012 2012
Country data
Economic and social contextPopulation (millions)Urban population (% of total)GNI per capita, World Bank Atlas method ($)GDP growth, 2000–05 and 2005–12 (avg. annual %)Adult literacy rate (% ages 15 and older) Gross primary, secondary, tertiary school enrollment (%)
Sector structureSeparate telecommunications/ICT regulatorStatus of main fixed-line telephone operatorLevel of competition (competition, partial comp., monopoly) International gateway(s) Mobile telephone service Internet serviceForeign ownership (not allowed, restricted, allowed)Reg. treatment of VoIP (banned, closed, no framework, allowed)
Sector efficiency and capacityTelecommunications revenue (% of GDP)Telecommunications investment (% of revenue)
Sector performanceAccess
Fixed-telephone subscriptions (per 100 people)Mobile-cellular telephone subscriptions (per 100 people)Fixed (wired)-broadband subscriptions (per 100 people)Households with a computer (%)Households with Internet access at home (%)Usage
Int’l. voice traffic, total (minutes/subscription/month)Domestic mobile traffic (minutes/subscription/month)Individuals using the Internet (%)Quality
Population covered by a mobile-cellular network (%)Fixed (wired)-broadband subscriptions (% of total Internet)International Internet bandwidth (bit/s per Internet user)Affordability
Fixed-telephone sub-basket ($ a month)Mobile-cellular sub-basket ($ a month)Fixed-broadband sub-basket ($ a month)Trade
ICT goods exports (% of total goods exports)ICT goods imports (% of total goods imports)ICT service exports (% of total service exports)Applications
Online service index (0–1, 1=highest presence)Secure Internet servers (per million people)
0.03 0.04 1,300100 100 80
128,380 186,950 38,4121.7 .. 1.0
.. .. ..
.. .. 93
No NoPrivate Private
.. P
M M
C M
A A.. ..
5.4 .. 2.77.6 .. 17.6
100.5 121.7 43.650.8 88.3 122.928.1 43.3 26.263.5a 73.5a 77.740.1a 70.9a 75.5
241.5 114.6 ..49.0 125.4 113.6
55.5 87.0a 75.4
100 100 10096.9 100.0 95.9
6,129 244,695 85,990
.. 21.2 25.2
.. 52.6 20.6
.. 45.9 29.2
.. .. 8.9
.. .. 10.8
.. .. 30.8
0.00 0.36 0.67709.9 2,736.8 827.6
146 2014 The Little Data Book on Information and Communication Technology
High income
MonacoHigh-
income
group
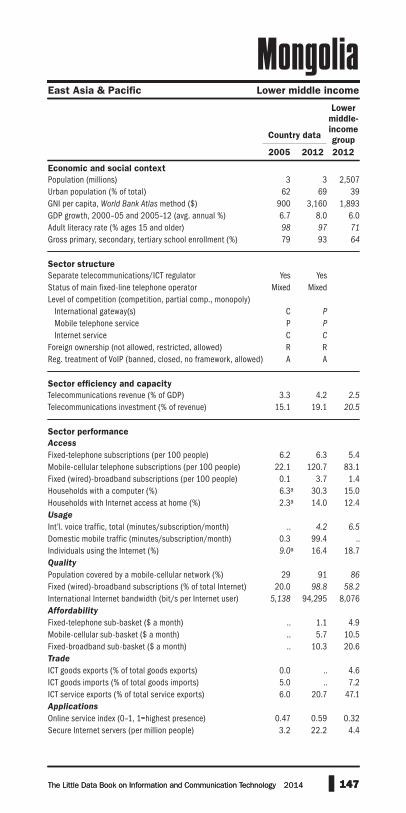
147The Little Data Book on Information and Communication Technology 2014
2005 2012 2012
Country data
Economic and social contextPopulation (millions)Urban population (% of total)GNI per capita, World Bank Atlas method ($)GDP growth, 2000–05 and 2005–12 (avg. annual %)Adult literacy rate (% ages 15 and older) Gross primary, secondary, tertiary school enrollment (%)
Sector structureSeparate telecommunications/ICT regulatorStatus of main fixed-line telephone operatorLevel of competition (competition, partial comp., monopoly) International gateway(s) Mobile telephone service Internet serviceForeign ownership (not allowed, restricted, allowed)Reg. treatment of VoIP (banned, closed, no framework, allowed)
Sector efficiency and capacityTelecommunications revenue (% of GDP)Telecommunications investment (% of revenue)
Sector performanceAccess
Fixed-telephone subscriptions (per 100 people)Mobile-cellular telephone subscriptions (per 100 people)Fixed (wired)-broadband subscriptions (per 100 people)Households with a computer (%)Households with Internet access at home (%)Usage
Int’l. voice traffic, total (minutes/subscription/month)Domestic mobile traffic (minutes/subscription/month)Individuals using the Internet (%)Quality
Population covered by a mobile-cellular network (%)Fixed (wired)-broadband subscriptions (% of total Internet)International Internet bandwidth (bit/s per Internet user)Affordability
Fixed-telephone sub-basket ($ a month)Mobile-cellular sub-basket ($ a month)Fixed-broadband sub-basket ($ a month)Trade
ICT goods exports (% of total goods exports)ICT goods imports (% of total goods imports)ICT service exports (% of total service exports)Applications
Online service index (0–1, 1=highest presence)Secure Internet servers (per million people)
3 3 2,50762 69 39
900 3,160 1,8936.7 8.0 6.098 97 71
79 93 64
Yes YesMixed Mixed
C P
P P
C C
R RA A
3.3 4.2 2.5
15.1 19.1 20.5
6.2 6.3 5.422.1 120.7 83.1
0.1 3.7 1.46.3a 30.3 15.02.3a 14.0 12.4
.. 4.2 6.5
0.3 99.4 ..9.0a 16.4 18.7
29 91 86
20.0 98.8 58.2
5,138 94,295 8,076
.. 1.1 4.9
.. 5.7 10.5
.. 10.3 20.6
0.0 .. 4.65.0 .. 7.26.0 20.7 47.1
0.47 0.59 0.323.2 22.2 4.4
147The Little Data Book on Information and Communication Technology 2014
East Asia & Pacific Lower middle income
MongoliaLower
middle-
income
group
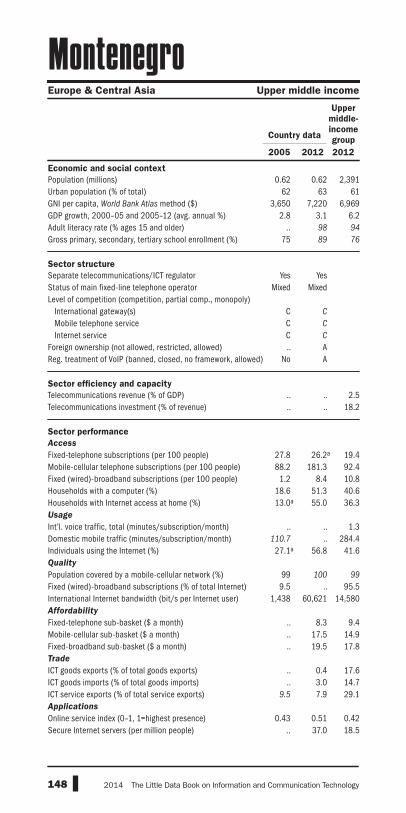
148 2014 The Little Data Book on Information and Communication Technology
Europe & Central Asia Upper middle income
2005 2012 2012
Upper
middle-
income
groupCountry data
Economic and social contextPopulation (millions)Urban population (% of total)GNI per capita, World Bank Atlas method ($)GDP growth, 2000–05 and 2005–12 (avg. annual %)Adult literacy rate (% ages 15 and older) Gross primary, secondary, tertiary school enrollment (%)
Sector structureSeparate telecommunications/ICT regulatorStatus of main fixed-line telephone operatorLevel of competition (competition, partial comp., monopoly) International gateway(s) Mobile telephone service Internet serviceForeign ownership (not allowed, restricted, allowed)Reg. treatment of VoIP (banned, closed, no framework, allowed)
Sector efficiency and capacityTelecommunications revenue (% of GDP)Telecommunications investment (% of revenue)
Sector performanceAccess
Fixed-telephone subscriptions (per 100 people)Mobile-cellular telephone subscriptions (per 100 people)Fixed (wired)-broadband subscriptions (per 100 people)Households with a computer (%)Households with Internet access at home (%)Usage
Int’l. voice traffic, total (minutes/subscription/month)Domestic mobile traffic (minutes/subscription/month)Individuals using the Internet (%)Quality
Population covered by a mobile-cellular network (%)Fixed (wired)-broadband subscriptions (% of total Internet)International Internet bandwidth (bit/s per Internet user)Affordability
Fixed-telephone sub-basket ($ a month)Mobile-cellular sub-basket ($ a month)Fixed-broadband sub-basket ($ a month)Trade
ICT goods exports (% of total goods exports)ICT goods imports (% of total goods imports)ICT service exports (% of total service exports)Applications
Online service index (0–1, 1=highest presence)Secure Internet servers (per million people)
0.62 0.62 2,39162 63 61
3,650 7,220 6,9692.8 3.1 6.2
.. 98 94
75 89 76
Yes YesMixed Mixed
C C
C C
C C
.. ANo A
.. .. 2.5
.. .. 18.2
27.8 26.2a 19.488.2 181.3 92.4
1.2 8.4 10.818.6 51.3 40.613.0a 55.0 36.3
.. .. 1.3110.7 .. 284.4
27.1a 56.8 41.6
99 100 99
9.5 .. 95.51,438 60,621 14,580
.. 8.3 9.4
.. 17.5 14.9
.. 19.5 17.8
.. 0.4 17.6
.. 3.0 14.79.5 7.9 29.1
0.43 0.51 0.42.. 37.0 18.5
Montenegro

149The Little Data Book on Information and Communication Technology 2014
Middle East & North Africa Lower middle income
2005 2012 2012
Country data
Economic and social contextPopulation (millions)Urban population (% of total)GNI per capita, World Bank Atlas method ($)GDP growth, 2000–05 and 2005–12 (avg. annual %)Adult literacy rate (% ages 15 and older) Gross primary, secondary, tertiary school enrollment (%)
Sector structureSeparate telecommunications/ICT regulatorStatus of main fixed-line telephone operatorLevel of competition (competition, partial comp., monopoly) International gateway(s) Mobile telephone service Internet serviceForeign ownership (not allowed, restricted, allowed)Reg. treatment of VoIP (banned, closed, no framework, allowed)
Sector efficiency and capacityTelecommunications revenue (% of GDP)Telecommunications investment (% of revenue)
Sector performanceAccess
Fixed-telephone subscriptions (per 100 people)Mobile-cellular telephone subscriptions (per 100 people)Fixed (wired)-broadband subscriptions (per 100 people)Households with a computer (%)Households with Internet access at home (%)Usage
Int’l. voice traffic, total (minutes/subscription/month)Domestic mobile traffic (minutes/subscription/month)Individuals using the Internet (%)Quality
Population covered by a mobile-cellular network (%)Fixed (wired)-broadband subscriptions (% of total Internet)International Internet bandwidth (bit/s per Internet user)Affordability
Fixed-telephone sub-basket ($ a month)Mobile-cellular sub-basket ($ a month)Fixed-broadband sub-basket ($ a month)Trade
ICT goods exports (% of total goods exports)ICT goods imports (% of total goods imports)ICT service exports (% of total service exports)Applications
Online service index (0–1, 1=highest presence)Secure Internet servers (per million people)
30 33 2,50755 57 39
1,980 2,960 1,8935.0 4.7 6.052 67 71
59 67 64
Yes YesMixed Mixed
C CC CC CA AC A
4.6 4.3 2.5
17.0 16.7 20.5
4.5 10.1 5.441.1 120.0 83.10.8 2.1 1.4
13.2 43.1 15.04.3 38.9 12.4
12.7 9.9 6.5
7.8 68.2 ..15.1 55.0 18.7
98 99 86
95.0 99.7 58.2
1,562 14,871 8,076
.. 2.3 4.9
.. 23.2 10.5
.. 12.2 20.6
6.0 3.1 4.67.0 3.5 7.2
17.0 21.8 47.1
0.29 0.54 0.320.7 3.6 4.4
MoroccoLower
middle-
income
group

150 2014 The Little Data Book on Information and Communication Technology
2005 2012 2012
Country data
Economic and social contextPopulation (millions)Urban population (% of total)GNI per capita, World Bank Atlas method ($)GDP growth, 2000–05 and 2005–12 (avg. annual %)Adult literacy rate (% ages 15 and older) Gross primary, secondary, tertiary school enrollment (%)
Sector structureSeparate telecommunications/ICT regulatorStatus of main fixed-line telephone operatorLevel of competition (competition, partial comp., monopoly) International gateway(s) Mobile telephone service Internet serviceForeign ownership (not allowed, restricted, allowed)Reg. treatment of VoIP (banned, closed, no framework, allowed)
Sector efficiency and capacityTelecommunications revenue (% of GDP)Telecommunications investment (% of revenue)
Sector performanceAccess
Fixed-telephone subscriptions (per 100 people)Mobile-cellular telephone subscriptions (per 100 people)Fixed (wired)-broadband subscriptions (per 100 people)Households with a computer (%)Households with Internet access at home (%)Usage
Int’l. voice traffic, total (minutes/subscription/month)Domestic mobile traffic (minutes/subscription/month)Individuals using the Internet (%)Quality
Population covered by a mobile-cellular network (%)Fixed (wired)-broadband subscriptions (% of total Internet)International Internet bandwidth (bit/s per Internet user)Affordability
Fixed-telephone sub-basket ($ a month)Mobile-cellular sub-basket ($ a month)Fixed-broadband sub-basket ($ a month)Trade
ICT goods exports (% of total goods exports)ICT goods imports (% of total goods imports)ICT service exports (% of total service exports)Applications
Online service index (0–1, 1=highest presence)Secure Internet servers (per million people)
Sub-Saharan Africa Low income
21 25 84630 31 28
290 510 5908.5 6.9 5.948 51 61
52 61 60
Yes YesMixed Mixed
C C
C C
C C
R RB B
1.5 6.2 5.0
24.6 21.7 ..
0.3 0.3 1.07.2 36.2 47.20.0 0.1 0.20.6a 5.9a 4.20.8a 4.7a 3.4
.. 0.8 ..25.6 26.4 70.10.9a 4.8a 6.2
.. .. ..
.. 132.8 30.9
106 1,636 9,141
.. 12.9 8.9
.. 13.0 11.9
.. 58.5 46.9
0.1 0.0 ..4.5 2.3 ..
20.6 31.1 ..
0.26 0.37 0.200.1 1.6 1.1
Low-
income
group
Mozambique
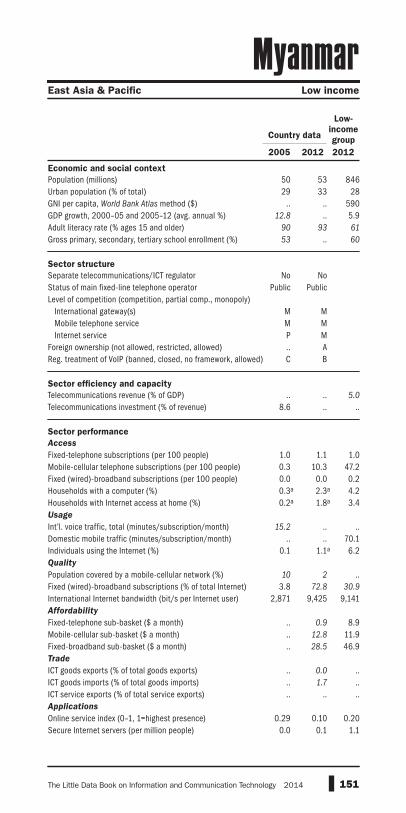
151The Little Data Book on Information and Communication Technology 2014
2005 2012 2012
Country data
Economic and social contextPopulation (millions)Urban population (% of total)GNI per capita, World Bank Atlas method ($)GDP growth, 2000–05 and 2005–12 (avg. annual %)Adult literacy rate (% ages 15 and older) Gross primary, secondary, tertiary school enrollment (%)
Sector structureSeparate telecommunications/ICT regulatorStatus of main fixed-line telephone operatorLevel of competition (competition, partial comp., monopoly) International gateway(s) Mobile telephone service Internet serviceForeign ownership (not allowed, restricted, allowed)Reg. treatment of VoIP (banned, closed, no framework, allowed)
Sector efficiency and capacityTelecommunications revenue (% of GDP)Telecommunications investment (% of revenue)
Sector performanceAccess
Fixed-telephone subscriptions (per 100 people)Mobile-cellular telephone subscriptions (per 100 people)Fixed (wired)-broadband subscriptions (per 100 people)Households with a computer (%)Households with Internet access at home (%)Usage
Int’l. voice traffic, total (minutes/subscription/month)Domestic mobile traffic (minutes/subscription/month)Individuals using the Internet (%)Quality
Population covered by a mobile-cellular network (%)Fixed (wired)-broadband subscriptions (% of total Internet)International Internet bandwidth (bit/s per Internet user)Affordability
Fixed-telephone sub-basket ($ a month)Mobile-cellular sub-basket ($ a month)Fixed-broadband sub-basket ($ a month)Trade
ICT goods exports (% of total goods exports)ICT goods imports (% of total goods imports)ICT service exports (% of total service exports)Applications
Online service index (0–1, 1=highest presence)Secure Internet servers (per million people)
MyanmarEast Asia & Pacific Low income
50 53 84629 33 28
.. .. 59012.8 .. 5.9
90 93 61
53 .. 60
No NoPublic Public
M MM MP M.. AC B
.. .. 5.0
8.6 .. ..
1.0 1.1 1.00.3 10.3 47.20.0 0.0 0.20.3a 2.3a 4.20.2a 1.8a 3.4
15.2 .. .... .. 70.1
0.1 1.1a 6.2
10 2 ..3.8 72.8 30.9
2,871 9,425 9,141
.. 0.9 8.9
.. 12.8 11.9
.. 28.5 46.9
.. 0.0 ..
.. 1.7 ..
.. .. ..
0.29 0.10 0.200.0 0.1 1.1
Low-
income
group

152 2014 The Little Data Book on Information and Communication Technology
2005 2012 2012
Country data
Economic and social contextPopulation (millions)Urban population (% of total)GNI per capita, World Bank Atlas method ($)GDP growth, 2000–05 and 2005–12 (avg. annual %)Adult literacy rate (% ages 15 and older) Gross primary, secondary, tertiary school enrollment (%)
Sector structureSeparate telecommunications/ICT regulatorStatus of main fixed-line telephone operatorLevel of competition (competition, partial comp., monopoly) International gateway(s) Mobile telephone service Internet serviceForeign ownership (not allowed, restricted, allowed)Reg. treatment of VoIP (banned, closed, no framework, allowed)
Sector efficiency and capacityTelecommunications revenue (% of GDP)Telecommunications investment (% of revenue)
Sector performanceAccess
Fixed-telephone subscriptions (per 100 people)Mobile-cellular telephone subscriptions (per 100 people)Fixed (wired)-broadband subscriptions (per 100 people)Households with a computer (%)Households with Internet access at home (%)Usage
Int’l. voice traffic, total (minutes/subscription/month)Domestic mobile traffic (minutes/subscription/month)Individuals using the Internet (%)Quality
Population covered by a mobile-cellular network (%)Fixed (wired)-broadband subscriptions (% of total Internet)International Internet bandwidth (bit/s per Internet user)Affordability
Fixed-telephone sub-basket ($ a month)Mobile-cellular sub-basket ($ a month)Fixed-broadband sub-basket ($ a month)Trade
ICT goods exports (% of total goods exports)ICT goods imports (% of total goods imports)ICT service exports (% of total service exports)Applications
Online service index (0–1, 1=highest presence)Secure Internet servers (per million people)
Sub-Saharan Africa Upper middle income
2 2 2,39135 39 61
3,390 5,610 6,9695.4 4.1 6.276 .. 94
71 .. 76
Yes YesPublic Public
M CM CC CR RB A
4.1 3.2 2.57.5 12.3 18.2
6.9 7.6 19.422.1 95.0 92.40.0 1.2 10.86.9a 14.3a 40.63.0a 13.0a 36.3
.. 6.0 1.3
.. 92.6 284.44.0a 12.9a 41.6
88 100 99
0.2 .. 95.5443 3,564 14,580
.. 12.8 9.4
.. 16.0 14.9
.. 68.7 17.8
0.5 0.6 17.64.8 3.1 14.74.7 27.0 29.1
0.34 0.30 0.426.9 18.2 18.5
Upper
middle-
income
group
Namibia

153The Little Data Book on Information and Communication Technology 2014
2005 2012 2012
Country data
Economic and social contextPopulation (millions)Urban population (% of total)GNI per capita, World Bank Atlas method ($)GDP growth, 2000–05 and 2005–12 (avg. annual %)Adult literacy rate (% ages 15 and older) Gross primary, secondary, tertiary school enrollment (%)
Sector structureSeparate telecommunications/ICT regulatorStatus of main fixed-line telephone operatorLevel of competition (competition, partial comp., monopoly) International gateway(s) Mobile telephone service Internet serviceForeign ownership (not allowed, restricted, allowed)Reg. treatment of VoIP (banned, closed, no framework, allowed)
Sector efficiency and capacityTelecommunications revenue (% of GDP)Telecommunications investment (% of revenue)
Sector performanceAccess
Fixed-telephone subscriptions (per 100 people)Mobile-cellular telephone subscriptions (per 100 people)Fixed (wired)-broadband subscriptions (per 100 people)Households with a computer (%)Households with Internet access at home (%)Usage
Int’l. voice traffic, total (minutes/subscription/month)Domestic mobile traffic (minutes/subscription/month)Individuals using the Internet (%)Quality
Population covered by a mobile-cellular network (%)Fixed (wired)-broadband subscriptions (% of total Internet)International Internet bandwidth (bit/s per Internet user)Affordability
Fixed-telephone sub-basket ($ a month)Mobile-cellular sub-basket ($ a month)Fixed-broadband sub-basket ($ a month)Trade
ICT goods exports (% of total goods exports)ICT goods imports (% of total goods imports)ICT service exports (% of total service exports)Applications
Online service index (0–1, 1=highest presence)Secure Internet servers (per million people)
25 27 84615 17 28
320 700 5903.3 4.5 5.949 57 61
64 77 60
Yes YesPublic Mixed
P CP PC CR RB A
0.9 .. 5.0
26.7 .. ..
1.9 3.0 1.00.9 59.6 47.20.0 0.5 0.21.9 7.8a 4.20.7a 4.1a 3.4
.. .. ..
.. .. 70.10.8 11.1a 6.2
10 35 ..0.0 64.8 30.9
226 1,632 9,141
.. 2.7 8.9
.. 3.5 11.9
.. 8.0 46.9
.. 0.2 ..4.5 5.3 ..
27.2 41.5 ..
0.27 0.29 0.200.5 2.4 1.1
South Asia Low income
NepalLow-
income
group

154 2014 The Little Data Book on Information and Communication Technology
2005 2012 2012
Country data
Economic and social contextPopulation (millions)Urban population (% of total)GNI per capita, World Bank Atlas method ($)GDP growth, 2000–05 and 2005–12 (avg. annual %)Adult literacy rate (% ages 15 and older) Gross primary, secondary, tertiary school enrollment (%)
Sector structureSeparate telecommunications/ICT regulatorStatus of main fixed-line telephone operatorLevel of competition (competition, partial comp., monopoly) International gateway(s) Mobile telephone service Internet serviceForeign ownership (not allowed, restricted, allowed)Reg. treatment of VoIP (banned, closed, no framework, allowed)
Sector efficiency and capacityTelecommunications revenue (% of GDP)Telecommunications investment (% of revenue)
Sector performanceAccess
Fixed-telephone subscriptions (per 100 people)Mobile-cellular telephone subscriptions (per 100 people)Fixed (wired)-broadband subscriptions (per 100 people)Households with a computer (%)Households with Internet access at home (%)Usage
Int’l. voice traffic, total (minutes/subscription/month)Domestic mobile traffic (minutes/subscription/month)Individuals using the Internet (%)Quality
Population covered by a mobile-cellular network (%)Fixed (wired)-broadband subscriptions (% of total Internet)International Internet bandwidth (bit/s per Internet user)Affordability
Fixed-telephone sub-basket ($ a month)Mobile-cellular sub-basket ($ a month)Fixed-broadband sub-basket ($ a month)Trade
ICT goods exports (% of total goods exports)ICT goods imports (% of total goods imports)ICT service exports (% of total service exports)Applications
Online service index (0–1, 1=highest presence)Secure Internet servers (per million people)
16 17 1,30080 84 80
39,880 48,000 38,4121.2 0.7 1.0
.. .. ..97 106 93
Yes YesMixed Mixed
.. C
P C
P C
A AA A
2.2 1.7 2.713.2 26.3 17.6
46.6 43.0 43.697.1 118.0 122.925.1 39.8 26.278.0 97.2a 77.778.3 94.0 75.5
.. .. ..38.8 95.0 113.6
81.0 93.0 75.4
100 100 10073.2 100.0 95.9
25,338 172,864 85,990
.. 35.1 25.2
.. 43.5 20.6
.. 35.4 29.2
16.8 10.2 8.918.7 12.1 10.845.5 45.2 30.8
0.86 0.96 0.67327.1 2,391.3 827.6
High income
NetherlandsHigh-
income
group

155The Little Data Book on Information and Communication Technology 2014
2005 2012 2012
Country data
Economic and social contextPopulation (millions)Urban population (% of total)GNI per capita, World Bank Atlas method ($)GDP growth, 2000–05 and 2005–12 (avg. annual %)Adult literacy rate (% ages 15 and older) Gross primary, secondary, tertiary school enrollment (%)
Sector structureSeparate telecommunications/ICT regulatorStatus of main fixed-line telephone operatorLevel of competition (competition, partial comp., monopoly) International gateway(s) Mobile telephone service Internet serviceForeign ownership (not allowed, restricted, allowed)Reg. treatment of VoIP (banned, closed, no framework, allowed)
Sector efficiency and capacityTelecommunications revenue (% of GDP)Telecommunications investment (% of revenue)
Sector performanceAccess
Fixed-telephone subscriptions (per 100 people)Mobile-cellular telephone subscriptions (per 100 people)Fixed (wired)-broadband subscriptions (per 100 people)Households with a computer (%)Households with Internet access at home (%)Usage
Int’l. voice traffic, total (minutes/subscription/month)Domestic mobile traffic (minutes/subscription/month)Individuals using the Internet (%)Quality
Population covered by a mobile-cellular network (%)Fixed (wired)-broadband subscriptions (% of total Internet)International Internet bandwidth (bit/s per Internet user)Affordability
Fixed-telephone sub-basket ($ a month)Mobile-cellular sub-basket ($ a month)Fixed-broadband sub-basket ($ a month)Trade
ICT goods exports (% of total goods exports)ICT goods imports (% of total goods imports)ICT service exports (% of total service exports)Applications
Online service index (0–1, 1=highest presence)Secure Internet servers (per million people)
0.23 0.26 1,30063 62 80
.. .. 38,412
.. .. 1.0
.. 97 ..
.. .. 93
.. ..
.. ..
.. ..
.. ..
.. ..
.. ..B A
.. .. 2.7
.. .. 17.6
24.2 31.6 43.658.7 91.2 122.94.2 18.9 26.2
18.2 28.2a 77.78.0a 20.3a 75.5
.. .. ..60.1 .. 113.6
32.4 58.0a 75.4
75a 89 10051.2 100.0 95.9
1,784 20,432 85,990
.. .. 25.2
.. .. 20.6
.. .. 29.2
0.2 0.2 8.94.6 3.3 10.88.6 12.7 30.8
.. .. 0.6768.3 242.3 827.6
High income
New CaledoniaHigh-
income
group

156 2014 The Little Data Book on Information and Communication Technology
2005 2012 2012
Country data
4 4 1,30086 86 80
25,150 36,900 38,4124.0 1.2 1.0
.. .. ..106 107 93
Yes YesPrivate Private
C C
C C
C C
A AA A
4.3 2.5 2.76.1 24.1 17.6
41.8 42.2 43.685.4 110.4 122.9
7.8 27.8 26.267.8a 91.2a 77.762.1a 87.4a 75.5
.. .. ..29.5 73.6 113.6
62.7a 89.5a 75.4
98 97 10027.8 90.5 95.9
1,764 31,062 85,990
.. 53.4 25.2
.. 51.6 20.6
.. 59.2 29.2
1.7 1.1 8.99.6 7.7 10.8
12.5 18.6 30.8
0.74 0.78 0.67489.9 1,093.8 827.6
Economic and social contextPopulation (millions)Urban population (% of total)GNI per capita, World Bank Atlas method ($)GDP growth, 2000–05 and 2005–12 (avg. annual %)Adult literacy rate (% ages 15 and older) Gross primary, secondary, tertiary school enrollment (%)
Sector structureSeparate telecommunications/ICT regulatorStatus of main fixed-line telephone operatorLevel of competition (competition, partial comp., monopoly) International gateway(s) Mobile telephone service Internet serviceForeign ownership (not allowed, restricted, allowed)Reg. treatment of VoIP (banned, closed, no framework, allowed)
Sector efficiency and capacityTelecommunications revenue (% of GDP)Telecommunications investment (% of revenue)
Sector performanceAccess
Fixed-telephone subscriptions (per 100 people)Mobile-cellular telephone subscriptions (per 100 people)Fixed (wired)-broadband subscriptions (per 100 people)Households with a computer (%)Households with Internet access at home (%)Usage
Int’l. voice traffic, total (minutes/subscription/month)Domestic mobile traffic (minutes/subscription/month)Individuals using the Internet (%)Quality
Population covered by a mobile-cellular network (%)Fixed (wired)-broadband subscriptions (% of total Internet)International Internet bandwidth (bit/s per Internet user)Affordability
Fixed-telephone sub-basket ($ a month)Mobile-cellular sub-basket ($ a month)Fixed-broadband sub-basket ($ a month)Trade
ICT goods exports (% of total goods exports)ICT goods imports (% of total goods imports)ICT service exports (% of total service exports)Applications
Online service index (0–1, 1=highest presence)Secure Internet servers (per million people)
High income
New ZealandHigh-
income
group

157The Little Data Book on Information and Communication Technology 2014
2005 2012 2012
Country data
Economic and social contextPopulation (millions)Urban population (% of total)GNI per capita, World Bank Atlas method ($)GDP growth, 2000–05 and 2005–12 (avg. annual %)Adult literacy rate (% ages 15 and older) Gross primary, secondary, tertiary school enrollment (%)
Sector structureSeparate telecommunications/ICT regulatorStatus of main fixed-line telephone operatorLevel of competition (competition, partial comp., monopoly) International gateway(s) Mobile telephone service Internet serviceForeign ownership (not allowed, restricted, allowed)Reg. treatment of VoIP (banned, closed, no framework, allowed)
Sector efficiency and capacityTelecommunications revenue (% of GDP)Telecommunications investment (% of revenue)
Sector performanceAccess
Fixed-telephone subscriptions (per 100 people)Mobile-cellular telephone subscriptions (per 100 people)Fixed (wired)-broadband subscriptions (per 100 people)Households with a computer (%)Households with Internet access at home (%)Usage
Int’l. voice traffic, total (minutes/subscription/month)Domestic mobile traffic (minutes/subscription/month)Individuals using the Internet (%)Quality
Population covered by a mobile-cellular network (%)Fixed (wired)-broadband subscriptions (% of total Internet)International Internet bandwidth (bit/s per Internet user)Affordability
Fixed-telephone sub-basket ($ a month)Mobile-cellular sub-basket ($ a month)Fixed-broadband sub-basket ($ a month)Trade
ICT goods exports (% of total goods exports)ICT goods imports (% of total goods imports)ICT service exports (% of total service exports)Applications
Online service index (0–1, 1=highest presence)Secure Internet servers (per million people)
5 6 2,50756 58 39
1,160 1,650 1,8933.1 3.2 6.078 .. 71
.. .. 64
Yes YesPrivate Private
.. MC CC CA AB A
2.9 .. 2.5
24.0 .. 20.5
4.0 5.0 5.420.5 86.1 83.1
0.2 1.6 1.43.8 9.9a 15.00.1 7.4a 12.4
.. .. 6.5
.. .. ..2.6 13.5a 18.7
70 100 86
45.0 100.0 58.2
43 24,725 8,076
.. 3.8 4.9
.. 27.8 10.5
.. 22.2 20.6
0.1 0.2 4.66.1 4.1 7.2
.. 18.7 47.1
0.37 0.31 0.322.0 8.4 4.4
Latin America & Caribbean Lower middle income
NicaraguaLower
middle-
income
group

158 2014 The Little Data Book on Information and Communication Technology
2005 2012 2012
Country data
Economic and social contextPopulation (millions)Urban population (% of total)GNI per capita, World Bank Atlas method ($)GDP growth, 2000–05 and 2005–12 (avg. annual %)Adult literacy rate (% ages 15 and older) Gross primary, secondary, tertiary school enrollment (%)
Sector structureSeparate telecommunications/ICT regulatorStatus of main fixed-line telephone operatorLevel of competition (competition, partial comp., monopoly) International gateway(s) Mobile telephone service Internet serviceForeign ownership (not allowed, restricted, allowed)Reg. treatment of VoIP (banned, closed, no framework, allowed)
Sector efficiency and capacityTelecommunications revenue (% of GDP)Telecommunications investment (% of revenue)
Sector performanceAccess
Fixed-telephone subscriptions (per 100 people)Mobile-cellular telephone subscriptions (per 100 people)Fixed (wired)-broadband subscriptions (per 100 people)Households with a computer (%)Households with Internet access at home (%)Usage
Int’l. voice traffic, total (minutes/subscription/month)Domestic mobile traffic (minutes/subscription/month)Individuals using the Internet (%)Quality
Population covered by a mobile-cellular network (%)Fixed (wired)-broadband subscriptions (% of total Internet)International Internet bandwidth (bit/s per Internet user)Affordability
Fixed-telephone sub-basket ($ a month)Mobile-cellular sub-basket ($ a month)Fixed-broadband sub-basket ($ a month)Trade
ICT goods exports (% of total goods exports)ICT goods imports (% of total goods imports)ICT service exports (% of total service exports)Applications
Online service index (0–1, 1=highest presence)Secure Internet servers (per million people)
13 17 84617 18 28
250 390 5903.7 5.2 5.929 .. 61
26 38 60
Yes YesMixed Mixed
.. ..C C
M M
R RB B
2.2 4.6 5.0
56.5 .. ..
0.2 0.6 1.02.5 31.4 47.20.0 0.0 0.20.1a 1.8a 4.20.0a 1.4a 3.4
.. .. ..
.. 18,471.9 70.10.2a 1.4a 6.2
15 75 ..5.9 13.4 30.9
1,028 3,499 9,141
.. 11.7 8.9
.. 16.6 11.9
.. 59.6 46.9
0.2 0.2 ..3.2 1.9 ..
34.3 5.4 ..
0.11 0.20 0.200.1 0.2 1.1
Sub-Saharan Africa Low income
NigerLow-
income
group

159The Little Data Book on Information and Communication Technology 2014
2005 2012 2012
Country data
Economic and social contextPopulation (millions)Urban population (% of total)GNI per capita, World Bank Atlas method ($)GDP growth, 2000–05 and 2005–12 (avg. annual %)Adult literacy rate (% ages 15 and older) Gross primary, secondary, tertiary school enrollment (%)
Sector structureSeparate telecommunications/ICT regulatorStatus of main fixed-line telephone operatorLevel of competition (competition, partial comp., monopoly) International gateway(s) Mobile telephone service Internet serviceForeign ownership (not allowed, restricted, allowed)Reg. treatment of VoIP (banned, closed, no framework, allowed)
Sector efficiency and capacityTelecommunications revenue (% of GDP)Telecommunications investment (% of revenue)
Sector performanceAccess
Fixed-telephone subscriptions (per 100 people)Mobile-cellular telephone subscriptions (per 100 people)Fixed (wired)-broadband subscriptions (per 100 people)Households with a computer (%)Households with Internet access at home (%)Usage
Int’l. voice traffic, total (minutes/subscription/month)Domestic mobile traffic (minutes/subscription/month)Individuals using the Internet (%)Quality
Population covered by a mobile-cellular network (%)Fixed (wired)-broadband subscriptions (% of total Internet)International Internet bandwidth (bit/s per Internet user)Affordability
Fixed-telephone sub-basket ($ a month)Mobile-cellular sub-basket ($ a month)Fixed-broadband sub-basket ($ a month)Trade
ICT goods exports (% of total goods exports)ICT goods imports (% of total goods imports)ICT service exports (% of total service exports)Applications
Online service index (0–1, 1=highest presence)Secure Internet servers (per million people)
140 169 2,50746 50 39
630 1,440 1,8936.6 6.9 6.055 51 71
56 .. 64
Yes YesPublic Mixed
.. C
P C
C C
A AA A
3.1 2.6 2.5
0.4 75.5 20.5
0.9 0.2 5.413.3 66.8 83.1
0.0 0.0 1.44.0 11.4a 15.02.0a 9.1a 12.4
6.2 4.6 6.5
27.4 37.6 ..3.5 32.9a 18.7
58 96 86
.. 44.6 58.2
30 306 8,076
.. 9.5 4.9
.. 9.8 10.5
.. 39.0 20.6
0.0 0.0 4.63.9 5.5 7.21.6 4.4 47.1
0.31 0.22 0.320.2 1.7 4.4
Sub-Saharan Africa Lower middle income
NigeriaLower
middle-
income
group

160 2014 The Little Data Book on Information and Communication Technology
2005 2012 2012
Country data
Economic and social contextPopulation (millions)Urban population (% of total)GNI per capita, World Bank Atlas method ($)GDP growth, 2000–05 and 2005–12 (avg. annual %)Adult literacy rate (% ages 15 and older) Gross primary, secondary, tertiary school enrollment (%)
Sector structureSeparate telecommunications/ICT regulatorStatus of main fixed-line telephone operatorLevel of competition (competition, partial comp., monopoly) International gateway(s) Mobile telephone service Internet serviceForeign ownership (not allowed, restricted, allowed)Reg. treatment of VoIP (banned, closed, no framework, allowed)
Sector efficiency and capacityTelecommunications revenue (% of GDP)Telecommunications investment (% of revenue)
Sector performanceAccess
Fixed-telephone subscriptions (per 100 people)Mobile-cellular telephone subscriptions (per 100 people)Fixed (wired)-broadband subscriptions (per 100 people)Households with a computer (%)Households with Internet access at home (%)Usage
Int’l. voice traffic, total (minutes/subscription/month)Domestic mobile traffic (minutes/subscription/month)Individuals using the Internet (%)Quality
Population covered by a mobile-cellular network (%)Fixed (wired)-broadband subscriptions (% of total Internet)International Internet bandwidth (bit/s per Internet user)Affordability
Fixed-telephone sub-basket ($ a month)Mobile-cellular sub-basket ($ a month)Fixed-broadband sub-basket ($ a month)Trade
ICT goods exports (% of total goods exports)ICT goods imports (% of total goods imports)ICT service exports (% of total service exports)Applications
Online service index (0–1, 1=highest presence)Secure Internet servers (per million people)
High-
income
group
0.06 0.05 1,30091 92 80
.. .. 38,412
.. .. 1.0
.. .. ..
.. .. 93
.. ..
.. ..
.. ..
.. ..
.. ..
.. ..
.. ..
.. .. 2.7
.. .. 17.6
36.2 43.1 43.631.0 .. 122.90.0 0.0 26.2
.. .. 77.730.9 .. 75.5
.. .. ..
.. .. 113.6
.. .. 75.4
.. .. 100
.. .. 95.9
.. .. 85,990
.. .. 25.2
.. .. 20.6
.. .. 29.2
.. .. 8.9
.. .. 10.8
.. .. 30.8
.. .. 0.6783.6 37.0 827.6
High income
Northern Mariana Islands

161The Little Data Book on Information and Communication Technology 2014
2005 2012 2012
High-
income
groupCountry data
Economic and social contextPopulation (millions)Urban population (% of total)GNI per capita, World Bank Atlas method ($)GDP growth, 2000–05 and 2005–12 (avg. annual %)Adult literacy rate (% ages 15 and older) Gross primary, secondary, tertiary school enrollment (%)
Sector structureSeparate telecommunications/ICT regulatorStatus of main fixed-line telephone operatorLevel of competition (competition, partial comp., monopoly) International gateway(s) Mobile telephone service Internet serviceForeign ownership (not allowed, restricted, allowed)Reg. treatment of VoIP (banned, closed, no framework, allowed)
Sector efficiency and capacityTelecommunications revenue (% of GDP)Telecommunications investment (% of revenue)
Sector performanceAccess
Fixed-telephone subscriptions (per 100 people)Mobile-cellular telephone subscriptions (per 100 people)Fixed (wired)-broadband subscriptions (per 100 people)Households with a computer (%)Households with Internet access at home (%)Usage
Int’l. voice traffic, total (minutes/subscription/month)Domestic mobile traffic (minutes/subscription/month)Individuals using the Internet (%)Quality
Population covered by a mobile-cellular network (%)Fixed (wired)-broadband subscriptions (% of total Internet)International Internet bandwidth (bit/s per Internet user)Affordability
Fixed-telephone sub-basket ($ a month)Mobile-cellular sub-basket ($ a month)Fixed-broadband sub-basket ($ a month)Trade
ICT goods exports (% of total goods exports)ICT goods imports (% of total goods imports)ICT service exports (% of total service exports)Applications
Online service index (0–1, 1=highest presence)Secure Internet servers (per million people)
5 5 1,30077 80 80
62,760 98,780 38,4122.1 0.8 1.0
.. .. ..99 98 93
Yes YesMixed Mixed
.. C
P C
C C
A AA A
1.6 1.1 2.7.. .. 17.6
45.6 28.0 43.6102.8 116.7 122.9
21.4 36.3 26.274.0 92.0 77.764.0 93.0 75.5
.. .. ..119.3 174.7 113.6
82.0 95.0 75.4
.. .. 10069.8 100.0 95.9
11,346 187,809 85,990
.. 38.0 25.2
.. 25.2 20.6
.. 53.3 29.2
1.2 0.8 8.98.8 7.1 10.8
24.4 29.1 30.8
0.89 0.86 0.67308.9 1,741.9 827.6
High income
Norway

162 2014 The Little Data Book on Information and Communication Technology
2005 2012 2012
Country data
Economic and social contextPopulation (millions)Urban population (% of total)GNI per capita, World Bank Atlas method ($)GDP growth, 2000–05 and 2005–12 (avg. annual %)Adult literacy rate (% ages 15 and older) Gross primary, secondary, tertiary school enrollment (%)
Sector structureSeparate telecommunications/ICT regulatorStatus of main fixed-line telephone operatorLevel of competition (competition, partial comp., monopoly) International gateway(s) Mobile telephone service Internet serviceForeign ownership (not allowed, restricted, allowed)Reg. treatment of VoIP (banned, closed, no framework, allowed)
Sector efficiency and capacityTelecommunications revenue (% of GDP)Telecommunications investment (% of revenue)
Sector performanceAccess
Fixed-telephone subscriptions (per 100 people)Mobile-cellular telephone subscriptions (per 100 people)Fixed (wired)-broadband subscriptions (per 100 people)Households with a computer (%)Households with Internet access at home (%)Usage
Int’l. voice traffic, total (minutes/subscription/month)Domestic mobile traffic (minutes/subscription/month)Individuals using the Internet (%)Quality
Population covered by a mobile-cellular network (%)Fixed (wired)-broadband subscriptions (% of total Internet)International Internet bandwidth (bit/s per Internet user)Affordability
Fixed-telephone sub-basket ($ a month)Mobile-cellular sub-basket ($ a month)Fixed-broadband sub-basket ($ a month)Trade
ICT goods exports (% of total goods exports)ICT goods imports (% of total goods imports)ICT service exports (% of total service exports)Applications
Online service index (0–1, 1=highest presence)Secure Internet servers (per million people)
High-
income
group
3 3 1,30072 74 80
10,780 19,450 38,4123.1 5.7 1.081 87 ..68 77 93
Yes YesMixed Mixed
M CP PM CR AB A
3.0 2.4 2.7102.5 10.8 17.6
10.5 9.2 43.652.9 159.3 122.9
0.5 2.1 26.237.2 62.7a 77.715.5a 41.9a 75.5
18.1 17.0 ..99.9 108.9 113.6
6.7 60.0a 75.4
92 98 10024.4 92.1 95.9
2,960 8,948 85,990
.. 13.2 25.2
.. 8.7 20.6
.. 26.0 29.2
0.2 0.1 8.94.4 3.0 10.8
21.9 24.1 30.8
0.47 0.67 0.674.0 62.8 827.6
High income
Oman

163The Little Data Book on Information and Communication Technology 2014
2005 2012 2012
Country data
Economic and social contextPopulation (millions)Urban population (% of total)GNI per capita, World Bank Atlas method ($)GDP growth, 2000–05 and 2005–12 (avg. annual %)Adult literacy rate (% ages 15 and older) Gross primary, secondary, tertiary school enrollment (%)
Sector structureSeparate telecommunications/ICT regulatorStatus of main fixed-line telephone operatorLevel of competition (competition, partial comp., monopoly) International gateway(s) Mobile telephone service Internet serviceForeign ownership (not allowed, restricted, allowed)Reg. treatment of VoIP (banned, closed, no framework, allowed)
Sector efficiency and capacityTelecommunications revenue (% of GDP)Telecommunications investment (% of revenue)
Sector performanceAccess
Fixed-telephone subscriptions (per 100 people)Mobile-cellular telephone subscriptions (per 100 people)Fixed (wired)-broadband subscriptions (per 100 people)Households with a computer (%)Households with Internet access at home (%)Usage
Int’l. voice traffic, total (minutes/subscription/month)Domestic mobile traffic (minutes/subscription/month)Individuals using the Internet (%)Quality
Population covered by a mobile-cellular network (%)Fixed (wired)-broadband subscriptions (% of total Internet)International Internet bandwidth (bit/s per Internet user)Affordability
Fixed-telephone sub-basket ($ a month)Mobile-cellular sub-basket ($ a month)Fixed-broadband sub-basket ($ a month)Trade
ICT goods exports (% of total goods exports)ICT goods imports (% of total goods imports)ICT service exports (% of total service exports)Applications
Online service index (0–1, 1=highest presence)Secure Internet servers (per million people)
158 179 2,50734 37 39
710 1,260 1,8935.0 3.1 6.050 55 71
41 45 64
Yes YesPublic Mixed
C CP CC CA A
No A
2.2 2.0 2.5
61.0 39.7 20.5
3.3 3.2 5.48.1 67.1 83.10.0 0.5 1.48.1 12.5a 15.0
.. 8.3a 12.4
4.0 8.3 6.5
40.9 135.6 ..6.3 10.0a 18.7
36 92 86
0.7 25.6 58.2
72 7,283 8,076
.. 3.5 4.9
.. 3.5 10.5
.. 14.5 20.6
0.5 0.2 4.68.7 4.4 7.2
17.9 20.1 47.1
0.32 0.37 0.320.3 1.3 4.4
Lower
middle-
income
group
South Asia Lower middle income
Pakistan

164 2014 The Little Data Book on Information and Communication Technology
2005 2012 2012
Upper
middle-
income
groupCountry data
Economic and social contextPopulation (millions)Urban population (% of total)GNI per capita, World Bank Atlas method ($)GDP growth, 2000–05 and 2005–12 (avg. annual %)Adult literacy rate (% ages 15 and older) Gross primary, secondary, tertiary school enrollment (%)
Sector structureSeparate telecommunications/ICT regulatorStatus of main fixed-line telephone operatorLevel of competition (competition, partial comp., monopoly) International gateway(s) Mobile telephone service Internet serviceForeign ownership (not allowed, restricted, allowed)Reg. treatment of VoIP (banned, closed, no framework, allowed)
Sector efficiency and capacityTelecommunications revenue (% of GDP)Telecommunications investment (% of revenue)
Sector performanceAccess
Fixed-telephone subscriptions (per 100 people)Mobile-cellular telephone subscriptions (per 100 people)Fixed (wired)-broadband subscriptions (per 100 people)Households with a computer (%)Households with Internet access at home (%)Usage
Int’l. voice traffic, total (minutes/subscription/month)Domestic mobile traffic (minutes/subscription/month)Individuals using the Internet (%)Quality
Population covered by a mobile-cellular network (%)Fixed (wired)-broadband subscriptions (% of total Internet)International Internet bandwidth (bit/s per Internet user)Affordability
Fixed-telephone sub-basket ($ a month)Mobile-cellular sub-basket ($ a month)Fixed-broadband sub-basket ($ a month)Trade
ICT goods exports (% of total goods exports)ICT goods imports (% of total goods imports)ICT service exports (% of total service exports)Applications
Online service index (0–1, 1=highest presence)Secure Internet servers (per million people)
0.02 0.02 2,39178 85 61
8,910 9,860 6,9693.2 –1.9 6.2
.. .. 94
.. .. 76
.. ..Public Public
.. ..
.. ..
.. ..
.. ..
.. ..
.. .. 2.5
.. .. 18.2
40.1 35.3 19.430.4 82.6 92.4
0.5 4.4 10.818.5 .. 40.6
.. 19.0 36.3
50.7 23.8 1.3.. .. 284.4
27.0 .. 41.6
30 98 99
7.6 79.2 95.51,123 .. 14,580
.. .. 9.4
.. .. 14.9
.. .. 17.8
.. 1.0 17.6
.. 2.5 14.7
.. .. 29.1
0.00 0.18 0.4250.5 95.2 18.5
East Asia & Pacific Upper middle income
Palau

165The Little Data Book on Information and Communication Technology 2014
2005 2012 2012
Country data
Economic and social contextPopulation (millions)Urban population (% of total)GNI per capita, World Bank Atlas method ($)GDP growth, 2000–05 and 2005–12 (avg. annual %)Adult literacy rate (% ages 15 and older) Gross primary, secondary, tertiary school enrollment (%)
Sector structureSeparate telecommunications/ICT regulatorStatus of main fixed-line telephone operatorLevel of competition (competition, partial comp., monopoly) International gateway(s) Mobile telephone service Internet serviceForeign ownership (not allowed, restricted, allowed)Reg. treatment of VoIP (banned, closed, no framework, allowed)
Sector efficiency and capacityTelecommunications revenue (% of GDP)Telecommunications investment (% of revenue)
Sector performanceAccess
Fixed-telephone subscriptions (per 100 people)Mobile-cellular telephone subscriptions (per 100 people)Fixed (wired)-broadband subscriptions (per 100 people)Households with a computer (%)Households with Internet access at home (%)Usage
Int’l. voice traffic, total (minutes/subscription/month)Domestic mobile traffic (minutes/subscription/month)Individuals using the Internet (%)Quality
Population covered by a mobile-cellular network (%)Fixed (wired)-broadband subscriptions (% of total Internet)International Internet bandwidth (bit/s per Internet user)Affordability
Fixed-telephone sub-basket ($ a month)Mobile-cellular sub-basket ($ a month)Fixed-broadband sub-basket ($ a month)Trade
ICT goods exports (% of total goods exports)ICT goods imports (% of total goods imports)ICT service exports (% of total service exports)Applications
Online service index (0–1, 1=highest presence)Secure Internet servers (per million people)
Upper
middle-
income
group
3 4 2,39171 76 61
4,460 8,510 6,9694.4 8.7 6.292 94 94
76 74 76
Yes YesMixed Mixed
.. CP CC CA A
No A
3.7 2.5 2.5.. .. 18.2
14.0 16.8 19.452.0 178.0 92.4
0.5 7.8 10.814.6a 38.3 40.6
8.1 31.6 36.3
.. 6.7 1.361.3 79.2 284.411.5 45.2a 41.6
75 96 99
21.3 98.4 95.52,396 30,838 14,580
.. 9.5 9.4
.. 12.6 14.9
.. 14.0 17.8
0.1 7.9 17.69.1 8.1 14.7
10.6 8.1 29.1
0.47 0.46 0.4254.1 89.8 18.5
Latin America & Caribbean Upper middle income
Panama

166 2014 The Little Data Book on Information and Communication Technology
2005 2012 2012
Country data
Economic and social contextPopulation (millions)Urban population (% of total)GNI per capita, World Bank Atlas method ($)GDP growth, 2000–05 and 2005–12 (avg. annual %)Adult literacy rate (% ages 15 and older) Gross primary, secondary, tertiary school enrollment (%)
Sector structureSeparate telecommunications/ICT regulatorStatus of main fixed-line telephone operatorLevel of competition (competition, partial comp., monopoly) International gateway(s) Mobile telephone service Internet serviceForeign ownership (not allowed, restricted, allowed)Reg. treatment of VoIP (banned, closed, no framework, allowed)
Sector efficiency and capacityTelecommunications revenue (% of GDP)Telecommunications investment (% of revenue)
Sector performanceAccess
Fixed-telephone subscriptions (per 100 people)Mobile-cellular telephone subscriptions (per 100 people)Fixed (wired)-broadband subscriptions (per 100 people)Households with a computer (%)Households with Internet access at home (%)Usage
Int’l. voice traffic, total (minutes/subscription/month)Domestic mobile traffic (minutes/subscription/month)Individuals using the Internet (%)Quality
Population covered by a mobile-cellular network (%)Fixed (wired)-broadband subscriptions (% of total Internet)International Internet bandwidth (bit/s per Internet user)Affordability
Fixed-telephone sub-basket ($ a month)Mobile-cellular sub-basket ($ a month)Fixed-broadband sub-basket ($ a month)Trade
ICT goods exports (% of total goods exports)ICT goods imports (% of total goods imports)ICT service exports (% of total service exports)Applications
Online service index (0–1, 1=highest presence)Secure Internet servers (per million people)
Lower
middle-
income
group
6 7 2,50713 13 39
680 1,790 1,8931.6 6.9 6.057 62 71
.. .. 64
Yes YesPublic Public
.. ..M M
P P
.. ..A A
.. .. 2.5
.. .. 20.5
1.0 1.9 5.41.2 37.8 83.10.0 0.1 1.42.0a 3.2a 15.01.1a 2.7a 12.4
.. .. 6.5
.. .. ..1.7 2.3a 18.7
.. .. 86
.. .. 58.2
57 4,849 8,076
.. 11.5 4.9
.. 30.4 10.5
.. 185.6 20.6
0.0 0.0 4.63.2 2.2 7.2
72.8 49.3 47.1
0.21 0.23 0.320.5 7.8 4.4
East Asia & Pacific Lower middle income
Papua New Guinea

167The Little Data Book on Information and Communication Technology 2014
2005 2012 2012
Country data
Economic and social contextPopulation (millions)Urban population (% of total)GNI per capita, World Bank Atlas method ($)GDP growth, 2000–05 and 2005–12 (avg. annual %)Adult literacy rate (% ages 15 and older) Gross primary, secondary, tertiary school enrollment (%)
Sector structureSeparate telecommunications/ICT regulatorStatus of main fixed-line telephone operatorLevel of competition (competition, partial comp., monopoly) International gateway(s) Mobile telephone service Internet serviceForeign ownership (not allowed, restricted, allowed)Reg. treatment of VoIP (banned, closed, no framework, allowed)
Sector efficiency and capacityTelecommunications revenue (% of GDP)Telecommunications investment (% of revenue)
Sector performanceAccess
Fixed-telephone subscriptions (per 100 people)Mobile-cellular telephone subscriptions (per 100 people)Fixed (wired)-broadband subscriptions (per 100 people)Households with a computer (%)Households with Internet access at home (%)Usage
Int’l. voice traffic, total (minutes/subscription/month)Domestic mobile traffic (minutes/subscription/month)Individuals using the Internet (%)Quality
Population covered by a mobile-cellular network (%)Fixed (wired)-broadband subscriptions (% of total Internet)International Internet bandwidth (bit/s per Internet user)Affordability
Fixed-telephone sub-basket ($ a month)Mobile-cellular sub-basket ($ a month)Fixed-broadband sub-basket ($ a month)Trade
ICT goods exports (% of total goods exports)ICT goods imports (% of total goods imports)ICT service exports (% of total service exports)Applications
Online service index (0–1, 1=highest presence)Secure Internet servers (per million people)
Lower
middle-
income
group
6 7 2,50758 62 39
1,210 3,400 1,8932.2 4.3 6.095 94 71
72 74 64
Yes YesPublic Public
.. CC CC CR AB A
3.5 3.7 2.5
.. .. 20.5
5.4 6.1 5.432.0 101.6 83.1
0.1 1.2 1.48.7 24.3a 15.01.7 22.8a 12.4
.. 7.2 6.5
.. 81.6 ..7.9 27.1a 18.7
.. 94 86
9.3 98.3 58.2
737 11,585 8,076
.. 8.8 4.9
.. 8.8 10.5
.. 21.8 20.6
0.2 0.1 4.617.4 19.1 7.28.7 1.9 47.1
0.47 0.46 0.321.4 15.4 4.4
Latin America & Caribbean Lower middle income
Paraguay

168 2014 The Little Data Book on Information and Communication Technology
2005 2012 2012
Country data
Economic and social contextPopulation (millions)Urban population (% of total)GNI per capita, World Bank Atlas method ($)GDP growth, 2000–05 and 2005–12 (avg. annual %)Adult literacy rate (% ages 15 and older) Gross primary, secondary, tertiary school enrollment (%)
Sector structureSeparate telecommunications/ICT regulatorStatus of main fixed-line telephone operatorLevel of competition (competition, partial comp., monopoly) International gateway(s) Mobile telephone service Internet serviceForeign ownership (not allowed, restricted, allowed)Reg. treatment of VoIP (banned, closed, no framework, allowed)
Sector efficiency and capacityTelecommunications revenue (% of GDP)Telecommunications investment (% of revenue)
Sector performanceAccess
Fixed-telephone subscriptions (per 100 people)Mobile-cellular telephone subscriptions (per 100 people)Fixed (wired)-broadband subscriptions (per 100 people)Households with a computer (%)Households with Internet access at home (%)Usage
Int’l. voice traffic, total (minutes/subscription/month)Domestic mobile traffic (minutes/subscription/month)Individuals using the Internet (%)Quality
Population covered by a mobile-cellular network (%)Fixed (wired)-broadband subscriptions (% of total Internet)International Internet bandwidth (bit/s per Internet user)Affordability
Fixed-telephone sub-basket ($ a month)Mobile-cellular sub-basket ($ a month)Fixed-broadband sub-basket ($ a month)Trade
ICT goods exports (% of total goods exports)ICT goods imports (% of total goods imports)ICT service exports (% of total service exports)Applications
Online service index (0–1, 1=highest presence)Secure Internet servers (per million people)
Upper
middle-
income
group
28 30 2,39175 78 61
2,700 6,060 6,9694.3 6.9 6.288 .. 94
81 82 76
Yes YesPrivate Private
.. ..C CC CA AA A
2.7 2.7 2.517.9 16.7 18.2
8.7 11.4 19.420.1 98.0 92.41.3 4.7 10.88.2 29.9 40.63.5 20.2 36.3
13.7 9.5 1.340.5 58.6 284.417.1a 38.2 41.6
92 97 99
42.3 98.2 95.52,109 13,094 14,580
.. 12.3 9.4
.. 12.8 14.9
.. 18.0 17.8
0.2 0.1 17.68.4 7.8 14.7
13.9 15.1 29.1
0.53 0.52 0.425.2 21.4 18.5
Latin America & Caribbean Upper middle income
Peru

169The Little Data Book on Information and Communication Technology 2014
2005 2012 2012
Country data
Economic and social contextPopulation (millions)Urban population (% of total)GNI per capita, World Bank Atlas method ($)GDP growth, 2000–05 and 2005–12 (avg. annual %)Adult literacy rate (% ages 15 and older) Gross primary, secondary, tertiary school enrollment (%)
Sector structureSeparate telecommunications/ICT regulatorStatus of main fixed-line telephone operatorLevel of competition (competition, partial comp., monopoly) International gateway(s) Mobile telephone service Internet serviceForeign ownership (not allowed, restricted, allowed)Reg. treatment of VoIP (banned, closed, no framework, allowed)
Sector efficiency and capacityTelecommunications revenue (% of GDP)Telecommunications investment (% of revenue)
Sector performanceAccess
Fixed-telephone subscriptions (per 100 people)Mobile-cellular telephone subscriptions (per 100 people)Fixed (wired)-broadband subscriptions (per 100 people)Households with a computer (%)Households with Internet access at home (%)Usage
Int’l. voice traffic, total (minutes/subscription/month)Domestic mobile traffic (minutes/subscription/month)Individuals using the Internet (%)Quality
Population covered by a mobile-cellular network (%)Fixed (wired)-broadband subscriptions (% of total Internet)International Internet bandwidth (bit/s per Internet user)Affordability
Fixed-telephone sub-basket ($ a month)Mobile-cellular sub-basket ($ a month)Fixed-broadband sub-basket ($ a month)Trade
ICT goods exports (% of total goods exports)ICT goods imports (% of total goods imports)ICT service exports (% of total service exports)Applications
Online service index (0–1, 1=highest presence)Secure Internet servers (per million people)
Lower
middle-
income
group
86 97 2,50748 49 39
1,210 2,500 1,8934.7 4.8 6.093 95 71
78 76 64
Yes YesPrivate Private
.. ..C C
C C
R RA A
4.2 2.4 2.5
24.4 24.0 20.5
3.9 4.1 5.440.5 106.5 83.1
0.1 2.2 1.46.6a 16.9a 15.04.3a 18.9a 12.4
.. .. 6.5
.. .. ..5.4a 36.2a 18.7
99 99a 86
8.5 34.5 58.2
694 14,269 8,076
.. 15.0 4.9
.. 10.5 10.5
.. 22.9 20.6
47.7 29.5 4.645.8 24.8 7.215.9 67.3 47.1
0.50 0.50 0.322.4 8.1 4.4
East Asia & Pacific Lower middle income
Philippines

170 2014 The Little Data Book on Information and Communication Technology
2005 2012 2012
Country data
Economic and social contextPopulation (millions)Urban population (% of total)GNI per capita, World Bank Atlas method ($)GDP growth, 2000–05 and 2005–12 (avg. annual %)Adult literacy rate (% ages 15 and older) Gross primary, secondary, tertiary school enrollment (%)
Sector structureSeparate telecommunications/ICT regulatorStatus of main fixed-line telephone operatorLevel of competition (competition, partial comp., monopoly) International gateway(s) Mobile telephone service Internet serviceForeign ownership (not allowed, restricted, allowed)Reg. treatment of VoIP (banned, closed, no framework, allowed)
Sector efficiency and capacityTelecommunications revenue (% of GDP)Telecommunications investment (% of revenue)
Sector performanceAccess
Fixed-telephone subscriptions (per 100 people)Mobile-cellular telephone subscriptions (per 100 people)Fixed (wired)-broadband subscriptions (per 100 people)Households with a computer (%)Households with Internet access at home (%)Usage
Int’l. voice traffic, total (minutes/subscription/month)Domestic mobile traffic (minutes/subscription/month)Individuals using the Internet (%)Quality
Population covered by a mobile-cellular network (%)Fixed (wired)-broadband subscriptions (% of total Internet)International Internet bandwidth (bit/s per Internet user)Affordability
Fixed-telephone sub-basket ($ a month)Mobile-cellular sub-basket ($ a month)Fixed-broadband sub-basket ($ a month)Trade
ICT goods exports (% of total goods exports)ICT goods imports (% of total goods imports)ICT service exports (% of total service exports)Applications
Online service index (0–1, 1=highest presence)Secure Internet servers (per million people)
High-
income
group
38 39 1,30061 61 80
7,270 12,660 38,4123.2 4.2 1.0100 100 ..
87 90 93
Yes YesMixed Mixed
C C
C P
C C
A AA A
3.8 2.7 2.716.1 14.9 17.6
31.0 15.6 43.676.3 140.3 122.9
2.5 15.5 26.240.0 73.0 77.730.4 70.0 75.5
.. .. ..46.7 105.9 113.6
38.8 65.0 75.4
99 100 10035.2 99.1 95.9
1,442 70,620 85,990
.. 21.6 25.2
.. 11.3 20.6
.. 19.9 29.2
4.0 7.0 8.97.9 8.2 10.8
19.6 33.7 30.8
0.61 0.54 0.6722.0 312.2 827.6
High income
Poland

171The Little Data Book on Information and Communication Technology 2014
2005 2012 2012
Country data
Economic and social contextPopulation (millions)Urban population (% of total)GNI per capita, World Bank Atlas method ($)GDP growth, 2000–05 and 2005–12 (avg. annual %)Adult literacy rate (% ages 15 and older) Gross primary, secondary, tertiary school enrollment (%)
Sector structureSeparate telecommunications/ICT regulatorStatus of main fixed-line telephone operatorLevel of competition (competition, partial comp., monopoly) International gateway(s) Mobile telephone service Internet serviceForeign ownership (not allowed, restricted, allowed)Reg. treatment of VoIP (banned, closed, no framework, allowed)
Sector efficiency and capacityTelecommunications revenue (% of GDP)Telecommunications investment (% of revenue)
Sector performanceAccess
Fixed-telephone subscriptions (per 100 people)Mobile-cellular telephone subscriptions (per 100 people)Fixed (wired)-broadband subscriptions (per 100 people)Households with a computer (%)Households with Internet access at home (%)Usage
Int’l. voice traffic, total (minutes/subscription/month)Domestic mobile traffic (minutes/subscription/month)Individuals using the Internet (%)Quality
Population covered by a mobile-cellular network (%)Fixed (wired)-broadband subscriptions (% of total Internet)International Internet bandwidth (bit/s per Internet user)Affordability
Fixed-telephone sub-basket ($ a month)Mobile-cellular sub-basket ($ a month)Fixed-broadband sub-basket ($ a month)Trade
ICT goods exports (% of total goods exports)ICT goods imports (% of total goods imports)ICT service exports (% of total service exports)Applications
Online service index (0–1, 1=highest presence)Secure Internet servers (per million people)
High-
income
group
11 11 1,30058 62 80
18,140 20,640 38,4120.7 –0.2 1.0
.. 95 ..89 97 93
Yes YesMixed Mixed
C CP CC CA A
No A
4.8 4.0 2.79.9 11.6 17.6
40.3 43.0 43.6108.9 116.1 122.9
11.1 22.5 26.242.5 66.0 77.731.5 61.0 75.5
15.7 .. ..80.6 135.8 113.6
35.0 64.0 75.4
99 99 10081.1 99.0 95.9
2,378 195,537 85,990
.. 25.0 25.2
.. 25.3 20.6
.. 29.2 29.2
7.8 3.4 8.98.4 5.1 10.8
16.1 17.8 30.8
0.65 0.65 0.6757.7 216.0 827.6
High income
Portugal

172 2014 The Little Data Book on Information and Communication Technology
2005 2012 2012
Country data
Economic and social contextPopulation (millions)Urban population (% of total)GNI per capita, World Bank Atlas method ($)GDP growth, 2000–05 and 2005–12 (avg. annual %)Adult literacy rate (% ages 15 and older) Gross primary, secondary, tertiary school enrollment (%)
Sector structureSeparate telecommunications/ICT regulatorStatus of main fixed-line telephone operatorLevel of competition (competition, partial comp., monopoly) International gateway(s) Mobile telephone service Internet serviceForeign ownership (not allowed, restricted, allowed)Reg. treatment of VoIP (banned, closed, no framework, allowed)
Sector efficiency and capacityTelecommunications revenue (% of GDP)Telecommunications investment (% of revenue)
Sector performanceAccess
Fixed-telephone subscriptions (per 100 people)Mobile-cellular telephone subscriptions (per 100 people)Fixed (wired)-broadband subscriptions (per 100 people)Households with a computer (%)Households with Internet access at home (%)Usage
Int’l. voice traffic, total (minutes/subscription/month)Domestic mobile traffic (minutes/subscription/month)Individuals using the Internet (%)Quality
Population covered by a mobile-cellular network (%)Fixed (wired)-broadband subscriptions (% of total Internet)International Internet bandwidth (bit/s per Internet user)Affordability
Fixed-telephone sub-basket ($ a month)Mobile-cellular sub-basket ($ a month)Fixed-broadband sub-basket ($ a month)Trade
ICT goods exports (% of total goods exports)ICT goods imports (% of total goods imports)ICT service exports (% of total service exports)Applications
Online service index (0–1, 1=highest presence)Secure Internet servers (per million people)
High-
income
group
4 4 1,30098 99 80
14,120 18,000 38,4121.5 –1.1 1.091 90 ..
.. 92 93
.. ..
.. ..
.. ..
.. ..
.. ..
.. ..
.. ..
.. .. 2.7
.. .. 17.6
27.6a 19.1 43.653.0 82.6 122.9
3.1 15.5 26.2.. 60.0a 77.7.. 60.7a 75.5
.. .. ..
.. .. 113.6
23.4a 51.4a 75.4
62 68 100.. 99.9 95.9
2,272 136,866 85,990
.. .. 25.2
.. .. 20.6
.. .. 29.2
.. .. 8.9
.. .. 10.8
.. .. 30.8
.. .. 0.6731.9 106.5 827.6
High income
Puerto Rico
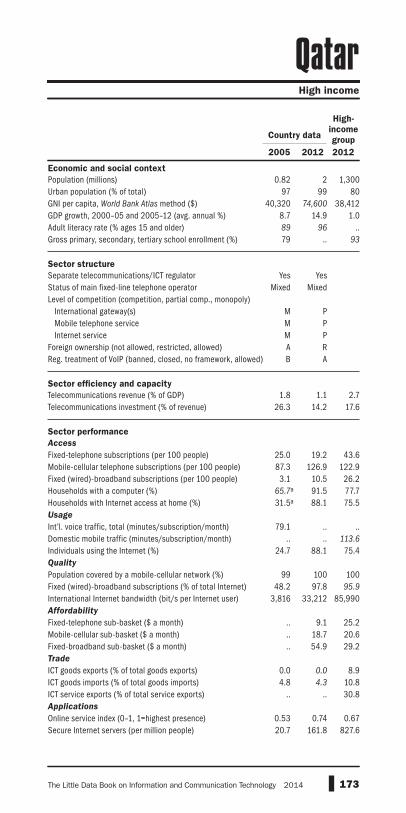
173The Little Data Book on Information and Communication Technology 2014
2005 2012 2012
Country data
Economic and social contextPopulation (millions)Urban population (% of total)GNI per capita, World Bank Atlas method ($)GDP growth, 2000–05 and 2005–12 (avg. annual %)Adult literacy rate (% ages 15 and older) Gross primary, secondary, tertiary school enrollment (%)
Sector structureSeparate telecommunications/ICT regulatorStatus of main fixed-line telephone operatorLevel of competition (competition, partial comp., monopoly) International gateway(s) Mobile telephone service Internet serviceForeign ownership (not allowed, restricted, allowed)Reg. treatment of VoIP (banned, closed, no framework, allowed)
Sector efficiency and capacityTelecommunications revenue (% of GDP)Telecommunications investment (% of revenue)
Sector performanceAccess
Fixed-telephone subscriptions (per 100 people)Mobile-cellular telephone subscriptions (per 100 people)Fixed (wired)-broadband subscriptions (per 100 people)Households with a computer (%)Households with Internet access at home (%)Usage
Int’l. voice traffic, total (minutes/subscription/month)Domestic mobile traffic (minutes/subscription/month)Individuals using the Internet (%)Quality
Population covered by a mobile-cellular network (%)Fixed (wired)-broadband subscriptions (% of total Internet)International Internet bandwidth (bit/s per Internet user)Affordability
Fixed-telephone sub-basket ($ a month)Mobile-cellular sub-basket ($ a month)Fixed-broadband sub-basket ($ a month)Trade
ICT goods exports (% of total goods exports)ICT goods imports (% of total goods imports)ICT service exports (% of total service exports)Applications
Online service index (0–1, 1=highest presence)Secure Internet servers (per million people)
High-
income
group
0.82 2 1,30097 99 80
40,320 74,600 38,4128.7 14.9 1.089 96 ..79 .. 93
Yes YesMixed Mixed
M PM PM PA RB A
1.8 1.1 2.726.3 14.2 17.6
25.0 19.2 43.687.3 126.9 122.93.1 10.5 26.2
65.7a 91.5 77.731.5a 88.1 75.5
79.1 .. .... .. 113.6
24.7 88.1 75.4
99 100 10048.2 97.8 95.9
3,816 33,212 85,990
.. 9.1 25.2
.. 18.7 20.6
.. 54.9 29.2
0.0 0.0 8.94.8 4.3 10.8
.. .. 30.8
0.53 0.74 0.6720.7 161.8 827.6
High income
Qatar

174 2014 The Little Data Book on Information and Communication Technology
2005 2012 2012
Upper
middle-
income
groupCountry data
Economic and social contextPopulation (millions)Urban population (% of total)GNI per capita, World Bank Atlas method ($)GDP growth, 2000–05 and 2005–12 (avg. annual %)Adult literacy rate (% ages 15 and older) Gross primary, secondary, tertiary school enrollment (%)
Sector structureSeparate telecommunications/ICT regulatorStatus of main fixed-line telephone operatorLevel of competition (competition, partial comp., monopoly) International gateway(s) Mobile telephone service Internet serviceForeign ownership (not allowed, restricted, allowed)Reg. treatment of VoIP (banned, closed, no framework, allowed)
Sector efficiency and capacityTelecommunications revenue (% of GDP)Telecommunications investment (% of revenue)
Sector performanceAccess
Fixed-telephone subscriptions (per 100 people)Mobile-cellular telephone subscriptions (per 100 people)Fixed (wired)-broadband subscriptions (per 100 people)Households with a computer (%)Households with Internet access at home (%)Usage
Int’l. voice traffic, total (minutes/subscription/month)Domestic mobile traffic (minutes/subscription/month)Individuals using the Internet (%)Quality
Population covered by a mobile-cellular network (%)Fixed (wired)-broadband subscriptions (% of total Internet)International Internet bandwidth (bit/s per Internet user)Affordability
Fixed-telephone sub-basket ($ a month)Mobile-cellular sub-basket ($ a month)Fixed-broadband sub-basket ($ a month)Trade
ICT goods exports (% of total goods exports)ICT goods imports (% of total goods imports)ICT service exports (% of total service exports)Applications
Online service index (0–1, 1=highest presence)Secure Internet servers (per million people)
21 20 2,39153 53 61
3,920 8,560 6,9696.0 1.8 6.297 98 94
75 81 76
Yes YesMixed Mixed
C C
C C
C C
A AA A
3.8 1.8 2.523.0 19.0 18.2
19.8 21.4 19.460.4 105.0 92.4
1.7 16.2 10.824.7 57.0 40.69.8a 54.0 36.3
10.2 11.6 1.357.2 224.7 284.421.5a 50.0 41.6
99 100 99
47.7 100.0 95.52,835 114,917 14,580
.. 13.0 9.4
.. 25.7 14.9
.. 9.5 17.8
2.2 5.0 17.66.7 6.8 14.7
19.2 37.3 29.1
0.54 0.52 0.425.4 68.7 18.5
Europe & Central Asia Upper middle income
Romania

175The Little Data Book on Information and Communication Technology 2014
2005 2012 2012
Country data
Economic and social contextPopulation (millions)Urban population (% of total)GNI per capita, World Bank Atlas method ($)GDP growth, 2000–05 and 2005–12 (avg. annual %)Adult literacy rate (% ages 15 and older) Gross primary, secondary, tertiary school enrollment (%)
Sector structureSeparate telecommunications/ICT regulatorStatus of main fixed-line telephone operatorLevel of competition (competition, partial comp., monopoly) International gateway(s) Mobile telephone service Internet serviceForeign ownership (not allowed, restricted, allowed)Reg. treatment of VoIP (banned, closed, no framework, allowed)
Sector efficiency and capacityTelecommunications revenue (% of GDP)Telecommunications investment (% of revenue)
Sector performanceAccess
Fixed-telephone subscriptions (per 100 people)Mobile-cellular telephone subscriptions (per 100 people)Fixed (wired)-broadband subscriptions (per 100 people)Households with a computer (%)Households with Internet access at home (%)Usage
Int’l. voice traffic, total (minutes/subscription/month)Domestic mobile traffic (minutes/subscription/month)Individuals using the Internet (%)Quality
Population covered by a mobile-cellular network (%)Fixed (wired)-broadband subscriptions (% of total Internet)International Internet bandwidth (bit/s per Internet user)Affordability
Fixed-telephone sub-basket ($ a month)Mobile-cellular sub-basket ($ a month)Fixed-broadband sub-basket ($ a month)Trade
ICT goods exports (% of total goods exports)ICT goods imports (% of total goods imports)ICT service exports (% of total service exports)Applications
Online service index (0–1, 1=highest presence)Secure Internet servers (per million people)
143 144 1,30073 74 80
4,460 12,700 38,4126.2 2.9 1.099 100 ..82 84 93
No NoMixed Mixed
.. ..C C
.. ..
.. ..No No
2.9 2.3 2.732.1 21.3 17.6
27.9 30.1 43.683.4 182.9 122.9
1.1 14.5 26.225.0a 60.6a 77.717.0a 51.2a 75.5
.. .. ..
.. 115.2 113.6
15.2 53.3a 75.4
95 .. 1008.3 98.1 95.9
655 32,838 85,990
.. 4.1 25.2
.. 11.1 20.6
.. 10.2 29.2
0.2 0.3 8.97.8 7.5 10.8
23.7 31.9 30.8
0.51 0.66 0.672.4 51.9 827.6
High-
income
group
High income
Russian Federation

176 2014 The Little Data Book on Information and Communication Technology
2005 2012 2012
Country data
Economic and social contextPopulation (millions)Urban population (% of total)GNI per capita, World Bank Atlas method ($)GDP growth, 2000–05 and 2005–12 (avg. annual %)Adult literacy rate (% ages 15 and older) Gross primary, secondary, tertiary school enrollment (%)
Sector structureSeparate telecommunications/ICT regulatorStatus of main fixed-line telephone operatorLevel of competition (competition, partial comp., monopoly) International gateway(s) Mobile telephone service Internet serviceForeign ownership (not allowed, restricted, allowed)Reg. treatment of VoIP (banned, closed, no framework, allowed)
Sector efficiency and capacityTelecommunications revenue (% of GDP)Telecommunications investment (% of revenue)
Sector performanceAccess
Fixed-telephone subscriptions (per 100 people)Mobile-cellular telephone subscriptions (per 100 people)Fixed (wired)-broadband subscriptions (per 100 people)Households with a computer (%)Households with Internet access at home (%)Usage
Int’l. voice traffic, total (minutes/subscription/month)Domestic mobile traffic (minutes/subscription/month)Individuals using the Internet (%)Quality
Population covered by a mobile-cellular network (%)Fixed (wired)-broadband subscriptions (% of total Internet)International Internet bandwidth (bit/s per Internet user)Affordability
Fixed-telephone sub-basket ($ a month)Mobile-cellular sub-basket ($ a month)Fixed-broadband sub-basket ($ a month)Trade
ICT goods exports (% of total goods exports)ICT goods imports (% of total goods imports)ICT service exports (% of total service exports)Applications
Online service index (0–1, 1=highest presence)Secure Internet servers (per million people)
Low-
income
group
9 11 84618 19 28
260 600 5907.5 8.1 5.965 66 61
55 67 60
Yes YesMixed Mixed
.. P
C C
C C
.. AB A
2.7 2.8 5.0
22.7 40.1 ..
0.3 0.4 1.02.4 49.7 47.20.0 0.0 0.20.2 2.4a 4.20.1 2.4a 3.4
12.8 3.3 ..11.8 48.9 70.10.6a 8.0a 6.2
75 98 ..40.0 69.6 30.9
1,030 6,585 9,141
.. 9.0 8.9
.. 14.7 11.9
.. 111.7 46.9
1.2 0.2 ..8.4 7.8 ..8.4 3.8 ..
0.29 0.34 0.20.. 2.5 1.1
Sub-Saharan Africa Low income
Rwanda

177The Little Data Book on Information and Communication Technology 2014
2005 2012 2012
Country data
Economic and social contextPopulation (millions)Urban population (% of total)GNI per capita, World Bank Atlas method ($)GDP growth, 2000–05 and 2005–12 (avg. annual %)Adult literacy rate (% ages 15 and older) Gross primary, secondary, tertiary school enrollment (%)
Sector structureSeparate telecommunications/ICT regulatorStatus of main fixed-line telephone operatorLevel of competition (competition, partial comp., monopoly) International gateway(s) Mobile telephone service Internet serviceForeign ownership (not allowed, restricted, allowed)Reg. treatment of VoIP (banned, closed, no framework, allowed)
Sector efficiency and capacityTelecommunications revenue (% of GDP)Telecommunications investment (% of revenue)
Sector performanceAccess
Fixed-telephone subscriptions (per 100 people)Mobile-cellular telephone subscriptions (per 100 people)Fixed (wired)-broadband subscriptions (per 100 people)Households with a computer (%)Households with Internet access at home (%)Usage
Int’l. voice traffic, total (minutes/subscription/month)Domestic mobile traffic (minutes/subscription/month)Individuals using the Internet (%)Quality
Population covered by a mobile-cellular network (%)Fixed (wired)-broadband subscriptions (% of total Internet)International Internet bandwidth (bit/s per Internet user)Affordability
Fixed-telephone sub-basket ($ a month)Mobile-cellular sub-basket ($ a month)Fixed-broadband sub-basket ($ a month)Trade
ICT goods exports (% of total goods exports)ICT goods imports (% of total goods imports)ICT service exports (% of total service exports)Applications
Online service index (0–1, 1=highest presence)Secure Internet servers (per million people)
Lower
middle-
income
group
0.18 0.19 2,50721 20 39
2,100 3,260 1,8934.9 0.7 6.099 99 71
.. .. 64
No YesPublic Public
M CM CC CR RB A
5.0 .. 2.5
.. .. 20.5
10.8 .. 5.413.3 .. 83.1
0.0 0.1 1.4.. .. 15.0.. .. 12.4
.. .. 6.5
.. .. ..3.4 12.9a 18.7
.. .. 86
.. .. 58.2
1,492 5,531 8,076
.. 12.7 4.9
.. 18.1 10.5
.. 42.7 20.6
0.1 0.1 4.62.0 2.7 7.2
10.1 7.8 47.1
0.38 0.28 0.325.6 26.3 4.4
East Asia & Pacific Lower middle income
Samoa

178 2014 The Little Data Book on Information and Communication Technology
2005 2012 2012
Country data
Economic and social contextPopulation (millions)Urban population (% of total)GNI per capita, World Bank Atlas method ($)GDP growth, 2000–05 and 2005–12 (avg. annual %)Adult literacy rate (% ages 15 and older) Gross primary, secondary, tertiary school enrollment (%)
Sector structureSeparate telecommunications/ICT regulatorStatus of main fixed-line telephone operatorLevel of competition (competition, partial comp., monopoly) International gateway(s) Mobile telephone service Internet serviceForeign ownership (not allowed, restricted, allowed)Reg. treatment of VoIP (banned, closed, no framework, allowed)
Sector efficiency and capacityTelecommunications revenue (% of GDP)Telecommunications investment (% of revenue)
Sector performanceAccess
Fixed-telephone subscriptions (per 100 people)Mobile-cellular telephone subscriptions (per 100 people)Fixed (wired)-broadband subscriptions (per 100 people)Households with a computer (%)Households with Internet access at home (%)Usage
Int’l. voice traffic, total (minutes/subscription/month)Domestic mobile traffic (minutes/subscription/month)Individuals using the Internet (%)Quality
Population covered by a mobile-cellular network (%)Fixed (wired)-broadband subscriptions (% of total Internet)International Internet bandwidth (bit/s per Internet user)Affordability
Fixed-telephone sub-basket ($ a month)Mobile-cellular sub-basket ($ a month)Fixed-broadband sub-basket ($ a month)Trade
ICT goods exports (% of total goods exports)ICT goods imports (% of total goods imports)ICT service exports (% of total service exports)Applications
Online service index (0–1, 1=highest presence)Secure Internet servers (per million people)
High-
income
group
0.03 0.03 1,30094 94 80
41,080 51,470 38,4123.2 .. 1.0
.. .. ..
.. 86 93
No NoMixed Mixed
.. ..C C
.. ..
.. ..
.. ..
0.4 .. 2.750.0 .. 17.6
70.0 59.8 43.657.6 115.2 122.94.1 31.7 26.2
.. .. 77.7
.. .. 75.5
.. .. ..
.. .. 113.6
50.3 50.9a 75.4
.. 98 10022.2 75.4 95.9
10,358 628,959 85,990
.. 25.6 25.2
.. 23.8 20.6
.. 22.2 29.2
.. .. 8.9
.. .. 10.8
.. .. 30.8
0.00 0.29 0.67369.4 1,451.6 827.6
High income
San Marino

179The Little Data Book on Information and Communication Technology 2014
2005 2012 2012
Country data
Economic and social contextPopulation (millions)Urban population (% of total)GNI per capita, World Bank Atlas method ($)GDP growth, 2000–05 and 2005–12 (avg. annual %)Adult literacy rate (% ages 15 and older) Gross primary, secondary, tertiary school enrollment (%)
Sector structureSeparate telecommunications/ICT regulatorStatus of main fixed-line telephone operatorLevel of competition (competition, partial comp., monopoly) International gateway(s) Mobile telephone service Internet serviceForeign ownership (not allowed, restricted, allowed)Reg. treatment of VoIP (banned, closed, no framework, allowed)
Sector efficiency and capacityTelecommunications revenue (% of GDP)Telecommunications investment (% of revenue)
Sector performanceAccess
Fixed-telephone subscriptions (per 100 people)Mobile-cellular telephone subscriptions (per 100 people)Fixed (wired)-broadband subscriptions (per 100 people)Households with a computer (%)Households with Internet access at home (%)Usage
Int’l. voice traffic, total (minutes/subscription/month)Domestic mobile traffic (minutes/subscription/month)Individuals using the Internet (%)Quality
Population covered by a mobile-cellular network (%)Fixed (wired)-broadband subscriptions (% of total Internet)International Internet bandwidth (bit/s per Internet user)Affordability
Fixed-telephone sub-basket ($ a month)Mobile-cellular sub-basket ($ a month)Fixed-broadband sub-basket ($ a month)Trade
ICT goods exports (% of total goods exports)ICT goods imports (% of total goods imports)ICT service exports (% of total service exports)Applications
Online service index (0–1, 1=highest presence)Secure Internet servers (per million people)
0.15 0.19 2,50758 63 39
740 1,310 1,8934.1 4.9 6.085 70 71
65 74 64
No YesMixed Mixed
.. ..
.. M
.. M
.. ..No No
9.1 5.8 2.5
14.9 51.2 20.5
4.6 4.3 5.47.7 65.0 83.10.0 0.4 1.4
.. .. 15.0
.. .. 12.4
33.2 7.4 6.5
4.6 25.5 ..13.8a 21.6a 18.7
8 70 86
0.0 88.7 58.2
94 7,689 8,076
.. 8.6 4.9
.. 13.2 10.5
.. 116.8 20.6
0.0 0.2 4.63.4 3.2 7.2
13.2 8.3 47.1
0.32 0.12 0.3212.2 46.6 4.4
Sub-Saharan Africa Lower middle income
São Tomé and PríncipeLower
middle-
income
group

180 2014 The Little Data Book on Information and Communication Technology
2005 2012 2012
Country data
Economic and social contextPopulation (millions)Urban population (% of total)GNI per capita, World Bank Atlas method ($)GDP growth, 2000–05 and 2005–12 (avg. annual %)Adult literacy rate (% ages 15 and older) Gross primary, secondary, tertiary school enrollment (%)
Sector structureSeparate telecommunications/ICT regulatorStatus of main fixed-line telephone operatorLevel of competition (competition, partial comp., monopoly) International gateway(s) Mobile telephone service Internet serviceForeign ownership (not allowed, restricted, allowed)Reg. treatment of VoIP (banned, closed, no framework, allowed)
Sector efficiency and capacityTelecommunications revenue (% of GDP)Telecommunications investment (% of revenue)
Sector performanceAccess
Fixed-telephone subscriptions (per 100 people)Mobile-cellular telephone subscriptions (per 100 people)Fixed (wired)-broadband subscriptions (per 100 people)Households with a computer (%)Households with Internet access at home (%)Usage
Int’l. voice traffic, total (minutes/subscription/month)Domestic mobile traffic (minutes/subscription/month)Individuals using the Internet (%)Quality
Population covered by a mobile-cellular network (%)Fixed (wired)-broadband subscriptions (% of total Internet)International Internet bandwidth (bit/s per Internet user)Affordability
Fixed-telephone sub-basket ($ a month)Mobile-cellular sub-basket ($ a month)Fixed-broadband sub-basket ($ a month)Trade
ICT goods exports (% of total goods exports)ICT goods imports (% of total goods imports)ICT service exports (% of total service exports)Applications
Online service index (0–1, 1=highest presence)Secure Internet servers (per million people)
25 28 1,30081 82 80
12,460 24,310 38,4125.2 6.1 1.083 87 ..75 92 93
Yes YesMixed Mixed
P ..P PC C
No RB B
2.8 2.7 2.70.0 0.0 17.6
15.6 17.0 43.657.4 187.4 122.90.3 6.9 26.2
30.0 67.7a 77.720.0 66.6a 75.5
.. 29.3 ..15.6 102.0 113.6
12.7 54.0a 75.4
96 99 1005.4 100.0 95.9
383 36,396 85,990
.. 13.2 25.2
.. 14.1 20.6
.. 39.7 29.2
0.1 0.1 8.96.5 8.0 10.8
41.5 3.6 30.8
0.49 0.80 0.673.1 34.2 827.6
High income
Saudi ArabiaHigh-
income
group
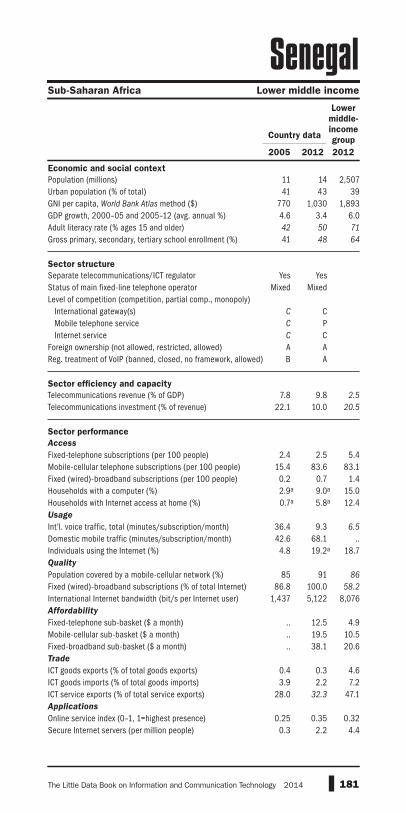
181The Little Data Book on Information and Communication Technology 2014
2005 2012 2012
Country data
Economic and social contextPopulation (millions)Urban population (% of total)GNI per capita, World Bank Atlas method ($)GDP growth, 2000–05 and 2005–12 (avg. annual %)Adult literacy rate (% ages 15 and older) Gross primary, secondary, tertiary school enrollment (%)
Sector structureSeparate telecommunications/ICT regulatorStatus of main fixed-line telephone operatorLevel of competition (competition, partial comp., monopoly) International gateway(s) Mobile telephone service Internet serviceForeign ownership (not allowed, restricted, allowed)Reg. treatment of VoIP (banned, closed, no framework, allowed)
Sector efficiency and capacityTelecommunications revenue (% of GDP)Telecommunications investment (% of revenue)
Sector performanceAccess
Fixed-telephone subscriptions (per 100 people)Mobile-cellular telephone subscriptions (per 100 people)Fixed (wired)-broadband subscriptions (per 100 people)Households with a computer (%)Households with Internet access at home (%)Usage
Int’l. voice traffic, total (minutes/subscription/month)Domestic mobile traffic (minutes/subscription/month)Individuals using the Internet (%)Quality
Population covered by a mobile-cellular network (%)Fixed (wired)-broadband subscriptions (% of total Internet)International Internet bandwidth (bit/s per Internet user)Affordability
Fixed-telephone sub-basket ($ a month)Mobile-cellular sub-basket ($ a month)Fixed-broadband sub-basket ($ a month)Trade
ICT goods exports (% of total goods exports)ICT goods imports (% of total goods imports)ICT service exports (% of total service exports)Applications
Online service index (0–1, 1=highest presence)Secure Internet servers (per million people)
11 14 2,50741 43 39
770 1,030 1,8934.6 3.4 6.042 50 71
41 48 64
Yes YesMixed Mixed
C CC PC CA AB A
7.8 9.8 2.5
22.1 10.0 20.5
2.4 2.5 5.415.4 83.6 83.10.2 0.7 1.42.9a 9.0a 15.00.7a 5.8a 12.4
36.4 9.3 6.5
42.6 68.1 ..4.8 19.2a 18.7
85 91 86
86.8 100.0 58.2
1,437 5,122 8,076
.. 12.5 4.9
.. 19.5 10.5
.. 38.1 20.6
0.4 0.3 4.63.9 2.2 7.2
28.0 32.3 47.1
0.25 0.35 0.320.3 2.2 4.4
Sub-Saharan Africa Lower middle income
SenegalLower
middle-
income
group

182 2014 The Little Data Book on Information and Communication Technology
2005 2012 2012
Country data
Economic and social contextPopulation (millions)Urban population (% of total)GNI per capita, World Bank Atlas method ($)GDP growth, 2000–05 and 2005–12 (avg. annual %)Adult literacy rate (% ages 15 and older) Gross primary, secondary, tertiary school enrollment (%)
Sector structureSeparate telecommunications/ICT regulatorStatus of main fixed-line telephone operatorLevel of competition (competition, partial comp., monopoly) International gateway(s) Mobile telephone service Internet serviceForeign ownership (not allowed, restricted, allowed)Reg. treatment of VoIP (banned, closed, no framework, allowed)
Sector efficiency and capacityTelecommunications revenue (% of GDP)Telecommunications investment (% of revenue)
Sector performanceAccess
Fixed-telephone subscriptions (per 100 people)Mobile-cellular telephone subscriptions (per 100 people)Fixed (wired)-broadband subscriptions (per 100 people)Households with a computer (%)Households with Internet access at home (%)Usage
Int’l. voice traffic, total (minutes/subscription/month)Domestic mobile traffic (minutes/subscription/month)Individuals using the Internet (%)Quality
Population covered by a mobile-cellular network (%)Fixed (wired)-broadband subscriptions (% of total Internet)International Internet bandwidth (bit/s per Internet user)Affordability
Fixed-telephone sub-basket ($ a month)Mobile-cellular sub-basket ($ a month)Fixed-broadband sub-basket ($ a month)Trade
ICT goods exports (% of total goods exports)ICT goods imports (% of total goods imports)ICT service exports (% of total service exports)Applications
Online service index (0–1, 1=highest presence)Secure Internet servers (per million people)
7 7 2,39154 57 61
3,430 5,280 6,9695.3 1.3 6.2
.. 98 94
78 79 76
No YesMixed Mixed
.. ..C C.. C.. AB A
4.7 5.3 2.522.9 15.0 18.2
30.9 38.4 19.467.4 117.8 92.40.4 12.9 10.8
25.0 60.3a 40.618.0 48.0a 36.3
13.5 8.2 1.327.6 97.4 284.426.3a 48.1a 41.6
96 100 99
4.4 99.0 95.5799 89,563 14,580
.. 7.0 9.4
.. 12.5 14.9
.. 21.2 17.8
.. 2.1 17.6
.. 3.8 14.736.5 42.0 29.1
0.48 0.58 0.425.1 34.7 18.5
Europe & Central Asia Upper middle income
SerbiaUpper
middle-
income
group

183The Little Data Book on Information and Communication Technology 2014
2005 2012 2012
Country data
Economic and social contextPopulation (millions)Urban population (% of total)GNI per capita, World Bank Atlas method ($)GDP growth, 2000–05 and 2005–12 (avg. annual %)Adult literacy rate (% ages 15 and older) Gross primary, secondary, tertiary school enrollment (%)
Sector structureSeparate telecommunications/ICT regulatorStatus of main fixed-line telephone operatorLevel of competition (competition, partial comp., monopoly) International gateway(s) Mobile telephone service Internet serviceForeign ownership (not allowed, restricted, allowed)Reg. treatment of VoIP (banned, closed, no framework, allowed)
Sector efficiency and capacityTelecommunications revenue (% of GDP)Telecommunications investment (% of revenue)
Sector performanceAccess
Fixed-telephone subscriptions (per 100 people)Mobile-cellular telephone subscriptions (per 100 people)Fixed (wired)-broadband subscriptions (per 100 people)Households with a computer (%)Households with Internet access at home (%)Usage
Int’l. voice traffic, total (minutes/subscription/month)Domestic mobile traffic (minutes/subscription/month)Individuals using the Internet (%)Quality
Population covered by a mobile-cellular network (%)Fixed (wired)-broadband subscriptions (% of total Internet)International Internet bandwidth (bit/s per Internet user)Affordability
Fixed-telephone sub-basket ($ a month)Mobile-cellular sub-basket ($ a month)Fixed-broadband sub-basket ($ a month)Trade
ICT goods exports (% of total goods exports)ICT goods imports (% of total goods imports)ICT service exports (% of total service exports)Applications
Online service index (0–1, 1=highest presence)Secure Internet servers (per million people)
0.08 0.09 2,39152 54 61
10,540 12,180 6,969–1.0 4.0 6.2
92 92 94
82 71 76
No NoPrivate Private
.. CP PP CA AA A
6.4 3.8 2.524.9 .. 18.2
24.6 22.7 19.467.5 147.8 92.41.1 11.0 10.8
12.0a 51.9a 40.66.0a 41.9a 36.3
9.3 5.2 1.3.. 42.3 284.4
25.4 47.1a 41.6
98 98 99
24.5 94.2 95.51,062 15,606 14,580
.. 9.0 9.4
.. 15.3 14.9
.. 16.3 17.8
0.0 0.0 17.61.5 2.1 14.74.9 6.4 29.1
0.49 0.33 0.42482.5 604.4 18.5
Sub-Saharan Africa Upper middle income
SeychellesUpper
middle-
income
group

184 2014 The Little Data Book on Information and Communication Technology
2005 2012 2012
Country data
Economic and social contextPopulation (millions)Urban population (% of total)GNI per capita, World Bank Atlas method ($)GDP growth, 2000–05 and 2005–12 (avg. annual %)Adult literacy rate (% ages 15 and older) Gross primary, secondary, tertiary school enrollment (%)
Sector structureSeparate telecommunications/ICT regulatorStatus of main fixed-line telephone operatorLevel of competition (competition, partial comp., monopoly) International gateway(s) Mobile telephone service Internet serviceForeign ownership (not allowed, restricted, allowed)Reg. treatment of VoIP (banned, closed, no framework, allowed)
Sector efficiency and capacityTelecommunications revenue (% of GDP)Telecommunications investment (% of revenue)
Sector performanceAccess
Fixed-telephone subscriptions (per 100 people)Mobile-cellular telephone subscriptions (per 100 people)Fixed (wired)-broadband subscriptions (per 100 people)Households with a computer (%)Households with Internet access at home (%)Usage
Int’l. voice traffic, total (minutes/subscription/month)Domestic mobile traffic (minutes/subscription/month)Individuals using the Internet (%)Quality
Population covered by a mobile-cellular network (%)Fixed (wired)-broadband subscriptions (% of total Internet)International Internet bandwidth (bit/s per Internet user)Affordability
Fixed-telephone sub-basket ($ a month)Mobile-cellular sub-basket ($ a month)Fixed-broadband sub-basket ($ a month)Trade
ICT goods exports (% of total goods exports)ICT goods imports (% of total goods imports)ICT service exports (% of total service exports)Applications
Online service index (0–1, 1=highest presence)Secure Internet servers (per million people)
5 6 84637 40 28
310 580 5909.0 6.3 5.935 43 61
.. .. 60
No YesPublic Public
.. P
C P
P P
.. ..B B
.. .. 5.0
.. .. ..
0.5 0.3 1.014.3 37.0 47.2
0.0 .. 0.20.8 .. 4.2
.. .. 3.4
.. .. ..
.. .. 70.10.2 1.3a 6.2
70 .. .... .. 30.9
.. 1,994 9,141
.. .. 8.9
.. .. 11.9
.. .. 46.9
.. .. ..
.. .. ..0.2 57.2 ..
0.15 0.17 0.200.7 0.8 1.1
Sub-Saharan Africa Low income
Sierra LeoneLow-
income
group

185The Little Data Book on Information and Communication Technology 2014
2005 2012 2012
Country data
Economic and social contextPopulation (millions)Urban population (% of total)GNI per capita, World Bank Atlas method ($)GDP growth, 2000–05 and 2005–12 (avg. annual %)Adult literacy rate (% ages 15 and older) Gross primary, secondary, tertiary school enrollment (%)
Sector structureSeparate telecommunications/ICT regulatorStatus of main fixed-line telephone operatorLevel of competition (competition, partial comp., monopoly) International gateway(s) Mobile telephone service Internet serviceForeign ownership (not allowed, restricted, allowed)Reg. treatment of VoIP (banned, closed, no framework, allowed)
Sector efficiency and capacityTelecommunications revenue (% of GDP)Telecommunications investment (% of revenue)
Sector performanceAccess
Fixed-telephone subscriptions (per 100 people)Mobile-cellular telephone subscriptions (per 100 people)Fixed (wired)-broadband subscriptions (per 100 people)Households with a computer (%)Households with Internet access at home (%)Usage
Int’l. voice traffic, total (minutes/subscription/month)Domestic mobile traffic (minutes/subscription/month)Individuals using the Internet (%)Quality
Population covered by a mobile-cellular network (%)Fixed (wired)-broadband subscriptions (% of total Internet)International Internet bandwidth (bit/s per Internet user)Affordability
Fixed-telephone sub-basket ($ a month)Mobile-cellular sub-basket ($ a month)Fixed-broadband sub-basket ($ a month)Trade
ICT goods exports (% of total goods exports)ICT goods imports (% of total goods imports)ICT service exports (% of total service exports)Applications
Online service index (0–1, 1=highest presence)Secure Internet servers (per million people)
4 5 1,300100 100 80
27,240 47,210 38,4125.1 5.5 1.093 96 ..
.. .. 93
Yes YesMixed Mixed
C CC CC CA AA No
3.5 2.6 2.712.6 .. 17.6
41.0 37.5 43.697.5 152.1 122.914.6 25.4 26.274.0 87.7a 77.766.0 87.7a 75.5
75.2 88.3 .... .. 113.6
61.0 74.2a 75.4
100 100 10029.1 98.3 95.9
31,606 387,641 85,990
.. 8.8 25.2
.. 9.3 20.6
.. 30.0 29.2
45.5 28.4 8.937.9 23.4 10.822.3 24.0 30.8
0.70 1.00 0.67275.4 610.1 827.6
High income
SingaporeHigh-
income
group

186 2014 The Little Data Book on Information and Communication Technology
2005 2012 2012
Country data
Economic and social contextPopulation (millions)Urban population (% of total)GNI per capita, World Bank Atlas method ($)GDP growth, 2000–05 and 2005–12 (avg. annual %)Adult literacy rate (% ages 15 and older) Gross primary, secondary, tertiary school enrollment (%)
Sector structureSeparate telecommunications/ICT regulatorStatus of main fixed-line telephone operatorLevel of competition (competition, partial comp., monopoly) International gateway(s) Mobile telephone service Internet serviceForeign ownership (not allowed, restricted, allowed)Reg. treatment of VoIP (banned, closed, no framework, allowed)
Sector efficiency and capacityTelecommunications revenue (% of GDP)Telecommunications investment (% of revenue)
Sector performanceAccess
Fixed-telephone subscriptions (per 100 people)Mobile-cellular telephone subscriptions (per 100 people)Fixed (wired)-broadband subscriptions (per 100 people)Households with a computer (%)Households with Internet access at home (%)Usage
Int’l. voice traffic, total (minutes/subscription/month)Domestic mobile traffic (minutes/subscription/month)Individuals using the Internet (%)Quality
Population covered by a mobile-cellular network (%)Fixed (wired)-broadband subscriptions (% of total Internet)International Internet bandwidth (bit/s per Internet user)Affordability
Fixed-telephone sub-basket ($ a month)Mobile-cellular sub-basket ($ a month)Fixed-broadband sub-basket ($ a month)Trade
ICT goods exports (% of total goods exports)ICT goods imports (% of total goods imports)ICT service exports (% of total service exports)Applications
Online service index (0–1, 1=highest presence)Secure Internet servers (per million people)
0.04 0.04 1,300.. .. 80.. .. 38,412.. .. 1.0.. .. .... .. 93
.. ..
.. ..
.. ..
.. ..
.. ..
.. ..
.. ..
.. .. 2.7
.. .. 17.6
.. .. 43.6
.. .. 122.9
.. .. 26.2
.. .. 77.7
.. .. 75.5
.. .. ..
.. .. 113.6
.. .. 75.4
.. .. 100
.. .. 95.9
.. .. 85,990
.. .. 25.2
.. .. 20.6
.. .. 29.2
.. .. 8.9
.. .. 10.8
.. .. 30.8
.. .. 0.67
.. .. 827.6
High income
Sint Maarten (Dutch part)High-
income
group

187The Little Data Book on Information and Communication Technology 2014
2005 2012 2012
Country data
Economic and social contextPopulation (millions)Urban population (% of total)GNI per capita, World Bank Atlas method ($)GDP growth, 2000–05 and 2005–12 (avg. annual %)Adult literacy rate (% ages 15 and older) Gross primary, secondary, tertiary school enrollment (%)
Sector structureSeparate telecommunications/ICT regulatorStatus of main fixed-line telephone operatorLevel of competition (competition, partial comp., monopoly) International gateway(s) Mobile telephone service Internet serviceForeign ownership (not allowed, restricted, allowed)Reg. treatment of VoIP (banned, closed, no framework, allowed)
Sector efficiency and capacityTelecommunications revenue (% of GDP)Telecommunications investment (% of revenue)
Sector performanceAccess
Fixed-telephone subscriptions (per 100 people)Mobile-cellular telephone subscriptions (per 100 people)Fixed (wired)-broadband subscriptions (per 100 people)Households with a computer (%)Households with Internet access at home (%)Usage
Int’l. voice traffic, total (minutes/subscription/month)Domestic mobile traffic (minutes/subscription/month)Individuals using the Internet (%)Quality
Population covered by a mobile-cellular network (%)Fixed (wired)-broadband subscriptions (% of total Internet)International Internet bandwidth (bit/s per Internet user)Affordability
Fixed-telephone sub-basket ($ a month)Mobile-cellular sub-basket ($ a month)Fixed-broadband sub-basket ($ a month)Trade
ICT goods exports (% of total goods exports)ICT goods imports (% of total goods imports)ICT service exports (% of total service exports)Applications
Online service index (0–1, 1=highest presence)Secure Internet servers (per million people)
5 5 1,30056 55 80
11,070 17,190 38,4124.9 3.5 1.0
.. .. ..78 82 93
Yes YesMixed Mixed
C PC PC CA AA A
3.0 2.6 2.722.6 11.0 17.6
22.2 17.9 43.684.2 111.9 122.9
3.4 14.7 26.247.0 79.0 77.723.0 76.6 75.5
12.4 11.4 ..86.4 120.0 113.6
55.2 80.0 75.4
100 100 10061.7 96.4 95.9
4,772 11,477 85,990
.. 18.9 25.2
.. 17.5 20.6
.. 27.6 29.2
9.4 16.6 8.98.3 12.8 10.8
24.2 31.7 30.8
0.59 0.50 0.6718.4 263.3 827.6
High income
Slovak RepublicHigh-
income
group

188 2014 The Little Data Book on Information and Communication Technology
Country data
Slovenia
2 2 1,30050 50 80
18,070 22,810 38,4123.6 0.6 1.0
100 100 ..92 94 93
Yes YesMixed Mixed
C CC CC CA AA A
3.3 2.5 2.723.8 20.0 17.6
51.0 39.9 43.687.9 108.6 122.9
9.8 24.3 26.261.0 76.0 77.748.2 74.0 75.5
11.6 9.9 ..109.4 137.3 113.6
46.8 70.0 75.4
99 100 10049.4 99.6 95.9
2,681 94,652 85,990
.. 18.7 25.2
.. 25.1 20.6
.. 36.2 29.2
1.3 1.8 8.94.3 3.6 10.8
20.4 22.2 30.8
0.67 0.67 0.6779.0 547.8 827.6
High income
High-
income
group
Economic and social contextPopulation (millions)Urban population (% of total)GNI per capita, World Bank Atlas method ($)GDP growth, 2000–05 and 2005–12 (avg. annual %)Adult literacy rate (% ages 15 and older) Gross primary, secondary, tertiary school enrollment (%)
Sector structureSeparate telecommunications/ICT regulatorStatus of main fixed-line telephone operatorLevel of competition (competition, partial comp., monopoly) International gateway(s) Mobile telephone service Internet serviceForeign ownership (not allowed, restricted, allowed)Reg. treatment of VoIP (banned, closed, no framework, allowed)
Sector efficiency and capacityTelecommunications revenue (% of GDP)Telecommunications investment (% of revenue)
Sector performanceAccess
Fixed-telephone subscriptions (per 100 people)Mobile-cellular telephone subscriptions (per 100 people)Fixed (wired)-broadband subscriptions (per 100 people)Households with a computer (%)Households with Internet access at home (%)Usage
Int’l. voice traffic, total (minutes/subscription/month)Domestic mobile traffic (minutes/subscription/month)Individuals using the Internet (%)Quality
Population covered by a mobile-cellular network (%)Fixed (wired)-broadband subscriptions (% of total Internet)International Internet bandwidth (bit/s per Internet user)Affordability
Fixed-telephone sub-basket ($ a month)Mobile-cellular sub-basket ($ a month)Fixed-broadband sub-basket ($ a month)Trade
ICT goods exports (% of total goods exports)ICT goods imports (% of total goods imports)ICT service exports (% of total service exports)Applications
Online service index (0–1, 1=highest presence)Secure Internet servers (per million people)
2005 2012 2012

189The Little Data Book on Information and Communication Technology 2014
2005 2012 2012
Country data
Lower
middle-
income
group
East Asia & Pacific Lower middle income
Solomon Islands
0.47 0.55 2,50718 21 39
900 1,130 1,8931.6 6.0 6.0
.. .. 71
51 .. 64
No YesMixed Mixed
.. ..
.. ..
.. ..
.. ..B B
2.7 .. 2.5
.. .. 20.5
1.6 1.5 5.41.3 55.0 83.10.1 0.4 1.4
.. 5.1a 15.0
.. 4.2a 12.4
.. .. 6.5
.. .. ..0.8 7.0a 18.7
.. .. 86
23.7 .. 58.2
2,044 3,614 8,076
.. 10.3 4.9
.. 14.5 10.5
.. 259.2 20.6
.. 0.0 4.6
.. 2.7 7.257.5 2.4 47.1
0.27 0.13 0.324.3 5.3 4.4
Economic and social contextPopulation (millions)Urban population (% of total)GNI per capita, World Bank Atlas method ($)GDP growth, 2000–05 and 2005–12 (avg. annual %)Adult literacy rate (% ages 15 and older) Gross primary, secondary, tertiary school enrollment (%)
Sector structureSeparate telecommunications/ICT regulatorStatus of main fixed-line telephone operatorLevel of competition (competition, partial comp., monopoly) International gateway(s) Mobile telephone service Internet serviceForeign ownership (not allowed, restricted, allowed)Reg. treatment of VoIP (banned, closed, no framework, allowed)
Sector efficiency and capacityTelecommunications revenue (% of GDP)Telecommunications investment (% of revenue)
Sector performanceAccess
Fixed-telephone subscriptions (per 100 people)Mobile-cellular telephone subscriptions (per 100 people)Fixed (wired)-broadband subscriptions (per 100 people)Households with a computer (%)Households with Internet access at home (%)Usage
Int’l. voice traffic, total (minutes/subscription/month)Domestic mobile traffic (minutes/subscription/month)Individuals using the Internet (%)Quality
Population covered by a mobile-cellular network (%)Fixed (wired)-broadband subscriptions (% of total Internet)International Internet bandwidth (bit/s per Internet user)Affordability
Fixed-telephone sub-basket ($ a month)Mobile-cellular sub-basket ($ a month)Fixed-broadband sub-basket ($ a month)Trade
ICT goods exports (% of total goods exports)ICT goods imports (% of total goods imports)ICT service exports (% of total service exports)Applications
Online service index (0–1, 1=highest presence)Secure Internet servers (per million people)

190 2014 The Little Data Book on Information and Communication Technology
2005 2012 2012
Country data
Low-
income
group
Sub-Saharan Africa Low income
Somalia
8 10 84635 38 28
.. .. 590
.. .. 5.9
.. .. 61
.. .. 60
No NoPrivate Private
.. ..
.. ..
.. ..
.. ..A A
.. .. 5.0
.. .. ..
1.2 0.7 1.05.9 22.6 47.20.0 0.0 0.2
.. .. 4.2
.. .. 3.4
.. .. ..
.. .. 70.11.1a 1.4a 6.2
.. 80 ..0.0 .. 30.9
33 .. 9,141
.. .. 8.9
.. .. 11.9
.. .. 46.9
.. .. ..
.. .. ..
.. .. ..
0.00 0.18 0.200.1 0.1 1.1
Economic and social contextPopulation (millions)Urban population (% of total)GNI per capita, World Bank Atlas method ($)GDP growth, 2000–05 and 2005–12 (avg. annual %)Adult literacy rate (% ages 15 and older) Gross primary, secondary, tertiary school enrollment (%)
Sector structureSeparate telecommunications/ICT regulatorStatus of main fixed-line telephone operatorLevel of competition (competition, partial comp., monopoly) International gateway(s) Mobile telephone service Internet serviceForeign ownership (not allowed, restricted, allowed)Reg. treatment of VoIP (banned, closed, no framework, allowed)
Sector efficiency and capacityTelecommunications revenue (% of GDP)Telecommunications investment (% of revenue)
Sector performanceAccess
Fixed-telephone subscriptions (per 100 people)Mobile-cellular telephone subscriptions (per 100 people)Fixed (wired)-broadband subscriptions (per 100 people)Households with a computer (%)Households with Internet access at home (%)Usage
Int’l. voice traffic, total (minutes/subscription/month)Domestic mobile traffic (minutes/subscription/month)Individuals using the Internet (%)Quality
Population covered by a mobile-cellular network (%)Fixed (wired)-broadband subscriptions (% of total Internet)International Internet bandwidth (bit/s per Internet user)Affordability
Fixed-telephone sub-basket ($ a month)Mobile-cellular sub-basket ($ a month)Fixed-broadband sub-basket ($ a month)Trade
ICT goods exports (% of total goods exports)ICT goods imports (% of total goods imports)ICT service exports (% of total service exports)Applications
Online service index (0–1, 1=highest presence)Secure Internet servers (per million people)

191The Little Data Book on Information and Communication Technology 2014
2005 2012 2012
Upper
middle-
income
groupCountry data
Sub-Saharan Africa Upper middle income
South Africa
48 52 2,39159 62 61
4,810 7,460 6,9693.8 2.8 6.289 93 94
.. .. 76
Yes YesMixed Mixed
P P
P P
C C
R RA A
6.3 4.5 2.513.1 12.1 18.2
9.8 7.7 19.470.4 130.6 92.4
0.3 2.1 10.813.0a 23.6a 40.6
3.0a 25.5a 36.3
.. .. 1.3
.. .. 284.47.5 41.0a 41.6
96 .. 99
1.7 .. 95.5244 18,111 14,580
.. 28.3 9.4
.. 32.6 14.9
.. 28.1 17.8
1.2 1.0 17.611.1 7.6 14.7
9.9 10.6 29.1
0.51 0.46 0.4220.2 87.7 18.5
Economic and social contextPopulation (millions)Urban population (% of total)GNI per capita, World Bank Atlas method ($)GDP growth, 2000–05 and 2005–12 (avg. annual %)Adult literacy rate (% ages 15 and older) Gross primary, secondary, tertiary school enrollment (%)
Sector structureSeparate telecommunications/ICT regulatorStatus of main fixed-line telephone operatorLevel of competition (competition, partial comp., monopoly) International gateway(s) Mobile telephone service Internet serviceForeign ownership (not allowed, restricted, allowed)Reg. treatment of VoIP (banned, closed, no framework, allowed)
Sector efficiency and capacityTelecommunications revenue (% of GDP)Telecommunications investment (% of revenue)
Sector performanceAccess
Fixed-telephone subscriptions (per 100 people)Mobile-cellular telephone subscriptions (per 100 people)Fixed (wired)-broadband subscriptions (per 100 people)Households with a computer (%)Households with Internet access at home (%)Usage
Int’l. voice traffic, total (minutes/subscription/month)Domestic mobile traffic (minutes/subscription/month)Individuals using the Internet (%)Quality
Population covered by a mobile-cellular network (%)Fixed (wired)-broadband subscriptions (% of total Internet)International Internet bandwidth (bit/s per Internet user)Affordability
Fixed-telephone sub-basket ($ a month)Mobile-cellular sub-basket ($ a month)Fixed-broadband sub-basket ($ a month)Trade
ICT goods exports (% of total goods exports)ICT goods imports (% of total goods imports)ICT service exports (% of total service exports)Applications
Online service index (0–1, 1=highest presence)Secure Internet servers (per million people)

192 2014 The Little Data Book on Information and Communication Technology
2005 2012 2012
Country data
Low-
income
group
Sub-Saharan Africa Low income
South Sudan
8 11 84617 18 28
.. 790 590
.. –9.8 5.9
.. .. 61
.. .. 60
No NoMixed Mixed
.. ..
.. ..
.. ..
.. ..
.. C
.. .. 5.0
.. .. ..
.. 0.0 1.0
.. 21.2 47.2
.. 0.0 0.2
.. .. 4.2
.. .. 3.4
.. 10.2 ..
.. 63.0 70.1
.. .. 6.2
.. .. ..
.. .. 30.9
.. .. 9,141
.. .. 8.9
.. .. 11.9
.. .. 46.9
.. .. ..
.. .. ..
.. .. ..
.. 0.14 0.20
.. .. 1.1
Economic and social contextPopulation (millions)Urban population (% of total)GNI per capita, World Bank Atlas method ($)GDP growth, 2000–05 and 2005–12 (avg. annual %)Adult literacy rate (% ages 15 and older) Gross primary, secondary, tertiary school enrollment (%)
Sector structureSeparate telecommunications/ICT regulatorStatus of main fixed-line telephone operatorLevel of competition (competition, partial comp., monopoly) International gateway(s) Mobile telephone service Internet serviceForeign ownership (not allowed, restricted, allowed)Reg. treatment of VoIP (banned, closed, no framework, allowed)
Sector efficiency and capacityTelecommunications revenue (% of GDP)Telecommunications investment (% of revenue)
Sector performanceAccess
Fixed-telephone subscriptions (per 100 people)Mobile-cellular telephone subscriptions (per 100 people)Fixed (wired)-broadband subscriptions (per 100 people)Households with a computer (%)Households with Internet access at home (%)Usage
Int’l. voice traffic, total (minutes/subscription/month)Domestic mobile traffic (minutes/subscription/month)Individuals using the Internet (%)Quality
Population covered by a mobile-cellular network (%)Fixed (wired)-broadband subscriptions (% of total Internet)International Internet bandwidth (bit/s per Internet user)Affordability
Fixed-telephone sub-basket ($ a month)Mobile-cellular sub-basket ($ a month)Fixed-broadband sub-basket ($ a month)Trade
ICT goods exports (% of total goods exports)ICT goods imports (% of total goods imports)ICT service exports (% of total service exports)Applications
Online service index (0–1, 1=highest presence)Secure Internet servers (per million people)

193The Little Data Book on Information and Communication Technology 2014
2005 2012 2012
Country data
High-
income
group
High income
Spain
44 47 1,30077 78 80
25,310 29,270 38,4123.2 0.1 1.098 98 ..96 106 93
Yes YesPrivate Private
C CC CC CA AA A
3.1 2.3 2.719.6 15.4 17.6
44.9 41.9 43.698.4 108.4 122.911.6 24.4 26.255.0 74.0 77.735.5 68.0 75.5
.. .. ..93.1 115.7 113.6
47.9 72.0 75.4
99 100 10080.8 99.6 95.9
5,799 81,365 85,990
.. 33.5 25.2
.. 39.9 20.6
.. 33.5 29.2
3.7 1.3 8.97.2 4.6 10.8
23.3 30.0 30.8
0.72 0.76 0.6781.2 266.7 827.6
Economic and social contextPopulation (millions)Urban population (% of total)GNI per capita, World Bank Atlas method ($)GDP growth, 2000–05 and 2005–12 (avg. annual %)Adult literacy rate (% ages 15 and older) Gross primary, secondary, tertiary school enrollment (%)
Sector structureSeparate telecommunications/ICT regulatorStatus of main fixed-line telephone operatorLevel of competition (competition, partial comp., monopoly) International gateway(s) Mobile telephone service Internet serviceForeign ownership (not allowed, restricted, allowed)Reg. treatment of VoIP (banned, closed, no framework, allowed)
Sector efficiency and capacityTelecommunications revenue (% of GDP)Telecommunications investment (% of revenue)
Sector performanceAccess
Fixed-telephone subscriptions (per 100 people)Mobile-cellular telephone subscriptions (per 100 people)Fixed (wired)-broadband subscriptions (per 100 people)Households with a computer (%)Households with Internet access at home (%)Usage
Int’l. voice traffic, total (minutes/subscription/month)Domestic mobile traffic (minutes/subscription/month)Individuals using the Internet (%)Quality
Population covered by a mobile-cellular network (%)Fixed (wired)-broadband subscriptions (% of total Internet)International Internet bandwidth (bit/s per Internet user)Affordability
Fixed-telephone sub-basket ($ a month)Mobile-cellular sub-basket ($ a month)Fixed-broadband sub-basket ($ a month)Trade
ICT goods exports (% of total goods exports)ICT goods imports (% of total goods imports)ICT service exports (% of total service exports)Applications
Online service index (0–1, 1=highest presence)Secure Internet servers (per million people)

194 2014 The Little Data Book on Information and Communication Technology
2005 2012 2012
Country data
Lower
middle-
income
group
South Asia Lower middle income
Sri Lanka
20 20 2,50715 15 39
1,210 2,920 1,8934.3 6.5 6.091 91 71
.. 77 64
Yes YesMixed Mixed
.. P
C P
C P
A ANo C
2.5 1.9 2.5
12.2 33.4 20.5
6.2 16.3 5.416.8 91.6 83.1
0.1 1.7 1.45.0 15.0a 15.01.1a 10.3a 12.4
.. 10.0 6.5
74.7 160.5 ..1.8a 18.3a 18.7
85 98 86
18.3 83.6 58.2
1,396 5,995 8,076
.. 3.4 4.9
.. 1.1 10.5
.. 4.5 20.6
1.1 0.5 4.64.9 3.7 7.2
20.4 24.6 47.1
0.42 0.38 0.321.8 8.7 4.4
Economic and social contextPopulation (millions)Urban population (% of total)GNI per capita, World Bank Atlas method ($)GDP growth, 2000–05 and 2005–12 (avg. annual %)Adult literacy rate (% ages 15 and older) Gross primary, secondary, tertiary school enrollment (%)
Sector structureSeparate telecommunications/ICT regulatorStatus of main fixed-line telephone operatorLevel of competition (competition, partial comp., monopoly) International gateway(s) Mobile telephone service Internet serviceForeign ownership (not allowed, restricted, allowed)Reg. treatment of VoIP (banned, closed, no framework, allowed)
Sector efficiency and capacityTelecommunications revenue (% of GDP)Telecommunications investment (% of revenue)
Sector performanceAccess
Fixed-telephone subscriptions (per 100 people)Mobile-cellular telephone subscriptions (per 100 people)Fixed (wired)-broadband subscriptions (per 100 people)Households with a computer (%)Households with Internet access at home (%)Usage
Int’l. voice traffic, total (minutes/subscription/month)Domestic mobile traffic (minutes/subscription/month)Individuals using the Internet (%)Quality
Population covered by a mobile-cellular network (%)Fixed (wired)-broadband subscriptions (% of total Internet)International Internet bandwidth (bit/s per Internet user)Affordability
Fixed-telephone sub-basket ($ a month)Mobile-cellular sub-basket ($ a month)Fixed-broadband sub-basket ($ a month)Trade
ICT goods exports (% of total goods exports)ICT goods imports (% of total goods imports)ICT service exports (% of total service exports)Applications
Online service index (0–1, 1=highest presence)Secure Internet servers (per million people)

195The Little Data Book on Information and Communication Technology 2014
2005 2012 2012
Country data
High-
income
group
High income
St. Kitts and Nevis
0.05 0.05 1,30032 32 80
10,900 13,610 38,4123.2 0.7 1.0
.. .. ..
.. 75 93
No NoPrivate Private
.. ..
.. ..
.. ..
.. ..No No
5.4 6.9 2.725.3 7.9 17.6
41.3 37.3a 43.6103.8 156.8a 122.9
13.2 27.2a 26.217.3a 54.7a 77.7
.. .. 75.5
58.2 63.5 ..102.1 32.3 113.6
34.0a 79.3a 75.4
.. .. 100
.. .. 95.9
.. 67,860 85,990
.. 12.6 25.2
.. 22.1 20.6
.. 36.7 29.2
2.4 22.5 8.98.3 5.9 10.8
14.0 16.7 30.8
0.48 0.18 0.671,017.5 1,388.9 827.6
Economic and social contextPopulation (millions)Urban population (% of total)GNI per capita, World Bank Atlas method ($)GDP growth, 2000–05 and 2005–12 (avg. annual %)Adult literacy rate (% ages 15 and older) Gross primary, secondary, tertiary school enrollment (%)
Sector structureSeparate telecommunications/ICT regulatorStatus of main fixed-line telephone operatorLevel of competition (competition, partial comp., monopoly) International gateway(s) Mobile telephone service Internet serviceForeign ownership (not allowed, restricted, allowed)Reg. treatment of VoIP (banned, closed, no framework, allowed)
Sector efficiency and capacityTelecommunications revenue (% of GDP)Telecommunications investment (% of revenue)
Sector performanceAccess
Fixed-telephone subscriptions (per 100 people)Mobile-cellular telephone subscriptions (per 100 people)Fixed (wired)-broadband subscriptions (per 100 people)Households with a computer (%)Households with Internet access at home (%)Usage
Int’l. voice traffic, total (minutes/subscription/month)Domestic mobile traffic (minutes/subscription/month)Individuals using the Internet (%)Quality
Population covered by a mobile-cellular network (%)Fixed (wired)-broadband subscriptions (% of total Internet)International Internet bandwidth (bit/s per Internet user)Affordability
Fixed-telephone sub-basket ($ a month)Mobile-cellular sub-basket ($ a month)Fixed-broadband sub-basket ($ a month)Trade
ICT goods exports (% of total goods exports)ICT goods imports (% of total goods imports)ICT service exports (% of total service exports)Applications
Online service index (0–1, 1=highest presence)Secure Internet servers (per million people)

196 2014 The Little Data Book on Information and Communication Technology
2005 2012 2012
Upper
middle-
income
groupCountry data
Latin America & Caribbean Upper middle income
St. Lucia
0.17 0.18 2,39123 17 61
5,110 6,890 6,9692.0 2.2 6.2
.. .. 94
73 71 76
Yes YesPrivate Private
C C
C C
M C
A ANo A
8.5 6.7 2.59.4 8.4 18.2
23.6 20.4 19.463.9 125.5 92.4
4.2a 13.6 10.8.. 42.5a 40.6.. 32.2a 36.3
53.5 28.7 1.364.7 80.4 284.421.6 48.6a 41.6
80 100 99
91.2 98.5 95.5.. 68,218 14,580
.. 13.4 9.4
.. 21.6 14.9
.. 36.2 17.8
4.8 4.2 17.65.5 3.9 14.75.9 9.1 29.1
0.47 0.35 0.4236.3 71.4 18.5
Economic and social contextPopulation (millions)Urban population (% of total)GNI per capita, World Bank Atlas method ($)GDP growth, 2000–05 and 2005–12 (avg. annual %)Adult literacy rate (% ages 15 and older) Gross primary, secondary, tertiary school enrollment (%)
Sector structureSeparate telecommunications/ICT regulatorStatus of main fixed-line telephone operatorLevel of competition (competition, partial comp., monopoly) International gateway(s) Mobile telephone service Internet serviceForeign ownership (not allowed, restricted, allowed)Reg. treatment of VoIP (banned, closed, no framework, allowed)
Sector efficiency and capacityTelecommunications revenue (% of GDP)Telecommunications investment (% of revenue)
Sector performanceAccess
Fixed-telephone subscriptions (per 100 people)Mobile-cellular telephone subscriptions (per 100 people)Fixed (wired)-broadband subscriptions (per 100 people)Households with a computer (%)Households with Internet access at home (%)Usage
Int’l. voice traffic, total (minutes/subscription/month)Domestic mobile traffic (minutes/subscription/month)Individuals using the Internet (%)Quality
Population covered by a mobile-cellular network (%)Fixed (wired)-broadband subscriptions (% of total Internet)International Internet bandwidth (bit/s per Internet user)Affordability
Fixed-telephone sub-basket ($ a month)Mobile-cellular sub-basket ($ a month)Fixed-broadband sub-basket ($ a month)Trade
ICT goods exports (% of total goods exports)ICT goods imports (% of total goods imports)ICT service exports (% of total service exports)Applications
Online service index (0–1, 1=highest presence)Secure Internet servers (per million people)

197The Little Data Book on Information and Communication Technology 2014
2005 2012 2012
Country data
High-
income
group
High income
St. Martin (French part)
0.03 0.03 1,300.. .. 80.. .. 38,412.. .. 1.0.. .. .... .. 93
.. ..
.. ..
.. ..
.. ..
.. ..
.. ..
.. ..
.. .. 2.7
.. .. 17.6
.. .. 43.6
.. .. 122.9
.. .. 26.2
.. .. 77.7
.. .. 75.5
.. .. ..
.. .. 113.6
.. .. 75.4
.. .. 100
.. .. 95.9
.. .. 85,990
.. .. 25.2
.. .. 20.6
.. .. 29.2
.. .. 8.9
.. .. 10.8
.. .. 30.8
.. .. 0.67
.. 32.3 827.6
Economic and social contextPopulation (millions)Urban population (% of total)GNI per capita, World Bank Atlas method ($)GDP growth, 2000–05 and 2005–12 (avg. annual %)Adult literacy rate (% ages 15 and older) Gross primary, secondary, tertiary school enrollment (%)
Sector structureSeparate telecommunications/ICT regulatorStatus of main fixed-line telephone operatorLevel of competition (competition, partial comp., monopoly) International gateway(s) Mobile telephone service Internet serviceForeign ownership (not allowed, restricted, allowed)Reg. treatment of VoIP (banned, closed, no framework, allowed)
Sector efficiency and capacityTelecommunications revenue (% of GDP)Telecommunications investment (% of revenue)
Sector performanceAccess
Fixed-telephone subscriptions (per 100 people)Mobile-cellular telephone subscriptions (per 100 people)Fixed (wired)-broadband subscriptions (per 100 people)Households with a computer (%)Households with Internet access at home (%)Usage
Int’l. voice traffic, total (minutes/subscription/month)Domestic mobile traffic (minutes/subscription/month)Individuals using the Internet (%)Quality
Population covered by a mobile-cellular network (%)Fixed (wired)-broadband subscriptions (% of total Internet)International Internet bandwidth (bit/s per Internet user)Affordability
Fixed-telephone sub-basket ($ a month)Mobile-cellular sub-basket ($ a month)Fixed-broadband sub-basket ($ a month)Trade
ICT goods exports (% of total goods exports)ICT goods imports (% of total goods imports)ICT service exports (% of total service exports)Applications
Online service index (0–1, 1=highest presence)Secure Internet servers (per million people)

198 2014 The Little Data Book on Information and Communication Technology
2005 2012 2012
Upper
middle-
income
groupCountry data
Latin America & Caribbean Upper middle income
St. Vincent and the Grenadines
0.11 0.11 2,39147 50 61
4,960 6,400 6,9694.9 0.6 6.2
.. .. 94
78 .. 76
Yes YesPrivate Private
C CC CC CA A
No A
9.3 7.4 2.5.. .. 18.2
20.7 17.7 19.464.9 123.9 92.4
3.4 12.4 10.816.8a 62.3a 40.614.1a 49.7a 36.3
58.9 34.7 1.349.4 82.2 284.4
9.2 47.5a 41.6
100 100 99
71.7 98.4 95.51,719,474 577,211 14,580
.. 10.9 9.4
.. 24.6 14.9
.. 33.6 17.8
1.4 2.5 17.66.4 3.3 14.7
24.8 23.8 29.1
0.43 0.31 0.42101.2 238.5 18.5
Economic and social contextPopulation (millions)Urban population (% of total)GNI per capita, World Bank Atlas method ($)GDP growth, 2000–05 and 2005–12 (avg. annual %)Adult literacy rate (% ages 15 and older) Gross primary, secondary, tertiary school enrollment (%)
Sector structureSeparate telecommunications/ICT regulatorStatus of main fixed-line telephone operatorLevel of competition (competition, partial comp., monopoly) International gateway(s) Mobile telephone service Internet serviceForeign ownership (not allowed, restricted, allowed)Reg. treatment of VoIP (banned, closed, no framework, allowed)
Sector efficiency and capacityTelecommunications revenue (% of GDP)Telecommunications investment (% of revenue)
Sector performanceAccess
Fixed-telephone subscriptions (per 100 people)Mobile-cellular telephone subscriptions (per 100 people)Fixed (wired)-broadband subscriptions (per 100 people)Households with a computer (%)Households with Internet access at home (%)Usage
Int’l. voice traffic, total (minutes/subscription/month)Domestic mobile traffic (minutes/subscription/month)Individuals using the Internet (%)Quality
Population covered by a mobile-cellular network (%)Fixed (wired)-broadband subscriptions (% of total Internet)International Internet bandwidth (bit/s per Internet user)Affordability
Fixed-telephone sub-basket ($ a month)Mobile-cellular sub-basket ($ a month)Fixed-broadband sub-basket ($ a month)Trade
ICT goods exports (% of total goods exports)ICT goods imports (% of total goods imports)ICT service exports (% of total service exports)Applications
Online service index (0–1, 1=highest presence)Secure Internet servers (per million people)

199The Little Data Book on Information and Communication Technology 2014
2005 2012 2012
Country data
Lower
middle-
income
group
Sub-Saharan Africa Lower middle income
Sudan
32 37 2,50733 33 39
570 1,500 1,8936.3 2.8 6.061 72 71
.. .. 64
Yes YesMixed Mixed
M PP PP CR RB C
3.9 2.1 2.5
384.0 332.4 20.5
1.5 1.1 5.44.8a 74.4 83.10.0 0.1 1.43.0 14.0 15.00.6 29.3 12.4
5.6 5.6 6.5
81.1 80.2 ..1.3 21.0 18.7
34 88 86
4.7 72.4 58.2
407 1,703 8,076
.. 4.9 4.9
.. 5.6 10.5
.. 9.7 20.6
0.0 0.0 4.64.2 3.8 7.22.1 3.8 47.1
0.22 0.25 0.320.0 0.0 4.4
Economic and social contextPopulation (millions)b
Urban population (% of total)b
GNI per capita, World Bank Atlas method ($)c
GDP growth, 2000–05 and 2005–12 (avg. annual %)c
Adult literacy rate (% ages 15 and older) Gross primary, secondary, tertiary school enrollment (%)
Sector structureSeparate telecommunications/ICT regulatorStatus of main fixed-line telephone operatorLevel of competition (competition, partial comp., monopoly) International gateway(s) Mobile telephone service Internet serviceForeign ownership (not allowed, restricted, allowed)Reg. treatment of VoIP (banned, closed, no framework, allowed)
Sector efficiency and capacityTelecommunications revenue (% of GDP)Telecommunications investment (% of revenue)
Sector performanceAccess
Fixed-telephone subscriptions (per 100 people)Mobile-cellular telephone subscriptions (per 100 people)Fixed (wired)-broadband subscriptions (per 100 people)Households with a computer (%)Households with Internet access at home (%)Usage
Int’l. voice traffic, total (minutes/subscription/month)Domestic mobile traffic (minutes/subscription/month)Individuals using the Internet (%)Quality
Population covered by a mobile-cellular network (%)Fixed (wired)-broadband subscriptions (% of total Internet)International Internet bandwidth (bit/s per Internet user)Affordability
Fixed-telephone sub-basket ($ a month)Mobile-cellular sub-basket ($ a month)Fixed-broadband sub-basket ($ a month)Trade
ICT goods exports (% of total goods exports)ICT goods imports (% of total goods imports)ICT service exports (% of total service exports)Applications
Online service index (0–1, 1=highest presence)Secure Internet servers (per million people)

200 2014 The Little Data Book on Information and Communication Technology
2005 2012 2012
Upper
middle-
income
groupCountry data
Latin America & Caribbean Upper middle income
Suriname
Economic and social contextPopulation (millions) 0.50 0.53 2,391Urban population (% of total) 67 70 61GNI per capita, World Bank Atlas method ($) 3,330 8,680 6,969GDP growth, 2000–05 and 2005–12 (avg. annual %) 5.9 4.2 6.2Adult literacy rate (% ages 15 and older) 90 95 94
Gross primary, secondary, tertiary school enrollment (%) .. .. 76
Sector structureSeparate telecommunications/ICT regulator Yes YesStatus of main fixed-line telephone operator Public PublicLevel of competition (competition, partial comp., monopoly) International gateway(s) M C Mobile telephone service M C Internet service P CForeign ownership (not allowed, restricted, allowed) R RReg. treatment of VoIP (banned, closed, no framework, allowed) No A
Sector efficiency and capacityTelecommunications revenue (% of GDP) 5.7 1.0 2.5Telecommunications investment (% of revenue) 32.4 15.9 18.2
Sector performanceAccess
Fixed-telephone subscriptions (per 100 people) 16.2 16.2 19.4Mobile-cellular telephone subscriptions (per 100 people) 46.6 106.5 92.4Fixed (wired)-broadband subscriptions (per 100 people) 0.2 5.5 10.8Households with a computer (%) 17.3a 34.3a 40.6Households with Internet access at home (%) 5.2a 20.2a 36.3Usage
Int’l. voice traffic, total (minutes/subscription/month) .. 28.9 1.3Domestic mobile traffic (minutes/subscription/month) 43.0 70.6 284.4Individuals using the Internet (%) 6.4 34.7a 41.6Quality
Population covered by a mobile-cellular network (%) .. 100 99
Fixed (wired)-broadband subscriptions (% of total Internet) 15.9 67.9 95.5International Internet bandwidth (bit/s per Internet user) 1,407 2,002 14,580Affordability
Fixed-telephone sub-basket ($ a month) .. 2.9 9.4Mobile-cellular sub-basket ($ a month) .. 14.2 14.9Fixed-broadband sub-basket ($ a month) .. 41.9 17.8Trade
ICT goods exports (% of total goods exports) 0.2 0.1 17.6ICT goods imports (% of total goods imports) 3.3 2.8 14.7ICT service exports (% of total service exports) .. 26.7 29.1Applications
Online service index (0–1, 1=highest presence) 0.35 0.16 0.42Secure Internet servers (per million people) 10.0 33.4 18.5

201The Little Data Book on Information and Communication Technology 2014
2005 2012 2012
Country data
Lower
middle-
income
group
Sub-Saharan Africa Lower middle income
Swaziland
Economic and social contextPopulation (millions) 1 1 2,507Urban population (% of total) 22 21 39GNI per capita, World Bank Atlas method ($) 2,390 2,860 1,893GDP growth, 2000–05 and 2005–12 (avg. annual %) 2.2 1.7 6.0Adult literacy rate (% ages 15 and older) 82 88 71
Gross primary, secondary, tertiary school enrollment (%) 61 67 64
Sector structureSeparate telecommunications/ICT regulator No NoStatus of main fixed-line telephone operator Public PublicLevel of competition (competition, partial comp., monopoly) International gateway(s) .. M Mobile telephone service M M Internet service C PForeign ownership (not allowed, restricted, allowed) No RReg. treatment of VoIP (banned, closed, no framework, allowed) B B
Sector efficiency and capacityTelecommunications revenue (% of GDP) 12.4 4.5 2.5
Telecommunications investment (% of revenue) 13.2 6.8 20.5
Sector performanceAccess
Fixed-telephone subscriptions (per 100 people) 4.0 3.7 5.4Mobile-cellular telephone subscriptions (per 100 people) 18.1 65.4 83.1Fixed (wired)-broadband subscriptions (per 100 people) 0.0 0.3 1.4Households with a computer (%) 8.6a 11.9a 15.0Households with Internet access at home (%) 3.0a 11.4a 12.4Usage
Int’l. voice traffic, total (minutes/subscription/month) .. 8.3 6.5
Domestic mobile traffic (minutes/subscription/month) .. 45.2 ..Individuals using the Internet (%) 3.7a 20.8a 18.7Quality
Population covered by a mobile-cellular network (%) 90 97 86
Fixed (wired)-broadband subscriptions (% of total Internet) 0.0 90.0 58.2
International Internet bandwidth (bit/s per Internet user) 24 1,818 8,076Affordability
Fixed-telephone sub-basket ($ a month) .. 6.8 4.9Mobile-cellular sub-basket ($ a month) .. 22.5 10.5Fixed-broadband sub-basket ($ a month) .. 75.7 20.6Trade
ICT goods exports (% of total goods exports) 0.2 .. 4.6ICT goods imports (% of total goods imports) 2.2 .. 7.2ICT service exports (% of total service exports) 15.6 42.7 47.1Applications
Online service index (0–1, 1=highest presence) 0.35 0.14 0.32Secure Internet servers (per million people) 1.8 8.8 4.4

202 2014 The Little Data Book on Information and Communication Technology
2005 2012 2012
Country data
High-
income
group
High income
Sweden
Economic and social contextPopulation (millions) 9 10 1,300Urban population (% of total) 84 85 80GNI per capita, World Bank Atlas method ($) 42,920 56,120 38,412GDP growth, 2000–05 and 2005–12 (avg. annual %) 2.8 1.4 1.0Adult literacy rate (% ages 15 and older) .. .. ..Gross primary, secondary, tertiary school enrollment (%) 95 92 93
Sector structureSeparate telecommunications/ICT regulator Yes YesStatus of main fixed-line telephone operator Mixed MixedLevel of competition (competition, partial comp., monopoly) International gateway(s) C C
Mobile telephone service C C
Internet service C C
Foreign ownership (not allowed, restricted, allowed) A AReg. treatment of VoIP (banned, closed, no framework, allowed) A A
Sector efficiency and capacityTelecommunications revenue (% of GDP) 1.8 1.5 2.7Telecommunications investment (% of revenue) 17.8 13.5 17.6
Sector performanceAccess
Fixed-telephone subscriptions (per 100 people) 62.4 43.8 43.6Mobile-cellular telephone subscriptions (per 100 people) 100.8 124.6 122.9Fixed (wired)-broadband subscriptions (per 100 people) 27.9 32.3 26.2Households with a computer (%) 80.0 92.0 77.7Households with Internet access at home (%) 72.5 92.0 75.5Usage
Int’l. voice traffic, total (minutes/subscription/month) .. .. ..Domestic mobile traffic (minutes/subscription/month) 90.8 164.9 113.6
Individuals using the Internet (%) 84.8 94.0 75.4Quality
Population covered by a mobile-cellular network (%) 99 100 100Fixed (wired)-broadband subscriptions (% of total Internet) 76.7 96.6 95.9
International Internet bandwidth (bit/s per Internet user) 20,578 279,287 85,990Affordability
Fixed-telephone sub-basket ($ a month) .. 28.3 25.2Mobile-cellular sub-basket ($ a month) .. 20.6 20.6Fixed-broadband sub-basket ($ a month) .. 36.8 29.2Trade
ICT goods exports (% of total goods exports) 11.2 7.2 8.9ICT goods imports (% of total goods imports) 11.1 10.1 10.8ICT service exports (% of total service exports) 46.2 46.6 30.8Applications
Online service index (0–1, 1=highest presence) 0.92 0.84 0.67Secure Internet servers (per million people) 331.2 1,444.0 827.6

203The Little Data Book on Information and Communication Technology 2014
2005 2012 2012
Country data
High-
income
group
High income
Switzerland
Economic and social contextPopulation (millions) 7 8 1,300Urban population (% of total) 73 74 80GNI per capita, World Bank Atlas method ($) 58,530 80,970 38,412GDP growth, 2000–05 and 2005–12 (avg. annual %) 1.2 1.7 1.0Adult literacy rate (% ages 15 and older) .. .. ..Gross primary, secondary, tertiary school enrollment (%) 85 87 93
Sector structureSeparate telecommunications/ICT regulator Yes YesStatus of main fixed-line telephone operator Mixed MixedLevel of competition (competition, partial comp., monopoly) International gateway(s) C C Mobile telephone service P C Internet service C CForeign ownership (not allowed, restricted, allowed) A AReg. treatment of VoIP (banned, closed, no framework, allowed) A A
Sector efficiency and capacityTelecommunications revenue (% of GDP) 3.4 2.4 2.7Telecommunications investment (% of revenue) 12.6 21.1 17.6
Sector performanceAccess
Fixed-telephone subscriptions (per 100 people) 69.5 56.5 43.6Mobile-cellular telephone subscriptions (per 100 people) 92.2 130.2 122.9Fixed (wired)-broadband subscriptions (per 100 people) 22.5 39.9 26.2Households with a computer (%) 76.5 85.8a 77.7Households with Internet access at home (%) 67.0a 90.0a 75.5Usage
Int’l. voice traffic, total (minutes/subscription/month) .. .. ..Domestic mobile traffic (minutes/subscription/month) 57.6 84.5 113.6
Individuals using the Internet (%) 70.1 85.2 75.4Quality
Population covered by a mobile-cellular network (%) 100 100 100Fixed (wired)-broadband subscriptions (% of total Internet) 64.6 99.0 95.9
International Internet bandwidth (bit/s per Internet user) 13,760 312,015 85,990Affordability
Fixed-telephone sub-basket ($ a month) .. 34.6 25.2Mobile-cellular sub-basket ($ a month) .. 51.3 20.6Fixed-broadband sub-basket ($ a month) .. 38.3 29.2Trade
ICT goods exports (% of total goods exports) 2.6 1.4 8.9ICT goods imports (% of total goods imports) 7.4 5.5 10.8ICT service exports (% of total service exports) 26.9 34.6 30.8Applications
Online service index (0–1, 1=highest presence) 0.76 0.67 0.67Secure Internet servers (per million people) 472.8 2,222.0 827.6

204 2014 The Little Data Book on Information and Communication Technology
2005 2012 2012
Country data
Lower
middle-
income
group
Middle East & North Africa Lower middle income
Syrian Arab Republic
Economic and social contextPopulation (millions) 18 22 2,507Urban population (% of total) 54 56 39GNI per capita, World Bank Atlas method ($) 1,520 .. 1,893GDP growth, 2000–05 and 2005–12 (avg. annual %) 4.7 5.0 6.0Adult literacy rate (% ages 15 and older) 81 84 71
Gross primary, secondary, tertiary school enrollment (%) 70 73 64
Sector structureSeparate telecommunications/ICT regulator No NoStatus of main fixed-line telephone operator Public PublicLevel of competition (competition, partial comp., monopoly) International gateway(s) .. .. Mobile telephone service P P
Internet service P P
Foreign ownership (not allowed, restricted, allowed) A RReg. treatment of VoIP (banned, closed, no framework, allowed) B B
Sector efficiency and capacityTelecommunications revenue (% of GDP) 2.6 .. 2.5
Telecommunications investment (% of revenue) 7.5 15.1 20.5
Sector performanceAccess
Fixed-telephone subscriptions (per 100 people) 16.0 20.2 5.4Mobile-cellular telephone subscriptions (per 100 people) 16.2 59.3 83.1Fixed (wired)-broadband subscriptions (per 100 people) 0.0a 1.1 1.4Households with a computer (%) 28.0 43.0a 15.0Households with Internet access at home (%) 26.0 38.0a 12.4Usage
Int’l. voice traffic, total (minutes/subscription/month) 13.6 11.6 6.5
Domestic mobile traffic (minutes/subscription/month) 130.2 72.2 ..Individuals using the Internet (%) 5.6a 24.3a 18.7Quality
Population covered by a mobile-cellular network (%) 92 90 86
Fixed (wired)-broadband subscriptions (% of total Internet) 1.3 60.5 58.2
International Internet bandwidth (bit/s per Internet user) 333 3,760 8,076Affordability
Fixed-telephone sub-basket ($ a month) .. 1.3 4.9Mobile-cellular sub-basket ($ a month) .. 21.3 10.5Fixed-broadband sub-basket ($ a month) .. 21.6 20.6Trade
ICT goods exports (% of total goods exports) 0.0 0.0 4.6ICT goods imports (% of total goods imports) 3.3 2.2 7.2ICT service exports (% of total service exports) 9.3 2.5 47.1Applications
Online service index (0–1, 1=highest presence) 0.36 0.23 0.32Secure Internet servers (per million people) 0.1 0.5 4.4

205The Little Data Book on Information and Communication Technology 2014
2005 2012 2012
Country data
Low-
income
group
Europe & Central Asia Low income
Tajikistan
Economic and social contextPopulation (millions) 7 8 846Urban population (% of total) 26 27 28GNI per capita, World Bank Atlas method ($) 320 880 590GDP growth, 2000–05 and 2005–12 (avg. annual %) 10.1 6.7 5.9Adult literacy rate (% ages 15 and older) 99 100 61
Gross primary, secondary, tertiary school enrollment (%) 69 69 60
Sector structureSeparate telecommunications/ICT regulator No NoStatus of main fixed-line telephone operator Mixed MixedLevel of competition (competition, partial comp., monopoly) International gateway(s) .. .. Mobile telephone service .. .. Internet service .. ..Foreign ownership (not allowed, restricted, allowed) .. ..Reg. treatment of VoIP (banned, closed, no framework, allowed) No A
Sector efficiency and capacityTelecommunications revenue (% of GDP) 2.9 .. 5.0
Telecommunications investment (% of revenue) 71.4 .. ..
Sector performanceAccess
Fixed-telephone subscriptions (per 100 people) 4.1 4.9 1.0Mobile-cellular telephone subscriptions (per 100 people) 3.9 81.5 47.2Fixed (wired)-broadband subscriptions (per 100 people) 0.1 0.1 0.2Households with a computer (%) 1.0a 4.1a 4.2Households with Internet access at home (%) 0.3 3.6a 3.4Usage
Int’l. voice traffic, total (minutes/subscription/month) .. .. ..Domestic mobile traffic (minutes/subscription/month) 7.3 .. 70.1Individuals using the Internet (%) 0.3 14.5a 6.2Quality
Population covered by a mobile-cellular network (%) .. .. ..Fixed (wired)-broadband subscriptions (% of total Internet) 2.2 .. 30.9
International Internet bandwidth (bit/s per Internet user) 98 .. 9,141Affordability
Fixed-telephone sub-basket ($ a month) .. 0.9 8.9Mobile-cellular sub-basket ($ a month) .. 8.5 11.9Fixed-broadband sub-basket ($ a month) .. 362.5 46.9Trade
ICT goods exports (% of total goods exports) .. .. ..ICT goods imports (% of total goods imports) .. .. ..ICT service exports (% of total service exports) 19.2 40.7 ..Applications
Online service index (0–1, 1=highest presence) 0.32 0.24 0.20Secure Internet servers (per million people) .. 1.2 1.1

206 2014 The Little Data Book on Information and Communication Technology
2005 2012 2012
Country data
Low-
income
group
Sub-Saharan Africa Low income
Tanzania
Economic and social contextPopulation (millions) 39 48 846Urban population (% of total) 24 27 28GNI per capita, World Bank Atlas method ($) 380 570 590GDP growth, 2000–05 and 2005–12 (avg. annual %) 7.1 6.8 5.9Adult literacy rate (% ages 15 and older) 69 68 61
Gross primary, secondary, tertiary school enrollment (%) .. 56 60
Sector structureSeparate telecommunications/ICT regulator Yes YesStatus of main fixed-line telephone operator Mixed MixedLevel of competition (competition, partial comp., monopoly) International gateway(s) M M
Mobile telephone service C C
Internet service C C
Foreign ownership (not allowed, restricted, allowed) R RReg. treatment of VoIP (banned, closed, no framework, allowed) A A
Sector efficiency and capacityTelecommunications revenue (% of GDP) .. .. 5.0
Telecommunications investment (% of revenue) .. .. ..
Sector performanceAccess
Fixed-telephone subscriptions (per 100 people) 0.4 0.4 1.0Mobile-cellular telephone subscriptions (per 100 people) 7.6 57.0 47.2Fixed (wired)-broadband subscriptions (per 100 people) 0.0 0.0 0.2Households with a computer (%) 2.1a 3.2a 4.2Households with Internet access at home (%) 0.5a 3.3a 3.4Usage
Int’l. voice traffic, total (minutes/subscription/month) 3.2 0.5 ..Domestic mobile traffic (minutes/subscription/month) 7.1 51.5 70.1Individuals using the Internet (%) 1.1a 4.0a 6.2Quality
Population covered by a mobile-cellular network (%) 45 95 ..Fixed (wired)-broadband subscriptions (% of total Internet) 1.6 .. 30.9
International Internet bandwidth (bit/s per Internet user) 234 3,974 9,141Affordability
Fixed-telephone sub-basket ($ a month) .. 8.9 8.9Mobile-cellular sub-basket ($ a month) .. 7.7 11.9Fixed-broadband sub-basket ($ a month) .. 19.1 46.9Trade
ICT goods exports (% of total goods exports) 0.3 0.1 ..ICT goods imports (% of total goods imports) 5.8 3.6 ..ICT service exports (% of total service exports) 10.1 13.3 ..Applications
Online service index (0–1, 1=highest presence) 0.29 0.35 0.20Secure Internet servers (per million people) 0.1 1.1 1.1

207The Little Data Book on Information and Communication Technology 2014
2005 2012 2012
Upper
middle-
income
groupCountry data
East Asia & Pacific Upper middle income
Thailand
Economic and social contextPopulation (millions) 66 67 2,391Urban population (% of total) 32 34 61GNI per capita, World Bank Atlas method ($) 2,600 5,210 6,969GDP growth, 2000–05 and 2005–12 (avg. annual %) 5.5 3.0 6.2Adult literacy rate (% ages 15 and older) 94 .. 94
Gross primary, secondary, tertiary school enrollment (%) 72 76 76
Sector structureSeparate telecommunications/ICT regulator Yes YesStatus of main fixed-line telephone operator Public PublicLevel of competition (competition, partial comp., monopoly) International gateway(s) M C
Mobile telephone service P C
Internet service C C
Foreign ownership (not allowed, restricted, allowed) R RReg. treatment of VoIP (banned, closed, no framework, allowed) B A
Sector efficiency and capacityTelecommunications revenue (% of GDP) 3.2 2.3 2.5Telecommunications investment (% of revenue) 10.0 23.5 18.2
Sector performanceAccess
Fixed-telephone subscriptions (per 100 people) 10.7 9.5 19.4Mobile-cellular telephone subscriptions (per 100 people) 46.5 127.3 92.4Fixed (wired)-broadband subscriptions (per 100 people) 0.8 8.2 10.8Households with a computer (%) 15.5 26.9 40.6Households with Internet access at home (%) 7.2a 18.4 36.3Usage
Int’l. voice traffic, total (minutes/subscription/month) .. 1.8 1.3Domestic mobile traffic (minutes/subscription/month) .. 38.0 284.4Individuals using the Internet (%) 15.0 26.5 41.6Quality
Population covered by a mobile-cellular network (%) 26 100 99
Fixed (wired)-broadband subscriptions (% of total Internet) 99.6 94.4 95.5International Internet bandwidth (bit/s per Internet user) 691 26,649 14,580Affordability
Fixed-telephone sub-basket ($ a month) .. 6.2 9.4Mobile-cellular sub-basket ($ a month) .. 10.6 14.9Fixed-broadband sub-basket ($ a month) .. 20.7 17.8Trade
ICT goods exports (% of total goods exports) 23.4 16.0 17.6ICT goods imports (% of total goods imports) 17.4 11.8 14.7ICT service exports (% of total service exports) 25.7 16.2 29.1Applications
Online service index (0–1, 1=highest presence) 0.50 0.51 0.42Secure Internet servers (per million people) 4.8 18.1 18.5

208 2014 The Little Data Book on Information and Communication Technology
2005 2012 2012
Country data
Lower
middle-
income
group
East Asia & Pacific Lower middle income
Timor-Leste
Economic and social contextPopulation (millions) 1 1 2,507Urban population (% of total) 26 29 39GNI per capita, World Bank Atlas method ($) 890 3,620 1,893GDP growth, 2000–05 and 2005–12 (avg. annual %) 1.0 9.8 6.0Adult literacy rate (% ages 15 and older) 51 58 71
Gross primary, secondary, tertiary school enrollment (%) 66 72 64
Sector structureSeparate telecommunications/ICT regulator No NoStatus of main fixed-line telephone operator .. ..Level of competition (competition, partial comp., monopoly) International gateway(s) .. .. Mobile telephone service .. .. Internet service .. ..Foreign ownership (not allowed, restricted, allowed) .. ..Reg. treatment of VoIP (banned, closed, no framework, allowed) B B
Sector efficiency and capacityTelecommunications revenue (% of GDP) 3.6 6.0 2.5
Telecommunications investment (% of revenue) 16.9 28.6 20.5
Sector performanceAccess
Fixed-telephone subscriptions (per 100 people) 0.2 0.3 5.4Mobile-cellular telephone subscriptions (per 100 people) 3.3 55.7 83.1Fixed (wired)-broadband subscriptions (per 100 people) 0.0 0.1 1.4Households with a computer (%) .. .. 15.0Households with Internet access at home (%) .. .. 12.4Usage
Int’l. voice traffic, total (minutes/subscription/month) 20.0 .. 6.5
Domestic mobile traffic (minutes/subscription/month) 70.6 36.8 ..Individuals using the Internet (%) 0.1 0.9a 18.7Quality
Population covered by a mobile-cellular network (%) 50 92 86
Fixed (wired)-broadband subscriptions (% of total Internet) 3.4 51.5 58.2
International Internet bandwidth (bit/s per Internet user) 5,071 17,467 8,076Affordability
Fixed-telephone sub-basket ($ a month) .. 20.8 4.9Mobile-cellular sub-basket ($ a month) .. 16.3 10.5Fixed-broadband sub-basket ($ a month) .. 99.0 20.6Trade
ICT goods exports (% of total goods exports) 5.2 .. 4.6ICT goods imports (% of total goods imports) 3.4 .. 7.2ICT service exports (% of total service exports) .. .. 47.1Applications
Online service index (0–1, 1=highest presence) 0.25 0.22 0.32Secure Internet servers (per million people) 1.0 0.8 4.4

209The Little Data Book on Information and Communication Technology 2014
2005 2012 2012
Country data
Low-
income
group
Sub-Saharan Africa Low income
Togo
Economic and social contextPopulation (millions) 6 7 846Urban population (% of total) 35 39 28GNI per capita, World Bank Atlas method ($) 370 500 590GDP growth, 2000–05 and 2005–12 (avg. annual %) 1.5 3.6 5.9Adult literacy rate (% ages 15 and older) 57 60 61
Gross primary, secondary, tertiary school enrollment (%) 61 73 60
Sector structureSeparate telecommunications/ICT regulator Yes YesStatus of main fixed-line telephone operator Public PublicLevel of competition (competition, partial comp., monopoly) International gateway(s) P P
Mobile telephone service P C
Internet service C C
Foreign ownership (not allowed, restricted, allowed) R RReg. treatment of VoIP (banned, closed, no framework, allowed) A A
Sector efficiency and capacityTelecommunications revenue (% of GDP) 6.3 9.2 5.0
Telecommunications investment (% of revenue) 34.7 23.6 ..
Sector performanceAccess
Fixed-telephone subscriptions (per 100 people) 1.1 0.9 1.0Mobile-cellular telephone subscriptions (per 100 people) 7.8 49.9 47.2Fixed (wired)-broadband subscriptions (per 100 people) 0.0 0.1 0.2Households with a computer (%) 1.0 2.3 4.2Households with Internet access at home (%) .. 1.4 3.4Usage
Int’l. voice traffic, total (minutes/subscription/month) 22.5 7.6 ..Domestic mobile traffic (minutes/subscription/month) 22.0 29.4 70.1Individuals using the Internet (%) 1.8a 4.0a 6.2Quality
Population covered by a mobile-cellular network (%) 85 91 ..Fixed (wired)-broadband subscriptions (% of total Internet) 1.9 16.9 30.9
International Internet bandwidth (bit/s per Internet user) 143 5,224 9,141Affordability
Fixed-telephone sub-basket ($ a month) .. 10.5 8.9Mobile-cellular sub-basket ($ a month) .. 17.8 11.9Fixed-broadband sub-basket ($ a month) .. 47.2 46.9Trade
ICT goods exports (% of total goods exports) 0.1 0.0 ..ICT goods imports (% of total goods imports) 3.9 1.9 ..ICT service exports (% of total service exports) 23.8 23.2 ..Applications
Online service index (0–1, 1=highest presence) 0.22 0.14 0.20Secure Internet servers (per million people) 0.4 3.1 1.1

210 2014 The Little Data Book on Information and Communication Technology
2005 2012 2012
Upper
middle-
income
groupCountry data
East Asia & Pacific Upper middle income
Tonga
Economic and social contextPopulation (millions) 0.10 0.10 2,391Urban population (% of total) 23 24 61GNI per capita, World Bank Atlas method ($) 2,550 4,220 6,969GDP growth, 2000–05 and 2005–12 (avg. annual %) 2.4 1.1 6.2Adult literacy rate (% ages 15 and older) 99 .. 94
Gross primary, secondary, tertiary school enrollment (%) 88 .. 76
Sector structureSeparate telecommunications/ICT regulator No NoStatus of main fixed-line telephone operator Public PublicLevel of competition (competition, partial comp., monopoly) International gateway(s) .. C
Mobile telephone service .. C
Internet service P C
Foreign ownership (not allowed, restricted, allowed) .. AReg. treatment of VoIP (banned, closed, no framework, allowed) C C
Sector efficiency and capacityTelecommunications revenue (% of GDP) .. .. 2.5Telecommunications investment (% of revenue) .. .. 18.2
Sector performanceAccess
Fixed-telephone subscriptions (per 100 people) 13.6 28.6 19.4Mobile-cellular telephone subscriptions (per 100 people) 29.6 53.4 92.4Fixed (wired)-broadband subscriptions (per 100 people) 0.6 1.4 10.8Households with a computer (%) .. 15.5a 40.6Households with Internet access at home (%) .. 12.0a 36.3Usage
Int’l. voice traffic, total (minutes/subscription/month) .. .. 1.3Domestic mobile traffic (minutes/subscription/month) .. .. 284.4Individuals using the Internet (%) 4.9a 34.9a 41.6Quality
Population covered by a mobile-cellular network (%) 70 .. 99
Fixed (wired)-broadband subscriptions (% of total Internet) 37.0 16.2 95.5International Internet bandwidth (bit/s per Internet user) 404 2,733 14,580Affordability
Fixed-telephone sub-basket ($ a month) .. 6.4 9.4Mobile-cellular sub-basket ($ a month) .. 11.0 14.9Fixed-broadband sub-basket ($ a month) .. 62.3 17.8Trade
ICT goods exports (% of total goods exports) .. 1.1 17.6ICT goods imports (% of total goods imports) 2.8 3.8 14.7ICT service exports (% of total service exports) 16.3 12.2 29.1Applications
Online service index (0–1, 1=highest presence) 0.40 0.24 0.42Secure Internet servers (per million people) 9.8 19.0 18.5

211The Little Data Book on Information and Communication Technology 2014
2005 2012 2012
Country data
High-
income
group
High income
Trinidad and Tobago
Economic and social contextPopulation (millions) 1 1 1,300Urban population (% of total) 12 14 80GNI per capita, World Bank Atlas method ($) 11,060 14,710 38,412GDP growth, 2000–05 and 2005–12 (avg. annual %) 8.7 1.4 1.0Adult literacy rate (% ages 15 and older) 98 99 ..Gross primary, secondary, tertiary school enrollment (%) 67 .. 93
Sector structureSeparate telecommunications/ICT regulator Yes YesStatus of main fixed-line telephone operator Mixed MixedLevel of competition (competition, partial comp., monopoly) International gateway(s) M .. Mobile telephone service M P Internet service C PForeign ownership (not allowed, restricted, allowed) A AReg. treatment of VoIP (banned, closed, no framework, allowed) No A
Sector efficiency and capacityTelecommunications revenue (% of GDP) 2.4 2.9 2.7Telecommunications investment (% of revenue) .. 8.7 17.6
Sector performanceAccess
Fixed-telephone subscriptions (per 100 people) 24.9 21.4 43.6Mobile-cellular telephone subscriptions (per 100 people) 71.3 140.8 122.9Fixed (wired)-broadband subscriptions (per 100 people) 0.8 13.8 26.2Households with a computer (%) 31.0 61.0a 77.7Households with Internet access at home (%) 17.0 40.0a 75.5Usage
Int’l. voice traffic, total (minutes/subscription/month) 27.0 19.6 ..Domestic mobile traffic (minutes/subscription/month) 272.8 205.7 113.6
Individuals using the Internet (%) 29.0a 59.5a 75.4Quality
Population covered by a mobile-cellular network (%) 100 100 100Fixed (wired)-broadband subscriptions (% of total Internet) 16.6 99.1 95.9
International Internet bandwidth (bit/s per Internet user) 1,304 18,442 85,990Affordability
Fixed-telephone sub-basket ($ a month) .. 15.6 25.2Mobile-cellular sub-basket ($ a month) .. 15.1 20.6Fixed-broadband sub-basket ($ a month) .. 12.3 29.2Trade
ICT goods exports (% of total goods exports) 0.2 0.1 8.9ICT goods imports (% of total goods imports) 4.0 3.1 10.8ICT service exports (% of total service exports) 8.9 85.3 30.8Applications
Online service index (0–1, 1=highest presence) 0.53 0.48 0.67Secure Internet servers (per million people) 21.6 93.2 827.6
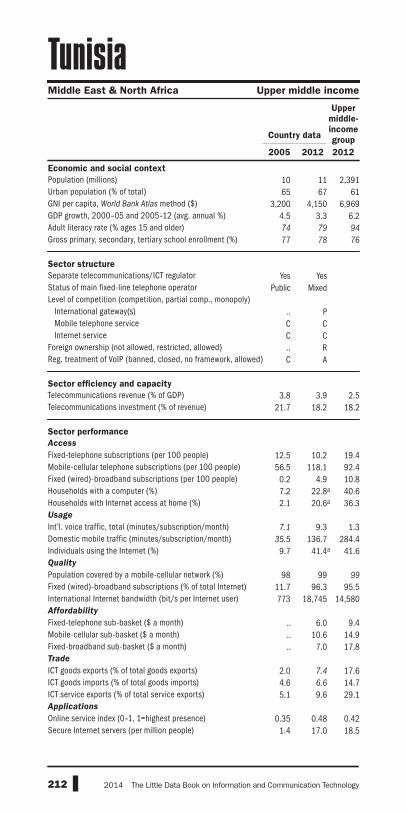
212 2014 The Little Data Book on Information and Communication Technology
2005 2012 2012
Upper
middle-
income
groupCountry data
Economic and social contextPopulation (millions)Urban population (% of total)GNI per capita, World Bank Atlas method ($)GDP growth, 2000–05 and 2005–12 (avg. annual %)Adult literacy rate (% ages 15 and older) Gross primary, secondary, tertiary school enrollment (%)
Sector structureSeparate telecommunications/ICT regulatorStatus of main fixed-line telephone operatorLevel of competition (competition, partial comp., monopoly) International gateway(s) Mobile telephone service Internet serviceForeign ownership (not allowed, restricted, allowed)Reg. treatment of VoIP (banned, closed, no framework, allowed)
Sector efficiency and capacityTelecommunications revenue (% of GDP)Telecommunications investment (% of revenue)
Sector performanceAccess
Fixed-telephone subscriptions (per 100 people)Mobile-cellular telephone subscriptions (per 100 people)Fixed (wired)-broadband subscriptions (per 100 people)Households with a computer (%)Households with Internet access at home (%)Usage Int’l. voice traffic, total (minutes/subscription/month)Domestic mobile traffic (minutes/subscription/month)Individuals using the Internet (%)Quality Population covered by a mobile-cellular network (%)Fixed (wired)-broadband subscriptions (% of total Internet)International Internet bandwidth (bit/s per Internet user)Affordability
Fixed-telephone sub-basket ($ a month)Mobile-cellular sub-basket ($ a month)Fixed-broadband sub-basket ($ a month)Trade
ICT goods exports (% of total goods exports)ICT goods imports (% of total goods imports)ICT service exports (% of total service exports)Applications
Online service index (0–1, 1=highest presence)Secure Internet servers (per million people)
Tunisia
10 11 2,39165 67 61
3,200 4,150 6,9694.5 3.3 6.274 79 94
77 78 76
Yes YesPublic Mixed
.. PC CC C.. RC A
3.8 3.9 2.521.7 18.2 18.2
12.5 10.2 19.456.5 118.1 92.4
0.2 4.9 10.87.2 22.8a 40.62.1 20.6a 36.3
7.1 9.3 1.335.5 136.7 284.4
9.7 41.4a 41.6
98 99 99
11.7 96.3 95.5773 18,745 14,580
.. 6.0 9.4
.. 10.6 14.9
.. 7.0 17.8
2.0 7.4 17.64.6 6.6 14.75.1 9.6 29.1
0.35 0.48 0.421.4 17.0 18.5
Middle East & North Africa Upper middle income

213The Little Data Book on Information and Communication Technology 2014
2005 2012 2012
Upper
middle-
income
groupCountry data
Economic and social contextPopulation (millions)Urban population (% of total)GNI per capita, World Bank Atlas method ($)GDP growth, 2000–05 and 2005–12 (avg. annual %)Adult literacy rate (% ages 15 and older) Gross primary, secondary, tertiary school enrollment (%)
Sector structureSeparate telecommunications/ICT regulatorStatus of main fixed-line telephone operatorLevel of competition (competition, partial comp., monopoly) International gateway(s) Mobile telephone service Internet serviceForeign ownership (not allowed, restricted, allowed)Reg. treatment of VoIP (banned, closed, no framework, allowed)
Sector efficiency and capacityTelecommunications revenue (% of GDP)Telecommunications investment (% of revenue)
Sector performanceAccess
Fixed-telephone subscriptions (per 100 people)Mobile-cellular telephone subscriptions (per 100 people)Fixed (wired)-broadband subscriptions (per 100 people)Households with a computer (%)Households with Internet access at home (%)Usage Int’l. voice traffic, total (minutes/subscription/month)Domestic mobile traffic (minutes/subscription/month)Individuals using the Internet (%)Quality Population covered by a mobile-cellular network (%)Fixed (wired)-broadband subscriptions (% of total Internet)International Internet bandwidth (bit/s per Internet user)Affordability
Fixed-telephone sub-basket ($ a month)Mobile-cellular sub-basket ($ a month)Fixed-broadband sub-basket ($ a month)Trade
ICT goods exports (% of total goods exports)ICT goods imports (% of total goods imports)ICT service exports (% of total service exports)Applications
Online service index (0–1, 1=highest presence)Secure Internet servers (per million people)
Europe & Central Asia Upper middle income
Turkey
68 74 2,39167 72 61
6,520 10,830 6,9695.2 3.4 6.288 94 94
74 85 76
Yes YesMixed Mixed
C ..P ..C C
A ANo A
2.6 2.1 2.511.0 19.0 18.2
28.0 18.7 19.464.4 91.5 92.4
2.3 10.6 10.812.0 50.2 40.6
7.7 47.2 36.3
3.9 5.6 1.368.3 209.0 284.415.5 45.1 41.6
96 100 99
70.6 99.2 95.52,788 40,629 14,580
.. 13.7 9.4
.. 31.4 14.9
.. 12.5 17.8
4.4 1.7 17.66.1 4.2 14.72.2 1.6 29.1
0.48 0.46 0.4218.1 50.4 18.5

214 2014 The Little Data Book on Information and Communication Technology
2005 2012 2012
Upper
middle-
income
groupCountry data
Europe & Central Asia Upper middle income
Turkmenistan
5 5 2,39147 49 61
1,600 5,410 6,9694.5 10.9 6.2
.. 100 94
.. .. 76
No NoPublic Public
.. ..C C
.. ..
.. ..B B
1.5 .. 2.5.. .. 18.2
8.4 11.1 19.42.2 76.4 92.4
.. 0.0 10.81.9a 13.7a 40.60.9a 6.7a 36.3
.. .. 1.3
.. .. 284.41.0a 7.2a 41.6
14 .. 99
.. .. 95.51,605 1,075 14,580
.. .. 9.4
.. .. 14.9
.. .. 17.8
.. .. 17.6
.. .. 14.7
.. .. 29.1
0.33 0.19 0.42.. 0.2 18.5
Economic and social contextPopulation (millions)Urban population (% of total)GNI per capita, World Bank Atlas method ($)GDP growth, 2000–05 and 2005–12 (avg. annual %)Adult literacy rate (% ages 15 and older) Gross primary, secondary, tertiary school enrollment (%)
Sector structureSeparate telecommunications/ICT regulatorStatus of main fixed-line telephone operatorLevel of competition (competition, partial comp., monopoly) International gateway(s) Mobile telephone service Internet serviceForeign ownership (not allowed, restricted, allowed)Reg. treatment of VoIP (banned, closed, no framework, allowed)
Sector efficiency and capacityTelecommunications revenue (% of GDP)Telecommunications investment (% of revenue)
Sector performanceAccess
Fixed-telephone subscriptions (per 100 people)Mobile-cellular telephone subscriptions (per 100 people)Fixed (wired)-broadband subscriptions (per 100 people)Households with a computer (%)Households with Internet access at home (%)Usage Int’l. voice traffic, total (minutes/subscription/month)Domestic mobile traffic (minutes/subscription/month)Individuals using the Internet (%)Quality Population covered by a mobile-cellular network (%)Fixed (wired)-broadband subscriptions (% of total Internet)International Internet bandwidth (bit/s per Internet user)Affordability
Fixed-telephone sub-basket ($ a month)Mobile-cellular sub-basket ($ a month)Fixed-broadband sub-basket ($ a month)Trade
ICT goods exports (% of total goods exports)ICT goods imports (% of total goods imports)ICT service exports (% of total service exports)Applications
Online service index (0–1, 1=highest presence)Secure Internet servers (per million people)

215The Little Data Book on Information and Communication Technology 2014
2005 2012 2012
Country data
High-
income
group
High income
Turks and Caicos Islands
0.03 0.03 1,30090 94 80
.. .. 38,412
.. .. 1.0
.. .. ..
.. .. 93
.. ..
.. ..
.. ..
.. ..
.. ..
.. ..
.. ..
.. .. 2.7
.. .. 17.6
.. .. 43.6
.. .. 122.9
.. .. 26.2
.. .. 77.7
.. .. 75.5
.. .. ..
.. .. 113.6
.. .. 75.4
.. .. 100
.. .. 95.9
.. .. 85,990
.. .. 25.2
.. .. 20.6
.. .. 29.2
4.0 1.9 8.94.6 3.0 10.8
.. .. 30.8
.. .. 0.67
.. 333.3 827.6
Economic and social contextPopulation (millions)Urban population (% of total)GNI per capita, World Bank Atlas method ($)GDP growth, 2000–05 and 2005–12 (avg. annual %)Adult literacy rate (% ages 15 and older) Gross primary, secondary, tertiary school enrollment (%)
Sector structureSeparate telecommunications/ICT regulatorStatus of main fixed-line telephone operatorLevel of competition (competition, partial comp., monopoly) International gateway(s) Mobile telephone service Internet serviceForeign ownership (not allowed, restricted, allowed)Reg. treatment of VoIP (banned, closed, no framework, allowed)
Sector efficiency and capacityTelecommunications revenue (% of GDP)Telecommunications investment (% of revenue)
Sector performanceAccess
Fixed-telephone subscriptions (per 100 people)Mobile-cellular telephone subscriptions (per 100 people)Fixed (wired)-broadband subscriptions (per 100 people)Households with a computer (%)Households with Internet access at home (%)Usage Int’l. voice traffic, total (minutes/subscription/month)Domestic mobile traffic (minutes/subscription/month)Individuals using the Internet (%)Quality Population covered by a mobile-cellular network (%)Fixed (wired)-broadband subscriptions (% of total Internet)International Internet bandwidth (bit/s per Internet user)Affordability
Fixed-telephone sub-basket ($ a month)Mobile-cellular sub-basket ($ a month)Fixed-broadband sub-basket ($ a month)Trade
ICT goods exports (% of total goods exports)ICT goods imports (% of total goods imports)ICT service exports (% of total service exports)Applications
Online service index (0–1, 1=highest presence)Secure Internet servers (per million people)

216 2014 The Little Data Book on Information and Communication Technology
2005 2012 2012
Upper
middle-
income
groupCountry data
East Asia & Pacific Upper middle income
Tuvalu
0.01 0.01 2,39148 51 61
3,740 5,650 6,9690.2 2.3 6.2
.. .. 94
.. .. 76
No NoPublic Public
.. ..M ..M M
R R.. ..
.. .. 2.5
.. .. 18.2
9.2 14.7 19.413.4 28.4 92.4
1.5 5.6 10.8.. 23.4a 40.6.. 19.7a 36.3
.. .. 1.32.9 .. 284.4
10.0a 35.0a 41.6
13 .. 99
28.8 .. 95.53,073 1,159 14,580
.. .. 9.4
.. .. 14.9
.. .. 17.8
7.3 .. 17.66.1 2.1 14.7
.. .. 29.1
0.00 0.05 0.42.. 102.2 18.5
Economic and social contextPopulation (millions)Urban population (% of total)GNI per capita, World Bank Atlas method ($)GDP growth, 2000–05 and 2005–12 (avg. annual %)Adult literacy rate (% ages 15 and older) Gross primary, secondary, tertiary school enrollment (%)
Sector structureSeparate telecommunications/ICT regulatorStatus of main fixed-line telephone operatorLevel of competition (competition, partial comp., monopoly) International gateway(s) Mobile telephone service Internet serviceForeign ownership (not allowed, restricted, allowed)Reg. treatment of VoIP (banned, closed, no framework, allowed)
Sector efficiency and capacityTelecommunications revenue (% of GDP)Telecommunications investment (% of revenue)
Sector performanceAccess
Fixed-telephone subscriptions (per 100 people)Mobile-cellular telephone subscriptions (per 100 people)Fixed (wired)-broadband subscriptions (per 100 people)Households with a computer (%)Households with Internet access at home (%)Usage Int’l. voice traffic, total (minutes/subscription/month)Domestic mobile traffic (minutes/subscription/month)Individuals using the Internet (%)Quality Population covered by a mobile-cellular network (%)Fixed (wired)-broadband subscriptions (% of total Internet)International Internet bandwidth (bit/s per Internet user)Affordability
Fixed-telephone sub-basket ($ a month)Mobile-cellular sub-basket ($ a month)Fixed-broadband sub-basket ($ a month)Trade
ICT goods exports (% of total goods exports)ICT goods imports (% of total goods imports)ICT service exports (% of total service exports)Applications
Online service index (0–1, 1=highest presence)Secure Internet servers (per million people)

217The Little Data Book on Information and Communication Technology 2014
2005 2012 2012
Country data
Low-
income
group
Sub-Saharan Africa Low income
Uganda
29 36 84613 16 28
290 480 5906.9 7.3 5.971 73 61
64 67 60
Yes YesMixed Mixed
P C
P C
C C
A ANo A
3.2 3.7 5.0
23.4 32.6 ..
0.3 0.9 1.04.6 45.0 47.20.0 0.1 0.20.8a 4.0a 4.20.1a 4.2a 3.4
.. .. ..119.4 61.3 70.1
1.7 14.7a 6.2
70 100 ..8.9 40.0 30.9
121 4,670 9,141
.. 9.2 8.9
.. 9.0 11.9
.. 14.0 46.9
2.0 6.5 ..7.5 6.6 ..
13.4 14.1 ..
0.31 0.29 0.200.0 1.2 1.1
Economic and social contextPopulation (millions)Urban population (% of total)GNI per capita, World Bank Atlas method ($)GDP growth, 2000–05 and 2005–12 (avg. annual %)Adult literacy rate (% ages 15 and older) Gross primary, secondary, tertiary school enrollment (%)
Sector structureSeparate telecommunications/ICT regulatorStatus of main fixed-line telephone operatorLevel of competition (competition, partial comp., monopoly) International gateway(s) Mobile telephone service Internet serviceForeign ownership (not allowed, restricted, allowed)Reg. treatment of VoIP (banned, closed, no framework, allowed)
Sector efficiency and capacityTelecommunications revenue (% of GDP)Telecommunications investment (% of revenue)
Sector performanceAccess
Fixed-telephone subscriptions (per 100 people)Mobile-cellular telephone subscriptions (per 100 people)Fixed (wired)-broadband subscriptions (per 100 people)Households with a computer (%)Households with Internet access at home (%)Usage Int’l. voice traffic, total (minutes/subscription/month)Domestic mobile traffic (minutes/subscription/month)Individuals using the Internet (%)Quality Population covered by a mobile-cellular network (%)Fixed (wired)-broadband subscriptions (% of total Internet)International Internet bandwidth (bit/s per Internet user)Affordability
Fixed-telephone sub-basket ($ a month)Mobile-cellular sub-basket ($ a month)Fixed-broadband sub-basket ($ a month)Trade
ICT goods exports (% of total goods exports)ICT goods imports (% of total goods imports)ICT service exports (% of total service exports)Applications
Online service index (0–1, 1=highest presence)Secure Internet servers (per million people)

218 2014 The Little Data Book on Information and Communication Technology
2005 2012 2012
Lower
middle-
income
groupCountry data
Europe & Central Asia Lower middle income
Ukraine
47 46 2,50768 69 39
1,540 3,500 1,8938.0 0.5 6.099 100 71
88 94 64
Yes YesPublic Mixed
.. CC C.. C.. A
No A
5.9 3.4 2.5
32.8 13.6 20.5
24.8 26.8 5.463.7 130.3 83.1
0.3 8.0 1.411.5 40.5 15.0
3.0 36.5a 12.4
.. .. 6.5
.. .. ..3.7 33.7a 18.7
96 100 86
3.5 72.0 58.2
461 14,143 8,076
.. 3.7 4.9
.. 7.8 10.5
.. 7.5 20.6
0.5 1.1 4.64.0 3.8 7.27.6 19.2 47.1
0.57 0.42 0.321.3 26.8 4.4
Economic and social contextPopulation (millions)Urban population (% of total)GNI per capita, World Bank Atlas method ($)GDP growth, 2000–05 and 2005–12 (avg. annual %)Adult literacy rate (% ages 15 and older) Gross primary, secondary, tertiary school enrollment (%)
Sector structureSeparate telecommunications/ICT regulatorStatus of main fixed-line telephone operatorLevel of competition (competition, partial comp., monopoly) International gateway(s) Mobile telephone service Internet serviceForeign ownership (not allowed, restricted, allowed)Reg. treatment of VoIP (banned, closed, no framework, allowed)
Sector efficiency and capacityTelecommunications revenue (% of GDP)Telecommunications investment (% of revenue)
Sector performanceAccess
Fixed-telephone subscriptions (per 100 people)Mobile-cellular telephone subscriptions (per 100 people)Fixed (wired)-broadband subscriptions (per 100 people)Households with a computer (%)Households with Internet access at home (%)Usage Int’l. voice traffic, total (minutes/subscription/month)Domestic mobile traffic (minutes/subscription/month)Individuals using the Internet (%)Quality Population covered by a mobile-cellular network (%)Fixed (wired)-broadband subscriptions (% of total Internet)International Internet bandwidth (bit/s per Internet user)Affordability
Fixed-telephone sub-basket ($ a month)Mobile-cellular sub-basket ($ a month)Fixed-broadband sub-basket ($ a month)Trade
ICT goods exports (% of total goods exports)ICT goods imports (% of total goods imports)ICT service exports (% of total service exports)Applications
Online service index (0–1, 1=highest presence)Secure Internet servers (per million people)
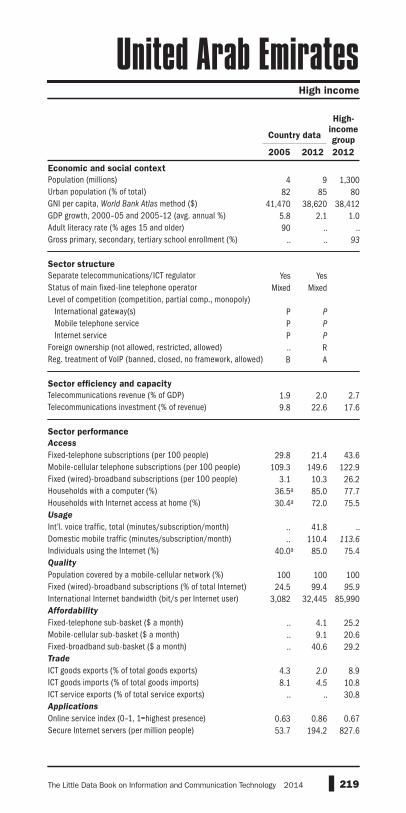
219The Little Data Book on Information and Communication Technology 2014
2005 2012 2012
Country data
High-
income
group
High income
United Arab Emirates
4 9 1,30082 85 80
41,470 38,620 38,4125.8 2.1 1.090 .. ..
.. .. 93
Yes YesMixed Mixed
P P
P P
P P
.. RB A
1.9 2.0 2.79.8 22.6 17.6
29.8 21.4 43.6109.3 149.6 122.9
3.1 10.3 26.236.5a 85.0 77.730.4a 72.0 75.5
.. 41.8 ..
.. 110.4 113.6
40.0a 85.0 75.4
100 100 10024.5 99.4 95.9
3,082 32,445 85,990
.. 4.1 25.2
.. 9.1 20.6
.. 40.6 29.2
4.3 2.0 8.98.1 4.5 10.8
.. .. 30.8
0.63 0.86 0.6753.7 194.2 827.6
Economic and social contextPopulation (millions)Urban population (% of total)GNI per capita, World Bank Atlas method ($)GDP growth, 2000–05 and 2005–12 (avg. annual %)Adult literacy rate (% ages 15 and older) Gross primary, secondary, tertiary school enrollment (%)
Sector structureSeparate telecommunications/ICT regulatorStatus of main fixed-line telephone operatorLevel of competition (competition, partial comp., monopoly) International gateway(s) Mobile telephone service Internet serviceForeign ownership (not allowed, restricted, allowed)Reg. treatment of VoIP (banned, closed, no framework, allowed)
Sector efficiency and capacityTelecommunications revenue (% of GDP)Telecommunications investment (% of revenue)
Sector performanceAccess
Fixed-telephone subscriptions (per 100 people)Mobile-cellular telephone subscriptions (per 100 people)Fixed (wired)-broadband subscriptions (per 100 people)Households with a computer (%)Households with Internet access at home (%)Usage Int’l. voice traffic, total (minutes/subscription/month)Domestic mobile traffic (minutes/subscription/month)Individuals using the Internet (%)Quality Population covered by a mobile-cellular network (%)Fixed (wired)-broadband subscriptions (% of total Internet)International Internet bandwidth (bit/s per Internet user)Affordability
Fixed-telephone sub-basket ($ a month)Mobile-cellular sub-basket ($ a month)Fixed-broadband sub-basket ($ a month)Trade
ICT goods exports (% of total goods exports)ICT goods imports (% of total goods imports)ICT service exports (% of total service exports)Applications
Online service index (0–1, 1=highest presence)Secure Internet servers (per million people)

220 2014 The Little Data Book on Information and Communication Technology
2005 2012 2012
Country data
High-
income
group
High income
United Kingdom
60 64 1,30079 80 80
39,560 38,500 38,4123.0 0.0 1.0
.. .. ..92 89 93
Yes YesPrivate Private
.. ..C C
C ..A AA A
3.7 1.8 2.7.. 15.2 17.6
56.5 52.9 43.6108.6 135.3 122.9
16.4 34.0 26.270.0 87.0 77.760.2 88.6a 75.5
.. .. ..87.6 123.0 113.6
70.0 87.0a 75.4
99 100 10060.7 98.6 95.9
52,831 188,920 85,990
.. 36.2 25.2
.. 47.8 20.6
.. 20.8 29.2
14.0 4.2 8.912.3 7.3 10.837.6 39.0 30.8
0.79 0.97 0.67464.8 1,200.3 827.6
Economic and social contextPopulation (millions)Urban population (% of total)GNI per capita, World Bank Atlas method ($)GDP growth, 2000–05 and 2005–12 (avg. annual %)Adult literacy rate (% ages 15 and older) Gross primary, secondary, tertiary school enrollment (%)
Sector structureSeparate telecommunications/ICT regulatorStatus of main fixed-line telephone operatorLevel of competition (competition, partial comp., monopoly) International gateway(s) Mobile telephone service Internet serviceForeign ownership (not allowed, restricted, allowed)Reg. treatment of VoIP (banned, closed, no framework, allowed)
Sector efficiency and capacityTelecommunications revenue (% of GDP)Telecommunications investment (% of revenue)
Sector performanceAccess
Fixed-telephone subscriptions (per 100 people)Mobile-cellular telephone subscriptions (per 100 people)Fixed (wired)-broadband subscriptions (per 100 people)Households with a computer (%)Households with Internet access at home (%)Usage Int’l. voice traffic, total (minutes/subscription/month)Domestic mobile traffic (minutes/subscription/month)Individuals using the Internet (%)Quality Population covered by a mobile-cellular network (%)Fixed (wired)-broadband subscriptions (% of total Internet)International Internet bandwidth (bit/s per Internet user)Affordability
Fixed-telephone sub-basket ($ a month)Mobile-cellular sub-basket ($ a month)Fixed-broadband sub-basket ($ a month)Trade
ICT goods exports (% of total goods exports)ICT goods imports (% of total goods imports)ICT service exports (% of total service exports)Applications
Online service index (0–1, 1=highest presence)Secure Internet servers (per million people)

221The Little Data Book on Information and Communication Technology 2014
2005 2012 2012
Country data
High-
income
group
High income
United States
296 314 1,30081 83 80
46,350 52,340 38,4122.6 0.8 1.0
.. .. ..93 97 93
Yes YesPrivate Private
.. CC CC CA AA A
2.9 3.4 2.718.7 14.0 17.6
58.7 44.4 43.668.3 95.4 122.917.2 28.3 26.267.1 79.3a 77.758.1a 75.0a 75.5
20.1 18.5 .... 383.7 113.6
68.0a 81.0a 75.4
99 100 10090.0 97.0 95.9
7,185 61,938 85,990
.. 15.0 25.2
.. 35.6 20.6
.. 15.0 29.2
14.3 9.0 8.913.7 12.8 10.819.3 22.1 30.8
0.86 1.00 0.67785.2 1,304.0 827.6
Economic and social contextPopulation (millions)Urban population (% of total)GNI per capita, World Bank Atlas method ($)GDP growth, 2000–05 and 2005–12 (avg. annual %)Adult literacy rate (% ages 15 and older) Gross primary, secondary, tertiary school enrollment (%)
Sector structureSeparate telecommunications/ICT regulatorStatus of main fixed-line telephone operatorLevel of competition (competition, partial comp., monopoly) International gateway(s) Mobile telephone service Internet serviceForeign ownership (not allowed, restricted, allowed)Reg. treatment of VoIP (banned, closed, no framework, allowed)
Sector efficiency and capacityTelecommunications revenue (% of GDP)Telecommunications investment (% of revenue)
Sector performanceAccess
Fixed-telephone subscriptions (per 100 people)Mobile-cellular telephone subscriptions (per 100 people)Fixed (wired)-broadband subscriptions (per 100 people)Households with a computer (%)Households with Internet access at home (%)Usage Int’l. voice traffic, total (minutes/subscription/month)Domestic mobile traffic (minutes/subscription/month)Individuals using the Internet (%)Quality Population covered by a mobile-cellular network (%)Fixed (wired)-broadband subscriptions (% of total Internet)International Internet bandwidth (bit/s per Internet user)Affordability
Fixed-telephone sub-basket ($ a month)Mobile-cellular sub-basket ($ a month)Fixed-broadband sub-basket ($ a month)Trade
ICT goods exports (% of total goods exports)ICT goods imports (% of total goods imports)ICT service exports (% of total service exports)Applications
Online service index (0–1, 1=highest presence)Secure Internet servers (per million people)

222 2014 The Little Data Book on Information and Communication Technology
2005 2012 2012
Country data
High-
income
group
High income
Uruguay
3 3 1,30092 93 80
4,720 13,580 38,4120.0 5.8 1.098 98 ..90 90 93
Yes YesPublic Public
.. ..C C
C P
A ..No A
3.8 2.5 2.78.0 49.7 17.6
30.3 29.8 43.634.7 147.1 122.9
1.5 16.6 26.222.1 63.7 77.713.5 48.4 75.5
8.9 5.9 ..28.1 97.0 113.6
20.1 55.1a 75.4
100 100 10027.8 100.0 95.9
2,395 40,635 85,990
.. 12.0 25.2
.. 22.4 20.6
.. 14.9 29.2
0.1 0.1 8.96.3 5.6 10.8
11.6 15.9 30.8
0.56 0.55 0.6727.1 75.1 827.6
Economic and social contextPopulation (millions)Urban population (% of total)GNI per capita, World Bank Atlas method ($)GDP growth, 2000–05 and 2005–12 (avg. annual %)Adult literacy rate (% ages 15 and older) Gross primary, secondary, tertiary school enrollment (%)
Sector structureSeparate telecommunications/ICT regulatorStatus of main fixed-line telephone operatorLevel of competition (competition, partial comp., monopoly) International gateway(s) Mobile telephone service Internet serviceForeign ownership (not allowed, restricted, allowed)Reg. treatment of VoIP (banned, closed, no framework, allowed)
Sector efficiency and capacityTelecommunications revenue (% of GDP)Telecommunications investment (% of revenue)
Sector performanceAccess
Fixed-telephone subscriptions (per 100 people)Mobile-cellular telephone subscriptions (per 100 people)Fixed (wired)-broadband subscriptions (per 100 people)Households with a computer (%)Households with Internet access at home (%)Usage Int’l. voice traffic, total (minutes/subscription/month)Domestic mobile traffic (minutes/subscription/month)Individuals using the Internet (%)Quality Population covered by a mobile-cellular network (%)Fixed (wired)-broadband subscriptions (% of total Internet)International Internet bandwidth (bit/s per Internet user)Affordability
Fixed-telephone sub-basket ($ a month)Mobile-cellular sub-basket ($ a month)Fixed-broadband sub-basket ($ a month)Trade
ICT goods exports (% of total goods exports)ICT goods imports (% of total goods imports)ICT service exports (% of total service exports)Applications
Online service index (0–1, 1=highest presence)Secure Internet servers (per million people)

223The Little Data Book on Information and Communication Technology 2014
2005 2012 2012
Country data
Lower
middle-
income
group
Europe & Central Asia Lower middle income
Uzbekistan
Economic and social contextPopulation (millions) 26 30 2,507Urban population (% of total) 37 36 39GNI per capita, World Bank Atlas method ($) 530 1,720 1,893GDP growth, 2000–05 and 2005–12 (avg. annual %) 5.3 8.5 6.0Adult literacy rate (% ages 15 and older) 99 99 71
Gross primary, secondary, tertiary school enrollment (%) 75 70 64
Sector structureSeparate telecommunications/ICT regulator No NoStatus of main fixed-line telephone operator Public PublicLevel of competition (competition, partial comp., monopoly) International gateway(s) .. .. Mobile telephone service C C
Internet service .. ..Foreign ownership (not allowed, restricted, allowed) .. ..Reg. treatment of VoIP (banned, closed, no framework, allowed) No No
Sector efficiency and capacityTelecommunications revenue (% of GDP) 2.2 .. 2.5
Telecommunications investment (% of revenue) 31.7 .. 20.5
Sector performanceAccess
Fixed-telephone subscriptions (per 100 people) 6.9 6.9 5.4Mobile-cellular telephone subscriptions (per 100 people) 2.8 71.0 83.1Fixed (wired)-broadband subscriptions (per 100 people) 0.0 0.7 1.4Households with a computer (%) 1.0 8.0a 15.0Households with Internet access at home (%) 0.9a 9.6a 12.4Usage
Int’l. voice traffic, total (minutes/subscription/month) .. 22.1 6.5
Domestic mobile traffic (minutes/subscription/month) .. 154.3 ..Individuals using the Internet (%) 3.3 36.5a 18.7Quality
Population covered by a mobile-cellular network (%) 75 92 86
Fixed (wired)-broadband subscriptions (% of total Internet) 7.4 85.0 58.2
International Internet bandwidth (bit/s per Internet user) 164 959 8,076Affordability
Fixed-telephone sub-basket ($ a month) .. 1.4 4.9Mobile-cellular sub-basket ($ a month) .. 2.4 10.5Fixed-broadband sub-basket ($ a month) .. 11.5 20.6Trade
ICT goods exports (% of total goods exports) .. .. 4.6ICT goods imports (% of total goods imports) .. .. 7.2ICT service exports (% of total service exports) .. .. 47.1Applications
Online service index (0–1, 1=highest presence) 0.41 0.50 0.32Secure Internet servers (per million people) 0.0 0.8 4.4

224 2014 The Little Data Book on Information and Communication Technology
2005 2012 2012
Country data
Lower
middle-
income
group
East Asia & Pacific Lower middle income
Vanuatu
Economic and social contextPopulation (millions) 0.21 0.25 2,507Urban population (% of total) 23 25 39GNI per capita, World Bank Atlas method ($) 1,780 3,000 1,893GDP growth, 2000–05 and 2005–12 (avg. annual %) 1.0 3.9 6.0Adult literacy rate (% ages 15 and older) 78 83 71
Gross primary, secondary, tertiary school enrollment (%) 64 .. 64
Sector structureSeparate telecommunications/ICT regulator No YesStatus of main fixed-line telephone operator Mixed MixedLevel of competition (competition, partial comp., monopoly) International gateway(s) .. C Mobile telephone service .. C Internet service .. CForeign ownership (not allowed, restricted, allowed) .. RReg. treatment of VoIP (banned, closed, no framework, allowed) No A
Sector efficiency and capacityTelecommunications revenue (% of GDP) 3.5 4.8 2.5
Telecommunications investment (% of revenue) 20.0 24.6 20.5
Sector performanceAccess
Fixed-telephone subscriptions (per 100 people) 3.3 2.2 5.4Mobile-cellular telephone subscriptions (per 100 people) 6.1 59.1 83.1Fixed (wired)-broadband subscriptions (per 100 people) 0.0 0.1 1.4Households with a computer (%) 4.0 10.7a 15.0Households with Internet access at home (%) .. 3.5 12.4Usage
Int’l. voice traffic, total (minutes/subscription/month) .. .. 6.5
Domestic mobile traffic (minutes/subscription/month) .. 99.1 ..Individuals using the Internet (%) 5.1 10.6a 18.7Quality
Population covered by a mobile-cellular network (%) 20 92 86
Fixed (wired)-broadband subscriptions (% of total Internet) 3.7 11.9 58.2
International Internet bandwidth (bit/s per Internet user) 376 2,290 8,076Affordability
Fixed-telephone sub-basket ($ a month) .. 40.4 4.9Mobile-cellular sub-basket ($ a month) .. 25.1 10.5Fixed-broadband sub-basket ($ a month) .. 105.2 20.6Trade
ICT goods exports (% of total goods exports) 0.2 0.0 4.6ICT goods imports (% of total goods imports) 2.8 3.1 7.2ICT service exports (% of total service exports) 6.5 2.0 47.1Applications
Online service index (0–1, 1=highest presence) 0.25 0.22 0.32Secure Internet servers (per million people) 133.7 43.5 4.4
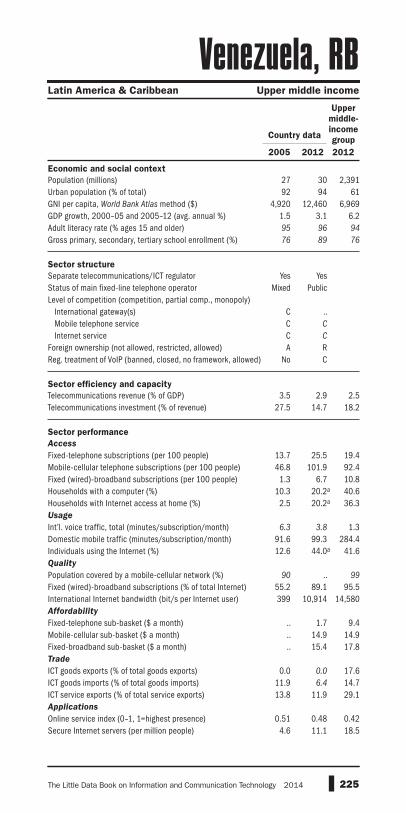
225The Little Data Book on Information and Communication Technology 2014
2005 2012 2012
Country data
Upper
middle-
income
group
Latin America & Caribbean Upper middle income
Venezuela, RB
Economic and social contextPopulation (millions) 27 30 2,391Urban population (% of total) 92 94 61GNI per capita, World Bank Atlas method ($) 4,920 12,460 6,969GDP growth, 2000–05 and 2005–12 (avg. annual %) 1.5 3.1 6.2Adult literacy rate (% ages 15 and older) 95 96 94
Gross primary, secondary, tertiary school enrollment (%) 76 89 76
Sector structureSeparate telecommunications/ICT regulator Yes YesStatus of main fixed-line telephone operator Mixed PublicLevel of competition (competition, partial comp., monopoly) International gateway(s) C .. Mobile telephone service C C
Internet service C C
Foreign ownership (not allowed, restricted, allowed) A RReg. treatment of VoIP (banned, closed, no framework, allowed) No C
Sector efficiency and capacityTelecommunications revenue (% of GDP) 3.5 2.9 2.5Telecommunications investment (% of revenue) 27.5 14.7 18.2
Sector performanceAccess
Fixed-telephone subscriptions (per 100 people) 13.7 25.5 19.4Mobile-cellular telephone subscriptions (per 100 people) 46.8 101.9 92.4Fixed (wired)-broadband subscriptions (per 100 people) 1.3 6.7 10.8Households with a computer (%) 10.3 20.2a 40.6Households with Internet access at home (%) 2.5 20.2a 36.3Usage
Int’l. voice traffic, total (minutes/subscription/month) 6.3 3.8 1.3Domestic mobile traffic (minutes/subscription/month) 91.6 99.3 284.4Individuals using the Internet (%) 12.6 44.0a 41.6Quality
Population covered by a mobile-cellular network (%) 90 .. 99
Fixed (wired)-broadband subscriptions (% of total Internet) 55.2 89.1 95.5International Internet bandwidth (bit/s per Internet user) 399 10,914 14,580Affordability
Fixed-telephone sub-basket ($ a month) .. 1.7 9.4Mobile-cellular sub-basket ($ a month) .. 14.9 14.9Fixed-broadband sub-basket ($ a month) .. 15.4 17.8Trade
ICT goods exports (% of total goods exports) 0.0 0.0 17.6ICT goods imports (% of total goods imports) 11.9 6.4 14.7ICT service exports (% of total service exports) 13.8 11.9 29.1Applications
Online service index (0–1, 1=highest presence) 0.51 0.48 0.42Secure Internet servers (per million people) 4.6 11.1 18.5

226 2014 The Little Data Book on Information and Communication Technology
2005 2012 2012
Country data
Lower
middle-
income
group
East Asia & Pacific Lower middle income
Vietnam
Economic and social contextPopulation (millions) 82 89 2,507Urban population (% of total) 27 32 39GNI per capita, World Bank Atlas method ($) 680 1,550 1,893GDP growth, 2000–05 and 2005–12 (avg. annual %) 6.9 6.1 6.0Adult literacy rate (% ages 15 and older) 90 93 71
Gross primary, secondary, tertiary school enrollment (%) .. .. 64
Sector structureSeparate telecommunications/ICT regulator No YesStatus of main fixed-line telephone operator Public PublicLevel of competition (competition, partial comp., monopoly) International gateway(s) C C
Mobile telephone service C C Internet service C CForeign ownership (not allowed, restricted, allowed) .. RReg. treatment of VoIP (banned, closed, no framework, allowed) C A
Sector efficiency and capacityTelecommunications revenue (% of GDP) 4.3 6.5 2.5
Telecommunications investment (% of revenue) .. .. 20.5
Sector performanceAccess
Fixed-telephone subscriptions (per 100 people) 10.0 11.2 5.4Mobile-cellular telephone subscriptions (per 100 people) 11.3 147.7 83.1Fixed (wired)-broadband subscriptions (per 100 people) 0.2 4.9 1.4Households with a computer (%) 6.3a 17.5a 15.0Households with Internet access at home (%) 1.5a 15.6a 12.4Usage
Int’l. voice traffic, total (minutes/subscription/month) .. .. 6.5
Domestic mobile traffic (minutes/subscription/month) .. .. ..Individuals using the Internet (%) 12.7 39.5a 18.7Quality
Population covered by a mobile-cellular network (%) 70 .. 86
Fixed (wired)-broadband subscriptions (% of total Internet) 7.2 30.6 58.2
International Internet bandwidth (bit/s per Internet user) 334 13,359 8,076Affordability
Fixed-telephone sub-basket ($ a month) .. 2.0 4.9Mobile-cellular sub-basket ($ a month) .. 4.1 10.5Fixed-broadband sub-basket ($ a month) .. 11.8 20.6Trade
ICT goods exports (% of total goods exports) 2.8 11.6 4.6ICT goods imports (% of total goods imports) 6.1 10.2 7.2ICT service exports (% of total service exports) .. .. 47.1Applications
Online service index (0–1, 1=highest presence) 0.46 0.42 0.32Secure Internet servers (per million people) 0.1 8.2 4.4

227The Little Data Book on Information and Communication Technology 2014
2005 2012 2012
Country data
High-
income
group
High income
Virgin Islands (U.S.)
Economic and social contextPopulation (millions) 0.11 0.11 1,300Urban population (% of total) 94 96 80GNI per capita, World Bank Atlas method ($) .. .. 38,412GDP growth, 2000–05 and 2005–12 (avg. annual %) .. .. 1.0Adult literacy rate (% ages 15 and older) .. .. ..Gross primary, secondary, tertiary school enrollment (%) .. .. 93
Sector structureSeparate telecommunications/ICT regulator .. ..Status of main fixed-line telephone operator .. ..Level of competition (competition, partial comp., monopoly) International gateway(s) .. .. Mobile telephone service .. .. Internet service .. ..Foreign ownership (not allowed, restricted, allowed) .. ..Reg. treatment of VoIP (banned, closed, no framework, allowed) .. ..
Sector efficiency and capacityTelecommunications revenue (% of GDP) .. .. 2.7Telecommunications investment (% of revenue) .. .. 17.6
Sector performanceAccess
Fixed-telephone subscriptions (per 100 people) 66.5 71.3 43.6Mobile-cellular telephone subscriptions (per 100 people) 74.5a .. 122.9Fixed (wired)-broadband subscriptions (per 100 people) 2.8a 8.6a 26.2Households with a computer (%) .. .. 77.7Households with Internet access at home (%) .. .. 75.5Usage
Int’l. voice traffic, total (minutes/subscription/month) .. .. ..Domestic mobile traffic (minutes/subscription/month) .. .. 113.6
Individuals using the Internet (%) 27.3a 40.5a 75.4Quality
Population covered by a mobile-cellular network (%) .. .. 100Fixed (wired)-broadband subscriptions (% of total Internet) .. .. 95.9
International Internet bandwidth (bit/s per Internet user) 1,527 .. 85,990Affordability
Fixed-telephone sub-basket ($ a month) .. .. 25.2Mobile-cellular sub-basket ($ a month) .. .. 20.6Fixed-broadband sub-basket ($ a month) .. .. 29.2Trade
ICT goods exports (% of total goods exports) .. .. 8.9ICT goods imports (% of total goods imports) .. .. 10.8ICT service exports (% of total service exports) .. .. 30.8Applications
Online service index (0–1, 1=highest presence) .. .. 0.67Secure Internet servers (per million people) 213.2 396.2 827.6

228 2014 The Little Data Book on Information and Communication Technology
2005 2012 2012
Country data
Lower
middle-
income
group
Middle East & North Africa Lower middle income
West Bank and Gaza
Economic and social contextPopulation (millions) 3 4 2,507Urban population (% of total) 73 75 39GNI per capita, World Bank Atlas method ($) 1,340 .. 1,893GDP growth, 2000–05 and 2005–12 (avg. annual %) -0.9 .. 6.0Adult literacy rate (% ages 15 and older) 93 95 71
Gross primary, secondary, tertiary school enrollment (%) 79 77 64
Sector structureSeparate telecommunications/ICT regulator .. ..Status of main fixed-line telephone operator .. ..Level of competition (competition, partial comp., monopoly) International gateway(s) .. .. Mobile telephone service .. .. Internet service .. ..Foreign ownership (not allowed, restricted, allowed) .. ..Reg. treatment of VoIP (banned, closed, no framework, allowed) No A
Sector efficiency and capacityTelecommunications revenue (% of GDP) 0.8 .. 2.5
Telecommunications investment (% of revenue) 5.1 .. 20.5
Sector performanceAccess
Fixed-telephone subscriptions (per 100 people) 9.5 9.3 5.4Mobile-cellular telephone subscriptions (per 100 people) 15.9 75.6 83.1Fixed (wired)-broadband subscriptions (per 100 people) 0.2 .. 1.4Households with a computer (%) 29.5a 53.9a 15.0Households with Internet access at home (%) 15.9 33.4a 12.4Usage
Int’l. voice traffic, total (minutes/subscription/month) .. .. 6.5
Domestic mobile traffic (minutes/subscription/month) .. .. ..Individuals using the Internet (%) 16.0a 41.1a 18.7Quality
Population covered by a mobile-cellular network (%) 95 .. 86
Fixed (wired)-broadband subscriptions (% of total Internet) 9.6 .. 58.2
International Internet bandwidth (bit/s per Internet user) 421 10,906 8,076Affordability
Fixed-telephone sub-basket ($ a month) .. .. 4.9Mobile-cellular sub-basket ($ a month) .. .. 10.5Fixed-broadband sub-basket ($ a month) .. .. 20.6Trade
ICT goods exports (% of total goods exports) 0.5 1.0 4.6ICT goods imports (% of total goods imports) 2.3 3.1 7.2ICT service exports (% of total service exports) 27.7 4.4 47.1Applications
Online service index (0–1, 1=highest presence) .. .. 0.32Secure Internet servers (per million people) 0.6 4.6 4.4

229The Little Data Book on Information and Communication Technology 2014
2005 2012 2012
Country data
Lower
middle-
income
group
Middle East & North Africa Lower middle income
Yemen, Rep.
Economic and social contextPopulation (millions) 20 24 2,507Urban population (% of total) 29 33 39GNI per capita, World Bank Atlas method ($) 700 1,270 1,893GDP growth, 2000–05 and 2005–12 (avg. annual %) 4.1 1.9 6.0Adult literacy rate (% ages 15 and older) 55 65 71
Gross primary, secondary, tertiary school enrollment (%) 56 56 64
Sector structureSeparate telecommunications/ICT regulator No NoStatus of main fixed-line telephone operator Public PublicLevel of competition (competition, partial comp., monopoly) International gateway(s) M M
Mobile telephone service C C
Internet service C C
Foreign ownership (not allowed, restricted, allowed) .. NoReg. treatment of VoIP (banned, closed, no framework, allowed) B B
Sector efficiency and capacityTelecommunications revenue (% of GDP) 1.2 3.4 2.5
Telecommunications investment (% of revenue) 25.2 29.4 20.5
Sector performanceAccess
Fixed-telephone subscriptions (per 100 people) 4.5a 4.6 5.4Mobile-cellular telephone subscriptions (per 100 people) 11.3 58.3 83.1Fixed (wired)-broadband subscriptions (per 100 people) 0.0 0.7 1.4Households with a computer (%) 1.9a 5.1a 15.0Households with Internet access at home (%) 1.4a 4.7a 12.4Usage
Int’l. voice traffic, total (minutes/subscription/month) 14.7 13.4 6.5
Domestic mobile traffic (minutes/subscription/month) .. .. ..Individuals using the Internet (%) 1.0a 17.4a 18.7Quality
Population covered by a mobile-cellular network (%) 68 84 86
Fixed (wired)-broadband subscriptions (% of total Internet) 1.4 14.4 58.2
International Internet bandwidth (bit/s per Internet user) 28 2,788 8,076Affordability
Fixed-telephone sub-basket ($ a month) .. 0.9 4.9Mobile-cellular sub-basket ($ a month) .. 11.1 10.5Fixed-broadband sub-basket ($ a month) .. 14.7 20.6Trade
ICT goods exports (% of total goods exports) 0.0 0.0 4.6ICT goods imports (% of total goods imports) 2.1 1.0 7.2ICT service exports (% of total service exports) 15.8 8.7 47.1Applications
Online service index (0–1, 1=highest presence) 0.21 0.18 0.32Secure Internet servers (per million people) 0.1 0.7 4.4

230 2014 The Little Data Book on Information and Communication Technology
2005 2012 2012
Country data
Lower
middle-
income
group
Sub-Saharan Africa Lower middle income
Zambia
Economic and social contextPopulation (millions) 11 14 2,507Urban population (% of total) 37 40 39GNI per capita, World Bank Atlas method ($) 490 1,350 1,893GDP growth, 2000–05 and 2005–12 (avg. annual %) 4.8 6.6 6.0Adult literacy rate (% ages 15 and older) 61 .. 71
Gross primary, secondary, tertiary school enrollment (%) .. 85 64
Sector structureSeparate telecommunications/ICT regulator Yes YesStatus of main fixed-line telephone operator Public MixedLevel of competition (competition, partial comp., monopoly) International gateway(s) C C
Mobile telephone service P C
Internet service P C
Foreign ownership (not allowed, restricted, allowed) R RReg. treatment of VoIP (banned, closed, no framework, allowed) B B
Sector efficiency and capacityTelecommunications revenue (% of GDP) 2.6 0.1 2.5
Telecommunications investment (% of revenue) 29.3 .. 20.5
Sector performanceAccess
Fixed-telephone subscriptions (per 100 people) 0.8 0.6 5.4Mobile-cellular telephone subscriptions (per 100 people) 8.3 74.8 83.1Fixed (wired)-broadband subscriptions (per 100 people) 0.0 0.1 1.4Households with a computer (%) 1.4a 3.1a 15.0Households with Internet access at home (%) 0.1a 2.8a 12.4Usage
Int’l. voice traffic, total (minutes/subscription/month) .. 1.8 6.5
Domestic mobile traffic (minutes/subscription/month) 28.2 57.8 ..Individuals using the Internet (%) 2.9a 13.5a 18.7Quality
Population covered by a mobile-cellular network (%) 65 78 86
Fixed (wired)-broadband subscriptions (% of total Internet) 31.8 93.9 58.2
International Internet bandwidth (bit/s per Internet user) 67 2,721 8,076Affordability
Fixed-telephone sub-basket ($ a month) .. 7.4 4.9Mobile-cellular sub-basket ($ a month) .. 16.5 10.5Fixed-broadband sub-basket ($ a month) .. 82.3 20.6Trade
ICT goods exports (% of total goods exports) 0.0 0.0 4.6ICT goods imports (% of total goods imports) 4.6 3.0 7.2ICT service exports (% of total service exports) 5.5 6.8 47.1Applications
Online service index (0–1, 1=highest presence) 0.23 0.31 0.32Secure Internet servers (per million people) 0.2 2.8 4.4

231The Little Data Book on Information and Communication Technology 2014
2005 2012 2012
Country data
Low-
income
group
Sub-Saharan Africa Low income
Zimbabwe
Economic and social contextPopulation (millions) 13 14 846Urban population (% of total) 36 39 28GNI per capita, World Bank Atlas method ($) 430 650 590GDP growth, 2000–05 and 2005–12 (avg. annual %) -8.5 0.2 5.9Adult literacy rate (% ages 15 and older) .. 84 61
Gross primary, secondary, tertiary school enrollment (%) 54 .. 60
Sector structureSeparate telecommunications/ICT regulator Yes YesStatus of main fixed-line telephone operator Public PublicLevel of competition (competition, partial comp., monopoly) International gateway(s) M P Mobile telephone service C P Internet service C CForeign ownership (not allowed, restricted, allowed) R RReg. treatment of VoIP (banned, closed, no framework, allowed) B A
Sector efficiency and capacityTelecommunications revenue (% of GDP) .. .. 5.0
Telecommunications investment (% of revenue) 4.1 .. ..
Sector performanceAccess
Fixed-telephone subscriptions (per 100 people) 2.6 2.2 1.0Mobile-cellular telephone subscriptions (per 100 people) 5.1 91.9 47.2Fixed (wired)-broadband subscriptions (per 100 people) 0.1 0.5 0.2Households with a computer (%) 2.0a 6.5a 4.2Households with Internet access at home (%) 0.9a 4.9a 3.4Usage
Int’l. voice traffic, total (minutes/subscription/month) .. 4.0 ..Domestic mobile traffic (minutes/subscription/month) 51.7 30.3 70.1Individuals using the Internet (%) 8.0a 17.1a 6.2Quality
Population covered by a mobile-cellular network (%) 70 81 ..Fixed (wired)-broadband subscriptions (% of total Internet) 10.6 99.3 30.9
International Internet bandwidth (bit/s per Internet user) 54 2,643 9,141Affordability
Fixed-telephone sub-basket ($ a month) .. 9.8 8.9Mobile-cellular sub-basket ($ a month) .. 20.6 11.9Fixed-broadband sub-basket ($ a month) .. 30.0 46.9Trade
ICT goods exports (% of total goods exports) 0.1 0.0 ..ICT goods imports (% of total goods imports) 2.5 3.4 ..ICT service exports (% of total service exports) .. .. ..Applications
Online service index (0–1, 1=highest presence) 0.30 0.30 0.20Secure Internet servers (per million people) 0.2 3.2 1.1

232 2014 The Little Data Book on Information and Communication Technology
a. ITU estimate.
b. Excludes South Sudan.
c. Excludes South Sudan after July 9, 2011.
Notes

233The Little Data Book on Information and Communication Technology 2014
Adult literacy rate is the percentage of people ages 15 and older who can, with understanding, read and write a short, simple statement about their everyday life. (United Nations Educational, Scientific, and Cultural Organization Institute for Statistics) (w)
Domestic mobile-telephone traffic refers to the total number of minutes of calls made by mobile subscribers within a country (including minutes to fixed-telephone and minutes to mobile-phone subscribers). (International Telecommunication Union) (w)
Fixed-broadband sub-basket refers to the price of the monthly subscription to an entry-level fixed broadband plan. For comparability reasons, the fixed broadband sub-basket is based on a monthly usage of (a minimum of) 1 gigabyte (GB). For plans that limit the monthly amount of data transferred by including caps below 1 gigabyte, the cost for additional bytes is added to the sub-basket. The minimum speed of a broadband connection is 256 kbit/s. (International Telecommunication Union) (m)
Fixed (wired)-broadband subscriptions refers to subscriptions to high-speed access to the public Internet (a TCP/IP connection), at downstream speeds equal to, or greater than, 256 kbit/s. This includes cable modem, DSL, fiber-to-the-home/building, and other fixed (wired)-broadband subscriptions. This total is measured irrespective of the method of payment. It excludes subscrip-tions that have access to data communications (including the Internet) via mobile-cellular networks. It excludes technologies listed under the wireless-broadband category. (International Telecommunication Union) (w)
Fixed-telephone sub-basket refers to the monthly price charged for subscribing to the Public Switched Telephone Network (PSTN), plus the cost of 30 local calls to the same (fixed) network (15 peak and 15 off-peak calls) of three minutes each. The service refers to the traditional fixed telephone line and does not refer to, for example, prices for managed VoIP. (International Telecommunication Union) (m)
Fixed-telephone subscriptions refers to the sum of active number of analog fixed-telephone lines, Voice over Internet Protocol (VoIP) subscriptions, fixed wireless local loop (WLL) subscriptions, ISDN voice-channel equivalents, and fixed public payphones. (International Telecommunication Union) (w)
Foreign ownership refers to the allowance of foreign participation or owner-ship in facility-based and spectrum-based operators as well as in Internet Service Providers (ISPs). (No = not allowed, R = allowed with restrictions, A = allowed without restrictions) (International Telecommunication Union)
GDP growth is the annual percentage growth rate of gross domestic product (GDP) at market prices based on constant local currency. Aggregates are based on constant 2005 U.S. dollars. GDP is the sum of gross value added by all resident producers in the economy plus any product taxes and minus any subsidies not included in the value of the products. It is calculated without
Glossary

234 2014 The Little Data Book on Information and Communication Technology
making deductions for depreciation of fabricated assets or for depletion and degradation of natural resources. (World Bank and Organisation for Economic Co-operation and Development) (w)
GNI per capita, World Bank Atlas method, is gross national income (GNI) converted to U.S. dollars using the World Bank Atlas method divided by the midyear population. GNI is the sum of value added by all resident produc-ers plus any product taxes (less subsidies) not included in the valuation of output plus net receipts of primary income (compensation of employees and property income) from abroad. GNI, calculated in national currency, is usually converted to U.S. dollars at official exchange rates for comparisons across economies. The World Bank Atlas method is used to smooth fluctuations in prices and exchange rates. It averages the exchange rate for a given year and the two preceding years, adjusted for differences in rates of inflation between the country and the Euro area, Japan, the United Kingdom, and the United States. (World Bank) (w)
Gross primary, secondary, and tertiary enrollment is the combined number of students enrolled in primary, secondary, and tertiary levels of education, regardless of age, as a percentage of the population of official school age for the three levels. (United Nations Educational, Scientific and Cultural Organization Institute for Statistics) (w)
Households with a computer refers to the percentage of households with a computer at home. A computer includes a desktop computer, a laptop (portable) computer, or a tablet (or similar handheld computer). It does not include equipment with some embedded computing abilities such as smart TV sets, and devices with telephony as their primary function, such as smartphones. (International Telecommunication Union) (w)
Households with Internet access at home refers to the percentage of house-holds with Internet access at home. Access is not assumed to be only via a computer—it may also be by mobile phone, tablet, PDA, games machine, digital TV, etc. (International Telecommunication Union) (w)
ICT goods exports and imports are goods that are intended to fulfill the function of information processing and communication by electronic means, including transmission and display, or that use electronic processing to detect, measure, or record physical phenomena or to control a physical process. They include telecommunications, audio and video, computer and related equipment; electronic components; and other information and com-munication technology goods. Software is excluded. Re-exports (exports of foreign goods in the same state as previously imported) are included. (United Nations Conference on Trade and Development) (w)
ICT service exports comprise communications services (telecommunica-tions, business network services, teleconferencing, support services, and postal services) and computer and information services (database, data processing, software design and development, maintenance and repair, and news-related service transactions). (International Monetary Fund) (w)
Glossary

235The Little Data Book on Information and Communication Technology 2014
Individuals using the Internet refers to the percentage of individuals who have used the Internet (from any location) in the last 12 months. Internet can be used via a computer, mobile phone, personal digital assistant, games machine, digital TV, etc. (International Telecommunication Union) (w)
International Internet bandwidth refers to the total used capacity of interna-tional Internet bandwidth, in bits per second per Internet user. It is measured as the sum of used capacity of all Internet exchanges (locations where Internet traffic is exchanged) offering international bandwidth. If capacity is asymmetric (i.e., more incoming [downlink] than outgoing [uplink] capacity), then the incoming (downlink) capacity should be provided. (International Telecommunication Union) (w)
International voice traffic, total is the sum of international incoming and out-going telephone fixed and mobile telephone traffic (in minutes). (International Telecommunication Union) (w)
Level of competition, international gateway, is the level of competition for international gateway(s). International gateway is any facility that provides an interface to send and receive electronic communications (i.e., voice, data and multimedia images/video) traffic between one country’s domestic network facilities and those in another country. (M = monopoly, P = partial competition, C = full competition). (International Telecommunication Union)
Level of competition, Internet service, is the level of competition for retail Internet access service. (M = monopoly, P = partial competition, C = full competition). (International Telecommunication Union)
Level of competition, mobile telephone service, is the level of competition for digital cellular mobile services. (M = monopoly, P = partial competition, C = full competition). (International Telecommunication Union)
Mobile-cellular sub-basket refers to the price of a standard basket of mobile monthly usage for 30 outgoing calls per month (on-net, off-net, to a fixed line, and for peak and off-peak times) in predetermined ratios, plus 100 SMS messages. The mobile-cellular sub-basket is based on prepaid tariffs although postpaid tariffs may be used for countries where prepaid subscriptions make up less than three percent of all mobile-cellular subscriptions. The mobile-cellular prepaid sub-basket is largely based, but does not entirely follow, the 2009 methodology of the OECD low-user basket. (International Telecommunication Union) (m)
Mobile-cellular telephone subscriptions refers to the number of subscrip-tions to a public mobile-telephone service that provide access to the PSTN (public switched telephone network) using cellular technology. The indicator includes (and is split into) the number of postpaid subscriptions, and the number of active prepaid accounts (i.e., that have been used during the last three months). The indicator applies to all mobile-cellular subscriptions that offer voice communications. It excludes subscriptions via data cards or
Glossary

236 2014 The Little Data Book on Information and Communication Technology
USB modems, subscriptions to public mobile data services, private trunked mobile radio, telepoint, radio paging, and telemetry services. (International Telecommunication Union) (w)
Online service index is one of the three component indicators for the United Nation’s e-Government Development Index (EGDI). Online service index measures the level of sophistication of a government’s online pres-ence based on four stages of e-government evolution: emerging presence, enhanced presence, transactional presence, and connected presence. A value of 0 indicates the lowest presence, a value of 1 the highest. (United Nations Department of Economic and Social Affairs and United Nations Public Administration Network) (m)
Population is based on the de facto definition of population, which counts all residents regardless of legal status or citizenship, except for refugees not permanently settled in the country of asylum, who are generally con-sidered part of the population of their country of origin. Data are midyear estimates. (World Bank) (s)
Population covered by a mobile-cellular network refers to the percentage of people within range of a mobile-cellular signal, irrespective of whether they are subscribers or users or not. This is calculated by dividing the number of people within range of a mobile-cellular signal by the total population and multiplying by 100. (International Telecommunication Union) (w)
Regulatory treatment of VoIP indicates whether the country has any regu-latory treatment on Voice over Internet Protocol (VoIP), a generic term to describe the techniques used to carry voice traffic over IP. The status are categorized as banned, closed, no framework, or allowed. “Closed” means that wholesale VoIP is permitted, but retail VoIP is banned, as well as cases where only the incumbent is licensed to provide VoIP. (B = banned, C = closed, No = no framework, A = allowed) (International Telecommunication Union)
Secure Internet servers are the number of servers using encryption tech-nology for Internet transactions. Data listed for 2012 are for December 2013. (Netcraft) (w)
Separate telecommunications/ICT regulator indicates whether the country has a separate telecommunications/ICT Regulatory Authority independent in terms of finance, structure, and decision making from the operators and the sector Ministry. (International Telecommunication Union)
Status of main fixed-line telephone operator indicates whether the incumbent fixed-line operator is a public or private entity. Public refers to a fully state-owned operator that has remained 100 percent government-owned since its creation or has been re/nationalized; private refers to a fully private operator that is 100 percent private, either as a result of a privatization or created as such; and mixed refers to a partially private operator that has a portion of its shares sold to either a private operator or to the public (e.g., through Initial
Glossary

237The Little Data Book on Information and Communication Technology 2014
Public Offerings or Employee Stock Ownership Plan), with the government remaining one of its shareholders. (International Telecommunication Union)
Telecommunications investment refers to the investment during the financial year in telecommunication services (including fixed, mobile, and Internet services) for acquiring or upgrading property and networks. Property includes tangible assets such as plant, intellectual and non-tangible assets such as computer software. The indicator is a measure of investment in tele-communication infrastructure in the country, and includes expenditure on initial installations and additions to existing installations where the usage is expected to be over an extended period of time. It excludes expenditure on research and development (R&D), annual fees for operating licenses and the use of radio spectrum. (International Telecommunication Union) (m)
Telecommunications revenue refers to revenue earned from retail fixed telephone, mobile-cellular, Internet, and data services offered by telecom-munication operators (both network and virtual) offering services within the country. Revenue (turnover) consists of retail telecommunication ser-vice earnings (therefore excluding revenue from wholesaling activities) dur-ing the financial year under review. It is calculated as percentage of GDP. (International Telecommunication Union) (w)
Urban population is the midyear population of areas defined as urban in each country and reported to the United Nations. (United Nations) (s)
VoIP is Voice over Internet Protocol, a generic term.
Glossary
