the local physical structure of amorphous hydrogenated boron carbide: insights from magic angle...
TRANSCRIPT

The local physical structure of amorphous hydrogenated boron carbide: insights from magic
angle spinning solid-state NMR spectroscopy
This article has been downloaded from IOPscience. Please scroll down to see the full text article.
2011 J. Phys.: Condens. Matter 23 435002
(http://iopscience.iop.org/0953-8984/23/43/435002)
Download details:
IP Address: 128.148.252.35
The article was downloaded on 29/04/2013 at 14:20
Please note that terms and conditions apply.
View the table of contents for this issue, or go to the journal homepage for more
Home Search Collections Journals About Contact us My IOPscience

IOP PUBLISHING JOURNAL OF PHYSICS: CONDENSED MATTER
J. Phys.: Condens. Matter 23 (2011) 435002 (12pp) doi:10.1088/0953-8984/23/43/435002
The local physical structure of amorphoushydrogenated boron carbide: insightsfrom magic angle spinning solid-stateNMR spectroscopy∗
Michelle M Paquette1, Wenjing Li2, M Sky Driver1, Sudarshan Karki1,A N Caruso1 and Nathan A Oyler2
1 Department of Physics, University of Missouri-Kansas City, Kansas City, MO 64110, USA2 Department of Chemistry, University of Missouri-Kansas City, Kansas City, MO 64110, USA
E-mail: [email protected]
Received 24 May 2011, in final form 20 July 2011Published 29 September 2011Online at stacks.iop.org/JPhysCM/23/435002
AbstractMagic angle spinning solid-state nuclear magnetic resonance spectroscopy techniques areapplied to the elucidation of the local physical structure of an intermediate product in theplasma-enhanced chemical vapour deposition of thin-film amorphous hydrogenated boroncarbide (BxC:Hy) from an orthocarborane precursor. Experimental chemical shifts arecompared with theoretical shift predictions from ab initio calculations of model molecularcompounds to assign atomic chemical environments, while Lee–Goldburg cross-polarizationand heteronuclear recoupling experiments are used to confirm atomic connectivities. A modelfor the BxC:Hy intermediate is proposed wherein the solid is dominated by predominantlyhydrogenated carborane icosahedra that are lightly cross-linked via nonhydrogenatedintraicosahedral B atoms, either directly through B–B bonds or through extraicosahedralhydrocarbon chains. While there is no clear evidence for extraicosahedral B aside from boronoxides, ∼40% of the C is found to exist as extraicosahedral hydrocarbon species that areintimately bound within the icosahedral network rather than in segregated phases.
S Online supplementary data available from stacks.iop.org/JPhysCM/23/435002/mmedia
(Some figures in this article are in colour only in the electronic version)
1. Introduction
Owing to their unique chemical, electrical, thermal, andmechanical properties, boron-rich carbide (BC) thin filmshave generated significant interest as heterostructure materialsin high-temperature thermoelectric energy converters [1–4],as low-k dielectric materials for ultra-large-scale integratedcircuits [5, 6] and as p-type semiconductors for direct-conversion solid-state neutron detectors [7]. Of the many
∗ This paper is dedicated to the memory of James M Phillips, Professor ofPhysics at the University of Missouri-Kansas City from 1965 to 2009 whoworked, in small part, on theoretical models of carborane adsorbates.
methods developed for the fabrication of BC films [8–14],the plasma-enhanced chemical vapour deposition (PECVD)of BC from the sublimed vapour of the single-source solidprecursor orthocarborane (1,2-C2B10H12, 1a) stands out as areliable route to high-resistivity (1010–1013 � cm) device-quality films [15–21]. This method produces hydrogenatedBxC:Hy films with a relatively narrow range of BxCstoichiometries (x ≈ 2–5) (compared to the wider rangepossible when using individual C- and B-containingprecursors) [11], which do not show evidence of segregatedcarbon phases known to reduce bulk electrical resistivity[22] as commonly observed in BC films prepared by other
10953-8984/11/435002+12$33.00 c© 2011 IOP Publishing Ltd Printed in the UK & the USA

J. Phys.: Condens. Matter 23 (2011) 435002 M M Paquette et al
methods [23–27]. This method, however, produces filmswith a range of mesostructures [8, 28–30] and variablehydrogen content [31, 32] as a function of growth conditionsand post-growth thermal treatment. Invariably, differencesin stoichiometry, short-range physical structure, as well asintermediate- and long-range physical order, lead to variationsin the mechanical, electronic structure, and electrical carriertransport properties of the films. To optimize these propertiesfor device integration, a deeper understanding of the plasmachemistry, film-growth mechanism(s), and resulting physicalstructure of the thin-film product as a function of growthconditions is desirable, but acquiring this knowledge hasremained a longstanding challenge.
In interpreting the physical structure of BxC:Hy solids,it is first instructive to consider the molecular structureof nonhydrogenated crystalline boron-rich carbides, BxC.Boron-rich solids are structurally unique owing to theirtendency to form deltahedra-based covalently bound extendedmolecular solids [33–35]. The crystal structure of BxC isbased on the α-rhombohedral boron lattice, with twelve-vertex icosahedra at the vertices of a rhombohedral unit cell,and a three-atom chain running along the crystallographic caxis (see figure 1). In each icosahedron, atoms at six ‘polar’sites are bound directly to neighbouring icosahedra, whileatoms at six ‘equatorial’ sites are bound to the three-atomchain. Crystalline BxC can accommodate stoichiometriesranging from B4.3C to B11.2C without undergoing a phasechange. It is generally agreed that at the carbon-rich limit(B4.3C), the dominant atomic distribution consists of B11Cicosahedra and C–B–C chains; as the relative boron contentincreases, carbon atoms are systematically displaced [36, 37].
In the PECVD growth of BxC:Hy films, the chemistrythat occurs when gaseous orthocarborane is introduced intothe reactive Ar+/e− plasma is not well understood. Possiblereactions include the removal of H atoms to form reactivecloso-icosahedral species, or the fragmentation of icosahedrainto reactive open-cage species (e.g., 11-vertex nido or10-vertex arachno boranes), smaller molecular fragments,and/or atomic constituents [30, 38–40]. The subsequentcondensation of icosahedra to each other directly througha single bond or through intericosahedral groups (e.g., thethree-atom chain in BxC), or the reassembly of atomsor fragments into icosahedra-based phases, other n-vertexcloso, nido, or arachno deltahedra-based phases, or otherlow-total-energy molecular networks (e.g., amorphous B orC) may then follow. Importantly, BxC:Hy films grown fromPECVD are expected to differ from bulk or thin-film BxCfor at least two reasons: (1) the precursor contains twointraicosahedral carbon atoms to begin with, whereas in BxCthe vast majority of icosahedra are expected to contain onlyone C atom or less; and (2) if hydrogen is incorporated, itmust fundamentally alter the molecular network through bondformation to C or B, barring the possibility of interstitialhydrogen (in BxC, all intraicosahedral C or B atoms are boundto either another icosahedron or the three-atom chain).
The traditional tools available for characterizing thephysical structure of BxC:Hy solids are limited. Diffractiontechniques (x-ray, neutron, electron) have provided minimal
Figure 1. Left: molecular structure of orthocarborane, 1a. Right:schematic of the BxC crystal structure.
information, particularly in the case of the amorphousfilms [41], but also in the case of more ordered filmswhich tend to exhibit a mixture of phases [28] andintrinsic disorder. Techniques such as x-ray photoemissionspectroscopy (XPS) [42], extended x-ray absorption finestructure (EXAFS) spectroscopy [23], electron energy lossnear-edge structure (ELNES) spectroscopy [43], inner-shellelectron energy loss spectroscopy (ISEELS) [44], and electronprobe microanalysis (EPMA) [45] have provided some insightinto local coordination environments, but their resolution,cross section, or reciprocal-to-real transform space is low,limiting the nearest-neighbour physical structure sensitivity.Fourier-transform infrared (FT-IR) spectroscopy has providedrelatively useful functional group information based on thepresence of local vibrational modes [32, 46–51]. Solid-statenuclear magnetic resonance (SSNMR) spectroscopy is aversatile technique for studying the short-range chemicaland physical structure as well as the intermediate-rangeconnectivity of solids [52]. This technique has been appliedfruitfully to the enduring challenge of discerning B/Csubstitutional disorder in crystalline BC [53–59]. Modernmagic angle spinning (MAS) SSNMR techniques are beingincreasingly applied to the study of amorphous materials,such as hydrogenated amorphous carbon (a-C:H) [60–63] andmesoporous boron carbon nitride (BCN) [64], but have so farnot been fully exploited [48, 61] in the characterization ofamorphous hydrogenated-boron-carbide-based solids.
Herein, we apply a variety of MAS-SSNMR techniquesto the analysis of an intermediate product formed duringthe PECVD growth of BxC:Hy films from orthocarborane.Knowledge of this intermediate product is important inultimately controlling the film growth: it provides a meansof furthering our understanding of the plasma reactionmechanism(s) by bridging the gap between what occursafter the sublimation of the initial stable orthocarboraneprecursor and before the formation of the final thin-filmproduct. The determination of 11B, 13C and 1H chemicalshifts (δ) from direct-excitation, cross-polarization (CP), and
2

J. Phys.: Condens. Matter 23 (2011) 435002 M M Paquette et al
2D SSNMR studies and their comparison with theoreticalchemical shifts of model chemical compounds calculatedusing density functional theory (DFT) gives informationabout the different types of atomic chemical environmentsin the solid. Additionally, Lee–Goldburg cross-polarization(LG-CP) and other heteronuclear recoupling MAS-SSNMRexperiments assist in the elucidation of B–H, C–H, and B–Cconnectivities. Taken together, the results provide importantand needed insight into the local chemical and physicalstructure of this intermediate BxC:Hy PECVD product and,by extension, the PECVD growth process.
2. Experimental methods
2.1. Material preparation and characterization
The BxC:Hy intermediate product was prepared by thereaction of orthocarborane vapour in a 200 mTorr argonbackground in our custom-built capacitively coupled PECVDreactor. The solid orthocarborane precursor was sublimedusing a custom solid-source bubbler held at 72 ± 2 ◦C,and an argon carrier gas, preheated to 90 ◦C, was passedthrough the bubbler at a flow rate of 10 sccm. The gaseousargon/carborane mixture was then delivered to the reactor viaa shower head, also forming the positive electrode (30 Wat 13.56 MHz) to the capacitively coupled PECVD system.In addition to the thin film that forms on the oppositegrounded and heated (350 ◦C) electrode, a homogeneousoff-white powder is formed just on the periphery of the mainplasma reaction and is what we have labelled the intermediateproduct, hereafter X.
Quantitative x-ray photoemission spectroscopy wasperformed on a powder sample of X on graphite tapeusing a Kratos Axis HS. The Kratos was operated inhybrid mode using 1487 eV photons produced from Al Kαemission, and the analyser pass energy was set to 80 eV.The concentration analysis was performed by integrating thecross-section-normalized Gaussian peaks of the relevant corelevels both manually and by CasaXPS, and the results werefound to be within a maximum of 2% of each other; theCasaXPS values are reported here. Elemental analysis of Xfor B, C, H, and N was performed by Columbia AnalyticalServices by combustion (C, H, N) and ICP (B) analysis.FT-IR spectra were acquired at room temperature with aThermo Scientific Nicolet is10 spectrometer using a SmartiTR attenuated total reflectance sampling accessory on whichthe solid powders were detected directly with automaticatmospheric suppression.
2.2. Computational methods
The geometries of the orthocarborane-based model com-pounds (see figure 3 below and table S1 in the supple-mentary data available at stacks.iop.org/JPhysCM/23/435002/mmedia) were optimized with density functional theory at theB3LYP/6-31G(d,p) level of theory using Gaussian 03 [65].Frequency calculations were performed on all compoundsto verify that these were minima on the potential energy
surface; no imaginary frequencies were observed, except inthe case of compounds 2a–e, which displayed one. Isotropicchemical shifts were calculated with the gauge-independentatomic orbital (GIAO) method at the same level of theorywith the SCF = tight full convergence specification. Electricfield gradient (EFG) parameters were also calculated, fromwhich were determined the quadrupole coupling constants(Qcc) and their associated asymmetry parameters (η). AllC nuclei were specified as 13C isotopes. The calculatedshifts for the model compounds were corrected for the shiftsof reference compounds, tetramethylsilane (TMS) for 1H(31.75 ppm) and 13C (191.82 ppm) nuclei, and BF3 · OEt2for 11B nuclei (108.42 ppm), calculated at the same levelof theory. The calculated 13C chemical shifts for ortho-,meta-, and paracarborane (1a–c) are all within 1 ppm ofthe experimental shifts [66], while the calculated 11B shiftsfor orthocarborane are only slightly upfield (2–4 ppm) fromthe experimental shifts. Similar differences are observedfor the experimentally known compounds 5b and 5c [67].The good correspondence between the experimental andcalculated shifts of these known model orthocarborane-basedcompounds suggests that the theoretical shifts calculatedfor the other model orthocarborane-based compounds maybe used with reasonable confidence to assign chemicalenvironments in the experimental SSNMR spectra.
2.3. SSNMR methods
All the SSNMR spectra were acquired on an 8.45 Tmagnet with a three-channel Tecmag [68] Apollo consoleand homebuilt double- and triple-resonance SSNMR probesfitted with a 3.2 or 4 mm MAS module from revolutionNMR [69]. 11B spectra were acquired on the 3.2 mm probewith MAS at 20 kHz to provide the best resolution possible,while the 13C spectra were acquired with the larger volume4 mm probe (spinning at 10 or 12 kHz) to maximize thesignal intensity (11B LG-CP spectra were also acquired onthe 4 mm probe for convenience). 11B experiments wereusually completed in a few hours or at most overnight in thecase of the 2D experiments, but because of the low naturalabundance of 13C (1.1%) and the T1 timescales involved,the 13C experiments required between one and five days ofacquisition time (e.g., the 13C T1 and REDOR (vide infra)curves each required five days of acquisition time). The 1H,11B, and 13C frequencies were 357.200 MHz, 114.602 MHz,and 89.821 MHz, respectively. All spectra were protondecoupled with >90 kHz continuous-wave (CW) decouplingunless otherwise noted in figure 2. The proton 90◦ pulses were4.75 µs prior to cross-polarization [70–72], the typical 13Cand 11B pulsed RF field strengths in triple-resonance modewere 44 and 33 kHz, respectively, and in double-resonancemode the 13C/11B RF field strength was 50 kHz or greater.
1H Lee–Goldburg (LG). References [73–75]. The 1HLG homonuclear decoupling condition (effective LG fieldof 53 820 Hz) was achieved by setting the proton frequencyoffset at 31 134 kHz and using a 43 900 Hz RF field. The13C and 11B LG-CP cross-polarization field amplitudes were
3

J. Phys.: Condens. Matter 23 (2011) 435002 M M Paquette et al
Figure 2. MAS-SSNMR experimental pulse sequences applied tocompound X. Solid rectangles represent 90◦ pulses, and openrectangles are 180◦ pulses. (a) 11B direct excitation withheteronuclear continuous-wave 1H decoupling. (b) 13C directexcitation with a rotor echo to minimize probe ringing interferenceduring acquisition. (c) 11B or 13C Lee–Goldburg cross-polarization.The LG-CP transfer time was incremented to observe the timedependence seen in figures 6(a)–(d). (d) 13C rampedcross-polarization with a rotor echo. (e) 11B saturation recovery. (f)13C T1 via cross-polarization from nearby hydrogen atoms. (g) 2D1H–11B CP. (h) Heteronuclear recoupling sequence REDOR. Thesequence on the 13C channel creates a chemical shift echo at thebeginning of the acquisition period which is interrupted by the11B–13C dipolar interaction (causing dephasing). The controlexperiment S0 is performed without the 11B pulse, and the dephasedexperiment S is performed with the 11B pulse. N is incremented toobserve the time dependence seen in figure 7.
experimentally optimized for maximum signal enhancement.The MAS frequency was 12 kHz.
2D 1H–11B CP. The 2D 1H–11B CP spectrum was obtainedwith 48 scans per t1 slice, 4 µs 11B dwell time, 20 µs 1Hdwell time, 128 phase sensitive t1 data points (64 Re and 64Im) achieved by alternating the 1H CP phase between x and ywith a constant t1 on successive slices [76], and a CP contacttime of 50 µs.
Boron saturation recovery. Pseudo-saturation of the centraltransition was achieved by applying 200 1.5 µs pulses prior tot1 (see figure 2(e)). The MAS frequency was 20 kHz.
13C T1. The carbon T1 was measured using the cross-polarization sequence found in figure 2(f) [77] with a 600 µsCP contact time, so only the T1 of 13C peaks that resultedfrom CP transfer were measured. Since the recycle time in CPexperiments is limited by the T1 of protons in the sample, thisallowed faster acquisition and higher signal/noise data thanthe corresponding direct-excitation experiment. This pulsesequence has the additional advantage that, because of thesubtraction of the −Iz spectrum (at the beginning of t1) fromthe +Iz spectrum that is achieved by the phase cycle, the datafitting is simplified because the long time behaviour of the
exponential T1 curve must approach zero (in practice, one lessfitting parameter is required).
REDOR. The heteronuclear recoupling sequence REDOR(rotational echo double resonance) [52, 78, 79] in figure 2(h)was applied at 10 kHz MAS with N = 1, 2, 4 and 8 rotorperiods of dephasing to probe for direct bonding between 13Cand 11B atoms. The 13C 180◦ pulses were 11.4 µs, and the11B pulse was 16 µs.
3. Results
3.1. Material characterization
Both x-ray photoemission spectroscopy and elemental analy-sis were performed to investigate the chemical compositionof X. XPS analysis of X indicates a molecular formulaof B2.7:C:N0.06:O0.5. However, XPS is not able to quantifyhydrogen, and it is possible that the C ratio was overestimateddue to adventitious surface carbon. Elemental analysis of Xindicates a molecular formula of B3.6:C:H6.0:N0.1:O1.8. Here,only B, C, H, and N percentages could be determined, andthe weight percentage of the sample that was unaccountedfor (33%) was attributed to O. However, since elementalanalysis is notoriously problematic for boron-rich solids dueto difficulties with combustion and/or digestion [35], it ispossible that the atomic percentage for O is overestimatedrelative to the atomic percentage for B, C, H, and N, or thatthere exist discrepancies in the relative B, C, H, and N atomicpercentages. Overall, the analyses suggest that the material isrelatively carbon rich with a BxC stoichiometry of x ≈ 2.7–3.6and that it contains a significant amount of both hydrogenand oxygen, the latter likely originating from the 100 ppbO2 and 200 ppb H2O contained in the Ar process gas, asthe base vacuum pressure in the PECVD chamber reaches4 × 10−8 Torr after bakeout. It is known that boron carbidereacts with O2 at high temperatures (i.e., above 450 ◦C) toform B2O3 and CO2, which can react subsequently with H2Oto form gaseous boric acids, HBO2 and H3BO3 [80]. Boroncarbide films grown by PECVD are known to react withoxygen to form boron oxides during film deposition, evenin the presence of very low quantities of oxygen and at lowtemperatures (i.e., room temperature to 150 ◦C), likely dueto the reactive ionic species (e.g., O+ [81]) present in theplasma [82, 83].
The FT-IR spectrum of X is distinctly different fromthose of orthocarborane [84] and decaborane [85, 86] (seefigure S1 in the supplementary data available at stacks.iop.org/JPhysCM/23/435002/mmedia) and shares some featuresobserved in previously reported amorphous hydrogenatedboron carbide thin films [32, 46–51]. Notably, peaks at3068 and 2578 cm−1 can be assigned to C–H and B–Hintraicosahedral stretching modes, which is consistent with asignificant amount of hydrogenated icosahedral species. Therich spectral features in the FT-IR spectrum below 1700 cm−1
have not previously been assigned unambiguously and willbe discussed in greater detail in a future publication. Asregards the presence of oxygen in X, a strong, broad peak
4

J. Phys.: Condens. Matter 23 (2011) 435002 M M Paquette et al
Figure 3. Optimized geometries of orthocarborane-based model compounds calculated using DFT at the B3LYP/6-31G(d,p) level of theory(B = pink, C = grey, H = white). Atom numbering schemes are also shown.
at ∼1460 cm−1 is diagnostic of the B–O stretching modein B2O3 and related compounds [87, 88], which may beobservable in the spectrum of X as a shoulder. Further,the broad peak observed in the 3100–3700 cm−1 range is
diagnostic of O–H stretching vibrations, which suggests thata significant amount of the oxygen (and correspondingly aportion of the hydrogen) in the sample exists in the formof water or hydroxy groups. Specifically, the presence of a
5

J. Phys.: Condens. Matter 23 (2011) 435002 M M Paquette et al
maximum at ∼3230 cm−1 supports the presence of a BOHfunctionality, found in boron oxides [87, 88].
3.2. Computational results
In order to tentatively assign the different B, C, andH chemical environments in X using our experimentalSSNMR results, the theoretical chemical shifts for a seriesof orthocarborane-based model compounds were calculatedusing DFT. Although far from exhaustive, this series ofmodel compounds represents a range of plausible localchemical/physical structure permutations which, throughcomparison with empirical SSNMR data, will allow usto narrow in on the true atomic structure of the BxC:Hyintermediate, X. The optimized geometries for the calculatedmolecules are shown in figure 3. The molecular modelsconsidered include ortho-, meta-, and paracarborane (1a–c),orthocarborane with a pendant CH3 group at each of the fivechemically distinct B or C vertices (2a–e), orthocarboranewith pendant terminal hydrocarbon (CnH2n+1, n = 2) orborane (BnHn+1, n = 2) groups (2f–i) at the C1 or B3positions, a selection of known, energetically stable [89,90] open-cage 11-vertex nido (3a–f) and 10-vertex arachno(4a–e) (car)borane fragments containing no, one, or two Catoms, C2B10H11 icosahedra bound to each other directlythrough B–B, C–C or C–B bonds (5a–c) at the C1 orB3 positions, and C2B10H11 icosahedra connected throughone- (6a–d, 7), two- (8a–d), or three-atom (9a) hydrocarbon(CnH2n) or borane (BnHn) chains at the C1 or B3 positions, ora three-atom CH2BHCH2 chain (9b) at the B9 position.
Representative chemical shifts and shift ranges forthe model compounds are tabulated in table S1 (seesupplementary data available at stacks.iop.org/JPhysCM/23/435002/mmedia). Since a large number of compoundswere modelled, only the salient trends are summarizedhere. The calculated 11B shifts for orthocarborane are−18.7,−16.8,−11.6, and −4.0 ppm for the four chemicallyinequivalent B environments, where the more upfield shiftsat −18.7 and −16.8 ppm correspond to B atoms bound tointraicosahedral C atoms. According to our calculations, thechemical shifts for intraicosahedral B are not significantlyperturbed when orthocarborane is functionalized. The largesteffects are predicted to occur for the B atoms that serveas functionalization sites. When an intraicosahedral B atomis bound directly to a neighbouring icosahedron rather thana proton, its predicted 11B shift moves slightly downfield(e.g., by 4 ppm in 5a and 7 ppm in 5c) relative to that inorthocarborane; if bound to an extraicosahedral hydrocarbonor borane group, it shifts downfield by ∼9 ppm (e.g., in2b–2f) or ∼6 ppm (e.g., in 2h and 6c), respectively. All ofthe calculated shifts for intraicosahedral B atoms therefore fallwithin a range of −20 to 5 ppm, which is narrow consideringthe linewidth of the 11B signal (vide infra). The range ofpredicted 11B shifts for the nido and arachno compoundsis somewhat wider, with the majority falling between −40and 0 ppm, and a few situated as upfield as −50 ppm oras downfield as 15 ppm. The 11B shifts for terminal andbridging BnHn+1/n groups are predicted far more downfield,
however, at∼70–110 ppm. The predicted 1H shifts for protonsbound to intraicosahedral B fall consistently between 1.9 and3.3 ppm. For nido and arachno compounds, the predictedshifts for the common µ-H bridging (B–H–B) protons (e.g.,in 3b, 3c, 3e, and 3f) are notably distinct, situated upfieldbetween −4.5 and −2.4 ppm. The predicted 1H shifts forterminal and bridging borane groups, on the other hand, falldownfield, between 6 and 11 ppm. The theoretical 13C shiftsfor intraicosahedral C atoms demonstrate greater sensitivityto orthocarborane functionalization. For intraicosahedral Catoms in functionalized orthocarborane not bound directly tofunctional groups, the calculated chemical shifts vary between47 and 60 ppm (compared to 54 ppm for orthocarborane).If an intraicosahedral C atom is bound directly toan adjacent icosahedron (e.g, 5b) or terminal/bridginghydrocarbon or borane groups (e.g., 6b, 6d) rather thana proton, its predicted chemical shift moves downfieldas far as 75 ppm. Interestingly, however, the chemicalshift for an intraicosahedral C atom in a hexacoordinateC–B4CH coordination environment (as in orthocarborane, 1a)is essentially the same as that for one in a hexacoordinateC–B5H coordination environment (as in metacarborane, 1b),which indicates that when it comes to the local chemicalenvironment within the icosahedra, proximity to C versus Bdoes not have a significant effect on the 13C chemical shift.The 13C shifts for C atoms in nido and arachno carboranes arestrongly dependent on the local environment; those calculatedfor the 3a–f and 4c–e models range from 16.9 to 132.7 ppm.Finally, terminal CH3 groups exhibit calculated 13C shiftsbetween 1 and 3 ppm when bound to intraicosahedral B (as in2b–2e) but a shift of 26.3 ppm when bound to intraicosahedralC (as in 2a). Terminal CH2CH3groups exhibit calculatedmethylene (CH2) and methyl (CH3) 13C shifts, respectively,at 9.3 and 13.3 ppm when bound to intraicosahedral B (as in2f) and 32.8 and 12.8 ppm when bound to intraicosahedralC (as in 2g). The predicted 13C shift for a bridging CH2group bound to two icosahedra via intraicosahedral B (as in6a) is 4.4 ppm, while that for a CH group connecting threeicosahedra via B (as in 7) is nearly equivalent at 3.6 ppm.The calculated 13C shift for a bridging CH2 group bound totwo icosahedra via intraicosahedral C (as in 6b), on the otherhand, is 46.4 ppm. For larger CnH2n bridging chains (e.g., 8a,8b, 9a), 13C shifts are predicted between 18 and 36 ppm.
The calculated 11B quadrupolar coupling constants (Qcc)for orthocarborane fall between 1.1 and 1.6 MHz (η =0.09–0.59) and exhibit minimal perturbation upon icosahedralfunctionalization (see table S2 in the supplementary dataavailable at stacks.iop.org/JPhysCM/23/435002/mmedia). Forexample, if an intraicosahedral B atom is bound to B orC rather than a terminal H atom, an increase of only0.1 MHz is observed in its predicted Qcc value. For theopen-cage nido and arachno fragments, the magnitudes ofthe calculated Qcc values decrease as a function of charge,where neutral compounds exhibit Qcc values comparableto those in orthocarborane, but charged compounds exhibitsmaller Qcc values (e.g., the Qcc values range from 0 to0.9 MHz for 7-CB10H3−
11 (3a) and from 0.6 to 1.2 MHzfor 7,8-C2B9H−12 (3e)). Extraicosahedral borane 11B nuclei
6

J. Phys.: Condens. Matter 23 (2011) 435002 M M Paquette et al
Figure 4. (a) 13C direct-excitation spectrum. (b) 1H–13Ccross-polarization spectrum. The peaks at ∼110 and 245 ppm in (a)are due to the 13C background in the rotor and stator materials.
Figure 5. Top: 11B direct-excitation spectrum (solid line) overlayedwith the1H–11B cross-polarization spectrum (dashed line). Bothspectra were normalized to maximum intensity. Bottom: thedifference between the two above spectra.
display significantly higher calculated Qcc values, whichrange from 4.5 to 5.0 MHz.
3.3. SSNMR results
The direct-excitation 13C SSNMR spectrum of intermediateX (figure 4(a)) displays peaks at 0, 12, and 57 ppm, with13C T1 relaxation times of 26 ± 7, 30 ± 7, and 29 ± 4 s,respectively, indicative of C atoms in at least three differentchemical environments. The relative peak area integrationsfor the peak at ∼55 ppm versus the combined peaks at∼5 ppm are 61 ± 8% and 39 ± 6% which, as determinedhere, are semiquantitative measures of the relative amountsof C atoms in the different chemical environments. The1H–13C cross-polarization spectrum for the same sample(figure 4(b)) displays intensity for each of the three signals,which indicates in all cases a nearby (≤3–4 A) hydrogen
atom (for comparison, an average C–H bond length is1.1 A [91]). The direct-excitation 11B SSNMR spectrum forX, shown in figure 5, exhibits a broad, featured isotropicpeak centred at −16 ppm with a full-width at half-maximum(FWHM) of ∼30 ppm and an 11B T1 relaxation timeof 370 ± 20 ms, determined by saturation recovery. Thecorresponding 1H–11B CP spectrum, displayed on top of thedirect-excitation spectrum in figure 5, exhibits a narrowerisotropic peak, also centred at −16 ppm, but with a FWHMof ∼20 ppm. The similarity between the direct-excitationand cross-polarization spectra suggests that a majority ofthe B in the sample is protonated. Although not strictlyaccurate because of the orientation dependence of the CPtransfer, the normalized CP spectrum was subtracted fromthe normalized direct-excitation spectrum to get an estimateof the relative contributions of protonated and nonprotonatedB; the difference is shown at the bottom of figure 5. It isevident that a small amount of spectral intensity remainsin the more upfield region, centred at ∼−25 ppm, and amore significant amount of spectral intensity remains in themore downfield region, centred at ∼5 ppm. This suggeststhat there is some contribution to the 11B SSNMR signalfrom nonprotonated B atoms with an average chemical shiftfurther downfield than that of the protonated B atoms. Inaddition, two sharper features at 2 and 14 ppm are evidentin the direct-excitation spectrum only, which may representthe ‘horns’ of a second-order quadrupolar lineshape belongingto a compound with a longer T2. Indeed, these featureslikely corroborate the presence of the B2O3 oxidation productin X, which has a Qcc value of ∼2.7 MHz and exhibitsa chemical shift and lineshape consistent with the featuresobserved in the direct-excitation 11B NMR spectrum ofX [92, 93], and possibly some contribution from H3BO3 [94].The subtraction above effectively assumes that all of thesignal intensity at −16 ppm is due to protonated B—a poor,but useful assumption because it allows for an estimationof an upper limit of three protonated B atoms for everynonprotonated B atom based on the integrated areas. Twofeatures of the 11B spectra are particularly noteworthy.(1) First, these spectra, for the most part, do not exhibit sharpspectral features—the peaks are significantly broadened.This broadness indicates that the lineshape is dominatedeither by a fast T2 mechanism or significant chemical shiftheterogeneity (indicating significant heterogeneity of B sitesin the sample), or possibly both. A fast T2 is consistent withthe presence of unpaired electron spin density, which givesrise to an observed EPR signal (data not shown; similareffects have been noted in BC [95] and C:H [63] thinfilms), as well as the probable cross-coupling between themultiple B–B dipolar couplings and quadrupolar couplingsfor intraicosahedral B [96, 97]. (2) Second, these spectra donot exhibit pronounced second-order quadrupole lineshapesexpected for a Qcc > 1 MHz (with the exception of thenonprotonated B residual which could be interpreted toinclude a second-order lineshape for a large Qcc). This islikely due to the aforementioned fast T2 mechanisms whichwill obscure the second-order effects for the 1.1–1.7 MHzQcc expected in intraicosahedral B (see figure S2 in the
7

J. Phys.: Condens. Matter 23 (2011) 435002 M M Paquette et al
Figure 6. (a)–(c) 1H–13C Lee–Goldburg cross-polarization (LG-CP) buildup curves for the 13C peaks at 57, 12, and 0 ppm, respectively,with noise-derived error bars. The curve in (a) is characteristic of one or more proton(s) directly bonded to 13C. (d) 1H–11B LG-CP buildupcurve for the 11B peak at −16 ppm. (e) 2D1H–11B CP spectrum.
supplementary data available at stacks.iop.org/JPhysCM/23/435002/mmedia).
1H–13C Lee–Goldburg cross-polarization (LG-CP)buildup curves are shown in figure 6 for the peaks at 57, 12,and 0 ppm (panels (a), (b), and (c), respectively). The presenceof a signal at early contact times indicates that, in all cases, theassociated C atom is directly bound to a proton. The curvefor the signal at 57 ppm (figure 6(a)) is characteristic of aCHn group [74]. The flattening of the curves in figures 6(b)and (c) may indicate the presence of C atoms with overlappingchemical shifts in different chemical environments (some ofwhich may not be directly protonated) for the peaks at 12and 0 ppm. Early signal intensity in the 1H–11B LG-CPcurve (figure 6(d)) also indicates an environment in whichB atoms are directly bound to protons. The 2D 1H–11Bplot in figure 6(e) confirms that only one dominant 1H–11Bcorrelation exists—between protons with a chemical shiftcentred at 2–3 ppm and boron atoms with chemical shifts inthe −15 to −20 ppm range.
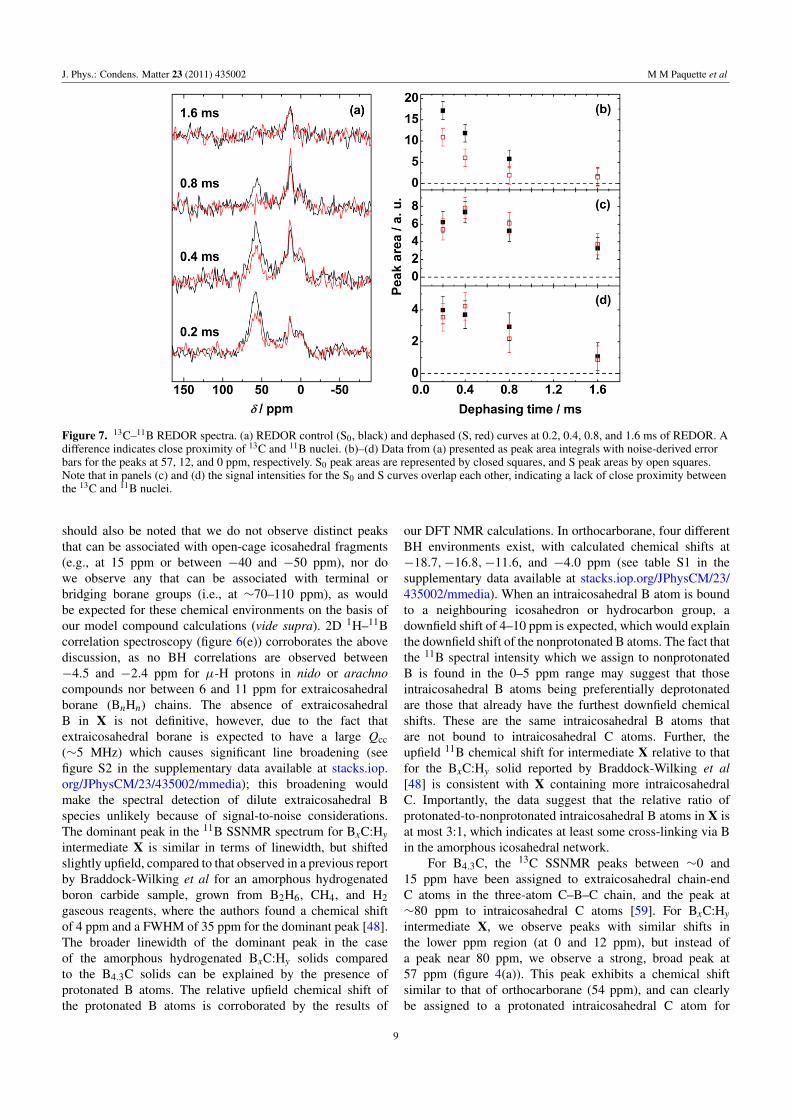
The REDOR spectra in figure 7(a) yield informationabout the proximity of the 13C and 11B nuclei. Thesignificant difference observed between the control (S0) andthe 11B-dephased (S) signal intensities for the peak at 57 ppmindicates that the associated C atom is definitely bound to oneor more B atoms. For the peaks at 0 and 12 ppm, the factthat no difference is observed between the S0 and S signalsindicates that the associated C atoms are not bound to B.For the peak at 0 ppm, however, the signal-to-noise ratio isparticularly low, so this conclusion is not definitive. Anothernoteworthy aspect of the plots in figures 7(b)–(d) is the relativetrends in signal decay. For the peak at 57 ppm (figure 7(b)), arelatively fast decay to zero intensity is indicative of a shorterT2 relaxation time, and likely proximity to a B atom—or,as expected for intraicosahedral C, up to five B atoms (vide
infra)—since the presence of a nearby quadrupole typicallyspeeds relaxation of 13C species. The lack of decay to zerointensity for the signal at 12 ppm (figure 7(c)), in contrast,may indicate a longer T2 relaxation time and corroborate theabsence of nearby B atoms for the associated C atom(s).Finally, the moderate decay of the signal at 0 ppm (figure 7(d))may be consistent with an intermediate T2 value and possiblythe proximity to only one or two B atoms. This interpretationwould be consistent with the small difference in S0 and Ssignals observed for this peak.
4. Discussion
From the combined SSNMR results, we can begin topiece together a picture of the local physical structure ofintermediate X. Although both fall within a similar spectralwindow and have a similar spectral shape (i.e., a prominentshoulder in the higher ppm region), the 11B MAS-SSNMRspectrum for the BxC:Hy intermediate, X, (figure 5) isdifferent from that of a typical B4.3C sample [56–58] intwo ways. First, the dominant peak in the spectrum ofX, attributed to intraicosahedral B, is shifted ∼10 ppmfurther upfield (at −16 ppm) than that in the spectrumof B4.3C (at −6 ppm [57]). Second, the linewidth of thepeak is greater in the case of the intermediate BxC:Hyproduct (FWHM of 30 ppm for X versus 10–15 ppmfor B4.3C [58]). Mauri et al [59] predict lower intensity(specifically, 1/11th intensity) peaks at 66–67 ppm for thecentral B atom in the extraicosahedral C–B–C chains ofB4.3C; however, experimental reports of additional 11B signalintensity are inconsistent and varied (e.g., Kirkpatrick et al[56] report weak peaks at 85 and 130 ppm, while Harazonoet al [57] report weak peaks at −60 and 37 ppm). We donot observe any signal above the noise in these regions. It
8
J. Phys.: Condens. Matter 23 (2011) 435002 M M Paquette et al
Figure 7. 13C–11B REDOR spectra. (a) REDOR control (S0, black) and dephased (S, red) curves at 0.2, 0.4, 0.8, and 1.6 ms of REDOR. Adifference indicates close proximity of 13C and 11B nuclei. (b)–(d) Data from (a) presented as peak area integrals with noise-derived errorbars for the peaks at 57, 12, and 0 ppm, respectively. S0 peak areas are represented by closed squares, and S peak areas by open squares.Note that in panels (c) and (d) the signal intensities for the S0 and S curves overlap each other, indicating a lack of close proximity betweenthe 13C and 11B nuclei.
should also be noted that we do not observe distinct peaksthat can be associated with open-cage icosahedral fragments(e.g., at 15 ppm or between −40 and −50 ppm), nor dowe observe any that can be associated with terminal orbridging borane groups (i.e., at ∼70–110 ppm), as wouldbe expected for these chemical environments on the basis ofour model compound calculations (vide supra). 2D 1H–11Bcorrelation spectroscopy (figure 6(e)) corroborates the abovediscussion, as no BH correlations are observed between−4.5 and −2.4 ppm for µ-H protons in nido or arachnocompounds nor between 6 and 11 ppm for extraicosahedralborane (BnHn) chains. The absence of extraicosahedralB in X is not definitive, however, due to the fact thatextraicosahedral borane is expected to have a large Qcc(∼5 MHz) which causes significant line broadening (seefigure S2 in the supplementary data available at stacks.iop.org/JPhysCM/23/435002/mmedia); this broadening wouldmake the spectral detection of dilute extraicosahedral Bspecies unlikely because of signal-to-noise considerations.The dominant peak in the 11B SSNMR spectrum for BxC:Hyintermediate X is similar in terms of linewidth, but shiftedslightly upfield, compared to that observed in a previous reportby Braddock-Wilking et al for an amorphous hydrogenatedboron carbide sample, grown from B2H6, CH4, and H2gaseous reagents, where the authors found a chemical shiftof 4 ppm and a FWHM of 35 ppm for the dominant peak [48].The broader linewidth of the dominant peak in the caseof the amorphous hydrogenated BxC:Hy solids comparedto the B4.3C solids can be explained by the presence ofprotonated B atoms. The relative upfield chemical shift ofthe protonated B atoms is corroborated by the results of
our DFT NMR calculations. In orthocarborane, four differentBH environments exist, with calculated chemical shifts at−18.7,−16.8,−11.6, and −4.0 ppm (see table S1 in thesupplementary data available at stacks.iop.org/JPhysCM/23/435002/mmedia). When an intraicosahedral B atom is boundto a neighbouring icosahedron or hydrocarbon group, adownfield shift of 4–10 ppm is expected, which would explainthe downfield shift of the nonprotonated B atoms. The fact thatthe 11B spectral intensity which we assign to nonprotonatedB is found in the 0–5 ppm range may suggest that thoseintraicosahedral B atoms being preferentially deprotonatedare those that already have the furthest downfield chemicalshifts. These are the same intraicosahedral B atoms thatare not bound to intraicosahedral C atoms. Further, theupfield 11B chemical shift for intermediate X relative to thatfor the BxC:Hy solid reported by Braddock-Wilking et al[48] is consistent with X containing more intraicosahedralC. Importantly, the data suggest that the relative ratio ofprotonated-to-nonprotonated intraicosahedral B atoms in X isat most 3:1, which indicates at least some cross-linking via Bin the amorphous icosahedral network.
For B4.3C, the 13C SSNMR peaks between ∼0 and15 ppm have been assigned to extraicosahedral chain-endC atoms in the three-atom C–B–C chain, and the peak at∼80 ppm to intraicosahedral C atoms [59]. For BxC:Hyintermediate X, we observe peaks with similar shifts inthe lower ppm region (at 0 and 12 ppm), but instead ofa peak near 80 ppm, we observe a strong, broad peak at57 ppm (figure 4(a)). This peak exhibits a chemical shiftsimilar to that of orthocarborane (54 ppm), and can clearlybe assigned to a protonated intraicosahedral C atom for
9

J. Phys.: Condens. Matter 23 (2011) 435002 M M Paquette et al
two reasons: (1) a chemical shift between ∼50–60 ppmis characteristic of a protonated intraicosahedral C atom,while a chemical shift of ∼60–80 is characteristic of anonprotonated one—as confirmed by both experimental andtheoretical results—and (2) cross-polarization experimentsprovide evidence that this peak is associated with a CHn group(see figures 4(b) and 6(a)). It should be noted that there isno indication of rapidly reorienting orthocarborane [98] inthe case of X, as seen in the MAS-SSNMR spectrum of thepure orthocarborane starting material as a very narrow peak at54 ppm. It should also be noted that the peak at 57 ppm cannotdefinitively be assigned to an orthocarborane-based speciesrather than, for example, a metacarborane- or B11C-basedspecies, as all of their 13C shifts are expected to fall within avery narrow range. The 13C SSNMR spectrum of the BxC:Hyintermediate product analysed here is also different from thatof the previously reported amorphous hydrogenated boroncarbide film grown from B2H6/CH4/H2 [61], which exhibits astrong peak at 15 ppm and a weak peak at 140 ppm—the latterbeing tentatively assigned to sp2 amorphous C. Evidently,the BxC:Hy intermediate product formed from orthocarboraneretains a large amount of intraicosahedral C, which doesnot occur in films fabricated from separate gaseous B- andC-containing precursors. Perhaps more interesting than theorigin of the 57 ppm peak in the 13C SSNMR spectrum ofX is the origin of the two more upfield peaks at 0 and 12 ppm.For these peaks, we definitively see evidence of protonation atthe associated C sites from CP experiments (see figures 4(b),6(b), and (c)), although it is possible that overlappingsignals are present here which might originate from multipleCHn or nonprotonated C chemical environments. From ourcalculations, the only molecular models with 13C shiftspredicted near 0 ppm are those which contain CHn groupsbound to two or more icosahedra via B atoms (e.g., 6aor 7) in which the 13C shift falls at ∼4 ppm, or terminalCH3 groups bound to intraicosahedral B (e.g., 2b–2e) inwhich the 13C shift falls between 1 and 3 ppm. We thereforepropose that these are good molecular models for the localchemical environment of extraicosahedral C in the BxC:Hyintermediate product X. 13C shifts for extraicosahedralhydrocarbon groups bound to intraicosahedral C atoms (e.g.,2a or 6b), or CnH2n bridging groups with n > 1 (e.g.,8a, 8b, 9a), are predicted further downfield; these types ofhydrocarbon groups are therefore not expected in X onthe basis of the 13C SSNMR results. The peak at 12 ppmappears to also belong to a CHn group according to CPexperiments (figure 6(b)), but unlike the peak at 0 ppm isclearly not attached directly to any B atoms according toREDOR experiments (figures 7(a) and (c)). From our DFTcalculations, we found that the methyl (CH3)
13C shift fora terminal CH2CH3 group bound to a B10C2 icosahedronis predicted at 13 ppm, regardless of whether the CH2CH3group is bound to intraicosahedral B (2f) or C (2g). (Thecalculated methylene (CH2) shift, on the other hand, movesfrom 9.3 ppm for 2f to 32.8 ppm for 2g.) In fact, a chemicalshift of 10–15 ppm is diagnostic of a CH3 group bound to ahydrocarbon group in general [99]. The peak at 12 ppm couldtherefore originate from, among other possibilities, the CH3
Figure 8. Proposed physical structure model of the intermediateBxC:Hy product X.
groups in a segregated hydrocarbon phase like hydrogenatedamorphous carbon [63]; however, we believe the presenceof a-C:H is unlikely because we do not see evidence ofany corresponding sp3 CH2 chemical shifts, expected at∼30–40 ppm, nor do we see evidence of sp2 C peaks, expectedat ∼130–140 ppm [63]. We therefore propose that it is morelikely that the hydrocarbon signal observed at 12 ppm belongsto a C species integrated intimately within the icosahedralnetwork, with fitting molecular models being the terminalCH2CH3 group in 2f or a bridging B–C(CH3)–B groupconnecting two icosahedra via B. Additional evidence for theassignment of the peak at 12 ppm to a terminal methyl groupis the relative narrowness of the peak, which is consistentwith a freely rotating sp3 CnH2n+1 chain; in contrast, Catoms in cross-linked icosahedra or bridging hydrocarbonchains would be expected to exhibit broader MAS-SSNMRpeaks, as observed for the peaks at 57 and 0 ppm. Wefurther note that no signals for oxygen-bound carbon canbe specifically identified (i.e., at 185–220 ppm for C=Oand 40–80 ppm for C–O [99]), consistent with the expectedformation and evolution of gaseous CO2 upon oxidationduring the growth of X. Finally, from peak integration data forthe direct-excitation 13C SSNMR spectrum, we can concludethat the ratio of intra- to extraicosahedral C is roughly 3:2.In other words, for every three B10C2 icosahedra, we expectfour extraicosahedral C atoms. On the basis of the abovediscussion, we tentatively propose a physical structure modelfor the BxC:Hy intermediate product, X, in figure 8.
5. Summary and future work
In summary, we have constructed a tentative model for thephysical structure of the BxC:Hy intermediate product, X,grown by PECVD from orthocarborane, from the results of11B and 13C MAS-SSNMR studies. The proposed model,illustrated in figure 8, is in line with the following:
• a B:C ratio of ∼3:1;• an intra- to extraicosahedral C ratio of ∼3:2;• a protonated-to-nonprotonated B ratio of ≤3:1, which
indicates at least some cross-linking via intraicosahedral B(this may be more likely via intraicosahedral B that is notdirectly bound to intraicosahedral C);
10

J. Phys.: Condens. Matter 23 (2011) 435002 M M Paquette et al
• no strong evidence for extraicosahedral or open-cageborane species aside from boron oxides (although these arestill possible as minor species);• no evidence for significant amounts of deprotonated
intraicosahedral C (and therefore no evidence forcross-linking via intraicosahedral C) nor for segregatedamorphous C;• good evidence for extraicosahedral hydrocarbon species,
in particular bridging B–CH2–B and B–C(CH3)–B groups,or terminal B–CH3 and B–CH2CH3 groups, all bound tointraicosahedral B.
Future work will compare the local physical structure—inferred from MAS-SSNMR studies—of the BxC:Hy inter-mediate, X, with those of BxC:Hy films fabricated usingdifferent PECVD conditions. We anticipate that these studieswill provide important insights into the orthocarborane plasmachemistry, film-growth mechanism(s), and post-growth ther-mal treatment effects as they relate to the mechanical,electronic structure, and electrical carrier transport propertiesof thin-film BxC:Hy. Further, the proposed physical structureprovides an important model long-desired by computationalgroups. From the above study, it is clear that MAS-SSNMRspectroscopy is poised to become a critical tool in thecharacterization of amorphous-boron-rich solids and similarlycomplicated materials.
Acknowledgments
ANC acknowledges funding through the Defense ThreatReduction Agency (HDTRA1-10-1-0092), the donors of theAmerican Chemical Society Petroleum Research Fund (PRF-50444-DNI10), the Office of Naval Research (N00014-1-11-0157), and the Army Research Office (W911NF-10-1-0476).The authors thank Todor Gounev for generous assistance withthe FT-IR spectroscopy and Tom Sandreczki for taking a breakfrom the Dean’s office to acquire an EPR spectrum for us.ANC owes an additional thank you to Neil Boag for originallyrecommending these NMR studies, and NAO thanks TatyanaPolenova for a discussion regarding simulating quadrupolarparameters.
References
[1] Bouchacourt M and Thevenot F 1985 J. Mater. Sci.20 1237–47
[2] Werheit H 1995 Mater. Sci. Eng. B 29 228–32[3] Sasaki S, Takeda M, Yokoyama K, Miura T, Suzuki T,
Suematsu H, Jiang W H and Yatsui K 2005 Sci. Technol.Adv. Mater. 6 181–4
[4] Ghamaty S, Elsner N B and Bass J C 2008 USPTO 7,342,170[5] Han L M, Yi X, Xie J Z, Zhou M S and Chooi S 2002 USPTO
6,424,044[6] Umeda S, Yuki T, Sugiyama T and Sugino T 2004 Diamond
Relat. Mater. 13 1135–8[7] Caruso A N 2010 J. Phys.: Condens. Matter 22 443201[8] Byun D, Spady B R, Ianno N J and Dowben P A 1995
Nanostruct. Mater. 5 465–71[9] Hu T et al 1998 Thin Solid Films 332 80–6
[10] Chen H Y, Wang J, Yang H, Li W Z and Li H D 2000 Surf.Coat. Technol. 128–129 329–33
[11] Sezer A O and Brand J I 2001 Mater. Sci. Eng. B 79 191–202[12] Klepper C C, Niemel J, Hazelton R C, Yadlowsky E J and
Monteiro O R 2001 Fusion Technol. 39 910–5[13] Suematsu H, Kitajima K, Suzuki T, Jiang W, Yatsui K,
Kurashima K and Bando Y 2002 Appl. Phys. Lett.80 1153–5
[14] Kitamura J, Usuba S, Kakudate Y, Yokoi H, Yamamoto K,Tanaka A and Fujiwara S 2003 Diamond Relat. Mater.12 1891–6
[15] Alimov V K et al 1992 J. Nucl. Mater. 196–198 670–5[16] Dowben P A 1995 USPTO 5,468, 978[17] Hwang S-D, Yang K, Dowben P A, Ahmad A A, Ianno N J,
Li J Z, Lin J Y, Jiang H X and McIlroy D N 1997 Appl.Phys. Lett. 70 1028–30
[18] Robertson B W, Adenwalla S, Harken A, Welsch P, Brand J I,Dowben P A and Claassen J P 2002 Appl. Phys. Lett.80 3644–6
[19] Bernard L et al 2003 Appl. Phys. Lett. 83 3743–5[20] Caruso A N, Billa R B, Balaz S, Brand J I and
Dowben P A 2004 J. Phys.: Condens. Matter 16 L139–46[21] Osberg K, Schemm N, Balkir S, Brand J O, Hallbeck M S,
Dowben P A and Hoffman M W 2006 IEEE Sensors J.6 1531–8
[22] Bandyopadhyay A K, Beuneu F, Zuppiroli L andBeauvy M 1984 J. Phys. Chem. Solids 45 207–14
[23] Zhang D, McIlroy D N, O’Brien W L and de Stasio G 1998J. Mater. Sci. 33 4911–85
[24] Oliveira J C, Paiva P, Oliveira M N and Conde O 1999 Appl.Surf. Sci. 138 159–64
[25] Ahn H S, Cuong P D, Shin K-H and Lee K-S 2005 Wear259 807–13
[26] Kulikovsky V, Vorlicek V, Bohac R, Ctvrtlik R,Stranyanek M, Dejneka A and Jastrabik L 2009 DiamondRelat. Mater. 18 27–33
[27] Bao R Q and Chrisey D B 2010 Thin Solid Films 519 164–8[28] Adenwalla S, Welsch P, Harken A, Brand J I, Sezer A and
Robertson B W 2001 Appl. Phys. Lett. 79 4357–9[29] Lunca-Popa P, Brand J I, Balaz S, Rosa L G, Boag N M,
Bai M, Robertson B W and Dowben P A 2005 J. Phys. D:Appl. Phys. 38 1248–52
[30] Park K et al 2006 Phys. Rev. B 73 035109[31] Schulz D L, Lutfurakhmanov A, Maya B, Sandstrom J,
Bunzow D, Qadri S B, Bao R Q, Chrisey D B andCaruso A N 2008 J. Non-Cryst. Solids 354 2369–71
[32] Billa R B, Hofmann T, Schubert M and Robertson B W 2009J. Appl. Phys. 106 033515
[33] Emin D 1987 Phys. Today 40 55–62[34] Balakrishnarajan M M, Pancharatna P D and
Hoffmann R 2007 New J. Chem. 31 473–85[35] Albert B and Hillebrecht H 2009 Angew. Chem. Int. Edn
48 8640–68[36] Werheit H, Au T, Schmechel R, Shalamberidze S O,
Kalandadze G I and Eristavi A M 2000 J. Solid State Chem.154 79–86
[37] Werheit H 2007 J. Phys.: Condens. Matter 19 186207[38] Buzhinskij O I et al 2003 J. Nucl. Mater. 313–316 214–8[39] Feng D et al 2008 J. Phys. Chem. A 112 3311–8[40] Ruhl E et al 2010 J. Phys. Chem. A 114 7284–91[41] Bao R Q and Chrisey D B 2011 J. Mater. Sci. 46 3952–9[42] Jacobsohn L G, Schulze R K, Maia da Costa M E H and
Nastasi M 2004 Surf. Sci. 572 418–24[43] Garvie L A J, Hubert H, Petuskey W T, McMillan P F and
Buseck P R 1997 J. Solid State Chem. 133 365–71[44] Hitchcock A P et al 1997 J. Phys. Chem. B 101 3483–93[45] Zalavutdinov R K, Gorodetsky A E and Zakharov A P 1995
Diamond Relat. Mater. 4 1383–5[46] Shirai K, Emura S, Gonda S I and Kumashiro Y 1995 J. Appl.
Phys. 78 3392–400
11

J. Phys.: Condens. Matter 23 (2011) 435002 M M Paquette et al
[47] Lin S-H, Feldman B J and Li D 1996 Appl. Phys. Lett.69 2373–5
[48] Braddock-Wilking J, Lin S-H and Feldman B J 1998 Tribol.Lett. 5 145–8
[49] Annen A, Sass M, Beckmann R, von Keudell A andJacob W 1998 Thin Solid Films 312 147–55
[50] Anan’ev A S, Kon’kov O I, Lebedev V M, Novokhatski A N,Terukov E I and Trapeznikova I N 2002 Semiconductors36 941–3
[51] Chaudhari P, Meshram N, Singh A, Topkar A andDusane R 2011 Thin Solid Films 519 4561–4
[52] van Wullen L, Muller U and Jansen M 2000 Chem. Mater.12 2347–52
[53] Silver A H and Bray P J 1959 J. Chem. Phys. 31 247–53[54] Hynes T V and Alexander M N 1971 J. Chem. Phys.
54 5296–310[55] Duncan T M 1984 J. Am. Chem. Soc. 106 2270–5[56] Kirkpatrick R J, Aselage T, Phillips B L and Year M B 1990
11B and 13C NMR spectroscopy of boron carbides AIPConf. Proc.—Boron-Rich Solids vol 231 (Albuquerque, NM)ed D Emin et al (New York: AIP) pp 261–70
[57] Harazono T, Hiroyama Y and Watanabe T 1996 Bull. Chem.Soc. Japan 69 2419–23
[58] Simeone D, Mallet C, Dubuisson P, Baldinozzi G,Gervais C and Maquet J 2000 J. Nucl. Mater. 277 1–10
[59] Mauri F, Vast N and Pickard C J 2001 Phys. Rev. Lett.87 085506
[60] Kaplan S, Jansen F and Machonkin M 1985 Appl. Phys. Lett.47 750–3
[61] Braddock-Wilking J, Lin S H and Feldman B J 1999 Phys.Rev. B 59 9745–7
[62] Donnet C, Fontaine J, Lefebvre F, Grill A, Patel V andJahnes C 1999 J. Appl. Phys. 85 3264–70
[63] Cho G, Yen B K and Klug C A 2008 J. Appl. Phys.104 013531
[64] Murakami M, Shimizu T, Tansho M, Vinu A, Ariga K,Mori T and Takegoshi K 2007 Solid State Nucl. Magn.Reson. 31 193–6
[65] Frisch M J et al 2003 Gaussian 03, Revision B.04 (Pittsburgh,PA: Gaussian)
[66] Harris R K, Bowles J, Stephenson I R and Wong E H 1988Spectrochim. Acta A 44 273–6
[67] Yang X G, Jiang W, Knobler C B, Mortimer M D andHawthorne M F 1995 Inorg. Chim. Acta 240 371–8
[68] Tecmag, Houston, TX, www.tecmag.com.[69] Revolution NMR, Fort Collins, CO, www.revolutionnmr.com.[70] Hartmann S R and Hahn E L 1962 Phys. Rev. 128 2042–53[71] Schaefer J and Stejskal E O 1976 J. Am. Chem. Soc.
98 1031–2
[72] Metz G, Wu X L and Smith S O 1994 J. Magn. Reson. A110 219–27
[73] Lee M and Goldburg W I 1965 Phys. Rev. 140 1261–71[74] van Rossum B J, de Groot C P, Ladizhansky V, Vega S and
de Groot H J M 2000 J. Am. Chem. Soc. 122 3465–72[75] Hong M, Yao X L, Jakes K and Huster D 2002 J. Phys. Chem.
B 106 7355–64[76] States D J, Haberkorn R A and Ruben D J 1982 J. Magn.
Reson. 48 286–92[77] Torchia D A 1978 J. Magn. Reson. 30 613–6[78] Gullion T and Vega A J 2005 Prog. Nucl. Magn. Reson.
Spectrosc. 47 123–36[79] Gan Z H 2007 J. Magn. Reson. 184 39–43[80] Litz L M and Mercuri R A 1963 J. Electrochem. Soc.
110 921–5[81] Zehringer R, Kunzli H, Oelhafen P and Hollenstein C 1990
J. Nucl. Mater. 176 370–4[82] Rybakov S Y, Sharapov V M and Gavrilov L E 1995
J. Physique IV 5 C5-921–926[83] Ennaceur M M and Terreault B 2000 J. Nucl. Mater. 280 33–8[84] Leites L A 1992 Chem. Rev. 92 279–323[85] Keller W E and Johnston H L 1952 J. Chem. Phys. 20 1749–51[86] Tillekaratne A and Trenary M 2009 J. Phys. Chem. C
113 13847–54[87] Moon O M, Kang B-C, Lee S-B and Boo J-H 2004 Thin Solid
Films 464/465 164–9[88] Buc D, Bello I, Caplovicova M A, Mikula M, Kovac J,
Hotovy I, Chong Y M and Siu G G 2007 Thin Solid Films515 8723–7
[89] Kiani F A and Hofmann M 2004 Inorg. Chem. 43 8561–71[90] Kiani F A and Hofmann M 2005 Eur. J. Inorg. Chem. 2545–53[91] Allen F H, Kennard O, Watson D G, Brammer L,
Orpen A G and Taylor R 1987 J. Chem. Soc., Perkin Trans.2 S1–S19
[92] Joo C, Werner-Zwanziger U and Zwanziger J W 2000 SolidState Nucl. Magn. Reson. 16 77–83
[93] Kroeker S and Stebbins J F 2001 Inorg. Chem. 40 6239–46[94] Klochko K, Cody G D, Tossell J A, Dera P and
Kaufman A J 2009 Geochim. Cosmochim. Acta73 1890–900
[95] Chauvet O, Emin D, Forro L, Aselage T L andZuppiroli L 1996 Phys. Rev. B 53 14450–7
[96] Eden M and Frydman L 2003 J. Phys. Chem. B107 14598–611
[97] Ashbrook S E, McManus J, Thrippleton M J andWimperis S 2009 Prog. Nucl. Magn. Reson. Spectrosc.55 160–81
[98] Leffler A J, Alexander M N, Sagalyn P L and Walker N 1975J. Chem. Phys. 63 3971–86
[99] Pavia D L, Lampman G M and Kriz G S 2001 Introduction toSpectroscopy (Toronto: Thomson Learning)
12