the long-run impact of traumatic experience on risk aversion
TRANSCRIPT

The Long-Run Impact of Traumatic Experience on Risk
Aversion
Young-Il Kim
Sogang University, South Korea
Email: [email protected]
Jungmin Lee
Sogang University, South Korea & IZA
Email: [email protected]
July 2013
Abstract
We examine the long-run impact of an early childhood exposure to a traumatic event
on risk attitudes by studying the Korean War. We find that those who spent their
early childhood during the peak of the war remain more risk averse five decades later,
even after controlling for age. Furthermore, within the cohorts, those who resided in
more severely affected provinces are more risk averse. Also by using data from the
World Values Survey and Armed Conflict Dataset that spans 51 countries, we confirm
that an early childhood exposure to a major civil war is associated with stronger risk
aversion.
Keywords: Risk aversion, Civil war, Early experience, Traumatic event.
JEL codes: D74, D81.
1

1 Introduction
Psychologists and sociologists have long studied why personality, attitudes, and beliefs vary
across individuals and how they are shaped in the first place (Hoffman 1977; Parke and
Asher 1983). Traditionally, the focus of economists has been behavioral outcomes rather
than preferences that determine the outcomes. Not until recently, economists have examined
preference heterogeneity and the origin of such heterogeneity.1
There is abundant evidence to indicate that risk preferences differ significantly across
individuals. Risk aversion differs by demographic characteristics such as gender, age, edu-
cation, income, and parental background (Hryshko et al., 2011; Dohmen et al., 2005; Eckel,
2002). Such differences may be biological or environmentally driven. For example, Galvan
et al. (2006) found that adolescents’ risk-seeking behavior is correlated with exaggerated
accumbens activity relative to prefrontal activity. On the other hand, Booth and Nolen
(2012) found that girls randomly assigned to single-sex environments are more risk-seeking
than their coed counterparts, thereby suggesting that risk preferences are affected during
childhood when the personality is developed and the child learns to embody social norms
and establishes a lifestyle.
There is a growing body of literature that shows that early childhood conditions are
significant for subsequent life outcomes (Heckman et al., 2012; Black et al., 2007; Alderman
et al., 2006; and Almond et al., 2005). A number of studies that focus on the impact
of early childhood exposure to major civil war also show that the exposure has lasting
impacts on socioeconomic outcomes such as health and education (Kesternich et al., 2012;
Akbulut-Yuksel, 2009; Parlow, 2012; and Akresh et al., 2011). One possible explanation for
such long-run impacts is that early life conditions play significant roles in the formation of
preferences. A number of recent studies found that risk preferences of adults are altered
after traumatic experiences such as natural disasters (Cassar et al., 2011b; Eckel et al., 2009;
Li et al., 2011; and Sacco et al., 2003). However, to the best of our knowledge, no study
thus far has examined whether early childhood experiences change preferences in the long
1For example, economists have become interested in gender differences in preferences, joining late the so-called “nature versus nurture” debate. Refer to Croson and Gneezy (2009) for a survey. Another branch ofthe literature concerns heterogeneity in social preferences, like trust among others, across different countries.To name a few, refer to Tabellini (2010) and Algan and Cahuc (2010).
2
run and therefore affect economic outcomes in adulthood.
In this study, we examine whether an early childhood exposure to civil war changes
risk preferences. Our empirical analysis consists of two parts. First, we examine if an
early childhood exposure to the Korean War2 has changed the risk preferences of the adult
South Korean population by using hypothetical lottery questions from a national survey
of approximately 8,000 individuals. The Korean War provides a unique opportunity for us
to study our question in terms of the following aspects. The war occurred between 1950
and 1953, while the survey was conducted in 2007. The timing of the war and that of the
survey enable us to estimate the long-run impacts for a wide range of birth cohorts. In other
words, different birth cohorts experienced (or did not experience) the war at different ages
with varying intensity. Further, there were very few war refugees to foreign countries as the
breakout of the Korean War was unanticipated, the war proceeded at a rather rapid pace,
and South Korea is a peninsula that only shares its border with North Korea. Lastly, the
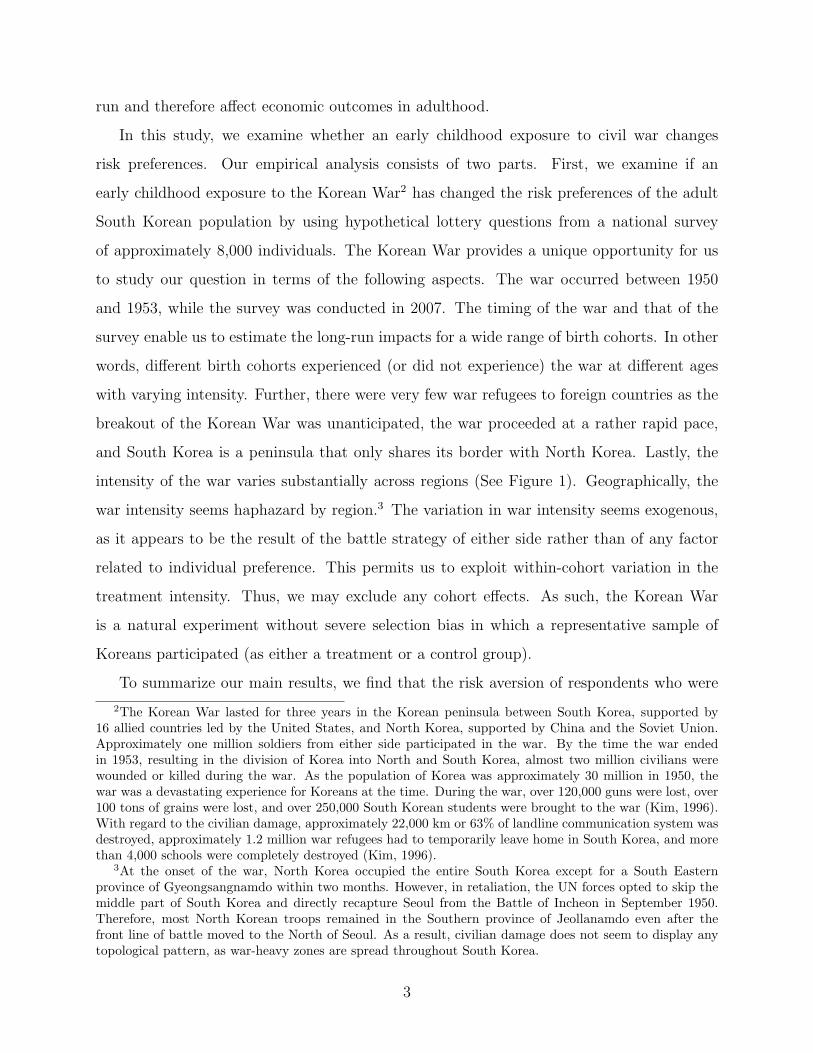
intensity of the war varies substantially across regions (See Figure 1). Geographically, the
war intensity seems haphazard by region.3 The variation in war intensity seems exogenous,
as it appears to be the result of the battle strategy of either side rather than of any factor
related to individual preference. This permits us to exploit within-cohort variation in the
treatment intensity. Thus, we may exclude any cohort effects. As such, the Korean War
is a natural experiment without severe selection bias in which a representative sample of
Koreans participated (as either a treatment or a control group).
To summarize our main results, we find that the risk aversion of respondents who were
2The Korean War lasted for three years in the Korean peninsula between South Korea, supported by16 allied countries led by the United States, and North Korea, supported by China and the Soviet Union.Approximately one million soldiers from either side participated in the war. By the time the war endedin 1953, resulting in the division of Korea into North and South Korea, almost two million civilians werewounded or killed during the war. As the population of Korea was approximately 30 million in 1950, thewar was a devastating experience for Koreans at the time. During the war, over 120,000 guns were lost, over100 tons of grains were lost, and over 250,000 South Korean students were brought to the war (Kim, 1996).With regard to the civilian damage, approximately 22,000 km or 63% of landline communication system wasdestroyed, approximately 1.2 million war refugees had to temporarily leave home in South Korea, and morethan 4,000 schools were completely destroyed (Kim, 1996).
3At the onset of the war, North Korea occupied the entire South Korea except for a South Easternprovince of Gyeongsangnamdo within two months. However, in retaliation, the UN forces opted to skip themiddle part of South Korea and directly recapture Seoul from the Battle of Incheon in September 1950.Therefore, most North Korean troops remained in the Southern province of Jeollanamdo even after thefront line of battle moved to the North of Seoul. As a result, civilian damage does not seem to display anytopological pattern, as war-heavy zones are spread throughout South Korea.
3

in their early childhood years in 1950, when the impact of the Korean War on civilians was
at its peak (Lee, 2011), increases and the size of the increase is larger than the difference
in risk aversion by gender. The war’s impact on risk aversion is only found for the early
childhood cohort, and the impact for respondents who are older in 1950 is insignificant. We
also perform the identical analysis for respondents who were infants in 1950 and find no
impact either.
In the second part of our empirical analysis, we validate our findings from the Korean
War using the data from the World Values Survey (WVS) and Armed Conflict Dataset as
a corroborative analysis. The WVS has been conducted in 51 countries and respondents
were asked some subjective questions related to risk aversion. Further, the Armed Conflict
Dataset, constructed by the Uppsala Conflict Data Program (UCDP) and Peace Research
Institute Oslo (PRIO), has been compiled for all civil conflicts around the world since 1946.4
Using the merged data, we find that experiences of civil wars during the identical age range
as that in our Korean War analysis similarly affect risk attitudes in adulthood.
2 Literature Review
A group of studies in the fields of psychology and economics examines the formation of
risk attitudes. Risk attitudes are determined by individual factors such as personality (Za-
leskiewicz, 2001; Trimpop et al., 1999), cognitive abilities (Benjamin et al., 2005), genetics
(Zhong et al., 2009), and emotions (Loewenstein et al., 2001). Moreover, risk attitudes are
affected by environmental factors such as friends (Nakajima, 2007), parents (Davies et al.,
2002), learning circumstances (Booth and Nolen, 2012), and cultural atmosphere (Bonin et
al., 2006).
Many recent studies have shown that a traumatic experience may significantly alter risk
attitudes. An experiment by Voors et al. (2012) reveals that a civil war in Burundi increased
risk-seeking behavior. Cassar et al. (2011b) conduct a similar experiment in Thailand and
find that subjects who experienced the 2004 Asian tsunami are more risk-averse. Cameron
4We will explain the civil war data in greater detail in Section 3. The data set is publicly available onlineat http://www.prio.no/Data/Armed-Conflict/.
4

and Shah (2010) show that subjects in Indonesia who were previously exposed to floods
and earthquakes exhibit more risk aversion than the subjects who do not. Further, Eckel et
al. (2009) find an increase in risk-seeking behavior among subjects who were exposed to the
disaster immediately after Hurricane Katrina and attribute the alteration of risk attitudes to
mental stress. Similarly, Li et al. (2011) find that after a month of unprecedented snowstorm
and two months after a major earthquake, Chinese subjects display more risk aversion in a
loss domain and simultaneously less risk aversion in a gain domain. A psychological study
by Sacco et al. (2003) finds indirect effect of a traumatic event. An experiment conducted
shortly after the 9/11 terrorist attack on Italian subjects showed that their risk aversion is
significantly altered, although they did not directly experience the attack.
It would be of great interest to examine if the immediate impact of traumatic events on
risk aversion, commonly indicated by the above studies, would persist in the long run after
the initial mental disruption is alleviated. There is an expanding body of studies on the long-
run consequences of childhood conditions on socioeconomic outcomes and behaviors such as
health, schooling, investment, and labor income. Malmendier and Nigel (2011) find that the
willingness to take financial risks diminishes for individuals who have experienced adverse
financial market conditions. Kesternich et al. (2012) show that through hunger, persecution,
and absence of the father, World War II has had a long-run detrimental health effect on
people in the form of increased incidences of diabetes, heart conditions, and depression.
Akbulut-Yuksel (2009) shows that a large-scale physical destruction from the World War II
has detrimental impacts on education attainment, health status and labor market outcomes.
Akresh et al. (2011) study the impact of the Nigerian civil war (1967–1970) to show that
the war has a significantly negative impact on the adult stature of those exposed to the
war between birth and adolescence. Alderman et al. (2006) and Bundervoet et al. (2009)
find long-run detrimental effects of civil war on health and education among children who
experienced malnutrition caused by the Zimbabwe and Burundi civil war. Leon (2010) finds
that the Peruvian civil conflict had a negative long-run impact on educational attainment.
Further, according to evidence from Guatemala and Tajikistan, the number of years of
schooling also reduces significantly for children who experience civil war (Chamarbagwala
and Moran, 2011; Shemyakina, 2011).
5

The abovementioned studies concentrate on the impact of civil conflict on socioeconomic
outcomes and behaviors. Some of the aforementioned impact may be attributable to the
alteration in preferences, particularly in risk preferences, of the affected individuals.5 In this
study, we examine if a traumatic exogenous shock may have a direct long-run impact on risk
preferences by using data on 1) the Korean War and 2) major civil wars since 1938.
3 Data and Empirical Strategy
3.1 Data
The data we use for our main analysis is from an individual survey from South Korea. The
Korean Labor & Income Panel Study (KLIPS) is a longitudinal survey of individuals aged
15 or older from approximately 5,000 households, analogous to the Panel Study of Income
Dynamics in the U.S. The data are suitable for our analysis since the war precedes the
survey by over five decades—approximately 14% of the respondents were aged between 0
and 9 in 1950, at the peak of the war, and approximately 11% of the respondents were aged
between 10 and 19 in 1950. The survey also provides information regarding each respondent’s
birthplace and residence at the age of 14. This enables us to exploit variation in regional
war intensity within cohorts.
For our analysis, we use the 7th wave of KLIPS, which includes hypothetical lottery
questions. The particular set of hypothetical lottery questions predicts financial risk-taking
behavior such as self-employment and stock ownership at a statistically significant level (Kim
and Lee, 2012). The 7th wave was conducted on 11,661 individuals from 4,762 households.
We included data on adult population aged between 20 and 85 and exclude proxy respondents
and those respondents with missing values. In addition, we exclude individuals whose place
of birth and residence at the age of 14 were different or, in other words, whose information
regarding the province of residence is relatively unreliable. The final sample includes 7,115
5For example, Cassar et al. (2011a) show that direct fighting experience during the Tajik civil war (1992–1997) has positive effects on trust, reciprocity, and a sense of fairness. Such changes in social preferences mayexplain changes in political behaviors, as found in Bellows and Miguel (2009). They find that individualsexposed to war violence in Sierra Leone are more likely to attend community meetings, more likely to joinlocal political and community groups, and more likely to vote.
6
individuals.
As mentioned earlier, we conducted a corroborative analysis by using merged data of the
WVS and the UCDP/PRIO Armed Conflict Dataset. This dataset enables us to investigate
whether the impact of the long-run civil war on risk attitudes from our main analysis is
observed in the cross-country individual-level dataset. We used the 2005-2008 WVS, con-
ducted in 51 countries on 70,242 individuals, as the particular wave includes a risk-related
question phrased: “Adventure and taking risks are important to this person.” We considered
two negative responses out of six-scale answers, “not like me” and “not at all like me,” as
the risk-averse responses. Thus, we created a dummy variable indicating the two negative
responses to the question and treated it as the dependent variable. 6 We also use the five-
wave aggregated WVS for the period 1981–2008, encompassing over 256,000 individuals in
87 countries, to analyze the impact of civil war on other personal attitudes including hap-
piness, importance of saving, willingness to avoid criminals, trust, willingness to fight for
one’s country, and existence of deity. For this additional analysis, we use all five-wave WVS
datasets because other attitude related variables are included in all five waves of WVS.
The WVS contains other individual demographic variables including age, gender, educa-
tion level, marital status, and income. Further, we imputed the age at which each respondent
was exposed to a civil war, if any, by using the UCDP/PRIO Armed Conflict Dataset that
compiles all civil conflicts around the world since 1946. We examined each civil conflict with
war-level intensity and exceeding 1,000 battle-related deaths at the onset and excluded civil
wars that were either restricted to a small part of a country, did not directly take place in
the country, or was not sufficiently intense. Then, we added the exposure to the WWII and
Spanish civil war7 (see Appendix A for detailed description about selection criteria). Finally,
all the selected conflicts from UCDP/PRIO dataset were matched with the WVS based on
6The results are robust to the classification of risk-averse responses. When the next highest response“a little like me” is also classified as a risk-averse response, the results were similar to when the two mostnegative responses were classified as a risk-averse response.
7The civil wars include the Chinese civil war, Turkish invasion of Cyprus, Ethiopian Civil War, IndonesianNational Revolution, Iran-Iraq war, Korean War, Vietnam War, Sino-Vietnamese War, and Rwandan CivilWar. Among the civil wars that meet the intensity criteria, we excluded the wars that were geographicallylimited in a country or lasted for less than 3 months, including the India-Pakistan War, Sino-Indian War,Indo-Pakistan War, Kargil War, Arab-Israeli War (where Jordanian involvement was minimal), MalayanEmergency, Chechnya conflict, Kurdish-Turkish conflict, and former-Yugoslavian war in the early 90s.
7

birth year and country, and we excluded all respondents born before 1938—the first year of
available civil conflict data.
3.2 Identification Strategy
For our main analysis, we assume a CRRA utility function and estimate risk aversion pa-
rameter γ for the main analysis8:
U (x)=x1−γ
1− γ(1)
Then, a structural noise parameter is introduced, following Luce (1959) and Holt and
Laury (2002). Denoting expected utility of option j = A (risk-free cash) or B (lottery), the
insensitivity of choice probabilities to payoff is captured by µ in the following probabilistic
choice index in the form of a cumulative probability distribution function (Andersen et al.,
2008):
∇EU =EU
1/µB
EU1/µA + EU
1/µB
(2)
As µ approaches zero, the probability of selecting the option with greater expected payoff
approaches one. At the other extreme, as µ increases, the choice probability approaches 0.5;
the choice becomes random and increasingly inconsistent with the expected utility theory.
The KLIPS contains a set of five hypothetical lottery choice questions. Respondents
choose between a certainty payment of 100,000 Korean won (KRW) and a lottery payment,
with the probability and payoff varying in each of the five questions, for a day’s work.
Table 2 summarizes the five hypothetical lottery questions; the first column presents the
identical certainty option and the second column summarizes the risky option that offers
different payoffs in different probabilities. For example, the first question asks respondents
to choose between a payment of 100,000 KRW (choice A in our notations) and an option of
8A more flexible form of the utility function is the power-expo utility function (Saha, 1993),U (x)= (1−exp
(−αx1−γ
))/α, which reduces to CRRA when α= 0 and collapses to CARA when γ= 0.
Kim and Lee (2012) show that the parameter α is statistically insignificant. The result is expected, as αmeasures the responses to varying amount of payoffs; however, the KLIPS lottery questions do not appearto have sufficient variations in the amount of payoffs (See Table 2).
8

taking a lottery that pays out 50,000 KRW with probability of 0.5 and 150,000 KRW with
a probability of 0.5 (choice B in our notations).
We construct the following conditional log-likelihood, using choices made by survey re-
spondents to the five hypothetical lottery questions:
lnL (γ, µ; ; y,X)=N∑i
5∑j
[(ln (∇EU)
∣∣ yji = 1)+(ln (1−∇EU)
∣∣ yji = −1)]
(3)
where i indexes individuals and j indexes the lottery questions. yji= 1 (or -1) denotes that
the choice made by individual i for the j th lottery question is option A (or B). We estimate
risk aversion parameter γ and structural noise parameter µ. We allow heterogeneity of the
parameters, linearly depending on individual characteristics (X) such as exposure to the
Korean War, gender, age, education, marital status, and annual household income.9 The
individual heterogeneity of interest is related to exposure to the Korean War. First, we define
a dummy variable, da,bi , that indicates an exposure to the Korean War between ages a and
b in 1950 when the war intensity was at its peak.10 The coefficient represents the difference
in the risk aversion parameter of those who were in the particular age group from those
who were in other age groups after controlling for age. Because of the lack of consensus or
previous research on the long-term impact of war experience at certain ages on risk attitudes,
we experimented with various age ranges in risk aversion parameter estimation as in equation
(4), where Zi represents individual characteristics except exposure to the Korean War.
γi = Ziβ + αda,bi (4)
After testing a variety of age range permutations of different lengths, initial and terminal
ages, we determined that those who were exposed to the Korean War in the early-childhood
phase around age 6 in 1950 were most significantly affected by the Korean War.11
9We perform maximum likelihood estimation using Stata’s ml command. The standard errors are clus-tered at the province-by-cohort level.
10The Korean War is distinctive in that although the war lasted for 3 years from 1950 to 1953, the majorityof war damage to civilians was concentrated on the first 9 months of the war in 1950, immediately followingthe unexpected onset of the war by invasion of North Korea (Lee, 2011).
11From the data we found that age 4 to 8 best represents early childhood exposure. Hereafter when we
9

It is likely, from our specification, that any difference in risk aversion in the selected age
group is due to the Korean War experience, but there remains a small possibility that this is
confounded by a specific cohort effect. For example, those in this particular group were aged
around 60 at the time of the survey and the impact may be related to the age group reaching
retirement. Therefore, to identify the effect of war on risk aversion, we exploit war intensity
variation by region within cohorts as well as war intensity variation by birth cohort. The
regional intensity measure is defined using the civilian damage per province (see Figure 1).
The birth cohort intensity measure is defined using the number of police injuries and deaths
during the war (see Table 3). As the primary duty of the police force is to maintain order
in areas that are not active war zones, their loss is a reasonable indicator of civilian damage
during the war. Army related measure such as the number of hospitalized soldiers better
represents military damage.
The regional war intensity measure is defined in the following manner. We added two
variables, an indicator variable, “Risky Area,” for provinces in which injuries and casualties
in the population was greater than the average of 0.05 and, its interaction term with the
early-childhood exposure dummy variable (da,bi ). The coefficient on the interaction term gives
the difference-in-differences (DID) estimate of the impact of the early childhood exposure to
war on risk aversion.
The Korean War lasted from 1950 to 1953, and the civilian war intensity measured by
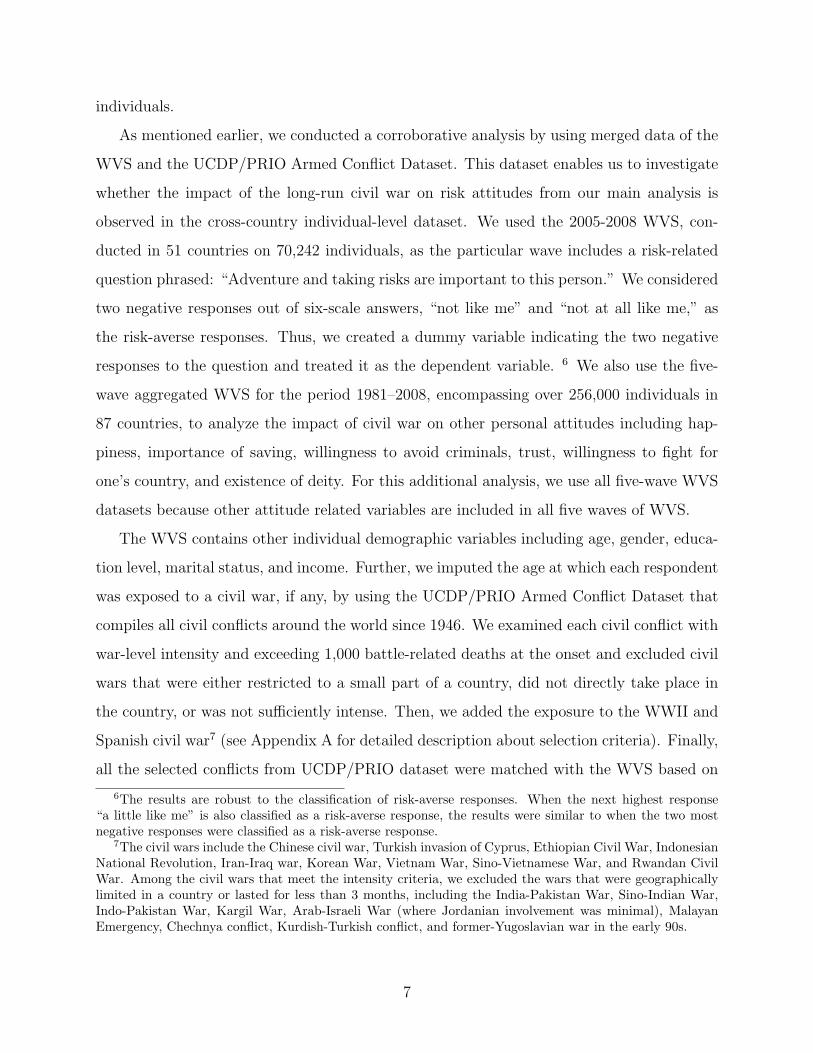
police injuries/casualty was the greatest in 1950 as Table 3 indicates. For the birth cohort
war intensity measure termed “Age-Adjusted Exposure to the Korean War” (denoted by Wit
for individual i in birth cohort t), we sum up the police loss for each year that each birth
cohort was exposed to the war in their early childhood. For example, if the early childhood
is defined as age range between a and b, the birth cohort war intensity measure is defined
as:
Wit =1953∑1950
Da,bit ωt (5)
where Da,bit is the dummy variable that indicates if the individual is in the specified age range
mention the early childhood in an analysis, we refer to age 4 to 8. Later in Table 8, we will present resultswith different age ranges.
10
in year t and ωt represents police injuries/casualty in year t. For example, those in the 1944
birth cohort were 6 in 1950 at the peak of the war but by 1953 they were out of the early
childhood window determined from the data. Therefore, the age-adjusted exposure to the
Korean War for the 1944 birth cohort is the sum of police loss from 1950 to 1952.
In the supplementary analysis, we test if the impact of early childhood exposure to a
civil war on risk attitude is also found in other countries with various cultural, political, and
historical backgrounds. For this analysis, we merge the WVS dataset from 51 countries for
over 70,000 respondents from 2005 to 2008 with the UCDP/PRIO Armed Conflict dataset.
Specifically we run the following linear probability model:
Risk Averseijt = β ·War Exposureijt +X′
ijtγ + αj + αt + εijt (6)
where i denotes individual, j denotes country, and t denotes year of survey. The dependent
variable, “Risk Averse”, is a dummy variable that indicates two negative responses out of
six-scale answers, “not like me” and “not at all like me,” to a question “Adventure and taking
risks are important to this person.” To first check the validity of the WVS question as a
measure of risk aversion, we test if it predicts a financially risky behavior, self-unemployment.
We run a Probit analysis with all controls included in equation (6) and “Risk Averse” dummy
variable as the independent variable. Then, taking “Self Employment” dummy variable as
the dependent variable, we find that the coefficient for “Risk Averse” is significant and
negative.
The key variable, “War Exposure,” is a dummy variable indicating that the individual was
exposure to a major civil war during the early childhood. The variable is constructed using
the UCDP/PRIO dataset. Thus the coefficient β measures the impact of an early childhood
war exposure on risk aversion. VectorX includes age, gender, education level, marital status,
and household income. We control for survey year and country fixed effects. In addition, we
examine the impact of early childhood exposure to civil war on other attitudinal variables
including happiness, importance of saving, willingness to avoid criminals, trust, willingness
to fight for country, and existence of deity.
11
4 Estimation Results and Discussion
4.1 The Korean War
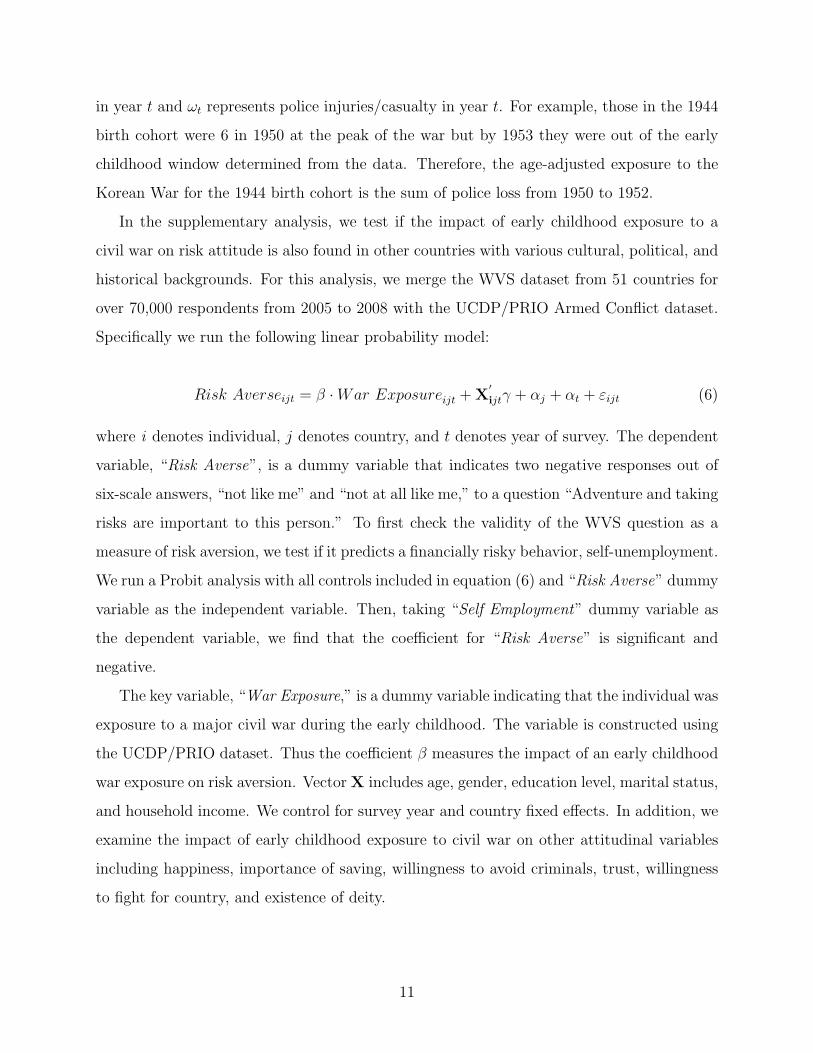
Before we proceed to our main structural analysis, we estimated a reduced-form linear prob-
ability model, taking an indicator variable for the choice of risky option over certainty option
as the dependent variable. The dependent variable is a dummy variable that is equal to 1
if the respondent selected the risky option and 0 otherwise. Each individual provided five
observations, corresponding to five hypothetical lottery questions. Table 4 reports the re-
sults. Columns 1 and 2 present the results from the specifications only using an indicator
variable for early childhood exposure. Column 1 uses a parsimonious set of control variables
while column 2 includes all control variables. Columns 3 and 4 present the results from DID
analysis that utilizes regional war intensity to correct for a possible cohort effect. Column 4
includes an indicator variable for respondents older than the early-childhood exposure group
to check if the increased aversion is specific to the entire older population or specific to
the early childhood exposure group. In the first two columns, we find that early childhood
exposure to the Korean War is statistically significant and negative. It means that early
childhood exposure to the Korean War decreases the likelihood of selecting the risky option.
In the last two columns, the interaction term is significant and negative. This implies that
even among those who experienced the Korean War in their early childhood, respondents
who lived in the provinces that were more severely affected by the war are more risk averse
than their counterparts. In the last specification, we find that this war exposure effect exists
only among those who experienced the war during their early childhood.
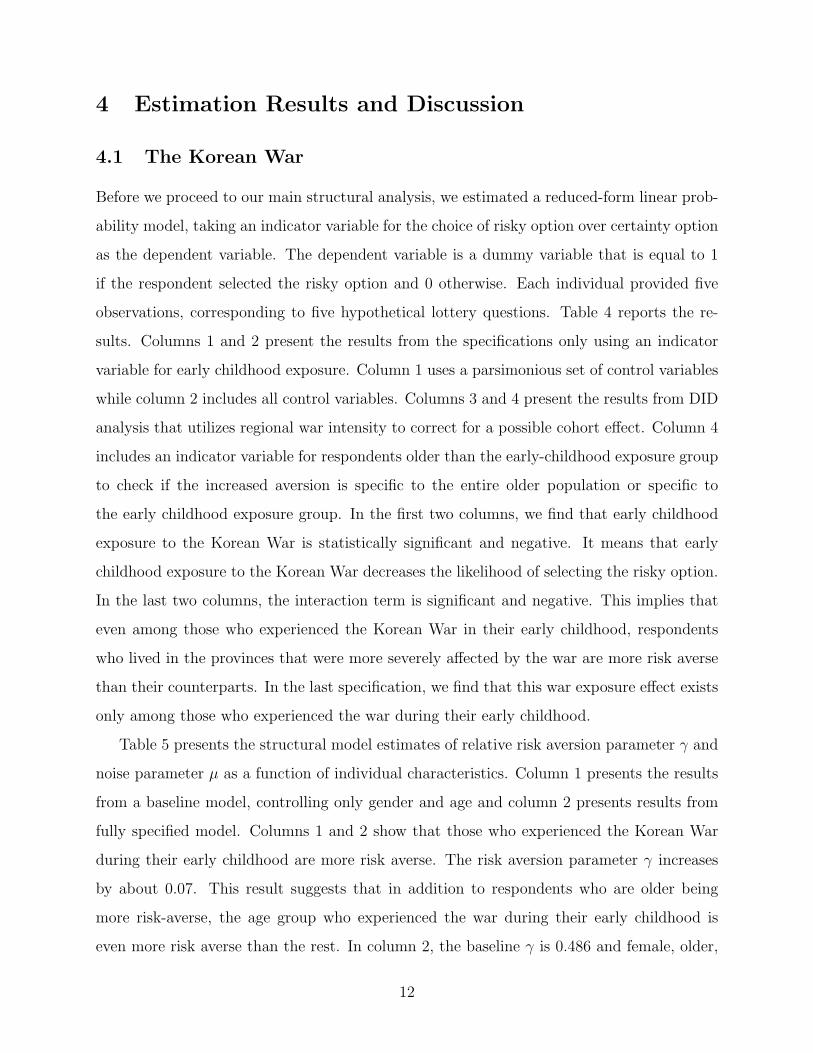
Table 5 presents the structural model estimates of relative risk aversion parameter γ and
noise parameter µ as a function of individual characteristics. Column 1 presents the results
from a baseline model, controlling only gender and age and column 2 presents results from
fully specified model. Columns 1 and 2 show that those who experienced the Korean War
during their early childhood are more risk averse. The risk aversion parameter γ increases
by about 0.07. This result suggests that in addition to respondents who are older being
more risk-averse, the age group who experienced the war during their early childhood is
even more risk averse than the rest. In column 2, the baseline γ is 0.486 and female, older,
12

and more educated individuals are more risk averse than others. Further, the structural
noise parameter estimation indicates that inconsistency in answering the hypothetical lottery
questions was greater for male, younger and more educated individuals. Marital status and
household income do not seem to have a statistically significant effect on γ and µ.
Columns 3 and 4 present results from DID specifications that exploit regional war in-
tensity variation within cohorts. Again, we find that respondents who had early childhood
exposure to the Korean War in a relatively risky area are more risk averse. Column 4 includes
a dummy variable that indicates respondents older than the early childhood exposure group.
We find that the difference in risk attitudes is not common for the entire older population.
Table 6 presents the results from the analysis that uses the second measure of war inten-
sity, age-adjusted exposure to the Korean War. Columns 1, 2 and 3 in Table 6 are analogous
to columns 1, 3, and 4 in Table 5. We find that the age-adjusted exposure to the Korean
War increases the risk aversion of respondents across the board. In column 3, as in column
4 of Table 5, risk aversion of the age group that is older than the exposed group is not
significantly affected.
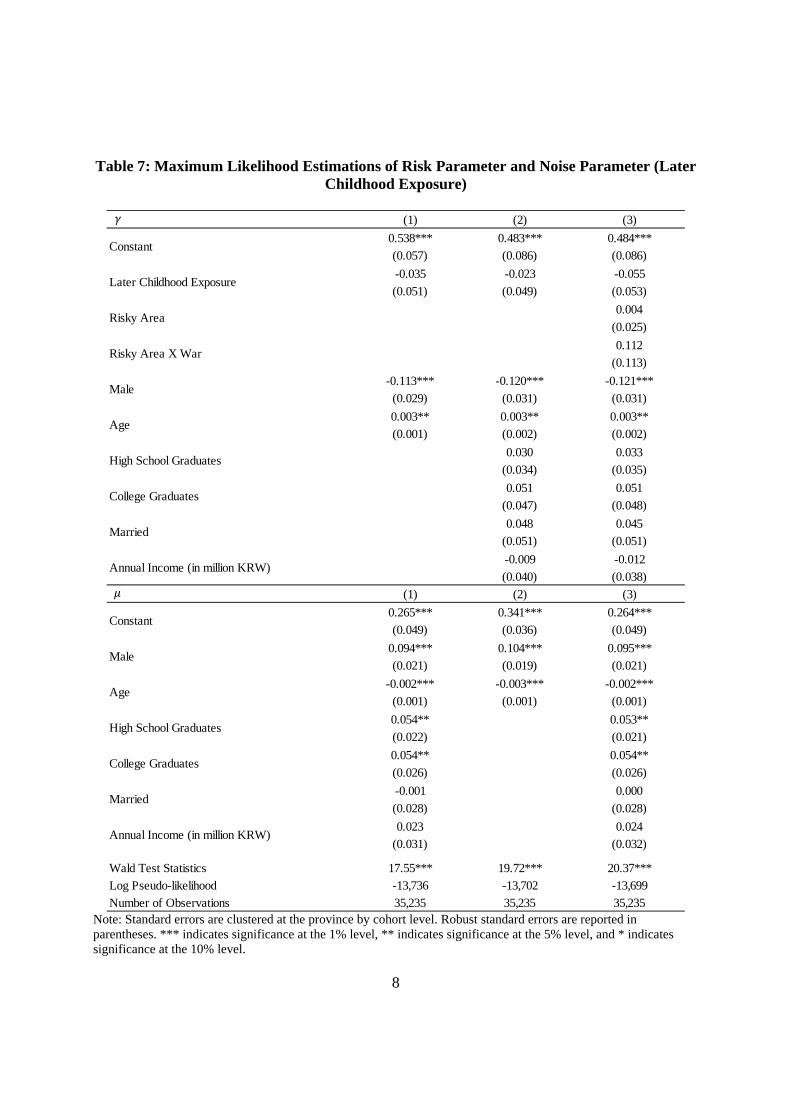
Table 7 presents the results when we use ”later childhood exposure” to the Korean War
(from age 9 to 12 in 1950). We test if the variability in risk aversion is unique to the early
childhood group. Columns 1, 2, and 3 in Table 7 correspond to columns 1, 3, and 4 in Table
5, respectively. The results across the board show that experiencing the Korean War at the
later childhood did not significantly alter risk attitudes.
So far we have specified the early childhood as the period from age 4 to 8. To check the
validity of this specification, in Table 8, we examine the effects of the Korean War on risk
aversion for all other age groups. Age 31 in 1950 corresponds to age 85 (the maximum age in
our sample) at the time of the survey; hence, we divide the ages 9–31 into three age groups
to ensure that each age group includes a sufficient number of respondents. The results show
that for age groups 0–3, 9–15, 16–22, and 23–31, the war exposure effect is insignificant.
This implies that the early childhood experience of the war in the early childhood may be
crucial in the formation of risk attitude that is carried over to later stages of life. Further,
the war exposure effect is significant for the 4–8, 4–7 and 6–9 age groups, all in the early
childhood. Overall the results indicate that the exposure to the Korean War only in the
13

early childhood around age 6 has a long-run impact on risk aversion.
To sum up, our findings indicate that there is a persistent long run impact of early child-
hood exposure to the war on risk aversion. Although our focus on the particular age group is
empirically driven, there is abundant evidence from developmental psychology showing that
early childhood experiences are essential in long-run personality formation. For example, the
behavioral genetic study of Emde and Hewitt (2001) shows that differences in temperament
measured in the first few years of life do not entirely depend on hereditary factors but also
environments. Eisenberg (2000) finds that by the age of three, children manifest an expanded
set of emotions. Overall, the developmental changes from age 2 to 8 are rather rapid and
wide-ranging (Caspi et al., 2005). The meta analyses by Fraley and Roberts (2005) and
Roberts and DelVecchio (2000) reveal that the level of continuity in personality formed after
age 3 is rather high. Personality formation in early childhood by environmental factors is
consistent with our finding that a traumatic exogenous shock at an early age has a profound
impact on risk attitudes in later stages of life.
4.2 Civil Wars around the World
How specific is the war exposure effect to the Korean War? It is difficult to answer the
question without standardized individual-level data across different countries. In our sup-
plementary analysis, we utilize the best available data and make the first attempt to provide
cross-country evidence that early childhood exposure to a major civil war affects the for-
mation of risk attitude. Table 9 presents the results of our supplementary analysis, using
large-scale cross-country individual survey data. We define the early childhood in the same
manner as the main analysis. The WVS also provides all other individual demographic
characteristics included in our main analysis. We use the indicator variable that shows if
a respondent experienced a major civil war for at least one year in the early childhood as
the key independent variable. Columns 1 and 2 report the results from equation (6) for all
51 countries. Columns 3 and 4 report the results from the same analysis for only 25 coun-
tries that underwent at least one major civil conflict after 1937. Columns 2 and 4 include a
dummy variable indicating if the respondent ever experienced a civil war when he/she was
older than the early childhood. The key coefficient is significant and positive in all four
14

specifications. This indicates that early-childhood exposure to a major civil war increases
the probability of risk-averse responses by 3.5 percentage points in column 2 and by 2.9
percentage points in column 4. The results also indicate that war experience at older ages
does not have significant impact on risk attitudes.12
As mentioned earlier, we examine the impact of early childhood civil war experience on
other attitudinal variables. These other attitude-related questions are asked in all five waves
of the WVS, and therefore we expand the dataset to include all the waves from 1981 to
2008. Table 10 shows that the key coefficients are statistically insignificant for happiness,
trust, willingness to fight for one’s country, and the existence of deity. For respondents who
experienced a major civil war after the early childhood, the probability for willingness to
avoid individuals with a criminal record as neighbors drops by six percentage points. It is
interesting that the early childhood exposure is significant only in terms of the importance
of saving, which is related to financial risk taking behavior. Respondents who experienced
a major civil war at the early childhood are 3.2 percentage points more likely to respond
that it is important to be thrifty and save money. The results from supplementary analysis
suggest that the long run impact of a traumatic shock in the early childhood is not specific
to the Korean War but may be more universal for other major civil wars.
5 Conclusion
Risk attitudes pertain to almost all areas of economic decision-making. However we have
very limited knowledge about the formation of risk attitudes. In this study, we examine
whether a traumatic war experience in the early childhood may persistently alter the risk
attitudes. We exploit the natural experimental setting engendered by the Korean War, where
a substantial proportion of the population experienced a major civil war. Our findings show
that early childhood experience of the Korean War leads to a substantial increase in risk
aversion. We also find that those who were living in relatively riskier areas in their early
12The only civil war that ended within 10 years from the time of the survey is the Ethiopian Civil War,which ended in the year 2000. Out of over 58,000 respondents from 51 countries who are born after 1937and who are not missing vital demographic information, there is no respondent who only experienced the1998–2000 wave of the civil war but not the 1974–1991 wave of the civil war. Therefore, it is extremelydifficult to estimate the short-run impact of civil war on risk aversion using WVS.
15

childhood are significantly more risk averse than the others in the same cohort, after five
decades since the end of the Korean War. The supplementary analysis of major civil wars
around the world shows that the long run impact on risk aversion is not specific to the
Korean War.
It is possible that risk aversion is instantaneously altered due to a major traumatic
experience, regardless of the age at which an individual experiences it. This temporary
change may be attributable to a sudden increase in the perceived likelihood of adverse
shocks. However, in our dataset, the war ended 51 years prior to the time of the survey
and it is likely that such an emotional effect may have already dissipated. Therefore, since
the impact of the war persisted over a long period of time, we can reasonably assume that
the war affected risk attitudes through more fundamental channels such as modifications
in preferences. Further, our findings also suggest that risk attitudes are shaped at the
early childhood. These findings are in line with recent evidence in the biology literature
that reveals that childhood experience alters biological systems responsible for maintaining
physiological stability in the brain (Danese and McEwen, 2012; McEwen, 2012). A fruitful
research area for future studies may be the investigation of preference formation over the
various stages of child development.
16

References
Akbulut-Yuksel, M. (2009). Children of War: The Long-Run Effects of Large-Scale Physical
Destruction and Warfare on Children. HiCN Working Paper 62.
Akresh, R., Bhalotra, S., Leone, M., and Osili, U. (2011). War and Stature: Growing Up
During the Nigerian Civil War. IZA Discussion Paper No. 6194.
Alderman, H., Hoddinott, J., and Kinsey, B. (2006). Long Term Consequences of Early
Childhood Malnutrition. Oxford Economic Papers, 58(3), 450-474.
Algan, Y. and Cahuc, P. (2010). Inherited Trust and Growth, American Economic Review,
100, 2060-2092.
Almond, D., Chay, K. & Lee, D. (2005). The Cost of Low Birth Weight. The Quarterly
Journal of Economics, 120(3), 1031-1083.
Andersen, S., Harrison, G.W., Lau, M.I. & Rutstrom, E. E. (2008). Eliciting Risk and
Time Preferences. Econometrica, 76(3), 583-618.
Bellows, J. and Miguel, E. (2009). War and Local Collective Action in Sierra Leone. Journal
of Public Economics, 93, 1144-1157.
Benjamin, D.J., Brown, S.A., and Shapiro, J.M. (2005). Who is ‘Behavioral’? Cognitive
Ability and Anomalous Preferences. Unpublished Manuscript, University of Chicago.
Black, S., Devereux, P., & Salvanes, K. (2007). From the Cradle to the Labor Market?
The Effect of Birth Weight on Adult. The Quarterly Journal of Economics, 122(1),
409-439.
Bonin, H., Constant, A., Tatsiramos, J., and Zimmermann, K. (2006). Ethnic Persistence,
Assimilation and Risk Proclivity. IZA Discussion Paper No. 2537
Booth, A., and Nolen, P. (2012). Gender Differences in Risk Behaviour: Does Nurture
Matter? The Economic Journal, 122 (Feb), F56-F78.
17

Bundervoet, T., Verwimp, P., and Akresh, R. (2009). Health and Civil War in Rural
Burundi. Journal of Human Resources, 44(2), 536-563.
Cameron, L. and Shah, M. (2010). Do Natural Disasters Shape Risk Attitudes?. Working
Paper.
Caspi, A., Roberts, B., and Shiner, R. (2005). Personality Development: Stability and
Change. Annual Review of Psychology, 56, 453-484.
Cassar, A., Grosjean, P., and Whitt, S. (2011a). Social Cooperation and the Conflict Gap:
Survey and Experimental Evidence from Post-War Tajikistan. Working Paper.
Cassar, A., Healy, A., and von Kessler, C. (2011b). Trust, Risk, and Time Preferences
After a Natural Disaster: Experimental Evidence from Thailand. Working Paper.
Chamarbagwala, R., and Moran, H. (2011). The Human Capital Consequences of Civil
War: Evidence from Guatemala. Journal of Development Economics, 94, 41-61.
Croson, R., and Gneezy, U. (2009). Gender Differences in Preferences. Journal of Economic
Literature, 47(2), 1-27.
Danese, A., and McEwen, B. (2012). Adverse Childhood Experiences, Allostatis, Allostatic
Load, and Age-Related Disease. Physiology & Behavior, 106(1), 29-39.
Davies, R., Heinesen, E., and Holm, A. (2002). The Relative Risk Aversion Hypothesis of
Educational Choice. Journal of Population Economics, 15, 683-713.
Dohmen, T., A. Falk, D. Huffman, U. Sunde, J. Schupp, & G. Wagner, (2005), “Individual
Risk Attitudes: New Evidence from a Large, Representative, Experimentally-Validated
Survey,” IZA Discussion Paper No. 1730.
Eckel, C., & Grossman. P. (2002). Sex Differences and Statistical Stereotyping in Attitudes
Toward Financial Risk. Evolution and Human Behavior, 23(4), 281-295.
Eckel, C., El-Gamal, M., and Wilson, R. (2009). Risk Loving After the Storm: A Bayesian-
Network Study of Hurricane Katrina Evacuees. Journal of Economic Behavior and
Organization, 55(4), 447-465.
18
Eisenberg, N. (2000). Emotion, Regulation, and Moral Development. Annual Review of
Psychology, 51, 665-697.
Emde, R., and Hewitt, J. eds. (2001). Infancy to Early Childhood: Genetic and Environ-
mental Influences on Developmental Change. New York: Oxford University Press.
Fraley, R. and Roberts, B. (2005). Patterns of Continuity: A Dynamic Model for Concep-
tualizing the Stability of Individual Differences in Psychological Constructs Across the
Life Course. Psychological Review, 112, 60-74.
Galvan, A., Hare, T., Parra, C., Penn, J., Voss, H., Glover, G. & Casey, B. (2006). Earlier
Development of the Accumbens Relative to Orbitofrontal Cortex Might Underlie Risk-
Taking Behavior in Adolescents. The Journal of Neuroscience, 26(25), 6885-6892.
Heckman, J., Conti, G., Hansman, C., Novak, M., Ruggiero, A., & Suomi, S. (2012).
Primate Evidence on the Late Health Effects of Early-Life Adversity. Proceedings of
the National Academy of Sciences, 109(23), 8866-8871.
Hoffman, M. (1977). Personal and Social Development. Annual Review of Psychology, 28,
295-321.
Holt, C. A., & Laury, S. K. (2002). Risk Aversion and Incentive Effects. American Eco-
nomic Review, 92(5), 1644-1655.
Hryshko, D., M. J. Luengo-Prado, & B. Sorensen, (2011), “Childhood Determinants of
Risk Aversion: The Long Shadow of Compulsory Education,” University of Alberta
Working Paper No. 2011-02.
Kesternich, I., Siflinger, B., Smith, J., and Winter, J. (2012). The Effects of World War II
on Economic and Health Outcomes across Europe. IZA Discussion Paper No. 6296.
Kim, W. (1996). Korean War Damage Statistics, Seoul: Defense and Military Research
Institute. (In Korean)
Kim, Y., and Lee, J. (2012). Estimating Risk Aversion Using Individual-Level Survey Data.
Korean Economic Review, 28(2), 221-239.
19

Lee, C. (2011). In-Utero Exposure to the Korean War and its Long-Term Effects on Eco-
nomic and Health Outcomes. Working Paper.
Leon, G. (2010). Civil Conflict and Human Capital Accumulation: The Long Term Effects
of Political Violence in Peru. Working Paper.
Li, J., Li, S., Wang, W., Rao, L., and Liu, H. (2011). Are People Always More Risk Averse
After a Major Snow-hit and a Major Earthquake in China in 2008. Applied Cognitive
Psychology, 25, 104-111.
Loewenstein, G.F., Weber, E.U., Hsee, C.K., and Welch, N. (2001). Risk as Feelings.
Psychological Bulletin, 127(2), 267-286.
Luce, D. (1959). Individual Choice Behavior, New York: John Wiley & Sons.
Malmendier, U., & Nigel, S. (2011). Depression Babies: Do Macroeconomic Experiences
Affect Risk Taking? The Quaterly Journal of Economics, 126(1), 373-416.
McEwen, B. (2012). Brain on Stress: How the Social Environment Gets Under the Skin.
Proceedings of the National Academy of Sciences of the United States of America, 109,
17180-17185.
Nakajima. R. (2007). Measuring Peer Effects on Youth Smoking Behavior. The Review of
Economic Studies, 74(3), 897-935.
Parke, R. & Ahser, S. (1983). Social and Personality Development. Annual Review of
Psychology, 34, 465-509.
Parlow, A. (2012). Armed Conflict and Children’s Health – Exploring New Directions: The
Case of Kashmir. HiCN Working Paper 119.
Roberts, B., and DelVecchio, W. (2000). The Rank-Order Consistency of Personality Traits
from Childhood to Old Age: a Quantitative Review of Longitudinal Studies. Psycho-
logical Bulletin, 126, 3-25.
Sacco, K., Galletto, V., and Blanzieri, E. (2003). How Has the 9/11 Terrorist Attack
Influenced Decision Making? Applied Cognitive Psychology, 17, 1113-1127.
20

Saha, A. (1993). Expo-Power Utility: A Flexible Form for Absolute and Relative Risk
Aversion. American Journal of Agricultural Economics, 75(4), 905-913.
Shemyakina, O. (2011). The Effect of Armed Conflict on Accumulation of Schooling: Re-
sults from Tajikistan. Journal of Development Economics, 95, 186-200.
Tabellini, G. (2010). Institutions and Culture. Journal of the European Economic Associ-
ation, 6(2-3), 255-294.
Trimpop, R., Kerr, J., and Kirkcaldy, B. (1999). Comparing Personality Contructs of
Risk-Taking Behavior. Personality and Individual Differences, 26(2), 237-254.
Voors, M., Nillesen, E., Verwimp, P., Bulte, E., Lensink, R. & Van Soest, D. (2012). Violent
Conflict and Behavior: A Field Experiment in Burundi. American Economic Review,
102(2), 941-964.
Zeleskiewicz, T. (2001). Beyond Risk Seeking and Risk Aversion: Personality and the Dual
Nature of Economic Risk Taking. European Journal of Personality, 15 (S1), S105-S122.
Zhong, S., Chew, S., Set, E., Zhang, J., Xue, H., Sham, P., Ebstein, R. and Israel, S.
(2009). The Heritability of Attitude Toward Economic Risk. Twin Research and
Human Genetics, 12(1), 103-107.
21

1
Figure 1: Injuries and Casualties from the Korean War per Population by Province
Source: Population data from the 1949 Census of South Korea. War damage data has been obtained from Kim (1996), p.85. Number of civilian injury/casualty per population ratios are shown in parenthesis.

2
Figure 2: Age-adjusted Exposure to the Korean War
Note: Age-adjusted exposure to the Korean War is the sum of the number of police injury/casualty for each cohort in the age group of 4–8 years.
0
2000
4000
6000
8000
10000
12000
14000
16000
18000
20000
1938 1939 1940 1941 1942 1943 1944 1945 1946 1947 1948 1949 1950 1951 1952 1953
Birth Year

3
Table 1: Summary Statistics of Relevant Variables
Mean
[Std. Dev.]
Male 0.44
[0.50]
Age 45.17
[15.32]
High School Graduates 0.33
[0.47]
College Graduates 0.30
[0.46]
Married 0.71
[0.45]
Annual Income (in million KRW) 31.43
[35.10]
Childhood Exposure to Korean War (Age group 4–12 in 1950)
0.12 [0.33]
Early Childhood Exposure to Korean War (Age group 4–8 in 1950)
0.06 [0.24]
Later Childhood Exposure to Korean War (Age group 9–12 in 1950)
0.06 [0.23]
Older Exposure to Korean War (Age group 13–31 in 1950)
0.17 [0.37]
Number of Observations 7,047

4
Table 2: Hypothetical Lottery Questions
Question Number
Option A (Safe Choice)
Option B (Risky Choice)
Gap in Expected Payoff
(Option A - Option B)1 100,000 1/2 of 150,000, 1/2 of 50,000 0
2 100,000 1/2 of 200,000, 1/2 of 0 0
3 100,000 2/5 of 200,000, 3/5 of 0 20,000
4 100,000 3/5 of 200,000, 2/5 of 0 -20,000
5 100,000 1/5 of 500,000, 4/5 of 0 0 Source: Kim and Lee (2012) Notes: All units are in KRW; KRW 100,000 is equivalent to USD 105.12, based on the average exchange rate in 2004, or equivalent to 0.6% of annual GDP per capita of South Korea in 2004. The questions were asked in the order of the question number. Each question was asked for the payment option for a day’s work.
Table 3: Civilian Damages in the Korean War by Year
Police Injuries and Casualties
Year Death Injury Kidnapped Missing Total
1950 1,067 3,364 52 6,494 10,977 1951 1,388 2,729 302 518 4,937 1952 469 474 42 43 1,026 1953 209 193 7 29 438
Source: Kim (1996): p. 67

5
Table 4: Reduced-form Estimations of Lottery Choice
(1) (2) (3) (4)
Constant 0.193*** 0.027 0.026 0.016
(0.011) (0.007) (0.021) (0.024)
Early Childhood Exposure -0.015* -0.012** -0.003 -0.010
(0.009) (0.001) (0.011) (0.013)
Risky Area -0.000 -0.000
(0.007) (0.007)
Risky Area X War -0.032* -0.032*
(0.016) (0.016)
Older Than Early Childhood -0.014
(0.013)
Male 0.097*** 0.096** 0.095*** 0.095***
(0.007) (0.006) (0.007) (0.007)
Age -0.003*** -0.002** -0.002*** -0.002***
(0.000) (0.000) (0.000) (0.000)
High School Graduates 0.022* 0.022*** 0.022***
(0.003) (0.008) (0.008)
College Graduates 0.014 0.014 0.016
(0.006) (0.011) (0.011)
Married -0.017** -0.017** -0.020***
(0.001) (0.007) (0.007)
Annual Income (in millions KRW) 0.017 0.017* 0.016*
(0.005) (0.009) (0.009)
Probability of Lower Payment Option
0.224** 0.224*** 0.224***
(0.016) (0.017) (0.017)
Amount of Lower Payment Option 0.015* 0.015*** 0.015***
(0.001) (0.002) (0.002)
Amount of Higher Payment Option 0.052** 0.052*** 0.052***
(0.002) (0.006) (0.006)
R2 0.047 0.052 0.052 0.053
Number of Observations: 35,235 35,235 35,235 35,235 Note: The analysis includes all independent variables included in model (3). Standard errors are clustered at the province by cohort level. Robust standard errors are reported in parentheses. *** indicates significance at the 1% level, ** indicates significance at the 5% level, and * indicates significance at the 10% level.

6
Table 5: Maximum Likelihood Estimations of Risk Parameter and Noise Parameter
Note: Standard errors are clustered at the province by cohort level. Robust standard errors are reported in parentheses. *** indicates significance at the 1% level, ** indicates significance at the 5% level, and * indicates significance at the 10% level.
(1) (2) (3) (4)
0.556*** 0.486*** 0.491*** 0.526***
(0.057) (0.085) (0.085) (0.099)
0.074* 0.072* 0.029 0.052
(0.041) (0.039) (0.044) (0.050)
0.002 0.002
(0.026) (0.026)
0.174** 0.173**
(0.068) (0.068)
0.051
(0.048)
-0.114*** -0.120*** -0.120*** -0.125***
(0.029) (0.031) (0.031) (0.031)
0.003** 0.003** 0.003* 0.002
(0.001) (0.001) (0.001) (0.002)
0.036 0.032 0.027
(0.034) (0.034) (0.034)
0.058 0.057 0.048
(0.047) (0.047) (0.048)
0.050 0.050 0.056
(0.050) (0.050) (0.049)
-0.009 -0.011 -0.003
(0.039) (0.038) (0.043)
(1) (2) (3) (4)
0.342*** 0.261*** 0.263*** 0.261***
(0.036) (0.049) (0.048) (0.047)
0.103*** 0.095*** 0.094*** 0.091***
(0.020) (0.021) (0.021) (0.021)
-0.003*** -0.002*** -0.002*** -0.002***
(0.001) (0.001) (0.001) (0.001)
0.054** 0.053** 0.052**
(0.022) (0.021) (0.021)
0.056** 0.057** 0.056**
(0.026) (0.026) (0.026)
0.001 0.001 0.000
(0.028) (0.027) (0.027)
0.024 0.024 0.026
(0.032) (0.032) (0.033)
Wald Test Statistics 18.98*** 21.56*** 34.43*** 36.83***
Log Pseudo-likelihood -13,733 -13,698 -13,694 -13,692
Number of Observations 35,235 35,235 35,235 35,235
Annual Income (in millions KRW)
Constant
Male
Age
High School Graduates
College Graduates
Married
Annual Income (in million KRW)
Constant
Early Childhood Exposure
Risky Area
Risky Area X War
Older Than Early Childhood
Male
Age
High School Graduates
College Graduates
Married

7
Table 6: Maximum Likelihood Estimations of Risk Parameters Using Age-adjusted Exposure to War
(1) (2) (3)
Constant 0.555*** 0.476*** 0.513***
(0.046) (0.079) (0.091)
Age-adjusted Exposure 0.063** 0.061*** 0.078***
(0.025) (0.023) (0.028)
Older Than Early Childhood 0.054
(0.044)
Male -0.099*** -0.100*** -0.105***
(0.026) (0.028) (0.028)
Age 0.003** 0.003** 0.002
(0.001) (0.001) (0.002)
High School Graduates 0.071** 0.066**
(0.033) (0.032)
College Graduates 0.091** 0.081*
(0.045) (0.045)
Married 0.027 0.035
(0.048) (0.047)
Annual Income (in millions KRW) -0.003 0.005
(0.038) (0.043) Wald Test Statistics 21.70*** 24.69*** 26.06***
Log Pseudo-likelihood -16,651 -16,957 16,595
Number of Observations: 42,220 42,220 42,220 Note: Noise parameters are similar to those in Table 5. Age-adjusted exposure to the Korean War was divided by 10,000 for computational convenience. Standard errors are clustered at the province by cohort level. Robust standard errors are reported in parentheses. *** indicates significance at the 1% level, ** indicates significance at the 5% level, and * indicates significance at the 10% level.
8
Table 7: Maximum Likelihood Estimations of Risk Parameter and Noise Parameter (Later Childhood Exposure)
Note: Standard errors are clustered at the province by cohort level. Robust standard errors are reported in parentheses. *** indicates significance at the 1% level, ** indicates significance at the 5% level, and * indicates significance at the 10% level.
(1) (2) (3)
0.538*** 0.483*** 0.484***
(0.057) (0.086) (0.086)
-0.035 -0.023 -0.055
(0.051) (0.049) (0.053)
0.004
(0.025)
0.112
(0.113)
-0.113*** -0.120*** -0.121***
(0.029) (0.031) (0.031)
0.003** 0.003** 0.003**
(0.001) (0.002) (0.002)
0.030 0.033
(0.034) (0.035)
0.051 0.051
(0.047) (0.048)
0.048 0.045
(0.051) (0.051)
-0.009 -0.012
(0.040) (0.038)
(1) (2) (3)
0.265*** 0.341*** 0.264***
(0.049) (0.036) (0.049)
0.094*** 0.104*** 0.095***
(0.021) (0.019) (0.021)
-0.002*** -0.003*** -0.002***
(0.001) (0.001) (0.001)
0.054** 0.053**
(0.022) (0.021)
0.054** 0.054**
(0.026) (0.026)
-0.001 0.000
(0.028) (0.028)
0.023 0.024
(0.031) (0.032)
Wald Test Statistics 17.55*** 19.72*** 20.37***
Log Pseudo-likelihood -13,736 -13,702 -13,699
Number of Observations 35,235 35,235 35,235
Annual Income (in million KRW)
Constant
Male
Age
High School Graduates
College Graduates
Married
Annual Income (in million KRW)
Constant
Later Childhood Exposure
Risky Area
Risky Area X War
Male
Age
High School Graduates
College Graduates
Married

9
Table 8: Maximum Likelihood Estimations of the Risk Parameter at Different Ages
Note: We only report war-exposure related coefficients in this Table. All other results are similar to the results in Table 6. Standard errors are clustered at the province by cohort level. Robust standard deviations are reported in squared brackets and standard errors are reported in parentheses. *** indicates significance at the 1% level, ** indicates significance at the 5% level, and * indicates significance at the 10% level.
(1) (2) (3) (4) (5) (6) (7) (8) (9)
0.048 0.060
(0.055) (0.064)
-0.107 -0.099
(0.089) (0.090)
0.029 0.025
(0.044) (0.072)
0.174** 0.166**
(0.068) (0.070)
0.027 0.000
(0.048) (0.107)
0.023 0.023
(0.091) (0.091)
-0.052 -0.094
(0.064) (0.143)
0.093 0.085
(0.132) (0.133)
0.034 -0.061
(0.074) (0.230)
-0.210 -0.203
(0.152) (0.150)
0.061
(0.051)
-0.075
(0.085)
0.014
(0.052)
0.166**
(0.081)
-0.013
(0.042)
0.195***
(0.073)
0.018 0.002 0.009 0.007 0.015 0.016 0.004 0.003 0.010
(0.026) (0.026) (0.026) (0.025) (0.025) (0.026) (0.026) (0.026) (0.029)
Wald Test Statistics 21.59*** 34.43*** 21.08*** 20.24*** 20.23*** 21.12*** 27.81*** 29.43*** 41.68***
Log Pseudo-likelihood -13,699 -13,694 -13,700 -13,700 -13,698 -13,699 -13,697 -13,697 -13,682
Number of Observations 35,235 35,235 35,235 35,235 35,235 35,235 35,235 35,235 35,235
Exposure to the Korean Warat Age 0–3
Risky Area
Risky Area X Exposure to theKorean War at Age 0–3
Exposure to the Korean Warat Age 4–8
Risky Area X Exposure to theKorean War at Age 4–8
Risky Area X Exposure to theKorean War at Age 23–31
Exposure to the Korean Warat Age 0–4
Risky Area X Exposure to theKorean War at Age 0–4
Exposure to the Korean Warat Age 4–7
Risky Area X Exposure to theKorean War at Age 4–7
Exposure to the Korean Warat Age 9–15
Risky Area X Exposure to theKorean War at Age 9–15
Exposure to the Korean Warat Age 16–22
Risky Area X Exposure to theKorean War at Age 16–22
Exposure to the Korean Warat Age 23–31
Exposure to the Korean Warat Age 6–9
Risky Area X Exposure to theKorean War at Age 6–9

10
Table 9: Impact of Early Childhood Exposure to Civil War on Risk-Averse Response
Note: We clustered the analysis by country. The probability weight is adjusted for survey year and country used. The dependent variable is the indicator for the two highest responses (5 and 6: “Not Like Me” and “Not at All Like Me”) to the question “Adventure and taking risks are important to this person.” Standard deviations are reported in squared brackets and standard errors are reported in parentheses. Countries that experienced major civil wars after 1937 include Bulgaria, China, Cyprus, Ethiopia, Finland, France, Germany, the UK, Indonesia, Iran, Japan, Malaysia, Morocco, the Netherlands, Norway, Peru, Romania, Russia, Rwanda, South Korea, Spain, Thailand, Turkey, Ukraine, and Vietnam. *** indicates significance at the 1% level, ** indicates significance at the 5% level, and * indicates significance at the 10% level.
SampleMean
(1) (2)SampleMean
(3) (4)
Age38.89
[13.92]0.006***(0.002)
0.007***(0.002)
38.60[13.90]
0.005**(0.002)
0.005**(0.002)
Age Squared1,706.63
[1,158.23]-0.00001(0.00002)
-0.00001(0.00002)
1,683.16[1,158.23]
-0.00001(0.00003)
-0.00001(0.00003)
Male0.48
[0.50]-0.112***
(0.009)-0.112***
(0.009)0.49
[0.50]-0.112***
(0.013)-0.112***
(0.013)
High School Graduate0.19
[0.40]0.003
(0.009)0.003
(0.009)0.20
[0.40]-0.009(0.012)
-0.010(0.012)
College Degree0.46
[0.50]-0.019**(0.007)
-0.020**(0.007)
0.45[0.50]
-0.026**(0.010)
-0.027**(0.010)
Married0.63
[0.48]0.049***(0.008)
0.050***(0.008)
0.65[0.48]
0.047***(0.009)
0.048***(0.009)
Monthly Income Scale (10 Scales ofIncome Specific to Each Country)
4.78[2.27]
-0.014***(0.002)
-0.014***(0.002)
4.83[2.24]
-0.015***(0.003)
-0.015***(0.003)
Early Childhood Exposure0.07
[0.25]0.039**(0.017)
0.035**(0.016)
0.13[0.34]
0.033**(0.016)
0.029*(0.016)
Older Than Early Childhood Exposure0.11
[0.31]-0.029(0.022)
0.22[0.41]
-0.037(0.023)
Indicator for the Two HighestResponses to Risk-Related WVSQuestion
0.41[0.49]
0.40[0.49]
Survey Year Dummy Yes Yes Yes Yes
Country Dummy Yes Yes Yes Yes
R2 0.124 0.124 0.121 0.121
Number of Observations: 58,706 58,706 29,465 29,465
All CountriesCountries that Experienced Major Civil
War after 1937

11
Table 10: Impact of Early Childhood Exposure to Civil War on Various Attitudes
Feeling HappyImportant to
Save No Criminal as
Neighbor
Early Childhood Exposure 0.0005 (0.008)
0.032*** (0.011)
-0.005 (0.012)
Older Than Early Childhood Exposure 0.0005 (0.011)
-0.003 (0.015)
-0.060*** (0.018)
Adjusted R2 0.131 0.080 0.325
Number of Observations: 194,792 194,792 164,339
Cannot Trust
People
Willing to Fight for Country
There is God
Early Childhood Exposure 0.002
(0.009) 0.010
(0.016) 0.009
(0.016)
Older Than Early Childhood Exposure -0.012 (0.012)
-0.022 (0.046)
-0.033 (0.037)
Adjusted R2 0.095 0.134 0.602
Number of Observations: 194,792 180,544 150,931 Note: We only report coefficients related to war-exposure in this Table from the full-specification model similar to the analysis reported in model (2) of Table 10. We clustered analyses by country. Probability weight is adjusted for survey year and country. The dependent variables are the indicators for the two negative responses (3 and 4: “Not Very Happy” and “Not at All Happy”) to the statement “Feeling of happiness”; the indicator for the response “important” to the statement “Important childhood qualities: thrift saving money and things”; the indicator for positive response to the statement “Want to avoid as neighbors: people with a criminal record”; the indicator for “cannot be too careful” to the statement “Most people can be trusted”; the indicator for “yes” to the statement “Willingness to fight for one’s country”; and the indicator for “yes” to the statement “Believe in God.” Standard deviations are reported in squared brackets and standard errors are reported in parentheses. *** indicates significance at the 1% level, ** indicates significance at the 5% level, and * indicates significance at the 10% level.

12
NOT FOR PUBLICATION
(Online Appendix)

13
APPENDIX A: CIVIL CONFLICTS WITH WAR-LEVEL INTENSITY AND EXCEEDING 1,000 BATTLE-RELATED DEATHS AT THE ONSET FROM UCDP/PRIO DATASE T, SPANISH CIVIL
WAR AND WORLD WAR II
Conflict Inclusion in the
Analysis Notes
Chinese Civil War Included
(1946–1949) Over 1.2 million casualties
Ethiopian Civil War Included
(1974–1991 & 1998–2000)
Civil conflict between Marxist Derg against Emperor Haile Selassie
Indonesian Civil War Included
(1945–1949) Indonesian National Revolution against the Dutch government, over 100,000 civilian casualties
Iraq-Iran War Included
(1980–1982) Most battles occurred in the period 1980–1982
Korean War Included
(1950–1953) Major civil war between North and South Korea
Papua conflict Included (1981)
More than 13,000 killed in the central highlands
Peruvian Conflict Included
(1983–1985) Almost 70,000 died, sporadic guerrilla tactics most aggravated between 1983–1985
Rwandan Civil War Included
(1990–1994) Conflict between the government and the rebel Rwandan Patriotic Front
Spanish Civil War Included
(1936–1939) Approximately 500,000 killed
Turkish invasion of Cyprus Included (1974)
Over one-fourth of the population of Cyprus was expelled from the occupied Northern part of the Island
Vietnam War Included
(1965–1973) Civilian deaths of up to 2 million
World War II Included
(1939–1945)
Bulgaria (41, 44); China (39–45); Finland (40, 44); France (40, 44); Germany (44); the UK (40–42); Indonesia (41–44); Japan (45); Malaysia (41–44); Morocco (41–42); the Netherlands (40, 44); Norway (40, 44); Romania (41, 44); Russia (41–44); Thailand (41–44); Ukraine (41, 44); Vietnam (41–44)
Georgian Civil War Excluded
(1992–1993) Limited to only a part of the country
India-Pakistan War Excluded
(1947–1948) Limited to only a part of the country
Kurdish-Turkish Conflict Excluded
(1997–1998) Limited to only a part of the country
Indonesian Achin rebellion Excluded
(1953–1957) Limited to only a part of the country (Scattered guerrilla fighting)
The Malayan Emergency Excluded
(1948–1960) Limited to only a part of the country (Scattered guerrilla fighting)

14
Conflict Inclusion in the
Analysis Notes
India-Pakistan War Excluded
(1971) Limited to only a part of the country/Too short (14 days)
Indonesian Invasion of Easter Timor
Excluded (1975)
Not the country in WVS (Casualties mostly in East Timor, not Indonesia)
Congo War Excluded
(1999–2010) Not the country in WVS (Congo wars mainly in Zaire, not in Rwanda)
Arab-Israeli War Excluded
(1957–1958) Not included in WVS (Jordanian involvement minimal)
Cambodian-Vietnamese War Excluded
(1979–1980) Not included in WVS (Most civilian casualties in Cambodia)
Bosnian War Excluded
(1992–1995) Not included in WVS (War in Bosnia not in Serbia)
Chechnyan Conflict Excluded
(1995) Not included in WVS (War in Chechnya not in Russia)
Croatian War of Independence Excluded
(1991–1995) Not included in WVS (War in Croatia not in Serbia)
Kosovo War Excluded
(1998–1999) Not included in WVS (War in Kosovo not in Serbia)
South African Border War Excluded
(1978) Not included in WVS (War in Namibia and Angola not in South Africa)
Western Sahara War Excluded
(1977–1978) Not included in WVS (War in West Sahara not in Morocco)
Sino-Indian War Excluded
(1962) Too short (one month)
Sino-Vietnamese War Excluded
(1979) Too short (one month)
Kargil War Excluded
(1999) Too short (three months)