the lower jordan basin - université de...
TRANSCRIPT

The Volta River basin
Comprehensive Assessment of Water Management in AgricultureComparative study on river basin development and management
Boubacar BARRYEmmanuel OBUOBIE
Marc ANDREINIWinston ANDAH
Mathilde PLUQUET
January, 2005
Draft
List of Tables
PagesTable 1: Distribution of the Basin in the Six Riparian Countries.Table 2: Average annual rainfall and evapotranspiration in the riparian countries of the Volta Basin
Table 3: Rainfall and length of growing seasons in the Volta Basin of Ghana
Table 4: Hydrometeorology Mean Annual (1961 – 1990) in the Volta Basin of Ghana
Table 5: Temperature and Relative Humidity in the Volta Basin of Ghana
Table 6: Demographic characteristics of the Volta Basin countries (2001)
Table 7: Population in the Volta River basinTable 8: Population statistics in riparian countries (2004)Table 9: Education and literacy in the Volta Basin countries Table 10: Agricultural labour force in the riparian countries of the Volta River Basin Table 11: Structure of Economic Output at the National LevelTable 12: Macroeconomic indicators in the Volta Basin countries (2001)Table13: Human development indicators in the Volta basin countries (1998)Table14: Poverty and income distribution in the Volta Basin countries (latest year available)Table 15: External Debt of the Riparian Countries (1998)Table 16: Area and length of main tributaries in the Volta River Basin in GhanaTable 17: Some Important Relief CharacteristicsTable 18: Identified Soil Groups in the Volta River Basin of GhanaTable 19: Characteristics of the ZonesTable 20: Major landuse types in the Volta basin of Burkina (hectares)Table 21: Erosion Hazards of the Volta Basin in GhanaTable 22: Rate of Occupation of Cultivable Land in the Basin in Togo (1,708,800 ha)Table 23: Evolution of Various Vegetation Formations in Togo (1979-1991)Table 24: Production Levels of Selected Crops by Regions in the Volta Basin in Ghana (Tones)Table 25: Cereal Production in the Mopti Region of Mali (Tones)Table 26 : Crop Production in Côte d’Ivoire (1996)Table 27: Production trends in Burkina Faso (x1000 tons)
Table 28: Population of Major Livestock in the Volta Basin in Ghana
Table 29: Population of Major Livestock in TogoTable 30: Annual Fish Production in GhanaTable 31: Surface Water Resources of the Volta River in GhanaTable 32: Surface water flows of the Black Volta in GhanaTable 33: Surface Water flows of the Lower Volta of GhanaTable 34: Sub-basins of the Main Volta River in GhanaTable 35: Surface water resources from within the Lower Volta Basin in GhanaTable 36: Potential Surface Water Resources of the Volta Basin in Burkina FasoTable 37: Potential of Surface Water Resources of the Nakambe BasinTable 38: Potential of surface Water Resources of the Mouhoun Basin in Burkina FasoTable 39: Hydrological Characteristics of the Groundwater aquifers in the Volta Basin of GhanaTable 40: Summary of borehole yields of hydrologic provinces and sub provincesTable 41: Minimum Recharge and Replenishable Groundwater CapacitiesTable 42: Chemical analysis of water samples in the geologic formations of Ghana (all values except pH are in mg/l)
2

Table 43: Groundwater potentiality of Burkina FasoTable 44: Average Rate of well-sinking success and discharge by regionTable 45: Proportion of Volta Basin in Agro-ecological zones of GhanaTable 46: Access to landTable 47: Proportion of area allocated to major crops species and yield per hectare in the GSTable 48: Cropping patterns in the Guinea Savannah zoneTable 49: Percentage of use of each technologyTable 50: Percentage of farmers practicing cropping system in WenchiTable 51: Percentage of farmers keeping livestock, 1992 Table 52: Estimated Average National wholesale prices of crops/tonne (1998)Table 53: Sequence of planting in the Techiman District of GhanaTable 54: Types of farming systems in the Techiman District of GhanaTable 55: Estimated average national wholesale prices of crops/tonne (1998)Table 56: Types of farming systems in the Atwima District of Ghana
Table 57: Estimated Average National wholesale prices of crops/tonne (1998)Table 58: Ministries and Departments for managing water and Land resources in BeninTable 59: Departments for Managing Land and Water Resources in Burkina FasoTable 60: Ministries and Their Responsibilities in Côte d’IvoireTable 61: Ministries for the Management and Use of Land Resources in Côte d’IvoireTable 62: Ministries and Departments Responsible for Water Resources Development and Utilization in GhanaTable 63: Ministries, Departments, and Institutions Responsible for the Management of Water in TogoTable 64: Bilateral Cooperation among Riparian CountriesTable 65: Dates of Ratification of Major International Environmental ConventionsTable 66: Water demand during year 2000 (km3)Table 67: Projected water demand in Burkina Faso (km3)
Table 68: Large dams in the Volta Basin of Burkina Faso
Table 69: Information on Dams in the Volta Basin of Cote d’IvoireTable70: Information on Dams in the Volta Basin of TogoTable 71: Domestic/Industrial Water Demand of the Volta River Basin (x 106m3)Table 72: Irrigation Water Demand of the Volta River Basin (x 106m3)Table 73: Water Demand for Livestock of the Volta River Basin (x 106 m3)Table 74: Total Consumptive Water Demand of the Volta River Basin (x 106 m3)Table 75: Dependency by region on groundwater supply for domestic use (1984)Table 76: Categories of infected people according to Farooq, 1963 Table 77: Annual population growth rate by sub-basins, 1960-200
3

List of FiguresPages
Figure 1 : NOAA-AVHRR satellite image composition LANDSAT 1999-2000 image compositionFigure 2a: Declining patterns in rainfall in Burkina Faso.Figure 2b: Changes in Climatic zones of the Volta Basin of BurkinaFigure 2c: Annual rainfall at several locations in the Volta Basin of Burkina FasoFigure 3: Distribution of rainfall in the Volta Basin in 1990Figure 4: Evaporation in several locations within the Volta Basin in Burkina FasoFigure 5: Spatial distribution of potential evapotranspiration in the Volta BasinFigure 6: Spatial distribution of temperature in the Volta BasinFigure 7: Spatial distribution of population density in the Volta River BasinFigure 8: Distribution of population density in Ghana Figure 9: Pyramidal ages in GhanaFigure 10: Distribution of soil types in the Volta basin of Ghana and BurkinaFigure 11: Map of Geology of the Volta River Basin.Figure 12: Land cover Map of the Volta River Basin.Figure 13: Hydrographic network of Burkina FasoFigure 14: Location of reservoirs in the Volta BasinFigure 15a: Water balance of the Mohoun River BasinFigure 15b: Water balance of the Nankambe River BasinFigure 16: Hydrogeological provinces and river systems of Ghana Figure 17: Hydrogeological subprovinces of the Basement Complex Figure 18: Hydrogeological subprovinces of the Voltaian System Figure 19: Distribution of borehole yield in Ghana (Water Resources Research Institute 1994)Figure 20: Regional distribution of borehole and annual abstraction Figure 21: Map showing discharge of wells across Burkina FasoFigure 22: Distribution of Piezometric heads of different wells in Burkina FasoFigure 23: Spatial distribution of boreholes in Burkina FasoFigure 24: Map showing the agro-ecological zones of Ghana and Burkina FasoFigure 26: Location of Dams in the Volta BasinFigure 27: Regional distribution of groundwater use among sectorsFigure 28: Water Weed EncroachmentFigure 29: Sandbar on the Volta River mouthFigure 30: Annual percent population growth rates by sub-basins, 1960-2000
Figure 31: Average cropped area by sub-basins, 1992 & 2000
4

I. INTRODUCTION
I.1 The Volta River Basin
The Volta River Basin is located in West Africa and covers an estimated area of 400,000 km 2. The Volta basin stretches from approximately latitude 5o 30 N in Ghana to 14o 30 N in Mali. The widest stretch is from approximately longitude 5o 30 W to 2o 00 E but the basin becomes more narrow towards the coast of the Gulf of Guinea. The Volta basin is spread over six West African countries (43% in Burkina Faso, 42% in Ghana, and 15% in Togo, Benin, Cote d’Ivoire and Mali).
The Akosombo dam is by fare the most significant structure built in the basin and the Volta Lake is the largest man-made lake in the World. The Volta Lake reservoir itself has a surface area of about 8,500 km2, an average depth of about 18.8m and a shoreline of about 5,500 km. The deepest portions of the lake are about 90m. The total volume of water in the reservoir at full supply level about 84.73m is approximately 150 billion m3. The seasonal rise and fall is about 2.0-6.0m and the areas covered by seasonal fluctuations are about 100,000ha. The Kpong Headpond, i.e. the area between the Akosombo dam and the Kpong Dam, has a surface area of 12 km2 with a total volume of about 190 km3. The average headpong elevation is about 14.7m. The lower Volta area, i.e. the area between the Kpong Dam at Akuse and the estuary at Ada, is about 68,600km2. Water available from the reservoirs is primarily used for hydro-energy production, other significant uses being transportation, fishery, water supply (commercial and domestic purposes), tourism and irrigation
The Akosombo dam is of strategic importance for the economy of Ghana. It generates 80% of the power produced in the country. The primary purpose of the project was to supply cheap electricity to smelt aluminum and the secondary one, the development of the country. Contrary to many hydropower dams that are generally build upstream, the Akosombo dam is built closed to the ocean because of the flat relief of the basin and the difficulty to find potential locations. Construction of the Volta Lake led to the resettlement of about 80,000 people from several hundred villages to fifty newly built townships (more than 1% of Ghana’s population at the time). In addition to the resettlement of the river communities, damming affected local health, agriculture, fishing, and navigation.
Population in the basin lives generally away from the main water courses because of water borne diseases such as Onchocerciais and Schistosomiasis which are prevalent in the region. The public health related problems were those of a switch between two disease episodes – i.e. the one that thrives well in (lotic) riverine system and the other which thrives well in (benthic) riverine systems. It was a switch between onchocerciasis (river blindness) and urinary schistosomiasis. Onchocerciasis is transmitted by the black-fly (Simuluim damnosum) which breeds solely in fast flowing waters. Urinary schistosomiasis, commonly called bilharziasis, is a chronic snail-borne infection, which frequently occurs in water development schemes in tropical countries. The disease was endemic in Ghana long before the creation of the Volta Lake; but endemicity was
5

low along the Volta River. Prevalence in school children was 5% according to an epidemiological survey made in 1960-61 before the lake was formed.
The creation of the lake and the consequent biological explosion of aquatic weeds associated with the aquatic snail, the “intermediate host,” together with mass migration into the fishing communities above the head pond area from regions in which the disease was endemic led to a great increase in the prevalence of the disease in many localities around the lake. In the other riparian countries of the basin, small and larges dams have been built by governments, NGOs and local people after the severe droughts that occurred in the 1970s and 1980s to secure food production. In the Nakambe sub-basin (Burkina Faso) alone more that 600 small dams have been built most of them during that period. More recently power generating dams have also been built in some of the Volta main tributaries Bagre and Kompienga (Burkina) with generating capacities of 41.5 GWH and 31.0 GWH respectively and on the Oti River, at the border between Togo and Benin within a power generating capacity of 35GWH.
Figure 1 : NOAA-AVHRR satellite image composition ANDSAT 1999-2000 image composition
The distribution of the area of the basin among the six riparian countries is shown in the following Table 1.
6

Table 1: Distribution of the Basin in the Six Riparian Countries.
Country Area of Volta River Basin (km2) % of Basin % of Country in the basin
Benin 17,098 4.10 15.2Burkina Faso 178,000 42.65 63.0Côte d’Ivoire 12,500 2.99 3.9
Mali 15,392 3.69 1.2Togo 26,700 6.40 47.3Ghana 167,692 40.18 70.0Total 417,382* 100%
Figures for area of Volta River Basin are from respective National Reports. The areas recorded from the country reports are quite similar to that quoted from Moniod, et al (1977).
As indicates in Table 1, the relative proportion of the basin area found within a country does not necessarily reflect the relative importance of that part of the basin in that country. While a country may only have a small percentage of the total basin within its borders, as in the case of Togo, this area might comprise a significant proportion of the entire country. Additionally, the area of the country within the basin might hold an abundance of natural resources with respect to the entire country, such as in the case of Mali, Burkina Faso, Ghana and Togo.
I.2 Methodology and presentation of the study
This report is a compilation of various documents collected in Burkina Faso and Ghana over the past year. Institutions and many people involved in research and development projects in the Volta Basin in both countries have also been visited during the same period. Some of the information especially socio-economic data presented in this report are country specific. However, because the basin covers 63% of Burkina, and almost 50% of Ghana, it can be estimated that such information are also valid for the basin. A GIS database of the Volta Basin has been created and is now available along with a collection of reports.
7

II. THE VOLTA RIVER BASIN: HUMAN AND PHYSICAL SETTING
II.1 Climatic features
The climate of the region is controlled by two air masses: the North-East Trade Winds and the South-West Trade Winds.
The North-East Trade Winds, or the Harmattan, blowing from the interior of the continent, are dry. In contrast, the South-West Trade Winds, or the monsoons, are moist since they blow over the seas. The inter-phase of these two air masses is called the Inter-tropical Convergence Zone (ITCZ). There is a lot of convective activity in the region of the ITCZ, hence the region is associated with a considerable amount of rainfall. The ITCZ moves northwards and southwards across the basin from about March to October when rainfall is received in the region.
II.1.1 Distribution of Rainfall
Three types of climatic zones can be identified in the region: the humid south with two distinct rainy seasons; the tropical transition zone with two seasons of rainfall very close to each other; and, the tropical climate, north of lat 9° N, with one rainfall season that peaks in August. Average annual rainfall varies across the basin from approximately 1600 mm in the southeastern section of the basin in Ghana, to about 360 mm in the northern part of Burkina Faso. Figure 3 shows the spatial distribution of rainfall in the Volta Basin and Table 4 shows the average annual rainfall and evapotranspiration in the riparian countries.
There have been a number of changes in the precipitation patterns in some sub-catchments in the basin, as rainfall and run-off reductions have been evident since the 1970s (Opoku-Ankomah, 2000). Some areas that used to have bi-modal type of rainfall have only one mode as the second minor season has become very weak or non-existent. This situation means that rainfed agriculture can only be carried out once instead of twice a year.
In Burkina Faso, the Volta basin stretches into three climatic zones:
1. the Sudan zone with an annual rainfall between 900 and 1,200mm distributed on average over 74 rainy days. It is located below the 11o 30’N parallel
2. the Sudano-Sahelian zone with an annual rainfall between 600 and 900mm on average
8

over 43 rainy days, located between the 11o 30’N and 14oN parallels3. the Sahelian zone located above the 14oN parallel with a mean annual rainfall between
300 and 600mm over 38 rainy days.
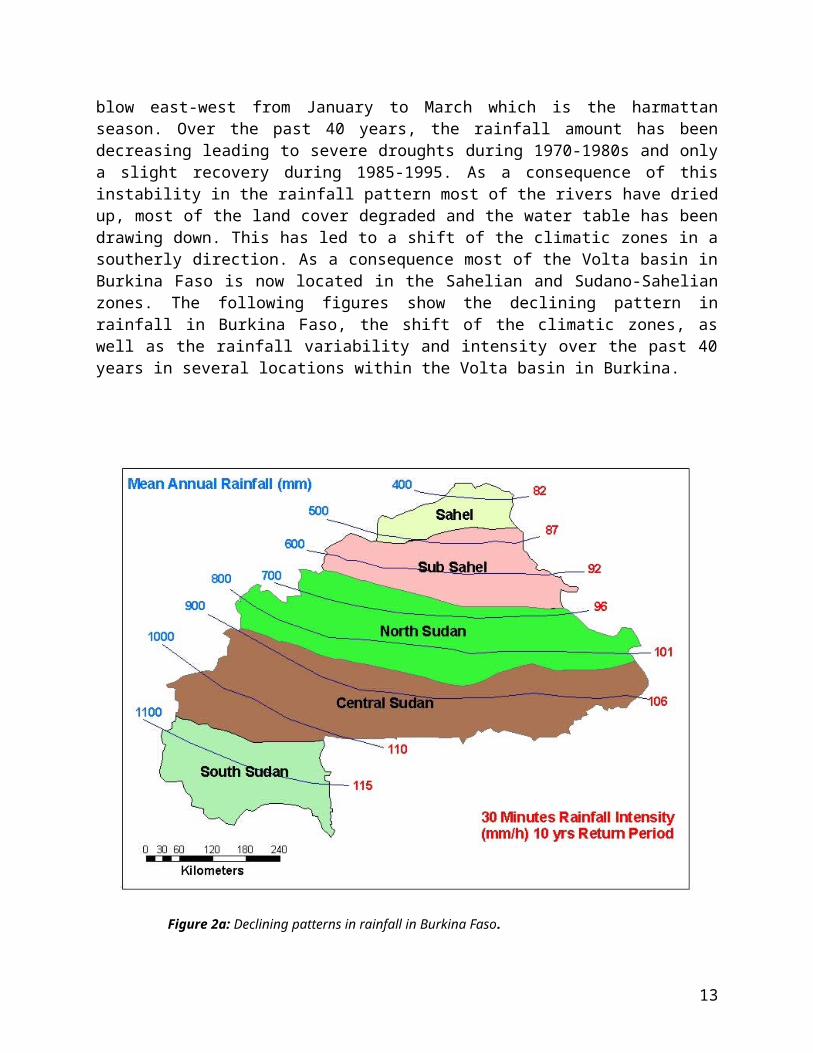
In the Sahelian zone, the rainy season lasts for about 3 months. It lasts 4 to 5 months in the Sudano-Sahelian zone and 6 to 7 months in the southern part of the Sudan zone. Dominant winds blow east-west from January to March which is the harmattan season. Over the past 40 years, the rainfall amount has been decreasing leading to severe droughts during 1970-1980s and only a slight recovery during 1985-1995. As a consequence of this instability in the rainfall pattern most of the rivers have dried up, most of the land cover degraded and the water table has been drawing down. This has led to a shift of the climatic zones in a southerly direction. As a consequence most of the Volta basin in Burkina Faso is now located in the Sahelian and Sudano-Sahelian zones. The following figures show the declining pattern in rainfall in Burkina Faso, the shift of the climatic zones, as well as the rainfall variability and intensity over the past 40 years in several locations within the Volta basin in Burkina.
Figure 2a: Declining patterns in rainfall in Burkina Faso.
9

LEO
Dori
GAOUA
Tougan
DIAPAGA
Dedougou
TENKODOGO
OUAHIGOUYA
OUAGADOUGOU
FADA NGOURMA
BOBO-DIOULASSO
LEO
Dori
GAOUA
Tougan
DIAPAGA
Dedougou
TENKODOGO
OUAHIGOUYA
OUAGADOUGOU
FADA NGOURMA
BOBO-DIOULASSO
Sahel
Sudan
Sudan-Sahel
Volta Basin
Sahel
Sudan
Sudan-Sahel
Volta Basin
´
´
COTE D'IVOIRE
MALINIGER
BENINTOGOGHANA
COTE D'IVOIRE
MALI
NIGER
BENINTOGOGHANA
Climatic zones of Burkina (1951-1970)
Climatic zones of Burkina (1971-2000)
Figure 2b: Changes in Climatic zones of the Volta Basin of Burkina
10

11

Figure 2c: Annual rainfalls at several location in the Volta Basin of Burkina Faso
12
1000 - 1100
900 - 1000
1200 - 1300
1100 - 1200
800 - 900
1600 - 17001100 - 12001800 - 1900
2000- 2100
1600 - 1700
1400 - 1500
1200 - 1300
1000 - 1100
600 - 700
Ghana
Mali
Burkina Faso
Benin
Ivory Coast
Niger
Togo
Nigeria
900800
700600
500
1100
1000
400
360
LEO
GAOUA
Tougan
DIAPAGA
Dedougou
TENKODOGO
OUAHIGOUYA
BOBO-DIOULASSO
Gulf ofGuinea
I
Isohyetes 1990Rainfall RangesVolta Basin
0 125 250 375 50062.5Kilometers
Figure 3: Distribution of rainfall in the Volta Basin in 1990
13
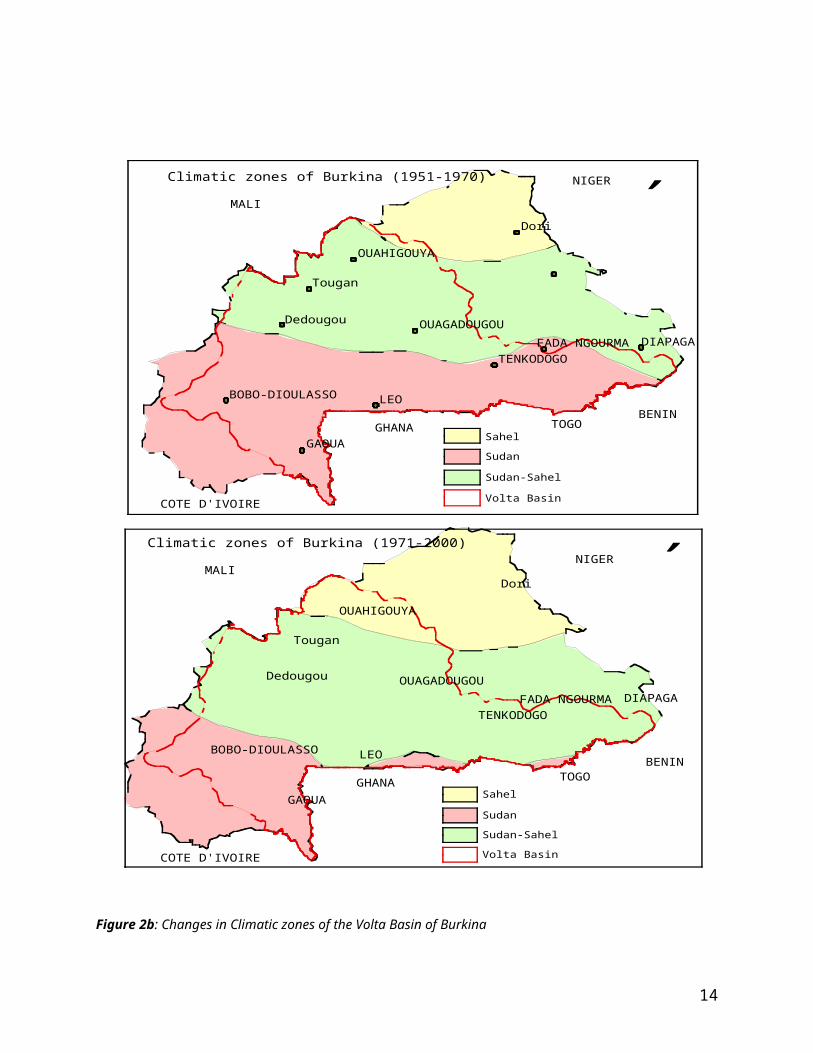
Table 2: Average annual rainfall and evapotranspiration in the riparian countries of the Volta BasinRiparian Country
River Area of the Volta Basin km2
Upstream Riparian Countries
Average Annual Rainfall (mm)
Average Annual Evaporation (mm)
Ghana Volta 165,830 Burkina Faso, Mali, Togo, Cote d’Ivoire, Benin
1320 1415
Cote D’Ivoire
Volta 9,890 Burkin Faso, Mali
1358 1486
Togo Volta 25,545 Burkina Faso, Benin
1305 1697
Burkina Faso
Volta 171,105 Mali 950 2130
Benin Volta 13,590 Burkina Faso, Togo
1294 1400
Mali Volta 12,430 None 685 3015
In terms of rainfall-runoff, it has been estimated that 340 km3 of rain must fall on the catchment before run-off occurs at significant levels. Once this threshold has been reached, approximately half of the precipitation becomes run-off. This indicates that only small changes in rainfall could have dramatic effects on run-off rates. Although rainfall decreased by only 5% from 1936 to 1998, run-off decreased by 14% (Andreini, 2000).
Simulations of run-off using GCM-based climate scenarios developed by Minia (1998) showed 15.8% and 37% reduction in run-off of the White Volta Basin for the years 2020 and 2050, respectively (Opoku-Ankomah, 2000). These projections showed that projects whose design was based on historical records without considering climate change, such as the hydropower dam at Akosombo, could be vulnerable
Table 3: Rainfall and length of growing seasons in the Volta Basin of Ghana
Agro-ecologicalZone
Mean annualRain (mm)
Growing Period (Days)Major season Minor season
Rain ForestDeciduous ForestTransitional CoastalGuinea SavannaSudan Savanna
2,2001,5001,300800
1,1001,000
150 - 160150 - 160200 - 220100 - 110180 - 200150 - 160
100906050--
II.1.2 Distribution of Evaporation and Evapotranspiration (ETP) compared to rainfall
14

Evaporation in the basin is relatively high especially in the Sahelian zone. In Burkina (43% of the basin), the lowest record is about 1,900mm/yr.
In the Volta Basin of Ghana, the Potential evapotranspiration varies from a minimum of 1,450 mm per annum in the Black Volta sub-basin to a maximum of 1,968 mm per annum in the White Volta sub-basin. Table 5 shows the range of potential evapotranspiration as well as other hydrometeorological parameters in each sub-basin of the Volta Basin in Ghana. Pan evaporation is the same (2540 mm/an) in all the sub-basins except the Lower Basin.
Table 4: Hydrometeorology Mean Annual (1961 – 1990) in the Volta Basin of GhanaVolta Basin System
Rainfall(mm)
Coeff. Of Var. Pan Evaporation (mm)
Potential Evapotranspiration(mm)
Black 1023.3 – 1348.0 0.17 – 0.23 2540 1450.0 – 1800.0White 929.7 – 1054.2 0.16 – 0.20 2540 1650.0 – 1968.0Oti 1050.0 – 1500.0 0.18 – 0.20 2540 1550.0 – 1850.0Lower 876.3 – 1565.0 0.17 – 0.35 1778 1450.0 – 1800.0
In Burkina Faso, average annual pan evaporation values are generally very high and at the same time progressively increase from south to north. The minimum annual value in the Volta basin is about 1900mm. Average levels recorded in the basin are 2334 mm in the north (Ouahigouya), 2120 mm in the centre (Ouagadougou) and 1932 mm in the south (Gaoua) (Monido et al.,1977). Figure 6 shows average pan evaporation values at several locations within the Volta River basin.
Evaporation in the Burkina part of the Vota Basin (mm)
2334
2120 2044 2003 2002 1932
Ouahigouya Ouaga Dedougou Bobo Leo Gaoua
Figure 4 : Evaporation in several locations within the Volta Basin in Burkina Faso
15
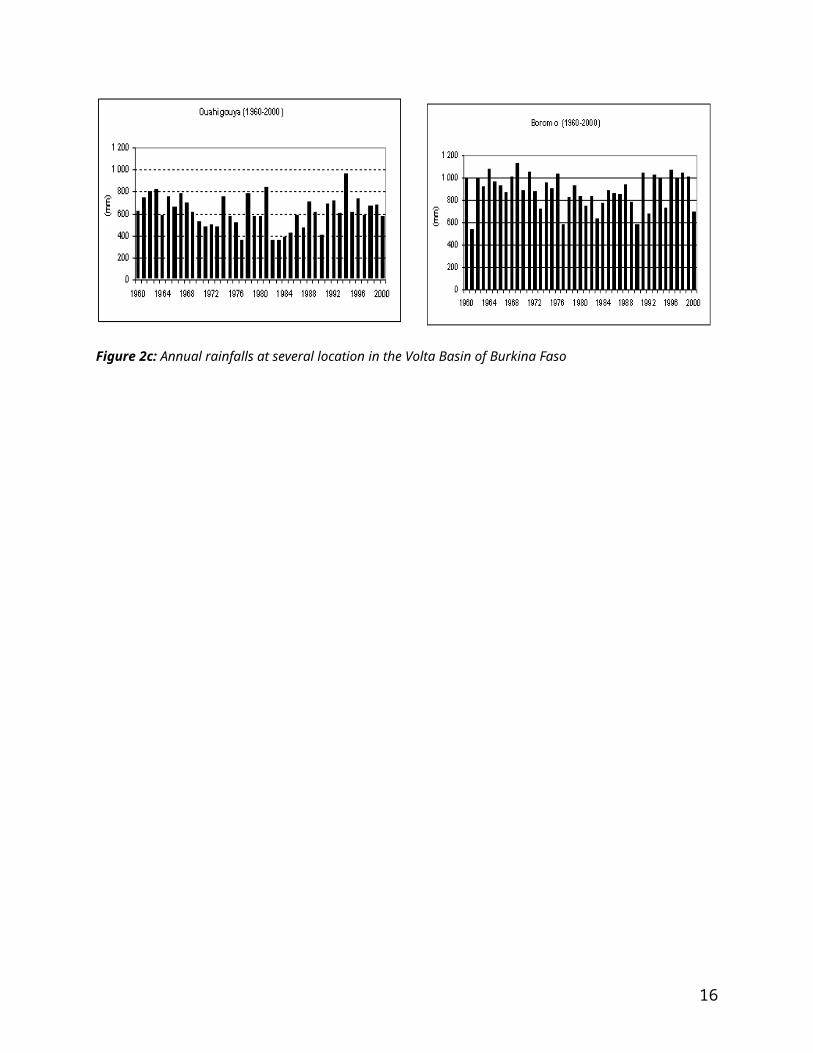
Figure 4 shows the distribution of potential evapotranspiration in Ghana and Burkina Faso (about 85 % of the Volta Basin). Generally, ETo decreases downstream of the basin.
16

Bobo-Dioulasso: 2003
Gaoua: 1932
Leo: 2002
Dedougou: 2044 Ouagadougou: 2120
Ouahigouya: 2334
Ghana
Mali
Benin
Ivory Coast
Niger
Togo
Nigeria
1600-1650
1450-1500
1550-1600
1500-1550
1350-1400
1650-1700
1400-1450
1700-1750
2000-2050
1300-1350
1750-18001850-1900
2050-2100
1600-16501600-1650
1700-1750
1300-1350
1750-1800
GulfOf
Guinea
Volta Basin
ETP Ranges
Towns with Ave. ETP values0 100 200 300 40050
Kilometers
Figure 5: Spatial distribution of potential evapotranspiration in the Volta Basin
17

II.1.3 Temperature and humidity
The annual mean temperatures in the Basin vary from about 27° C to 30° C. Daily temperatures can be as high as 32° C - 44° C, however, whereas night temperatures can be as low as 15° C. The humidity varies between 6% and 83% depending on the season and the location. Figure 5 shows the spatial distribution of temperatures in the Volta Basin. Generally, temperatures are higher in the upstream of the basin and decreases downstream
Generally, in Ghana (42 % of the Basin) the mean temperature never falls below 24oC in the country. This is explained by the fact that no part of the country is really far from the equator. The hottest month of the year is March-April and the coolest is August. The southern section of the country is more humid than the north. In the coastal area of Ghana the relative humidity are 95-100% in the morning and about 75% in the afternoon. In the north values can be as low as 20-30% during the Harmatan period and 70-80% during the rainfall period.
In Burkina Faso, the mean temperature in the Sahel zone is always higher than 29oC while in the Sudano-Sahelian zone it lies between 28oC and 29 oC and in the Sudan zone below 28oC. The seasonal variation in temperatures is characterized by four periods: two extremely hot periods and two relatively cool periods. The first hot period is in March-April with average maximum temperatures of 37oC and 41oC in the south, centre and north of the basin respectively, while the average minimum temperatures are 24oC (south), 25oC (centre) and 26oC (north). The second hot period occurs immediately after the rainy season. It is not as hot as the first, with average maximum temperature of 34oC, 36oC and 38oC in the south, centre and north respectively. Minimum temperatures vary between 21oC and 22oC.
The first cool periods occurs in December-February, with average maximum temperatures varying between 33oC and 35oC in January and average minimum temperatures in the order of 14oC (north), 17oC (centre) and 19oC (south). This is the period of the harmattan, a dry dusty wind that is cold at night and hot during the day. The second cool period coincides with the rainy season. During this period, the moisture content of the air is at the highest. The average maximum and minimum temperatures during this cool period are subject to extreme variations due to the irregularity of the rains. These extreme regional and temporal variations, combined with the shortness of the rainy season, are one of the ecological factors that play a key role in limiting crop production and make a major contribution to the degradation of the vegetation cover. Relative humidity can reach a maximum of 80% during the month of August which is the wettest month of the rainy season. There are sometimes heavy falls of dew, especially in the south where levels of between 0.8mm and 1mm have been recorded. Total evaporation in August is generally lower than 100mm. From November to April relative humidity in Burkina is about 50%. Maximum pan evaporation (>400mm) is observed during March-April.
18

Gaoua: 25.6
Bobo-Dioulasso: 27.6
Ouahigouya: 28.4
Dori: 29
Ouagadougou: 28
26 - 27
27 - 28
28 - 29
25 - 26
27 - 28
24 - 25
27 - 2825 - 26
25 - 26
24 - 25
24 - 25
26 - 27
Ghana
Mali
Benin
Ivory Coast
Niger
Togo
Nigeria
Gulf OfGuinea
Temperature Ranges
Volta Basin
Towns with Ave. Annual Temp
0 110 220 330 44055
Kilometers
I
Burkina Faso
Figure 6: Spatial distribution of temperature in the Volta Basin
19

Conditions of temperature and humidity in the Volta basin of Ghana do not differ too much from what prevails generally over the portions of the country within the basin. Table 6 below gives figures of temperature and relative humidity of the different sub-basins of the Volta Basin of Ghana.
Table 5: Temperature and Relative Humidity in the Volta Basin of GhanaVolta Basin System
Temperature (C) Relative Humidity (%)
Black 25.0 – 27.8 59 – 77White 28.0 – 28.6 54 – 68Oti 27.0 – 27.8 62 – 72Lower 23.5 – 28.1 6 – 83
II.2 Human Context
A. Human resources
The geographic distribution of the population within the basin is highly variable with a density ranging from 8 to 104 persons/km2. In areas with high density population one can notice a real pressure on land and water resources (Ghana’s Upper East regions: 104 persons/km2). Figures 7, 8, and 9 show the spatial distribution of population density in the Volta River Basin, Ghana and Burkina Faso respectively. In general, areas with low population density are either national park (Comoe one of the largest West African national parks, in Cote d’Ivoire) or regions where onchocerciasis or river blindness is prevalent (valleys of the Black Volta). Three cities in the basin (Ouagadougou, Bobo Dioulasso and Tamale) can be described as large, each having a population of over one hundred thousand people.
20

Basin Area (sq. km.): 407,093
Average Population Density (people per sq. km.): 43
Number of Large Cities (>100,000 people): 3Water Supply per Person (1995) (m3/person/year): 2,054Figure 7: Spatial distribution of population density in the Volta River Basin
21

Figure 8: Distribution of population density in Ghana
In Ghana the most populated areas are located outside the Volta Basin, except Tamale and the upper regions (Fig 7). The two largest cities of Burkina (Ouagadougou and Bobo-Dioulasso) are located within the basin. The average population density in the Volta basin of Burkina Faso is 29 inhabitants/km2 with strong regional variations. While the high population density (79 inhabitants/km2) on the central plateaux has led to the over exploitation of natural resources and a marked degradation of the environment, the sparsely populated eastern and western regions (10 inhabitants/km2) are attracting number of immigrants. This is causing problems in terms of rational land management and the degradation of natural resources (Evaluation report by “Reseau Agro-Ecologie”, 1977).
Table 6: Demographic characteristics of the Volta Basin countries (2001)
Setting
Tota
l Pop
ulat
ion
(mill
ion)
Estim
ated
Pop
ulat
ion
2005
(mill
ion)
Popu
latio
n gr
owth
Rat
e
(ann
ual %
)
Popu
latio
n de
nsity
(peo
ple
per s
q km
)
Popu
latio
n de
nsity
, Rur
al
2000
(peo
ple
per s
q km
)
Popu
latio
n (%
Rur
al)
Rur
al p
opul
atio
n gr
owth
ra
te (a
nnua
l %)
Popu
latio
n a
ges 0
-14
(% o
f to
tal)
Popu
latio
n a
ges 1
5-64
(%
of to
tal)
Popu
latio
n a
ges 6
5 an
d ab
ove
Benin 6.44 7.12 2.56 58.19 185.70 57.00 1.32 45.85 51.36 2.71Burkina Faso 11.55 12.66 2.38 42.22 247.68 83.13 2.04 47.08 50.14 2.66Côte d’Ivoire 16.41 17.65 2.20 51.60 306.08 55.96 1.70 41.90 55.05 2.54
22

Ghana 19.71 20.91 1.83 86.61 341.99 63.60 1.55 43.06 51.87 4.53Mali 11.09 12.05 2.25 9.09 163.43 69.14 1.37 46.97 49.81 3.00Togo 4.65 5.02 2.40 85.56 120.19 66.08 1.94 43.57 52.58 3.15Data source: WDI (2003); and “..” denotes data not available.
Burkina Faso and Mali have the highest percentage of young population, 0-14 years (47%), while Ghana has the lowest (43%). A major fraction of population falls in working ages 15-64 years, for all countries. The highest percentage of the working age group occurs for Côte d’Ivoire (55%) and for the rest of the riparian countries it varies between 50% and 53%. Figure show a population pyramid of Ghana after the 1999 Population Census
Figure 9: Pyramidal ages in Ghana
Population in the Volta basin is generally rural (64-88 %-see Table 7) and the people depend for their livelihood, to a large extent, on the exploitation of the natural resources which may not be environmentally sustainable in the future. In Burkina Faso which represents 43 % of the total area of the basin, about 78 % of the total population lives in the Volta Basin which plays a vital socio-economic importance for the country. Out of the 45 provinces in the country, 37 are located within the Volta Basin in two sub-basins Mouhoun and Nakambe with population density of respectively 41 and 53 persons/ km2. In Togo, the Volta Basin covers 48 % of the country’s land and is home to 35 % of the population in 2000.
Table 7: Population in the Volta River basinCountry 1990 2000 2010 2020 2025 Growth
Rate (%)
P/km2
Density(2000)
Urban%
Rural%
23

(2000)Benin 382,328 476,775 596,000 746,000 820,000 2.27 43.4 36 64
Burkina Faso 7,014,156 8,874,148 11,227,366 14,204,605 15,997,351 2.38 41.53 22.6 77.4
Côte d’Ivoire - 397,853 497,469 632,313 717,672 2.53 8 - 22 23 77
Ghana 5,198,000 6,674,376 8,570,068 11,004,185 11,696,054 2.5 26 – 104 16 84
Mali 380,000 625,000 880,000 1,140,000 1,260,000 2.78 45 - 75 12.2 87.8
Togo 1,189,900 1,594,446 2,153,719 2,891,457 3,385,266 2.80 66 30 70
Total 14,474,276 18,642,598 23,924,622 30,618,560 33,876,343
Average 2.54 48.49 23.30 76.70Source:
The total basin population is expected to grow significantly from an estimated 18,600,000 in 2000 to approximately 33,900,000 in 2025. This is an expected increase of 80 % in a twenty-five year period. This high growth is due to the high average population growth rate (2.54 %) in the basin.
About half of the population in each of the Riparian countries is in the age group of (15-64) years (Table 8), which forms majority of the labour force. This age pattern might also be true for the areas within the Volta river basin, meaning that the basin is significantly rich in human resources. Other important population statistics in the riparian countries of the Basin are given in Table 8 below.
Table 8: Population statistics in riparian countries (2004)
CountryLife Expectancy(Yrs)
Death Rate(per 1000)
Literacy Rate(%)
Sex Ratio (male(s)/female)
% Age Structure (Yrs)
0-14 15-64 64 and over
Benin 51 13.69 40.90 0.98 46.8 51.0 2.3Burkina Faso 42 18.79 26.60 0.97 46.0 51.1 2.9
Côte d’Ivoire 42 18.48 50.90 1.01 45.1 52.6 2.2
Ghana 56 10.67 75.00 1.00 38.0 58.3 3.7Mali 45 19.12 46.40 0.96 47.1 49.9 3.0Togo 53 11.64 60.90 0.97 43.9 53.6 2.6Average 48 15.40 50.12 0.98 44.48 52.8 2.8
Source: CIA, 2004
Population pressures in countries with a weak economic base, as in the basin, induce unsustainable use of forest and land resources. This constitutes a major factor in the degradation of natural resources especially in Burkina Faso. Between 1985 and 1995, the population of Burkina Faso increased by 2.7%. Since then, the increase has been in the order of 2.6% (INSD, 1997). In the near future the population is expected to reach almost 16 million. This rapidly expanding population automatically requires a great area of cultivated land, which in turn means
24

more land clearance. And this inevitably contributes to the destruction of small amount of available vegetation cover. According to the Ministry of Agriculture, the high population density on the central plateau which lies entirely within the Volta basin and the high levels of intensive farming (between 50% and 70%) mean that the agro-demographic threshold has been reached, if not exceeded, and has led to a process of land degradation
The easy movement of people across national boundaries in the sub-region under the ECOWAS protocol makes population pressure a transboundary cause of the above-mentioned environmental problems in the basin. There have been some population migrations in the basin. In Ghana, the decline of the fishing industry in the Lower Volta following the establishment of the Volta Lake upstream has attracted people to move upstream to live near the lake for their livelihood. It is unfortunate that these settlements are often close to the banks of the lake, however.
In Togo, some people in the basin (Savannas and Kara regions) who migrated to the southern regions of the country before 1990 are now returning due to socio-political unrest.
The population of Burkina Faso experiences an important migration at both internal and external levels. The average ratio between internal and external migrations is as follows: out 100 migrant people, 71.2 % migrate inside the country and 28.8% abroad. In Burkina Faso during the severe Sahelian droughts of the 70s and 80s numerous populations have moved form the northern and central regions (Plateau Mossi) of the countries to the south in search a better life. Many Burkinabes are currently migrating from one region to another, or from rural to urban areas. Kessler and Geerling (1994) identify three types of migration:
The exodus towards urban centres The migration of young people towards urban in search of paid work. This uncontrolled migration leads to the over-exploitation of land and deforestation around the large towns, and creates problems in terms of urban development. Between 1975 and 1985, the urban growth of Ouagadougou and Bobo-Dioulasso was 156% and 101% respectively
Migration to other countries This type of migration is characteristic of rural areas, usually in regions with poor financial resources. The migrants move mainly towards Cote d’Ivoire and, to a lesser extent to Ghana. The departure of these members of the working population depopulates the villages and deprives them of the workforce required to implement SWC and other labour intensive initiatives.
Rural migration Migration within the country involves the individual or collective, spontaneous or organized migration from regions that are usually infertile and/or over-populated to regions that are under-populated and under-exploited, with the intention of settling temporally (during the rainy season) or permanently.
Rural migrations within the country have increased since the drought of 1970-72. They are regarded as a purely temporally solution to the problem of over-population and the absence of
25

cultivated land. The problems experienced in the central region will soon be repeated in the newly colonized region since the settlement of the migrant population and the cultivation of these areas occurs in a haphazard way that results in the exploitation of the land and vegetation cover. Rural migrations occur as follows:
individual or collective departures occurring from usually infertile and overpopulated regions (e. g. : the central plateau or Mossi land) towards more fertile and hardly exploited areas; the main host provinces are those of Houet, Mouhoun, Gourma, Tapoa, Kossi and Sissili;
spontaneous departures towards places where there are real possibilities of earning more substantial incomes (e. g. : gold sites), noticed in the provinces of Sanmatenga, Passoré, Séno and Soum;
State organized migrations towards areas developed for agricultural exploitation; they concern the developed plain of the Sourou province and the plain of the Kompienga and Bagré dam and the Kou valley.
The settlement of populations in these areas is anarchic. However, as far as organised migrations are concerned, the National Office in charge of Land Development (ONAT) is trying to organize the settlement of migrants.
The growth rates of migrations in host provinces between 1975 and 1985 were as follows : 88% for the Houet province, 44% for Mouhoun, 73% for the Tapoa, 64% for the Kossi and 106% for the Sissili (J.J. Kessler et C. Geerling, 1994).
Mali has also seen migration into the “forest” of Samori, a sub-basin of the Volta. This movement is caused by the quest for new land for farming activities. Others moved into the basin after the drought of 1985. Another sub-basin in Mali, the Seno, has seen such a surge in population that there is no longer sufficient farmland to allow land to lie fallow, resulting in an impoverishment of the land. Additionally, there has been some migration out of the basin and into the urban areas where jobs are sought.
As noted above in Table 8, the literacy rate is in the range of 26 to 75% with a mean of approximately 50% for the entire basin. This average level of literacy can serve as an impediment to environmentally sustainable development. Additionally, there are significant disparities in the schooling and literacy rates for men and women. In Togo, for example, between 43 and 83% of women are illiterate, while the illiteracy rates for men are between 25 and 50%.
Table 9: Education and literacy in the Volta Basin countries Country Education
efficiency coefficient (%)*
Net intake rate in grade 1 (%) 2000
Adult illiteracy rate (%) >15 yrs, 2001
Youth illiteracy rate (%) 15-24 yrs, 2001
All Male Female Male Female Male FemaleBenin 49.8* .. .. 46.54 75.44 28.37 62.75Burkina Faso 67.7 24.57 17.22 65.09 85.08 53.14 75.46Côte d’Ivoire 59.0 29.84 24.08 39.66 61.57 28.73 46.42Ghana 87.5 29.29 29.34 18.94 35.46 6.12 10.62
26

Mali 66.4 .. .. 63.33 83.35 51.81 74.00Togo 44.9 50.11 43.63 26.62 56.03 12.24 34.79Data source: WDI (2001; 2003); *=primary school only;
Life expectancy in the basin is fairly low, varying between 42 and 56 years with an average of 48 (Table 8). The infant mortality rate in the basin is high, estimated in 2004 to be between 49.25 and 55.1 per 1000 births in Ghana and between 90.39 and 106.7 in Burkina (CIA, 2004). A major factor in the short life expectancy of the population of the Volta basin is inadequate access to health care. Access to public health care in the Volta Basin in Ghana is poor and significantly below the national average of 37.2% (PIP, 1990).
In Burkina, only 28% of children between 12 and 23 months old are fully vaccinated against the six main diseases affecting children. About 29% of children between 0 and 5 years old are malnourished and in Togo and within the Volta basin about 42% of children under the age of three are concerned. Only 31.7% of children are in full-time education and only 12.3% of the population is literate. Although health care is being continually improved, it is marked by a high level of infant mortality.
Agricultural labor force
Ghana has the largest human labor force 9.5 million, followed by Côte d’Ivoire 6.6 million, Burkina Faso 5.7 million and Mali 5.4 million. Benin 2.9 million and Togo 1.9 million have the lowest labor force. During 1980-1999, labor force growth rates have varied substantially in Côte d’Ivoire 3.4%, Ghana 2.9% and Togo 2.7%. It has remained around 2 percent in Mali and Burkina Faso. Benin had during the same period the lowest labor force growth rate of all the riparian countries, 0.4%. Agriculture accounts for 86% of total employment in Mali and 92% in Burkina Faso; for all other countries it accounts for not less than 60%.
Employment rates in the agriculture sector of the riparian countries vary according to gender (Table 9). In the agriculture sector of Côte d’Ivoire, the employment rates accounts for 54 percent of total male employment, and 72 percent of total female employment. Employment patterns are more or less the same in almost all the other riparian countries except Ghana where, the agriculture sector accounts for a higher proportion of female employment than male employment. Women in the Volta Basin are heavily dependent on the agriculture sector for their livelihood security.
Table 10: Agricultural labour force in the riparian countries of the Volta River Basin Total population(million) 2001
Labor force Employees in agriculture (latest year available)**
Employment in agriculture (% of total employment)**
Total 2001 (millions)
Average annual growth rate (%) 1980-99*
Male(% of male employment)
Female(% of female employment)
Benin 6.44 2.91 0.4 61.90 65.20 63.50Burkina Faso 11.55 5.68 1.9 91.40 93.50 92.40Côte d’Ivoire 16.41 6.60 3.4 54.20 72.00 60.00Ghana 19.71 9.40 2.9 62.20 58.70 62.20Mali 11.09 5.42 2.2 83.00 89.00 85.80
27

Togo 4.65 1.93 2.7 66.20 64.50 65.50Data source: WDR (2000); WDI (2003); * (WDI, 2001); **=latest year available (1990s).
II.3 Economic Sector and Policies
The riparian countries of the Volta River Basin are some of the poorest in the world and have underdeveloped economies. Mali has the highest proportion of the population below the poverty line (64 %-2001 est.), 44.5% in Burkina Faso in 1997 and Ghana recording the least in 1992 (34.1 %). See Table 9. According to the World Development Report 2000/2001, all of the Volta River Basin countries are considered to be in the low income category (GNP per capita of $755 or less). Per capita GNP and economic growth rates for the riparian countries are shown in the following tables.
Côte d’Ivoire has the highest GNP in the region with $710 per capita, while Mali is ranked lowest with only $190. The average GNP/capita is $372, making the region one of the poorest in the world. Although figures quoted in the table are national values, the condition in the basin is not better than the remainder of the countries. The average annual growth rates in the range of –0.3 to 2.7% of GNP/capita also show low performance of the economies of the region. During 2001, Benin, Burkina Faso Ghana registered a robust GDP growth rate of 4 to 5 percent, while Côte d’Ivoire experienced a negative growth rate. Likewise, Côte d’Ivoire, Mali, and Togo showed a negative per capita GDP growth rate, while all others have a positive figure. Over all, per capita GDP growth rates are lower in all countries than GDP growth rates, which is picking up the effect of fast growing population in all countries, the difference being widest in case of Togo with fastest growing population.
Economic activities in the basin are quite similar in all of the countries: crop production, livestock breeding, fishing, lumber, agro-industry, transportation, and tourism. These activities can be grouped under agriculture, industry, manufacturing, and services.
Agriculture includes crop and livestock production, fisheries, and forestry, while industry involves mining and quarrying, electricity supply, and construction; services include transport, storage, communication, wholesale and retail trade, restaurants and hotels, government services, etc. The economic outputs of these activities in the riparian countries are shown in Table 11.
Table 11: Structure of Economic Output at the National Level
Gross Domestic Product
Millions of $
Value added as % of GDP
Agriculture Industry Manufacturing Services
Country 1990 1999 1990 1999 1990 1999 1990 1999 1990 1999Benin 1,845 2,402 36 38 13 14 8 8 51 48
Burkina Faso 2,765 2,643 32 32 22 27 16 21 45 41
Côte d’Ivoire 10,796 11,223 32 24 23 24 21 20 44 52
Ghana 5,886 7,606 45 36 17 25 10 9 38 39Mali 2,421 2,714 46 47 16 17 9 4 39 37
28

Togo 1,628 1,506 34 43 23 21 10 9 44 36- - 37.8 36.7 19.0 21.3 12.3 11.8 43.5 42.2
(World Development Report 2000/2001)
The above table shows economic outputs for the countries as a percentage of GDP in 1990 and 1999. The activity output is shown as a percentage of the GDP. From the table, it can be observed that services and agriculture are most prominent in the sub-region, averaging 42% and 37% of GDP, respectively (1999). Industry follows in third place. The services sector averages 19% and 21% of GDP in 1990 and 1999, respectively. The services sector is dominant in the urban areas, whereas agriculture dominates in the rural areas. It is worth noting that the type or intensity of activities did not change significantly over the 1990 to 1999 period.
The agriculture sector (Table 11) contributes between 35-40 percent of the value added to GDP in all countries, except Côte d’Ivoire, where it contributed only 1/4th. Côte d’Ivoire, and Mali, also experienced a negative agricultural value added growth. Also, agriculture value added per worker varied considerably: lowest contribution in Burkina Faso ($185), followed by Mali ($265), Togo ($528), Ghana ($574), Benin ($627) and highest in Côte d’Ivoire ($1085). As agriculture sector value added per worker is a measure of agriculture sector productivity/efficiency, it implies that with the minor exception of Côte d’Ivoire, agriculture sector is least efficient, which points to capacity constrains, underemployment, low productivity, market distortions, and poor infrastructure in these countries.
Table 12: Macroeconomic indicators in the Volta Basin countries (2001)Country
Per c
apita
G
DP
(con
stan
t
GD
P gr
owth
(an
nual
%)
GD
P pe
r cap
ita g
row
th
(ann
ual %
)
Agr
icul
ture
val
ue a
dded
(%
of G
DP)
Agr
icul
ture
val
ue a
dded
pe
r wor
ker (
cons
tant
199
5 U
S$)
Agr
icul
ture
val
ue a
dded
gr
owth
(ann
ual %
)
Empl
oym
ent
in se
ctor
(%
of
tota
l em
ploy
men
t)* A
id
depe
nden
cy
ratio
Agr
icul
tur e
Serv
ices
Indu
stry
% o
f GN
I
% o
f gro
ss
capi
tal
form
atio
n
Benin 423.75 5.00 2.31 35.53 626.78 3.10 63.50 28.40 8.10 11.62 60.05Burkina Faso 250.22 5.64 3.09 38.22 185.21 7.05 92.40 5.80 1.80 15.68 61.68Côte d’Ivoire 714.62 0.90 -3.30 24.25 1084.8 -1.60 60.00 30.50 9.60 1.91 18.17Ghana 421.02 4.00 1.88 35.90 573.95 3.69 62.20 27.90 10.1 12.72 51.23Mali 291.60 1.44 -0.88 37.77 264.57 -13.0 85.80 12.20 2.00 13.92 62.65Togo 322.33 2.70 -0.09 39.44 527.77 4.78 65.50 24.40 10.10 3.77 17.86
Data source: (WDI, 2003); WDR (2003); WDR (2004); *=latest year available during 1990s; years may not be same for various sectors, so figure may not add to 100.
The last column in (Table 12) shows aid dependency ratio, defined in terms of foreign aid as a percentage of gross national income and gross capital formation. The number show that relative aid dependency is lower for Côte d’Ivoire and Togo, while for all other countries, over 50-60 percent of gross capital formation depends on foreign aid. In general, the basin countries have high debt burden, with average debt burden being about 72 percent of GNP (WDR, 2003).
Additionally, the region is saddled with a heavy burden of external debt as indicated in (Table 11). The debt burden ranges from 32% to as high as 122% of the GNP. The average, as well as the
29

median, debt burden for the sub-region is about 70% of the GNP. This poor economic situation can potentially inhibit any meaningful sound environmental development with respect to the exploitation of natural resources for socio-economic development. The other important measurement of external debt is debt servicing as a percentage of exports, of GDP and the value of debt in relation to the value of exports. In Burkina Faso for example, debt servicing in 1996 was equivalent to 56% of GDP, and 19% of export revenues from goods and services. The present value of Burkina Faso’s external debt in 1996 compared to the value of its exports was 254%.
Following the United Nations typology, Human Development Index (HDI), Human Poverty Index (HPI), and Gender Development Index (GDI) can be used to construct relative poverty profiles and discern gender differentials, if any, for the Basin countries. Of the two poverty indices, the HDI is a combination of longevity (life expectancy), knowledge (literacy and education) and standard of living (purchasing power and cost of living), where the lower the figure, the worse is the state of human development in a country. The HPI converts this into a poverty index, which becomes a measure of economic development and human welfare. The HPI is a measure of human deprivation defined in terms of survival (percent dying under 40 years), knowledge (illiterate adult percent) and economic provisioning (health, sanitation, infant mortality). Therefore, both HDI and HPI are composite indices and the underlying conception of poverty is that of multiple human deprivations.
The GDI measures women’s achievement using the same indicators as the HDI. The divergence between the HDI and GDI for each setting measures the relative status of women’s opportunities. The closer the values of the HDI and GDI, the greater the degree of gender equality is. For all countries, the GDI is consistently lower than HDI, with the divergence being highest in Mali, followed by Burkina Faso and Benin, but lowest in Togo and Ghana (Table 13). This implies that gender disparities do exist in all countries, and remain widely pervasive except the latter two
The human development index of Burkina Faso is among the lowest in the world 0.320. Out of the six riparian countries of the basin, only Ghana is ranked medium human development country.
Table13: Human development indicators in the Volta basin countries (1998)Country HDI HDI rank HPI (%) HPI rank GDI GDI rank
Benin 53.5 157 48.8 74 0.391 132Burkina Faso 44.7 172 58.4 84 0.290 142Côte d’Ivoire 46.9 154 45.8 72 0.401 129Ghana 60.4 129 35.4 59 0.552 105Mali 53.7 165 51.4 81 0.371 137Togo 49.0 145 37.8 63 0.448 120
Data source: HDR (2000)
In terms of population below international poverty lines, Mali, Burkina Faso, and Ghana have about half to two-thirds of their population living below $1 a day poverty line, with mean income shortfall varying between 1/4th to 1/3rd of reference poverty line. For $2 a day, poverty rates are extremely high.
30

Table14: Poverty and income distribution in the Volta Basin countries (latest year available)Country Rural
population below national poverty line (%)
Urban population below national poverty line (%)
Population below $1 a day (%)
Poverty gap at $1 a day (%)
Population below $2 a day (%)
Poverty gap at $2 a day (%)
Gini Index (%)
Income share held by lowest 10%
Income share held by highest 10%
Benin 33.00* 33.00* .. .. .. .. .. .. ..Burkina Faso 51.0 16.5 61.2 25.5 85.8 50.9 55.1 2.0 46.8Côte d’Ivoire 36.8* 36.8* 12.3 2.4 49.4 16.8 36.7 3.1 28.8Ghana 34.3 26.7 44.8 17.3 78.5 40.8 40.7 2.2 30.1Mali .. .. 72.8 37.4 90.6 60.5 50.5 1.8 40.4Togo 32.3* 32.3* .. .. .. .. 33.8** .. ..Data source: WDR (2003); (WDI, 2003). *=National figure; **= Deininger and Squire (1997) database/WIID (2000).
Gini index is a measure of income inequality, with value ranging between zero and one. A zero value shows a perfectly equal distribution of income, while a value of one implies perfect inequality. Higher the Gini value, higher is the degree of income/consumption inequality. Income/consumption share held by highest/lowest 10 percent is the share that accrues to respective sub-group of population indicated by deciles. The numbers show that poorest countries, such as Burkina Faso and Mali, also have highest income inequality with Gini coefficient ranging between 50 to 55 percent.
During the 1980’s, most of the governments of the riparian countries began negotiations with the World Bank and agreed a Structural Adjustment Loan. This was followed in 1990’s by an IMF Enhanced Structural Adjustment Facility. There was a considerable degree of opposition to these relations with the IMF and World Bank from opposition parties and trade unions in most of the riparian countries.
Adjustment programmes in key sectors such as education and health, agriculture, the environment and public enterprises accompanied these macro-economic programmes. Funds were loaned to improve these sectors conditional to certain changes in their operation, as prescribed by the Bank. This high degree of funding for sectoral adjustment from the start was unusual in sub-Saharan Africa.
Attempts to increase government revenue in most of the riparian countries through reforms of the tax system and improved collection largely failed. For example, in Burkina Faso, a large wage increase in the public sector in 1991 increased government expenditure and a large budget deficit developed.
External debt continues to place a heavy burden on the Burkina economy. Total outstanding debt almost trebled from 41.3% of GDP in 1981 to 85.6% of GDP in 1994. Although the Paris Club of debtors rescheduled some debt in 1991 and 1993, this made little difference. In a country such as Burkina Faso, government expenditure on debt servicing greatly depletes funds available for essential social development. Money that Burkina Faso desperately needs to spend on improving education and health provision is instead used to pay debt servicing. Under HIPC Burkina Faso
31
will receive $200 million in debt relief, which although not a huge amount, could still be used toimprove education and health-care provision.
Table 15: External Debt of the Riparian Countries (1998)Country Millions of Dollars % of GNP
Benin 1,647 46Burkina Faso 1,399 32Côte d’Ivoire 14,852 122
Ghana 6,884 55Mali 3,202 84Togo 1,448 68
Average 4,905 70(World Development Report 2000/2001, 2001)
II.4 Agro-ecological Zoning
II.4.1 Drainage network and sub-basins
The Volta Basin is drained by several major rivers: the Black Volta, the White Volta with the Red Volta as its tributary, the Oti River and the Lower Volta. The mean annual flows of the Black Volta, White Volta, and Oti River are 7,673 x 106, 9,565 x 106, and 11,215 x 106, respectively (MWH, 1998-Table 12). The Oti River with only about 18% of the total catchment area contributes between 30% and 40% of the annual flow of the Volta River System. This situation is due to the steep topography and the relatively high rainfall in the Oti sub-basin.A dominant feature in the basin is Lake Volta which covers about 4% of the total area in Ghana. It generates hydropower (1060MW) at Akosombo and Kpong about 100 km north of Accra. 95% of the generated power in the basin comes from these two sites. Table 12 presents area of sub-basins and length of the main tributaries of the Volta River.
Table 16: Area and length of main tributaries in the Volta River Basin in Ghana
Sub-basins Total Area (km2)
Rainfall(mm) Mean Annual
Runoff (x106 m3)
Run-off Coefficient(%)
Length(km)
Black Volta 149,015 1023.3–1348.0 7 673 8.3 1,363.3White Volta 104,749 929.7–1054.2 9 565 10.8 1,136.7Oti 72,778 1150.0–1350.0 11 215 14.8 936.7Lower/ Main Volta
62,651 1050.0–1500.0 9 842 17.0
Total 400,710 876.3–1565.0
The White Volta begins as the Nakanbé River in Burkina Faso. The Red Volta, referred to as Nazinon in Burkina Faso, and Sissili, are tributaries of the White Volta and they all have their source in Burkina Faso. The mean annual flow of the White Volta Basin is estimated to be about 300 m3/s where the percentage of flow from outside Ghana to the total flow is estimated to be 36.5% (UNEP, 2002).
The Sourou from Mali and the Mouhoun from Burkina Faso join in the latter country and flow downstream to Ghana as the Black Volta. In Burkina Faso, apart from the Mouhoun, all of the
32

rivers, including the Nakanbé, Nazinon and Sissili, dry up for approximately two months out of the year. The mean annual flow of the Black Volta at Bamboi is about 200 m3/s, out of which about 42.6% originates from outside Ghana.
The Oti River begins in the Atakora hills of Benin at an altitude of about 600 m and flows through Togo and Ghana. In Benin, the Oti River is referred to as the Pendjari River. Tributaries include the Koumongou, Kéran, Kara, Mô, Kpanlé, Wawa, Ménou, and Danyi Rivers. Due to the regularization by the Kompienga Dam in Burkina Faso, the Oti River has a permanent flow with an annual average flow of 100 to 300 m3/s, and can reach more than 500 m3/s. Virtually all of the tributaries stop flowing during the dry season, however, and their annual average flows are only in the range of 5 m3/s. In Ghana, the Black Volta, the White Volta and the Oti join the main Volta at Volta Lake, which was created by the Akosombo Dam (UNEP, 2002).
II.4.2 Relief
The basin is flanked by a mountain chain on its western-most section. From the sea and northeastwards rise the Akwapim ranges, followed by Togo Mountain, Fazao Mountain, and the Atakora ranges in Benin. The Kwahu plateau branches north-westwards after the Akosombo Gorge. The only other significant relief on the western part of the basin is the plateau of Banfora.
The basin in general has a low relief with altitudes varying between 1 and 920 m. The average mean altitude of the basin is approximately 257 m, with more than half the basin in the range of 200 – 300 m. The global slope index is between 25 – 50 cm/km. Some of the characteristics of the relief are shown in Table 17.
Table 17: Some Important Relief CharacteristicsElevations at MSL (m) Black Volta White Volta Oti Main VoltaMinimum altitude 60 60 40 1Maximum altitude 762 530 920 972Average altitude 287 270 245 257
Source: ORSTOM Hydro. Monographs edited by Moniod et al., 1977.
II.4.3 Soils in the BasinThe soils of the Main Volta Basin in the sub-humid Savannah Zones are Savannah Ochrosols, Groundwater Laterites, Savannah Ochrosols – Groundwater Laterite (GWL), Savannah Ochrosol– GWL Intergrades, Savannah Ochrosol – Rubrisol Intergrades, Tropical Black Clays, Alluviosols, Tropical Grey Earths, Sodium Vleisols, and Savannah Gleisols. The soils of the Oti Basin are Savannah Ochrosols, Groundwater Laterites, Savannah Ochrosol-GWL Intergrades, Savannah Lithosols, Savannah Gleisols, and Forest Lithosols. The major soil groups in the Black and White Volta are Savannah Ochrosols, Groundwater Laterites, Savannah Ochrosols–Groundwater Laterite Intergrades, Savannah Lithosol, Savannah Gleisols, Savannah Ochrosols – Rubrisol Intergrades, and Savannah Gleisol–Alluviosol Intergrades.
Table 18 gives detail description of identified soil groups in the entire Volta River Basin.
Table 18: Identified Soil Groups in the Volta River Basin of Ghana
Soil Group Predominant Predominant Erosion
33

Relief Texture Hazard
Savannah Ochrosols Upper and middle moderately heavy to Moderate sheet Slopes gently light and gully Undulating erosion
Groundwater Water Near level to level Light over concretions Severe to veryLaterites (GWL) lower slopes to valley and Iron pan severe sheet
Bottoms erosionSavannah Ochrosols Gently undulating to Medium to light Moderate to GWL Intergrades level middle to lower severe sheet
Slopes erosionSavannah Lithosols Summits with steep Medium to light Severe gully
Slopes erosionSavannah Gleisols Near-level to level moderately heavy to Slight sheet(GLE) lowlands very heavy erosionSavannah GLE- Lowland terraces Light to very light Moderate to Alluviosol Intergrades slight sheet Erosion
In the Volta Basin of Burkina Faso, the major soil types found are:
Lithosols and Aridisols : characterized by little or no chemical and biological alteration, traces of organic matter to a depth of less that 20 cm and an almost non-existent biological activities
Degraded Ferruginous soils or Ferralitic soils : they are slightly or moderately unsaturated
and have developed on material that is deficient in humus and material resulting from schist and sandstone. They are characterized by the complete alteration of the primary mineral, an abundance of synthetic products (aluminosilicates, iron hydroxides and oxides, etc.) and, in some case highly developed organic matter.
Ferruginous soils : they occupy most of the basin (central plateau and south). They usually contain low levels of organic matter. These soils can be with low or high cultivation according to their location
Halomorphic soils : they have a layered structure are fairly rare in the Volta basin
Hydromorphic soils : they occupy the low-lying areas and alluvial plains
Vertisols: mainly found in the valleys and usually dark in colour. They are characterized by the presence of highliexpansive clay which swells and contracts alternately under the effects of very wet and very dry periods.
34

Ghana
Mali
Burkina Faso
Benin
Ivory Coast
Niger
Togo
Nigeria
GhanaAcrisols
Alisols
Arenosols
Cambisols
Ferralsols
Fluvisols
Gleysols
Leptosols
Lixisols
Luvisols
Nitosols
Planosols
Plinthosols
Regosols
Solonchaks
Solonetz
Vertisols
BurkinaDegraded Ferrogenous Soils
Ferrogenous Soils with low cultivation
Ferroginous with high cultivation
Halomorphic and Aridisols
Hydromorphic Soils
Lithosols and Aridisols
Vertisols
1:5,710,422Scale:
I
Figure 10: Distribution of soil types in the Volta basin of Ghana and Burkina
II.4.4 Geology of the Basin
The geology of the main Volta is dominated by the Voltaian system. Other geological formations include the Buem formation, Togo series, Dahomegan formation, and Tertiary-to-Recent
35

formations. The Voltaian system consists of Precambrian to Paleozoic sandstones, shales and conglomerates. The Buem series lies between the Togo series in the east and the Voltaian system in the west. The Buem series comprises calcareous, argillaceous, sandy and ferruginous shales, sandstones, arkose, greywacke and agglomerates, tuffs, and jaspers. The Togo series lies to the eastern and southern part of the main Volta and consists of alternating arenaceous and argillaceous sediment. The Dahomeyan system occurs at the southern part of the main Volta Basin and consists of mainly metamorphic rocks, including hornblende and biotite, gneisses, migmatites, granulites, and schist.
The Oti Basin is underlain mainly by the Voltaian system, the Buem formation and the Togo series. The White Volta Basin is composed of the Birimian system and its associated granitic intrusives and isolated patches of Tarkwaian formation. The other significant formation is the Voltaian system. The Birimian system consists of metamorphosed lavas, pyroclastic rocks, phyllites, schists, tuffs, and greywackes. The Black Volta Basin consists of granite, the Birimian and Voltaian systems, and, to a minor extent, the Tarkwaian system. The Tarkwaian formation consists of quartzites, phyllites, grits, conglomerates, and schists. The underlying rocks of the basin have no inherent porosity. Thus, groundwater storage occurs only in fractured zones of the rocks. Figure 8 shows the geology of the entire Volta River Basin.
36
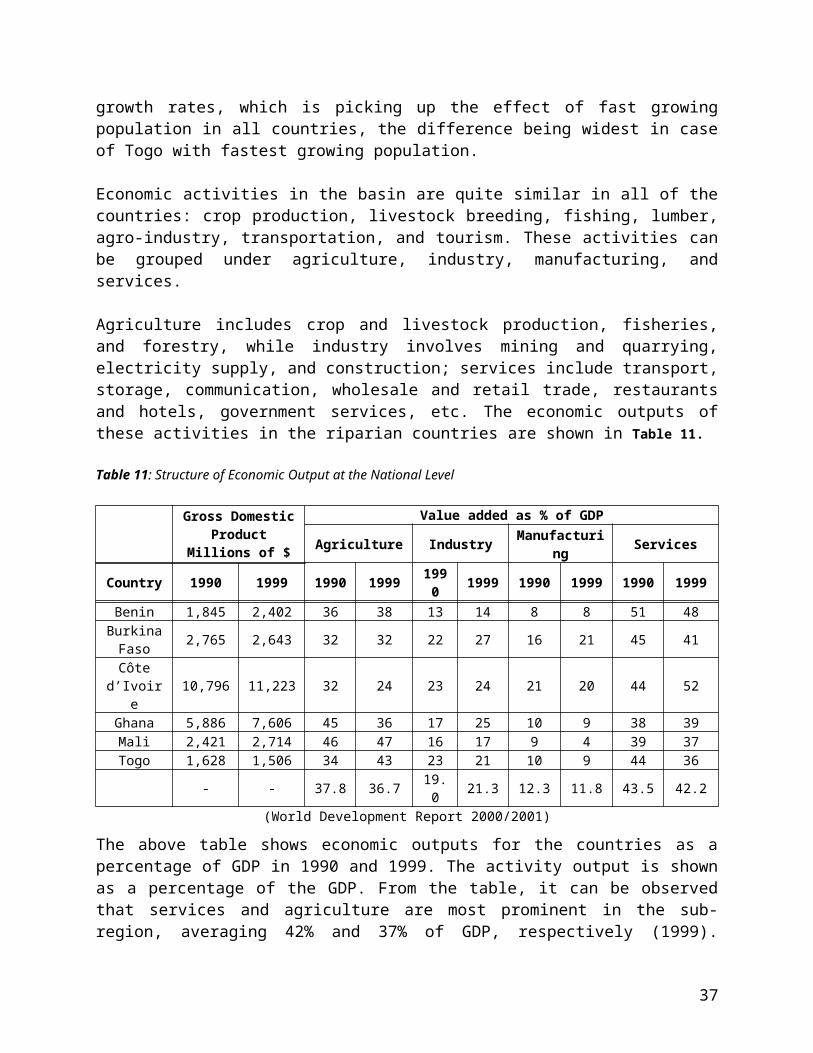
Figure 11: Map of Geology of the Volta River Basin.
37

II.4.5Land use, land ownership and land degradation
Figure 12: Land cover Map of the Volta River Basin.
As agriculture and animal husbandry are the primary economic activities in the basin, land resources are critical to the basin inhabitants. The resources currently meet these needs, but the growing population pressure that will require additional land, combined with the anthropogenic and climatic threats to land resources, suggest that this might not always be the case.
Information on demand for land resources is inadequate in the basin. Statistics of land use were given, for example, in Togo and out of a basin area of 2,670,000 ha only 428,000 (16%) were put under cultivation in 1995, while an area of 528,420 ha (19%) were under forest reserve. Fertility of the soils was not discussed, but this could be a limiting factor due to the expansion of agricultural lands. For the Volta Basin in Burkina Faso, 3,905,500 ha, representing 22.5% of the basin area is under cultivation. It was indicated that land availability in that area for farming is becoming limited but is not yet in a crisis situation. Throughout the basin, the loss of soil fertility due to erosion, over-use, over-use of manure, and uncontrolled bushfires were identified as problematic issues.
Farming practices could determine the size of land needed for future activities. With the increase in population, the available data and information suggest that demand for land for farming will increase with the view to achieving food self-sufficiency in the basin, as well as increasing food exports. Population pressure has not only expanded pasturage, but also reduced its quality due to
38

reduced crop rotation and not allowing sufficient time for croplands to lie fallow to regenerate essential nutrients.
Farming and animal husbandry are significant contributors to land degradation in the basin. Agricultural practices in the basin have in the past included crop rotation and leaving fields fallow for a period of time. With rising population, however, the fallow periods have been reduced and crop rotation declined, leading to the loss of soil fertility and less food production per unit area of cultivated land. Increasing livestock production has resulted in the loosening of soils and the degradation of vegetation, both of which exacerbate erosion. Increased exploitation of forested areas is also a significant contributor to soil degradation and erosion.
Forested areas are cut to provide additional lands for agriculture and animal husbandry, and to provide fuel. Additionally, timber resources are over-exploited in many parts of the basin. This is done to meet rising demands for foreign exchange, as well as to meet increasing domestic needs. Unfortunately, the timber exploited is not processed for higher value and thus more volume of timber is required to be exported for adequate foreign exchange receipts for the countries’ socio-economic development. In the long-term, these practices are not sustainable and have detrimental effects on both land and water resources in the region.
The problem of land degradation in the basin encompasses soil degradation, intense erosion and desertification. As discussed above, the basin’s population is heavily dependent upon the land resources of the region for subsistence agriculture and livestock breeding. The increasing demographic pressures have resulted in the overuse and misuse of land resources. Soil degradation, erosion, and desertification processes manifest themselves in low agricultural productivity, destruction of the soil’s natural productive capacity, compacting of the soil, degradation of water quality, and loss or reduction in vegetation cover. The increased mobility of sediments also affects reservoir capacities and their useful lives.
Land ownership in the region remains primarily traditional, meaning that lands are often owned or managed by local elders or leaders. As a result, the major institutions involved in land administration are the traditional leaders in some countries. Thus, a significant problem associated with land resources is the institutional and legal framework governing the release of land for use. Some lands are also preserved as natural habitats for flora and fauna and are unavailable for use; however, illegal exploitation of the land resources has reduced their value.
Additionally, some lands are already degraded to the point of non-productivity. For example, in the Lower Volta Basin, the establishment of the Akosombo Dam has rendered some of the soils in the area more acidic. As a result, the yields from farms in the region have been reduced considerably. The potential of such lands has been reduced and will require remedial measures.
The problem of land degradation in the region has both transboundary causes and effects. Transhumance, defined as the movement of cattle, sheep, and people across national boundaries, is common within the basin. This phenomenon is usually accompanied by reckless destruction of vegetation, watering sources, etc. The situation also creates social tension and disruption of socio-economic activities, sometimes proving fatal.
39

Bushfires have no respect for national boundaries and can move from one country to another country in the basin. This phenomenon of bushfire across frontiers does happen in the basin and constitutes a transboundary cause. While controlled bushfires are used to enhance the fertility of agricultural lands, many of the bushfires intentionally or unintentionally occurring in the region can quickly get out of control and burn large areas.
Deforestation occurs across frontiers, particularly where transhumance is a major problem as in the basin. The animals being moved are fed on leaves of trees illegally cut down by the herdsmen. Additionally, the pounding of the soils by the hooves of the animals renders the soil loose for erosion. Deforestation also occurs across borders when there are inadequate laws in neighboring countries. For example, people from Burkina Faso travel to Mali because the laws are less strict there.
Population pressures in countries with a weak economic base, as in the basin, induce unsustainable use of forest and land resources. The easy movement of people across national boundaries in the sub-region under the ECOWAS protocol makes population pressure a transboundary cause of the above-mentioned environmental problems in the basin.
The transboundary nature of the effects of soil degradation and erosion arise mainly in the sediment transport and degradation of water quality. Due to erosion occurring upstream, sediments are filling river channels and reservoirs, and decreasing water quality. Additionally, the transhumance of livestock occurs when new pastures must be found due to land degradation.
Socio-economic impacts related to land degradation are extensive, but difficult to assess. Land degradation, however, has serious consequences on the ability to produce food in the region, which in turn has serious consequences on human health and security.
i. BENIN
Only a small amount of land is suitable for agriculture, livestock, and for dwellings in the Volta Basin of Benin. As a result, competition exists over these finite resources and the region is experiencing significant demographic pressure. This land pressure is also hindering economic development in the region.
The majority of land in the basin is owned and is passed down through families, rather than sold to outsiders. Additionally, communes remain under the control of managers who determine how lands are divided. Thus, the land tenure system remains somewhat traditional as local leaders have significant control.
Land resources in the basin are seriously threatened by anthropogenic activities, and this in turn threatens waterways. The overexploitation of the vegetation occurs as a result of overgrazing of livestock caused by the increasing density of the zone’s population. The abusive use of artificial fertilizers and pesticides, the reduction of the duration of fallow periods, and other poor agricultural practices scour the land and deplete the soil’s minerals. Bushfires accompanied by hard rains and strong winds further accentuate erosion and add to the sedimentation of waterways. Further, the destruction of forests and the deforestation of riverbanks exacerbate the
40

degradation of the land and threaten the Oti River. Table 14 below gives the characteristics of the agro zones in Benin.
Table 19: Characteristics of the Zones
Agro Zones Ecological Practices of Agricultural Systems Problems Causes
West Atacora
Cotton
Oti National Park
Burning of biomass Farming of hollows No use of mineral
manure Food crops: sorghum
and millet, niébé, groundnut, fonio, voandzou, yam, maize, and rice
Breeding: system of breeding based on transhumance and changing pastures
Degradation of the soils and vegetation cover
Food security No market for
groundnut and rice Conflicts between
livestock breeders and farmers
Farming practices Demographic pressure Ferruginous soils with
inadequate water and poor fertility except in the hollows
Lack of water sources and pasture
ii. BURKINA FASO
Burkina is endowed with significant natural resources. Apart from arable lands (9,000,000 ha), forestry and pastoral lands (16,000,000 ha), there are nearly 1,200 water courses and dams covering a total area of 120,000 ha to 150,000 ha. These natural water bodies (Mouhoum, Nakambé, Nazxinon, Comoe, etc) offer potential fishery resources of close to 12,000 tons per year (Kafando, 1995).
Five agro-ecological have been identified by the CNRST, based on agro-climatic, socio-demographic conditions and regional constraints and potentials. These zones have the following characteristics:
The Eastern zone covers an area of 60,600 sq.km with a population density of less than 20 inhabitants per sq. km. It has an annual rainfall of between 500 mm and 1000 mm. It has great potential in animal husbandry, fishery and wildlife resources (5 reserves). The farming system is dominated by sorghum and millet.
The Sahelian zone covers an area of 36,896 sq. km with a very low population density of 10 to 17 inhabitants per sq. km; it has a rainfall of between 300 mm and 600 mm. and a highly degraded vegetation cover due to drought. Its agriculture is subsistence and consists mainly of cereal. The main source of income is animal husbandry.
The North-western zone has an area of 30,870 sq. km., a rainfall of between 500 mm. and 800 mm. It has an average population density of 41.1 inhabitants per sq. km. Although the farming system is based on the cultivation of sorghum and millet, this zone has great
41

potential for irrigated crops such as vegetables, rice and maize. Animal husbandry is also significant.
The Central zone covers an area of 94,000 sq. km with a high population pressure resulting in severe degradation of the plant cover and soils. Rainfall varies between 600 mm and 900 mm. The agro-pastoral and forestry potentials are limited and the farming system which consists of agriculture combined with animal husbandry, is dominated by small ruminants and poultry.
The Western zone has an area of 52,000sq.km, and a rainfall of between 700 mm and 1200 mm. This zone has great natural resources potential. It is the converging area for immigrants from the Central and Northern parts of the country. Its agriculture is much diversified with high output in cotton, fruits, vegetables and dominance of cereals (sorghum, maize, millet, rice and fonio). It has a high potential for animal husbandry, and possesses a large stock of cattle.
Land in Burkina Faso is threatened by agricultural practices, deforestation, and, in some areas, by mining activities. The land tenure system is governed by the Land and Agricultural Reform Law. This statutory framework has been read through several times with a view to adopting in the socio-cultural context of the regions of the country, but there has not been a bold application of the law due to the existence of customary laws on land ownership. This situation should improve soon. An FAO study in 1987 revealed four (4) types of land holding rights in force in the rural areas of Burkina:
the right to permanent use for each member a lineal group with the collective ownership right vested in the head of the family;
the right to permanent use as a result of the clearing and development of vacant land; the right to use inherited from a farmer who has himself been granted that right by the
holder of a collective ownership right; this is usually permanent;
The provisional right of use lent out by the holder of the right to permanent use or a collective ownership right (lending or hiring). Under the framework of the Agrarian and Land Reform Law (RAF), the National Lands Sector (DFN) which is the right to exclusive State ownership was established in 1984. Despite the existence of these basic land tenure regulations, there is also the existence almost throughout the whole country, of the customary law governing lands placed under the authority of “Land Chiefs” who assume religious and legal functions in the villages. Their duty is to ensure that land is used in accordance with the rules laid down by society. The underlying principle is to ensure that every man, whether he belongs to a village community or not has a right to adequate land, in order to support himself and his family (CIMAC, 1996). This redistribution of lands to those who do not possess any is in the form of land lending or renting, which are unpaid for.
However, the only requirement on the part of the beneficiary is the compliance with certain socio-cultural rules of the lender or the receiving community (in the case of immigrants). Apart
42

from this land redistribution system, the common method of land possession is through inheritance. These land acquisition methods enable every one, no matter his status in life, either rich or poor, to have access to land. However, in most cases, the right to land ownership is the exclusive preserve of men. Women can have access to it for subsistence farming, through the head of the household or family. With regard to redistribution of land, especially through lending, any action which tends to jeopardize the ownership right of the lender is forbidden, such as investments leading to permanent occupation of the land.
In the Mouhoun Basin, land tenure is based on social stratification. It is also based on the right of collective appropriation distributed between the founders of a village and the right of temporary or permanent use of the land allotted to an individual. Individual appropriation does not exist, however, and land rights can only remain within the social group.
In the Nakanbé Basin, land tenure is related to the existing structure. The area is occupied primarily by animal herders who require a large amount of land for pasture, but the land is not used intensively. The land is collectively owned by the group, and they do not have the right to refuse an outsider use of the land if they have valid reason.
Forested areas in Burkina Faso are shrinking significantly as population pressure in the region increases. In the National Action Plan for the Fight Against Desertification (1999), it is noted that forested areas decreased by 1.26 million hectares between 1980 and 1992. It was estimated in 1996 that 105,000 ha of forested areas were yearly lost. About 880,000 ha are classified forests and 8,790,000 ha are protected forests. In the Volta Basin about 788 433 ha of forest are considered classified forests since 1954.
The Volta Basin in Burkina covers a total area of 172, 968 km2 (17.3 million ha) and is primarily occupied by tropical ferruginous soils and degraded land less favorable to subsistence farming and cash crops. It is estimated that about 9 million hectares representing 1/3 of the country’s total area, is arable land. However only 3.5 millions hectares are yearly cropped with subsistence farming based on staple cereals: millet, sorghum and maize. These three cereal crops cover 88% of the total cropped land in the country. The average yield is about 850 kg/ha.
In 2000, about 2,927, 737 ha were cropped in the basin. This is an increase of 12% compared to 1997 when about 2,612,245 ha were then cropped. According to the Agricultural Strategic Plan in 2000, the cropped area in the Volta Basin represented 82.5% of the total cropped land in Burkina. About 12,000 ha of land were also planted with fruit trees. One of the objectives of the Strategic Plan is to increase agricultural production by 5 to 10% per year over the next ten years.
In short, the occupied surfaces in the basin are:
agriculture: 3,000,000 hectares water bodies: 83,000 hectares human settlement: (not estimated) roads: 34,000 hectares ( 16300 ha representing 38 161 km rural dirt roods and 17530 ha
of 9100 km of improved roads) classified forests: 788,500 hectares
43

Tableau 20: Major landuse types in the Volta basin of Burkina (hectares)Agriculture 3 000 000Water bodies 83 000Human settlements Not EstimatedRoads 34 000Forests 788 500Total 3 905 500
The total of: 3,905,500 hectares represents 22.5% of the total surface of the basin.
iii. CÔTE D’IVOIRE
The rural areas in the basin tend to follow the traditional system of land tenure. At the village level, each "great family" has a field on which the members cultivate. The appropriation of the ground is thus collective, but its exploitation is individual.
Today, land and water resources are subjected to the modern system of land tenure defined by the laws of the Rural Land Code and Water Code promulgated in December 1998. These laws aim to protect the resources from overexploitation.
As in the rest of the basin, agriculture is the dominant economic activity and a significant contributor to land degradation in the Volta Basin of Côte d’Ivoire. Cotton is a main crop in the area, as well as anacarde, corn, sorghum, rice, and groundnuts.
The area is also used as pastureland to a significant extent. Herders come from Mali and Burkina Faso to use lands in Côte d’Ivoire.
Bushfires are used extensively in the region in hunting, managing pastures, preparing agricultural lands, and for other purposes. Uncontrolled bushfires contribute to land degradation.
The lands in the basin are occupied approximately in the following manner:
3% Infrastructure, urban areas, water, and rocky zones12% State-owned land: national parks and reserves
75% Rural areas (50% savannah and forest, 25% cultivated)
iv. GHANA
Land ownership within the basin is basically traditional except for areas demarcated for control by the government agencies, such as the Volta River Authority, as well as forest reserves, wildlife, and national parks. The details of traditional ownership vary from place to place. The system vests all resources under the control of the traditional authorities. Families and
44
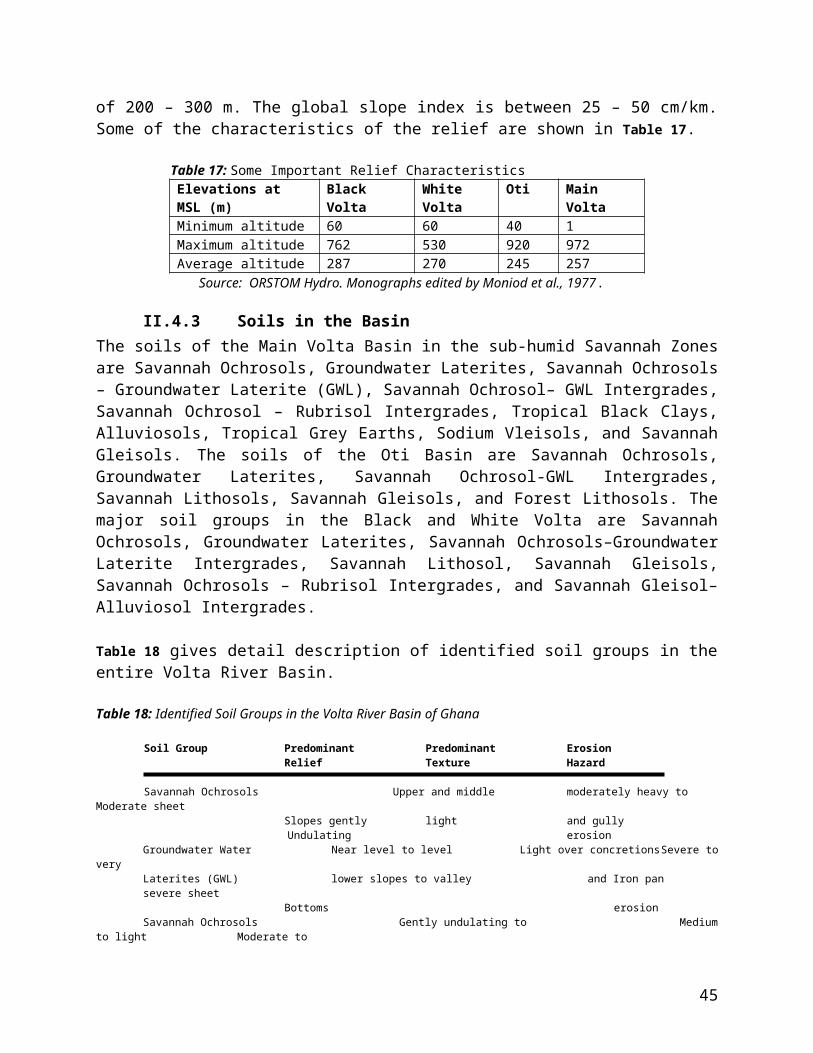
individuals have both access and control of resources through birth into a particular community or after payment of certain amounts either in kind or cash (Nyankpala Agricultural Research Station (NAES), 1989). In the northern sector of the Volta Basin, usufruct rights to land might not necessarily include rights to economic trees like the dawadawa and shea trees (NAES, 1989). While individuals and families might own lands along riverbanks, the rivers always remain communal or public property and are used as such.
Agriculture is the dominant economic activity within the Volta River Basin. As in other areas of the basin, soil is being rapidly degraded as a result of shortened fallow periods. This is especially pronounced in the northern parts of the basin
Environmental problems arising from livestock production are becoming sources of great concern. The maintenance of large herds of livestock has tended to exceed the carrying capacity of the ecosystem, particularly in the northern part of the basin where mean annual rainfall is about 1000-1200 mm. During the dry season of November to April, large herds of cattle cross from the neighboring countries to graze on the limited fodder available. This severely exposes the soil to erosion, and watersheds to rapid evaporation. The prolonged exposure of the soil renders it susceptible to erosion and reduces its regenerative capacity. In the northern parts of the basin, large tracts of arable land have become infertile and crop yields have declined tremendously.
Table 21: Erosion Hazards of the Volta Basin in GhanaVolta Basin
System Erosion Hazard
Black Volta
Northern Section: slight to moderate sheet erosion. South-western Section: A combination of moderate to severe sheet and gully erosion but
more of the latter with areas of very severe sheet and gully erosion. SE Section: A combination of moderate to severe sheet and gully erosion but more of
the latter.White Volta Same as in the Black Volta Basin
Daka Combination of sheet and gully erosion but more of the former.
Oti Combination of moderate to severe sheet and gully erosion but more of the latter, especially within the central and southern sections
Lower Volta
NS – Combination of moderate to severe sheet and gully erosion, especially the southern parts. The extreme northern part is however subject to slight sheet erosion.
CS – Moderate to severe sheet and gully erosion but more of the latter. SS – Slight to moderate sheet erosion within the savannah areas and severe to very
severe gully erosion within the forest and highland areas. ES – Severe to very severe sheet and gully erosion but more of the latter.
As increasing populations look for additional lands to farm, deforestation often occurs. Although figures are not known for the Volta basin, nationally deforestation occurs at a rate of 2.5-5% annually in areas that are not forest reserves. Within forest reserves, deforestation occurs annually at a rate of 1.3%.
Bush burning, used to clear land for agricultural purposes, hunting, creating fire belts at the onset of the dry season, and inducing rapid re-growth of rangeland during the dry season, often results in enormous damage to vegetation, wildlife, and properties because they typically are not controlled. The risk of bushfires is highest on the grazing lands in the savannah zones of the
45

basin where as many as 120 to 150 outbreaks can occur within a single year. Along the border areas of the savannah zone, particularly in the Oti, White Volta, and Daka Basins, the problem of bushfires is especially severe, probably as a result of the association with transhumance.
Urbanization in Ghana is another cause of land degradation in several areas within the basin that are becoming population nodes as people migrate from the rural areas to urban centres in search of a better livelihood and to escape tribal conflicts. Settlement growth in areas of the basin considered to be potential biodiversity conservation priority areas, particularly in the White Volta and Lower Volta Basin, is of great concern as important habitat is lost. Although no population statistics are available, however, it is believed that the population in designated protected areas within the basin has not changed significantly over the past decade.
Another problem associated with rapid urbanization is that infrastructure development often lags behind population growth resulting in the development of poor sanitation situations that adversely affect surface water resources. A report by EPA (2001) shows that surface water resources close to urban centres have exceptionally high fecal coliform counts.
Mining is a final cause of land degradation. Several small-scale artisanal groups carry out gold mining in areas underlain by the Birimian formation with little regard for environmental protection. As a result, their operations have led to serious degradation of the land in portions of the Black Volta and White Volta Basin. Limestone mining in the Black Volta basin and in the Lower Volta is also causing damage to land.
White Volta BasinThe predominant land use is extensive land cultivation two-to-six miles from the village on upland areas (NAES, 1993), with widespread grazing of large numbers of cattle and other livestock up to 100 cattle/km2 (FAO, 1991); and compound cropping (home gardening) around the house (Wills, 1962; Adu, 1967: USAID/ADB, 1979; FAO, 1963; NAES, 1993). Estimates of land use and land cover in 1989 showed that about 50% of the land in the northeast and northern parts of the basin was in the compound and bush fallow cultivation cycle (IFAD, 1990). Farm sizes are usually less than 3 acres. Grazing lands including those obtainable under natural condition are generally poor. Annual bush burning further reduces the quality and quantity of fodder.
Extensive valley bottoms in many parts of the basin, particularly in the guinea savannah areas, have in recent years been cultivated for rice under rain-fed conditions. In the north and northeast, the best agricultural soils are derived from granites, sandstones, and greenstones. These areas remain the most densely populated.
A long period of overcrowding in the upland areas away from the valley bottoms, which had been infested with the Onchocerciasis simulium vector, and the intensive cultivation and grazing without proper management practices have led to widespread soil erosion and loss of fertility of the upland soils (Hunter, 1967, Samba, 1994). Outcrops of rocks, iron pan soils, as well as the scarps are usually avoided by farmers and may be uninhabited or only sparsely inhabited. Fuelwood and other wild produce gathering is widespread.
46

Urban land use is small and most intensive in such centres as Bolgatanga, Bawku, Wa, Navrongo, Tamale, and Tumu. Due to the decentralisation of administration to the district level, urban type land use is becoming important in some of the district capitals, especially those along major trunk roads (Walewale).
Black Volta BasinThe major land use is agriculture with food crop cultivation under extensive bush fallow. The major food crops include yam, cassava, maize, sorghum, millet, groundnuts, and beans. Animal grazing on the free range is a significant activity. Animal numbers are large in the northern and middle parts of the basin in Ghana.
In the northwest of the basin, particularly the Lawra district, lands are highly degraded both in terms of physical status and fertility levels and can hardly support meaningful crop cultivation. Vegetation has also been degraded due to the incidence of annual bushfires. This has led to seasonal human migration and great reduction in the number of livestock.
Lower Volta BasinCurrent land use is short bush fallow cultivation along the immediate banks of the river, and less intensive bush fallow cultivation elsewhere. Animal grazing is common while the lakeshores are extensively settled by fishing families. Charcoal burning involving the cutting of wood has become an extensive economic activity in the southern dry forest and transitional environments (e.g., various parts of the Afram sub-basin.)
The Afram plains and other areas in the south have been the focus of increasing settlement and agricultural development since the 1960s, having been generally thinly populated in the past as part of the empty “middle belt” (Dickson and Benneh, 1987). The forest and transitional areas are intensively farmed with cocoa, coffee, plantain, cocoyam, cassava, oil palm, and maize on small bush fallow plots. A large modern commercial farm at Ejura specializes in maize production. Some timber extraction takes place in these areas.
Recent developments, particularly below the Akosombo Dam, include irrigated rice, sugar, and vegetable cultivation in the areas immediately adjoining the Volta River. The construction of the Akosombo Dam has reduced the annual flooding in the Lower Volta lands.
The areas around the coastal lagoons, such as the Songhor, are used for salt mining. Urban land use is limited to a few towns including Kpandu, Kwamekrom, Akuse Sogakpe, and Ada-Foah.
Oti BasinCurrent land use and land cover are extensive bush fallow cultivation and grazing with tree savannah regrowth and small patches of reserved forest areas on the hills in the southeast. The main crops that are grown in the basin include yams, guinea corn, maize, rice, millet, and groundnuts.
Fishing is common along the river while grazing, as in other parts of the savannah, is commonly
47

practiced. Settlements within the basin are small.
Daka BasinThe predominant land use is bush fallow cultivation of yams, maize, and guinea corn with free grazing animals. A recent land use problem within the greater part of the Volta basin especially in Black Volta, White Volta, Afram, Daka, and Oti sub-basins is the activity of alien herdsmen who graze their large herds of cattle indiscriminately, leading to widespread destruction of vegetation and even crop farms. In some cases bushfires are set to hasten to re-growth of fresh vegetation leading to high rates of soil erosion and loss of soil productivity.
v. MALI
Land in Mali officially belongs to the state. This ownership, however, does not preclude the traditional authority, which manages land ownership according to the following criteria:
The water and land belong to the head of the land (first occupants and their descendants). This title can be passed down through the family.
These grounds can then be yielded, lent, pawned or sold to a third party. Village leaders play an important role in resolving land disputes.
Approximately 80% of the land in the basin is used for agriculture, livestock, or dwellings. The high population density in the region places enormous pressure on the land. There is competition between the livestock breeders and the farmers for scarce land and water resources. Resulting in part from the increasing population pressure on the land, agricultural practices are not sustainable. Lands are no longer allowed to lie fallow for a sufficient amount of time before they are replanted.
The basin of the Sourou River is considered to be the granary of the country, but poor agricultural practices have steadily degraded the land. The lands are now no longer very fertile and are prone to wind erosion. The degradation of the soil in Mali has resulted in a decline in production from 4 to 20% in the sahel zone and 8 to 20% in the soudan zone.
There is a great deal of competition for resources between those engaged in agriculture and those raising livestock. The droughts in the northern region of Mali have resulted in livestock herders migrating into the Sourou region to find water. This transhumance results in significant destruction of the forests of Samori.
vi. TOGO
Togo is divided into 6 major agro-ecological zones and 3 are entirely located within the Volta basin. These are: the Dry Savannah zone in the North, the Oti sub-basin and the Southern dry zone of the Atakora Mountains. The dry Savannah zone in the North is dominated by three major soils units: deep weathered ferruginous soils, litisols, and hydromorphic soil with gley while in the OTI sub-basin zone the major unit soils are shallow weathered ferruginous soils and in the southern dry zone of the Atakora Mountains they are tropical ferruginous soils, ferralitic soils
48

vertisols and litisols. Soil erosion is highly present in this zone.
In Togo, the land resources are governed by a combination of local and tribal leaders and the national government.
Degradation of the land in Togo results from a variety of factors. First, trees are harvested at an unsustainable rate in some areas as the demand for wood has increased. This increases erosion and desertification as the land cover is removed. Second, poor agricultural practices, such as the misuse or overuse of pesticides and fertilizers, have damaged soil resources. Finally, overgrazing of the land further exacerbates the problems of erosion and desertification.
Forest resources in Togo have experienced extensive degradation in recent decades due to population increase, unsustainable cutting of trees for firewood and charcoal, unsustainable cutting of sawlogs, clearing for agricultural use, and bushfires. The forests of the Volta Basin provide more than half of the national production of sawlog, and during the political crisis of the 1990s, much illegal cutting of forests took place. At the national level, it is estimated that forest cover is degraded at the rate of 15,000 ha/year.
While there are significant protected areas in Togo, these have been threatened by encroachment from those populations living around the reserves. In 1992, a national commission was formed to examine the areas facing the greatest threats, which suggested turning towards participatory management of protected areas.
Since 1970 when coffee and cacao trees and cotton production were introduced into the region, vegetation cover in the region has changed. During that period, there was significant immigration into the region as people came to grow these products. Considerable amounts of land were cleared in order to make way for agriculture and livestock production. The agricultural practices, including shortened fallow periods, used in the region often result in land degradation. Table 15 shows that the areas under cultivation will continue to increase over the next decade:
Table 22: Rate of Occupation of Cultivable Land in the Basin in Togo (1,708,800 ha)Years Cultivable Area (ha) Cultivated Area (ha) Rate in %1990 1,456,188 264,030 15.452000 1,291,759 434,014 25.392010 1,087,310 646,784 37.852020 782,632 963,862 56.42025 578,179 1,176, 637 68.85
Source : Projection à partir des données des Recensements Nationaux de l’Agriculture (1972, 1982, 1996 – DESA)
Livestock are also taking a significant toll on soil productivity in the region. Although there are little data on the specific effects of livestock, it is clear that they are negatively influencing the area.
The areas that have experienced the most severe degradation include the Savannah and Kara region. The areas of Plateau (Danyi), the Central region (Fazao), Kara (Kantè), and Savannah (Dapaong) have experienced strong degradation. The areas of Plateau (Danyi), Power Station, and of Kara experienced average degradation. The zones with weak degradation extend around
49

the Togo Mountains, in the Plateau area (Danyi and Wawa), in the Savannah area (Mandouri), and Kara (National Park of Kéran).
Table 23: Evolution of Various Vegetation Formations in Togo (1979-1991)
Vegetation Area (km²) Variation in % of the area1979 1991- Dense forests- Mountainous forests- Dry dense forests- Regrown forests- Savannahs with trees- Shrub savannahs- Agriculture zones and others
293186367711591292251381840
1264525315615604827201944
- 56 %- 39 %- 53 %- 47 %- 53 %- 47 %+ 5,6 %
In the area of strongly degraded savannah, the soil erosion was evaluated in 1969 to be between 1,500 and 2,000 tons per km2 annually. The prefecture of Oti has records from the same time period showing from 600 to 1,500 tons per km2. These figures can be multiplied by as much as four or six times to account for the current level of degradation (Kpongou, 1994).
The zones with weaker degradation are currently threatened by the phenomenon of savannisation and from impoverishment of the soil due to the disappearance of forests.
While the causes and effects of land degradation have been described well, supporting data has been provided only sporadically and will need to be augmented. For many countries, information has not been provided on the areas that are experiencing the most severe degradation, the amount of soil lost to erosion annually, and rates of deforestation and desertification. Nor has a quantification of the loss of productivity of lands been provided for all countries. Additionally, information on demand for land resources in the future has not been given, except in the case of Togo.
II.4.6 Agriculture
i. Crop production
Accurate and specific data are not easily available on the economic output of the basin as these data are embedded in the national figures. It may be claimed, however, that agricultural production in the basin, which has a higher rural population than the national averages and, will not be less than 40% of the entire economic output of the basin. To demonstrate the importance of agriculture in the basin, some information from national reports is presented.
In Ghana, Table 17 shows the production levels of selected staple crops by regions in the basin. From the table, it can be observed that the basin in Ghana produces 78% of the total national output of yams, 31% of cassava, 40% of maize, and 69% of rice.
50
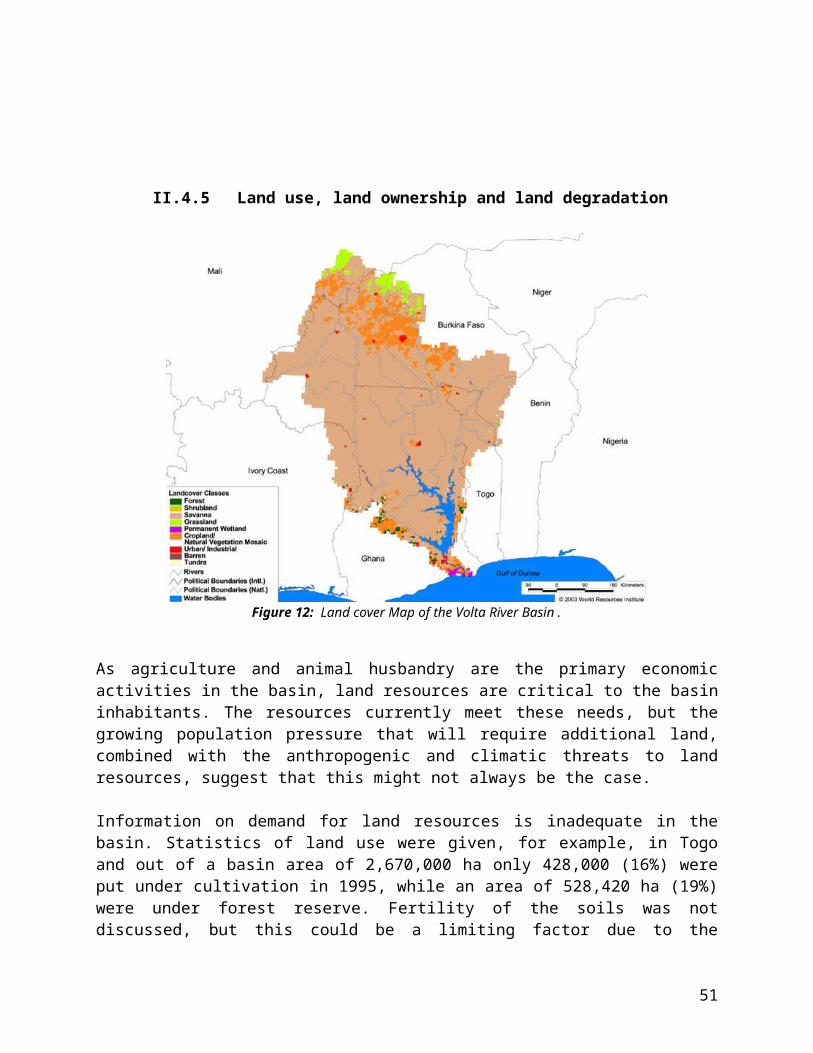
Table 18 shows the statistics of cereal production in two districts of the Volta Basin of Mali. These regions are considered to be the granary of the Mopti region and 85% of the local population is engaged in agricultural production.
Table 24: Production Levels of Selected Crops by Regions in the Volta Basin in Ghana (Tones)
Region Yam% of
National Total
Cassava% of
National Total
Maize% of
National Total
Rice% of
National Total
Upper East - - 16,280 1.6 65,379 26.3
Upper West 263,416 7.8 - 56,725 5.6 9,281 3.7
Northern 518,000 15.4 68,500 0.8 81,800 8.1 71,360 28.7Volta 112,265 3.3 424,350 5.2 48,980 4.8 14,530 5.8
Eastern* 529,014 15.7 767460 9.5 97,014 9.6 2,250 0.9Ashanti* 186,248 5.5 373,674 4.6 12,530 1.2 706 0.3
Brong Ahafo* 1,000,337 29.7 854,659 10.5 91,985 9.1 32 0.0
Greater* Accra - 38,603 0.5 2,269 0.2 8,469 3.4
Total in Basin 2,609,280 77.6 2,527,246 31.2 407,583 40.2 172,007 69.1
National Total 3,363,000 8,107,000 1,013,000 249,000
Source: SRID, MOFA, 2000*Figures are totals for districts that fall within the Volta Basin, whether wholly or partially.
51
Table 25: Cereal Production in the Mopti Region of Mali (Tones)KORO
Cereals/Years 1990-1991 1991-1992 1992-1993 1993-1994 1994-1995 1995-1996 1996-1997 1997-1998 1998-1999 1999-2000 2000-2001Millet 67930 64770 66440 67800 67800 66735 65500 68225 68400 68700 69000
Sorghum 3500 3950 3660 3760 4400 4400 4275 4300 4600 4650Paddy rice 320 270 270 360 330 380 350 4150
Niébé 1545 3245 3640 980 1950 1700 2320 2370 2426Fonio 5020 4190 4264 4990 5350 4530 3380 4030 1940 1940 2000
Groundnuts 1620 5470 5750 5520 5985 5670 6150 5975 6030 6324
BANKASSCereals/Years 1990-1991 1991-1992 1992-1993 1993-1994 1994-1995 1995-1996 1996-1997 1997-1998 1998-1999 1999-2000 2000-2001
Millet 48700 42600 44300 45800 45900 45600 46900 46800 47500 48000 48945Sorghum 6300 8100 8300 8500 9230 9900 9900 9800 9800 10500
Paddy rice 170 275 1050 1600 1900 3250 3800 3900 5600 5400 4150Niébé 2490 4200 4000 1600 1450 1360 1500 1700 1800 1875 2050Fonio 4900 4650 4850 4900 4825 4330 4100 3950 3500 3500 3335
Groundnuts 1760 4750 4800 5800 5800 4900 5650 5100 5850 5750 5880
52

Crop production in Côte d’Ivoire is presented in Table 26.
Table 26 : Crop Production in Côte d’Ivoire (1996)Produce Quantity (Tonnes)Cocoa 816Coffee 1,099Cotton 1,511
Cashew nut 12,482“Roucou” 1,951
Yams 225,703Maize 14,500
Cassava 42,695Rice 2,341
Groundnut 4,330
In Burkina, agriculture is the main activity of the population and it involves mainly food crops, with a clear predominance of cereals. The 1990 MEE/CILSS study which included data for the period covering 1961 to 1988 indicated that the following are the main food crops: sorghum (which takes 51 % of the country’s rain-fed cereal area), millet (40 %), maize (6.7 %), rain-fed rice (1.6 %) and fonio (10.7 %).
The main cash crop is cotton, followed by pulses and oil seeds (groundnuts, sesame, cowpea, Bambara bean, etc…), fruits and vegetables (citrus, mango and vegetable products). Table 20 below shows the production trend between 1992 and 1996 in Burkina Faso
Table 27: Production trends in Burkina Faso (x1000 tons)
Crop Year
1992 1993 1994 1995 1996
Cereals 2091.6 2157.1 2099.5 1936.6 2054.6
Oil seeds and pulses 239 306.3 310.8 293 301.1
Cotton 163.3 116.6 143.1 151.3 170
Fruits and vegetables 319.1 331.9 345.2 360.7 376.9
Source : CC-PASA (1997)
In the Mouhoun sub-basin, cotton and maize are the major crops. During the 1997-1998 season the cotton production the sub-basin accounted for about $50 million in revenue leading to a substantial increase in cultivated land the following years (from 250,000 ha in 1997-1998 to 400,000 ha in 2001-2002). Cereal production (maize, fonio, millet, sorghum) covers 60% of the cultivated land while cash crops (cotton, groundnuts, etc.) only 30%.
Like in most of the riparian countries in the Volta basin, in Togo, productivity in the agriculture sector is low. Agriculture employs 59% of the active population and is widely dominated by a subsistence farming system. Most of the 3.5 millions arable land in Togo
53

is located in the Volta basin and is used for staple crops (maize, fonio, yam cassava, millet sorghum and rice, peanuts etc.) and for cash crop (cotton, coffee, cocoa etc.) Cash crops production is almost entirely intended for export (100,000T of cotton, 20,000T of coffee and 20,000T of cocoa etc.)
Irrigated land as a percentage of cropland for 1995–97 for Benin, Burkina Faso, Côte d’Ivoire, Ghana, Mali, and Togo are 0.8, 0.7, 1.0, 0.2, 2.1, and 0.3, respectively (World Development Report 2000/2001, 2001). Thus, crop production under irrigation is negligible in the sub-region as most arable farming is predominantly rainfed. With current climate change, rainfall is believed to be becoming more variable and unreliable. Extensive crop farming coupled with variable and unreliable rainfall patterns in a region where poverty is predominant has far-reaching implications on the environment and food security.
In the Nakanbe sub-basin alone (in Burkina) more than 400 dams and small reservoirs have been built over the past years to develop irrigation and generate electricity. Thus, about 47 irrigation schemes have been identified but only 2,620 ha have yet been developed and out of that 1,000 ha for the Bagre dam alone. An estimated 2,175 ha of inland valleys is to be added to the potential of irrigable land in the basin. Irrigated land in the Nakanbe sub-basin is relatively small compare to the vast potential for irrigation that the large volumes of water stored behind the numerous dams can offer.
ii. Livestock
The rich savannah grassland provides good fodder for livestock production. Animal husbandry data in Ghana shows that for example four regions, including the Upper-East, Upper-West, Northern and Volta, which fall exclusively in the basin, account for 83.5%, 57.7%, 64.1%, and 68.8% of cattle, sheep, goats, and pigs, respectively. Table 28 gives the population of major livestock in the Ghana side of the Basin.
Table 28: Population of Major Livestock in the Volta Basin in GhanaLivestock Population % of National Total
Cattle 1,111,707 89.1Sheep 1,672,395 69.1Goats 1,854,749 70.5Pigs 231,760 65.3
Poultry 5,479,352 37.5
Livestock is also taking a significant toll on soil productivity in the region. Although there are little data on the specific effects of livestock, it is clear that they are negatively influencing the area.
In Togo livestock production is not as developed as in Burkina and Ghana because of water and pasture scarcity and also the presence of trypanosomiasis vector. Table 29 shows national figures of the 1995 agricultural survey. Most of the Livestock production is located within the Volta basin
54

Table 29: Population of Major Livestock in TogoLivestock Population
Cattle 202,340Sheep 501,139Goats 813,532Pigs 330,750
Poultry 5,738,400
In Burkina Faso, animal husbandly, just like agriculture, occupies an important place in the farming system in all the regions of Burkina. It plays an important role in the economy of the country accounting for approximately 16 % of exports of goods and nearly 12.69 billion CFA in absolute value en 1989 (MARA, 1991). In terms of stocks, there are: 4.260.900 heads of cattle, 5.680.600 sheep, 7.242.100 goats, 552.300 pigs, 445.300 asses, 23.032 horses, 13.056 camels and 18.776.400 fowls (DSAP/MARA, 1995).
iii. Fisheries
Fish production is also an important para-agricultural activity in the basin. In the Oti River in Benin, fish are abundant. Downstream in Togo, fishing is also found to be a secondary activity for most of the population.
During the drought of the 1970s, fishing gained importance as an economic activity and as a source of food in Burkina Faso. Fishing is done in rivers (Mouhoun, Oti, Kompienga, Comoé, Léraba, Béli, Faga, Garoual, Sirba, and Tapoa) and in reservoirs (Kompienga, Bagré, Sourou, Moussodougou, Zega, Loumbila, and Kanazoé). Families of fish that are exploited include Cichlidae, Centropomidae, Mochokidae, Clariidae, Bagridae, Clatoteidae, Characidae, Mormyridae, and Osteoglossidae. Although this area has not been studied adequately, it is estimated that between 8,000 and 8,500 tons of fish are caught annually at a national level, and that this amount constitutes roughly 60-70% of biological capacity. The fish resources are being modified and threatened by overexploitation in certain areas due to the degradation of waterways, however.
Fish farming and fishing in Côte d’Ivoire experienced a takeoff in 1978 with a fishery development project. A provisioning center of 8 ponds with a capacity of 60,000 alevins per year and 52 fish farming ponds were established. The fish farming activity has strongly regressed since 1993, however, largely due to inadequate water resources and the slowdown in farming.
In Ghana, the Volta Lake created by the Akosombo Dam produced about 87,500 metric tons of fish in 2000. It is stated that the Volta Lake produces about 98 % of the inland fresh water fish in Ghana (Braimah, 2001). The increases in fish landings from the Volta Lake in the last half-decade are the result of deployment of active gear, such as the winch net, with unapproved mesh sizes in the lake. Table 30 gives the annual fish production in Ghana between 1996 and 2000.
55

Table 30: Annual Fish Production in Ghana
Source 1996 1997 1998 1999 2000No. % No. % No. % No. % No. %
Marine 378,000 84 377,600 80 336,700 74.3 384,700 83.7 421,320 82.8Inland 74,000 16 94,400 20 116,200 25.7 75,000 16.3 87,500 17.2Total 452,000 472,000 452,900 459,700 508,820
Source: SRID, MOFA, 2001
Prior to the construction of the dam on the Mouhoun in Burkina Faso, fishing in Mali was done using rudimentary equipment and the activity did not provide a significant source of income. When the waters rose, however, several villages moved to the edge of the river and fishing became a more important activity. The industry has since moved from subsistence to commercial.
iv. Forestry
Forests in the basin are cut to provide firewood and charcoal for local populations. Additionally, forests are developed to provide lumber. For example, the forests in the Togo section of the basin provide more than half of the country’s production of sawlog (Togo National Report). Forests in the region have been severely overexploited, however, and are threatened. The forested areas in the Volta basin of Burkina Faso have been reduced by 1.26 million hectares from 1980 to 1992. In 1996 alone, over 105,000 hectares in the Burkinabe portion of the Volta basin have been deforested.
II.5 Water resources
Major sources of water in the Volta River system and riparian countries are natural rainfall, rivers, streams, lakes, groundwater and artificial impounded water (dams, dug-outs and reservoirs). The estimation of direct recharge to the system is based on the assumption that recharge occurs when actual evapotranspiration and direct run-off are balanced by precipitation. This occurs when the soil is saturated to the field capacity, which is likely to occur when precipitation exceeds evapotranspiration. Analyses of rainfall data from various stations within the Volta River system indicate that the months in which precipitation exceeds the evapo-transpiration are usually June, July, August, and September. The annual recharge for the Volta River system ranges from 13.4 % to 16.2 % of the mean annual precipitation. On average, the mean annual recharge of the Volta River system is about 14.8 % of the mean annual precipitation
II.5.1 Surface Water Resources in the Volta River System
i. GHANA
56

Naturally, rainfall is the single source of water that feeds all other sources. Whenever rainfall is insufficient, recharge of water from other sources is low. In the extreme south-west of Ghana, the mean annual rainfall is over 2000 mm. Rainfall reduces eastward and northwards to about 800 mm at Accra (the capital) and 1000 mm in the north of the country (see Figure 3). A comparison of the annual rainfall totals between the period 1960-1991 shows that there is no apparent decrease in rainfall in the northern and coastal parts of the country. The Ashanti and Brong-Ahafo regions may be getting slightly wetter.
Rivers constitute another important source of surface water supply in Ghana. There are 3 main river systems that drain the country. These are the Volta River System, the south-Western River system and the Coastal River System. These cover 70 percent, 22 percent and 8 percent respectively of the total area of Ghana. The Volta River system consists of the Black, White and Main/Lower Volta and Oti and Daka Rivers. The southwestern rivers comprise the Bia, Tano, Ankobra and Pra rivers. The coastal rivers are made up of Chi-Nakwa, Ochi Amissah, Ayensu, Densu and the Tordzie rivers (MWH, 1998).
The yields from runoff in the various river basins generally follow the rainfall pattern. During the month of June, July and October when rainfall is heaviest in the south of the country, flows are high. In northern Ghana, where rainfall is unimodal, high flows occur in August through October. The dry season extends from November to March and low flows are observed during this period throughout the country (FAO-RAF, 2000). The total annual runoff for the country is 54.4 billion m3 of which about 70 % is accounted for by the Volta River system.
All the tributaries of the Volta River enter Ghana and converge in the Lower Volta Basin. Rainfall in the basin varies from approximately 1000 mm to 1600 mm. The surface water resources received annually from outside and within the country are shown in Table 24.
The flows into the Lower Volta were based on specific yield of the catchment and may not be very accurate. Approximately 54% of the flows of the transboundary tributary originate from outside the country. An earlier estimation by Nathan Consortium (1970) puts this figure around 70 %. This may be explained by the reduction of rainfall magnitudes in the Sahel in the high latitudes of West Africa since the 1970s (Nicholson, 1983). Further, in the case of the Oti River, approximately 76 % of the water resources originate from outside the country. The total mean annual flow of the entire Volta River system is estimated to be 38.3 billion m3 (MWH, 1998). The surface water resources of the Sub Rivers in the entire Volta river basin are described below.
Table 31: Surface Water Resources of the Volta River in Ghana
River Mean Flows (m3/s) Mean Annual Flow (109m3)
Water resources that originate from outside the country
White Volta 110.7 3.49Black Volta 103.75 3.27
Oti 276.4 8.72
SUB-TOTAL 490.85 15.49
57

Water resources from within the country
White Volta 192.57 6.08Black Volta 139.55 4.40
Oti 89.1 2.81Lower Volta 289 9.12SUB-TOTAL 710.22 22.41
TOTAL FLOW 1,201.07 37.90Source: (Opoku-Ankomah, 1998)
The White Volta Basin
The White Volta sub-basin covers about 49210 km2 in Ghana, representing 46 % of its total catchment area of 10741.67 km2 distributed in Ghana, Burkina and Togo. Its main tributaries are Morago and Tamne. The Morago has a total area of 1608 km2 with an area of 596 km2 in Ghana and 912 Km2 in Togo. The Tamne lies entirely in Ghana with an area of 855 km2. The White Volta covers mainly the north-central Ghana and some parts of the Upper and Northern Regions. It is located within the Interior Savanna Ecological Zone and, is underlain by the Voltaian and granite geologic formations.
Annual rainfall in the sub-basin ranges between 1000 in the north and 1200 mm in the south; pan evaporation is about 2550 mm per year and runoff from within the basin averages about 96.5 mm per year. The average annual runoff from the White Volta is about 272 m3/s and the mean monthly runoff from within the basin varies from a maximum annual flow of 1216 m3/s to a minimum of about 0.11 m3/s. Potential storage sites have been identified within the basin totaling nearly 8180 106 m3 which could regulate the basin yield at a minimum flow of about 209 m3/s. It contributes about 20 % of the annual total flows to the Volta Lake. Specific suspended sediment yield in this basin is between 8.5 and 14.0 tonnes/yr/km2. Current surface water uses in the basin are estimated at about 0.11m3/s for domestic water supply and about 2 m3/s at numerous small irrigation projects.
Development potentials have been identified in the White Volta Basin which includes a total of 63 megawatts of installed hydroelectric generating capacity, 155,809 hectares of irrigation, flood control, domestic water supply, navigation and recreation.
The Black Volta Basin
The Black Volta has a total catchment area of 142,056 km2 including areas outside Ghana. Only 33,302 km2 (23.5%) of the catchment are located in Ghana. Its main tributaries are Kamba, Kuon, Bekpong, Kule Dagare, Aruba, Pale, San, Gbalon, Chridi, Oyoko, Benchi, Chuco and Laboni. The catchment areas are all within Ghana. The Black Volta basin is primarily located in northern-western Ghana. The basin includes portions of the Upper, Northern and Brong Ahafo Regions.
Annual rainfall in the basin varies between about 1150 mm in the north to 1380 mm in the south; pan evaporation is on the order of 2540 mm per year, and runoff is about 88.9
58

mm per year. The annual runoff from the Black Volta Basin is about 243 m3/s. Mean annual flow is about 8300 106 and the mean monthly runoff from the basin within Ghana varies from a maximum of about 623 m3/s to a minimum of about 2m3/sec. It contributes for about 18 % of the annual total flows to the Volta Lake. The potential storage site at Bui has a volume in excess of 12.3 109m3and could regulate the basin yield at a minimum of about 200 m3/s. The specific suspended sediment yield in this basin ranges from 8.0-12.0 tonnes/yr/km2. Current surface water use is estimated to be only about 0.03 m3/s for domestic water supply.
The surface water resources of the Black Volta Basin consist of runoff from outside and within the country. The inflow into the country can be estimated from the discharges measured at Lawra, which is near the border. Similarly, the total discharge in the basin can be estimated from Bamboi, the southern most gauging station (See Table 25).
Table 32: Surface water flows of the Black Volta in GhanaStation Catchment
area (k m2)Annual discharge (m3/s)
Dry season discharge (m3/s)
Wet season discharge (m3/s)
Lawra (inflow) 90,658 103.75 34.75 172.13Bamboi 128,759 218.97 62.83 373.79Catchment outlet (outflow)
243.30 69.81 415.32
Flow from within the catchment in Ghana
139.55 35.06 243.19
% Inflow/total Outflow 42.64 49.7 41.45
Development potentials have been identified in the basin which includes 230 megawatts of installed hydroelectric generating capacity, about 38,446 hectares of irrigation, flood control, and recreation.
The Lower Volta
The Lower basin is located below the confluence of the Black Volta and the White Volta rivers, excluding the Oti river drainage area. The surface water resources in the basin consist of flows from outside the country and flows from within the country. Discharges of White Volta at Nawuni and Mole River at Lankatere were used to estimate the total basin discharge (Table 33).
Table 33: Surface Water flows of the Lower Volta of GhanaStation River Catchment area Annual
discharge (m3/s)
Dry season discharge (m3/s)
Wet season discharge (m3/s)
Nangodi Yarugu
Red VoltaWhite Volta
10,97441,619
30.7280.00
0.342.17
61.12157.00
Total inflow 110.72 2.51 218.12NawuniLankatere
White VoltaMole
96,957 229.9873.31
18.9515.78
440.05131.33
Total outflow White Volta 303.29 34.73 571.38Total flow from within the catchment area in
192.57 32.22 353.26
59

Ghana% Total inflow/total outflow
36.5 7.2 38.0
The Lower Volta Basin covers a total area of about 68588 km2 and most of that (50 432 km2) is located in east-central Ghana. The basin includes also portions of the Northern, Brong Ahafo, Volta, Ashanti, Eastern Regions and parts of Togo.
Annual rainfall in the basin varies from about 1100mm in the northern part of the basin to about 1,500mm in the central, and to about 900mm in the southern part. Pan evaporation is about 1,800mm per year and runoff from within the basin is estimated to be about 89 mm per year. The natural total mean runoff from the Basin is estimated to be about 1,160 m3/s; the Volta Lake behind Akosombo dam providing extensive regulation. Current river water withdrawals in the basin include about 1.86 m3/s domestic water supply, about 0.71 m3/s for irrigation water supply, and about 566 m3/s for power. In the future, nearly all the regulated outflow from Akosombo will be utilized for power generation. Table 34 gives the estimated annual flow of the tributaries of the Main Volta river basin
Table 34: Sub-basins of the Main Volta River in GhanaSub-basin Area (km2) Specific yield (m3/s/km2)*
1000Estimated annual basin flow (m3/s)
Daka 8,283 7.996 66.2Kularakum 5,931 8.000 47.4Pru 8,728 2.176 19.0Sene 5,366 2.176 11.7Obosom 3,620 2.176 7.9Dayi 1,828 8.289 15.7Asukawkaw 2,233 8.081 18.0Alabo 1,023 3.086 3.2Afram 11,396 8.766 99.9Total flow from the tributaries 48,478 289.0
The surface water resources from within the basin were estimated from the annual flows of these primary tributaries. Summary of flows from outside the country, within the country but outside the Lower Basin and within the Lower Basin are shown in Table 35 below:
Table 35: Surface water resources from within the Lower Volta Basin in GhanaRiver Study (m3/s) Nathan Consortium (m3/s)
Flows that originate from outside the country
White Volta 10.7 152.06
Black Volta 103.75 186.32
Oti 276.40 389.34
Sub-total 490.85 727.72
Flows from within the country but outside the Lower Volta
White Volta 192.57 118.65
Black Volta 139.55 57.20
Oti 89.10 111.85
60

Sub-total 421.22 287.70
Total inflows into the Lower Volta Basin
912.07 1015.44
Flows from within the Lower Volta Total 289.0 140.73
The total inflow into the Lower Volta Basin is 912 m3/s as compared to 1015 m3/s estimated earlier by Nathan Consortium. Thus, the percentage of current flows into the Lower Volta basin is about 90 % of the amount estimated in the earlier report. The observation here is that the flows that originate from outside the country into the Volta Basin have considerably reduced while the flows in the country have increased by 46%.
Development potentials identified in the basin include a total of about 202,350 hectares, 140 megawatts of additional hydropower generating capacity exclusive of potential additional installations at Akosombo, flood control, navigation, recreation and water supplies for domestic, municipal and industrial uses.
Oti Basin
The Oti River Basin has an area of 16801 km2 in north eastern Ghana. The basin includes portions of the Northern and Volta Regions. The basin also expands to Togo where it covers more than 40 % of the land. The relief varies considerably from 150 m to 450 m in Ghana and much more in Togo. Annual rainfall on the basin varies from 1010 mm in the north to 1400 mm in the south; pan evaporation is about 2540 mm per year and runoff is about 254 mm per year.
The average annual runoff from the Oti basin is about 500 m3/s and the mean monthly runoff from the basin within Ghana from 849 m3/s to 1.1 m3/s. The mean annual flow is estimated at 12, 606 x 106 m3. The Oti River Basin contributes about 25 % of the annual total flows to the Volta Lake due to the steep topography and the relatively high rainfall within the basin. Potential storage sites have been identified within the basin, totaling about 406 million m3, which could regulate the basin yield at a minimum flow of about 37 m3/s. Specific suspended sediment yield in this basin is 27.7 tonnes/yr/km2. It is the highest in the Volta River system of Ghana
The Oti River Basin is entirely within the Interior Savanna Ecological Zone and is underlain by the Voltaian and Buem geologic formations. Current surface water usage in the basin is negligible and there have been no irrigation development potentials identified in the basin.
Daka basin
The Daka Basin covers an area of 7,424 km2 located almost entirely in eastern part of northern Ghana. The annual rainfall on the basin varies between 1120 mm and 1340 mm and most of the biophysical characteristics found in the basin are similar with those of the Oti River Basin.
61

Another important source of surface water supply in Ghana is from surface impoundments and dugouts. The largest reservoir in the country is the man-made Volta Lake created in 1964 at Akosombo to generate hydro-electric power. The dam is 88.2 m high with a crest length of 638.4 m and a generating capacity of 833 MW. It has a mean annual inflow of 4.05 ha/m and a live storage of 6.03 ha/m (FAO-RAF, 2000/1)
ii. BURKINA FASO
Burkina Faso has a total mean annual precipitation volume of 165 km3, of which only 9 km3 is runoff. The country has eight large dams in operation, of about 2100 dams in total. The total storage volume of all reservoirs is approximately 4.6 km3
The hydrographic network of the country is characterised by three great river basins: the basins of the rivers Nazinon, Nazinga and Mouhoun, of the River Comoé and the River Niger.
Figure 13: Hydrographic network of Burkina Faso
The rivers Mouhoun (Black Volta) and Nakanbé (White Volta) constitute the two main sub-basins of the Volta Basin in Burkina Faso. The country has other smaller rivers – the Bougouriba, Comoé, Béli, Sirba and Tapoa. Many of these rivers dry up in the dry season (October-June), with the exception of the Mouhoun and Comoé in the south-west which are fed by springs (Bandre et al., 1998).
Mean annual rainfall in the Mouhoun and Nakanbé sub-basins varies from approximately 900 mm to less than 600 mm. Over the past forty years, the precipitation patterns have been of increased dryness, especially between 1970 and 1980. While rainfall increased between 1985 and 1995, the last decades are still marked by the following trends:
62

decrease in river flow, decreased availability of groundwater, the drying up of source waters, and degradation of vegetation cover.
The surface water resources of the basin are made up of stream flows and water in reservoirs. Table 36 illustrates the distribution of the available surface water resources in the Volta River Basin of Burkina Faso.
Table 36: Potential Surface Water Resources of the Volta Basin in Burkina Faso
Sub-basinAnnual Flow
Volume (x 109m3)
Volume inReservoirs(x 109m3)
Potential in theBasin
(x 109m3)Mouhoun (Black Volta 2.64 0.29 2.75Nakambé (White Volta) 2.44 2.20 3.32
Total 5.08 2.49 6.07Source: Etat des lieux des ressources en eau et de leur cadre de gestion
The Nankambe River is one of the main tributaries of the Volta River. Its basin covers about 81,932 km2 located in the following four sub-basins:
Sissili basin 7,559 km2
Nazion basin 11,370 km2
Pendjari basin 21,595 km2
Nouhoa basin 4,050 km2
The first intermittent flows in the Nakambe occur in May. They become permanent flows in July and August at the Wayen station (20,800 km2 watershed) and larger downstream when they reach Bagre (33,120 km2) where average values of 65.4 m3/s in July, 145 m3/s in August and 107 m3/s in September. During these three months, 88% of the annual flows at Bagre (29.7m3/s representing 946 Mm3) occur.
The Nazinon and the Sissili Rivers are two of the Nankambe tributaries that collect runoff water from the South-West part of the Mossi plateau. The Pendjari River which forms the border with Benin has three main tributaries: the Doudodo, the Singou and the Kompienga Rivers. These rivers flow during the rainy season (750 -900 mm) and dry up in November.
Annual surface water resources from the basin are shown in the following Table 37.
Table 37: Potential of Surface Water Resources of the Nakambe BasinSub-basin Mean flow
(m3/s)Contribution of the basin
(106 m3)Nakambe 33.4 1,054Nazinon 6.04 160Sissili 2.11 67
Pendjari 28.5 899Nouhao 7.59 239
Total Nakambe Basin in Burkina 77.64 2,444
Existing reservoirs in the Nakambe basin have a total storage capacity of 4.3 billion m3
63

including the Ziga reservoir. About 27 of the main reservoirs in the basin are frequently monitored and the total volume stored in these reservoirs is estimated at 2.04 billion m3
which represent half of their capacity. Bagre and Kompienga are the largest reservoirs in the Nakambe basin and are used for power generating, irrigation and environmental purposes.
The Mouhoun River is the main tributary of the Volta River. Its basin covers 91,036 km2 and can be divided in three sub-basins:
Upper Mouhoun basin 20,978 km2 Sourou basin 15,256 Lower Mouhoun basin 54,802 km2
The upstream portion of the Mouhoum has perennial flows with base flows rarely below 2 m3/s at the Samendeni station or at Nasso on the Kou River. At the confluence with the Sourou River, the Mouhoun and its main tributaries (Plandi, Kou, Voun Hou) prouduce a mean flow of about 25 m3/s. However this flow is irregular. With the construction of a water abstraction structure on the Sourou River in 1984 and the recurrent precipitation deficits, the natural regime has been changed during the base flow and flood periods. Thus, the estimated average base flow of 5.9m3/sec at Boromo (ORSTOM, 1977) has since decreased to a dry up of the river in 1984. Similar observations have been made at the Dalopa and Noumbel stations where average flaws were estimated at 7.35 and 9.3m3/s respectively. Table 38: Potential of surface Water Resources of the Mouhoun Basin in Burkina Faso
Sub-basin Mean flow(m3/s)
Contribution of the basin(106 m3)
Mouhoun at Ouessa 43.0 1,356Sub-basin Bougouriba 28.0 884Su-basin Bambassou 12.9 405
Total Mouhoun Basin in Burkina 83.9 2,646
Existing reservoirs in the Mouhoun basin have an overall capacity of 438x106 m3. A planned reservoir at Samandeni on the Mouhoun, 30 km north-west of Bobo-Dioulasso will alone hold about 500x106 m3. Only the Sourou reservoir at Yaran with a capacity of 250x106 m3 is currently monitored by hydrologists. This reservoir likewise those on the Nakambe River have never reached their capacity. It is estimated that existing reservoirs in the basin store about 300x106 m3. Small reservoirs however, get full during normal years.
64

Figure 14: Location of reservoirs in the Volta Basin
Figure 15a: Water balance of the Mohoun River Basin
65

Figure 15b: Water balance of the Nankambe River Basin
iii. MALI
Though very little data are available on water resources in Mali, the country possesses substantial surface water resources made up of: (1) rainwater, ranging from 1,400 mm per year in the south to less than 150 mm per year in the north; (2) perennial surface water, with an annual flow of about 56.5 billion cubic meters, divided between the Niger River at Koulikoro (46 billion) and the Senegal River at Kayes (10.5 billion); and (3) non-perennial surface water like the Sourou River (the Volta Basin of Mali) (N'Djim and Doumbia, 1998)
In the region of the Volta Basin of Mali, water has been in such short supply that the first priority has been to provide water to the inhabitants, while research was overlooked. The Sourou River is the main source of surface water in the region. Annual rainfall is approximately 400 mm and surface flows are only ephemeral as streams dry up after 3 to 5 months of the rainfall season. Discharge measurements are limited and available data could not allow for quantitative assessment of surface water resources. However, about 52% of the villages in the region depend on surface water (i.e., streams, lakes, ponds, etc.) for short periods.
The level of water of the Sourou River in Mali increased significantly after a dam was constructed in Burkina Faso in 1989. The valley of Sourou now forms the northern end of the reservoir created by the dam.
The only other sources of surface water are small temporary ponds that appear in Seno during the winter. There are 12 ponds in the southern zone (Dioura) and 9 others in the District of Bankass. They dry up, however, after 3 to 5 months.
The chemical and bacteriological quality of the surface water is generally bad, in large part due to fecal contamination. The polluted water is a source of water-borne diseases.
66

iv. TOGO
The northern section of the Oti basin of Togo receives between 1000 and 1200 mm of rainfall annually, while the southwest region receives from 1000 to 1500 mm per year.
Surface water resources estimated for the basin are about 4.71 x 10⁹m3 per year. Most streams dry up during the dry seasons due to high evapo-transpiration. In the northern part of the basin, the Oti, enlarged by its tributaries and Mô exceed 100 m3/s in the Savannah region and 100 to 300 m3/s in the area of Kara. The extreme variability of the flows between the wet and dry seasons makes depending on the surface water for irrigation difficult. In the southwestern section of the basin, the Menou, Wawa, and Danyi have much smaller flows of between 1 and 6 m3/s, but these are perennial flows as the climate is wetter.
Togo’s water shortage is projected to be exacerbated by the effects of climate change. It is estimated that by 2025, average monthly temperatures will rise from South to North 0.48 to 0.58%, which is 0.8 to 1° C over 1995 levels. Precipitation is expected to decrease 0.1 to 0.3%.
v. CÔTE D’IVOIRE
The lack of hydrometeorological, hydrogeologic, hydroclimatic, water quality, and sediment transport data for the Black Volta Basin of Côte D’ivoire makes it difficult to accurately evaluate the surface and subsurface waters in the Côte D’ivoire area. Average annual rainfall over the basin is approximately 1,000 mm. The surface water resources derived from the Black Volta are about 0.788 x 10⁹m3/yr. There are 43 dams established in the basin, with a storage capacity of 3 million m3.
vi. BENIN
The average annual rainfall in the Oti River Basin of Benin is approximately 1,100 mm. In normal years, flows are about 58.6 m3/s and the annual flow volume is estimated at approximately 1.85 x 10⁹m3. Estimation of groundwater resources in the Oti Basin is difficult since these resources are almost inseparable from the groundwater resources of the Niger basin in Benin.
Benin has a hydroelectric power station on the Oti River with a storage capacity of 350 million m3 and the capacity to produce 15 MW. Additionally, a hydroelectric power station is planned at Pouya (Natitingou) on the Yéripao.
II.5.2 Groundwater Resources, Recharge, and Quality
The geological characteristics of the basin show that the rocks have no inherent porosity. Formation of aquifers, therefore, depends upon secondary porosity created as a result of fissuring or weathering. Muscovite or hornblende can weather to approximately 30 m,
67

whereas the Birimian formation can weather to a depth of approximately 73 m, thus giving rise to a thicker aquifer. The hydrogeological characteristics of the basin in Ghana are described in Table 39 below:
Table 39: Hydrological Characteristics of the Groundwater aquifers in the Volta Basin of Ghana
Run-off Coefficient(%)
Borehole Yields (m3/h)
Mean Borehole Yields(m3/h)
Specific Capacities(m3/h/m)
Depths to Aquifer(m)
Mean Depth to Aquifer(m)
Depth of Boreholes(m)
Mean Depth of Borehole(m)
White Volta 10.8 0.03 –
24.0 2.1 0.01 – 21.1 3.7 – 51.5 18.4 7.4 – 123.4 24.7
Black Volta 8.3 0.1 – 36.0 2.2 0.02 – 5.28 4.3 – 82.5 20.6
Oti 14.8 0.6 – 36.0 5.2 0.06 – 10.45 6.0 – 39.0 20.6 25.0 – 82.0 32.9Lower Volta 17.0 0.02 –
36.0 5.7 0.05 – 2.99 3.0 – 55.0 22.7 21 – 129.0 44.5
Source: MWH (1998)
The table indicates that run-off coefficients are in general low. Direct recharge of aquifers from precipitation is less than 20% across the basin. These figures do not give a good outlook for recharge of the groundwater resources.
The borehole yields are quite variable with a mean for all the sub-basins between 2.1 and 5.7 m3/h. These figures suggest that the groundwater yields in the basin are low. The figures in the table show that the region has low hydraulic transmissivity.
The depth of aquifers is also variable in the basin. Studies have shown that there is no correlation between depths to aquifer and borehole yields. The results indicate that groundwater resources are not abundant in the basin and face threats if not properly managed (UNEP, 2002).
i. GHANA
(a) The Hydrogeology
Ghana has two major hydrogeologic provinces. These are: (1) the basement Complex composed of Precambrian crystalline igneous and metamorphic rocks, and (2) Paleozoic consolidated sedimentary formations (See figure 10). Minor provinces consist of (1) Cenozoic, Mesozoic, and Paleozoic sedimentary strata along narrow belts on the coast; and (2) Quaternary alluvium along the major stream courses.
The basement complex underlies about 54% of the country and is further divided into sub-provinces on the basis of geologic and groundwater conditions. Generally, these sub-provinces include the metamorphosed and folded rocks of the Birimian system, Dahomeyan system, Tarkwaian system, Togo Series, and the Buem Formation (Figure
68

17). The basement complex consists mainly of gneiss, phyllite, schist, mihnatite, granite-gneiss, and quartzite.
The Paleozoic consolidated sedimentary formations, locally referred to as the Voltaian Formation, underlie about 45% of the country and consist mainly of sandstone, shale, arkose, mudstone, sandy and pebbly beds, and limestone. The Voltaian Formation is further subdivided on the basis of lithology and field relationships into the following sub-provinces: (1) Upper Voltaian (massive sandstone and thin-bedded sandstone); (2) Middle Voltaian (Obusum and Oti Beds); and (3) Lower Voltaian (Figure 18).
The remaining 1% of the rock formation is made up of two coastal provinces (the coastal Block-Fault Province and the coastal-Plain Province) and the Alluvial Province. The coastal Block-Fault province consists of a narrow discontinuous belt of Devonian and Jurassic sedimentary rocks that have been broken into numerous fault blocks and are transacted by minor intrusive. The coastal plain hydrogeologic province is underlain by semi-consolidated to unconsolidated sediments ranging from Cretaceous to Holocene in age in south eastern Ghana and in a relatively small isolated area in the extreme south western part of the country. The Alluvia hydrogeologic province includes narrow bands of alluvium of Quaternary age, occurring principally adjacent to the Volta River and its major tributaries and in the Volta delta (Ministry of Works and Housing, 1998; Dapaah-Siakwan and Gyau-Boakye, 2000).
69
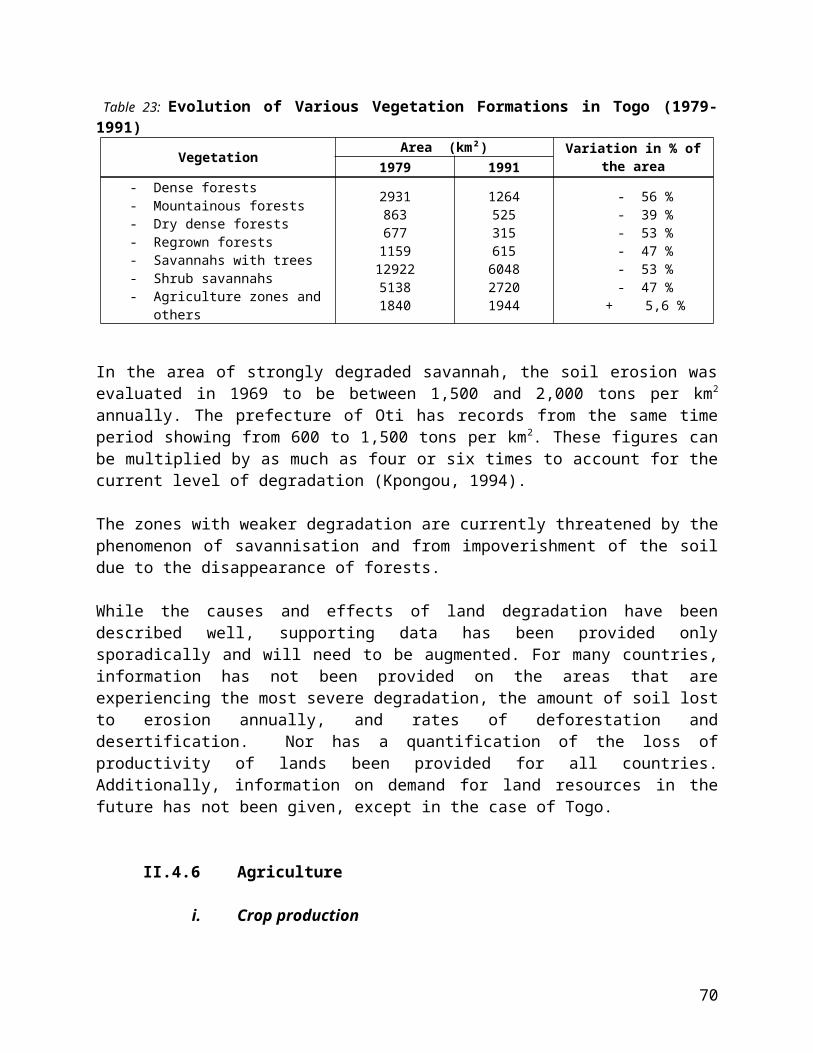
Figure 16: Hydrogeological provinces and river systems of Ghana (Geological Survey of Ghana 1969)
70

Figure 17: Hydrogeological subprovinces of the Basement Complex (Ghana Geological Survey 1969)
71

Figure 18: Hydrogeological subprovinces of the Voltaian System (Ghana Geological Survey 1965)
72

(b) Aquifers found in Ghana
The rocks that underlie 99% of Ghana (the basement complex and the Voltaian formation) are essentially impermeable and have little or no primary porosity. Therefore groundwater occurrence in Ghana is associated with the development of secondary porosity as a result of jointing, shearing, fracturing and weathering. This has given rise to two main types of aquifers: the weathered zone aquifers and the fractured zone aquifers. The weathered zone aquifers usually occur at the base of the thick weathered layer. The weathered layers vary, from 0 m (outcrops) to about 100 m. It is thickest in the wet forested south-western part of the country where it reaches an average thickness of 60 m and thinnest in the semi-arid zone in the extreme northeast where the mean thickness is 10 m. The fractured zone aquifers are normally discontinuous and limited in area. Due to the sandy clay nature of the weathered overburden, the groundwater occurs mostly under semi-confined or leaky conditions. The yield of these aquifers rarely exceeds 6 m3/h (Ministry of Works and Housing, 1998).
Three aquifers occur in the remaining 1% of Ghana, mainly in the extreme south eastern and western part (with cenozoic and mesozoic sediments formation). The first aquifer is unconfined and occurs in the recent sand very close to the coast. It is between 2 m and 4 m deep and contains fresh meteoric water. The intermediate aquifer is either semi-confined or confined and occurs mainly in the red continental deposits of sandy clays and gravels. The depth of this aquifer varies from 6 m to 120 m, and it contains mostly saline water. The third aquifer is the limestone aquifer. It varies in depth between 120 m and 300 m. The groundwater in this aquifer, which occurs under artesian condition, is fresh. The average yield of the limestone aquifer is about 148 m3/h (Ministry of Works and Housing, 1998; Dapaah-Siakwan and Gyau-Boakye, 2000).
(c) Borehole Yields
Yields from boreholes are highly variable because of the lithological varieties and structural complexities of the rocks. In 1994, the Water Resources Research Institute made an analysis of borehole yields for the various geologic formations in the country. The least explored geologic unit is the Voltain system (underlying also the Volta basin). Table 40 gives a summary of data on borehole yields for the various hydrologic units in the country.
73

Table 40: Summary of borehole yields of hydrologic provinces and sub provincesHydrogeologic province Borehole-completion Range of yield Average Yield and subprovince success rate (%) (m3/h) (m3/h)
Basement Complex
Lower Birimian System 75 0.41-29.8 12.7
Upper Birimian System 76.5 0.45-23.6 7.4
Dahomeyan System 36 1-3 2.7
Tarkwaian System 83 1-23.2 8.7
Togo Series 87.9 0.72-24.3 9.2
Buem Formation 87.9 0.72-24.3 9.2
Voltaian System
Lower Voltaian 55 1-9 8.5
Middle Voltaian (Obusum and Oti beds) 56 0.41-9 6.2
Upper Voltaian 56 1-9 8.5
Cenozoic, Mesozoic, and Palozoic
Sedimentary Strata (Costal Provinces)
Coastal Block-Fault Province 36 1-5 3.9
Coastal-Plain Province 78 4.5-54 15.6
Alluvial Province 67 1-15 11.7
Source: Dapaah-Siakwan and Gyau-Boakye (2000)
Again, in 1994, the Water Resources Research Institute prepared a borehole-yield map of Ghana based on available data on borehole yields; static water level and other vital information (Figure 19). This map indicates the borehole yield to be expected in any area within the country.
74

Figure 19: Distribution of borehole yield in Ghana (Water Resources Research Institute 1994)
75

(d) Groundwater abstraction and distribution
Groundwater is abstracted from all the geological formations in the country. In 1994 there were over 45,000 abstracting systems made up of approximately 10,500 boreholes, 45,000 hand-dug wells and some dug out, all over the country (Kortatsi, 1994). Current available information shows increase in the number of abstraction systems, possibly due to increase in population, which has resulted in a higher demand for water for various uses particularly domestic. As at march 1998, the number of hand dug wells had risen to about 60,000 whiles the number of boreholes reached 11,500 in the year 2000 (Dapaah-Siakwan and Gyau-Boakye, 2000); making a total of over 71,500 systems. From the borehole and well figures, it could be inferred that the rate of construction of wells in Ghana (1994-1998), and that of boreholes (1994-2000) were 10 per day and 1 every other day respectively. A hand dug well is a cost-effective device for extracting shallow groundwater bodies and it is a technology that has found extensive use as a traditional water supply system in many rural and urban communities throughout Ghana.
A typical hand dug-well in Ghana consists of three components; the intake, a shaft and the wellhead (DANIDA, 1993). Boreholes are also found in use in several areas in Ghana though the cost involve limits its use (the average cost of drilling a borehole in Ghana, including pump testing is about US $3,920). Most of the boreholes have been drilled through one project or the other for community use. Few private organizations and very few individuals own their own boreholes.
There is limited data on hand-dug wells in the country, except the Volta region where an inventory had been done and from this inventory, it can be inferred that hand dug well yield varies from 0 (dry well) to 26 m3/day with mean of 6 m3/day (Kortatsi, 1994). Therefore, the estimated total abstraction of hand dug wells per year is 1.3x10⁸ m3. Figure 20 gives the regional distribution of borehole (NB) and the estimated annual abstraction (AA) of groundwater based on 12 h of pumping per day. The estimated total annual abstraction of boreholes is 1.41x10⁸ m3.
76

Figure 20: Regional distribution of borehole and annual abstraction
(e) Aquifer recharge
There is little information available on groundwater recharge in Ghana. Recharge to all the aquifer systems in Ghana is mainly by direct infiltration of precipitation through fracture and fault zones along the highland fronts and also through the sandy portions of the weathered zone. Some amount of recharge also occurs through seepage from ephemeral stream channels during the rainy seasons. Some indirect recharge principally occurs in the lower rainfall, low relief and low permeability areas. This happen when runoff from watershed outside the areas or a particular storm event is of sufficient magnitude to cause runoff. The drainage courses or stream which act as conduit for this overland flows are generally weak fissured zones which allow a greater part of the runoff to infiltrate through their beds to the groundwater table.
Data on water level fluctuation are scarce but generally support the contention of high recharge in some areas; observations carried out in the Upper Regions between 1976 and 1979 show oscillation of 0.3 to 5.4 m between the dry and wet seasons with the peaks normally in September/October. Wells monitored by the Water Resources Research Institute between 1980 and 1989 show generally irregular movements of groundwater levels and may have been affected by pumping either of the monitoring well itself or other wells in the vicinity. Nevertheless, there is some indications that the groundwater system is active rather than passive, and is affected by significant recharge and discharge on an annual cycle (World Bank Country Report, 1992).
77

The minimum recharge for the sub-basins within the Volta Basin of Ghana and replenishable groundwater capacities are presented in the following table.
Table 41: Minimum Recharge and Replenishable Groundwater Capacities
Sub-Basin Minimum Recharge(mm)
Replenishable Groundwater Capacities(x 109m3)
White Volta 151 6.6Black Volta 205 3.4
Oti 175 3.7Lower Volta 205 8.2
(f) Groundwater quality
Previous studies (Nathan Consortium studies, 1970; Amuzu, 1978; Andah, 1993; Kortatsi, 1994; Ministry of Works and Housing, 1998; Darko et al, 2003) revealed that the quality of groundwater in Ghana is generally good for multi-purpose use except for the presence of low pH (3.5-6.0) waters, high level of iron, manganese and fluoride in certain localities as well as high mineralization with TDS in the range 2000-14,584 mg/l in some coastal aquifers particularly in the Accra plains. In Tamale and Atiave, fluoride concentration levels could be as high as 5.0 mg/l and 20.0 mg/l respectively. About 30% of all boreholes in Ghana have iron problems (Ministry of Works and Housing, 1998). High iron concentration in the range 1-64 mg/l have been observed in boreholes in all geological formations. This iron originates partly from the attack of low pH waters on corrosive pump parts and partly from the aquifers (Ministry of Works and Housing, 1998). The percentage of iron derived from the aquifers is however unknown. Table 42 gives the mean values of chemical analyses of many water samples in the various geologic formations in Ghana.
The waters in many hand-dug wells look turbid and polluted as they contain high levels of nitrate in the range of 30-60 mg/l and abundant coliform (Kortatsi, 1994). This is probably due to improper construction and inadequate protection of wells sites from surface runoff and animal droppings.
Table 42: Chemical analysis of water samples in the geologic formations of Ghana (all values except pH are in mg/l)
Gneiss Granitic Phyllites sandstone Mudstone Sand and Limestone Quartzite
formation and shale gravel
pH 7.5 6.99 6.83 6.95 7.64 7.53 7.7 6.36
Total dissolved salts 4888 387.38 211.19 533.45 424.66 632.04 932.04 398.26
Calcium (Ca) 595 49.38 32.09 25.08 26.10 68.72 58.08 42.06
Magnesium (Mg) 207.2 19.06 15.67 7.57 9.12 33.50 36.14 23.37
Sodium (Na) 720 47.99 11.67 262.55 125.39 134.45 296.77 24.53
78

Chloride (Cl) 1790 73.48 9.90 70.42 42.04 173.56 196.86 103.61
Sulphate (SO4) 1800 10.60 7.16 65.17 11.18 101.19 77.25 60.06
Bicarbonate (CO3) 34 81.17 104.14 97.49 189.29 154.59 149.66 67.05
Total Iron (Fe) 0.1 1.01 2.15 1.95 0.645 1.84 0.467 2.87
Maganese (Mn) 0.05 0.44 0.39 0.17 0.10 0.22 0.16 0.45
Flouride (F) 0.25 0.35 0.315 0.775 0.57 0.60 1.76 0.23
Nitrate nitrogen (NO3) 0.5 1.605 0.59 0.75 0.135 2.22 1.79 2.32
Total hardness 2340 172.49 123.70 70.76 222.77 230.35 229.94 179.61
Source: Kortatsi (1994)
ii. Burkina Faso
(a) Aquifers in Burkina Faso
The types of aquifers found in Burkina Faso can also be classified as continuous and discontinuous. The continuous aquifers are the continental terminal aquifers located in the Southern part of the Gondo plain and the weathered zone aquifers found in areas including Bobo Dioulasso and Tenkodogou. The discontinuous aquifers are the Precambrian bedrock, the Gourma formation (y doubam group) and the Gres premier and intracambrain.
The top part of the continental aquifer is mainly made up of clay, sand, and gres. The bedrock consists of fractured and weathered schists and dolomite. The depth of the water table in this type of aquifer is between 10 and 80 m. Area covered by this aquifer is about 11,000 Km2 with a recharge of 430 million m3 (equivalent to annual infiltration of 38 mm). The saturated depth of the aquifer decreases from southwest to northeast, from about 50 to 5 m.
Assuming a draw down of one-thirds of the saturated depth, it is estimated that about 1-3 billion m3 of water can be extracted from this aquifer. Generally, the quality of water from this aquifer is very good, but it becomes poorer as one approaches the middle of the Gondo plain. In the Northern part of Bobo Dioulasso, this aquifer has a depth of 10-30 m and mainly used with shallow wells. Not much is know about its recharge in Bobo area but most recharge is done through preferential flow. Water from this aquifer is also used for industrial and irrigation purposes though there was no information on the volume involved (CIEH, 1976; BILAN D’EAU, 1993).
The weathered zone aquifer is found in the Bobo Dioulasso region (where it is part of the “zone de socle” aquifer system), Tenkodogou region and other areas of Burkina Faso. In general, this aquifer has a depth of 10-50 m. Many studies have shown that the depth is a determining factor for the success of landing water. That is, borehole or well success rate increases with depth. In Bobo Dioulasso, this aquifer has 10-30 m of weathered layer which gives an average yield of 0.5-5 m3/hr with transmisivities between 1.9-5.5x10⁻⁴
79

m3/s. The piezometric head is between 10 m and above the bedrock. 83 % of the flow in this aquifer is found in up to 50 m depth; 93 % within 60 m; and 90 % within 70 m. Optimum depth is between 45-65 m (CIEH, 1976; BILAN D’EAN, 1993).
The Precambrian bedrock type of aquifer consists of crystalline, volcanic and metamorphic rocks; granite, schist, green rock, etc. Availability of water resources in this aquifer is linked to the fracturing or weathering of these rocks. The weathering of schists produces clay which makes it impervious, thus water can only be found by drilling beyond these layers to the fractured layers. The coverage area of this aquifer is 225,000 Km2 and recharge is estimated at between 3-4x10⁹m3 (equivalent to annual infiltration of 17 mm) (CIEH, 1976; BILAN D’EAN, 1993).
The Gourma formation (y doubam group) type of aquifer is characterised by dolomite and calcareous rocks that contain water in fractured zones. Recharge by rainfall is very low. Much is not known about this aquifer and needs research to understand its characteristics.
Gres premier and intracambrain aquifer is not well known but very important. It has a good yield and located in areas with many perennial rivers in the Bobo Dioulasso area. It covers an area of 30,000 Km2 and has a discharge of 1.9 billion m3 (equivalent to annual infiltration of 60 mm). It has a transmisivity of 1.4-4.8x10⁻³ m2/s and a yield of 1 m3/hr/m. The thickness of this aquifer in this area is estimated as 100 m. In general, discharges increases with depth. Research is needed to know more about this important aquifer (CIEH, 1976; BILAN D’EAU, 1993).
(b) Groundwater availability
Given the climatic conditions of Burkina Faso, surface water is in limited supply and groundwater is therefore an important resource. Rural water supply projects rely mainly on groundwater, although this is also scarce in many areas. Dammed river courses typically provide urban supplies. Only around 25% of the population has access to safe drinking water. Traditional sources of water were hand-dug wells (as well as ponds used in the rainy season). Currently, groundwater is also abstracted from a number of tubewells, typically equipped with handpumps. Tubewells generally source groundwater from fractures within the basement complex, while hand-dug wells are largely sourced from the weathered overburden layer. Yields from tubewells and dug wells in the basement areas are generally low and many dry up seasonally (UN, 1983).
Groen et al. (1988) noted groundwater levels in north-western Burkina Faso of some 10–60 m below surface with a seasonal variation of around 1–2 m. In the sedimentary rock formations along the northwest border region, groundwater availability is also limited, although the dolomitic limestones form the best aquifers. The younger sedimentary formations cropping out in the north constitute a small aquifer which is connected with underlying dolomitic limestone.
Based on the many work of drilling carried out on all the territory of Burkina, it was
80

possible to classify areas of the country according to their groundwater potential. From this, it is noted that about 45 % of the territory of Burkina is in the category described as bad or poor potentiality (Table 43)
Table 43 : Groundwater potentiality of Burkina Faso Groundwater potential Surface area (Km2) Proportion (% territory)
Bad 74,000 27Poor 52,000 19Good 112,000 41
Very good 36,000 13Total 274,000 100
Source: BILAN D’EAN (1993)
(c) Aquifer yield
Geology, very largely, determines the yield of aquifers. Thus in the crystalline basement zones, which constitutes more than 80 % of Burkina, yields obtained in drillings are about 2 m3/h. The consequence is that in these zones, the large needs (urban water supply, industries and irrigation) are thus difficult to satisfy. On the other hand, in the sedimentary zones, significant yields are frequently obtained, sometimes more than 100 m3/h. Figure 21 shows discharges of wells drilled in the entire country.
Figure 21: Map showing discharge of wells across Burkina Faso
In an IDRC project, 2 out of a total of 16 (test-) drillings with depths to 80 m were dry,
81

whereas the yield of 14 wells was between 0.6 and 6 m3/h. Success rate of drilling varies but usually its quite low (70% for wells with a flow from 0.5 to 5 cubic metres per hour; 15% for wells with a flow of more than 5 cubic metres per hour and for those with a higher discharge is only 2.5%). Low success rates have been attributed partly to the fact that drilling is local and lacks modern exploration methods (Faruqui, 2003).
Figure 22 shows the distribution of piezometric heads of different wells drilled all over Burkina Faso.
Figure 22: Distribution of Piezometric heads of different wells in Burkina Faso
(d) Recharge Mechanisms
Two mechanisms of recharge of the groundwater table have been identified in Burkina Faso. These are the direct and indirect recharge mechanisms. With the direct recharge, rainwater infiltrates directly into the ground and percolates towards the water table. With the indirect recharge, infiltration takes place in the low points (hollows, streams, alluvial valleys) where water concentrates after runoff. The environment plays a great role on infiltration. Indirect infiltration is more significant in the areas affected by the impoverishment of the soils where the recharge of the water tables occurs primarily around the hollows. The annual recharge of the water table is estimated at 5 mm in the North and 50 mm in the South. Depending on the permeability of the soil, this recharge
82

varies between 0.1 and 10 % of annual rainfall. For the whole of Burkina Faso, recharge is estimated at 9.5 billion m3 per annum (FAO, 1995).
(e) Groundwater Abstraction and Distribution
The groundwater resources available in Burkina Faso are mainly provided by boreholes. In all, there are about 24,350 boreholes spread across the entire country. Figure 23 shows the spatial distribution of boreholes in the various Provinces in Burkina Faso.
GOURMANB:522
COMOENB:956
HOUETNB:749
TAPOANB:348
SENONB:789
KOSSINB:353
SISSILINB:383
SOUMNB:827
YATENGANB:1177
PONINB:349
SOUROUNB:560
OUDALANNB:564
GNAGNANB:786
MOU HOUNNB:450
BOULGOUNB:995
BAZEGANB:408
SANMATENGANB:908
BAMNB:581
SANGUIENB:738
KENEDOUGOUNB:383
BOUGOURIBANB:155
NAMENTENGANB:423
OUBRITENGANB:773
NAHOURINB:341
PASSORENB:640
BOULKIEMDENB:1392 GANZOURGOU
NB:979
ZOUNDWEOGONB:591
KOURITENGANB:515
Figure 23: Spatial distribution of boreholes in Burkina Faso
(f) Quality of aquifers in Burkina Faso
The quality of ground waters in Burkina can generally be considered satisfactory, with a few exceptions (WaterAid, 2003). Water from shallow aquifers is more polluted than the deeper aquifers due to infiltration from the soil surface. Pollution is at its peak in August, which coincides with the start of the rainfall season and falls to the lowest in September as a result of high rainfall and starts increasing again at the end of the rainfall season. The period within a year for which groundwater aquifers become polluted in Burkina Faso is very short.
Based on a WaterAid country report, groundwater from the basement rocks is typically fresh, with Ca-Mg-HCO3-dominant water types. Pollution from contaminants such as
83

nitrate is a common problem, especially in shallow groundwater sources (Yameogo et al, 2002). Arsenic has also been identified as a problem in some areas. The extent of occurrence of high arsenic water is not known; recognized problems appear to be localized to one or two villages. Few other water-quality problems have been singled out as major issues.
Nitrogen speciesShallow groundwater has significant potential for being contaminated by pollutants from domestic (latrines, drains, waste tips) as well as agricultural and industrial sources. Groen et al. (1988) noted the occurrence of nitrate at concentrations above the WHO guideline value (50 mg/l) in several groundwater samples from tube wells and open dug wells in north-western Burkina Faso. In a study of 168 tube well samples, 15% were found to have NO3-N concentrations greater than 10 mg/l. In addition, of 123 samples of well water investigated, 36% had concentrations above this value. The maximum observed concentration was 90 mg/l (as N).
Nitrate concentrations were highest in areas with increased housing density and were also elevated in groundwater down gradient of the housing areas. Increased nitrate was found to be accompanied by increased electrical conductivity, which suggests that the concentrations of many other major ions (notably chloride, sulphate, sodium, potassium) were likewise increased as a result of the pollutant inputs. Yameogo and Savadogo (2002) also noted high concentration of nitrate in shallow aquifers in Ouagadougou particularly between August and early September. This, they attributed to high infiltration resulting from heavy rains.
However, in the dry season, the concentration level goes down significantly. Water samples of 5 out of 6 wells taken in the dry season showed nitrate concentrations below the acceptable WHO standard except the sample from Kossodou well which had higher concentration (250 mg/l). High nitrate concentrations are likely to be a feature of shallow groundwaters in many areas of the country. The concentrations of ammonium and nitrite are less clear.
SalinityGroen et al. (1988) found variable salinity in groundwater samples from their study of north-western Burkina Faso. Electrical conductivity values were in the range 50–2700 µS/cm. The highest values observed are relatively saline and unsuitable for potable use. However, median values determined (270 µS/cm and 370 µS/cm respectively for dug wells and tube wells) indicate the presence of predominantly fresh groundwater. The salinity variations in groundwater from the sedimentary formations along the north-west and northern border areas of Burkina Faso are not known. Yameogo and Savadogo (2002) found salinity range of 100-350 µS/cm from 25 wells sampled in Ouagadougou and in the Baskuy community the figure ranges between 326-1595 µS/cm in water sampled from 15 wells with permanently high levels of nitrate.
84

FluorideNo fluoride data are currently available for Burkina Faso groundwater. Smedley et al. (1995) and Ghana Ministry of Works and Housing (1998) reported often high fluoride concentrations (up to 5 mg/l) in some granites and some meta-igneous horizons in the Birimian basement from the neighbouring Upper Regions of Ghana. This suggests that areas of granite especially and possibly other areas of the crystalline basement of Burkina Faso could carry groundwater with unacceptably high fluoride concentrations (greater than the WHO guideline value of 1.5 mg/l). Fluoride concentrations are likely to be higher in tube wells abstracting from the basement fractures than in shallow dug wells.
ArsenicData for arsenic in groundwater from Burkina Faso were not available at the time of writing. A number of accounts suggest that arsenic problems exist in part of Burkina Faso, although the extent and scale of the problem is not well defined. De Jong and Kikietta (1980) noted the occurrence of locally high arsenic concentrations in a village close to Mogtedo in central Burkina Faso. Appelo and Postma (1993, p248) also indicated from an original investigation carried out by IWACO (1975) that arsenic problems occur in some Burkina Faso groundwaters. The high concentrations were taken to be the result of oxidation of sulphide minerals (e.g. pyrite, arsenopyrite) and are likely to be concentrated in and around the gold mineralized areas.
The presence of arsenic in the drinking water is said to have given rise to the serious chronic arsenicosis condition known as blackfoot disease. If so, this would imply the occurrence of very high concentrations in affected potable supplies (several hundreds of µg/l) and is cause for concern. Verification of the location(s) of the noted health problems and instigation of a water-testing programme for arsenic, especially in the mineralized areas, would help to define the nature and scale of the problem in Burkina Faso and form the basis for provision of low-arsenic alternative water supplies.
IodineAs with many other chemical constituents, analyses of iodine are not available for the groundwater. However, the region is arid and remote from the influences of maritime rainfall. Hence, iodine inputs from atmospheric sources are likely to be low. This, combined with the dominant hard-rock geology of the region, means that iodine concentrations in groundwaters (as well as soils and locally produced crops) are likely to be low (of the order of a few µg/l). Indeed, iodine concentrations were found to e low or very low in many groundwater samples from the neighbouring Bolgatanga area of northern Ghana (Smedley et al., 1995). Hence, it is possible that iodine-deficiency problems occur in the Burkina Faso population if dietary iodine supplements are not used.
iii. MALI
(a) The Geology of Mali
85

The main geological units of Mali are Birimian (Precambrian) crystalline basement, Lower Cambrian to Palaeozoic indurated sandstones and metamorphosed clays (‘pelites’) Permian dolorite intrusions, mixed continental sediments of the Continental Intercalaire’ Formation (of Mesozoic age), Upper Cretaceous to Eocene marine sediments, the Pliocene ‘Continental Terminal’ sedimentary Formation and superficial deposits largely of Quaternary age (British Geological Survey, 2002; UN, 1988).
The crystalline basement occurs principally in southern Mali but also crops out in the Kayes region and the middle of the Adrar des Iforas. Rock types include met sedimentary and met igneous units, with some granite. Intrusions of crystalline Permian dolorite crop out in parts of south-west and central Mali. Lower Cambrian and Palaeozoic sediments have accumulated in vast sedimentary basins, which cover more than two thirds of the Mali land area. Lower Cambrian sediments outcrop along the southern margin of the major Taoudenit Basin, which covers most of central and northern Mali. The Lower Cambrian sediments exceed 1000 m in thickness in many places and are composed mainly of sandstone, but with some argillaceoous and carbonate horizons, especially in the upper parts (British Geological Survey, 2002; UN, 1988).
Palaeozoic sandstones, schists and limestones crop out in the northern part of the Taoudenit Basin. The Taoudenit Basin is infilled in its central part by the vast ‘Continental Intercalaire’ Formation of mid-Jurassic to mid-Eocene age. This covers an area of around 125,000 km2 varies in thickness from 20 m on the basin margins to 400 m in the area of the Nara Trench, between Nara and Tombouctou (Fontes et al., 1991). The formation comprises clays, fine to coarse unconsolidated sandstones and basal conglomerates. Continental Intercalaire deposits also occur in eastern Mali on the east edge of the Adrar des Iforas plateau and in the Tullemeden Basin on the south-east Mali border. The Continental Intercalaire is overlain by Upper Cretaceous to Eocene marine sediments on the eastern edge of the Adrar des Iforas plateau and the Tullemeden Basin. The sediments compose mostly limestone and marl with some fine sands (British Geological Survey, 2002).
The Neogene ‘Continental Terminal’ Formation is more than 1000 m thick in south-east Mali (Tullemeden Basin) but generally a few tens of metres thick elsewhere. It crops out in a large area of the central Taoudenit Basin, and in the Gondo Basin on the southern border. The sediments are mostly poorly consolidated sands and clays with some lateritised horizons. Pyrite and lignite are common in the sequence (UN, 1988). Superficial Quaternary deposits include fine-grained alluvium, mostly in the Niger Basin, sand dunes in northern Mali, lacustrine sediments in the Taoudenit Basin and northern Mali (UN, 1988; Fontes et al., 1991). Sabkha (evaporite salt) deposits are also found in parts of the Taoudenit Basin. Soils are commonly lateritic, ferruginous and often thick. These are particularly well-developed on the areas of crystalline Birimian basement and on the sandstone plateaux (UN, 1988).
Sea et al. (1990) reported iron-rich lateritic soils in excess of 35 m thick from Misseni area. Sulphide mineral veins (containing mostly iron and copper sulphides) are prevalent
86

in the Birimian (Precambrian) basement rocks in some areas. In Misseni area, they are found in association with metamorphosed volcanic rocks (Sea et al., 1990). The sulphide mineralisation is often associated with gold, which is exploited in some areas, notably the Galam Bambouk gold area on the Mali/Senegal border, near to Guinea. Economic reserves of phosphate are also exploited in some areas (British Geological Survey, 2002).
(b) Types of Aquifers and Groundwater Availability in Mali
Groundwater occurs in greatest abundance in the sedimentary aquifers, particularly in the Continental Intercalaire and the Continental Terminal, but is more limited in the crystalline and indurated sedimentary rock types. Unfortunately, the poorer aquifers are more prevalent in the south of the country where the major proportion of the population is concentrated. Hence, the sedimentary aquifers are of limited viability for public supply despite their greater permeability and storage capacity. In the crystalline basement rocks, aquifer permeability is irregularly distributed but is mostly low. Groundwater occurs in fractures and is more abundant where weathered overlying layers (overburden) are thickest. Water-level variations in the crystalline basement are large and the average depth of wells is 60 m (British Geological Survey, 2002; UN, 1988).
In the indurated Lower Cambrian and Palaeozoic formations, groundwater availability depends on local lithology and degree of fracturing. Sandstones with overlying laterite soils form the best aquifers, and these are the main supply aquifers of Mali. However, permeability is limited, especially where the rocks are crossed by massive (crystalline) doloritic intrusions. Groundwater is mainly concentrated in the top 20–60 m and water levels are typically 10–25 m below surface (UN, 1988). These formations are poor aquifers in the Gourma Basin of south-central Mali and wells constructed in this area have had a low rate of success (British Geological Survey, 2002)
The Continental Intercalaire is the greatest water- bearing formation in Mali, though as a result of its location in the northern Sahel and Saharan areas, it is largely only exploited in the west and on the southern edge of the Adrar des Iforas. Producing wells in the formation can be extremely deep, up to or in excess of 150 m (UN, 1988). Groundwater levels may also be up to 100 m deep (Fontes et al., 1991). The Continental Terminal is the second largest aquifer in Mali. It is particularly well-developed in the inner delta, where it is in hydraulic contact with overlying Quaternary alluvial deposits. Good yields are obtained when water levels are shallow (<20 m), as occur close to the Niger River. Yields diminish away from the river (UN, 1988). Well depths are typically 20–60 m deep in the inner delta area, depending on distance from the river. Groundwater is generally limited in the superficial Quaternary alluvium as a result of fine sediment grain size. Small-scale supplies of water may be obtained from surface sand dune deposits (British Geological Survey, 2002).
(c) Well-sinking success Rate, Discharge and Recharge
Groundwater is abstracted from nearly all the regions in Mali with varying rate of success. In general, the success rate of drilling a well ranges from an average of about 57
87

% in the Kayes region to about 79 % in the Segu region. The overall average for the entire country is about 71 % (see Table 20). Potential availability is believed to be broadly sufficient, considering theoretical annual water needs at some 6.12 billion m3, shared as follows: 62 million m3 for domestic supply; 60 million m3 for cattle; and 6 billion m3 for irrigation (N'Djim and Doumbia, 1998). Aquifers recharge for the entire country is estimated at 20 km3/year (FAO, 1995)
Table 44: Average Rate of well-sinking success and discharge by regionRegion Success Rate (%) Average Discharge (m3/h)Kayes 56.9 6.9Koulikoro 63.9 4.9Sikasso 76.1 6.4Segu 78.5 6.8Mopti 68.6 9.0Timbuctu 66.5 15.5Gao 69.2 9.0Bamako 89.2 8.2Average 71.1 8.3
Source: National Office of Planning, Water Direction Plan, 1991 in N'Djim and Doumbia, 1998
(d) Groundwater Quality
Information available suggests that groundwater is for the most part fresh and of good quality. However, increased salinity has been observed sporadically in several of the aquifers. Salinisation of soils and shallow groundwater is also seen as a problem in the river valleys. The salinisation largely results from recent irrigation practices and has led to high total dissolved salt contents and high alkalinity in the irrigated riverine areas of Mali. Reports suggest that poor sanitation in urban areas may lead to pollution of shallow groundwater sources with nitrate and other pollutants (British Geological Survey, 2002).
Nitrogen speciesConcentrations of nitrate (and ammonium) are likely to be low in most rural groundwaters. However, nitrogen-based fertilisers are used in the agricultural areas of Mali (Diara, 1998) and may contribute some nitrate in particular to shallow groundwaters. Fontes et al. (1991) found concentrations of NO3-N in the range <0.1–7.3 mg/l in groundwaters from the Continental Intercalaire of the Taoudenit Basin. This confirms the expected low concentrations as all are below the WHO guideline value for nitrate (N) in drinking water of 11.3 mg/l. However, many of the groundwaters from the formation are believed to be present under anaerobic conditions. Hence, some nitrate loss resulting from denitrification may have occurred in this aquifer. Concentrations of nitrate may be higher in urban areas where domestic pollution is most concentrated. Although poor sanitation in urban areas poses a greater threat to surface waters through direct discharge, groundwater at shallow depths is also at increased risk (British Geological Survey, 2002).
Salinity and hardnessThe limited information available suggests that groundwater from crystalline basement aquifers and from the Lower Cambrian and Palaeozoic formations is generally fresh and
88

soft, though often aggressive (pH of groundwater in the basement aquifers is commonly acidic: around 5.5-7.7; UN, 1988). Cambrian schists mostly also contain acidic and fresh water, though dissolved salt contents up to 17000 mg/l have been recorded (UN, 1988). Groundwater in the Continental Intercalaire is typically fresh and of good quality, although salinity is variable. In the Taoudenit Basin of central Mali, Fontes et al. (1991) reported electrical conductivity values between 50 µS/cm and 13,100 µS/cm (chloride concentration up to 3300 mg/l) in groundwater from wells up to 100 m deep. Groundwater in the Cretaceous to Lower Eocene sediments is also of variable salinity, being rackish in some areas (British Geological Survey, 2002).
In the Continental Terminal, groundwater salinity is low close to the course of the Niger River, but increases away from the river (the recharge area) towards the margins of the Taoudenit Basin. Salinity also apparently increases with depth in the Continental Terminal (UN, 1988). As noted above, salinisation of soils and shallow groundwater is a particular problem in the river valley areas of Mali. Problems have been especially noted for the Niger River and the Fala of Molodo (west of the Niger River; Valenza et al., 2000). Much of this is related to recent irrigation, but increased salinity in these areas is also due to the presence of ancient saline soils (solonchaks, which contain halite, NaCl and trona, NaHCO3. Na2CO3.2H2O). These form a wide sabkha plain in the Fala of Molodo, which is the former course of the Niger River (Valenza et al., 2000). Rising water tables resulting from irrigation have allowed these salts to be redissolved in shallow groundwater and to increase the salinity further (British Geological Survey, 2002).
Miézan and Dingkuhn (2001) observed increased sodium and chloride concentrations in groundwater samples from close to the water table in the river valleys of Mali. They also reported sodium adsorption ratios (SARs) in groundwater of 10–50 and often high pH values (8.5 to 10). The salinisation and alkalinisation of the soils and shallow groundwaters can be severely detrimental to plant nutrient availability as well as to water potability.
In the area around Molodo (west of the Niger River), Valenza et al. (2000) found groundwater with electrical conductivity values in the range 300– 500 µS/cm, whilst values in groundwater east of the Niger were around 300 µS/cm and irrigation water had a very low conductivity of around 30 µS/cm. The most saline waters sampled had a dominance of either sodium-bicarbonate or sodium-sulphate ions. Although the highest values observed in this area are potable, they are liable to taste salty and may be unacceptable to users British Geological Survey, 2002).
FluorideFew data are available for fluoride in the groundwater. Fontes et al. (1991) gave fluoride concentrations for groundwater from the Continental Intercalaire of the Taoudenit Basin. These were generally low, giving a range of <0.2 to 1.7 mg/l. Only one sample exceeded the WHO guideline value for fluoride in drinking water of 1.5 mg/l. Most had concentrations of the order of 0.3–0.7 mg/l (19 samples). Fluoride concentrations in the other aquifers are also expected to be low but may increase in parts of the crystalline
89

basement rocks, especially where granite occurs. Concentrations may also be higher in the more saline groundwaters from the other sedimentary formations. Sufficient variability in fluoride concentrations is expected for it to merit testing for in Mali groundwaters (British Geological Survey, 2002).
Iron and manganeseConcentrations of iron and manganese should below in most groundwaters, except where particularly acidic, as in some of the crystalline basement rocks and indurated Palaeozoic sediments. Concentrations may also increase where aquifers become anaerobic, as for example found in areas of the Continental Intercalaire. In the Taoudenit Basin, dissolved iron concentrations were found by Fontes et al. (1991) to range between <0.01–3.5 mg/l and manganese between <0.002–3.8 mg/l. The highest concentrations were taken to be due to anaerobic conditions. The low nitrate concentrations in many samples from the area also suggest the presence of anaerobic conditions in parts of this aquifer (British Geological Survey, 2002).
ArsenicNo arsenic data are available for Mali groundwater. Concentrations should be mostly low, but may increase in the anaerobic groundwaters from the Continental Intercalaire of the Taoudenit Basin. Concentrations may also be higher locally in the areas of sulphide mineralization, particularly where gold-mining activity is prevalent as this leads to preferential oxidation of arsenic-rich sulphide minerals and to their release into the environment. Lateritic soils from some mineralised areas of Mali (e.g. Misseni) have been noted to contain accumulations of arsenic in the shallow layers (upper 2 metres or so), which often contain ‘iron pans’ (layers of indurated iron-rich laterite) (Sea et al., 1990).
Here the arsenic most likely derives from the strong weathering (oxidation) of primary sulphide mineral veins in the bedrock and the accumulation in the surface layers is related to the relative abundance of iron oxides, which are known to have a strong affinity for arsenic. In such mineralized areas, arsenic is likely to be much more abundant than in other areas of bedrock and if mobilized, may cause localized groundwater-quality problems. However, as iron oxides are capable of binding arsenic strongly, the arsenic is likely to be retained in the solid minerals. Hence, the shallow soils and overburden are considered unlikely to be major sources of dissolved arsenic (British Geological Survey, 2002).
IodineMuch of the iodine present in water is derived from the ocean as a result of maritime rainfall or marine aerosols. Iodine may also be concentrated in organic matter in the soil. Little iodine is derived from rock weathering. Hence, in a country such as Mali, which is remote from the sea and with a paucity of organic-rich soils, iodine concentrations in groundwater are expected to be generally low. If the overall diet of Mali inhabitants contains insufficient iodine, there may be an increased vulnerability to development of iodine-deficiency disorders (IDDs) such as goitre. Where drinking-water iodine concentrations are less than around 5 µg/l, this may signal a potential problem with IDD
90

development. In groundwater from the Continental Intercalaire of the Taoudenit Basin, Fontes et al. (1991) found iodine concentrations in the range 1–440 µg/l (average 69 µg/l, 20 samples). This is a very large range but the lowest concentrations observed could indicate a problem with the development of IDDs (British Geological Survey, 2002).
Other trace elements Little other information is available on trace-element contents of the groundwaters. Diara (1998) reported the occurrence of pollution from mercury and lead in urban water supplies from Bamako, but gave no data to substantiate the observation. If such metals are found in high concentrations, they are likely to be localized to a small number of wells rather than of widespread occurrence in the urban areas. Fontes et al. (1991) found concentrations of uranium in the range 0.05–106 µg/l (average 10.4 µg/l, 21 samples) in groundwater from the Continental Intercalaire of the Taoudenit Basin. A number of these are significantly above the WHO guideline value of 2 µg/l for uranium in drinking water. The health consequences of long-term exposure to uranium at such concentrations are poorly understood, but the concentrations found are potential cause for concern and suggest that testing for uranium should be included in groundwater analysis programmes in the sedimentary aquifers of Mali-WaterAid Country information sheet (British Geological Survey, 2002).
II.4.2 A geographical triptych
A. Agro-Ecological Zones in the Volta Basin of GhanaThe natural vegetation of Ghana is closely related to the ecological zones. Six agro-ecological zones, defined on the basis of climate, reflected by the natural vegetation and influenced by the soils are recognized in Ghana (Figure 24).
91

Ghana
Mali
Burkina Faso
Benin
Ivory Coast
Niger
Togo
Nigeria
LEO
Dori
GAOUA
Tougan
DIAPAGA
Dedougou
TENKODOGO
OUAHIGOUYA
FADA NGOURMA
BOBO-DIOULASSO
WA
HO
ACCRA
TAMALE
KUMASI
SEKONDI
SUNYANI
KOFORIDUA
BOLGATANGA
ZONENorth Sahel
South Sahel
North Sudan
South Sudan
Coastal Savanna
Guinea Savanna
Moist Semi Deciduous
Transitional Zone
Tropical Rain forest
Volta Basin
I
0 100 200 300 40050Kilometers
Gulf OFGuinea
Figure 24: Map showing the agro-ecological zones of Ghana and Burkina Faso
These consist of the Sudan, Guinea and Coastal Savanna Zones, the Forest-Savanna Transitional Zone, the Semi-deciduous Forest Zone and the High Rainforest. In all these zones, the natural vegetation has undergone a considerable change as a result of human activities. Also considerable variations exist between successive rainy seasons in time of onset, duration and amounts of fall. Rainfall is also generally accompanied by high intensities and energy loads and is therefore erosive. Generally, Alluvia soils (Fluvisols)
92

and eroded and shallow soils (Leptosols) are found in all the agroecological zones (FAO-RAF, 2000/1).
The High Rainforest The rainforest covering an area of about 7500 km2 is located in the south-western corner of the country. This zone is characterised by a bimodal rainfall distribution pattern with mean annual totals ranging from 1750 to 2200 mm. The major rainy season occurs from March to mid-July with a peak fall in June. The minor rainy season starts from early September and tails off at the beginning of November. The major dry season commences from mid-November and lasts till the end of February. Temperatures are generally high throughout the year. The mean annual maximum temperature varies from 28.7 to 31 oC with a corresponding minimum temperature of 20.6 to 23.2 oC. The mean temperature is about 26.5 oC. Relative humidities in the morning are over 90 %. In the dry season, the value falls below 80 %. Potential evepotranspiration in this zone is about 1350 mm/yr (FAO-RAF, 2000/1).
The vegetation in the rainforest is generally evergreen although some species common to the semi-deciduous forest may be found. Such species tend to shed their leaves during the dry season. The zone is characterized by the cynometra-Lophira-Tarrietia association with Cynometra ananta, Lyphira alata and Tarrietioa utilis as indicator trees (Lane, 1962). The topography is undulating to rolling with numerous fresh water swamps potentially suitable for rice cultivation occupying the low lying valley bottoms. The swamp vegetation consists of Raphia palms with shrubs such as Alchornea cordifolia, Caropa procera and Macaranga spp. entangled by various climbers. The soil types in this zone are: Acrisols, Nitrisols and Gleysols (FAO-RAF, 2000/1).
The Semi-Deciduous Forest (SDF)The Semi-deciduous forest zone is about 66300 km2 in extent and forms about 90 % of the total forest zone. Like the HRF zone, the SDF zone is characterized by a bimodal rainfall distribution pattern with mean annual totals ranging from 1400-1750 mm. Conditions of temperature potential evapotranspiration and relative humidities are similar to that in the HRF zone (FAO-RAF, 2000/1).
The characteristic associations are Celtic-Triplochiton and Antiaris-Chlorophora. The indicator trees for the former consist of Celtic milbraedii and Triplochiton scleroxylon whilst the latter is characterzed by Antiaris Africana and Chlorophora excelsa. It is within this zone that most food crops and cocoa cultivation takes place. Most of the timber for both local needs and export comes from the zone. As a result of these activities the vegetation outside forest reserves consists mainly of forb regrowth, thicket, secondary forest and swamp thicket. Soils present in this zone are: Acrisols, Nitrisols and Gleysols (FAO-RAF, 2000/1).
The forest-Savanna Transitional Zone (Derived savanna) This zone covering about 8300 km2 occurs as a normal strip about 48 km wide along the
93

north and the north easting limits of the semi-deciduous forest. This zone is also characterised by a bimodal rainfall distribution pattern with mean annual totals ranging from 1200-1400 mm. The mean temperature is about 26.5 oC. Morning and mid-day relative humidity values range between 85 5 and 88 % and 70 % and 74 % respectively. Potential evepotranspiration in this zone is about 1350 mm/yr (FAO-RAF, 2000/1).
Most of the tree species of the forest zone occur in this area in addition to such species as Daniella oliveri, Borassus aethiopum and Terminalia macroptera. These trees occur in association with tall to medium grassrs such as andropogon and Pennisetum spp. The soil types here are: Lixisols, Nitrisols, Plinthosols and Cambisols (FAO-RAF, 2000/1).
Guinea Savanna ZoneThe guinea savanna zone which covers almost the northern two-thirds of the country is the largest ecological zone. Its aerial extent is about 147900 km2. This zone is characterized by a unimodal rainfall regime lasting from April to October with a mean annual rainfall varying between 1000 and 1200 mm. Monthly totals increase gradually from March until a maximum is reached in August or September, after which monthly totals fall rapidly. The period between November and March is dry. This is the period when the desiccating effect of the harmattan is strongly felt. Mean annual maximum temperature ranges from 33 oC to 35 oC with a minimum of about 22 oC and a mean of 27.8 to 28.5 oC. Relative humidity is about 40 % in the dry season but may reach 84 % during the peak of the rainy season in August. Potential evapotranspiration varies between 2000 and 2300 mm/year (FAO-RAF, 2000/1).
The vegetation consists typically of a ground cover of grasses of varying heights interspersed with generally fire resistant, deciduous, broad leaved and gnarled trees at the forest margins in the south. This grades into a more open grassland with widely spaced shorter trees towards the north. Owning to the tussocky nature of the grasses bare patches of land are common. During the dry season, November to March, the dry grasses are highly inflammable. In the less eroded areas, Andropogon gayanus, the commonest grass, may be replaced by Hyparrhenia and Heteropogon spp. While Aristida and Cymbopogo gigantus dominate the badly eroded sites. Vetiveria nigritana, Seteria anceps and Sedges occur in alluvial sites. The common tree species, including Lophira lanceolata, Anogeissus, Afzelia Africana, prosopis Africana, Pterocarpus erinaceus, Parkia clappertoniana, Butyrospermum parkii and Antiaris Africana. Fringe forest and woodland may be found along the water courses. Soils present in this zone are: Lixisols, Acrisols, Luvisols and Gleysols (FAO-RAF, 2000/1).
Sudan Savanna ZoneThe Sudan savanna zone covers an estimated area of 1900 km2. It is characterized by a unimodal rainfall pattern with mean annual rainfall varying between 900-1000 mm. Mean annual maximum temperature ranges from 27.8 to 28.5 oC. Relative humidity and potential evapotranspiration are similar to that of the Guinea Savanna Zone (FAO-RAF, 2000/1).
94

This zone consists of short drought and fire resistant deciduous trees, interspersed with open savanna grassland. Grass cover is very sparse and in most areas, the land is bare and severely eroded. Tree cover is very low. However, in the densely settled and cultivated areas, important economic trees such as Adansonia digitata, Ceiba pentandra, Butyrospermum parkii, Parkia clappertoniana, Tamarindus indica and Acacia albida still remain. The soil types here are: Lixisols, Acrisols, Luvisols and Lithosols (FAO-RAF, 2000/1).
Coastal Savanna ZoneThe Costal savanna zone covers an estimated area of 4500 km2 with mean annual rainfall varying between 600-900 mm. This zone has a bimodal rainfall pattern with a characteristic distribution similar to that of the forest zone. The mean annual maximum and minimum temperatures are 30.5 and 22.9 oC respectively. Relative humidity varies from 55 to 65 % during the day and fall to about 40 % during the major dry season (FAO-RAF, 2000/1).
The vegetation consists of mainly grassland interspersed with dense short thickets often less than 5 m high with a few trees like Antiaris Africana, Ceia pentandra and Milicia excelsa, Albizia zygi and Azadirachta indica. Short and medium grasses are the dominant plant species, notable among which are Andropogon gayanus, hyparrhenia dissolute in upland areas and Vetiveria fulbibarbis, Brachiaria falcifera and Bothriochloa bladhii in low lying areas. Soils present in this zone are: Acrisols, Luvisols, Cambisols, Gleysols, Vertisols, Solonetz and intergrades (FAO-RAF, 2000/1).
With the exception of the Tropical Rainforest zone, the Volta Basin of Ghana falls in all the agro-ecological zones within the country. The largest proportion is in the Sudan/Guinea Savanna zones (24.2 %). The rest of the distributions are shown in Table 45 below:
Table 45: Proportion of Volta Basin in Agro-ecological zones of GhanaAgro-ecological zone Proportion of Volta Basin in the zoneThe Semi-Deciduous Forest 5.4The forest-Savanna Transitional 11.2Sudan/Guinea Savanna 24.2Coastal Savanna 0.5
B. Major Farming Systems in the Volta Basin of Ghana
The term farming-system refers to a particular arrangement of farming enterprises (e.g cropping, livestock-keeping, processing farm products) that are managed in response to the physical, biological and socio-economic environment and in accordance with the farmers’ goals, preferences and resources. Farming is used here in a wide sense to include not only crops and livestock but also the other natural resources available to the farm household, including resources held in common with others (Reijntjes et al, 1992).
95

Two farming systems are dominant in Ghana: The bush fallow system (temporary system) and the permanent system. Some variants both systems are also found in the Volta basins: the HUZA and the mixed farming systems.
The bush fallow systemThis is a system of land rotation between crops or fields and bush. A plot of land is cultivated for a number of farming seasons and abandoned during the time necessary to revert to secondary vegetation. It allows the soil to keep its nutrients qualities. The length of this resting period depends on how pressing the need is for land for cultivation. In the sparsely settled areas, the length rotation may reach 15 years, whereas in the densely settled areas, the period may be as short as 3 years. As soon as the farmer abandons a plot, he starts to cultivate the new plot. Thus he moves from one plot to another plot in different farming seasons. This system could be named shifting cultivation instead of bush fallowing. The latter term implies the movement of both settlements and farming to new areas when old farm lands are abandoned. In Ghana, farm settlements are usually permanent.
The average size of food farm cultivated under the bush fallow system is 1.1 hectares. During the dry season, men clear the land by hand. The vegetation is cut down and burnt. All trees of economic importance, such as shea butter, dawa-dawa and the oil palm trees are left standing. Sowing begin with the first rains. For planting yams, plantains and cocoyams, the hoe is used. In the case of cassava, maize, guinea corn and millet, the cutlass is used. To improve the soil occupation and the yields, several kinds of crops are grown together in the same farm. Indeed, the nutrients requirements are not the same according to the crop, so it is possible to obtain high yields from all the crops growing on the same farm or plot. Moreover, the different crops grow in different ways, this mean that all the different crops together provide a better cover of the soil and as a result, help to fight the erosion.
This system of bush fallowing has some advantages in the peculiar environmental conditions of the tropics:
- The rotation allows the growing crops to make use of the plant food that accumulate in the soil as a result of the decay of leaves and twigs from the fallow vegetation. Consequently the harvest is satisfactory in the first seasons of cultivation. After 2 or 3 years, the farmer to allow it to regenerate fresh supplies of plant nutrients, abandons the food plot.
- The burning of cleared vegetation on plots intended for cultivation saves time and labour. It also improves the soil. The ash contains carbonates and phosphates; these are washed into the soil by the first rains, and so increase the soil fertility. The danger of this method of burning is to affect the protecting vegetal cover and thus increase the risk of erosion.
96

The disadvantage of the system is that is generally thought that a fallow period of 25 to 30 years is desirable. When the pressure on the land is too high this period cannot be respected. As a result, the length of the fallow period has consequently decreased and this has resulted in low crop yields. For the last two decade, the fallow period has been shortened to approximately 2-3 years. This has led decline and deterioration of cultivated soils and yields. The use of fire for cleaning vegetation exposes the soil to the sun and torrential rains until the first crop forms an effective protective cover.
The HUZA farming systemIt differs from the bush fallow because of the peculiar system of land ownership, which gives rise to the strip pattern of land. A co-operative regroups all the financial resources of the farmers. The company is organized for the sole purpose of collecting land. The land so acquired is called ‘huza’ described as “a tract of land bought by a group of people, often but not necessarily kinsmen, under elected leader (Hutze) who makes all negotiations with the seller (Gyasi, 1976)”. When the land is acquired, it is divided into strips for each farmer. The width of the strip is proportional to the farmer’s financial participation. This method rises the strip pattern of land use. After two or three seasons of cultivation, when yields decline, the field is left fallow. Due to the pressure of population and the great demand for land, the length of the fallow period is now short (4-6 years).
The permanent systems Contrary to the bush fallow system, these systems are intensive and a piece of land is cultivated continuously. In Ghana, there are 2 permanents systems of food farming: the compound farming system and the Anloga-Keta system. In the Volta Basin, only the compound farming system is used.
The compound farming systemIt is used in the densely settled areas of northeastern and northwestern Ghana. This system centres on the household compound. The land immediately surrounding the compound house is intensively cropped with vegetables and staples using organic soil regeneration techniques, which involve the use of household refuse and manure from livestock. The average size of a compound farm is less than an acre. These pieces of land are used for the cultivation of okra, tomatoes, peppers, maize, cocoyam and plantains. These farmers cultivate also larger fields at some distance away from the household. In these fields, they adopted the bush fallow system. These outfields provide the main bulk of the farmer’s food supply.
The Mixed Farming SystemIt is characterised by a combination of cultivation with keeping of livestock. The latter provides power and manure on the farm. This system was introduced in the nineteen thirties to check the rapid deterioration of soils as a result of population pressure on land and to increase agricultural production. In addition to the use of manure to increase production, many technical innovations were introduced: use of bullock plough, planting on ridges. Cow-dung, compost of household refuse, kitchen sweepings and goats pens are applied to compound farms. Mixed farming is restricted to areas, which are free from tsetse fly. The growing season is based on when rainfall is more than one-half of the
97

potential evapo-transpiration, and ends when there is less than half the potential evapo-transpiration. In the Sudan Savanna Zone, the climate, which is characterised by the alternation of clear-cut wet and dry seasons, has a direct effect on soil forming processes in the area. Although the prevailing climatic conditions permit accelerated chemical decomposition and deep weathering of rocks, the sudden and torrential rainfall following a prolonged dry season, during which the vegetation cover is burnt, induces great soil erosion.
C. Land tenure characteristics in several agro-ecological zones of the Volta basin of Ghana
Sudan and Guinean Savanna ZonesVarious ethnics groups live within the zones. The village chief or the earth priest (Tendana) administrated the land. According to traditional tenure rights, land is only allocated to the farm households. The usufruct rights can be passed on to the descendants so that land tenure is secure as long as the land is cropped. When the land is fallow the Tendana can redistribute it. There is no fixed rent paid to the chief or to the Tendana. A part of the harvest is given to them more or less as a sign of recognition of their authority. As the household is not the owner of the land, they cannot sell it. Rights of usufruct have considerable religious implications: unless the occupier of the land stands in breach with the chief or the Tendana, he cannot be deprived of them.
Land transactions are limited to leasing which is very seldom. Land can temporarily be exchanged for bullock or tractor services. When population density rises and land becomes scarcer, the land which is fallow will be relocated. Thus, smaller households who don’t have enough labour to cultivate all the land but who still want to keep the land at their disposal also try to lease the land to neighbours or relative in the meantime. Land security is very high as measured by rights over land and low incidence of dispute, except for migrant farmers from other regions. Customary lw does not recognise female right of usufruct. This is likely to influence the type of crops cultivated by women.
As soon as the land is fallowed, it can be redistributed. There is virtually no restriction on the use of land for crop food production. For migrant farmers, where land is leased for agriculture, the control over trees and other perennial features on the land remain under the control of the original owner. Ownership of economic trees on farms belongs to the individual who develops but for economic trees in the bush, the first individual to reach a tree can harvest its fruit.
The main difference between the Sudan and the Guinean Savanna Zones are the current land tenure. In the first one, the traditional land tenure systems have been generally maintained. Land is bought and sold around larger urban settlements but the areas are not led to a monetarisation and individualisation of land rights. In the Guinean Savanna Zone, recent developments and pressure on land have resulted in the flagrant violation of these traditional regulations on land. Now land is sold for cash or in kind or both depending on the contractual arrangements.
98

Forest Savanna Transitional ZoneAccess to land for farming can be gained from family, from the outright purchase of land, by paying fee to chiefs or local districts assemblies or by hiring and share cropping.
Table 46: Access to landMethod of lease PercentageHire land 35Sharecrop 14Hire out 8Share out 4
In the food crop sector leasing is usually based on short-term sowing contact. The maximum period of loan is usually for three years, but often for one year. With the sharecropping tenancy, one third of the harvest (generally maize) or one third of the proceeds from sales is restored to the landlord, the tenant retaining the rest. With the increase of land pressure, the landlord, in some areas, increases the share to half.
The Hiza system land tenure (a described below) is practised in the southeastern corner of the forest/savannah transition zone.
Deciduous Forest ZoneLands in the community belong primarily to the chief. However, most of these lands are now in the care of families. The chief has direct control over virgin forest only. Land is often given to migrants on share cropping terms. In some areas, the migrants develop new plantations that are then shared between the tenant and the landlord. Like in the Forest Savanna Transitional Zone, the landlord get one third of the harvest or of the proceeds. With the increase of land demand, he has been able to demand a larger part. In some cases, farmers hire land. With this system, the control of the farmer on his land is small. Tenants are worried that landlords will take the land from them when plantations mature. Cocoa has become the dominant landscape in the zone. In giving land to migrants, landowners place restrictions on the use of their land. They may oblige settler farmers to plant cocoa, because of economic reasons.
D. Major farming activities in the various agro-ecological zones of the Volta Basin in Ghana
i. Cropping systems in the Volta basin of Ghana
Sudan Savanna Zone The basis of the cropping system throughout the zone is pearl millet. The early millet is inter-planted with late millet or sorghum in fields close to compound where fertility is highest. Maize was highly cultivated during period when fertilizers were available at subsidized rates. Since fertilizers were not available and soil fertility declining, the planting of crop has fallen drastically in 1997.
There has been a spread of European vegetable cultivation with the gradual decrease of
99

some minor of indigenous crops. Carrots, cabbage, lettuce and peas are now available and grown in irrigated plots close to towns and were probably originally planted for expatriates.
Guinean Savanna Zone (GS)Maize is the major cereal crop produced in this zone. More than 80% of the small-scale farmers grow maize. Maize has a special position because of government support for the crop. Improved varieties are used. Every farm family cultivates sorghum either as a sole crop or in an inter-crop. Cereals crops like maize, sorghum and millet cover most of the cultivated land. However, areas under maize decrease with increasing of population density, while areas under millet or sorghum increase. Cotton, a cash crop, is found at specific sites throughout the Savanna Zone.
Table 47: Proportion of area allocated to major crops species and yield per hectare in the GSCrops Average area (%) Yields (Mt/Ha)Cotton 2.28 -Groundnut 38.28 0.52*Cowpea 31.05 0.60#Yams 14.31 2.98*Cassava 23.36 3.9*Sorghum 48.18 0.70*Millet 62.10 0.68#Maize 59.21 1.00+Rice 3.78 0.90+Tomato - 1.90+Pepper - 0.9+
Source: *MOFA 1999, + Runge-Metzger and Diehl 1993, # Diehl 1992
Cash crops are groundnuts, cowpeas, maize and rice. Women are usually the ones mainly responsible for marketing these cereals. They pass on the money to their husband. The women also sell products to the market when the quantity harvested is large.
Forest Savanna Transitional ZoneFood crop production dominates the farming system. Animal production is higher in this area than in the forest. It is the zone of major commercial food production: maize, cassava, groundnut and yam. Oil palm is also important as a plant reserved in fallow land rather than grown plantations. Cotton and tobacco are important cash crops.
Deciduous Forest ZoneCassava and plantain are the important food crops, and, cocoa and oil palm are important as cash crops. Vegetable production is increasing in importance in this zone. Cocoa is the most important cash crop in this area. Both indigents and settlers grow it.
ii. Crop husbandry processes and activities
Sudan Savanna ZoneThe population density has a great influence on the cultivation systems. Until recently, shifting cultivation was the dominant system of culture, with the increase of land
100

pressure, farmers start to practise permanent cultivation. Compound farms and bush farms are found in this zone. On the bush farm, no manure is applied and it consists in land rotation. The plots take place 2-4 kilometres away from the farm. In the compound system, the land cultivated is directly around the homestead and is fertile because of the use of household and farm refuse as manure. Tobacco, gourds, melon, okra, tomatoes, pepper and sweet potatoes are usually cultivated in the compound lands. Further away is another zone planted with early and late millet, guinea corn, bambara beans and cowpea. This second zone is fertilized with farmyard manure though often inadequate. The rest of the compound area, usually the largest, is not manured and is cropped to guinea corn and late millet.
The compound farms produce higher yields than the bush farm. In the first case, the soil fertility is maintained thanks to manure whereas in the bush farm, the soil is left to the nature to restore through the fallow system. With the increase in land pressure, the compound system takes in importance. The major bulk of cereals are, however, produced in the bush fallow farm. Usually the system of cropping is guinea corn and late millet mixed together, or both planted singly and often inter-cropped with groundnuts, bambara beans or cowpeas. Rice may be planted in poorly drained soils, or grown inter-planted with early millet.
The pressure on land and the need to produce cash crops for sale has gradually brought about innovative farming techniques. Migrants like Muslims, seem to be the first to practise horticulture in riparian areas. Many of the larger rivers are not exploiting in this way because of a lack of adequate methods of lifting water. However, most of the shallow rivers and seasonally flooded land are now given over to dry-season gardening. In addition, gardens have been established on the edges of dugouts, when they had been excavated. There is still an opportunity to develop some of the larger rivers for irrigation, given appropriate water-lifting technology.
Onion cultivation is particularly popular and probably represents one of the most important agricultural exports from the zone. The quantity of cereals produced is locally consumed and so, not open to the commercial market. Sheanuts are bought and exported on small scale. Tomatoes and onions are produced for sale as cash crops and are exported to Southern Ghana.
Guinea Savanna ZoneAnimal production is of higher importance than in the rest of the Savanna Zone. However, food production dominates. Bullock is used also for ploughing although some farmers are not able to afford it. Tractor may be used but at a higher price (between ¢25000 and ¢30000 per acre for the bullocks, and ¢35000 for the tractor.Like in the Sudan Zone, farming systems practised are bush fallow and compound.
The major cropping systems are mono-crops of early maturing maize in the compound fields. The following groups of cropping systems may be distinguished in the zone:
- Maize, sorghum, groundnut and cowpea with root crops, namely yam and cassava, occur in the central portion of the zone;
101

- Sorghum based but mixed with maize or cowpea and yam, occurs in the western part of the zone;
- Yam, maize, sorghum, groundnut based system, occur at the southeastern part of the zone.
Table 48: Cropping patterns in the Guinea Savannah zoneCropping pattern Percentage area (%)Sole 4.0Mixed cereal 15.4Cereal/legume 62.2Roots/others 12.0Others 5.0
The choice of soil tillage is influenced by ecological and economic factors such as soil type, land use of the preceding year, crop that is actually to be sown or planted, and the available technological options. Tractor is used for heavier lowland soils whereas hoe and bullocks tilled sandy upland soils. Soils preparation is done by hoe.
Table 49: Percentage of use of each technologyHoe 77.4 %Bullock 14.6 %Tractor 8.0 %
Soils nutrient stocks are replenished by fallowing, the use of organic manure, biological processes, rainfall, sedimentation and mineral fertilisation. The application of fertiliser and manure is still not a common practice and is very fluctuating from year to year. The majority is applied on crops which show an elastic response to the fertiliser, such as maize, rice and vegetables.
Men and women have distinguished roles: men usually carry out land and clearing and ploughing, whilst women gather and burn the cleared weeds and later plant all crops. Women do most of the marketing and are responsible for the daily cooking and childcare. Almost every farmer of the zone has some livestock. About 90 % of all women have 5-10 chicken; about 29 % have 2-5 goats. 89 % of all men have sheep, particularly in the Dagbon area and 10 % have cattle.
Forest Savanna Transitional ZoneIn this zone, permanent mechanized cultivation of food crops is common. Many farmers have adopted technologies based on ploughing, permanent cultivation and use of chemical fertilisers. The transitional character of the ecosystems, the ethnic and cultural diversity resulting from migration led to a considerable diversity in farming systems and crops. The widest variety of crops is grown in the transition zone. Mixed or sole cropping is used and the major cropping systems in the forest area are sole maize, maize/cassava, maize/cassava/plantain and /maize/pepper. In the Savanna area of the zone the cropping systems are sole yam, sole groundnut, rice/cassava and yam/cassava.
If the maize is planted in the first season, the inter-cropped culture (cassava or plantain) is
102

relayed into the maize field at maize tasselling stage. To lower costs, maize is cropped twice a year or inter-cropped with cassava. Groundnut is planted during the first season, it normally follows yam. In this zone, single stand maize gradually displays the maize-cassava intercrop. Sole yam is the second most important cropping system. Mixtures of pepper, garden egg and okra are the third. Legumes like cowpeas and groundnuts are rotated with cereals and yams.
Table 50: Percentage of farmers practicing cropping system in WenchiCropping system Percentage Cocoa (with food crops) 0Plantain intercrop (cocoyam, yam, cassava) 3Maize cassava intercrop (cocoyam, vegetables, pulses) 7Vegetables (pepper, garden egg, okra) 17Sole cassava 5Sole maize 26Sole tomato 5Cowpea 5Groundnut 10Rice 0Yams 19Others 3
Deciduous Forest ZoneIn this zone, the systems all have combination of food crops and at least one tree crop. For example cocoa or oil palm is combined with food crops such as plantain, cassava, cocoyam and some other minor crops. The farming system practised involves permanent cultivation of tree crops, and rotational bush fallow of food crops. The first crop normally planted is maize, which is planted in almost every part of the farm. Two or three weeks later, trees (cocoa or oil palm) are planted, following by plantain, cassava or vegetable in the same piece of land. Farm sizes vary from an acre to 15 acres with the most recurring farm size being 2 acres followed by one acre.
iii. Livestock production
Sudan Savanna Zone and Guinea Savanna ZoneLivestock may be owned individually or by family. Sheep, goats, fowls and guinea fowls are kept by a majority of household.
Table 51: Percentage of farmers keeping livestock, 1992Cattle Sheep Goat Chicken Guinea fowls Duck Turkey Pig 58.3 60.0 68.3 73.3 48.3 33.3 5.0 28.3
The animals are free during the dry season and tethered to uncultivated patches of grass near the farm in the rains. Grazing lands are poor and are those obtained under natural conditions.
Forest Transitional Savanna ZoneIn this zone, poultry, sheep, ducks and goats are kept in extensive and or semi-intensive
103

managements systems, whilst pigs are kept under an intensive system. The chickens are kept in coops during the night and left on free-range during the day. The animals are seen to be liquid assets, which can be sold easily on the local markets. Pigs are kept in the relatively urban settlements.
Deciduous ZoneBecause of the susceptibility of livestock to Trypanosomiasis and other diseases, the zone keeps very few livestock. It also results from a difficulty of integrating livestock with arable farming particularly where farmers have to walk long distances to farm. Small livestock are allowed to roam and graze around the village.
E. Constraints to agricultural production in several agro-ecological zones of the Volta basin in Ghana
Savanna Zone- A long and intense dry season- The pattern of rainfall is uncertain: the single wet season may start as early as the
beginning of March or as late as the end of June;- The major proportion of the early rains is lost due to surface runoff;- Annual bush burning aggravates the low levels of organic matter in the topsoil;- Debilitating human diseases such as Onchocerciasis and malaria- Livestock pest and diseases such as Trypanosomiasis, are a major constraints to
increase livestock production;- Scarce drinking water;- Poor and deteriorating infrastructure and communications- Remoteness from major domestic and overseas markets.
Savanna Transitional ZoneThe major problems are:
- High costs of farming input and fluctuation in their price;- High interest rates by credit institutions;- Erratic rainfall;- Long-term management strategies for the land use are difficult because the
landlord may deprive the farmer of the land when he wants;- The aridity of the zone in the dry harmattan produces stress in cocoa resulting in
such diseases as swollen shoot;- Prevalence of livestock diseases.
Deciduous Forest ZoneThe major problems are:
- Tsetse infestation limits the exploitation of livestock potential;- Cocoa is suffering from black pod and the spread of the swollen shoot virus;- Although the soils are fertile in this zone, when the forest is cleared for
cultivation, the nutrient status is drastically reduced as a result of the organic matter being quickly oxidised, the topsoil dries hard when exposed to the sun;
104
F. Specific examples of Farming systems and land use options in some agro-ecological zones of the Volta basin of Ghana
i. The interior savanna zone
Farming systemsThe Savelugu-Nanton District it the Northern Region of Ghana is discussed here as typifying the farming systems in the Interior Savanna Zone. To make the discussion applicable to the wider ecological zone, other information from other areas of the district may be used.
The main tree crop is sheanut tree; the food crops are millet, sorghum, rice, groundnuts, cowpeas, yams, cassava and vegetables (tomatoes and onions). Rice, tomatoes, onions and cotton are important cash crops. The average size of cropped fields is about two hectares with the mean from men being 2.7 ha and 1.8 for women.
There are 4 types of crop mixture patterns:- Sole cropping- Mixed cereals- Cereal/legume mixtures- Root crops and others
Interface between land evaluation and farming systemsThe six main soils occurring in the Savelugu-Nanton District were identified as:
- Ferric Acrisols - Dystric Plinthsols - Dystric Planosols - Plinthic Lixisols - Eutric Fluvisols - Eutric Plinthisols
The land suitability for the crops grown is at best moderately suitable. The low level input is the current level used in the district. It means that fertilisers are not used to any significant extent. In order to improve yields and soils suitability, the intermediate input level would be used (soil fertility maintenance level of fertiliser or organic manure application). The long-term target for improvements in the farming system of small-scale farmers and in the short-term for the few large-scale farmers is the high input level.
The Soil Research Institute of Ghana (SRI, 1999), developed yields indices based on the different levels of soil suitability for the different crops. As a result, the yields attainable at low, intermediate and high input levels were estimated. Moreover, by using the Estimated Average National wholesales prices of crops/tonne (1998), the revenue from the yield of each crop was estimated.
Savelugu-Nanton District
105

Table 52: Estimated Average National wholesale prices of crops/tonne (1998)Crop Price (cedis)Maize 704,670Cassava 304,473Millet 751,807White yam 620,793Sorghum 616,110Cowpea 1,123,018Groundnuts 1,515,232Yams 670,793Rice 1,047,070
Source: ministry of food and agriculture, Ghana, field estimates.
The revenue from each of the component crops in the crop mixtures taking account the spatial and temporal arrangements on a piece of land when added up, give an estimate of the total revenue per area for the cropping or farming system. This gives an indication of the sustainability of the different cropping systems. In order to determine the economic profitability of different cropping or farming systems, the cost of inputs and activities are considered.
Examples of cash flow analyses are illustrated for food crop intercrop with limited rotational bush fallow system (sorghum, maize and yam) at low, intermediate and high input level on Ferric Acrisols over a 4-year period.
These results show that improving in the farming/cropping system could be made for better yields and better revenue. Increasing the input levels from low to intermediate and from intermediate to high brings a significant increase in the net cash flow. Farming on all the soils are however relatively sustainable for all cropping systems at both the intermediate and high input levels.
ConclusionFrom this analyse, we conclude that in the Savelugu Nanton District, the most profitable farming/cropping system is the one which involves the mixture of sorghum, maize, groundnut, cowpeas, cassava and yam. It may be used at all level of input and on all the soils. However, since the profitability increases with increasing level of inputs used, the most sustainable farming system in the Interior Savanna Zone is the high input level. Farmers in this zone should be encouraged to increase their use of inputs where possible.
ii. The Forest-Savanna Transitional Zone
Farming systemsThe Techiman District, in the Brong Ahafo Region of Ghana is dicussed here as typifying yhe farming system in this zone. The main tree crops include cashew, oil palm and teak. A quarter of the farmers are growing tree crops. The three most common food crops grown are maize, cassava and yams. Two dominants cropping systems are use:
- Permanent tree crops systems
106

- Rotational bush fallow of food crops systems (Cassava + yam + maize or Plantain + yam + maize)
The average farm size in the zone is of 1.4 hectares. Another important element of the farming system is the main rotation of annual cropping patterns. Most of the Transitional Zone and thus Techiman Districts falls within the cropping systems zone with length of growing period between 210 and 240 days. Sowing and planting of crops start in mid-April, yams are planted from November to December and harvested from August.
The sequence of planting different crops in a year on a plot in the Techiman District is shown in the following table.
Table 53: Sequence of planting in the Techiman District of GhanaPosition in sequence Crops planted Planting Period/Season1st Maize From mid April2nd Cashew March-September3rd Plantain April-September4th Cocoyam, vegetables April-May5th Yams November-December6th Cassava Throughout the year
There is also the rotation/sequencing of crops from year to year. A plot may be farmed for up to four years. Maize and vegetables are harvested the first year, the other food crops the second year. Cassava and yams are replanted in the third year and the plantains continue to be harvested to nearly the fourth year. Normally, farmers plant food crops with the trees until the tree crops form a closed canopy, which prevents light from reaching the food crops underneath them. The food crops are cultivated for a period for 2 to 4 years and then left to a fallow period of 2-3 years.
Table 54: Types of farming systems in the Techiman District of GhanaNational types Agro-ecological zones types of cropping
systemsSpecific farming systems
Permanent tree crop systems
Cashew permanent tree crop systems = cashew + food crops (plantain, maize, cassava, cocoyam + other minor crops)
Cashew cropping systems without livestockCashew cropping systems with some limited livestock = cashew + food crops + limited semi-intensive livestock (poultry, goats and sheep)
Oil palm permanent tree crop systems = oil palm + food crops systems (e.g. maize, cassava, cocoyam, plantain + other minor crops)
Oil palm permanent tree crop systems without livestockOil palm permanent crop systems with some livestock = oil palm + food crops + limited semi-intensive livestock
Rotational bush fallow of food crops systems
Plantain based rotational bush fallow of food crop system = plantain intercropped with other food crops (usually excluding cassava), in a rotational bush fallow system
Plantain based rotational bush fallow of food crop system without livestockPlantain based rotational bush fallow of food crop system + limited semi-intensive livestock (poultry, goats and sheep)
Cassava based Rotational Bush fallow of food crop systems = cassava inter-cropped with other food crops (usually excluding plantains), in a rotational bush
Cassava based rotational bush fallow of food crop systemCassava based rotational bush fallow of food crop system + limited semi-intensive livestock
107

fallow system
Interface between land evaluation and farming systems in the Transitional zoneThe main soils occurring in the Techiman District were identified to be Haplic Lixisols, Ferric Lixisols, Ferric Acrisols and Haplic Acrisols. The suitability of these soils varies from marginally suitable to very suitable. The Haplic Lixisols and Ferric Acrisols are suitable or very suitable for maize, cassava and cowpeas cultivation. Haplic Acrisols are not suitable for maize at low input levels but are suitable for yams, cassava and cowpeas.
The use of inputs is generally intermediate (soil fertility maintenance levels of fertiliser or organic manure). Increasing of inputs may be the soil suitable for such or such crop; the description of each crop yield for each soil has been done. In order to determine the revenue from outputs of the crops in the farming system, estimated wholesales prices of the outputs of the crops per tonnes, based on National Average Wholesale Prices were used.
Table 55: Estimated average national wholesale prices of crops/tonne (1998)Crop Price (cedis)Maize 704,670Cassava 304,473Plantain 377,188White yam 620,793Cocoa 2,250,000Oil palm 1,400,000Groundnuts 1,515,232Citrus 500,000Cashew 650,000
Source: ministry of food and agriculture, Ghana, field estimates.
Revenue from the yield of each crop was estimated by multiplying wholesale market price of crop with yields. The revenue for the crops at low, intermediate and high level inputs are shown is table 2.4, 2.5 and 2.6.
The costs of inputs for farming system in the Techiman District have been estimated. As a result, example of cash flow analyses may be done. In the table, we can see the cash flow for cashew with food crops intercrop system at low and intermediate input levels on Haplic Lixisols for a period of 9 years
For all the type of soils, at low input level, the most sustainable cropping system is cassava food intercrop with rotational bush fallow. It gives the highest annual profitability on all soils types. For all the cropping systems, increasing the input level means increasing cash flow. The amount of increase, however, varies with soil type and cropping system. The exception is on the food crop systems on Haplic Acrisols, where an increase of inputs from intermediate to high level leads to a decrease in the profitability.
108

Conclusions Currently, in this zone, farmers apply organic and inorganic fertilisers on their farms. However, an increase in the input level should be encouraged to move to the high input level. The most sustainable crop systems are cashew permanent tree with plantain intercrop on Haplic Acrisols and then cashew permanent tree crop with cassava intercrop, when using high levels of inputs. On the other three soils, cassava food crop intercrop with rotational bush fallow is the most profitable.
iii. The Deciduous Forest Zone
Farming systemsThe Atwima District in the Ashanti Region is discussed here as typifying the farming systems in the zone. The main tree crops include cocoa, oil palm, coffee, rubber and avocado. The food crops are maize, plantain, cassava, cocoyam, yam and vegetables (tomato, okra, garden egg).
Farm sizes range between 0.45 and 6.8 hectares with a modal size of 0.9 hectares.
The two dominant systems are:- The permanent tree crop system (cocoa + food crops or oil palm + food crops)- The rotational bush allow of food crops systems (mainly plantain, cocoyams and
maize, white yams and vegetables)
Plantain and cassava are not usually intercropped. The food crop farms are fallowed after 2-4 years of farming. Most farmers in the district keep local fowls or poultry, whilst an average of farmers keep two goats and a sheep.
Table 56: Types of farming systems in the Atwima District of Ghana
National types Cropping systems Farming systemsPermanent tree crop systems
Cocoa cropping systems = cocoa + food crops (e.g. plantain, cassava, cocoyam + other minor crops)
Cocoa cropping systems without livestock = cocoa + food crops (e.g. plantain, cassava, cocoyam + other minor crops)
Cocoa cropping systems with some limited livestock = cocoa + food crops (e.g. plantain, cassava, cocoyam + other minor crops) + limited semi-intensive livestock (poultry, goats and sheep)
Oil palm permanent tree crop systems = oil palm + food crops (e.g. plantain, cassava, cocoyam + other minor crops)
Oil palm permanent tree crop systems without livestock = oil palm + food crops (e.g. plantain, cassava, cocoyam + other minor crops)
109

Oil palm permanent crop systems with some livestock = oil palm + food crops + limited semi-intensive livestock (poultry, goats and sheep)
Rotational bush fallow of food crops systems
Plantain based rotational bush fallow of food crop systems = plantain inter-cropped with other food crops (usually excluding cassava), in a rotational bush fallow system
Plantain based rotational bush fallow of food crop system without livestock = plantain inter-cropped with other food crops (excluding cassava), in a rotational bush fallow system
Plantain based rotational bush fallow of food crop system with some livestock = plantain inter-cropped with other food crops (excluding cassava), in a rotational bush fallow system + limited semi-intensive livestock
Cassava based rotational bush fallow of food crop systems = cassava inter-cropped with other food crops (usually excluding plantains), in a rotational bush fallow system
Cassava based rotational bush fallow of food crop system = plantain inter-cropped with other food crops (excluding plantain), in a rotational bush fallow system
Cassava based rotational bush fallow of food crop system = plantain inter-cropped with other food crops (excluding plantain), in a rotational bush fallow + limited semi-intensive livestock
In almost all cases, use of purchased inputs such as fertiliser, organic manure, lime and pesticides, and veterinary drugs, is very low.
Interface between land evaluation and farming systems in the Deciduous Forest Zone
The main soils occurring in the Atwima District are Ferric Acrisols, Haplic Alisols, Dystic Fluvisols and Rhodic Nitosols. The suitability of these soils varies between unsuitable to very suitable. The low input level is the current level used in the district. The yields attainable at low and medium levels were estimated and are shown in the table 3.1 and 3.2.
In order to determine the revenue from outputs of the crops in the farming system, estimated wholesale prices of the outputs of the crops per tonne, based on National Average Wholesale Prices, obtained from the Ministry of Food and Agriculture (MOFA), and confirmed with field data were used (Cf. table 3.3 and 3.4).
Table 57: Estimated Average National wholesale prices of crops/tonne (1998)Crop Price (cedis)Maize 704,670Cassava 304,473Plantain 377,188White yam 620,793Cocoa 2,250,000Oil palm 1,084,226Groundnuts 1,515,232
Source: ministry of food and agriculture, Ghana, field estimates.
110

Like for the other district in the other agro-ecological zone, a typical cash flow analysis had been made. The example done is for cocoa with food crops intercrop system at low and medium input levels on Ferric Acrisols over a period of 9 years.
Conclusion After analysis, on Ferric Acrisols, Dystic Fluvisols and Haplic Alisols, the most sustainable system is plantain food crop intercrop with rotational bush fallow. For Rhodic Notisols, the most sustainable cropping system is the cocoa with food crop intercrop one.
Using Dystic Anvisols for any cocoa with food crop intercrop farming system or cassava food crop intercrop with rotational bush fallow system is actually not sustainable and should be discouraged. For Rhodic Notisols, intermediate input level is always more sustainable than the high input level.
B. The Agro-Ecological zones in the Volta basin of Burkina Faso
Five agro-ecological zones have been identified by the CNRST, based on agro-climatic, socio-demographic conditions and regional constraints and potentials. These zones have the following characteristics:
The Eastern zoneThis zone covers an area of 60,600 sq.km with a population density of less than 20 inhabitants per sq. km. It has an annual rainfall of between 500 mm and 1000 mm. It has great potential in animal husbandry, fishery and wildlife resources (5 reserves). The farming system is dominated by sorghum and millet.
The Sahelian zoneThis zone covers an area of 36,896 sq. km with a very low population density of 10 to 17 inhabitants per sq. km; it has a rainfall of between 300 mm and 600 mm and highly degraded vegetation cover due to drought. Its agriculture is subsistence and consists mainly of cereal. The main source of income is animal husbandry.
The North-western zoneThis zone has an area of 30,870 sq. km., a rainfall of between 500 mm. and 800 mm. It has an average population density of 41.1 inhabitants per sq. km. Although the farming system is based on the cultivation of sorghum and millet, this zone has great potential for irrigated crops such as vegetables, rice and maize. Animal husbandry is also significant.
The Central zoneThis zone covers an area of 94,000 sq. km with a high population pressure resulting in severe degradation of the plant cover and soils. Rainfall varies between 600 mm and 900 mm. The agro-pastoral and forestry potentials are limited and the farming system which
111

consists of agriculture combined with animal husbandry is dominated by small ruminants and poultry.
The Western zone This zone has an area of 52,000sq.km, and a rainfall of between 700 mm and 1200 mm. This zone has great natural resources potential. It is the converging area for immigrants from the Central and Northern parts of the country. Its agriculture is much diversified with high output in cotton, fruits, vegetables and dominance of cereals (sorghum, maize, millet, rice and fonio). It has a high potential for animal husbandry, and possesses a large stock of cattle.
Subsistence farming is very widespread; it is essentially manual with very few external inputs. Animal traction is mainly used in the cotton-growing tracts (cash cropping) where modernisation (mechanisation and use of agrochemicals) is well advanced.
C. Agricultural regions and Production systems in Burkina Faso Many regional divisions of Burkina Faso were made by the technical services of ministerial departments (MARA, MEE, MAT...) following precise specific objectives. The agricultural zones described here are those determined by INERA. They cover the entire agroecological zones described under this section as well as the entire Volta Basin in Burkina.
The Northern Region: The SAHELIt covers the majority of the Burkinabè Sahel and includes the Sahel provinces of Oudalan and Soum. It is the driest region of the country. The rainy season, which lasts approximately three months, extends from June to September. Rains are erratic and the total rainfall in a year is hardly more than 600 mm. Evapotranspiration there is very high and is combined with high amplitudes of temperatures during the day and at night.
By tradition, it is a livestock zone. Millet is the main crop, while white sorghum comes second. There are almost no rotation crops. Fallowing decisions are dependent on the displacement of animal habitat or penning (KAFANDO P., 1995). Night penning of animals on plots after harvests constitutes the main form of soil fertilisation. The inputs of chemical fertilizer are negligible. Animal traction, which has been introduced by vulgarization agents, is not yet generalized. However, in the Soum there are a few hitches with donkeys and camels. Usually agricultural work is manual in this region where the margin of manoeuvre of producers is narrow as far as the choice of cropping and production system is concerned.
The Central RegionIt covers the following provinces: Sanmatenga, Namentenga, Oubritenga, Boulkiemdé, Sanguié, Kadiogo, Ganzourgou, Bazèga, Zoundwégo, Sissili and Nahouri. It extends to almost all the central plateau, with an annual rainfall ranging from 600 mm in the north to
112

900 mm in the south. Unequally distributed, rains spread over 4 to 6 months. Agriculture in this region is mainly rain fed.
Due to its high population density, this region experiences serious problems of environmental degradation resulting from the overexploitation of its meagre resources. The population pressure in the centre is such that there is practically almost no fallow anymore. Therefore, soil fertility is not restored, accelerating in this way its degradation and aggravating the adverse effects of wind and water erosion. The inputs of fertilizers to make up for and restore crop exploitations are weak. This system of land use gradually leads to soil depletion, hence the notion of land overexploitation.
Farming systems in the regions are based on cereals like in the east. Sorghum and millet come first, i.e. about 80 % acreage, followed by groundnuts and quite far behind maize.
The introduction of animal traction dates back from the 1960's. In general, the use of traction equipment is limited to ploughing before planting, particularly for cash crops (groundnuts and cotton). It cannot be said that animal traction is a characteristic of this region as most farming activities are still done manually. Local varieties of sorghum and millet are still preponderant. Recourse to improved seeds concerns only groundnut and rice.
As a result of the many water bodies in the central regions, market gardening is developing. Since it is an out of season activity, producers have the opportunity to get to work and increase their incomes.
The North-Western Region It includes the provinces of Bam, Passoré, Yatenga and Sourou. This region is characterized by a rainfall, which varies between 600 mm in the north to 800 mm in the south. The dominant economic activity is livestock raising, with, however, animal numbers less than those of the Sahel and the central regions. But the degradation of the climatic conditions obliged producers to adapt themselves. In this sense farming systems in this region are now based on the couple millet-sorghum (white). Groundnut comes in third position. Pedo-climatic conditions offer producers of this region little choice in terms of crop diversification. Croplands are lacking and they are continuously used under rotations: millet-sorghum-groundnut However, it can be noticed that farmers are making efforts to overcome this hostility of nature. It is one of the regions, where the use of organic manure (animal manure and excreta), in association with the use of straw, is quite common.
In provinces such Yatenga and Passoré, the Zaï (improved traditional technique) is used to restore deteriorated land. Although the introduction of animal traction goes as far as the beginning of independence (BDPA and SATEC intervention), this practice is also constrained for many reasons: soil fragility, high costs, maintenance of draught animals. As a result, farming activities still remain manual. In the north-western region, it is worth noticing the existence of the Sourou valley, which provides great opportunities for the cultivation of irrigated rice, maize and market gardening. With irrigation, producers
113

undertake two campaigns of rice and earn substantial incomes. It must be noticed that in the irrigated areas, agricultural intensification techniques are used.
The Eastern Region It covers the provinces of Boulgou, Kouritenga, Gourma, Gnagna and Tapoa. Some provinces (Gourma, and Tapoa) in this region are the least populated and thus the least deteriorated in Burkina Faso. The annual rainfall varies between 600 mm and 900 mm. It shelters the country's big fauna reserves. It is considered as a cereal producing region. Farming systems there are characterized by the predominance of sorghum and millet in rotations. Groundnut comes next. In recent years, the penetration of cash crops such as cotton has been noticed thanks to political incentives.
The Western Region It covers the provinces of Kossi, Mouhoun, Houet, Kénédougou, Bougouriba, Comoé and Poni.
The rainfall is in the range of 900 mm and 1100 mm. It constitutes the region with the best agricultural potential. Maize is the main food crop. The growing of rain-fed rice is also developed. It is the chosen zone for the main industrial and cash crops (sugar cane and cotton).
The western region is also that of yams. Mainly cultivated in the Comoé and Poni provinces, the position of yam is relatively important in the farming system. Its cultivation demands rich soils, hence the need to clear new plots as fields become poor. It is a destruction factor of biological diversity.
The western region, no matter what is said, is the region where the modernization of agriculture is fast (use of improved seeds and grain drills, mechanical ploughing and weeding, treatment with insecticides). In addition to the large adoption of animal traction, favored by the cultivation of cotton, an experiment of mechanization occurred thanks to the financial facilities provided by cotton cultivation. This intensification of agriculture is limited in the short term by the fragility of soils whose fertility conservation is not guaranteed. The low rate of organic matter in the soil and the need to restore soil depletion constitutes challenges for most producers in the region despite their satisfactory technical level.
In this region, fallowing is a practice still in force, because of the relative availability of lands. But the land pressure, which is growing with the flow of migrants, tends to make it disappear.
114

III. HISTORICAL DEVELOPMENT OF VOLTA BASIN
III.1 Changes in water supply and use
III.1.1 Water Institutions and Legislation
Institutional structures and legal frameworks have been established to some degree in the riparian countries for environmental management, as documented in the various country reports. A summary of the various national institutional structures and legal frameworks is presented in tables below. The institutions charged with transboundary water resources issues are then discussed in greater detail. A short summary of legal and institutional constraints follows.
BeninBenin has developed a number of laws and institutions to address the environmental impacts of activities in the country, which are outlined in the following table.
Table 58: Ministries and Departments for managing water and Land resources in BeninMinistry Departments ResponsibilitiesMinistry of Environment, Settlements, and Urban Development
Environment, Sanitation,and Urban Roads, Administration of Territories
Management of theEnvironment
Ministry of Agriculture, Livestock, and Fishing
Rural Development, Forestand Natural Resources, Agriculture, Fishing, Livestock
Management of NaturalResources, Water, andSoils
Ministry of Mines, Energy, and Hydraulics
Mining, Beninois Societyof Electricity and Water,Hydraulics
Management of Mineral Resources, Management and Distribution of Water Resources at the National Level
Ministry of State in Charge of Coordination of Government Act, Forecasting, and Development
- Identification of projects and programmes that will have positive impacts on the environment. Followup of projects and programmes and their actual impacts on the land,and in particular the environment
Ministry of Interior and Security and Decentralization
Department of TerritorialAdministration; Department of Local community;National Commission ofState Affairs; Departmentof Prevention and SoilProtection
Environmental issues
Ministry of Law and Justice and Human Rights
Department of Law andCodification
Support of the legalFramework
Ministry of Finance andEconomy
- Development of policies for improving the environment, e.g., taxIncentive
Ministry of Public Health Department of Hygiene andSanitation
Implementation of national policies in matters of hygiene and health
Ministry of Higher Education National University of Concern about
115

and Scientific Research Benin; Committee of Manand Biosphere; BeninoisNational Commission of UNESCO; Beninois Center of Scientific Research and Technique
environmental policies
Apart from the Ministries having some roles in managing water and land resources, the Beninois government has put in place measures that give roles to the local communities concerning sanitation, public health, and roads. Several legislative texts have been passed for rational management of the natural resources of the country. Some of these include:
1. Decree No. 82-435; December 30, 1982 against bushfires and setting fires to plantations.2. The Law No. 87-016; Water Code.3. The Law No. 98-030; February 12, 1999 on legal framework for the environment of the republic of Benin.
Burkina FasoThe overall vision of the country’s framework for managing natural resources, expressed in the document “Policies and Strategies in Water Matters” adopted by the Burkinabe government in 1998, is of sustainable human development. This means providing economic security, health, food security, and a sound environment, among other things. The following laws are in existence for the management of the environment and land resources:1. Act No. 005/97/ADP2. Act No. 0014/96/ADP of 23 May 1996Table 4.2-1 gives the responsibilities of the various government ministries and departments associated with the management of land and water resources in Burkina Faso.
Table 59: Departments for Managing Land and Water Resources in Burkina FasoDepartment ResponsibilitiesForeign Affairs To implement framework of agreements of
international cooperationAdministration of Territories/Lands Land administrationEnergy and Mines Production of hydropower and utilization of
mineral resourcesTertiary and Secondary Education and Scientific Research
Education and training
Public Works, Settlements and UrbanDevelopment
Road infrastructure and urban
Agriculture Enhance irrigation developmentAnimal Resources Management of pastoral zonesHealth Public HealthTransport and Tourism Collection of climatological dataSocial Action and the Family Management of risk linked to waterAuthorities for managing valleys AMVS, MOB
116

Other actors associated with the land and water resources management include NGOs, the private sector, and development partners. Some difficulties encountered in institutional management include sectoral management of natural resources and inadequate management of human and financial resources.
Côte d’IvoireIn Côte d’Ivoire, numerous institutions are charged with the responsibility of managing and using water resources. This situation has led to fragmentation and dispersion of functions among the institutions. The functions of main actors in water resources are divided into two main groups: managers and users. The law that created this division was Law No. 98 – 755. There are two codes regulating, protecting, and guiding the use of water: environment and water codes. The ministry with overall responsibility for managing water resources is the Ministry of Water and Forests. It is the authority in charge of policies for managing water resources. Additional ministries include:
Table 60: Ministries and Their Responsibilities in Côte d’IvoireMinistry ResponsibilitiesResourcesMinistry of Mines and Energy Generation of hydroelectricityMinistry of Transport River and maritime transportMinistry of Construction and Urban Development SanitationMinistry of Environment and Life Protection of waterMinistry of Economy and Finances Financing of water projectsMinistry of Planning and Development Scheduling of projectsMinistry of Public Health Protection against diseases associated with
waterMinistry of Industry IndustryMinistry of Tourism TourismMinistry of Interior and Decentralization
Table 61: Ministries for the Management and Use of Land Resources in Côte d’IvoireMinistry ResponsibilitiesMinistries of Water and Forests Protection of soils and fight against desertificationMinistry of Environment and Life Protection of EcosystemsMinistry of Construction and UrbanDevelopment
Management of urban areas
Ministry of Agriculture and AnimalResources
Agricultural development and management of rural areas
Ministry of Mines and Energy Mineral exploitation
A legal framework that came into force in December 1998, the Rural Land Code, allows for the registration and security of rural lands.
Ghana
Policy framework Details of the Ghana water policy are presented here to illustrate the positive steps being taken in the basin to create a policy environment that promotes sustainable water resources management.
117

Water vision: Water is essential to the existence of man and all living things. Health, nutrition and food production, for example, are dependent on its availability in adequate quantities and good quality. Population increase and concentration, rapid urbanisation and industrialisation resulting in an increase in individual and collective needs have made water increasingly scarce and often of low or reduced quality. In addition to these, current accelerating climatic change processes are expected to increase both the spatial and temporal unpredictability of water availability. The water resource base is, therefore, under increasing threat. Ghana’s Water Vision for 2025 has the main objective to ‘promote an efficient and effective management system and environmentally sound development of all water resources in Ghana’.
Policy Objectives: The water policy of Ghana aims at achieving an efficient and effective management system for the sustainable development of water resources in Ghana to assure full socio-economic benefits for present and future generations.This would be achieved by ensuring:
Availability of water in adequate quantities and quality to sustain nature, biodiversity and the aquatic ecosystem;
Access to safe drinking water and sanitation facilities for the entire population, both rural and urban;
Availability of water in sufficient quantities for cultivation of food crops, watering of livestock and sustainable freshwater fisheries to ensure sustainable food security for the country;
Availability of water for hydropower generation, industrial use, water transport, and recreation;
An effective management system for sustainable use of water and fully integrated into the socio-economic development of the country and national development planning.
Guiding Principles for Ghana Water PolicyOn the basis of national aspirations and convictions, as indicated in the Constitution of the Fourth Republic, the National Development Framework, Ghana Water Vision 2025 and the National Environmental Action Plan, as well as other international guidelines, agreements and conventions, Ghana’s water policy will be guided by the following principles:
The principle of fundamental right of all people to safe and adequate water to meet basic human needs;
The principle of recognising water as a finite and vulnerable resource, given its multiple uses;
118

The principle of integrating water resources management and development with environmental management in order to ensure the sustainability of water resources in both quantity and quality;
The precautionary principle that seeks to minimise activities that have the potential to negatively affect the integrity of all water resources;
The principle of coordinating water resources planning with land use planning;
The principle of adopting the river/drainage basin as a planning unit;
The principle of polluter pays, to serve as a disincentive to uncontrolled discharge of pollutants into the environment;
The principle of subsidiarity in order to ensure participatory decision-making at the lowest appropriate level in the community;
The principle of solidarity, expressing profound human companionship for common problems related to water;
The principle of recognising the economic value of both raw and value added water and making users bear the appropriate cost;
The principle that international co-operation is essential for sustainable development of shared basins;
The principle of integrating river basin management with management of the coastal zone; and
The principle of the greatest common good to society in prioritising conflicting uses of water.
Acts establishing new institutions and strengthening existing ones for managing water resources in Ghana, and in particular the Volta Basin, are as follows:Act 46 of 1961 (Volta River Development Act) sets up the Volta River Authority (VRA).The VRA has the mandate to plan, execute and manage development of the Volta River.The primary function of the VRA is to generate power for the country’s industrialization.Act 490 of 1994 establishes the Environmental Protection Agency.Act 522 of 1996 establishes the Water Resources Commission.Act 462 of 1993 establishes the District Assemblies.
Government departments and agencies charged with responsibilities of usage or management of water resources are presented in Table 62.
119

Table 62: Ministries and Departments Responsible for Water Resources Development and Utilization in Ghana
Ministry Department/Institutions Responsibilities
Ministry of Works andHousing (MWH)
Water Resources *Commission
Planning and regulation of the development and use of freshwater resources in Ghana
Ministry of Environmentand Science (MES)
Environmental ProtectionAgency (EPA) *
Management of the country’s environment, collaborating with relevant state institutions and international bodies in ensuring sustainable development of the country’s natural resources
Ministry of Lands andForestry
Forestry Commission * Control and planning of forestry resources
Ministry of Mines Mineral Commission* Granting of mining rights
Public Utilities RegulatoryCommission
Regulate the supply, Transmission, and distribution of treated water
Ministry of Energy (ME) Volta River Authority(VRA) **
Plan, execute and manage the development of the Volta River for hydropower generation
Ministry of Food andAgriculture
Irrigation Development Authority ** Development of irrigation in the country
Ministry of Works andHousing
Ghana Water Company Ltd. ** Provision of potable water for urban settlement
Ministry of Works andHousing
Community Water and Sanitation ** Provision of potable water for rural communities
Ministry of Roads andTransport
Meteorological Services Division *** Assessment of data
Ministry of Environment and Science
Water Research Institute of CSIR *** Assessment of surface and groundwater resources in quantityand quality.
* Organization involved primarily in the regulation of the environment and natural resources.** Organization involved mainly in the development and use of water resources.*** Organization involved mainly in the data collection and processing of data/information for water resources management.
Mali
In Mali, the water sector is under the Ministry of Mines, Energy, and Water. Its function is carried out by the National Department of Hydraulics, which was established by the law No. 99-023 of June 11, 1999.
The functions of the department, among other things, include the assessment of potential water resources in the country, supervision of works and appraisal of projects in the water sector, and promotion of sub-regional cooperation in the domain of water resources management.
A number of departments are also involved in the management of water resources. To avoid duplication and harmonize activities, a Committee of Interministerial Coordination
120

of Water Sector and Sanitation was established by decree No. 95-447/PM-RM. The composition of the Committee reflects the ministries involved in water issues:
The Ministry in Charge of HydraulicsThe Ministry in Charge of PlanningThe Ministry in Charge of International CooperationThe Ministry in Charge of Public HealthThe Ministry in Charge of AgricultureThe Ministry in Charge of LivestockThe Ministry in Charge of EnvironmentThe Ministry in Charge of Territorial AdministrationThe Ministry in Charge of FinancesThe Ministry in Charge of IndustryThe Ministry in Charge of Cottage Industry
The Ministry in Charge of the Environment is responsible for all issues affecting the environment. However, the management of the environment is shared among ministerial departments, which include: Rural Development, Health, Hydraulics, Transport, Urban Development, Industries, Education, Public Works, and Territorial Administration.
A number of laws regulate economic and social activity in order to protect the environment. The Preamble to the Malian Constitution states that the people of Mali must insure the cultural inheritance and environmental protection. Some of the laws and regulations governing the water sector in Mali include:
(i) The Water Code, (ii) National Policy on Water, (iii) The Code on Decentralised Territorial Communities, and (iv) National Strategy on Development of Potable Water Supply and Sanitation.
Other laws governing the environmental sector include Law No. 91-047/an-rm and the Law No. 89-6/an-rm. Other laws govern land ownership and the management of forest resources.
4.6 TogoIn Togo, a number of institutions are involved in the management of water and soils. The various ministries and departments involved are presented in Table 4.6-1.
Table 63: Ministries, Departments, and Institutions Responsible for the Management of Water in TogoMinistry Department/Institution ResponsibilityMinistry of Equipment, Mines, and Hydraulic Resources
General Department ofHydraulics
Implementation of programmes, formulation of laws and regulations withrespect to water resources and sanitation
Ministry of Public Health Division of Public Health and Sanitary Engineering
Public hygiene and sanitation
Ministry of Public Health National Institute ofHygiene
Analysis of water
Ministry of Agriculture, Department of Managing Management of surface
121

Animal Husbandry, andFishing
Rural Equipment water, Agro land laws
Ministry of Environment and Forest Resources
Department of GeneralEcology and Rehabilitation of the Environment
Control of withdrawal of water from water courses, aquifers, lagoons, and the sea for industrial and agricultural purposes
Ministry of Agriculture,Animal Husbandry, andFishing
Togolese Institute ofAgricultural Research (ITRA)
Conservation, studies, andmapping out of soil types
Ministry of Planning andManagement of Territories,Habitat, and Urban Development
Department of Urban Development and Habitat
Control of the management of urban lands
Ministry of National Education, University of LomeMinistry of Cooperation andForeign Affairs
The legal framework governing the management of land and water resources is the Code for the Environment, the decree of 5 February 1933, and Code for Water, which is to be finalized under the management of water resources, and the Mining Code.
Overview of national institutional and legal framework for integrated management
In the riparian countries, many institutions are charged with the responsibilities of managing water and soil resources. This results in the overlapping of responsibilities and difficulties in coordination. Coordination of activities among the institutions was found to be generally weak, and in some cases is only on an ad hoc basis for crisis situations. In order for the management of water and soil resources to be effective, it should be integrated at the local and national level, with emphasis on intersectoral coordination.
The effectiveness of the laws governing resources poses another problem as the laws and regulations established for the management of water and soil resources appear to be weak and ineffective. In some instances, the laws are adequate but they are not adhered to or enforced either due to lack of institutional capacity or political commitment. The knowledge base of the state of natural resources, rate of depletion, and consequent future impact is poor, and probably contributes to the weak political commitment on the parts of governments and general apathy on the part of the populace.
Regional CoordinationSeveral initiatives have been undertaken at the regional level to manage water resources. One such process initiated by the Government of Burkina Faso, with the support of DANIDA (Danish International Development Agency), brought together official delegations from 16 West African countries to form the West African Regional Action Plan for Integrated Water Resources Management (WARAP – IWRM). Begun in 1997, this regional cooperation arrangement within the Economic Community of West Africa States (ECOWAS) has proposed the establishment of a regional structure for coordination and monitoring of the West African Regional Initiatives for Integrated Water Resources Management. Some of the IWRM country initiatives identified for support include:
122

GIRE (IWRM) in Burkina Faso Water resources management in Benin WRIS project for water resources monitoring in Ghana Establishing the Water Resources Commission in Ghana The sub-regional action plan for combating desertification adopted in 1999 by the
environment ministers
Another regional cooperation effort for integrated management of water resources is being developed by the Global Water Partnership and its technical group, the West African Technical Advisory Committee (GWP/WATAC). Their aim is to prepare regional Programmes of Action to implement the West African Water Vision for the twenty-first century.
A sub-regional initiative, Comité Permanent Inter Etats de Lutte Contre la Sécheresse (CILSS), limited to the Sahel region, considers how to fight drought and desertification with the view to promoting food self-sufficiency in the region.
Green Cross International, with its sub-regional head in Burkina Faso, is also undertaking a basin-wide initiative with the objective to develop basin principles, agreements, and management policies in order to promote peace.
Other initiatives in the region include: GLOWA Volta Project on Integrated Assessment of Feedback Mechanism between Climate Land Use, and HydrologyWorld BankAgence Francaise de DéveloppementWest and Central Africa Action Plan for Abidjan Convention (WACAF)Land-Ocean Interactions in the Coastal Zones (LOICZ Afribasins project)Center for Africa Wetlands (CAW)
Two other regional initiatives have direct bearing on the Volta River Basin environment. The New Partnership for Africa’s Development (NEPAD) is a comprehensive integrated framework for the socio-economic development of Africa, and contains a strong environmental component. Additionally, two basin countries (Côte d’Ivoire and Ghana) participate in the African Process. Implemented through a GEF Medium Sized Project by UNEP, the African Process has developed a series of concrete projects that effectively address problems identified as having adverse impacts on the sustainable development of the marine and coastal environment in sub-Saharan Africa. This TDA and the ensuing Strategic Action Programme draw upon the interventions developed under these two programs.
Bilateral cooperation also exists among the riparian countries for mitigating some environmental issues and problems. Such cooperation efforts include the Burkina Faso–Ghana Joint Committee for managing the water resources of the Volta Basin; Burkina Faso–Côte d’Ivoire Committee for the development of programmes for integrated
123

management of water and cooperation in matters of the environment and forest, etc. Table 4.7-1 provides details of some of the existing bilateral cooperation efforts.
Table 64: Bilateral Cooperation among Riparian CountriesCountries Areas of CooperationBurkina Faso - Côte d’Ivoire Demarcation of borders
Cooperation in matters of the environment and forestHarmonization of geological cartography of border zonesDevelopment of programmes of integrated management of water resourcesTranshumance and sanitation issues
Burkina Faso - Ghana Finalization of border demarcationFight against epidemicsPipeline projectCreation of joint commission on the management of water in the Volta BasinThe dam project of Noumbiel
Burkina Faso - Benin Rehabilitation of transnational highwaysTranshumance and sanitary issuesPoaching
Burkina Faso - Togo Transhumance and sanitary issuesDemarcation of tripartite boundaryExchange of experience in matters of soil and water
Burkina Faso - Mali Fight against bushfiresProtection of elephants of Gourma and the management of their movement Fight against desertificationRoads
Regional institutions, such as the Economic Community of West African States (ECOWAS) and the Economic and Monetary Union of West Africa (UEMOA), all have within their purview the promotion of the integrated management of the natural resources of the region for social and economic development. At the moment, though, a coordinated framework for holistic management of the natural resources (water and land resources) and the ecosystem of the Volta Basin for sustainable development does not exist.
International CooperationThe riparian countries are also party to a number of international agreements that are relevant to the protection of the environment in the Volta River Basin. All six of the Volta countries are parties to the conventions listed in the table on the next page (Table 4.7-2). Additionally, Côte d’Ivoire, Ghana and Togo are parties to Tropical Timber Agreement 83 and Tropical Timber Agreement 94. Benin, Mali, and Togo are parties to the Convention on Conservation of Migratory Species. Finally, all of the riparian countries except Togo and Ghana are parties to the Basel Convention on Hazardous Waste. None of the countries, however, is party to the Convention on Environmental Impact Assessment in a Transboundary Context (Espoo Convention).
124

Table 65: Dates of Ratification of Major International Environmental ConventionsCBD Ramsar Biological
DiversityClimateChange
MontrealProtocol
CITES World Heritage
Desertification
Benin 30/06/94 24/05/00** 30/06/94 01/07/93* 28/02/84* 14/06/82 29/08/96Burkina Faso
02/09/93 27/10/90** 02/09/93 20/07/89 13/10/89* 02/04/87 26/01/96
Côte d’Ivoire
29/11/94 27/06/96** 29/11/94 05/04/93* 21/11/94* 09/01/81 04/03/97
Ghana 29/08/94 22/06/88** 06/09/95 24/07/89 14/11/75 04/07/75 27/12/96Mali 29/03/95 25/09/87** 28/12/94 28/10/94* 18/07/94* 05/04/77*** 31/10/95Togo 04/10/94* 04/11/95** 08/03/95 25/02/91 23/10/78 15/04/98*** 04/10/95***
* accession** entry into force*** acceptance
Surface Water development and use Throughout the Volta River Basin, dams and reservoirs have been created in order to mobilize water for agricultural, industrial, and electricity-generating purposes. The number of large and small dams continues to expand as population pressure grows. Increasing use of water and probably decreasing precipitation in the region threaten the continued sustainable management of the waters in the basin. Figure 1 shows the location of dams in the Volta Basin.
Several large dams have been constructed throughout the Volta River Basin with the primary purpose of generating electricity. The damming of the Volta River at Akosombo has created one of the largest man-made lakes in the world, covering an area of approximately 8500 km2. A smaller and shallower impoundment, the Kpong Headpond, covering an area of roughly 38 km2 with a storage capacity of 2000 x 106m3, was completed in 1981 when another hydroelectric dam was constructed at Kpong, 20 km downstream of Akosombo.
Benin has a hydroelectric power station on the Oti River with a storage capacity of 350 million m3 and the capacity to produce 15 MW. Additionally, a hydroelectric power station is planned at Pouya (Natitingou) on the Yéripao.
In recent decades there has been a great push in Burkina Faso to expand the number of dams in the Volta River Basin to meet the country’s need and demand for fresh water. As a result, there are now estimated between 600 and 1400 dams and lakes with a total storage capacity of 4.7 billion m3 and about 10,484 wells of which 8020 are in good functioning well. The volume stored annually in these reservoirs is about 2,490 billion m3. With regard to hydro-power 13 locations have been identified in the country and 10 are located within the Volta Basin. A total of 125.9 GWH/yr is expected to be generated from these hydro-power stations. A recent survey by DIRH indicates that several planned irrigation projects covering at total area of 1045 ha will require about 65.3 million m3.
There is not a reliable set of data on water demand and use prior to 2001, in Burkina Faso. Water demand for various usages has been estimated in 2001 by DGH when
125

formulating the Burkina IWRM programme. For domestic water use the following parameters have been used:
- Ouagadougou: 65l /day/pers.- Bobo-Dioulasso: 50 l/day/pers.- Urban area: 40 l/day/pers- Semi-urban area: 30 l/day/pers- Rural area : 20 l/day/pers
The total demand for domestic water in Burkina Faso is estimated at 103,500,000 m3/yr; 37,000,000 m3 /yr in urban areas, 2,500,000 m3/yr in semi-urban areas et 64,000,000 m3/yr in rural areas.
Water demand for agriculture was estimated using the following parameters:
- large irrigation schemes (double cropping with rice): 20,000 m3/ha/yr- small irrigation schemes (double cropping rice and vegetables): 15.000
m3/ha/yr- developed inland valley (supplementary irrigation) 5500 m3/ha/yr- Vegetable cropping: 8000 m3/ha/yr
Total estimated water demand for irrigation in Burkina: 323,000,000 m3/yr
Table 66: Water demand during year 2000 (km3)
Volta Basin inBurkina
Domestic water demand irrigation livestock Industrial and
mines Hydropower
Mouhoun 34,89 133,17 21,60 1,31 0Nakanbé 47,93 69,68 24,80 1,31 2 000
Total 82,82 202,85 46,40 2,62 2 000Source : Programme GIRE/OTEG
Table 67: Projected water demand in Burkina Faso (km3) years 1990 2000 2010 2020 2025
Domestic and Industrial water 66,6 85,4 105,6 132,3 149,0Irrigation 43,1 202,9 383,7 554,0 639,1livestock 37,2 46,4 60,8 77,8 87,9TOTAL 146,9 334,7 550,1 764,1 876Source : Programme GIRE/OTEG
Table 68 : Large dams in the Volta Basin of Burkina Faso
Basin area(km2)
Storage capacity(km3)
Lake surface (km2)
Annual inflow
Evaporation (mm/year)
10 mm Evaporation
(km3)
126

Bagré 34 000 1 700 255 946 1900-3000 2,55Kompienga 5 800 2 050 210 631 1900-3000 2,10Sourou 11 000 360 400 1900-3000 4,00Ziga 20 800 200 72 315 1900-3000 0,72
NAKANBE Basin 82 000 391 57 791 2 444 1900-3000 578MOUHOUN Basin 91 000 470 24 685 2 640 1900-3000 247
VOLTA Basin 173 000 861 82 476 5 084 825
Akossombo 398 390 149 000 8 500 36 900 1600-1800 85
Cote d’Ivoire does not have any major dams in the Volta Basin since their basin is small and is on the border with Ghana. The following minor dams are located in Cote d’Ivoire.
Table 69: Information on Dams in the Volta Basin of Cote d’IvoireName of the Dam
Year Manager North West Use Surface of the Basin (Km2)
Height of the Dike (m)
Storage Capacity (1000 m3)
Sorobango 1994 Sodepra 8o09 2o43 Livestock 2.50 4.75 30Kamala 1994 Sodepra 8o24 2o44 Livestock 3.00 5.00 36Yerekaye 1994 Sodepra 8o21 2o49 Livestock 7.00 4.50 64Kiendi 1994 Sodepra 8o11 2o42 Livestock 6.00 5.00 73Poukoube 1994 Sodepra 8o23 2o42 Livestock 6.00 5.00 30Tambi 1994 Sodepra 8o13 2o35 Livestock 6.00 4.50 37Borombire 1989 Sodepra 8o44 3o08 Livestock 4.00 4.25 73Imbie 1988 Sodepra 9o13 2o54 Livestock 5.50 3.90 73Lankara 1988 Sodepra 9o11 3o02 Livestock 5.00 4.25 73Niandeque 2 Sodepra 9o13 2o54 Livestock 5.00 73Syaledouo 1988 Sodepra 9o03 3o01 Livestock 4.50 4.25 73Tidio 1980 Prive 9o16 2o57 Livestock 4.50 73Angai 1988 Sodepra 9o35 3o17 Livestock 4.50 4.25 73Bikodidouo 1983 Sodepra 9o34 3o04 Livestock 6.00 4.25 73Bouko 1990 Sodepra 9o28 3o13 Livestock 4.00 4.20 73Bouna 1979 Sodepra 9o17 2o58 Livestock 6.00 4.00 73Bromakote 1988 Sodepra 9o21 3o03 Livestock 9.50 4.25 73Danoa 1990 Sodepra 9o41 3o16 Livestock 7.00 4.25 73Gnonsiera 1990 Sodepra 9o37 3o04 Livestock 5.00 4.05 73Kalamon 1988 Sodepra 9o48 3o10 Livestock 7.50 4.25 73Kodo 1980 Sodepra 9o41 3o18 Livestock 6.00 4.00 73Kpanzarani 1988 Sodepra 9o25 3o05 Livestock 5.00 4.00 73Kpoladouo 1988 Sodepra 9o30 3o19 Livestock 5.00 4.25 73Nambelessi 1988 Sodepra 9o32 3o18 Livestock 5.00 4.20 73Niamoin 1982 Sodepra 9o37 3o27 Livestock 7.00 4.25 73Niadegue 1 1982 Sodepra 9o16 2o54 Livestock 6.00 4.25 73Peko 1983 Sodepra 9o31 3o02 Livestock 5.50 4.25 73Piri 1991 Sodepra 9o29 3o11 Livestock 5.00 73Sepedouo 1982 Sodepra 9o40 3o24 Livestock 5.00 3.50 73Sipe Sodepra 9o40 3o24 Livestock 73Sipirition 1983 Sodepra 9o25 2o54 Livestock 5.50 4.25 73Tchassondouo 1988 Sodepra 9o35 3o25 Livestock 5.50 4.25 73Timperdouo 1990 Sodepra 9o32 3o11 Livestock 10.00 4.25 73Didre Douagre 1990 Sodepra 9o43 3o21 Livestock 5.00 4.25 73Minichio 1990 Sodepra 9o46 3o29 Livestock 6.00 3.90 73
127

Nankele 1990 Sodepra 9o52 3o23 Livestock 9.00 4.25 73Nikindjoka 1990 Sodepra 9o43 3o17 Livestock 4.00 4.20 73Peon 1990 Sodepra 9o45 3o24 Livestock 4.00 4.00 73Tinkalamon Sodepra 9o49 3o38 Livestock 5.50 4.20 73Yalo 1982 Sodepra 9o48 3o24 Livestock 7.00 4.25 73Boromeredouo 1989 Sodepra 9o59 3o08 Livestock 4.00 4.25 73Yonodouo 9o59 2o57 Livestock 5.60 4.25 73Barriera 1982 Sodepra 9o53 3o27 Livestock 6.00 4.25 73
Total 2,971
In the Volta Basin in Mali, Pont-barrage of Baye is the only significant dam. Togo has the following dams in the Volta Basin.
Table70: Information on Dams in the Volta Basin of TogoDam Volume (m3) UsesDalwak 10,000,000 Domestic water supply, IrrigationTantigon 762,400 Agriculture, animal husbandry, domestic water supplyNamiete 600,000 Domestic water supply, animal husbandry, market gardenMagna 500,000 Domestic water supply, animal husbandry, market gardenKozah 5,000,000 Domestic water supply, animal husbandry
Although there are believed to be hundreds of dams in the Volta River Basin, the data on the locations and size of these waterworks are inadequate. Thus, it is difficult to quantify the effects of the dams on the Volta River Basin.
128

Figure 26: Location of Dams in the Volta Basin
129

Water use: The basin demand for water is an aggregation of the demands from the riparian countries over a period of time. The country demand, in turn, is dependent on the types of economic activities undertaken, as well as the level of the country’s development as more advanced economies will demand more water than less advanced ones. Population is also a factor in determining the quantity of water needed for domestic use. Projections for water demand are based on growth of population and the activities envisaged to be carried out under the country’s development plans.
Table 71 shows the water demand for domestic and industrial activities. These are projected to increase due to the rapid population increase and envisaged industrial expansion, both of which will require an increased use of water. The domestic/industrial water demand for Benin was, however, very high and may be due to planned economic development activities.
Table 71: Domestic/Industrial Water Demand of the Volta River Basin (x 106m3)Country 1990 2000 2010 2020 2025Benin 56 196 336 448Burkina Faso 67 85 106 132 149Côte d’Ivoire - 4 5 12 14Ghana 82 138 192 272 284Mali 5 9 13 16 18Togo 51 68 92 123 145
Table 72 presents water demand data for irrigation in the basin. In Ghana and Benin, the increases expected are quite high. The percentage increases of year 2020 demand over year 2000 are 538% and 706% for Ghana and Benin, respectively.
Table 72: Irrigation Water Demand of the Volta River Basin (x 106m3)Country 1990 2000 2010 2020 2025Benin 152 548 1,225 1,600Burkina Faso 43 203 384 554 639Côte d’Ivoire - 19 57 166 276Ghana 75 565 1,871 3,605 3,733Mali 126 180 219 291 311Togo 43 50 91 133 171
The high projections of water demand for irrigation in the basin come from the fact that rain-fed agriculture is becoming more precarious and less reliable under climate change and the ensuing variable precipitation. Further, the need to produce adequate food to feed the rising populations is a major concern of the countries in the sub-region.
Table 73 presents the information on water demand for livestock production. It is observed again that the demand for water needed for livestock will increase by several times by the year 2025 to meet the protein requirements of the basin population and for export.
Table 73: Water Demand for Livestock of the Volta River Basin (x 106 m3)Country 1990 2000 2010 2020 2025Benin 40 94 133 175
130

Burkina Faso 37 46 61 78 88Cote d’Ivoire - 1 2 3 3Ghana 18 26 41 63 67Mali 4 34 74 123 142Togo 15 19 22 30 36
The information provided in Table 74 for the total water demand shows drastic increases of 62% to 1221% in year 2020 over year 2000 water demands. The sharp increases are, however, largely driven by the high irrigation water demand projected for the future.
Table 74: Total Consumptive Water Demand of the Volta River Basin (x 106 m3)Country 1990 2000 2010 2020 2025 % Income
2020/2000Benin - 249 838 1,694 2,223 583Burkina Faso 147 335 550 764 876 128Cote d’Ivoire - 24 64 181 293 1,221Ghana 175 729 2,104 3,940 4,084 424Mali 136 223 306 430 471 93Togo 109 137 205 286 351 62
While significantly higher demands have been projected for the near future, current demands are not now being met in most countries. For example, the water resource supply for the Volta Basin in Ghana for 2000 was 245 x 106m3 (WARM, 1998). This implies that for a demand of about 729 x 106m3, only 34% was met. The problem of not being able to meet the consumptive water demand depends, to a large extent, upon inadequate infrastructure of water supply systems. This means that there are not sufficient financial resources to store, treat, and distribute water.
The problem of not being able to meet the consumptive water demand depends, to a large extent, upon inadequate infrastructure of water supply systems. There are insufficient financial resources to store, treat, and distribute water.
Seasonal variations also hinder the ability to supply water in a timely fashion. For example, in the upper reaches of the catchment, such as in Mali and some sections of Burkina Faso, river flows are not year round and some wells and groundwater boreholes go dry during certain months. Thus, water availability becomes a problem.
The overuse and misuse of water resources in the region also decreases the availability of water. In the water resources sector, an aspect of over-exploitation in the basin occurs through the excessive pumping of groundwater without due regard to the recharge characteristics of the aquifer system. This situation leads to lack of water during the dry season when water availability is scarce as in the drier parts of the basin in or near the Sahel Zone. Groundwater over-exploitation can lead to saltwater intrusion in the southern parts of the basin near the Gulf of Guinea Coast.
The inefficient use of water resources in the region has exacerbated the problem of scarcity. For example, flooding is the most common irrigation practice in the basin. This approach is very inefficient as it results in water losses through evaporation and deep
131

seepage. More efficient types, such as sprinklers and drip irrigation, may have to be introduced to cut the water use.
Water supply systems for domestic and industrial uses have large transmission losses due to leakages, which could be as high as 50%. The expansion of water supply systems for domestic/industrial use does not always match the water demands. The limitation in expansion is due to unavailable financial resources.
While each of the countries forecasts increased demand for water over the next decades, the trends in water use pattern among some of the riparian countries are quite different. For example, there has been a rapid expansion of irrigation in the last 15 years in Burkina Faso of about 934 %, while Ghana only experienced an expansion of 95m % (Andreini et al., 2002). Ghana, on the other hand, plans to expand its hydropower generation by constructing the Bui Dam. Thus Burkina Faso, an upstream, agriculturally-oriented country hopes to develop the country’s irrigation potential while Ghana, downstream, aims to develop use of hydropower. The trends in water use patterns can potentially generate conflict if the resources are not managed in an integrated fashion.
Although there is little data on the problem of water quality degradation, it has been identified as an important issue in the basin. Some of the causes of water quality degradation include poor farming practices, improper land use, intensive grazing activities of cattle and sheep, and bushfires. Improper application of fertilizers to agricultural lands promotes leaching into the waterbodies. These chemicals are transferred downstream into other countries without any possible restriction. Sediment transport across the riparian countries is the major source of degradation of shared water resources.
Discharge from untreated industrial effluents is not significantly present in the basin due to limited industrial activities, but some untreated sewage is discharged into the waters. Additionally, humans and animals defecating and bathing in rivers and water sources add to the degradation of water quality. Another significant cause of water quality degradation is the introduction of urban waste, particularly from run-off from inland port communities and urban settlements located near banks of the rivers and reservoirs.
Surface Water and health issues:Closely related to surface water availability, access and usage is people’s health. According to statistical analysis of GLSS data, the major health problems of communities in the Volta basin are malaria, measles, hernia and river blindness. Of these diseases, malaria and river blindness are directly related to water. The incidence of malaria and river blindness in the sample is about 88 percent and 24 percent of the households, respectively. This makes malaria the most important water-related disease in the basin. Data analysis on malaria transmission intensity in the Nouna District in Burkina Faso points to Anopheles gambiae s. l. and Anopheles funestus as the principal vectors throughout the year, with high transmission intensities (sporozoite rates 5-15%) documented over the main transmission season (June until December), but very low transmission intensity (sporozoite rates <1%) during the dry and hot season (February
132

until May). There are considerable variations in malaria transmission intensity by village and season.
Groundwater development and use
MaliGroundwater in most regions in Mali is put to multi-purpose use including domestic water supply, irrigation and watering of cattle. The distribution among types of use varies from one region to another, as the following table shows in Figure 2, but in most cases domestic water supply dominated other uses.
About 55% of the population of the capital city of Bamako uses water from aquifer resources. In the rural areas, groundwater is either the only source or the main source of portable water supply to the people. This source is either in the form of traditional wells (village sump wells, usually shallow with depth between 2 and 10 m), numbering an estimated 800,000 and not necessarily meeting standards e.g. sumps, pools, and other water-holes are often utilized or Modern water sources e.g. drilled wells with pumps, cistern wells, or other modern wells, estimated at 3,000 modern wells and nearly 9,000 pumps.
A 1992 survey of 384 rural centers showed that: three have a water supply; 211 are served by modern wells and sumps; 24 are equipped with solar pumps with mini-networks; and 146 (36 percent) are without modern wells. According to a WaterAid country report for Mali, the satisfaction rate for rural area "potable water" is about 49 percent and that access to potable water for most of the Malian population, especially in rural areas, will require a greater utilization of groundwater particularly in the desert and sub-desert regions (Mopti, Timbuctu, and Gao) of the country Telmo (2002) determined that 48% of the households in Gouansolo had access to improved water supplies from groundwater aquifers (i.e., borehole pumps).
Groundwater withdrawn for industrial use as a percentage of overall abstracted groundwater is 1; and per capita volume of water used in industrial production is 1 m3/p/year (CIA, 2004)
133

0
1500
3000
4500
6000
7500
9000
10500
Quantity (1000) cm
3
KayesKoulikoroSikasso
SeguMoptiTimbuctu
Gao
Region
Groundwater use by Sectors in 7 Regions (1989)
DomesticCattle
Irrigation
Figure 27: Regional distribution of groundwater use among sectorsSource: After Mali National Office of Planning, National Direction Plan, 1991
Burkina Faso
The groundwater resource in Burkina Faso is used mainly for domestic water supply particularly in smaller towns and rural areas. Pipe borne systems based on groundwater are in use in 48 small towns as well as in the city of Bobo Diolasso (500 000 inhabitants), where drinking water supply relies entirely on groundwater, and in the capital Ouagadougou (> 1 Million inhabitants), where groundwater provides 15 % of the drinking water. This small percentage is however not unimportant as it represents a relatively reliable fresh water reserve in dry seasons (Bracken and Mang, 2002). While mechanized groundwater production for urban water supply has developed continuously since the 1980s in Burkina Faso, this country, like the other countries of the Sahel, suffers from a lack of surface water because of geographical, geological and climatic conditions. This means that the country is often obliged to make use of groundwater to supply small towns, villages and the countryside with potable water.
In rural parts of the country, only 0.01 percent of Burkinabé have access to water through private taps; only two percent through public standpipes; 46.1 percent through public wells, 41.2 percent through boreholes, and six percent through sources like rivers, streams, and ponds. Only an urban pittance of 25 percent of city-dwelling Burkinabé access water through private taps, 47.7 percent access through public standpipes, 20.9 percent access through wells or boreholes, and 5.7 percent buy their water from vendors.
There is hardly any data on the amount of groundwater being used for agricultural and industrial purposes in Burkina Faso, though it is known that a limited amount from shallow aquifers is used for irrigation particularly in market gardening and also for watering livestock.
134

Ghana
In Ghana, groundwater is mostly used in the rural areas and mainly for drinking and other domestic purposes; the use of groundwater for livestock and poultry watering and for irrigation of crops is limited. Generally, groundwater use is determined by the quantity available, its quality and the unavailability of other alternatives.
Due to the low yield of boreholes and the relatively good quality of groundwater compared to surface sources, boreholes in almost all the ten regions of Ghana with the exception of the Greater Accra region are exclusively used to supply water for drinking and other domestic purposes. Presently, about 52% of the rural inhabitants in Ghana have access to potable water mainly from groundwater sources (Gyau-Boakye and Dapaah-Siakwan, 1999). Since 56% of the 19 million Ghanaian population lives in the rural areas (Ghana Statistical Services, 2002), it means that about 30% of Ghanaians (in the rural areas) have access to groundwater as portable water source. This figure could be higher if those using groundwater for drinking purposes in urban areas are considered. Table 75 gives an indication of the level of regional dependency on groundwater resources for domestic use.
Table 75: Dependency by region on groundwater supply for domestic use (1984)Region Regional
PopulationSource of groundwater supply by population Groundwater
Dependency (%)Borehole Well Dug-out Total
Western 1,157,807 196,582 134,661 17,343 348,586 30.1Central 1,142,335 146,800 129,502 31,358 207,660 18.2Greater Accra 1,431,099 9,135 65,063 21,847 96,045 6.7Eastern 1,680,890 248,232 224,463 80,596 553,291 32.9Volta 1,211,907 130,609 232,033 36,110 398,752 32.9Ashanti 2,090100 381,192 136,332 30,489 548,013 26.2Brong Ahafo 1,206,608 103,458 146,439 57,187 307,084 25.5Northern 1,164,583 23,203 207,009 100,613 330,825 28.4Upper West 438,008 298,482 7,421 20,272 326,175 74.5Upper East 772,744 491,177 86,982 15,206 593,365 76.8
Source: After Gyau-Boakye and Dapaah-Siakwan (1999)
III.2 Agrarian and environmental transformations
A. Technical change (agriculture, water mobilization…
1. AGRICULTURE
1.1 Agricultural changes in the pre-colonial era of GhanaEmerging from the prehistoric era, men generally ceased to depend, as they had done, on wild fruits and root crops they had gathered and wild animals they had hunted. Instead they began to cultivate crops on farms. Ghana shared this experience. There is no exact knowledge about farming in Ghana in very early days. However, archaeology, botany, and the study of languages have provided some knowledge about the crops people cultivated and the methods farmers used. Ghana had three main different geographical
135

zones: the savannah in the northern zone, the sandy swampy mangrove lands on the coastal belt, and in between these two zones, the forest belt. Some crops required much rainfall, others need ample sunshine, and other grow in zones with a combination of these climatic conditions. The crops grown in the above three zones has, until recently, depended very much upon the nature of the land and other geographical conditions, including the amount and duration of the annual rainfall.
The crops, which were cultivated in Ghana before the advent of the Europeans, were not as varied as they became later, following the introduction into the country of new crops by the white men. These foodstuffs include some species of cereals like millet (or guinea corn), yam, pepper, beans and other vegetables. The Portuguese records also indicated that a species of rice was the staple crop in the country lying between the Gambia and the Cacheu River. Although there are no existing records to indicate that this cereal was in cultivation in Ghana, it was not unlikely that the country grew this crop at the time of the arrival of the white men. The surplus of their farms was sold to the growing populations around the European forts, and to the Europeans both for their own consumption and for replenishing the provisions of the vessels passing off West Africa on their way to the Far East.
When the early Europeans became firmly established on the Guinea Coast, they introduced tropical crops from other lands in the New World and in the Far East. Some of the important foreign crops introduced into Ghana and other parts of the Guinea Coast were cassava, pineapple, orange, tangerines, avocado pear, guava, sugar cane and coconut. These crops were introduced to ensure increased regular supplies of these imported crops for the consumption of the European merchants and for the crews en rout to the East. Later, when they were widely cultivated, the new crops introduced a diversified diet for the people.
Before mechanized farming was introduced in the country in more recent years, the people of Ghana, as happened in most other countries at the time, employed the method of shifting cultivation. The implements used were mainly the cutlass and the hoe. In the absence of labour-saving devices, farming from planting and sowing to the harvesting, was all done by physical human labour. In consequence, the size of farms was generally small. In deed for a very long time farmers mostly engaged in what is called subsistence cultivation, only growing enough for their own domestic needs, with very little over for the market
With the increasing concentration of population in the growing towns, many city dwellers cut themselves off from the land. These people depended on the surplus farm products of the countryside. To meet the demand of the market, farmers expanded their farms and increased their yields and wealth. Following the abolition of the Atlantic slave trade, more and more emphasis was placed on commercial agriculture in Ghana and other parts of West Africa. In Europe the transformation of industrial processes called the Industrial Revolution created a great demand not only for West African palm oil, but also for other tropical crops, such as raw cotton, rubber, etc. From the second half of the nineteenth century onwards, many farmers changed to plantation farming, producing cocoa and coffee, which steadily became the live-wire of the economy of Ghana.
136

1. Agricultural changes in the Volta Basin of Ghana
Long before Akosombo was constructed, the fertile banks along the Volta River were some of Ghana’s richest agricultural land. Archeological finds show that the Volta Basin was once well populated (comments from Kaplan et. al., 1907). Much of the natural vegetation was burned down for agriculture over a period of more than a thousand years, which led to the eventual drying and erosion of the land. However, the floodplains along the Volta River provided a constant source of fertile agricultural land for local farmers.
Before the Akosombo Dam, local farming along the Volta was structured around the rise and fall of the river. The damming put an end to natural cycles, which deposited nutrient-laden silts along the flood plains. The river ecosystem was transformed into a lake ecosystem. Damming led to a drastic curtailment in subsistence agricultural production and animal grazing.
An important development in agriculture associated with the Akosombo Lake is farming on the land exposed by fluctuation in the lake level. This development has started on the initiative of the local lakeside dwellers, but research work has been concerned mainly with the soils and cropping patterns. The annual fluctuation of the lake varies between 1.8 and 4.3m. It has been estimated that, at 3.0 m some 80.940 hectares would be exposed around the 4,828 km of the lake boundary. The soils in the drawdown area are mostly sandy and well drained. The eastern and southern banks are steep and expose only a narrow area. Wider stretches occur on the northern bank where population density is low.
The northern bank of the Afram and the western bank of the main lake also expose moderately wide areas. According to various sources, about two-third of the periodically flooded land areas are suitable for agriculture use. In 1971, about 10-15% of these areas were under cultivation. In 1979-1980, conflicts with land use started in and around the major centres between the local population and fishermen as a result of the shortage of land in the shore area.
At present only small portions of the drawdown area, those adjacent to the areas with high density of population are cropped, mainly with vegetables such as tomatoes, okra, peppers, garden eggs, and maize. Some problems encountered include drought conditions and insects.
Unfortunately, demands for electricity could not always be synchronized with the traditional flooding seasons. Furthermore, the reduced flow into the Gulf of Guinea resulted in saltwater intrusion at the Volta River delta and estuary. Salt water destroyed clam beds and lowered drinking water quality. Many of the stream and clam fishermen downstream moved north to the lake, where they hoped to restore their careers.
The Volta River Project also included plans for an irrigation network in the Afram Plains, which was considered Ghana’s agricultural breadbasket. However, these plans were pushed down on the agenda for various economic, social, and political reasons. The possibility of using water from the lake for small, draw-down, lakeside irrigation schemes
137

was further curtailed by the refusal of the VRA to release water from the lake and thus prejudice the full production of power for the smelter and other consumers.
The Sahel drought did little to improve the prospects of such irrigation schemes. The sudden change in government in 1966 led to budget restructuring during the first year of Akosombo’s operation, which affected many of the original project initiatives, including the irrigation network and the resettlement scheme. Teaching new farming techniques was expensive, and there was no guarantee that the traditional farmers would embrace them. In 1998, only 2,000 hectares of irrigated land existed in Ghana.
People who lived in flooding area were mostly subsistence farmers although some of them grew cocoa (2400 ha of cocoa were lost under the lake) and some were river fishermen. In general their standard of living was low. The typical farmer had 2.5 to 4 hectares of land under his control and 3 or 4 plots which he would use in turn in successive year. Only about 6% of the land area covered by the lake was used productively. The rest was unsuitable, unoccupied.
The main agricultural objective of the VRP (Volta River Project) was to improve the agricultural production systems to enable people to move from subsistence to a cash economy. To maintain the fertility of the soils, they choose an intensive mechanising agriculture. The aim was to specialized agriculture as follows:
- Arable farms >4.9 ha mechanised;- Tree crops 2 ha < surface < 6 ha was to be provided;- Intensive livestock 1.2 ha < surface was to be provided; - Pastoral 12.1 ha < surface was to be provided.
The VRA (Volta Resettlement Authority) had also hoped to introduce new farming methods. VRA controlled the allocation of seeds and fertilizers and the bulk buying of the products. They wanted to clean 41 600 ha for the agriculture to provide 4.8 ha for each adult male settler, whereas 51200 hectares were used productively in the flooded area. Mechanised cultivation was to be used across several plots, to give the small farmers the advantages of modern farming methods. The farmers were responsible for weeding and harvesting their strips of field with the costs of the use of mechanised equipment being shared on an acreage basis. The VRA was to own the tractors, distribute and sell fertilizers and buy a significant quantity of the agricultural produce.
It was expected that the average farmer would have an annual income of £(G) 350. Moreover, it was expected delivering irrigation water by gravity from the Volta Lake and by pumping from the Volta River, to irrigate about 180,000 hectares. The total area of the Accra plains that is irrigable and suitable for mechanized agriculture was estimated at 178,000 ha out of 335,000 ha of land; and the economic potential has been found very high. The total investment required for the irrigation project was by the time about £ (G) 28 millions in 10 years.
Annual fluctuation in the level of the lake varies between 1.8 and 4.3 m and as such it has was estimated that at 3m some 80,940 ha of fertile would be exposed around the 4828 km of the lake boundary could be farmed.
138

Irrigation opportunity
The Volta Lake represents a good opportunity for developing irrigation schemes in the Volta basin. According to many, about 178, 068 hectares out of 335,092 hectares of the Accra Plains could be irrigated by gravity from the Volta Lake and by pumping from the Volta River. A scheme had been constructed including the use of mechanised agriculture methods, fertilizers and pesticides. The types and properties of the soils were determined, and the socio-economics of the area found to be very high. Since the population of the Accra-Tema commercial region was growing very fast, the demand for food was also growing rapidly. But the scheme appeared inappropriate and too expensive (£28 million). No moves have been made to implement it, so that the idea of irrigating the Accra Plains remains in abeyance.
VLR&DP successfully carried out drawdown demonstration farming complemented with sprinkler irrigation water from the Lake by use of small pumps at VRA’s resettlement township of Ampem. People living in the whole of the Afram arm of the Volta Lake have broadly adopted this method of farming. The Afram area has thus become important for the production of tomatoes and other short maturing crops during the dry months from November to about May.
Kpong Farms Limited has been created by the VRA in order to promote leadership in agricultural systems, irrigation practices and food processing technologies. The objective of the authority was mainly to prove that this venture (large scale irrigation) is economically viable and can be adopted to cover Accra Plains. The project which is using water from the Kpong headpond was initiated with the construction of a mainly gravity irrigated scheme covering an area of approximately 100 ha for the production of beans, rice, etc.
It has now developed into a full integrated agro-industry spanning rice, livestock and pasture production as well as feed milling, abattoir services and meat processing. VRA hopes that the positive demonstration at the drawdown areas and the Kpong Farms Limited will encourage private entrepreneurs to move into irrigation farming. Government has taken the initial step to irrigate the Asutuare lands for farmers using waters from the Kpong headpond.
II. WATER MOBILIZATION
Since the beginning of the twentieth century, water development projects have been planned to make use of the water and other natural resources in the basin. Thus, the idea of damming the Volta River began in early 1900s with the conception of the Volta River Project (VRP) and ended with the creation of Volta River Authority (VRA) in charge of the creation and management of the Akosombo dam and later, the Kpong dam downstream.
The Akosombo dam is by fare the most significant structure built in the basin and the Volta Lake is the largest man-made lake in the World. It is of strategic importance for the
139

economy of Ghana. It generates 80% of the power produced in the country. The primary purpose of the project was to supply cheap electricity to smelt aluminium and the secondary one, the development of the country. Construction of the Volta Lake led to the resettlement of about 80,000 people from several hundred villages to fifty newly built townships (more than 1% of Ghana’s population at the time). In addition to the resettlement of the river communities, damming affected local health, agriculture, fishing, and navigation. In other riparian countries of the basin, small and larges dams have been built by governments, NGOs and local people after the severe droughts that occurred in the 1970s and 1980s to secure food production. In the Nakambe sub-basin (Burkina Faso) alone more that 400 dams have been built most of them during that period. More recently power generating dams have also been built in some of the Volta main tributaries Bagre and Kompienga (Burkina) with generating capacities of 41.5 GWH and 31.0 GWH respectively and on the Oti River, at the border between Togo and Benin within a power generating capacity of 35GWH
*Animal production in the Volta Basin of Ghana
1. FisheriesAfter the formation of the lake, fishery has become an important branch of the economy in terms of its employment and revenue potential. Contrary to expectations, the fish catch very rapidly exceed 20,000 metric tons. A detailed study carried out in 1969-1970 located over 950 fishing villages, mostly newly established, along the shore of the lake. From these villages, some 12500 fishing canoes and approximately 20,000 fishermen were operating, and the total population of fishing communities was estimated as approximately 59,000 people in 1971. This number was estimated to be about 87,000 in 1975.
In the period from May 1969 to April 1970 a statistical survey of the fish catch of these fishermen gave a point estimate of 61,000 metric tons fresh weight equivalent. The catch settled down to a level of 38,000 tonnes in the following year, when the lake becomes ecologically more stable. Before the construction of the dam, the annual take from the Volta Basin was of 10,000 tonnes. There had been 2,000 fishermen operating in the basin but now there are estimated at 12,000 working on the lake. They and their families make up fishing communities, numbering about 59,000 in 1971, living in approximately 1,275 settlements around the lake (1,479 in 1975). 87 % of these persons were migrants and were already familiar with the techniques of fishing.
There were attracted by the excellent fishing grounds in the lake but also by the changes that occurred in the lower reaches of the river following the construction of the dam. 60 % of the households migrated from the new settlements and 8 % of them derived their income mainly from fishing in 1971. About 59.8 % of the settlements were located in the Southern area of the lake (46.1 % of the total shoreline), and only 55.4 % in 1975 because of the saturation of the free lands.
140

The sell price was about ¢0.25/kilogram (that is the fishermen received) so that the value of a year’s catches is about ¢9.5 million (the total revenue obtained from Akosombo-produced electricity is of ¢28 million). The total marine catch was estimated as 119000 tonnes in 1969. The Ghana’s total consumption of fish in 1969 was 197, 000 tonnes (18,700 tonnes imported at a cost of ¢5.8 million). The catch from the Volta Lake therefore satisfied approximately 20 % of the country’s demand for fish. Most of the fishermen working in the Volta Lake operated elsewhere in Ghana before the Lake was created. A large proportion of them were engaged in clam and creek fishing on the lower Volta (Article 6). The creek fisheries were worth about £65,000 a year and the clam fishing no less than £25,000 a year. At 1955 prices the loss was about ¢160,000 or at 1974 prices about ¢640,000.
About 62 % of the catch is consumed before being marketed and only 2 % ends on the market as fresh fish. The consumers’ centres are not located in the immediate vicinity of the fishing grounds. The yields from the fishery in the Volta Lake cover about 15 % of the annual fish consumption (1974) and 29 % has to be imported. In 1977 the revenue from power produced by Akosombo Dam was ¢33.474 million that is 15 % less than the value of the annual fish production (¢38.719 million).
E. Health and Environmental Changes in the Volta Basin of Ghana
I. HEALTH
There have been serious health issues associated with the Volta Lake, in particular two disease of major incidence: schistomiasis (or bilharziasis) and onchocerciasis (or river blindness.
The dam virtually halted the rate of flow in the Volta River, increasing stagnant water conditions and consequently, creating ideal breeding grounds for carriers of waterborne diseases. Before the Akosombo and Kpong Dams, malaria (from mosquitoes) was not much of a problem along the swift-flowing Volta River, but after it became a stagnant lake, malaria became a greater public health concern in lakeside villages. Likewise, only 1 - 5% of the population suffered from schistosomiasis (a disease transmitted by snails) before the dam was constructed. By 1979, urinary schistosomiasis had grown to become the most prevalent disease in the area, affecting some 75% of lakeside residents (comment from Gitlitz, 1993).
Volta Lake has had significant effects on the public health situation. Bilharzia reached a prevalence of 90% among children in particular localities. The lake has flooded out the riverine forests which constitute a breeding place for a species of tsetse fly. The lake has also wiped out the breeding places of the vector of onchoceriasis. About 60,000 fishermen living mostly in isolated villages around the lake were exposed to riverine and did not have access to health facilities.
Prevailing diseases before the Akosombo Dam Construction
141

Among the many medical problems found in the area to be flooded, were the usual worm infections, particularly round worms, hookworms, yaws, leprosy, tuberculosis, malaria, cerebrospinal meningitis, smallpox and malnutrition and poliomyelitis in children. Before the creation of the Volta Lake, infection rates of Schistosomiasis in the area had been 1 to 5 percent. In the Asukwakwaw area, north of the Akosombo dam, the prevalence of Onchocerciasis could reach 90%.
Post construction period
In 1968, the public health aspect of the Volta River Project was assigned to the UNDP (United Nations Development Program) assisted by VRR&DP of the VRA. It was to research into the public health situation and resettlement of the people displaced by the Volta Lake. Attention was paid particularly to the water-borne diseases (Onchocerciasis, Schistosomiasis, Trypanosomiasis and Malaria). The immediate objective was the control of the major parasitic diseases.
Between 1968 and 1977, much valuable health data were collected. The changing of familiar houses and environment to news villages with core houses and limited room space caused overcrowding and discomfort and created conditions for the spread of communicable diseases such as yaws, measles and smallpox. Lack of adequate farmlands and community life led to economic hardship and starvation and malnutrition of the children.
The resettles, because of their ignorance, apathy and habits, marked indifference to public health problems. The communal latrines provided soon ceased to function due to lack of proper use and maintenance. The pipe borne water systems operated by diesel pumps soon fail, etc. This general low standard of living is usually associated with the parasitic diseases such as malaria, dysentery, typhoid fever, hookworm and other intestinal worm diseases found in the resettlements. Yellow fever and dengue were the most important arthropod-borne viral infections found during the early part of the resettlement program.
Increase in development of aquatic snail, host of Bilharzia (urinary Schistosomiasis) led to a great increase in the prevalence of the disease in many localities around the lake. Transmission occurred in the lake itself. Man is infected with urinary Schistosomiasis from water in which swim larval forms (called cercariae) of the parasite worm. Schistosomiasis is a cumulative and debilitating illness. Surveys in 1964-1977 showed a 90 % prevalence rate in school children in fisher’s population who live close the lake. The problem of Bilharzia in the lake basin must be seen as a disease, which embraces both the lake and the Volta delta. The migratory habits of the fishermen ensure the spread of the disease from endemic areas to other areas.
Onchocerciasis is transmitted from man to man by the bite of the black fly, which breeds in rapidly flowing streams and rivers. When the lake was formed, the major breeding sites north of the Akosombo dam were inundated and eliminated. The construction of the second dam at Kpong eliminated too the breeding sites downstream of Akosombo and therefore stopped the transmission of the disease in the vicinity. However, in the
142

Asukwakwaw area, north of the Akosombo dam, the incidence of Onchocerciasis is still high because the tributaries of the Volta Lake and the seasonal streams continue to support the breeding of the black fly.
The 20-year Onchocerciasis Eradication Programme started in March 1974. The programme was a combined effort of seven West Africa countries (Ghana, Togo, Niger, Burkina-Faso, Benin, Mali and Ivory Coast). It has achieved much success using modern techniques and pesticides. The discovery of Evermectin® for mass treatment, has increased the hope for a total eradication of the disease in affected areas. The benefit to health by the construction of the Akosombo dam in 1965 and the Kpong dam in 1981 is undoubtedly the reduce incidence of Onchocerciasis in the Volta Basin.
The amount spent to combat these diseases is not well known. The health program has been part of the Volta Lake Research and Development Project, initiated in January 1968. This project was built to help develop fisheries on the lake, to research into the use of drawdown area for agriculture, to carry out socio-economic surveys of the resettlement villages and research studies on the public health aspects of the Volta Lake. This project was the result of cooperation between VLR&DP, UNDP/FAO and the VRA/Ghana Government.
What has the effects of these diseases been in terms of lost productivity? Very little literature has been produced on the subject of Onchocerciasis. Moreover, few reliable statistics are available on the prevalence of the disease in Ghana and for many public health specialists, it seems that Akosombo dam has caused no overall change in the number of people affected by Onchocerciasis and that has merely altered its geographical distribution. More work has been done on the subject of Schistosomiasis, both in Ghana and internationally. Several attempts have been made to estimate the cost of Schistosomiasis in terms of loss of productivity. A study in the Philippines (Farooq, 1963) divided the infected people into several categories:
Table 76: Categories of infected people according to Farooq, 1963.
Category Loss of working capacity (%) Proportion (%)1) No manifest symptoms 0 61.52) Mild symptoms, no absence from work 25 223) Moderate symptoms, reduced capacity of work 50 154) Severe symptoms, frequent absence from work 75 1.55) Very severe symptoms, total absence from work 100
It is possible to apply the scheme to the Volta Basin. Taking a low estimate of 100 000 as the number of people living around the Lake Volta, and using the average infection rate of 80% we may deduce that 80,000 people are infected.
Thus,
- 22% (or 17600) have their working capacity reduced by 25%- 15% (or 12000) have their working capacity reduced by 50%- 1.5 (or 1200) have their working capacity reduced by 87.5%
143

Ghana’s GNP per capita in 1975 was $590. The value of lost productivity per year was therefore $590*(0.25*17600 + 0.5*12000 + 0.875*1200) = $6 750 000During the construction of Kpong Dam in the early 1980s, flooding provided some health benefits. The dam was sighted a few kilometers downstream from Kpong town, so that the backwaters would flood the Kpong Rapids. This area was the largest breeding ground for the tsetse fly in Ghana. Sleeping sickness, carried by the tsetse fly, was a major problem to the British colonists, foreigners, and other people who did not have acquired biological defenses. Tsetse flies breed in the dense bush bordering bodies of water, and are most prevalent in the lower part of the Brong Ahafo Region, the Ashanti Region, and parts of the Eastern Region into the Volta Region. Sleeping sickness may linger quietly in a person for many years, causing a loss of energy and reduced immunity to other diseases. Full-blown sleeping sickness leads to quick death.
II. ENVIRONMENTAL CHANGES
The impact of the Volta Lake on the environment has been found to be varied. These include enhanced fishing upstream as well as diminished fishing downstream, opportunities for irrigated farming downstream, proliferation of aquatic weeds upstream and downstream, increase in some water borne diseases such as bilharzia and malaria and reduction and elimination of other diseases such as Onchocerchiasis in some areas; Seismicity, Sediment load changes, Morphological changes and Microclimatic changes. During the pre-impoundment period a host of multi-disciplinary research workers from academic and specialist institutions studied the impact of the reservoir on agriculture, fisheries, public health and on conservation of biodiversity
Some studies showed that mineral resources flooded were mainly limestone, gravel and sand, which were of limited economic value. Initially sedimentation was not found to be a problem; but now due to deforestation on the edges of the reservoir some sedimentation is being observed. Meteorological data available shows that the reservoir suffers a significant loss of water through evaporation, which is balanced by gain from rainfall. No significant climate change has been observed around the reservoir except in the southern Afram area where a micro climatic change has been observed in the form of a relative dryness of the area. The Volta Lake has been found to be low in mineral nutrient except during the flood season when the annual inflows raise the level of mineral nutrients. The arms of the lake as well as the shallow areas, which have more nutrients, have been found to be more productive than the deep open waters.
(i) Deforestation
The activities of people living in uncontrolled human settlements have caused serious deforestation around the lake. It has resulted in intensive erosion leading to siltation and sedimentation, which adversely affected the life span of the Lake. VRA has therefore taken serious measures to avoid eventual silting of the lake. The authority has sponsored two afforestations projects intended to stop erosion around the lake. In the Adjena Gorge, VRA and the Forestry Department, have declared the steep areas bordering the lake as
144

protected lands. VRA has funded another pilot afforestation project in the low slope areas around Yeji in the Brong Ahafo region. The objective of this project is to encourage fisherfolk to plant wood lots and adopt the use of improved stoves, which use less fuel wood for fish smoking. It is hoped that this project will help to restore some 580 hectares of tree cover and reduce the dependency of fuel wood by 60 % in the Yeji area.
(ii) Aquatic weeds
The Volta Lake, like other tropical man made lakes, has been characterised by growth of aquatic weeds. The Volta did not experience that short-lived but sudden explosion of floating weeds, which populated Kariba immediately after impoundment. The weeds, which have occurred, are longer lasting. Among the important ones are Pistia, Vossia spp. Ceratophyllum. Pistia is flood resistant. Vossia spp, which is resistant to wave and wind action, is also resistant to herbicides. It has needle-like hairs, which make it unsuitable neither for grazing nor for manual cutting. It creates a good habitat for fish. Ceratophyllum’s submerged beds house large populations of Bulinus snails the vector of Schistosomiasis. Attempts to control Schistosomiasis by controlling Ceratophyllum, which create a favourable habitat for the vector, has failed. The weeds have also provided favourable habitats for a number of disease vectors, notably the vector of bilharzias and that of yellow fever virus. The aquatic weeds invasions had negatives affects on water transport, power generation, health, agriculture and fisheries.
Figure 28: Water Weed Encroachment
(iii) Sandbars
145

Before the dam construction, seasonal floods flushed out sandbars, which might have started during the dry season, thus the estuary was largely kept free of sandbars. However, after the construction of the dam, due to absence of annuals floods, sandbars gradually formed at the estuary and in time virtually blocked it. The effect of this was that saline water, which during high tide flowed upstream into the river channel, completely ceased.
Moreover, with the absence of salt water into the river channel, soon the areas even closer to the estuary started to experience the presence of the schistome snail and Bilharzia became prevalent. But, by bringing a dredger permanently stationed at the estuary to cut a channel trough the sandbar, VRA restored salinity into the river channel. As a result, Bilharzia has now wiped out from these areas.
Figure 29: Sandbar on the Volta River mouth
(iv) Seismicity
Reservoir induced seismicity (RIS) is one impact of the water project which has received attention in recent times because of its potential catastrophic effects. The creation of the Volta lake has added weight to the underlying rocks amounting to 165 million metric tons when the lake reaches its estimated capacity of 165 km3, and fluctuating through a range of 25 million metric tons during normal fluctuation of the lake level (Smithsonian Institute, 1974). Significantly, the weight build-up has occurred over an area, which is not very far from the seismically active area along the main Akwapim fault.
In November 1964, when about 28km3 of water had been impounded, an earth- quake of intensity of 5 on the modified Mercalli scale occurred with its epicentre located near Koforidua, about 40km south of the reservoir. In December 1966, another earthquake
146

occurred when the total impoundment stood at 102km3, and a third occurred in February 1969 with storage at 162 km3, but the epicenters for these shocks were offshore from Accra and more remote from the lake. These incidents led Kumi (1973) to conclude that at least the 1964 incident, which had its epicentre within 40km of the reservoir, could be attributed to crustal readjustments associated with the initial stages of the lake’s infilling.
(v) Sediment load changes
Before the construction of the Akosombo dam, the highest measurements of suspended sediment concentration of the Volta River at Ajena in 1956, at the height of the flood season, did not exceed 90mg/l near the surface (Volta River Project (VRP) Preparatory commission, 1956). Current measurements downstream of the dam at Tefle (Sogakope) by the Water Resources Research Institute (WRRI) show that the average suspended sediment concentration is 38mg/l. This significant reduction in sediment load downstream has been linked to increased channel-bed scouring and the exposure of the piles on which the supporting piers of the Tefle bridge stand
(vi)Morphological changes
Some profound morphological changes are found along the stretch of the Volta river downstream of Akuse and in its delta zone. Since 1974, the point at which the Volta entered the sea is known to have shifted 12km eastwards in a channel, which runs parallel to the coast. This phenomenon of gradual eastwards shift of the mouth of the Volta River has been known in the past but the process seems to have been accelerated since the construction of the Akosombo dam and the flood-flushing of the river mouth stopped. The main concern with these changes has been the disastrous effect any rapid flood release could have on estuarine communities and the environment. It is largely due to the adverse changes that have occurred in the delta zone, which periodically prompts the VRA to artificially re-establish a direct flow into the sea. Additionally, the changes are probably linked to accelerated coastal erosion at Ada.
(vii) Microclimatic changes (weather changes)
The transformation of bare or vegetated land into water body causes significant changes in surface albedo and thereby alters the local heat budget. It also causes changes in surface roughness, which may tend to affect wind speed. Oral accounts of sudden change in wind speed on the Volta Lake and surrounding areas have been documented by Moxon (1984). Similar reports of observed changes in local weather conditions were corroborated by the residents during field survey of the impact of water projects in Ghana by the personnel of Water Resources Research Institute (Sam, 1993). The main scientific study of the impact of the Volta Lake on the local climate was pioneered by De-HeerAmissah (1969). He studied available climatic data from near and distant stations from the lake, such as Tamale and Kete Krachi in the northeast, and Akuse and Accra in the south, two years after the lake started filling up, and arrived at these conclusions:
147

(i) There was no evidence of significant changes in the monthly rainfall amounts at the four stations even though a tendency towards decreasing rainfall amounts at Kete Krachi and increasing amounts at Tamale was becoming evident.
(ii) The mean monthly maximum temperature since 1964 at Kete Krachi seemed to be lower than the pre-project 10 year mean, whereas the minimum temperatures were higher than the 10 year mean.
Recent work by Opoku-Ankomah (1996) on the rainfall pattern of Accra from 1935 to 1995 divided into decades, i.e. 1936–1945, 1946–1955, etc. showed that there was a gradual rise of rainfall totals from the beginning of 1936–1945 to the 1956–1965 decade and a decline thereafter up to 1986–1995. The mean annual rainfall for the 1986–1995 decade has not been high, however, the number of occurrences of very large (24-h maximum) rainfall events have been relatively high
III. LAND TENURE SYSTEM AND AGRICULTURAL POLICIES CHANGES IN BURKINA
FASO
1. Changes in the land tenure system in Burkina Faso
According to OUEDRAOGO N., 1997, three land systems which coexisted in Burkina Faso can be distinguished. They are as follows: customary land system, colonial land system and post-colonial land system.
(i) The customary land system
The customary land system is almost the same everywhere in Burkina Faso. It is based on the collective ownership of land. The collective ownership of land is exercised by the land custodian (known as Tengsoba for the Mossi, Tarfolo for the Sénoufo, Susunnbaso tinibaso for the Bwaba etc. (OUEDRAOGO S. 1993). In all customs the land custodian is the closest descendant of the first settler. In this capacity, he administers the land patrimony of the group in the interest of all the community. He distributes land or he authorizes land use, following the indispensable rites, by households and individuals that require it and in accordance with their needs. Thus, the applicant acquires a user right, which must not be mistaken for ownership right in the Western sense of the term.
However, after the death of the applicant his heirs will settle and exploit the same land without the land custodian intervening anew. This land is available for the whole community for any possible use in case no heir claims it. Land is given provisionally to strangers (non-natives) even if this provision may be permanent. Therefore the right accorded to the stranger is precarious, hence the notion of land insecurity for migrants. In this case, land is simply lent, often following royalties in kind or performances of various services. Security imperatives require that the applicant be first socially integrated. However, except in rare cases, land cannot be refused to an applicant according customary law. Therefore the customary land system is complex in practice.
148

At the economic and social levels, it must be acknowledged that the customary land system, with all its utilization nuances, opposes creative investments or dissuades them through the almost permanent insecurity as far as individual use is concerned. In this system, land is not given to those who have the necessary means to develop it, but to those who won the confidence of the owning social group, and what is more, on a provisional basis.
(ii) The colonial land system
This system is essentially based on private ownership while making provision for a public estate. Private estate is acquired through purchase, exchange, gifts or legacies, etc. Public estate is made up of natural properties such as hills, rivers, natural or artificial lakes (roads, artificial water bodies, etc.). This system was resisted to by the customary land system.
(iii) The post-colonial land system
The land system in force now is based on the agrarian and land reform (RAF), adopted in 1984, which grants user rights to individuals and moral entities.
It makes provision for a national land including all the lands within the borders of Burkina Faso, no matter their former status or legal systems. State property is inalienable, un-seizable and imprescriptible. In addition to ownership right, the State assigned itself that of management. In this way, it defines rights for groups and individuals. It should be pointed out that the settlement and exploitation of rural lands by peasants for subsistence are free.
The RAF so designed shatters the mystic aura of land and takes away from peasants their references and customary value systems by leading them to practice new farming techniques (protection and restoration of soils, fertilization, etc.). This law particularly aimed at making land available to those willing to develop it, and at organizing the rational management of this resource which has become in the end scarce in Burkina Faso.
Therefore, this land system aims at favoring the development of productive agricultural forces. However, it does not encourage populations to make sustainable investments and a lot of resistance to its enforcement can be noticed.
2. Changes in Agricultural Policies in Burkina Faso
Burkina Faso has remained an agricultural economy, with agriculture providing a livelihood for 90% of the population. But the performance of Burkinabé agriculture is strongly constrained by the erratic limits of land and water and by demographic pressure on the availability of land.
Agricultural production in Burkina can be divided into "food crops" and "cash crops."
Using 80% of the cultivated area, food crops, which consist of cereals (millet, sorghum, fonio), maize, and rice, are the most important products of the agricultural sector. Cash
149

crops are basically cotton and ground nuts. Cash crops are of fundamental importance to Burkina's economy, because they provide the main trade revenue of the country. Cotton in particular has been Burkina's main export commodity and has gained significant importance in recent years.
Since independence the state has played a major role in the agricultural policy of Burkina Faso. It has devoted between 10% and 25% per annum of public investments to agriculture and achieved many Rural Integrated Development Programs, the most recent being the Valley of the Sourou River project.
The extension agencies of the Ministry of Agriculture have provided services such as training, agricultural technique development, and input distribution. As a seller of inputs and purchaser of harvests, the state has fulfilled another important regulation aim, through parastatals like SOFITEX in the area of cotton production and the OFNACER, responsible for cereal stabilization. The state has influenced the agricultural sector as a policy maker. Agriculture policy changed during the decades preceding adjustment with regimes and their perception of the relative importance of rural versus urban dwellers. Through the tool of producer price setting, the state has provided both incentives and disincentives for the volume of agricultural output.
Some common characteristics emerge from the agricultural policies implemented by successive governments: the state has constantly reorganized its services in line with its prevailing objectives; it has managed to control the pricing policy of agricultural products; and it has attempted to organize producers and provide them with infrastructure.
To facilitate the development of the agricultural sector, newly independent Burkina Faso created 11 Regional Development Offices (RDO). The core of these offices is the Extension Service, responsible for all rural development activities in a given area. These activities include distribution of fertilizers, insecticides, and chemicals for the protection of stored grain; collection of credit; purchase of farm products; promotion of cooperatives; collection of statistical data; promotion of community activities; and advice on planting techniques.
The first Five-Year Plan, launched in 1967, gave priority to increasing the output of cereals through better cultivation methods and the use of fertilizers. As in previous years, the objectives were diversification of crops, soil conservation, and improvement of the irrigation system. These improvements were expected to double agricultural output in 15 years.26 The long-run decision was also taken to establish a complementary system of agriculture and livestock. The plan foresaw the development of irrigated areas of intensive farming as well as the enlargement of regions of traditional dry farming. The total investment for rural development during that time amounted to 29.8% of total public investment.27
The main objective during the second Five-Year Plan (1972-76) was primarily to overcome the results of the drought the country had just suffered, which hit crop farming severely. In 1973 the existing parastatal RDOs were given the monopoly for purchasing grains from farmers. The importance of the RDOs enforced the role of the state as a
150

buyer and purchaser of agricultural products. After four years of implementation of the government's measures, the objectives of monopolizing the grain trade and achieving price stabilization had not been reached. OFNACER, the national cereal board, was entrusted with greater responsibility for marketing cereals and supporting official producer prices at the level of farmers.
Like the food grain supplies, the livestock sector was severely affected by the drought of the early '70s. The drought-induced losses were estimated at 12-15% for cattle and at 8-10% for sheep and goats. In the years 1975-77 the government undertook several measures to reconstitute the cattle stock. To facilitate these efforts, a new agency, the ONERA (Office National d'Exploitation des Recherches Animales) was set up. Its task was to develop domestic and export marketing of livestock and livestock products.
Given the substantial disparities in agricultural potential between the Mossi plateau and the peripheral areas, the government's policies aimed to redistribute the population to alleviate population pressure on the Mossi plateau. The attempt to out-migrate people from the Mossi plateau into lands of richer soil, better rainfall, and low population density in the peripheral areas was a means of promoting the country's long-term agricultural development. A government agency, the Authorité d'Amenagement des Vallées des Voltas (AVV), was created in 1974 to organize settlement in the White, Red, and Black Volta. The government also launched projects to eradicate the simulium fly, tsetse fly, and malaria in infected areas and also planned to mechanize production and begin resettlement schemes.
Since the 1980s, the government and NGOs have taken measures to reduce the heavy dependency on rainfalls. Despite the high number of factors31 militating against overly ambitious irrigation development, it was imperative that the government formulate at least a moderate irrigation development program. The major objective of the program was to complement rain-fed agriculture at the margin and to gradually overcome the constraints identified earlier. Later, the government introduced local low-cost water retention schemes and started irrigation programs such as the Sourou Valley Rural Integrated Development Program.
The agricultural policy of the years of the revolution was distinguished by a great plurality of objectives: production and productivity gains; income stabilization; food security; foreign-exchange earnings; and fiscal revenues. The implementation of policies to meet these objectives involved a series of "classic interventions," such as minimum producer prices, maximum consumer prices, administration of agro-industrial output and input prices, stabilization levies or compulsory paybacks, marketing and stabilization boards, and regulation of markets and foreign trade. The revolutionary government also gave priority to the construction of earth dams and the digging of wells for irrigation. Its first economic objective was to achieve food self-sufficiency in the decade that followed revolution.
But even while trying to improve the agricultural sector and the lot of the peasants during the first years of his administration, Sankara adopted the 1985 Agrarian and Land Reform Law, which basically hurt the interests of the peasants. The law nationalized land that had been private property or owned according to custom. The program was meant to promote
151

the rational use of land to increase productivity and social justice but was viewed with great hostility by the peasants.
One of the major positive changes in the agricultural sector brought about by Sankara's policy was that of self-help rural development. The best known such project is the Sourou valley agricultural project. In the first phase a 711-m canal was constructed in the Sourou valley. The canal was constructed entirely by local labor to bring water from the Mouhoun to the Sourou dam. The second phase involved the establishment of 40,000 hectares of irrigated land and the construction of a barrage at Samandéni. Of this land, 15,700 hectares were divided into plots worked by small shareholders and land for agro-industries. The rest was run by the state, with about 3,000 hectares devoted to sugar production and 5,800 hectares to cotton and oilseed producing crops. The Sourou project is an example of what can be achieved in an arid area that was considered to have little potential. Self-help schemes for soil improvement, especially in the Mossi highlands, where soil erosion due to over-cultivation was prevalent, were also developed.
In May, 1987, the Ministry of Agriculture established new, decentralized development agencies, the Regional Agricultural Production Centers (Centres Regionaux de Production Agropastorale). They replaced the Rural Development Agencies (Organismes de Developpement Rural), which were abolished in 1986. Their essential function is to provide extension schemes.
Beside that, numerous initiatives to promote particular crops or activities were launched between '82 and '87, but were subsequently abandoned for lack of resources or follow-up.
The government has consistently considered agriculture as the engine of growth but changed the nature of its development from being extensive, which has harmful environment consequences, to being intensive In 1988, 11 Agricultural Production Units were set up, their aim being the operation of irrigation infrastructures.
The most pertinent concluding description of the Burkinabé agricultural policy was made by a World Bank report by the end of the ‘70s, which said: "A complex system of institutions, regulations and mechanisms which give the government a dominant role" involving "four key ministries, six marketing and stabilization boards, more than 20 decentralized agencies, and numerous parastatal enterprises for production, extension and research. Fiscal, price and trade regulations are both numerous and cumbersome." That system obviously introduced substantial economic inefficiencies that call into question its justification. Institutional reforms aimed at rationalizing the role of the public sector were initiated in the mid-1980s. These reforms started to restructure the institutions involved in the agricultural sector and to identify the need for greater coherence and eventual liberalization of price and marketing policies.
III.3 Changes in population, social and cultural patterns of water management
Population Distribution in Ghana
152

Population density increased steadily from thirty-six per square km in 1970 to fifty-two per square km in 1984; in 1990 sixty-three persons per square km was the estimate for Ghana's overall population density. These averages, naturally, did not reflect variations in population distribution. For example, while the Northern Region, one of ten administrative regions, showed a density of seventeen persons per square km in 1984, in the same year Greater Accra Region recorded nine times the national average of fifty-two per square km. As was the case in the 1960 and 1970 figures, the greatest concentration of population in 1984 was to the south of the Kwahu Plateau. The highest concentration of habitation continued to be within the Accra-Kumasi-Takoradi triangle, largely because of the economic productivity of the region. In fact, all of the country's mining centers, timber-producing deciduous forests, and cocoa-growing lands lie to the south of the Kwahu Plateau. The Accra-Kumasi- Takoradi triangle also is conveniently linked to the coast by rail and road systems--making this area an important magnet for investment and labour
By contrast, a large part of the Volta Basin was sparsely populated. The presence of tsetse flies, the relative infertility of the soil, and, above all, the scarcity of water in the area during the harmattan season affect habitation. The far north, on the other hand, was heavily populated. The eighty-seven persons to a square kilometre recorded in the 1984 census for the Upper East Region, for example, was well above the national average. This may be explained in part by the somewhat better soil found in some areas and the general absence of the tsetse fly; however, onchocerciasis, or river blindness, a fly-borne disease, is common in the north, causing abandonment of some land. With the improvement of the water supply through well-drilling and the introduction of intensive agricultural extension services as part of the Global 2000 program since the mid-1980s, demographic figures for the far north could be markedly different by the next census.
Another factor affecting Ghana's demography was refugees. At the end of 1994, approximately 110,000 refugees resided in Ghana. About 90,000 were Togolese who had fled political violence in their homeland beginning in early 1993 (see Relations with Immediate African Neighbours, ch. 4). Most Togolese had settled in Volta Region among their ethnic kinsmen. About 20,000 Liberians were also found in Ghana, having fled the civil war in their country (see International Security Concerns, ch. 5). Many were long-term residents. As a result of ethnic fighting in northeastern Ghana in early 1994, at least 20,000 Ghanaians out of an original group of 150,000 were still internally displaced at the end of the year. About 5,000 had taken up residence in Togo because of the strife
Urban-Rural Disparities
Localities of 5,000 persons and above have been classified as urban since 1960. On this basis, the 1960 urban population totalled 1,551,174 persons, or 23.1 percent of total population. By 1970, the percentage of the country's population residing in urban centres had increased to 28 percent. That percentage rose to 32 in 1984 and was estimated at 33 percent for 1992.
Like the population density figures, the rate of urbanization varied from one administrative region to another. While the Greater Accra Region showed an 83-percent
153

urban residency, the Ashanti Region matched the national average of 32 percent in 1984. The Upper West Region of the country recorded only 10 percent of its population in urban centres that year, which reflected internal migration to the south and the pattern of development that favored the south, with its minerals and forest resources, over the north. Urban areas in Ghana have customarily been supplied with more amenities than rural locations. Consequently, Kumasi, Accra, and many towns within the southern economic belt attracted more people than the savannah regions of the north; only Tamale in the north has been an exception. The linkage of the national electricity grid to the northern areas of the country in the late 1980s may help to stabilize the north-to-south flow of internal migration
The growth of urban population notwithstanding, Ghana continued to be a nation of rural communities. The 1984 enumeration showed that six of the country's ten regions had rural populations of 5 percent or more above the national average of 68 percent. Rural residency was estimated to be 67 percent of the population in 1992. These figures, though reflecting a trend toward urban residency, were not very different from the 1970s when about 72 percent of the nation’s population lived in rural areas.
In an attempt to perpetuate this pattern of rural-urban residency and thereby to lessen the consequent socio-economic impact on urban development, the "Rural Manifesto," which assessed the causes of rural underdevelopment, was introduced in April 1984. Development strategies were evaluated, and some were implemented to make rural residency more attractive. As a result, the Bank of Ghana established more than 120 rural banks to support rural entrepreneurs, and the rural electrification program was intensified in the late 1980s. The government, moreover, presented its plans for district assemblies as a component of its strategy for rural improvement through decentralized administration, a program designed to allow local people to become more involved in planning development programs to meet local needs.
Annual population growth rate in the Volta basin of Ghana
The third demographic variable that was analyzed regarding its role in affecting agricultural land use is the annual population growth rate. Results of the annual population growth rate in the various sub-basins of Ghana in three periods, namely 1960-1970, 1970-1984 and 1984-2000, are shown in Table 5.3. Figure 5.4 depicts the trends in the annual population growth rate.Table 77: Annual population growth rate by sub-basins, 1960-2000
Sub-basin Annual population growth rate1960-1970 1970-1984 1984-2000
White Volta 5.4 2.7 1.5Black Volta 3.4 3.3 1.2Main Volta 4.9 2.7 2.5Oti basin 7.9 3.1 3.0Daka basin 6.6 2.4 2.8Source: 1984 population census of Ghana, special report on localities by local authority and 2000 population and Housing Census, Summary Report of Final Results (GSS 2002b)
154

5.4
3.4
4.9
7.9
6.6
2.73.3
2.73.1
2.4
1.5 1.2
2.53.0 2.8
0
1
2
3
4
5
6
7
8
9
White Volta Black Volta Main Volta Oti basin Daka basin
Annual population growth rate
1960-1970 1970-1984 1984-2000
Figure 30: Annual percent population growth rates by sub-basins, 1960-2000
The annual population growth rate decreased for all three periods in all sub-basin, the only exception being the Daka sub-basin, where it increased from 2.4 5 between 1970-1984 to 2.8 % in 1984-2000. Annual population growth rates were very much higher between 1960-1970 compared to the periods in all the sub-basins
Agricultural land use in the sub-basins
Agricultural land use for 1992 and 2000 in the Volta river sub-basins, as shown in figure was characterized by a mixture of increases and decreases. While there were increases in the White, Black and Main Volta sub-basins during the period, the Oti and Daka sub-basins experienced declines.
155

Figure 31: Average cropped area by sub-basins, 1992 & 2000
Source: Ministry of Food and Agriculture, Ghana, 2001: in Codjoe (2004)
The highest annual increase (89.9 %) in agricultural land use in the White Volta sub-basin is recorded in the Lawra-Jirapa Local council, and the lowest a 0.3 % increase in the Walewale local council
Migrations and mobility in the Volta basin of Ghana
The spreading Lake behind the Akosombo Dam forced 739 villages along the banks to be moved. However, this was not the first time that Ghana had resettled citizens. In 1956, members of the Frafra people in the Northern Region first had their homes relocated because of overpopulation. The second resettlement was the Tema Manhean Project (1959), which resulted from the construction of the Tema Harbor seaport.
The Volta Resettlement Scheme, Ghana’s third of its kind, carried a budget of $9.8 million. Before the 80,000 people could be displaced, economic, social, physical, political, and psychological factors had to be addressed. Since resettlement would drastically affect the lifestyles of the people, it was essential to make the transition as smooth as possible while preserving sacred traditions and rituals of life. Furthermore, there was a prevailing sentiment among the people to be displaced that the government "owed them something." Many of the people needed to regain a sense of worth and reestablish their contribution to society.
Everyone was given the option of either monetary compensation or resettlement into one of the 52 specially constructed townships. Over 70,000 people chose resettlement over monetary compensation. A great number of the resettled moved on immediately when confronted with shortages and inadequacy of housing, of cleared land, of money and of food. A study by FAO, revealed that by1970, only five years after the move, only 25,000 of the settlers remained in the villages, illustrating clearly the collapse of the old way of life of the various communities in the area. Unfortunately, there are no studies of those who chose to leave the villages compared to the study of those who remained. However, it is fair to say that by and large it was men who left to work elsewhere, leaving behind women and children together with government officials (Graham, 1972).
Many case studies have shown that the move from old to new villages was itself a traumatic experience for many of the resettled. Shortage of time, lack of money and inadequate planning combined to ensure that few of the villages were completed by the time people arrived. By 1966, the disruption of existing social, cultural and economic relations was almost complete.
Before Akosombo, many of the people along the Volta lived in tiny scattered villages. The average village house was constructed with swish (soil-based) walls and thatch roofs.
156

Subsistence farming, animal grazing, and river fishing were the most common practices in the area; and these traditions were passed down from generation to generation. According to the 1956 preparatory studies, only about 6% of the land covered by the lake was "used productively," while the rest was "unsuitable for agriculture or unoccupied" with low cash incomes and many medical problems (Hart, 1977).
The resettled were referred to as subsistence farmers, with low levels of productivity, which contributed little to the national development effort. According to Hart (1977), the resettled farmers were in fact, agricultural labourers for the VRA and not individual farmers acting in mutual cooperation.
The resettlement scheme offered a unique opportunity to consolidate the scattered villages into more organized communities and provide them with schools, improved sanitary facilities, and increased revenue potential through mechanized farming techniques and organized livestock breeding. Furthermore, this consolidation would facilitate future electrification of the area. Indeed the resettlement was seen then by the Government of Ghana as an opportunity to implement the ideas of “modernization theory” through wide scale social engineering. Isolated communities, living in harmony with the Volta River and practicing the most appropriate form of shifting agriculture, were not only expected to acquiesce to the resettlement scheme for the greater good of the nation, but were also expected to change their whole way of life in order to conform to the conventional models of development.
A resettlement house was constructed with landcrete walls (concrete made with local soil) and an aluminium roof. In terms of the sturdiness and durability of the building materials used, a resettlement house was superior to the average village house. Although each family was given a "core" house, overcrowding was common because previously, every household built as many rooms as they needed and also, many of the houses were never completed.
The resettlement project also aimed to replace the common practice of subsistence farming with "cash crop" farming. In doing so, each farmer would be taught new farming techniques to produce enough for his family and some extra crops to sell for income. In order to support crop rotation, virgin forests were cleared for farmlands; but this was not always done without resistance (the government often clashed with traditional chiefs over who owned the land). As a subsidy, the government also provided chicks, piglets, and other young livestock to the people to rear on the new livestock farms and later, to sell for profit. After many of the animals began to die prematurely from disease and malnutrition (usually from improper care), the government stopped giving out the young livestock at no cost to the farmers.
Many of the most crucial problems in the new villages stemmed from the land issues It has been planned that sufficient land be cleared to provide every farmer with 12 acres (4.86 ha). But by 1966, when the deadline for the dam construction had been reached only 15, 000 acres (6,075 ha) had been cleared from a target of 54, 000 acres (21,678 ha). By way of comparison, the flooded area had 128, 000 acres (51,830 ha) in productive
157

use.
With only a quarter of the required land cleared it was clear that the resettled could not practice their traditional farming skills, or even continue growing their subsistence crops. Confronted by this land shortage, many of the resettled could not farm at all. The land clearing programme was initially based on the use of heavy machinery but, by 1967, the scheme was abandoned due to lack of spare parts and lack of heavy earth moving. The VRA had also hoped to introduce new farming methods to the people and also controlled the allocation of seeds and fertilizers and the bulk of buying the production. Farmers were assigned to various types of agriculture. Some were to become crop growers other tree-crop farmers, and the rest livestock farmers. More specialized activities, like tobacco and cotton cultivation, and pig and poultry were later introduced. By 1968, it was clear that the new system of intensive, mechanized farming had failed.
The creation of the lake has also led to a massive escalation of disease amongst the lacustrine population. Among the feared consequences of the lake was an increase on three notorious afflictions: schistomiasis (bilharzias) onchoceriasis (river blindness) and malaria. Although various efforts have been made to improve the health of the resettled, it is clear, despite the absence of statistics, that the health standards of the lacustrine population have been considerably lowered by the impounding of the river.
Many agree that the Volta Resettlement project improved the physical environment for the average rural Volta citizen however, the debate continues as to whether or not there were social and psychological improvements. VRA tried as much as possible to settle people of the same ethnic group into a village. But sometimes, there were cultural conflicts because a Fanti would not want to be governed by an Ewe chief, for example. Other problems arose from lifestyle issues.
Some who were seasoned fishermen did not want to become cash crop farmers. Many left their resettlement homes and constructed wooden shacks along the lakeside so that they could be closer to their best-known source of income. As more people encroached on the lakeside and the communities diversified their activities, illegal clearing and farming along the banks led to increased sediment deposit into the lake. With the receding perimeter of the lake due to the drought in 1998, the government made efforts to replant trees along the lakeside to control erosion.
IV.3.4 Legal Framework: Presentation of the Water Laws
A. Statutory Legal Framework for Water
In this section, we shall discuss the emerging consensus on water policy and the major institutions created by statute to deliver water in Ghana. We shall also discuss the institutions created to regulate the water sector.
A.1 National Water Policy
158

It is difficult to state that Ghana has a Water Policy because there is no national water policy document that states the intentions of government on the management of Ghana's water resources. What exists is a document by a number of consultants entitled ‘Ghana’s Water Resources, Management Challenges and Opportunities’, (to be referred to as Ghana’s Water Resources) published by the Ministry of Works and Housing, which makes recommendations about how Ghana’s water resources should be managed. It seems however that government is following these recommendations. We shall discuss the salient recommendations of the document in the light of the difficulties that have faced the country in the management of its water resources.
Until recently there was no institution in Ghana that had overall responsibility to manage the country’s water resources. Several single purpose state agencies like the Ghana Water and Sewerage Corporation (GWSC), the Volta River Authority (VRA), and the Irrigation Development Agency (IDA), pursued their individual mandates with little co-ordination and without any thought about what other water users required. Little emphasis was put on the management and conservation of water. Second, water was provided in a way that did not capture the economic value of producing and conserving it. It was either provided free of charge or at a very subsidized rate. Third, there was no effective regulation of the water sector. The likely result was that the management of water could not be sustained.
The recommendations made in Ghana’s Water Resources are supposed to correct these mistakes. It was recommended that Ghana should move away from a state dominated water sector to a private sector led industry where the private sector plays the central role in investing and in delivering water. The recommendations argue that there are costs involved in managing water in a sustainable manner (Ghana’s Water Resources, pp 55-57). A price must therefore be placed on the use of water resources in order to capture its value as a scarce resource. Raw water abstraction should attract a fee. The ‘polluter pays’ principle should be used to control discharge of effluents into water. People who use water for non-extractive purposes like fishing, transportation and recreation should be made to pay a fee for its use. The introduction of water charges should facilitate the promotion of water conservation, the protection of the aquatic environment and the maintenance of a database on water resources (Ghana’s Water Resources, pp 46-51).
The objectives of regulation should be to ensure an efficient co-ordination and planning of water resources in Ghana. It should protect the economic life of existing investments in infrastructure and create the appropriate framework for people to invest in water and its resources. It is hoped that such an environment will safeguard the public interest against failure of hydraulic structures, flooding and river bed and reservoir sedimentation and facilitate the participation of all users in the management of water resources.
It also suggested changes in the institutional setting for managing water resources and controlling pollution. It argued for a multi-sectoral approach to water resources management. It recommended that a single agency should be established to co-ordinate the sector’s activities to ensure that there is minimum conflict between different water users.
159

A.2 National Water Legislation
There are a number of agencies in Ghana that provide water under statute law. However, the most important ones for purposes of providing water for domestic consumption are the Ghana Water Company Limited (GWCL) (formally Ghana Water and Sewerage Corporation) and the Community Water and Sanitation Agency (CWSA). By practice and orientation, GWCL has concentrated on the provision of water and sewerage services in urban areas, whilst the CWSA facilitates the provision of water in rural areas. The CWSA works in close collaboration with District Assemblies. Recently, a number of regulatory institutions have been established to regulate the delivery of water to consumers and also to protect the environment and conserve water resources.
A.3 The Ghana Water Company Limited
The GWCL was set up in 1965 as a public corporation. A managing director who is accountable to a Board of Directors heads the Corporation. GWSC has 10 regional offices headed by regional directors.
Under the GWSC Act 1965, GWSC has authority to provide, distribute and conserve water for domestic, public and industrial purposes (section 4 of GWSC Act 1965, Act 310). It is also supposed to establish, operate and control sewerage systems in Ghana. The Corporation has power to make long term plans for the provision of water and the operation of sewerage systems in Ghana. It has authority to conduct research into water and sewerage issues. It can also make engineering and survey plans and it can construct and operate water and sewerage works in the country. It sets the standards for water supply and the operation of sewerage systems.
Under LI 1233, the Corporation has enacted regulations through which water and sanitation facilities can be made available to Ghanaians. These regulations are meant to protect the environment, protect natural watercourses and provide for proper sewerage systems. Among its important powers, GWSC can by a notice published in the Local Government Bulletin, declare an area to be a ‘connection area’. It can also in consultation with the Town and Country Planning Authority, establish planned connection areas. When an area is declared a connection area, GWSC can take over any private sewerage system there. Anybody who wishes to build a private sewerage system in a connection area must submit his plans and drawings to the GWSC for approval. The GWSC can also enter any land in a connection area and install or inspect a sewerage system (Sections 1-20 of GWSC Regulations 1979, LI 1233).
The GWSC has power to serve a notice on the owner or occupier of land in a connection area to apply for the installation of a water or sewerage system. A person can also on his own apply for the grant of a permit to construct a sewerage system. No private sewerage system can be connected to a public sewerage system without the approval of GWSC.
160

The Corporation has authority to enter a person’s premises or land and install or complete the installation of a sewerage system without the person’s approval and at the person’s expense. No one can receive a building permit in a connection area if he does not have a permit to install pipes and sanitary appliances in the building to be constructed.
The Corporation has regulatory powers to protect natural waterways. It is therefore illegal to pollute a watercourse or to cause damage to a sewerage system. Nobody has authority to dig, excavate or remove earth around a public sewerage system without the prior approval of the Corporation. No one can build a structure over or near a public water way or sewerage system without the prior approval of the Corporation.
Customers of the Corporation are under obligation to pay for services provided by the Corporation. This has to be done within 14 days of the receipt of a bill. The Corporation has authority to disconnect a person who fails to pay for services it has provided. It can also institute action in court to recover monies owed to it.
A.4 The Community Water and Sanitation Agency
As we have already stated, GWSC has concentrated on the provision of water to urban areas. It failed to provide water to the rural areas of Ghana. In 1994 an autonomous division of the GWSC, the Community Water and Sanitation Division was created to facilitate the provision of water to rural areas in Ghana. By Act 564, the Community Water and Sanitation Agency became an institution in its own right and it is no more a division of GWCL. The CWSA is in the process of separating itself from GWSC.
Among the objectives of the CWSA is to facilitate the provision of safe water and sanitation services to rural communities and small towns (Section 2 of Community Water and Sanitation Agency Act, 1998, Act 564). It must support district assemblies in promoting sustainable safe water and sanitation services in rural areas. It must support district assemblies to encourage the participation of communities, especially women, in the management and construction of water and sanitation facilities. Among its responsibilities, it has to design strategies for mobilizing resources for the execution of water and sanitation projects. To achieve this objective, it must encourage the private sector to participate in the provision of water and sanitation facilities. It must also provide district assemblies with the technical assistance required for executing water and sanitation projects. It also co-ordinates the activities of NGOs involved in the provision of rural water, sanitation and hygiene education. It must collaborate with the Ministries of Local Government, Environment, Health and Education in increasing consciousness about water related health hazards. It must set standards for the provision of water and sanitation services. It has to charge fees for the services it provides and it must collaborate with International Agencies it considers necessary for implementing its programmes. It must collaborate with the Water Resources Commission, the Environmental Protection Agency, the GWSC and other public and private bodies that
161

are involved in the provision of water and sanitation services to rural communities in Ghana (Mensah, 1999).
A.5 District Assemblies
Ghana has embarked on a decentralization programme that is aimed at allowing decisions affecting communities to be taken at the lowest appropriate level. Under the Local Government Act 1993, Act 462, district assemblies are the highest political and administrative authorities in the district (Sections 10(1), 10(3)(c)(d)(e) of the Local Government Act, 1993, Act 462). District Assemblies must promote productive activity and social development in their districts. They must also remove all impediments to development in their districts. It is their responsibility to develop the basic infrastructure and provide the municipal works and services required in the district. They are also responsible for the development, improvement and the management of human settlements and the environment in their districts.
Under the second schedule 2 of the Local Government (Assin District Assembly)(Establishment) Instrument, 1988, LI 1380 some of the Assembly’s duties include:To ensure the provision of adequate and wholesome supply of water throughout the entire District in consultation with the Ghana Water and Sewerage Corporation.To establish, install, build, maintain and control public latrines, lavatories, urinals and wash places.To establish, maintain and carry out services for the removal of night soil from any building and for the destruction and treatment of such night soil.
The lowest political authority in a district is the unit committee. Under schedule 5 of the Local Government (Urban, Zonal and Unit Committee) Establishment Instrument, 1994, LI 1589, unit committees are supposed to perform the following functions:Mobilise members of the Unit for the implementation of self-help and development projects.Monitor the implementation of self-help and development projects.
There is thus a close connection between the Community Water and Sanitation Agency, District Assemblies and the Unit Committees. The Community Water and Sanitation Agency is responsible for facilitating the provision of water and sanitation to rural communities. A District Assembly is responsible for ensuring that adequate and wholesome water is provided in the district. They are also responsible for developing infrastructure, the municipal works and human settlements. They are also responsible for managing sanitation. Unit committees are responsible for initiating and monitoring self-help projects. The provision of water and sanitation under the Community Water and Sanitation Programme (CWSP) for communities is supposed to be self-help (Mensah, 1999).
A.6 Regulatory Institutions
162
The effectiveness of the laws governing resources poses another problem as the laws and regulations established for the management of water and soil resources appear to be weak and ineffective. In some instances, the laws are adequate but they are not adhered to or enforced either due to lack of institutional capacity or political commitment. The knowledge base of the state of natural resources, rate of depletion, and consequent future impact is poor, and probably contributes to the weak political commitment on the parts of governments and general apathy on the part of the populace. The legal framework governing the management of land and water resources is the Code for the Environment, the decree of 5 February 1933, and Code for Water, which is to be finalized under the management of water resources, and the Mining Code.
Customary laws and practices in Ghana have existed over the years and cover the areas of water conservation, pollution control, protection of catchment areas and protection of fisheries. These laws are enforced through various sanctions, usually determined by traditional authorities. However, apart from issues on the protection of water for domestic use that are already present in existing statutes, many traditional regulations are rather localised and do not have any common features that can be readily incorporated into common law. The Rivers Ordinance (CAP 226, of 1903) was the first attempt to comprehensively control the use of water other than for domestic uses. There was no follow-up to this ordinance. No regulations were made, and time and other enactments have since overtaken the ordinance. Part 1 and II of the Rivers Ordinance have since been repealed by the Water Resources Commission (WRC) Act 522 (1996). Part III of the Ordinance is, however, still operative. A list of all statute laws that are related to water resources in the country is presented in Appendix 1.
Until the Water Resources Commission Act was passed in 1996, agencies in the water sector were set up by legal enactments that provided the legal framework for the management of the resource. Each of the legal enactments contain specific provisions which grant the agencies the powers, with the approval of government, to make general and specific regulations by legislative instruments to enable the objectives and functions of the agencies to be better discharged. This arrangement gave room to a fragmented approach to the management of the resource.
Water, as an essential natural resource falls within the provisions of Article 269 of Ghana’s Constitution, which seeks to protect water resources by setting up a Commission to regulate, manage and co-ordinate government policies in relation to it. Section 12 of the Water Resources Commission Act (1996) stipulates that ‘the property in and control of all water resources is vested in the President on behalf of, and in trust for the people of Ghana’. The vesting of the water resources in the President is to make water resources management consistent with general natural resources management in Ghana and the 1992 Constitution. The principle implies that there is no private ownership of water in Ghana, but that the President, or anyone so authorised by him, may grant rights for water use. It also implies that with good governance and practice, the principle is expected to ensure that water allocation for various uses will be beneficial to the public interest and also for the greatest good of society.
Though the WRC Act vests the ownership of water resources in the state, it recognises all existing uses of water prior to the enactment of the WRC Act. However, all existing
163

claims to water uses are to be submitted to the Commission within twelve months after the coming into force of the Act. The WRC Act also provides for certain categories of water uses which are exempted from the requirement of prior permit. Section 13 (2) of the WRC Act provides for the non-preventive use of water resources for the purpose of fighting fire, while Section 14 (1) states that ‘a person who has lawful access to water resources may abstract and use water for domestic purposes’.
A number of institutions have been established to regulate the delivery of water in Ghana.
A.6.1 The Water Resources Commission
The Water Resources Commission was set up under article 269 of the 1992 Constitution to be the single agency responsible for co-ordinating water policy in Ghana. Act 522 established the Commission.
The Commission is responsible for the regulation, management and co-ordination of policy in connection with water (Section 2 of Act 522). It is supposed to propose comprehensive plans for the utilization, conservation, development and improvement of water resources in Ghana. It has the mandate to initiate, control and co-ordinate activities connected with the development of water resources. It grants water rights. It can also require water user agencies to conduct research into water resources. It has also authority to monitor and evaluate programmes for the operation and maintenance of water resources in Ghana. It advises the government on issues that are likely to adversely affect water resources.
Under the Water Resources Commission Act, the property in and the control of water resources is vested in the President on behalf and in trust for the people of Ghana (section 12). No person has authority to divert, dam, store, abstract or use water resources, construct or maintain works for the use of water resources without the authority of the Commission. A person who has been lawfully granted access to water resources can abstract it and use it for domestic purposes. However, no one has authority to abstract water for domestic purposes without a permit (section 13-24).
Where the Commission thinks that the use of a water resource poses a threat to the environment or public health, it may by notice order the person polluting the water resource to stop the activity. When an application for a water right is made, the Commission is obliged to consult inhabitants in the area where the right is to be granted, to ascertain their views on the grant of the water right. It also has to publish the application in the Gazette to allow anyone who has an interest in the water resource to indicate the nature of his interest. The grant of a water right may be subject to conditions. No one has authority to transfer a water right without the written approval of the Commission.
The Commission has power to suspend or vary a water right if it thinks that the water resource in an area is insufficient for public purposes. Where it thinks that the water
164

resource is needed for a public purpose it can also terminate or limit a right already granted. Compensation can be given to the right holder if this occurs. A water right can be terminated for breach of a condition attached to the right or for non-use. It is an offence to interfere or alter the flow of water, or pollute or foul water beyond the limits prescribed by the Environmental Protection Agency.
The WRC has just started its work. It is in the process of formulating its policies with regard to the granting of water rights.
A.6.2 The Environmental Protection Agency
The Environmental Protection Agency was established in 1994. Its functions include advising the Minister for the Environment on policies on all aspects of the environment (Section 2 of the EPA Act 1994, Act 490). The Agency is also supposed to co-ordinate activities of all bodies concerned with the environment and to be the link between such bodies and the Ministry of the Environment. It has responsibility to co-ordinate the activities of bodies that generate waste with the object of controlling the generation, treatment, storage and transportation of industrial waste. It must protect and improve the quality of the environment. It has power to issue environmental permits and pollution abatement notices in order to control waste discharges and emissions and to prevent or reduce noise pollution. It is supposed to provide standards and guidelines in relation to air, water and other forms of environmental pollution. It also has authority to ensure that developers comply with environmental impact assessments of their development plans before they begin development. The EPA is supposed to implement the National Environmental Action Plan.
A.6.3 The National Environmental Action Plan
The objectives of the National Environmental Action Plan are to improve the surroundings, living conditions and the quality of life for all generations of Ghanaians. It aims to ensure that there is reconciliation between economic development and natural resource conservation. It is hoped that a high quality environment will become an essential element in Ghana’s economic and social development plans (Ghana Environmental Action Plan, vol. 1, pp 1-18).
The principles on which the National Environmental Action Plan is based are that there must be optimum sustainable yield from the use of natural resources. It requires that the most cost-effective methods should be applied to achieve environmental objectives. This means that incentives and regulatory methods should used to achieve environmental objectives. Consequently, the polluter should be made to pay for the cost of preventing or eliminating the pollution or nuisance he has caused. Decisions on the environment should be taken at the lowest appropriate level. The public must also be encouraged to participate in decisions that affect the environment. Ghana must co-operate internationally to achieve environmental objectives (Mensah, 1999).
165
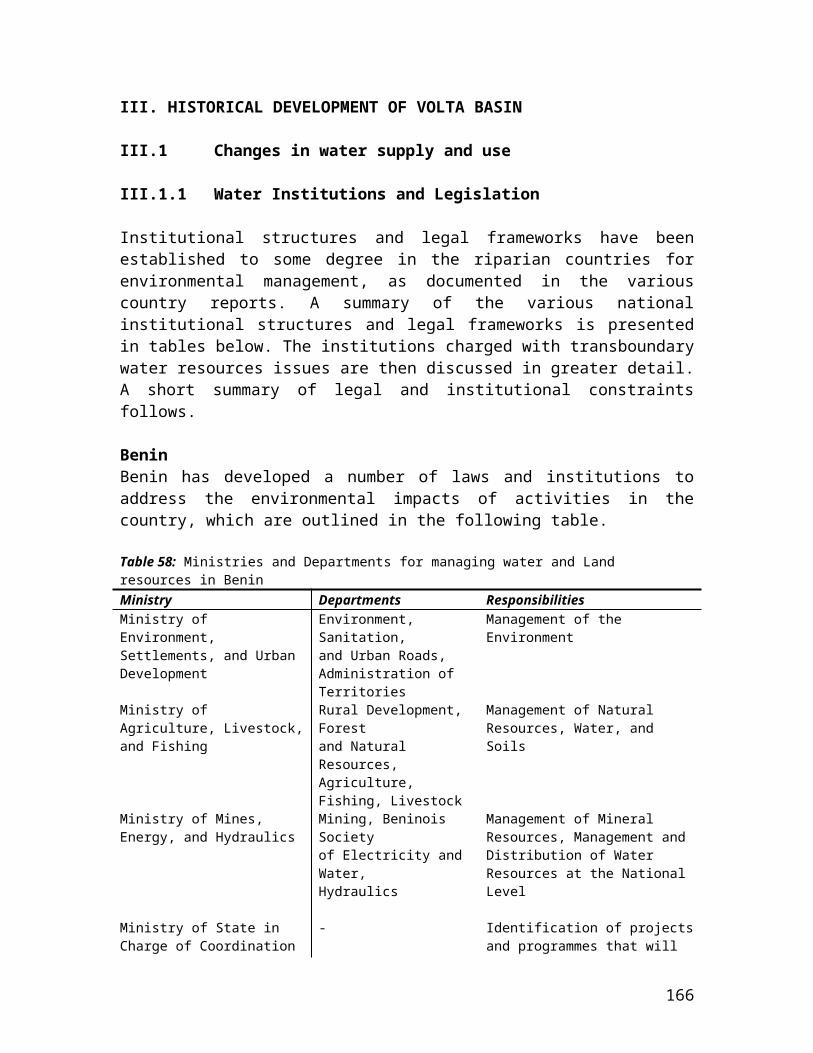
A.6.4 The Public Utilities Regulatory Commission
We shall discuss the nature of water supply to consumers in Ghana in later sections of this paper. When we do that, we shall see that among the major complaints of consumers, are the high tariffs they have to pay for water and the deteriorating quality of service they receive from GWSC. The PURC was set up in 1997 to regulate the tariffs charged by utilities and to protect both consumers and utility companies. It is supposed to provide guidelines on rates that can be charged by Utility companies and to approve rates chargeable by the Utility companies. It is supposed to monitor the standards and performance of utility companies (PURC Act 1997).
According to Part III of the Act, the PURC is supposed to set up a complaint procedure for consumers dissatisfied with the services or actions of a utility provider. The PURC has also just been set up and is now developing policies to fulfill its mandate.
B. Nature and Status of Customary Water Rights
Before the creation of GWCL and CWSA, customary law was the regime through which water was provided to people living in the rural areas of Ghana. Due to the fact that water has not been provided to all rural communities under the CWSP, customary water law continues to be important in enabling people to get water.
B.1 Description of Customary Water Laws
Traditionally, water is a treasured natural resource (see Ofori Boateng J. 1977). The major sources of water in the customary regime are wells, streams, rivulets, and rivers in that order of importance.
Most of the rural communities in the Assin Foso District have access to a surface water source. The desire to situate communities near water sources is commonsensical since water is essential for life. Human settlements are however situated quiet a distance from water sources. This prevents human settlements from suffering from floods during rainy seasons. Situating settlements away from water sources has its drawbacks. It can take some time to get water. However, this compels people to conserve water and it prevents the use of rivers as sewers.
In most communities, no institution or office has responsibility to provide water. This may be due to the fact that water is acquired solely from natural sources and available technology is not sophisticated enough to get deep ground water. During dry seasons, when very little water is available, it is the responsibility of individual households to look for water. Communities however have institutions to ensure that water is conserved and its quality is maintained.
Water in its visible form - as sea, rivers or lakes - cannot be privately owned. It is unclear whether it is public property. In some communities, surface water is public property. In
166

others, it belongs to the king. In reality the king holds the water in trust for his people. In other communities, water is said to be ‘ownerless’. Generally, a private person will never be allowed to purchase or own a surface source of water.
Within the customary regime, it is not easy to get access to ground water. Ground water is acquired through digging wells. It is therefore unclear whether underground water is considered public or private property. There are clearly public wells, when the community digs the well and uses it as its source of water. When a private person digs a well on his land, the water is likely to be considered as private property. In fact in most communities, people are encouraged to dig private wells in order to reduce the pressure on the community well during the dry season.
In rural Ghana digging a private well involves considerable expense. This can range between ¢250,000 and ¢400,000. This is far beyond the incomes of the average rural person. A person is allowed to charge members of the public who want to take water from his well. This can be at a commercial rate. The price of a bucket of water from such wells can range from between ¢10 to ¢ 40.
Generally no permit is required to dig a private or a public well. In small towns however, where sanitation has become a serious problem, one needs to acquire a permit from a health inspector in order to dig a well. This is to prevent the citing of wells near refuse dumps to prevent water contamination.
The chief, elders and priests control, manage and regulate the use of water sources. In many communities, the rules for collecting water are commonsensical rules. For example, one cannot use a dirty bucket to collect water. In others, especially where the water source is a river, the rules take on a religious character. For example, women are not allowed to collect water when they menstruate. Generally, there are particular days and months when no one can go into the river or the sea. Some of these rules are meant to protect water quality and prevent the catching of immature fish. Sanctions for breach of rules include slaughtering of sheep, the provision of schnapps or the payment of fines to the elders. Traditionally, water is used mainly for domestic purposes. Very little navigation is done on rivers and therefore the customary law of navigation is not well developed. Irrigation is also not a common form of farming technique (Mensah, 1999).
Water from traditional sources is usually contaminated and generally leads to diseases like guinea worm infestation, bilharzia, river blindness and cholera etc. Enforcement of customary law depends on the cultural habits of the locality. Generally enforcement is good if the community is homogeneous.
IV. 7 Urban Water Management
A. Access to clean Water in Urban Ghana
167

Most people in urban areas rely on piped-borne water supplied by GWCL. According to the Ghana Living Standards Survey Round 3 (GLSS 3) 1991/2, 100% of households in Accra and 99.3% in Kumasi had access to pipe borne water (Rakodi C., 1996). Access to individual piped water depends on the degree of area planning and on the extent of ones wealth (Rakodi C, 1996, p 17). In 1991, in the Accra Metropolitan Area 59% of households had an indoor piped supply connection. All wealthy households had an individual supply and less than a quarter of such people shared their pipe connections with other households. 85% of middle-income people and only 53% of low-income people had a private supply. Only 40% of middle-income people and 9% of low-income people had exclusive use of their taps. 12% and 23% of middle and low-income people respectively, shared their supplies with more than ten other households. Public standpipes are generally uncommon. Only 8% of households had access to them. 28% of people had no direct access to a tap. 5% of middle-income people and 34% of low-income households purchase water regularly.
Water is purchased from neighbours who have an in house connection. Although the time spent fetching water is half of what occurs in rural areas, households of Accra who do not have an on site connection spend about 8.4 hours per week on this task. As stated earlier on, under LI 1233, people have to apply to GWSC for an on site connection. The main constraint to getting a connection is the cost. In 1996, it cost about c 200,000 to get an on site connection. Consequently, there are several illegal connections.
Irregular supply and frequent shortages are well known in Ghana. Water does not usually flow during the day. It flows in the night. Residents have to leave their taps on in spite of the fact that when air passes through the taps, it causes the meter to read. People are then forced to pay huge bills even though the water has not been flowing. Sleep is usually disrupted for people who do not have an on site connection or have to share water with other residents. Typically, girls over 7 years and women are those who queue for water.Women spend about 18 minutes a day getting water, whilst it is 12 minutes for men. Boys between 7-19 spend about the same time as girls to fetch water. Older men rarely fetch water. In addition to the intermittent daily flows, water often flows only a few days week. In some areas, interruptions can last for months. Interruptions affect all areas, irrespective of socio-economic standing.
Households have developed various strategies to deal with water supply interruptions. 96% of households store water. They use various types of containers including Jerry cans, pig feet containers, overhead tanks and buckets etc. 50% of wealthy people, 16% of middle income people and 3% of low income people use overhead tanks. It is possible to buy water from GWSC tankers or from private suppliers. This solution is available to the few people with overhead tanks and it is very expensive.
Other solutions to frequent water shortages are the purchase of water from areas where water flows constantly. This results in women walking long distances for water. The potential hazard to girls who enter the homes of strangers is a source of worry to many
168
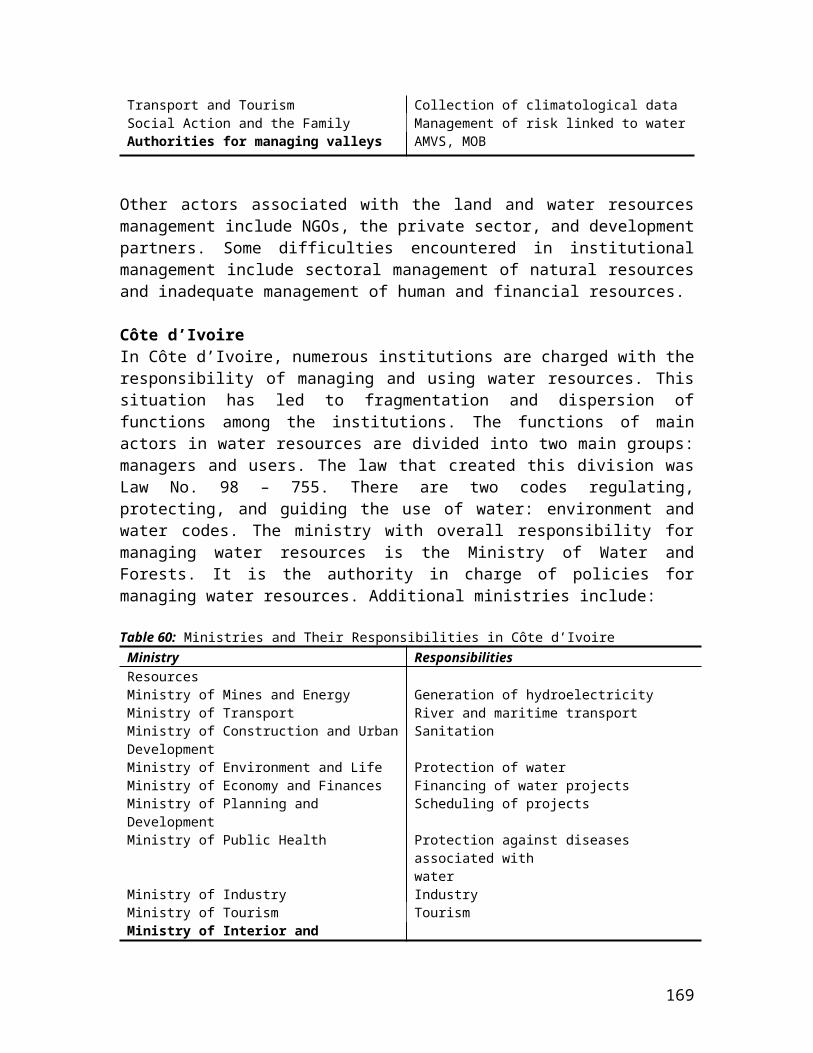
parents. Others use water from wells or collect stream water in rainy seasons. Some collect rainwater from roofs when it rains. Others recycle water within homes.
Storing water has important health implications. There is evidence of faecal contamination in some samples of tap water consumed. This is because connections are illegal or poorly fitted. Contamination of water as a result of in-house storage is also widespread. This is due to the fact that buckets used to store water are also used for other purposes. There is also irregular cleaning of storage containers. Failure to boil water and the frequent dipping of cups into water are other reasons for the contamination of water.
A.1 Problems of GWCL
The major problem facing the Corporation is that it is a public corporation that has been subject to the dictates of politicians. Consequently water tariffs have for long been kept low with the object of protecting consumers (Ghana’s Water Resources p45). Politicians have also used it as a source of patronage and public policy towards the Corporation has been geared towards satisfying political objectives instead of assisting the Corporation to be managed efficiently. It has therefore been extremely difficult for the Corporation to meet its operational and capital plans. The result has been low investment and a general breakdown of GWSC ‘s water delivery system.
There has been very little investment in equipment. In most regions billing is done manually. This creates opportunities for fraud and illegal use of Corporations funds. It is estimated that about 29% of the Corporation’s customers are not billed. About 50% of meters do not work and the rate of revenue collection is low. About 30% of the Corporation’s 207 systems are not operational and most of them have not been operational for more than a year. About 30% of the production systems are operating below capacity. By the year 2000, it is estimated that daily demand for water will be about 1,200 Ml/day. The Corporation’s production is about 500 Ml/day. The Corporation however has an estimated capacity of only 600 Ml/day. There is thus significant under capacity to meet demand. Very few of the Corporation’s production meters work. Consequently, its estimate of 43% of unaccounted for water is crude and is likely to be higher than is stated (Halcrow Consultancy Report, 1995, p 11-13).
A.2 Reform of Urban Water Sector
Government has been under pressure from donor agencies to reform water delivery in urban areas. This has resulted in the Halcrow Consultancy Report and the Berger Report. Until recently, the government was reluctant to privatise the whole urban water sector but was willing to commercialise certain operation including billings. It had also agreed to lease self-contained water systems from source to end user to private operators. Recently, however, there is evidence that under intense pressure from donors it has decided to privatise all utility companies including water.
The biggest problem facing these reforms is that there is very little debate about the reforms. Every step is shrouded in secrecy. Government, it seems is being forced to take
169

a direction that it does not approve of. The general public has been kept in the dark about the directions of the reforms and consequently, there is very little public support for these measures. Institutions that deal with the water sector are unsure of what to do. This is creating problems of institutional planning and co-ordination.
B. Access to clean Water in Rural Ghana
B.1 Community Water & Sanitation Programme (CWSP)-objectives
The CWSP assists communities to improve their capabilities to meet their demand for clean water. It ensures that there is a minimum basic service of water that is protected all year-round, of 20 litres per capita per day, within 500 meters for consumers living close to a water point. A water point must not serve more than 300 persons (CWSP Implementation Manual, 1996 p1).
The CWSP is a demand driven programme. Communities are expected to participate fully in the programme in order to sustain it. They are supposed to organise themselves by contributing financial and human resources to ensure the success of the programme. Consequently, only communities that are willing to contribute to part of the cost of providing the service (generally 5%) and who are ready to pay for the maintenance of the facilities provided, become part of the programme. Women, as the primary collectors and users of water, are given a central role in the design and management of water facilities. The private sector has the responsibility to design, construct, and maintain the facilities. NGOs play an important role by providing training in the management and repair of water facilities. The programme integrates health, sanitation, and hygiene education in order to maximise the benefits that can accrue under the programme. As we have already indicated, local government authorities are closely involved in the programme. They provide infrastructure and organise the institutions necessary for effective and efficient utilisation of water resources.
B.2 Access to Water under the CWSP
In most communities under the CWSP about 95% of people use the boreholes or hand dug wells provided under the programme. The other 5% use the traditional wells and the traditional sources of water. The water provided under the CWSP has to be paid for and the amount paid is determined by the WATSAN in consultation with the community. It ranges from c 10 to c 30 per bucket. The sale of water has been so successful that some communities have used monies from their water fund to embark on other development projects. No community has complained about a long interruption in their supply of water under the programme. When interruptions occur, it is due to the breakdown of a part. This is however quickly repaired because of the training given to women in repairing of facilities. Problems may occur in the future when spare parts are not distributed as part of the programme. Generally, women spend less than 15 minutes to fetch water.
170

Storage of water continues to be a big problem. Water is stored in barrels, buckets and open tanks and this can lead to water contamination. In fact while there has been a serious reduction in guinea worm infestation, there is still a problem with cholera and typhoid.
Another weakness of the CWSP is the weak institutional capacity of local governments. Local government has not shown the level of interest that was expected from it under programme. The creation of DWSTs has been extremely slow. This has affected the progress of the programme.
B.3 Assessment of the various Regimes
We now have to assess the various regimes for delivering water to people in Ghana. Do they take an entitlement view of water? Do they have mechanisms for alleviating poverty? How do they ensure that the environment is protected and water quality is maintained? Do they have a workable system of water conservation and what role is given to women in the management of water resources?
B.3.1 Assessing GWSC Performance
Before the 1990s, GWSC was basically a public corporation that was part of the public sector. Due to this role, it took an entitlement view of water. Service to most poor urban areas was free, whilst service for homes with on site connections was subsidised. This led to misuse of water and low cost recovery. With the advent of structural adjustment and the commercialisation of its services, GWSC is now taking a very commercial approach to the delivery of water. Tariffs have increased substantially over the last few years and most standpipes in poor urban areas are being discontinued. GWSC has employed vendors who control the few remaining standpipes. These vendors sell water to customers.
Presently, if one does not have the means to purchase water, one simply cannot get it legally. For those who have no access to GWSC vendors, they have to purchase water from private vendors who make huge profits from selling water. Since there are no mechanisms for providing water at reduced tariffs to the poor, there is clearly an anti-poverty alleviation dimension to present urban water policy. In fact access to water for the poor has been greatly reduced through the combination of the phasing out of public standpipes and increased water tariffs. GWSC argue that this is necessary in the short term to save the Corporation from collapse. After it has corrected its balance sheet and it has been able to attract investors, it would be able to provide a more reliable service and also provide a subsidy for the poor in urban areas. There may be a basis for these arguments. In the short term however, it is fair to say that urban water policy has not been in favour of the poor.
171
GWSC has also been unable to ensure water quality. This has been due in part to its lack of funds to meet its basic mandate. The second reason is even more fundamental. Ghana’s population has grown rapidly since independence. In the last 15 years, there has also been intensified economic activity nation wide. This has led to severe pressure on land. Haphazard urban development has contributed to poor land use. These issues affect the environment and water quality. Unfortunately, GWSC has no control over such events. These problems have made its ability to control water quality an impossible one. For the reasons stated above, GWSC has also been unable to play its role as a conservator of water. As we indicated earlier on, the Corporation claims that 43 % of its water is unaccounted for. However, conservation has not been a major concern in Ghana because of the myth of an abundance of water. As the population increases and demand for water grows, there will be the need to provide strong conservation measures to protect the country’s water resources. It is hoped that the Water Resources Commission and the Environmental Protection Agency that have just been set up, will combine effectively to deal with the environmental problems of water resource management.
In urban areas, the gender problem is not as acute as in rural areas. Still women without on site connections spend considerable time to get water. With increasing tariffs and with the closure of many standpipes, there is bound to be increased pressure on women. They may have to walk longer distances to get water. They will also have to spend a lot more time and more money to purchase water. Another important issue is access to water and sanitation for the urban poor. Our discussions suggest that they have little access to water. The service they get from GWSC is also extremely poor. No arrangements have been made to capture the particular concerns of this socio-economic group.
B.3.2 Assessing the CWSP
How does the CWSP fare according to the issues raised earlier on in the paper? It seems that the CWSP is moving away from an entitlement view of water. Unless a community is ready to pay its contribution for the water facility and is prepared to maintain it, it does not become part of the programme. Water from the facility is also sold to community members. Presently, there is no mechanism for allowing people who cannot afford to pay for water to get it for free.
The CWSA has an effective answer to this criticism. They claim that lessons from the past indicate that when facilities are provided for free, water and water facilities are misused. It is difficult to have an effective answer to CWSA position on the entitlement problem. However, there is no doubt that there are people in rural communities who cannot afford to pay for water. If mechanisms are not provided to get water to them at subsidised rates, they will continue to use the traditional sources of water and may acquire infectious diseases. When this occurs, it would undermine the whole programme. NGOs have also complained about the rigidity with which the CWSA insists on the satisfaction of the financial side of the programme. They argue that a community’s commitment to water and sanitation cannot be measured by the amount of money it can raise alone. Willingness to contribute in other ways like the provision of labour, etc ought
172

to be also used in assessing whether a community is committed to the programme or not. In fact, some NGOs claim that rigidity of the CWSA on the finance side, is preventing communities that are ready to ‘own’ their water facilities from getting access to water (Interview with Country Director of WaterAid).
Has the CWSP assisted in poverty alleviation? Formally, we shall state that the CWSA is a realistic programme. It allows communities to prove their commitment to the programme. In this sense it does not provide free access to water. However, the conditions that have to be fulfilled are not too stringent. Only extremely poor communities will find it difficult to meet these conditions. Substantively, there is evidence that the CWSP has greatly improved the conditions of life in rural communities. Communities under the CWSP have drastically reduced diseases like guinea worm infestation. The provision of water has also improved personal cleanliness and socio-economic life in these communities. Trained personnel like teachers are now willing to accept postings into these areas. There has been a marked improvement in school attendance by children (Ababio R. A., 'Rural Water and Sanitation: A Case Study of Eyisam, Abontsen and Ekumfi Dunkwa in the Mfantsiman District of the Central Region of Ghana', 1996).
Environmental protection and water conservation are however still major problems in communities. Communities make rules to protect the quality of water that comes from the water facility. For example, one cannot wash near the water point, or use a dirty receptacle to collect water. However, communities cannot handle the complex problems of water conservation and environmental protection. There is also a serious problem of low capacity of District Assemblies to protect the environment and safeguard water quality at local government level. They have neither the personnel, nor the funds, nor the equipment to handle these complex tasks. On the national scale water conservation and water quality protection have to be to be handled by institutions such as the Water Resources Commission and the Environmental Protection Agency.
The CWSP has made major achievements in solving the gender problem. Women are given prominent roles in the design and management of water facilities. They are generally responsible for repairing water facilities. Due to the fact that a water facility is not supposed to be more than 500 metres from the community, it drastically reduces the distance and the time that is required to get water.
B.3.3 Assessing the Customary Regime
As we have already indicated, there is no charge for collecting water from a customary water source. A person can take as much water as she can carry as long as she leaves enough for others. This is an entitlement view of water. This entitlement view is due partly to the fact that very little investment goes into collecting water from customary sources. But this is not the only reason. It is also due to the recognition that water is
173
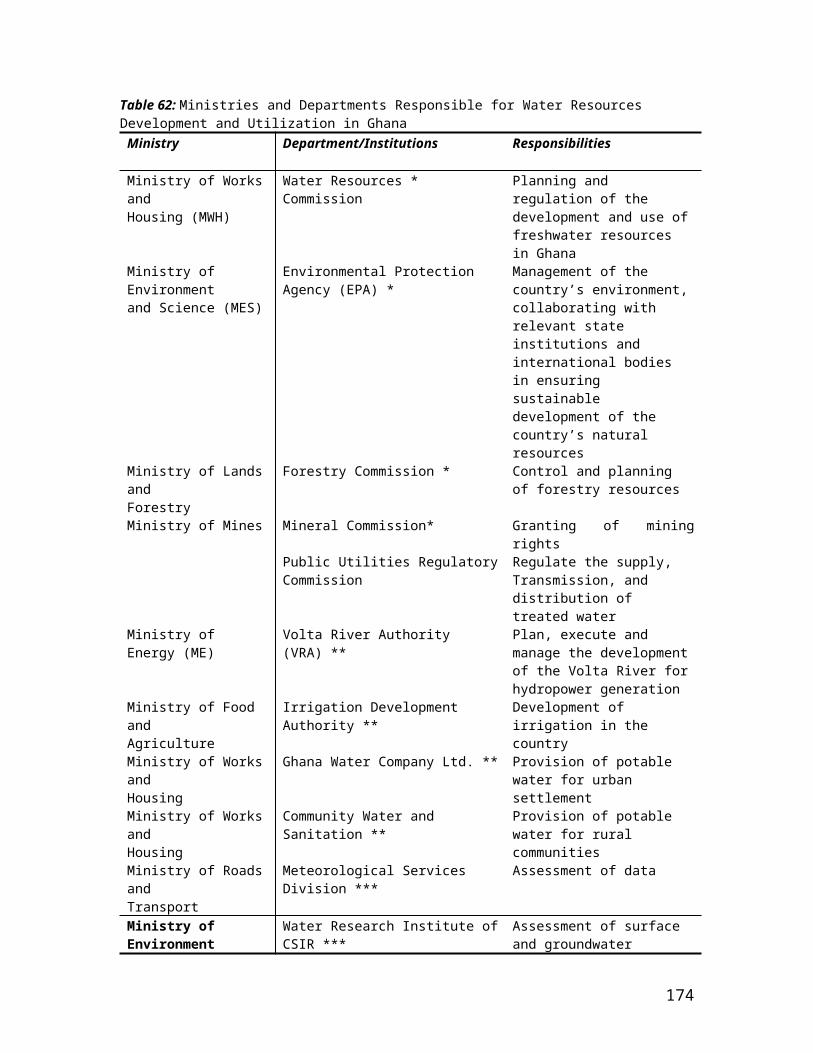
essential for human survival. And this can be seen in the different attitudes towards water during the dry and wet seasons.
In the wet season when water is plentiful, one can take as much as one wants. During the dry season when water is scarce, water is still not sold but there are limits on the amount that one can take. Customary law is however not rigid. It recognises that natural and public sources of water cannot satisfy a community’s demand for water. It allows private persons to invest in water. Such people can charge a fee for their investment. Presently, there is no regulation of water charges in the customary regime. Regulation may be unnecessary because there is not a great demand for private water. Private persons may also have recognized the special nature of water and are not charging excessively for its provision. We shall therefore state that the customary regime takes a realistic view of water. It allows water from public sources to be available to all without charge. It recognizes however that demand can outstrip supply and therefore allows private persons to invest in water and charge a fee for providing it to the market.
Does the customary regime solve the poverty problem? We shall argue that formally, it tries to solve the poverty problem. However, substantively, the customary regime actually aggravates poverty. Formally, water from natural and public sources is available free of charge. As long as water is available, a person is not denied access to it. The problem with the customary regime is that water from traditional sources is not available all year round. It is also the source of many diseases. It is also difficult to increase the supply of water to meet increased demand as populations grow. Sanitation under customary law is also seriously inadequate. Traditional methods of disposing waste cannot handle increased generation of waste. All these problems lead to diseases in rural areas and affect the economic lives of communities.
Within the traditional regime there are measures to control pollution. Human settlements are located away from water sources. This, as we have already indicated, is to prevent water sources from being used as sewers. There are days and months when one cannot go to the river. This is supposed to prevent the depletion of fish stock. One cannot use a dirty bucket to collect water. Women who menstruate cannot go into rivers etc. Within the limits of traditional knowledge, attempts are made to control pollution and maintain water quality.
How effective are these methods? The answer is that they are generally ineffective. With increasing population growth, many human settlements are now close to water sources. Poor land use methods have destroyed the environment. Mining and other industrial activity have generated waste that can be controlled under the customary regime. Generally as the population becomes educated and less homogeneous, taboos and religious sanctions that form the basis of the punishment under the customary regime are also ignored.
174

In the customary regime, water conservation has been unnecessary because of the low level of technology that is used to get water. Traditional wells do not go deep enough to deplete the water table. The natural water cycle regulates the amount of water available. However, with the availability of sophisticated technology that can take water from underground, dam rivers and divert watercourses, traditional conservation methods are also likely to become irrelevant.
How does customary law deal with the gender problem? One would be tempted to say that customary water law is anti-female. Many of the rules refer to women and try to restrict their ability to get water. A critical look at the situation suggests that this is not actually the case.
Many of the rules refer to women because they are the primary collectors of water. Many of the rules – for example, the fact that women cannot collect water when they are menstruating - are meant to protect water quality.
However, while one can argue that customary law is not anti-female, it is definitely not profemale. In spite of the important role women play in collecting water, the customary regime gives them no special role in its management. Nothing is done to relieve the pain associated with collecting water. Women must trek long distances to get water especially during dry seasons. This affects their economic activity and quality of life.
The major strength of customary law is its attitude towards the issue of entitlement. It is an important lesson that has to be learnt. If we can graft it on to the CWSP, it would significantly improve its ability to solve the problem of poverty alleviation. Generally, we shall conclude that customary water law is not an adequate regime for providing water to rural people in Ghana. It is unable to provide water all year round and is the source of diseases. Due to population growth and increased economic activity, its conservation and water quality control methods are inadequate. It does not also provide a special role for women in the management of water resources.
B.4 Impact of Water Law & Water Rights on Water Supply and Access
From the discussion, it is clear that the CWSP has been a relative success whilst the provision of water to urban areas has been a relative failure. The provision of water under the customary regime is also facing serious challenges. We now have to answer the following questions: ‘which conditions have enabled the CWSP to be a relative success?’ ‘Why has the provision of water and sanitation to urban areas and under customary law been relatively unsuccessful?’
B.4.1 Enabling Conditions
The major enabling condition for the success of the CWSP has been the general consensus among stakeholders that increasing the supply of water and sanitation to the poor is essential if there is to be an improvement in the standard of living of Ghanaians.
175

Effective policies and strategies are being developed to implement the programme of providing water and sanitation to as many communities as possible. There is constant inter-action between donors, the government and non-governmental organizations to review progress in the implementation of the CWSP.
As we have already indicated, the management of water resources is a multi-faceted enterprise and it involves a number of users and institutions. Until recently, different users and institutions pursued their mandates with very little co-ordination among themselves. There are now genuine attempts to integrate policies and strategies to ensure that the provision of rural water is managed in a multi-faceted manner. The CWSA consults with District Assemblies when it is developing its policies. Local communities are involved in the design and implementation of the programme. The private sector is given a prominent role to play in the supply of facilities. One of the major weaknesses of past water and sanitation programmes were attempts to separate water supply from sanitation issues. As part of the multi and inter-disciplinary approach to water management, water supply, sanitation and hygiene issues have been brought together to ensure that communities reap maximum health benefits from the programme.
An issue that has increased public awareness of the importance of water and sanitation issues and has encouraged the government to tackle the problem seriously is the democratisation process. Ghana has had two elections in the 1990s. The introduction of competitive politics has helped to improve the supply of water to rural areas in two ways. First, democracy has opened the political space and provided opportunities for civil society to contribute to debates on the future of the country. The press has highlighted the problem of access to water and sanitation to the poor in rural areas. Reports of outbreaks of guinea worm disease, cholera and typhoid fever are given prominence in the media. NGOs dealing with the provision of water are informing the public about the importance of the issue.
Democratisation has also led to the need for government to develop new constituencies to bolster its position in the electoral system. Structural adjustment has generally had a negative impact on urban dwellers. Government is now developing its support in the rural areas. This has meant satisfying rural needs and one of the most important needs of the rural populace is the provision of clean water. Government has consequently taken seriously the provision of potable water to as many rural communities as possible (see Herbst J., 1993, for a discussion of the Politics of Reform).
Community participation in the provision of water and sanitation has also greatly improved the sustainability of water supply programmes. This bottoms-up approach has a number of important dimensions. First it is a demand driven approach. Unless a community wants water and sanitation facilities, it does not become part of the programme. Communities must also be prepared to pay part of the cost of providing such facilities and they must be ready to pay for their maintenance. Water is sold to community members and the funds collected are used to maintain water and sanitation
176

facilities. Tariffs are determined by WATSANs in consultation with communities. Women as the primary collectors of water are given special roles in the management of water facilities. Community participation through the bottoms-up approach has been the greatest strength of the CWSP.
C. CUSTOMARY LAW AND TRADITIONAL WATER MANAGEMENT IN BURKINA FASO: EXAMPLE OF THE YATENGA PROVINCE
Humankind and the environment were closely linked in traditional societies. In order to have a good understanding of environmental management as a whole in the province (kingdom) of Yatenga, it is necessary to consider the governing system, traditional religion, the origins of the migrations and the history of the settlement of villages.1 - The governing system in the Yatenga kingdom
1.1- Traditional governing in the Yatenga kingdom
According to the Ramsa Naba (Minister of Youth and Protector of the kingdom's fetishes), the kingdom always had its own governing system, which is applied from the top to the bottom and from the bottom to the top. Such a system resisted the colonizer's attempts at reform, thanks to the great ascendancy of the Emperor over his faithful subjects, who in return must guarantee and defend the general interest of the kingdom. Thus the ambivalent application of the governing system justifies itself as follows:from top to bottom: decisions are taken by the Emperor and communicated to the Zack-Naba (head of the family),from bottom to top: the communities' concerns reach the Emperor through a hierarchic way. He will then gather the Ministers' Council to decide solutions or sanctions to be applied. The Ministers' Councils gather each Friday at the royal palace in the presence of the following ministers. The Baloum, in charge of the King's protocol;
The Toogo Naba, Minister of Communication;
The Ouidi Naba, Minister of the Education and Defense of the Princes;
The Rasam Naba, Minister of Youth and Protector of the fetishes, who is the central pillar of the system. He is considered as the second in hierarchy and is assisted by secretaries in charge of precise tasks.1.2- Division of powers within the kingdom
177

In traditional Mossi societies, the principle of division of powers has existed since time immemorial and is regulated by the custom, the supreme law. Everybody knows about the division of powers as nobody ignores the rules enacted by the custom. The principle is applied as follows:-- the Naba, leader of the village, has administrative power over the subjects, at the level of the region. He is the intermediary between the Emperor of Yatenga and his people on one side, and, on the other side, he acts as an administrative relay, communicating messages and collecting the poll tax.- the Tengsoaba, leader of the earth, he is the guardian of the customary law on the village land. He organizes and chairs the ritual ceremonies linked to the earth. When a death occurs, he chooses the burial place in consultation with the Council of Elders. He acts as an intermediary between the people and the deities to ask for the community's protection. In case of violation of the custom, sanctions are given to the guilty by the appropriate authorities (leader of the earth, Council of Elders) and expiatory and propitiatory sacrifices are undertaken in order to calm down the spirits- The Council of Elders acts as a consultative assembly to both authorities mentioned formerly; the opinion of the Council of Elders often influences the decisions of the Naba, leader of the village, and of the Tengsoaba, leader of the Earth. The Council of Elders is composed of two "Chambers"; the women and the men. 2.- Water in the traditional Moagha society of the Yatenga kingdom
2.1- Water as a universal myth
The water-life relationship is present in the founding myths of every culture. The Flood theme is prevalent in all three monotheistic religions, but, contrary to customary belief, did not necessarily originate in, and is certainly not confined to, the Judeo-Christian-Islamic tradition. It is also found in the Hindu "vedas", in the Inca stories, in all the myths of Mesopotamia ("the Earth between two floods") and in the animism of African societies. The founding myths influenced cultural behaviors and brought the notion of water as a sacred element. The cultural dimension is certainly indispensable and helps us understand the various conflicts emerging around water and, eventually, to find pacific and fair solutions for its sharing and use.2.2- Water and the animist religion
178

The traditional African societies were strongly animist before the implementation of Islam and Christianity. The animist religion is based on the natural elements, among which water. These traditional societies have their own vision of water, which differs from the western water vision (art. 5 of the customary law of Yatenga). Water is used with a religious sense by the customers in order to evoke the spirits of the dead so that they watch over the community.2.3- Water in the peoples' settlement
The lack of water in some regions drove the people to migrate in order to settle in cities where it is abundant. These last decades witnessed an important demographic upsurge on the riverbanks. The elders say that the search for water structured the peoples' settlement in the country. In the popular tales water often played a saving role in many societies. 2.4- Water as salvation for the migrant
Many societies show a grateful behavior with regards to the natural elements, especially water, which granted them with a significant protection at one point in their history. The stories recalling these events are not exclusive to the traditional African societies. They are universal, as the holy scriptures or the popular tales of the oral societies testify.The legend of Queen Abra Pokrou in the Gold Coast (now Ghana), in which water helped her to escape her enemies after her designation to take over from her late father.2.5- The village names inspired from water.
According to SANON D. B. and TRAORE Y., 1999, the environment used to be a cultural source of inspiration in traditional societies. A toponymic approach reveals that the village names refer either to a plant-like entity, or to a watercourse, or to a particular relief existing before the people's settlement. In some societies, which consider water as a symbol of peace and life, certain villages have been given a name referring to water. The example mentioned hereafter refers to rivers or villages of western Burkina Faso, although all the communities of the country share the same vision with regards to their environment.The "Zu" River has a mystic dimension, such as the bush or the mountain. It is considered as an expression of the world's dynamism, a strong, eventually suspicious, entity, hence the necessity for each
179

village to make a pact with the river whose water it uses daily. The river is considered as the vital stream linking the present and past generations that lived on it. Apart from their mystic connotations, the various toponymies also convey a meaning, a projection of society and dictate particular behaviors.Kofila: village of the Madeira ethnic group in the north of the capital of the Houet province (Bobo), also financial capital of Burkina Faso. This name comes from the local "Jula" dialect and is divided in two parts: "Ko", which means "river", and "Fila" which means "two". Effectively, the village is located at the confluence of two watercourses.These names of villages, places and regions represented projects of communities. As a matter of fact, the designated name acts as a call for the defense and improvement of water as a natural element and of the conditions of life. 2.6- A system of water property
As an element in the democratization process that occurred during the 1990s, most African countries have established a legislative system governing various branches of industry, including water. Burkina Faso elaborated and implemented a law concerning the Land and Property Reform (RÈforme agraire et fonciËre RAF). The 5th article of the RAF names the State as the owner of water. But, in reality, this statement remains only a simple claim, as a real juridical prerogative would not be accepted without great resistance by the customary water users. Effectively, what characterizes African water law is the existence, parallel to written laws, of a corpus of customary norms which originate largely prior to colonization. In a country where the majority of the population is illiterate, these norms tend to supplant the official written legislation in relation to the exploitation of the water resources by the local inhabitants. During our interviews, the customary leaders affirm that the State is powerless without those who know the true identity of the people. They therefore act as the intermediary between population and administration. According to various customary leaders, no serious study, with the ambition of creating acceptable juridical norms, could ignore the essential contribution of customary law. 2.7- Traditional water management: customary laws
In the traditional societies of Yatenga's kingdom in the northern part of Burkina Faso, environmental management is the responsibility of the leader of the earth (article 9, 10 of Yatenga's customary code), who can be assisted by the elders or any other person designed in that perspective, such as the Bouli Naba (customary leader in charge of water).
180

2.7.1- Prohibitions
According to the hierarchy of customary law, the prohibitions are above the totems, as they have a larger sphere of application. The prohibition represents what is not authorized by the community at the level of the village, thus what everybody forbids. Hence the following prohibitions can apply in a village and be severely sanctioned by the custom: Prohibition to sell water or refuse to let it be draw from one's own well.Prohibition to dirty the roundabouts of the wellProhibition to dig a well without the agreement of the relevant customary leaders.2.7.2- Totems
They have a sphere of application restricted to the large family. Thus an ancestor, walking in search of a shelter, was saved by quenching his thirst in such watercourse; he takes an oath about it, engaging his whole descent. This oath recommends that his descent watch-over the watercourse and carry-out sacrifices in order to thank the spirits of the place (according to the authors mentioned above).2.8- Gender and traditional water management
In traditional societies the customary leaders were responsible for the management of water. Now the State also designates technicians in the same perspective. The distribution of the work now determines the participation, by gender, in the traditional societies of the Yatenga province. The males in the traditional societies are in charge of the construction, maintenance and management of the work. During the work, the girls and women constitute a stimulation force and organize in this perspective festivities on the building site. They praise the work accomplished, particularly of the young people who do the hardest tasks. Moreover, they play a predominant role in the domestic and horticultural uses. In the traditional societies the gender approach existed under the form of complementarity between the sexes.2.9- The causes of failure of water conveyance projects
In traditional societies the approaches that do not involve the population are very likely to fail. The water management policy must take tradition into account in order to achieve a sustainable vision. The ecological NGO, Green Cross Burkina Faso, understood this when it promoted its hydraulic policy through revaluation of the traditional methods of water management. Several factors explain the causes of
181

failure of water conveyance projects: the influence of ecological factors (advance of the desert, drought), demographic pressure (increase in water demand, contamination of water), economic and political aggression (inclusion of the economic dimension in social relationships, territorial conflicts). The mastery of local knowledge in water management, and the understanding of the sources of conflicts are necessary for the elaboration of sustainable projects and would favour a partnership between traditional and modern water management.
182

List of References
ACOPS. WGPI (Working Group on Programme on Interventions): WGPI-I (2001): WGPI-II (2002)
ACOPS. WGPIA (Working Group on Integrated Problem Analysis): WGPIA-I (2000); WGPI-II (2001); WGPI-III (2001).
Acquah, B. K. P. (2002) “Investigation of Groundwater Availability in the Volta Basin of Ghana, Based on Hydrogeological Field Data and Geological Maps Using GIS.” Masters Thesis, Institute of Groundwater and Hydraulic Engineering, University of Stuttgart, Stuttgart.
Agodzo, S.K. 2003. Shallow well irrigation for shallot farming in the Keta Lagoon Area of Ghana. Journal of the Ghana Institution of Engineers. Volume 1, Number 1:pp1-6
Andah, A.I. 1993. Groundwater Utilization for small-scale Irrigation in the Accra Plains: Kponkpo and Ablekuma pilot schemes. Water Resources Research Institute (C.S.I.R). Accra, Ghana.
Andreini M., van de Geisen, N., van Edig, A., Fosu, M. and W. Andah, 2000. Volta Basin Water Balance. ZEF Discussion Papers on Development and Policy No. 21.
Andreini M., Vlek, P. D. Nick van de Giesen, 2002. Water sharing in the Volta basin. FRIEND 2002 – Regional Hydrology: Bridging the Gap between Research and practice. IAHS Publ. No. 274.
Andreini, M.; van de Giesen, N.; van Edig, A.; Fosu, M.; Andah, W. (2000) « Volta Basin Water Balance. » ZEF – Discussion Papers on Development Policy, No. 21, ZEF, Bonn.
Armah, A. K. and D. S. Amlao. 1998. Coastal Zone Profile of Ghana. Gulf of Guinea Large marine Ecosystem Project. Ministry of Environment, Science and Technology. Accra, Ghana.
Banoeng-Yakubo, B.; Skjernaa, L. (2000) “Applications of Remote Sensing and Geographical Information System to Hydrogeological Studies in the Upper West Region, Ghana.” In: Sililo et al. (Eds.), Groundwater: Past Achievements and Future Challenges, Balkema, Rotterdam.
BR5GM (1991) « Exploitation des Eaux Souterraines en Socle Cristallin et Valorisation Agricole. Pilote Expérimentale en Milieu Rural pour les Zones Soudano-Saheliennes. Synthèse des Etudes de la Phase II (Rapport Final). » BRGM, Orléans.
Bracken, P. and Mang, H.P. 2002. Sanitary systems in Ouagadougou, Burkina Faso: Current practices and future potential.
183

http://www.gtz.de/ecosan/download/PatrickBracken-traineereport.pdf)
Bromley, J.; Edmunds, W. M.; Fellmann, E. (1997) “Estimation of Rainfall Inputs and Direct Recharge to the Deep Unsaturated Zone of Southern Niger Using the Chloride Profile Method.” Journal of Hydrology, 188-189, 1-4, 139-154, Elsevier.
CIA (Central Intelligence Agency), 2004. The World Factbook—Mali. http://www.cia.gov/cia/publications/factbook/geos/ml.html
CIDA (1998) “Basic Human Needs Performance Review. From Service Delivery toward Governance for Sustainability Report of the Ghana Water Program – Evaluation Report.” CIDA, Quebec.
CONAGESE 10 BP 6486 Ouagadougou 10 – National Action Plan for the Fight Against Desertification, Burkina Faso – 1999.
Cornish, G.A. and Aidoo, J.B. 2000. Informal Irrigation in the Peri-urban zone of Kumasi, Ghana: Findings from an initial questionnaire survey. Report OD/TN 97. HR Wallingford, UK.
Cote d’Ivoire, 2001. Plan of Installation of the National Park of Comoe and of Development of its Periphery, 2002-2001.
Danielson, J. J. (1996) “Delineation of Drainage Basins from 1 km African Digital Elevation Data.” In: Pecora Thirteen, Human Interactions with the Environment – Perspectives from Space, Sioux Falls, South Dakota, August 20-22, 1996.
Dapaah-Siakwan, S.; Gyau-Boakye, P. (2000) “Hydrogeologic framework and borehole yields in Ghana.” Hydrogeology Journal, 8, 405-416.
Darko & Krasny, 2003
Deichmann, U. (1994) “A Medium Resolution Population Database for Africa, Database Documentation and Digital Database.” NCGIA, University of California, Santa Barbara. Through: UNEP/GRID at Sioux Falls. Data available from: http://grid2.cr.usgs.gov/datasets/datalist.php3.
Desconnets, J. C.; Taupin, J. D.; Lebel, T.; Leduc, C. (1997) “Hydrology of the HAPEX-Sahel Central Super-Site: surface water drainage and aquifer recharge through pool systems.” J. Hydrology, 188/189, 1-4, 155-178.
DGH (Direction Générale de l’Hydraulique) (1997) “Inventaire des Points d’Eau Modernes au Burkina Faso.” Ministère de l’Environnement et de l’Eau, Ouagadougou.
DGH (Direction Générale de l’Hydraulique) (2001) « Etat des Lieux des Ressources en Eaux du Burkina Faso et de leur Cadre de Gestion. » Ministère de l’Environnement et de l’Eau, Ouagadougou.
184

Dieng, B. ; Bazie, P. ; Schmitt, A. (1991) « Transfert d’Eau en Milieu Poreux non Sature. Recharge des Nappes en Climat Soudano-Sahelien. » In : Utilisation Rationnelle de l’Eau des Petits Bassins Versants en Zone Aride, 131-137, AUPELG-UREF, Pris.
Diluca, C. ; Muller, W. (1985) « Evaluation Hydrogéologique des Projets d’Hydraulique en Terrains Cristallins du Bouclier Ouest Africain. » BGR, Hannover.
Edmunds, W. M.; Fellmann, E.; Goni, I. B.; Prudhomme, C. (2002) “Spatial and Temporal Distribution of Groundwater Recharge in Northern Nigeria.” Hydrogeology Journal, 10, 205-215.
FAOSTAT, on-line database, FAO, Rome (http://www.fao.org/waicent/portal/statistics_en.asp).
GCLME. GEF: REGIONAL REPORT FROM THE STOCKTAKING WORKSHOP (May 2001) – PDF – B “Development of a Strategic Action Program (SAP) for the Guinea Current Large Marine Ecosystem (GCLME)”
GCLME. INTEGRATED ENVIRONMENTAL AND LIVING RESOURCES MANAGEMENT IN THE GULF OF GUINEA – The Large Marine Ecosystem Approach. Proceedings of the first Regional Symposium on the Gulf of Guinea Large Marine Ecosystem. GOG (1998).
GCLME. PERSPECTIVES IN INTEGRATED COASTAL AREAS MANAGEMENT IN THE GULF OF GUINEA. Gulf of Guinea Large Marine Ecosystem Project. GOG (1998).
GCLME. STATE OF THE COASTAL AND MARINE ENVIRONMENT OF THE GULF OF GUINEA. Gulf of Guinea Large Marine Ecosystem Project. GOG (1998)
GCLME. TOWARDS INTEGRATED COASTAL ZONE MANAGEMENT IN THE GULF OF GUINEA. Gulf of Guinea Large Marine Ecosystem Project. GOG (1998).
GCLME. UNIDO/UNDP/NOAA/UNEP Guinea Current Large Marine Ecosystem, Review of Existing Information and Recommendations on Transboundary Priority Issues: Regional Report for Stocktaking Meeting, May 2001.
Ghana Geological Survey (1964) “Mineral Resources Map – North-West part of the Wa sheet (1:250,000).” GSD, Accra.
Ghana Geological Survey (1973) “Geological Map – Southwestern part of the Wa sheet (1:250,000).” GSD, Accra.
Ghana Geological Survey (1991 a) “Geological Map – Northern part of Bole sheet (1:250,000).” GSD, Accra.
Ghana Geological Survey (1991 b) “Geological Map – Southern part of Bole sheet (1:250,000).” GSD, Accra.
185

Gleick, P. (1996) “Basic Water Requirements for Human Activities: Meeting basic needs.” Water International, 21, 83-92.
Gombert, P. (1998) “Synthèse sur la Géologie et l’Hydrogéologie de la Série Sédimentaire du Sud-Ouest du Burkina Faso, Programme RESO, Sous-Programme ‘Ressources en Eau’.” IWACO, Ouagadougou.
Gyau-Boakye and P. Tumbulto, 2000. The Volta Lake and declining rainfall and streamflow in the Volta River basin. Environment, Development, and Sustainability, 2, 1 – 10.
Gyau-Boakye, P and Dapaah-Siakwan, S. 1999. Groundwater: solution to Ghana’s rural water supply industry? Water Resources Research Institute
Gyau-Boakye, P. (2001) “Sources of Rural Water Supply in Ghana.” Water International, 26, 1, 96-104.
Gyau-Boakye, P.; Tumbulto, J> W> (2000) “The Volta Lake and Declining Rainfall and Streamflows in the Volta Basin.” Environment, Development and Sustainability, 2, 1-10.
http://www.cee.mtu.edu/peacecorps/documents_november_02/andrea_telmo.pdf
IGP (1999) “Promotion of District Capitals 1 (Ejura, Kintampo & Nkoranza) – Hydrogeological Investigations, Technical Report.” Ministry of Local Government and Rural Development, Accra.
Inter-African Committee for Hydraulic Studies (1986) “Explanatory Notice and Recommended Usage of the Map of Potential Groundwater Resources in Western and Central Africa 1: 5,000,000.” ICHS, BRGM, Orleans.
Kankam-Yeboah, K. 1987. Status Report on the pilot scheme in Groundwater Utilization in the Accra plains. WRRI-CSIR Accra, Ghana.
Kortatsi, B.K. (1984) “Groundwater Utilization in Ghana.” In: Future Groundwater Resources at Risk (Proceedings of the Helsinki Conference), IAHS Publication No. 222, IAHS Press, Wallingford.
Kortatsi, B.K. 1994. Groundwater utilization in Ghana, in: Future Groundwater Resources at Risk (Proceedings of the Helsinki Conference), IAHS Publication no. 222, 1994.
Kwei, C. A. (1997) “Evaluation of Groundwater Potential in the Northern Region of Ghana.” CIDA, Quebec.
Leduc, C.; Desconnets, J. C. (1994) “Variability of Groundwater Recharge in the Sahel: Piezometric Survey of the Continental Terminal Aquifer (Niger).” In: Future Groundwater Resources at Risk (Proceedings of the Helsinki Conference), IAHS
186
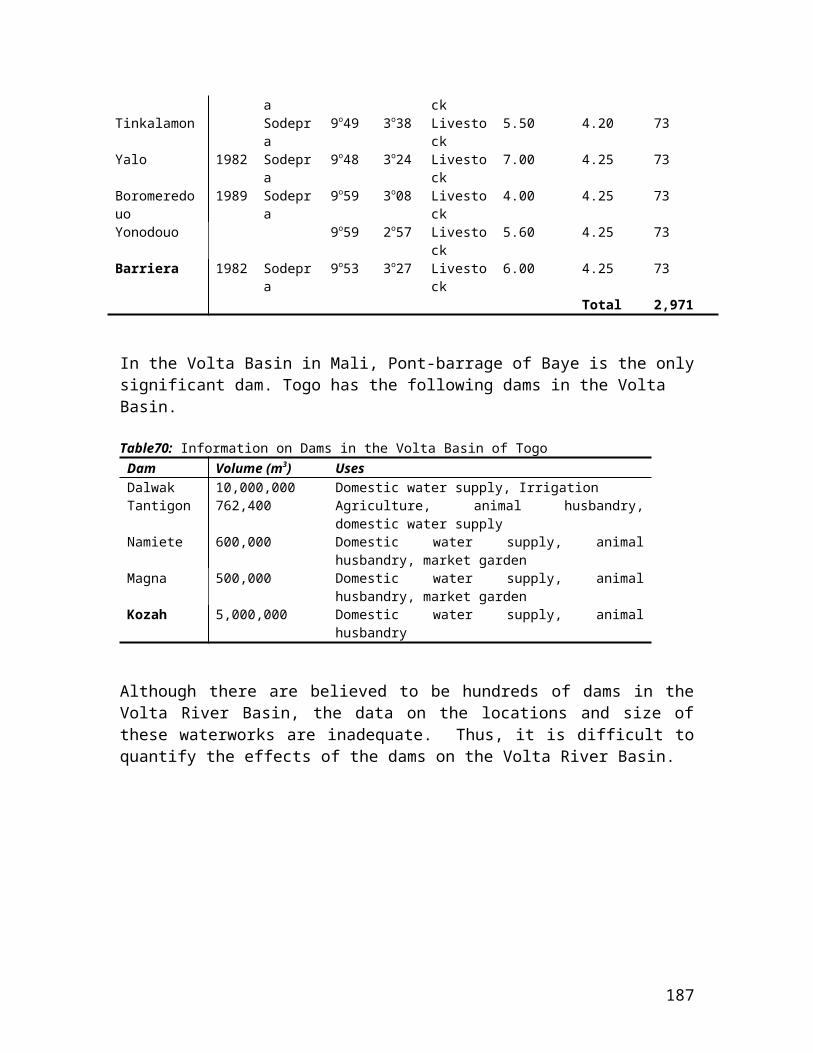
Publication No. 222, IAHS Press, Wallingford.
Mali, 1983. Inventory Project of Terrestrial Resources.
Milville, F. (1991) “Etude Hydrodynamique et Quantification de la Recharge des Aquifères en Climat Soudano-Sahelien: Application a un Bassin Expérimental au Burkina Faso.” In: Soil Water Balance in the Sudano-Sahelian Zone, IAHS Publication No. 199, Proceedings of an International Workshop, Niamey, 18-23.02.1991, IAHS Press, Wallingford.
Minister of Environment and Water (BURKINA FASO). – National Monograph on the Biological Diversity of Burkina Faso – Ouagadougou, February 1999.
Ministry of Works and Housing (1998) “Water Resources Management Study, Information ‘Building Block’ Study. Part II, Volta Basin System, Groundwater Resources.” Ministry of Works and Housing, Accra.
Ministry of Works and Housing (2001) “2000 Population & Housing Census – Summary Report on Final Results.” Ministry of Works and Housing, Accra.
Ministry of Works and Housing. 1998. Ghana’s Water Resources: Management Challenges and Opportunities. Water Resources Management Study.
Minor, T. B., Carter, J. A., Chesley, M. M., Knowles, R. B. (1994) “An Integrated Approach to Groundwater Exploration in Developing Countries Using GIS and Remote Sensing”,ASPRS/ACSM, http://www.odyssey.maine.edu/gisweb/spatdb/acsm/ac94048.html
Moniod, F., B. Pouyaud, and P. Sechet, 1977. Le Bassin du Fleuve Volta. Monogaphies Hydrologiques Orstom, No. 5. Paris.
Nathan Consortium, 1970. Framework for River Basin Planning. Ghana Sector Studies. Interim Report for Ministry of Finance and Economic Planning.
Nathan Consortium, 1970. Framework for River Basin Planning. Ghana Sector Studies. Interim Report for Ministry of Finance and Economic Planning.
N'Djim, H and Doumbia, B. 1998. Case study: Mali Population and water issues. In: Alex B. Sherbinin and Victoria Dompka (Eds.). Water and Population Dynamics: Case studies and policy implications. http://www.aaas.org/international/ehn/waterpop/mali.htm
New, M., Hulme, M. and Jones, P. D. (1999) “Representing Twentieth Century Space-Time Climate Variability. Part 1: Development of a 1961-90 Mean Monthly Terrestrial Climatology.” J. Climate 12, 829-856 (dataset available through the IPCC DDC).
Nicholson, S. E., 1983. Sub-Saharan rainfall in the years 1976 – 80: Evidence of continued drought. Monthly Weather Review. III. 1646 – 1654.
187

Nicholson, S.E., 1983. Sub-Saharan rainfall in the years 1976 – 80: Evidence of continued drought. Monthly Weather Review. III. 1646 – 1654.
ONEA (1999) « Rapport Technique d’Exploitation, Exercice 1998. » Office National de l’Eau et de l’Assenissement, Ouagadougou.
Opoku-Ankomah, Y., 1998. Volta Basin System Surface Water Resources in Water Resources Management Study. Information Building Block. Part II, Vol. 2. Ministry of Works and Housing. Accra. Ghana.
Opoku-Ankomah, Y., 2000. Impacts of Potential Climate Change on River Discharge in Climate Change Vulnerability and Adaptation Assessment on Water Resources of Ghana. Water Research Institute (CSIR), Accra. Ghana.
Taylor, K. C., Minor, T. B., Chesley, M. M., and Matanawi, K. (1999) “Cost effectiveness of well site selection methods in a fractured aquifer.” Ground Water 37/2, 271-274.
Telmo, A. 2002. A water Supply and Sanitation Study of the Village of Gouansolo in Mali, West Africa. MSc Report. Michigan Technological University, USA.
Thierry, D. (1990) “Analysis of Long Duration Piezometric Records from Burkina Faso to Determine Aquifer Recharge.” In: D. N. Lerner, A. S. Issar, I. Simmers; Groundwater Recharge – A Guide to Understanding and Estimating Natural Recharge; International Contributions to Hydrogeology, &, International Association of Hydrogeologists. Heise, Hannover.
UNEP, 1999. Regional Seas Reports and Studies No. 171, “Overview of Land-based Sources and Activities Affecting the Marine, Coastal and Associated Freshwater Environment in the West and Central African Region.”
UNEP, 2001. Benin Country Report for the Integrated Management of the Volta River Basin Project, Accra.
UNEP, 2001. Burkina Faso Country Report for the Integrated Management of the Volta River Basin Project, Accra.
UNEP, 2001. Cote d’Ivoire Country Report for the Integrated Management of the Volta River Basin Project, Accra.
UNEP, 2001. Ghana Country Report for the Integrated Management of the Volta River Basin Project, Accra.
UNEP, 2001. Mali Country Report for the Integrated Management of the Volta River Basin Project, Accra.
UNEP, 2001. Presentations on other Initiatives. First Regional Meeting of the National Coordinators. Integrated Management of the Volta River Basin, PDF B. Accra, Ghana,
188

June 5 – 8.
UNEP, 2001. Proceedings of the first Steering Committee Meeting. Integrated Management of the Volta River Basin. Accra, Ghana, June 8, 2001.
UNEP, 2001. Proceedings of the Second Steering Committee Meeting. Integrated Management of the Volta river Basin. Accra, Ghana, November 30.
UNEP, 2001. Report of the first Regional Meeting of the National Coordinators for the Preparatory Process of a full GEF Project Proposal, Accra, Ghana, June 5 – 8.
UNEP, 2001. Report on the Second Regional Meeting of the National Coordinators. Integrated management of the Volta River Basin, PDF B. Accra, Ghana, November 27 – 30.
UNEP, 2001. Some Technical Information and country Reports, Integrated Management of the Volta River Basin, PDF B. Accra, Ghana, June, 5 – 8.
UNEP, 2001. Some technical Information. Second Regional Meeting of the National Coordinators. Integrated Management of the Volta River Basin, PDF B. Accra, Ghana November 27 – 30.
UNEP, 2001. Togo Country Report for the Integrated Management of the Volta River Basin Project, Accra.
UNEP/GEF/VOLTA/SCM.1/1, 2001. Proceedings of the First Steering Committee meeting. Accra.
UNEP/GEF/VOLTA/SCM.1/1, 2001. Report of the First Regional Meeting of the National Coordinators for the preparatory process of a full GEF project proposal. Accra.
UNEP/GEF/VOLTA/SCM.2/1, 2001. Proceedings of the Second Steering Committee meeting. Accra.
UNEP/GEF/VOLTA/SCM.2/1, 2001. Report of the Second Regional Meeting of the National Coordinators. Accra.
Wardrop & Associates Ltd. (1977) “CIDA Ghana Upper Region Water Supply Project, Phase 1, Hydrogeological Report Based on 1460 Well Supplies.” CIDA, Quebec.
Wardrop Engineering (1987) “Report on Shorting of Wells in the Upper Regions of Ghana.” Unpublished report.
Water Resources Management Study (WARM), 1997. Information Building Block, Part III, Vol. 1.
World Bank. World Development Report 2000/2001.
WRI-Water Resources Research Institute / DANIDA (1993) “Rural Drinking Water
189

Supply and Sanitation Project in the Volta Region – Final Report on the Inventory and Assessment of Potential for Hand Dug Wells in the Volta Region, Vol I – Main Report.” WRI, Accra.
190