the lunar mars life - nasa · national aeronautics and space administration the lunar mars life...
TRANSCRIPT

National Aeronautics and Space Administration
The Lunar Mars LifeThe Lunar Mars Life Support Test
P j tProject
Daniel J. Barta, Ph.D.Manager, Next Generation Life Support ProjectNASA Johnson Space Center, Houston, TX
26 May 201626 May 2016
https://ntrs.nasa.gov/search.jsp?R=20160006345 2018-06-09T06:04:28+00:00Z

BackgroundNASA’s Large Scale Bioregenerative Life Support Tests
KSC’s Biomass Production Chamber• Large-scale closed crop testing• Control system development• Evaluation of robotic arm (Florida State)• Wastewater processing by crops• Trace gas evolution & microbial ecology
JSC’s Large Scale Human-In-The Loop TestingThe-Loop Testing•Large-scale crop testing•Human test subjects•Closed atmosphere•Closed atmosphere• Integration of physicochemical and biological technologies
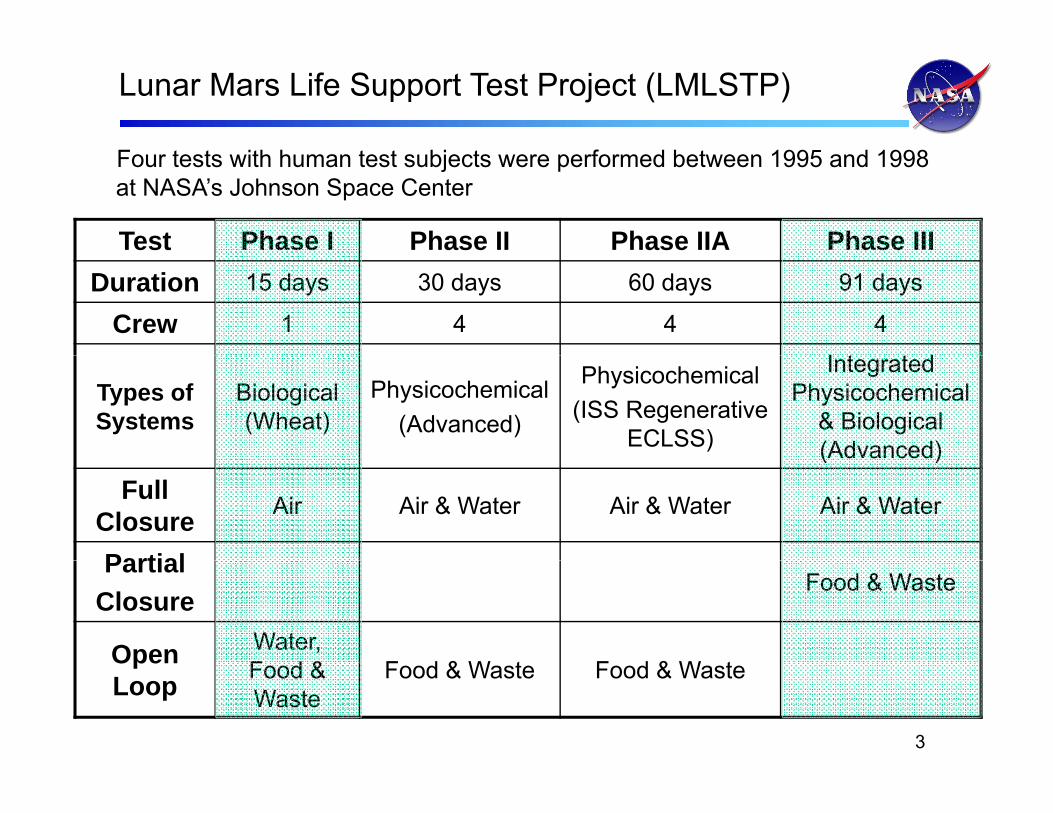
Lunar Mars Life Support Test Project (LMLSTP)
F t t ith h t t bj t f d b t 1995 d 1998
Test Phase I Phase II Phase IIA Phase III
Four tests with human test subjects were performed between 1995 and 1998 at NASA’s Johnson Space Center
Duration 15 days 30 days 60 days 91 days
Crew 1 4 4 4
I t t dTypes of Systems
Biological (Wheat)
Physicochemical(Advanced)
Physicochemical(ISS Regenerative
ECLSS)
Integrated Physicochemical
& Biological (Advanced)( d a ced)
Full Closure Air Air & Water Air & Water Air & Water
PartialPartialClosure
Food & Waste
Open Water, F d & F d & W t F d & W t
3
Open Loop Food &
WasteFood & Waste Food & Waste

Lunar Mars Life Support Test ProjectPhase I: 15-day, 1-Person Test
T t F ilitCREW CABIN GROWTH CHAMBERTest Facility • 2.7 m wide by 2.4 m tall atmospherically sealed with 2 compartments – 19.2 m3 (crew
(11.2 m2 growing area)
CO2O2 CO2 O2 CO2 CO2
p (cabin) & 27 m3 (growth chamber). • Growth chamber section outfitted with a hydroponic
2
O2 Concentrator
O2
outfitted with a hydroponic growing system for wheat. • Leak rate <2% volume per day
O2Net Photosynthesis (PS n)Respiration

LMLSTP Phase I: 15-day, 1-Person TestExpected rate of photosynthesis of a wheat crop
n
70
80
1 61.82.0
ty per d
ay
ssim
ilatio
n
Cultivar: Yecora RojoGrowing Area 11.2 m2
PPF 1500 2 1
Crop Carbon Dioxide
Assimilation
50
60
1.21.41.6
2 /hr)
on C
apac
itqu
ival
ents
Dio
xide
As PPF: 1500 m-2 s-1
Photoperiod: 24 hrAssimilation
30
40
0.60.81.0
ms/
11.2
m2
evita
lizat
iota
bolic
Eq
s C
arbo
n D
Human Daily Requirement for Carbon Dioxide Removal
0
10
20
0 00.20.4
(gra
m
Air
Re
Hum
an m
e
ynth
esis
as 15-Day Test
656055504540353025201510500 0.0
Days After Seeding
H
p P
hoto
sy
The growth chamber was expected to exceed the carbon dioxide removal it d d ti i t f d i th
5
Cro capacity and oxygen production requirement for one person during the
15 day period selected for the test (shaded).
Curve derived from Bugbee and Salisbury “Exploring the Limits of Crop Productivity”

LMLSTP Phase I: 15-day, 1-Person TestControl of Atmospheric Composition
Th th d f t lli t h i CO d O d t t dThree methods for controlling atmospheric CO2 and O2 were demonstrated. Physicochemical (P/C) systems were used to correct for imbalances between crew respiration and crop photosynthesis (PSn) was regulated directly.
Method of Control
Integrated P/C & Biological
Environmental Regulation of PSn
Environmental Regulation of PSn
Days of Test 1-6 7-12 13-15y
Photosynthesis Maximum Limited by Light Intensity
Limited by CO2Availability
D i ti P/C Systems Crop CO2 Assimilation Matched to Crew Description yCorrect Imbalance
p 2CO2 Output Respiration
Photosynthetic Photon Flux Fixed Intensity
Intensity AdjustedContinuously to Fixed Intensity
(Light Level) Maintain Cabin [CO2]Supplemental CO2 Injection
Inject to maintain cabin [CO2]
Contingency Only
6
P/C O2 Scrubber Remove O2 to maintain cabin [O2]
Contingency Only

Demonstrated three control strategies
LMLSTP Phase I: 15-day, 1-Person TestControl of Atmospheric Composition
Demonstrated three control strategies1. Full light, CO2 injected to maintain [CO2] setpoint2. Light dimmed to maintain [CO2] setpoint3 No automated control; light at intermediate3. No automated control; light at intermediate
setpoint; CO2 limited to crew member respiration
90
100
) Exercise
40
50
60
70
80
90
Car
bon
Dio
xide
(g/h
r Exercise
Activity Level when Awake
2422201816141210864200
10
20
30
Hours
Res
pire
d C
Sleep
Hours
Test Subject Metabolic Profile

LMLSTP Phase I Test ResultsDaily Removal of Carbon Dioxide from Cabin Atmosphere
Daily removal of atmospheric carbon dioxide by the wheat crop over its life cycle
2.0
2.5
Test Subject Respiration
mila
tion Source of Carbon Dioxide
1.5
Supplemental CO2
xide
Ass
ims
(kg/
day)
1.0
arbo
n D
iox
by P
lant
s
0.0
0.5Ca
8
6 8 10 12 14 16 18 20 22 24 26 28 30 32 34 36 38 40 42 44 46 48 50 52 54 56 58 60 62 64 66 68
Days from seeding

LMLSTP Phase I Test Results Oxygen Concentration in the Cabin Atmosphere
• During the first control period, O2 production by the wheat exceeded the crew member’s respiration requirement. Physicochemical (P/C) systems were used to remove excess O2 and maintained
i b l i i l l lconcentrations below a critical level.• During the 2nd and 3rd control periods, net photosynthesis (PSn) was matched to the crew member’s CO2 output and cabin [O2] slowly fell.
22
ion
(%)
Net Photosynthetic Rate Matchedto Crew Respiration
(carbon dioxide removal requirement)
Maximum Rate of PSn(human requirements
were exceeded)
21
once
ntra
t (carbon dioxide removal requirement)were exceeded)
20
xyge
n C
o
90 1 2 3 4 5 6 7 8 9 10 11 12 13 14 15
Day of Human Test
Ox

LMLSTP Phase I Test Results Ethylene Concentration in the Cabin Atmosphere
10

LMLSTP Phase I Test Results Evapotranspiration
35
40
25
30
35
m-2
d-1)
15-dayHumanTest
15
20
25
pira
tion
(L Test
5
10
15
Side ASide Bva
potra
nsp
70656055504540353025201510500
5 Side B
Ev
11
Days from seeding

LMLSTP Phase III: Overview
4 b f 91 d• 4 crew members for 91 days• Demonstrated an integration of advanced regenerative biological and physicochemical (P/C) technologies for life support(P/C) technologies for life support.
• Two chamber facilities were interconnected• Air revitalization System
– Higher plants compliment P/C systems• Water Recovery System
– Microbial cell bioreactors were used for the primary treatment step
• Food System– The stored food system was supplemented with wheat grain for bread and fresh lettucefor bread and fresh lettuce grown in situ
• Waste Management System (Demonstrations)
I i i f h f
12
– Incineration of human feces– Biodegradation of plant inedible materials

Lunar Mars Life Support Test ProjectPhase III, 4-person, 91-day Test
4BMSCHx
Lunar Heat Pump
ChilledWater
CO2Ai
Growth ChamberLife Support Systems Integration Facility
4BMS
CO2Storage
Water SaveCO2 Removal
CHx
Air CO2
CO2CH4Air
CO2
CO2
CO2Bottles
HydroponicSystem
r Com
p
CO2
PotableH2O
CRS
H20
CO2 Removal
O2H2O
H2 H2
Bottles
H2OAir
OxygenConcentratorAir
y
CHxCondensate
Air
O2O2Bottles
Excess DS
OGS
Incinerator
H2O
O2
O2TCCSGermination
Air
CondensateManualTransfer
Donor Urine
Bioreactor Vent
H2O
Salad
I H2O
Supply
Wheat Manual Transfer
VCD VA BackupWasteTank
UrinePretreat
PWS
IncineratorTransfer
Feces Manual Transfer
Backup Urine
IncineratorCondensate
Machine
DI H2OSupply
VRA
MF
a l Mili-Q
PWS
Air Evap
Potable H2OWater Manual Transfer
Urin
e
Was
te W
aterRecovered Water M
CV
& Filter VRA
Feed
13
BioFeed
ICB
ROAm
mon
iaR
emov
a Mili QTFBROProd
BioProd
Waste Water
RecyclePost Process
Bio Air

LMLSTP Phase III: Growth Chamber ConfigurationThe 11 2 m2 growth chamber was divided into 2 sides A and B each with aThe 11.2 m2 growth chamber was divided into 2 sides, A and B, each with a separate hydroponic system.• Side A: standard hydroponic nutrient solution formula• Side B: nutrients derived from inedible biomass Each side had 4 growing zones. After the chamber was fully planted, wheat was harvested and re-planted in a staged, serial fashion, in increments of ¼ of the planted area, approximately every 20 days.
A 1 B 3
G r o w in g Z o n eP a ir s
A 1A 3 B 1
B 3
A 2 A 4 B 2 B 4
S t a n d a rdN u t r ie n t S a l t s
R e c y c l e dN u t r ie n t S a l t s
S o u r c e o f S a l t s f o rH y d r o p o n i c S y s t e m

LMLSTP Phase III: Predicted atmosphere revitalization with batch cropping
1 5
2
2.5
izat
ion
Day
) A1B3A2B4A3B1
Phase I Test
0.5
1
1.5
Air
Rev
ital
(PE
per D A3B1
A4B2Total
00 25 50 75 100 125 150 175 200 225
Day of Test
A
A4B2A3B1A2B4
838383
838383
Atmosphere revitalization predicted from CO2 assimilation from “Apogee” Wheat
A2B4A1B3
8383
8383
grown at a PAR level of 1500 m-2 s-1 and a 24 hr photoperiod, given that all four quarters of the growth chamber were planted and harvested sequentially at the same time.

LMLSTP Phase III: Predicted atmosphere revitalization with staged cropping
1.5
2
zatio
n ay
)A1B3A2B4A3B1
0.5
1
Air
Rev
italiz
(PE
per D
A3B1A4B2Total
00 25 50 75 100 125 150 175 200
Day of Test
A
A4B2A3B1
1838
8383
8383
A2B4A1B3
5882
838383
Atmosphere revitalization predicted from CO2 assimilation from “Apogee” Wheat grown at a PAR level of 1500 m-2 s-1 and a 24 hr photoperiod

LMLSTP Phase III: Waste Management System Demonstrations
Bi l i l D d ti f I diblBiological Degradation of Inedible Biomass and Recovery of Nutrient Salts
• ½ of the wheat’s inedible biomass was mineralized using a stirred tank aerobicmineralized using a stirred tank aerobic bioreactor.
• Recovered nutrient salts were returned to the plant growth systems. p g y
• Average degradation of total solids: 45% ( ≈ 26 kg biomass was treated)
• Average salt recovery: 80%Average salt recovery: 80%.
Incineration of Human Feces and Recovery of Carbon DioxideRecovery of Carbon Dioxide
• Human feces (8.2 kg total) were incinerated in a fluidized bed incinerator.
• Carbon dioxide exhaust was injected• Carbon dioxide exhaust was injected into the wheat chamber after treatment for trace contaminants

LMLSTP Phase III Results: Actual Air Revitalization (CO2 Removal) vs Predicted
2
11.21.41.61.8
2vi
taliz
atio
nO
2pe
r Day
)Predicted
Actual
00.20.40.60.8
1
Air
Rev
(kg
CO
00 25 50 75 100 125 150 175 200 225
Day of test
Actual Planting and Harvesting
Schedule Performed
Test Deviations & Anomolies• To reduce test costs, the last quarter of chamber (A2B4) was not replanted• Crop nutrient management was inadequate
– the first crops planted took up excessive amounts of K & P– the first crops planted took up excessive amounts of K & P– this resulted in nutrient deficiency stress in later crops, with secondary affects on
growth, yield and resistance to disease organisms– an opportunistic Fusarium infection was observed in stressed plants

LMLSTP Phase III Results: Wheat Yield
Yield By Staged CropYield By Staged Crop
1 2
1 4
1 6
(kg)
G ra inIn e d ib le
4
6
8
1 0
ry B
iom
ass
0
2
4
23/9
7
23/9
7
23/9
7
23/9
7
/7/9
7
27/9
7
16/9
7
/2/9
7
/7/9
7
21/9
7
Dr
1 8 8 08 18 28 63 97 87 95 83 8
Mean Grain YieldYield By Nutrient Source
7/2
7/2
7/2
7/2 8 8/2
9/1
10 10 10/2
D a te S e e d e dW h ite n u m b e rs in b a rs : A g e a t h a rv e s t
Mean Grain Yield(kg) (kg m-2) Harvest Index
Side A (Pure Salts) 10.48 1.87 36.5Side B (Biologically Recovered Salts) 11.4 2.03 38.8
Yield By Nutrient Source
Total Chamber 21.88 1.95 37.7
Harvested grain was introduced into the Human Chamber to make bread. Fresh bread was baked every 5 days.

LMLSTP Phase III Results: Lettuce Production System
• Lettuce was grown in a small growth chamber located within the crew living space.
• The chamber contained a 0.22 m2
growing area illuminated with light emitting diodes (LEDs) providing 189 mol s-1 m-2 photosynthetic photon fluxmol s 1 m 2 photosynthetic photon flux.
• Sequentially planted every 11 days, with 8 harvests during the 91 day-test, 4 plants per harvestplants per harvest
• Average shoot fresh mass per plant was 157 g (5.5 oz) at an average of 31.5 days from seedingdays from seeding• Average Harvest Index
69% Amount Consumed/Total83% Shoot/Total83% Shoot/Total
• Average daily rate of make-up water use was 3.18 L m-2 d-1 for 64.5 total liters

Prime Farmland?