the making of tpc-ds meikel poess oracle corporation raghunath othayoth nambiar hewlett-packard...
TRANSCRIPT
The Making of TPC-DS
Meikel PoessOracle Corporation
Raghunath Othayoth Nambiar
Hewlett-Packard Company
August 31, 2006 32nd International Conference on Very Large Data Bases 2
Agenda
1. Industry standard benchmark development
2. Limitations of TPC-H
3. Key elements of TPC-DS
4. Current state of the specification
5. Q & A
August 31, 2006 32nd International Conference on Very Large Data Bases 3
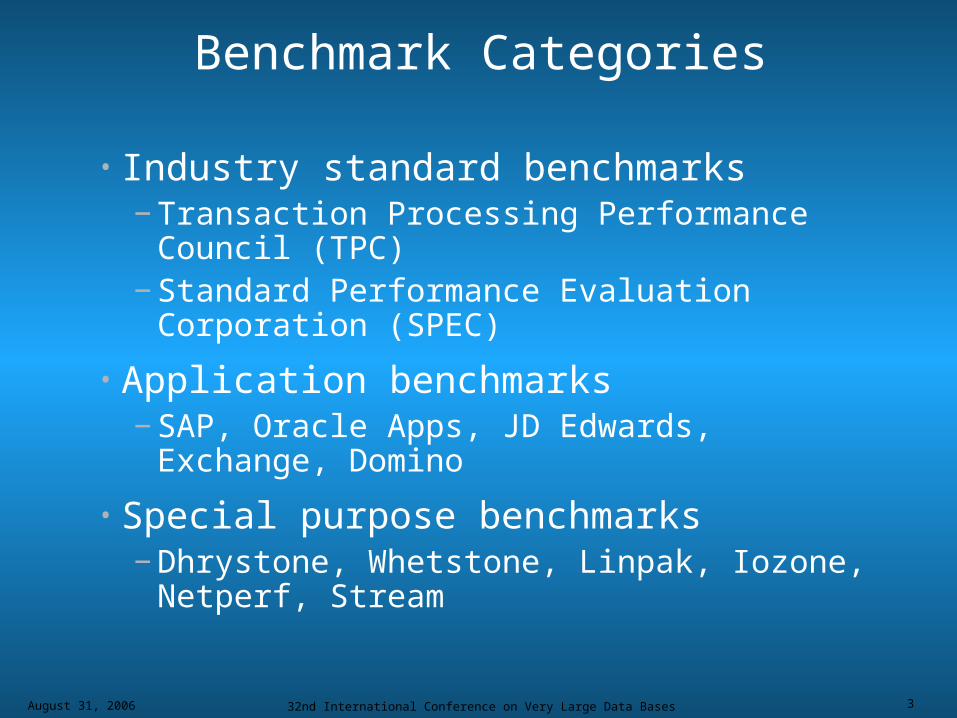
Benchmark Categories
• Industry standard benchmarks− Transaction Processing Performance
Council (TPC)− Standard Performance Evaluation
Corporation (SPEC)
• Application benchmarks − SAP, Oracle Apps, JD Edwards, Exchange,
Domino
• Special purpose benchmarks− Dhrystone, Whetstone, Linpak, Iozone,
Netperf, Stream
August 31, 2006 32nd International Conference on Very Large Data Bases 4
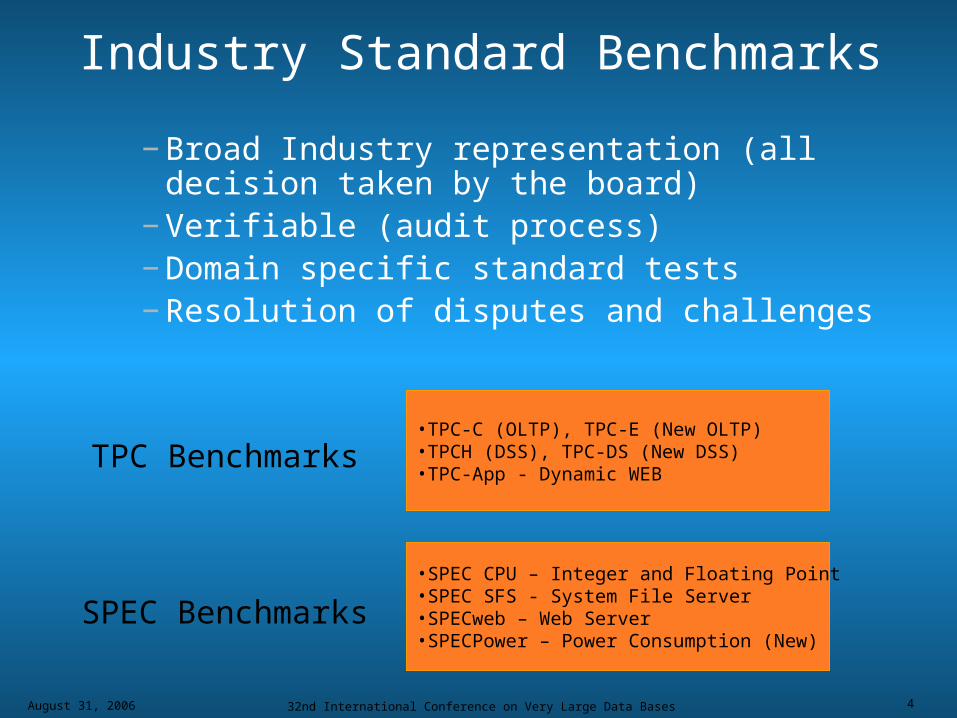
Industry Standard Benchmarks
− Broad Industry representation (all decision taken by the board)
− Verifiable (audit process)− Domain specific standard tests− Resolution of disputes and challenges
TPC Benchmarks
SPEC Benchmarks
•TPC-C (OLTP), TPC-E (New OLTP)•TPCH (DSS), TPC-DS (New DSS)•TPC-App - Dynamic WEB
•SPEC CPU – Integer and Floating Point•SPEC SFS - System File Server•SPECweb – Web Server•SPECPower – Power Consumption (New)
August 31, 2006 32nd International Conference on Very Large Data Bases 5
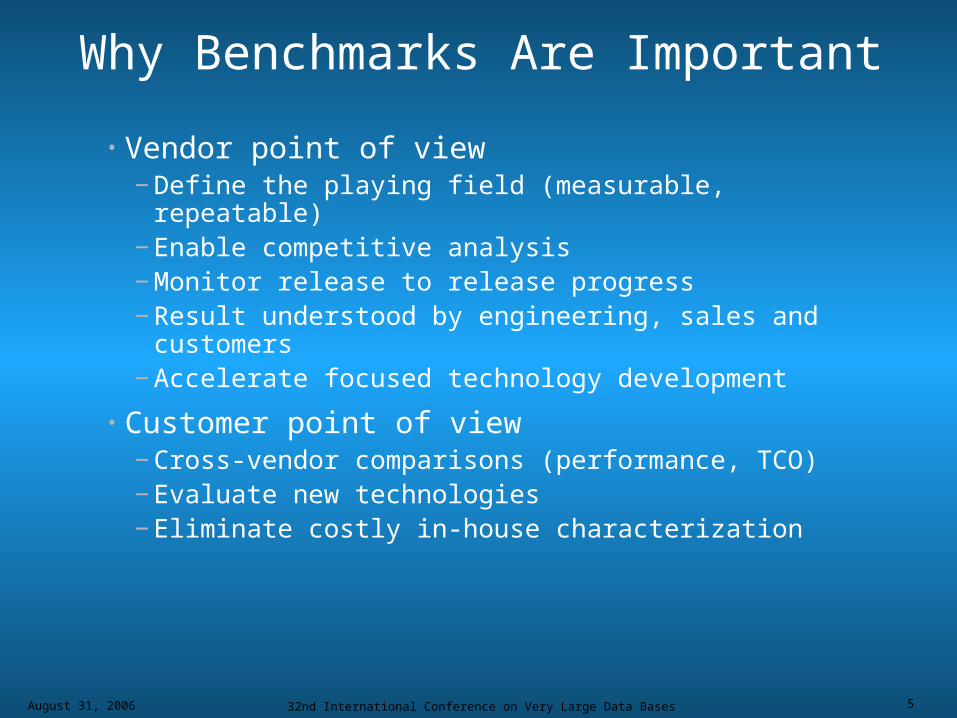
Why Benchmarks Are Important
• Vendor point of view− Define the playing field (measurable, repeatable)− Enable competitive analysis − Monitor release to release progress− Result understood by engineering, sales and
customers− Accelerate focused technology development
• Customer point of view− Cross-vendor comparisons (performance, TCO)− Evaluate new technologies − Eliminate costly in-house characterization
August 31, 2006 32nd International Conference on Very Large Data Bases 6
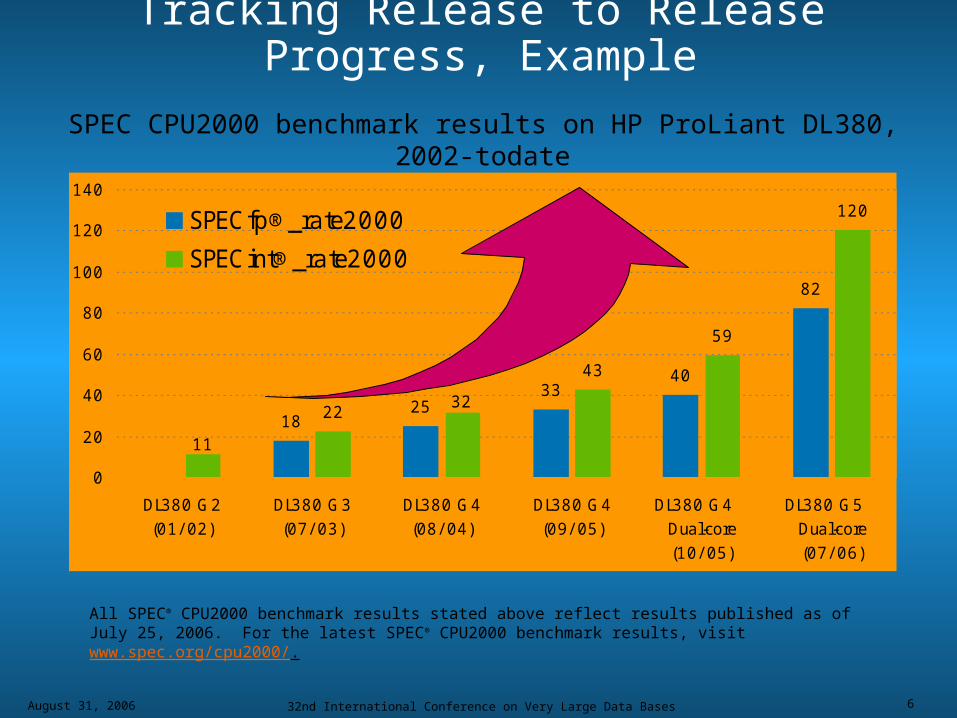
All SPEC® CPU2000 benchmark results stated above reflect results published as of July 25, 2006. For the latest SPEC® CPU2000 benchmark results, visit www.spec.org/cpu2000/.
Tracking Release to Release Progress, Example
SPEC CPU2000 benchmark results on HP ProLiant DL380, 2002-todate
1825
3340
82
22
43
59
120
11
32
0
20
40
60
80
100
120
140
DL380 G2(01/ 02)
DL380 G3(07/ 03)
DL380 G4(08/ 04)
DL380 G4(09/ 05)
DL380 G4 Dual-core(10/ 05)
DL380 G5 Dual-core(07/ 06)
SPECfp®_rate2000
SPECint®_rate2000
August 31, 2006 32nd International Conference on Very Large Data Bases 7
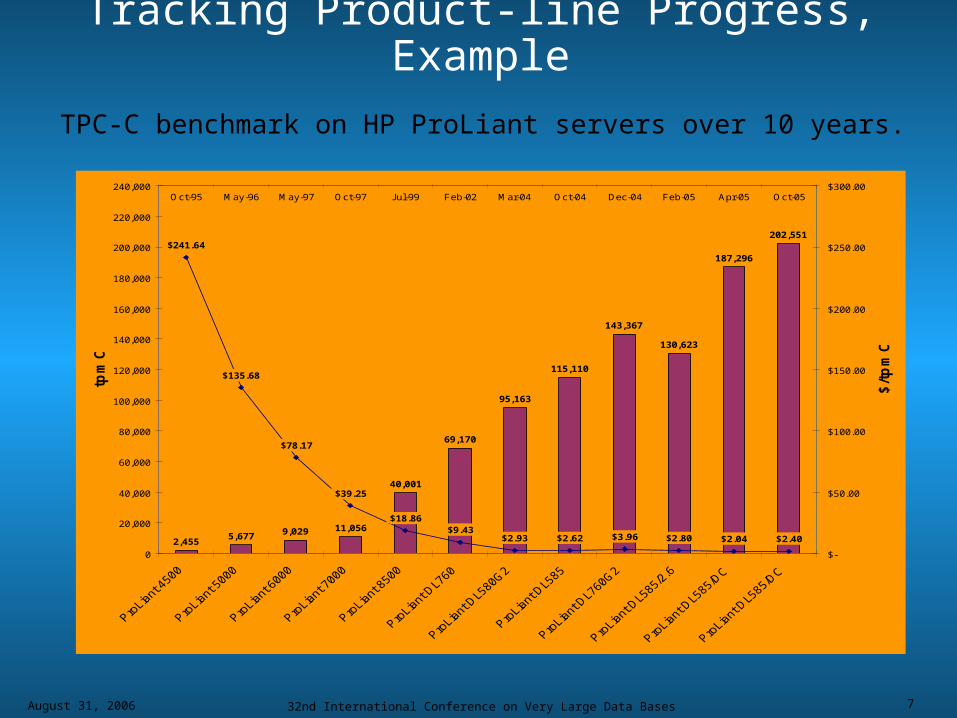
2,4555,677 9,029 11,056
40,001
69,170
95,163
115,110
143,367
130,623
187,296
202,551$241.64
$135.68
$78.17
$39.25
$18.86$9.43
$2.93 $2.62 $3.96 $2.80 $2.04 $2.40
0
20,000
40,000
60,000
80,000
100,000
120,000
140,000
160,000
180,000
200,000
220,000
240,000
tpm
C
$-
$50.00
$100.00
$150.00
$200.00
$250.00
$300.00Oct-95 May-96 May-97 Oct-97 Jul-99 Feb-02 Mar-04 Oct-04 Dec-04 Feb-05 Apr-05 Oct-05
$/t
pm
C
TPC-C benchmark on HP ProLiant servers over 10 years.
Tracking Product-line Progress, Example
August 31, 2006 32nd International Conference on Very Large Data Bases 8
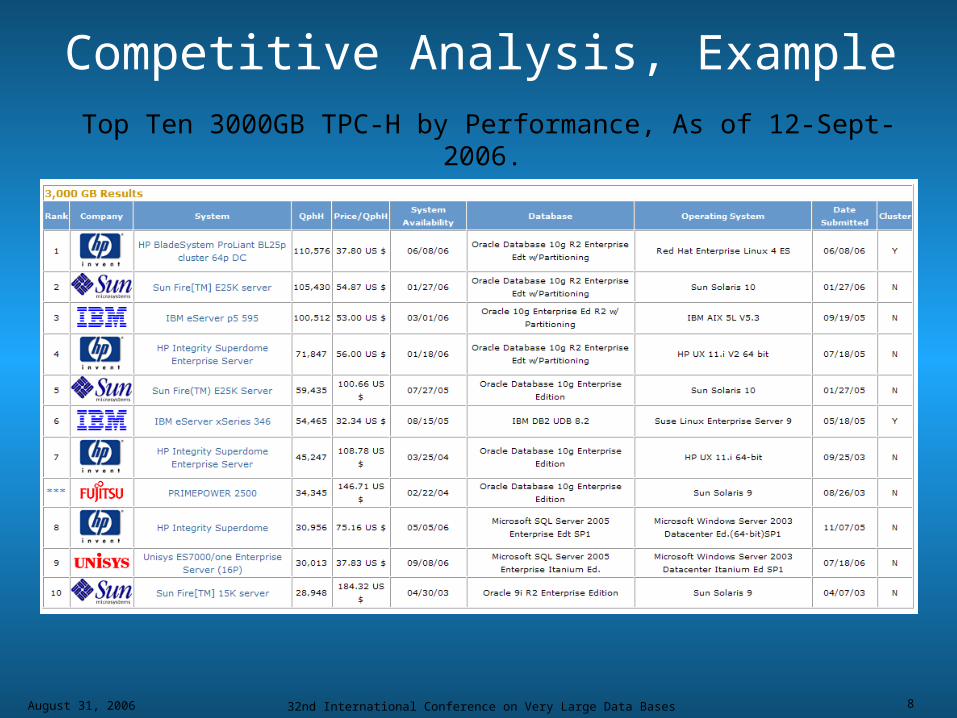
Competitive Analysis, Example Top Ten 3000GB TPC-H by Performance, As of 12-Sept-2006.
August 31, 2006 32nd International Conference on Very Large Data Bases 9
Transaction Processing Performance Council (TPC)
August 31, 2006 32nd International Conference on Very Large Data Bases 10
What makes the TPC unique
• TPC is the only benchmark organization that requires price-performance scores across all of its benchmarks
• All tests require full documentation of the components and applications under test, so that the test can be replicated
• The TPC requires an independent audit of results prior to publication
• TPC tests the whole system performance, not just a piece
• TPC is database agnostic: Oracle, IBM DB2, Sybase, Microsoft SQL Server, NonStop SQL/MX and other databases
• TPC provides cross-platform performance comparisons, a view of processor versus real performance, technology comparisons and actual cost of performance comparisons
August 31, 2006 32nd International Conference on Very Large Data Bases 11
TPC Business Model
• TPC follows the philosophy of real world benchmarks, so that its customers can:− relate their business to the benchmark
business model− relate their workload to the workload of the
benchmark− Understand the benchmark
August 31, 2006 32nd International Conference on Very Large Data Bases 12
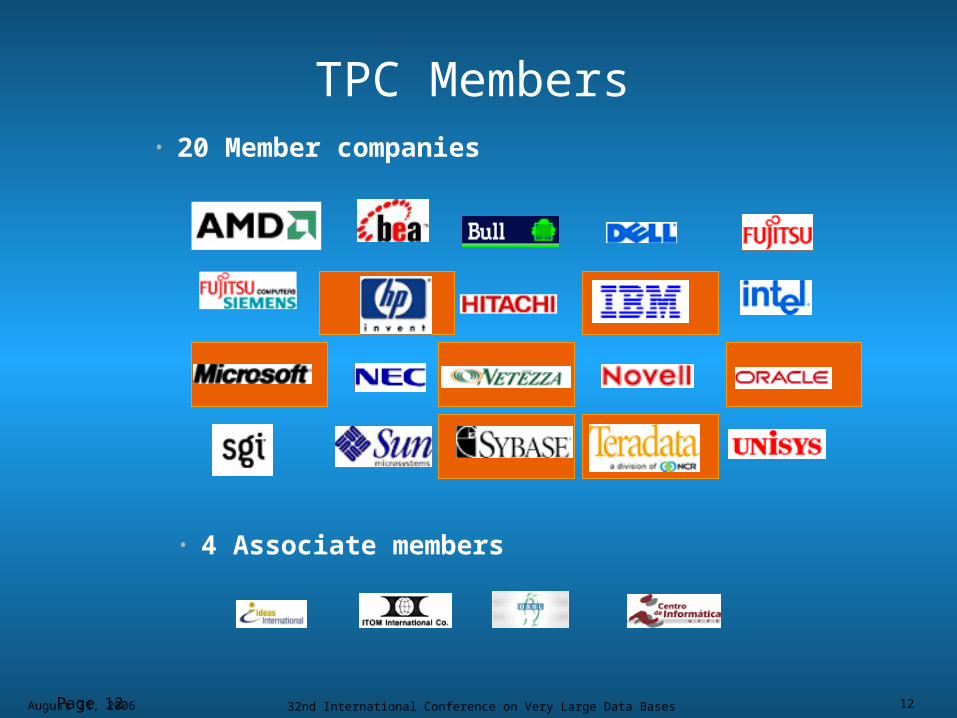
TPC Members • 20 Member companies
Page 12
• 4 Associate members
August 31, 2006 32nd International Conference on Very Large Data Bases 13
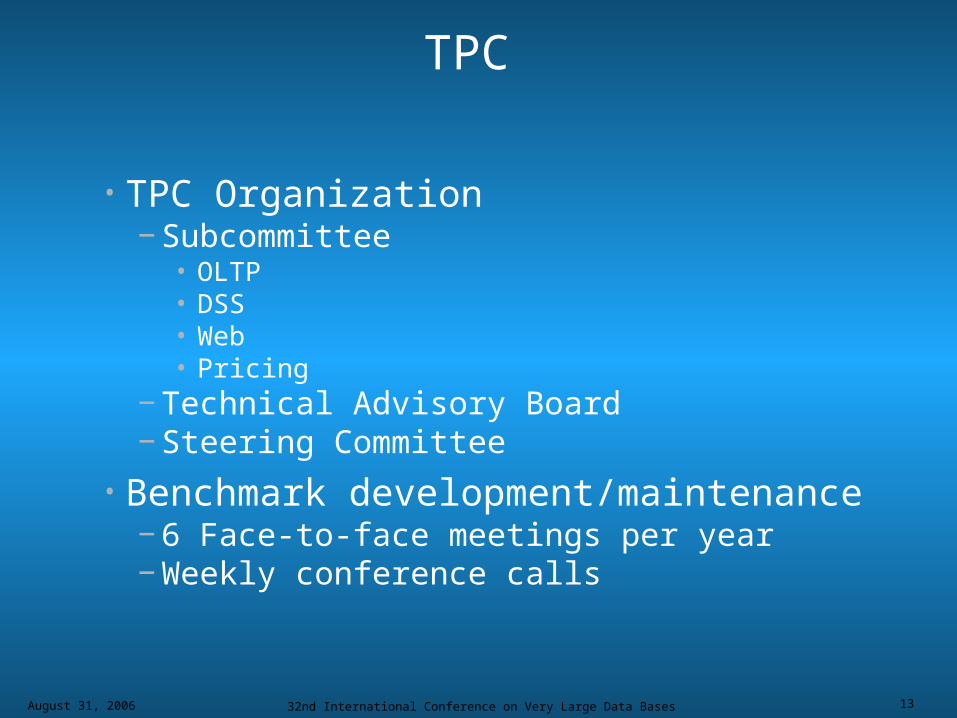
TPC
• TPC Organization− Subcommittee
• OLTP• DSS• Web• Pricing
− Technical Advisory Board − Steering Committee
• Benchmark development/maintenance− 6 Face-to-face meetings per year− Weekly conference calls
August 31, 2006 32nd International Conference on Very Large Data Bases 14
New Benchmark Development
August 31, 2006 32nd International Conference on Very Large Data Bases 15
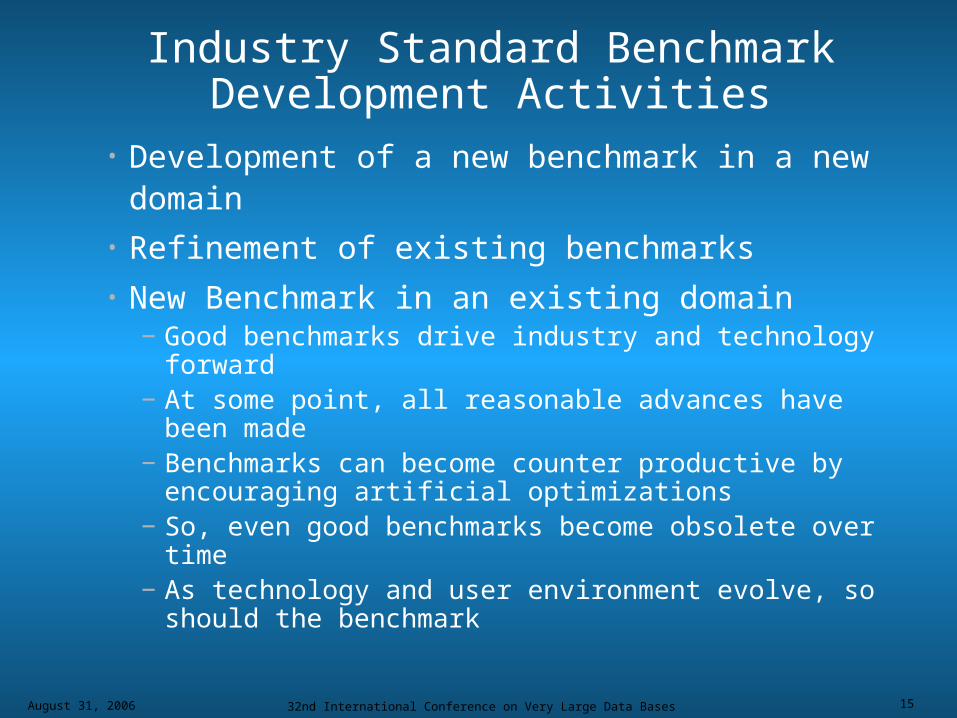
Industry Standard Benchmark Development Activities
• Development of a new benchmark in a new domain
• Refinement of existing benchmarks • New Benchmark in an existing domain
− Good benchmarks drive industry and technology forward
− At some point, all reasonable advances have been made
− Benchmarks can become counter productive by encouraging artificial optimizations
− So, even good benchmarks become obsolete over time
− As technology and user environment evolve, so should the benchmark
August 31, 2006 32nd International Conference on Very Large Data Bases 16
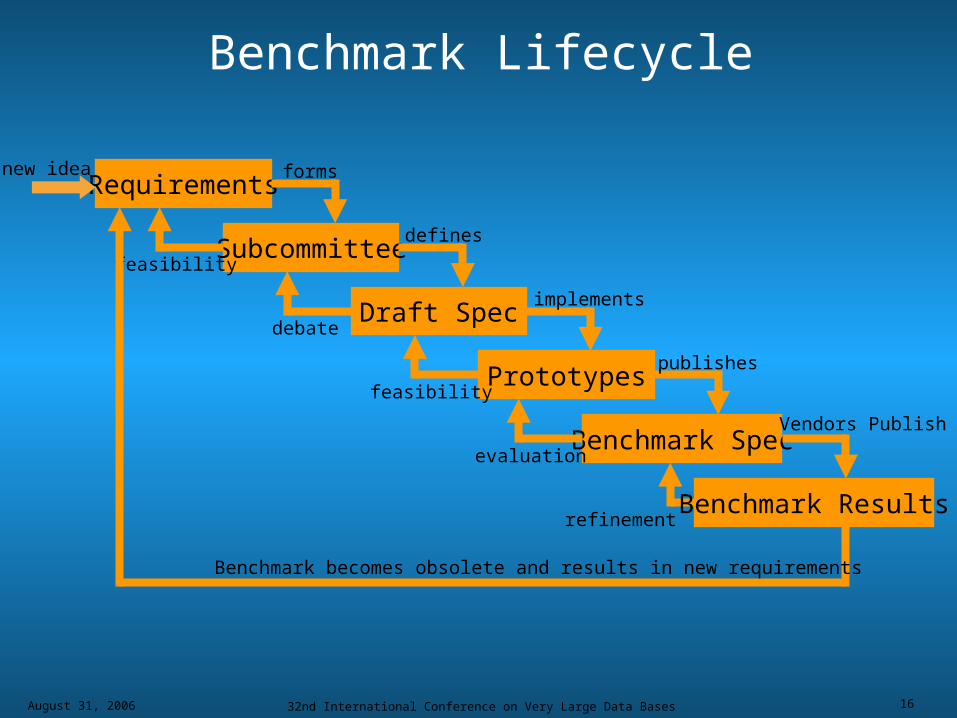
Benchmark Lifecycle
Requirements
Subcommittee
forms
feasibility
Draft Spec
defines
debate
Prototypes
implements
feasibility
Benchmark Spec
publishes
evaluation
Benchmark Results
Vendors Publish
refinement
Benchmark becomes obsolete and results in new requirements
new idea
August 31, 2006 32nd International Conference on Very Large Data Bases 17
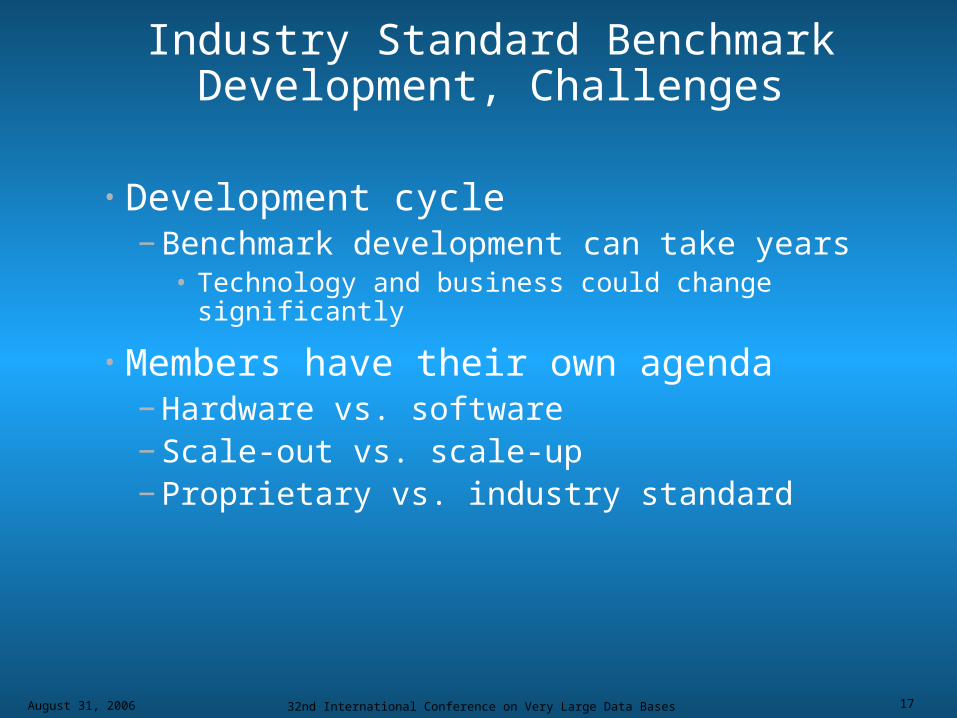
Industry Standard Benchmark Development, Challenges
• Development cycle− Benchmark development can take years
• Technology and business could change significantly
• Members have their own agenda− Hardware vs. software− Scale-out vs. scale-up− Proprietary vs. industry standard
August 31, 2006 32nd International Conference on Very Large Data Bases 18
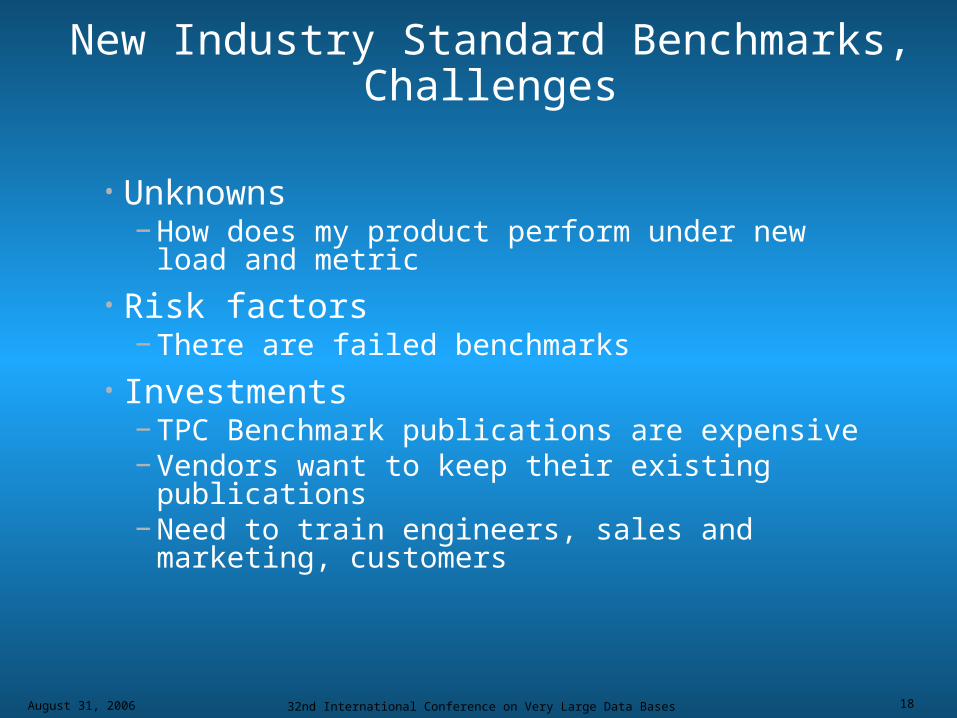
New Industry Standard Benchmarks, Challenges
• Unknowns− How does my product perform under new
load and metric
• Risk factors− There are failed benchmarks
• Investments− TPC Benchmark publications are expensive− Vendors want to keep their existing
publications− Need to train engineers, sales and
marketing, customers
August 31, 2006 32nd International Conference on Very Large Data Bases 19
TPC-H
August 31, 2006 32nd International Conference on Very Large Data Bases 20
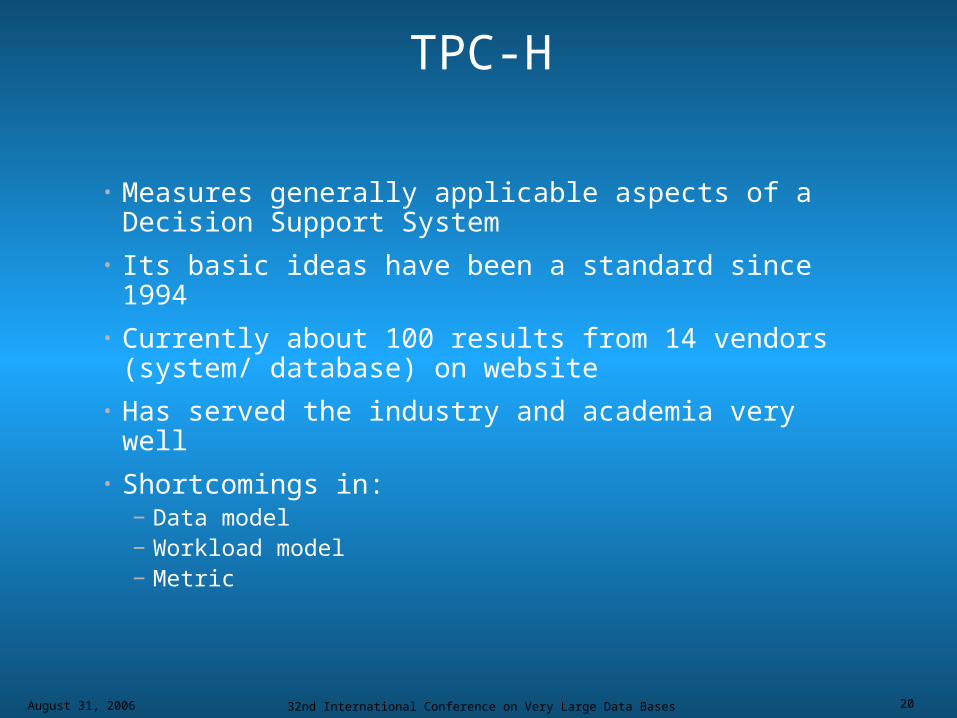
TPC-H
• Measures generally applicable aspects of a Decision Support System
• Its basic ideas have been a standard since 1994• Currently about 100 results from 14 vendors
(system/ database) on website• Has served the industry and academia very well• Shortcomings in:
− Data model− Workload model− Metric
August 31, 2006 32nd International Conference on Very Large Data Bases 21
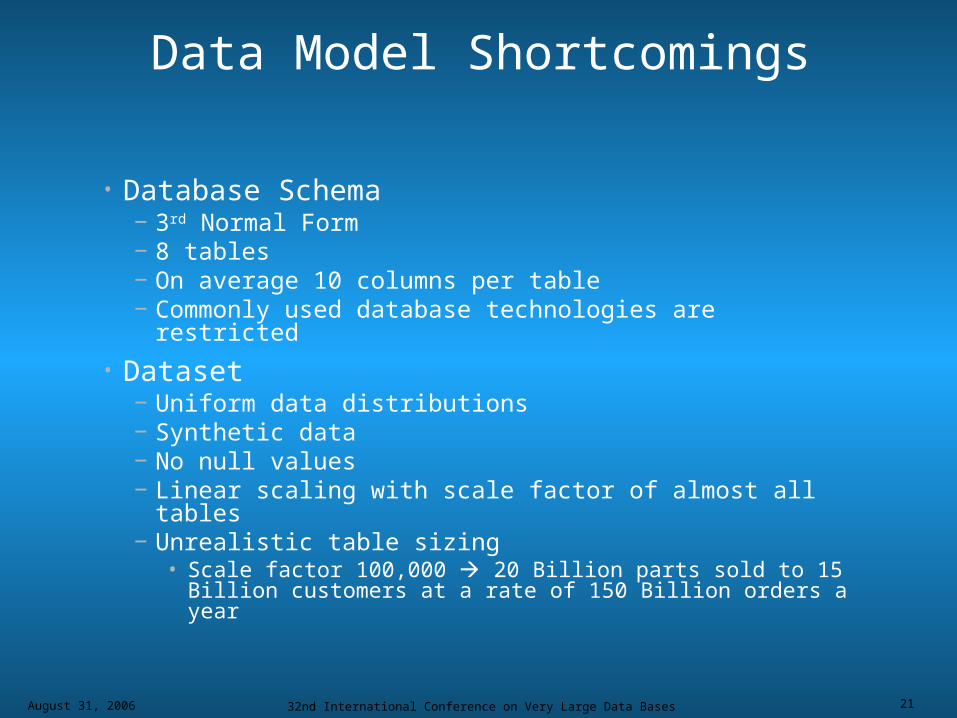
Data Model Shortcomings
• Database Schema− 3rd Normal Form− 8 tables− On average 10 columns per table− Commonly used database technologies are
restricted
• Dataset− Uniform data distributions− Synthetic data− No null values− Linear scaling with scale factor of almost all tables− Unrealistic table sizing
• Scale factor 100,000 20 Billion parts sold to 15 Billion customers at a rate of 150 Billion orders a year
August 31, 2006 32nd International Conference on Very Large Data Bases 22
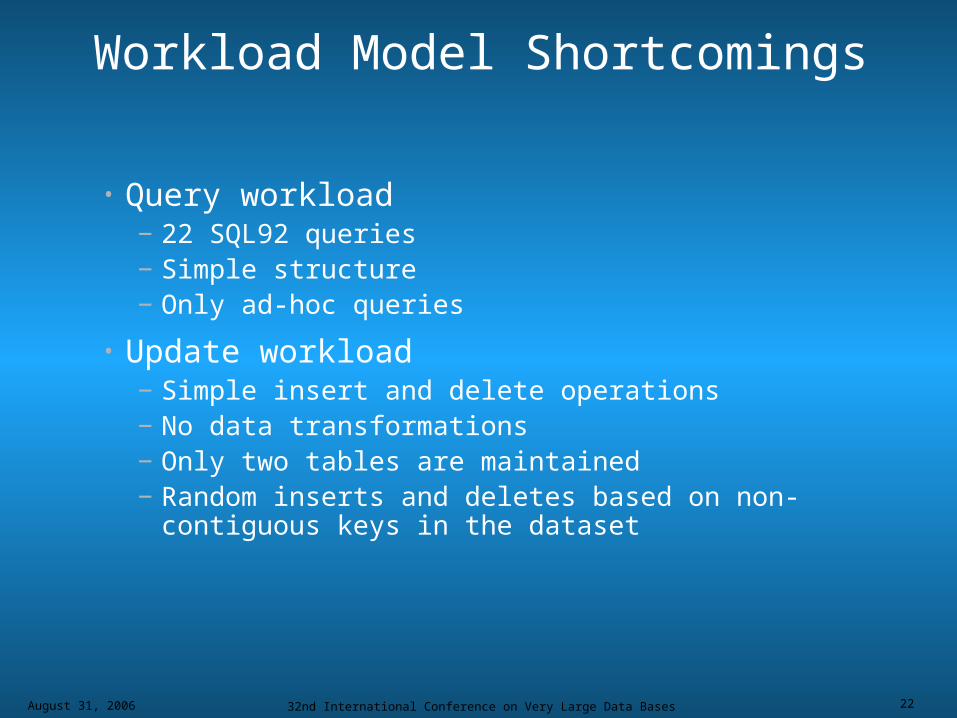
Workload Model Shortcomings
• Query workload− 22 SQL92 queries− Simple structure− Only ad-hoc queries
• Update workload− Simple insert and delete operations− No data transformations− Only two tables are maintained− Random inserts and deletes based on non-
contiguous keys in the dataset
August 31, 2006 32nd International Conference on Very Large Data Bases 23
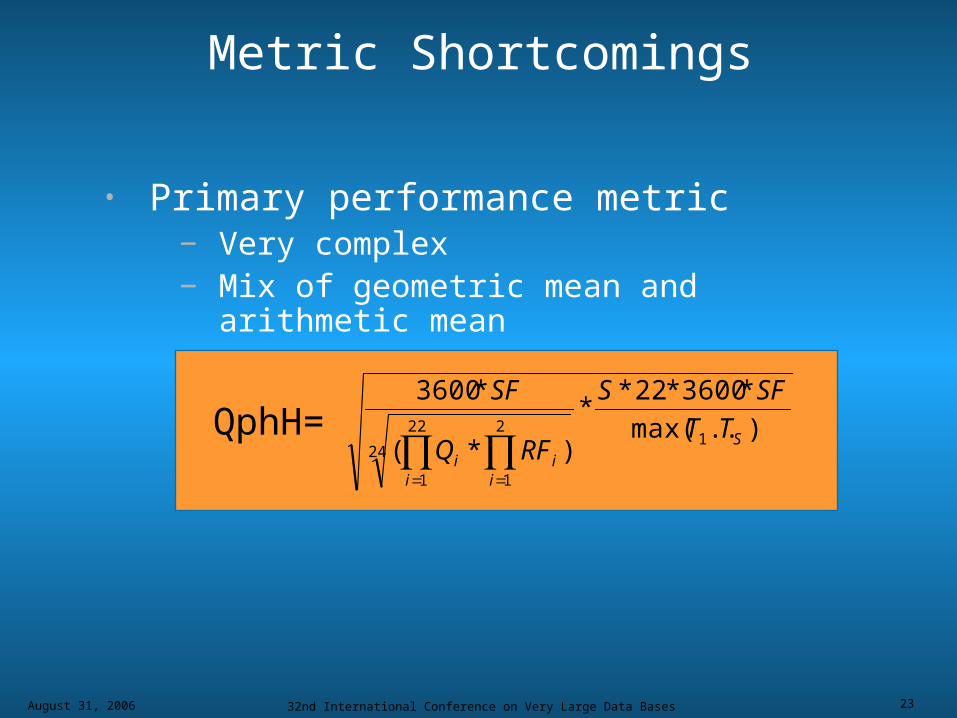
Metric Shortcomings
• Primary performance metric− Very complex− Mix of geometric mean and arithmetic
mean
)..max(
*3600*22**
)*(
*3600
124
2
1
22
1
S
ii
ii
TT
SFS
RFQ
SF
QphH=
August 31, 2006 32nd International Conference on Very Large Data Bases 24
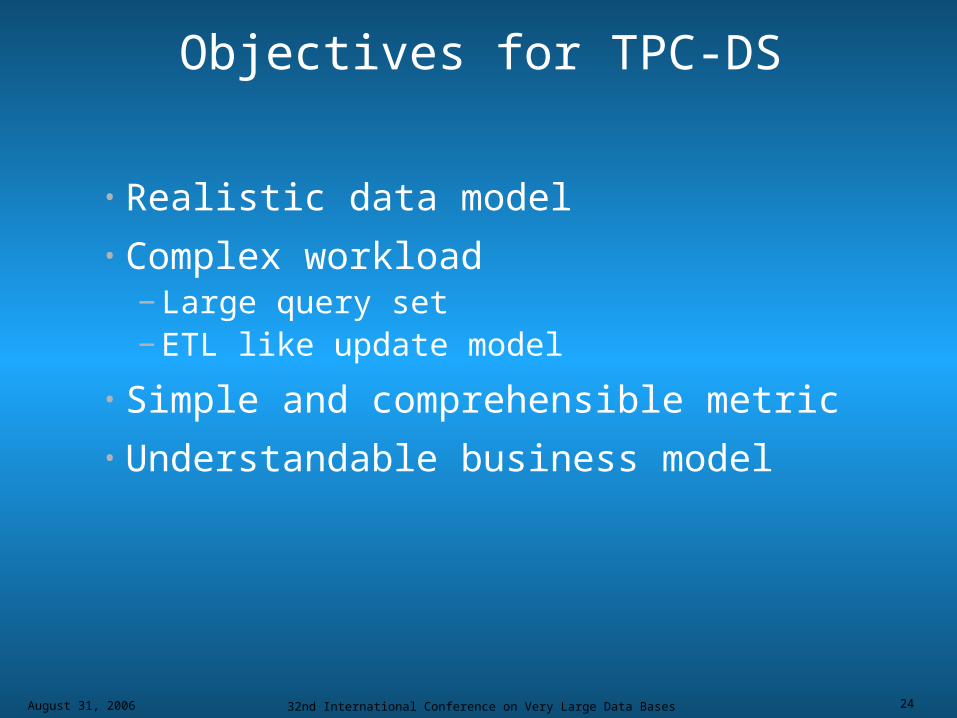
Objectives for TPC-DS
• Realistic data model• Complex workload
− Large query set− ETL like update model
• Simple and comprehensible metric• Understandable business model
August 31, 2006 32nd International Conference on Very Large Data Bases 25
Data Model
August 31, 2006 32nd International Conference on Very Large Data Bases 26
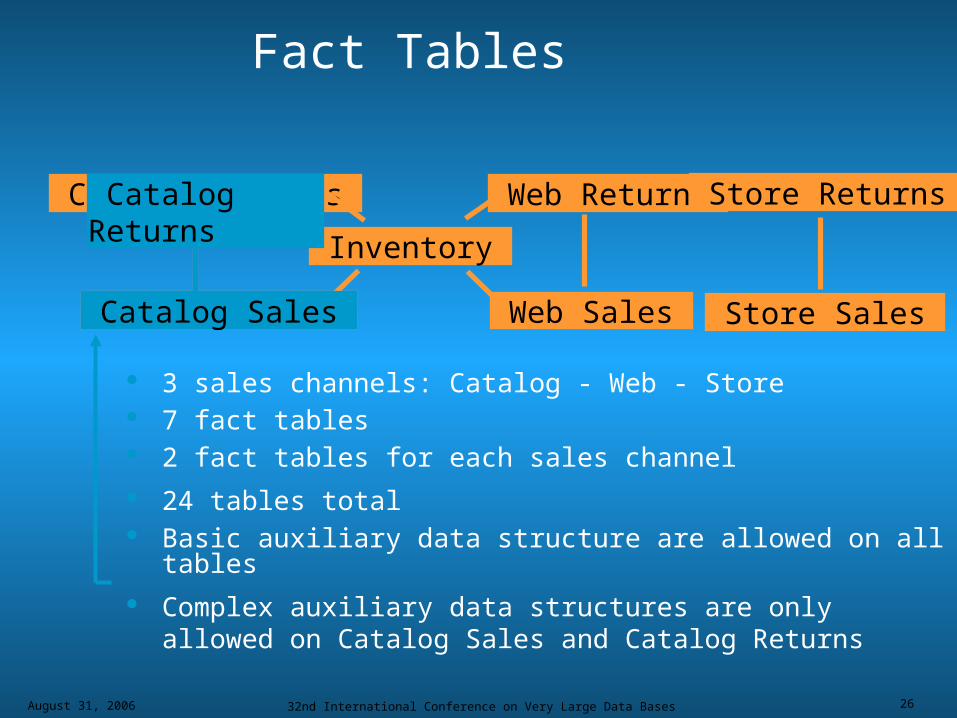
Fact Tables
Catalog Returns
Catalog Sales
Inventory
Web Returns
Web Sales
Store Returns
Store Sales
3 sales channels: Catalog - Web - Store 7 fact tables 2 fact tables for each sales channel 24 tables total Basic auxiliary data structure are allowed on all tables Complex auxiliary data structures are only allowed on
Catalog Sales and Catalog Returns
Catalog Returns
Catalog Sales
August 31, 2006 32nd International Conference on Very Large Data Bases 27
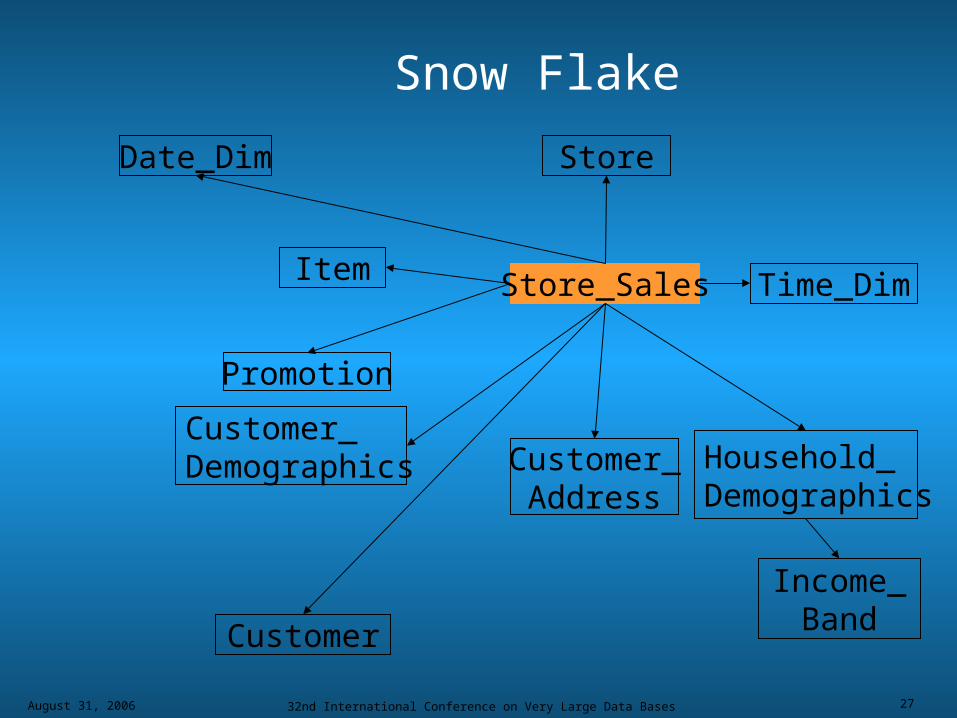
Snow Flake
Store_Sales
Date_Dim
Item Time_Dim
Customer_Demographics
Store
Household_Demographics
Promotion
Customer
Customer_Address
Income_Band
August 31, 2006 32nd International Conference on Very Large Data Bases 28
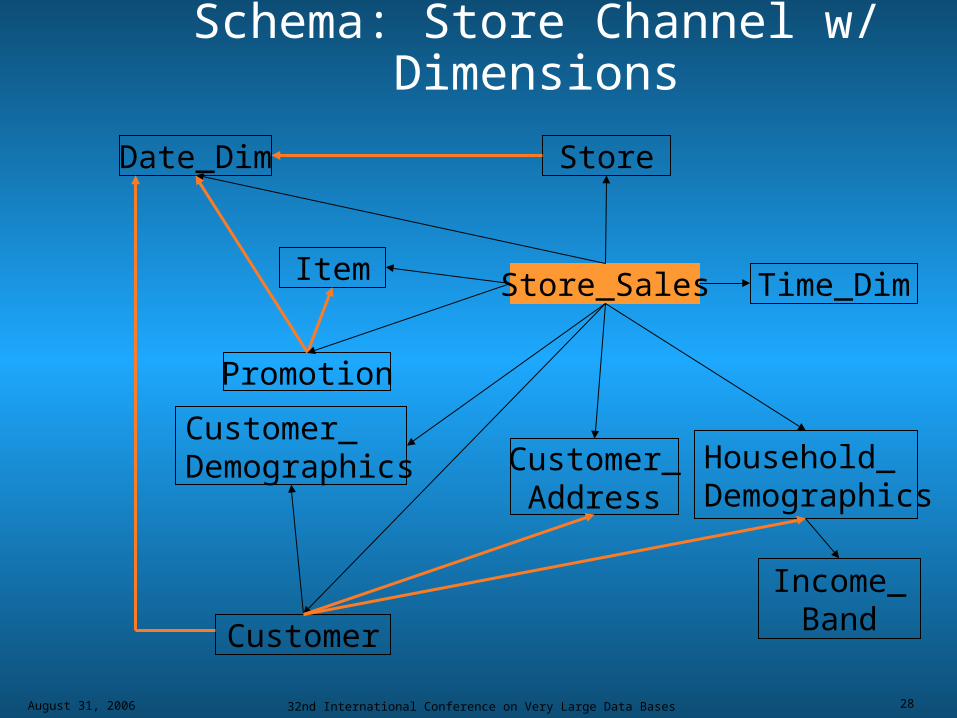
Schema: Store Channel w/ Dimensions
Store_Sales
Date_Dim
Item Time_Dim
Customer_Demographics
Store
Household_Demographics
Promotion
Income_BandCustomer
Customer_Address
August 31, 2006 32nd International Conference on Very Large Data Bases 29
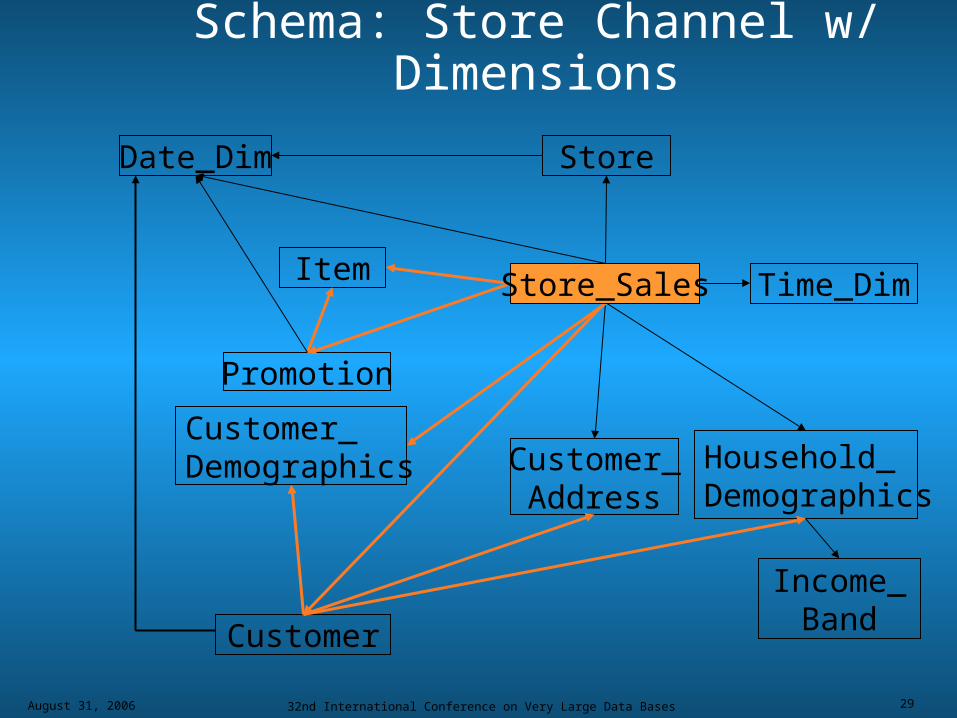
Schema: Store Channel w/ Dimensions
Date_Dim
Item Time_Dim
Customer_Demographics
Store
Household_Demographics
Promotion
Income_BandCustomer
Customer_Address
Store_Sales
August 31, 2006 32nd International Conference on Very Large Data Bases 30
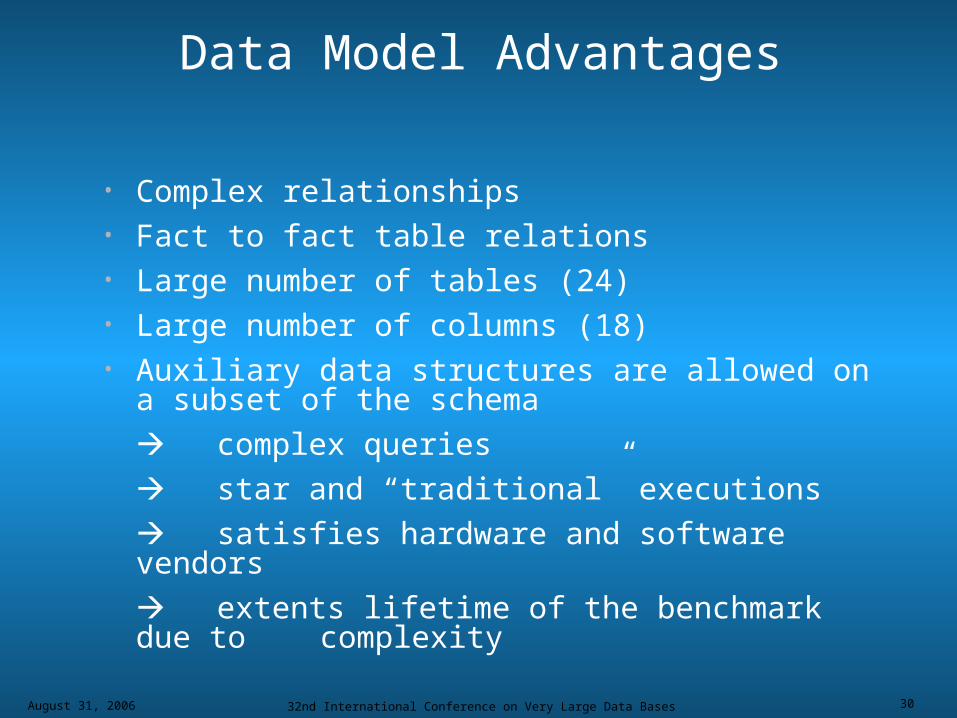
Data Model Advantages
• Complex relationships• Fact to fact table relations• Large number of tables (24)• Large number of columns (18)• Auxiliary data structures are allowed on a
subset of the schema
complex queries
star and “traditional” executions
satisfies hardware and software vendors
extents lifetime of the benchmark due to complexity
August 31, 2006 32nd International Conference on Very Large Data Bases 31
Dataset
August 31, 2006 32nd International Conference on Very Large Data Bases 32
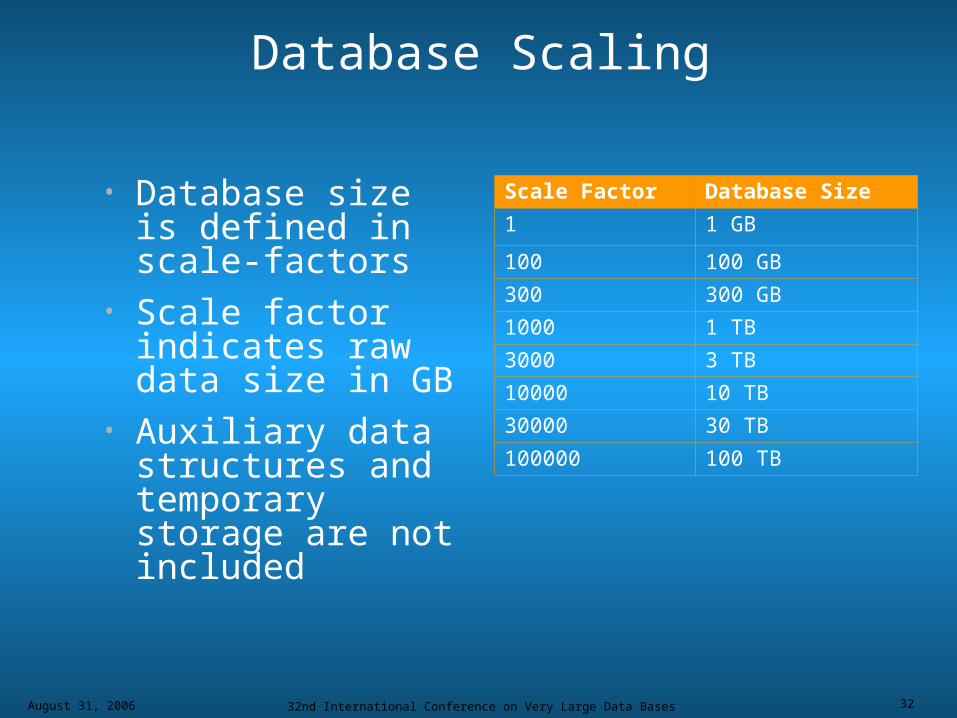
Database Scaling
• Database size is defined in scale-factors
• Scale factor indicates raw data size in GB
• Auxiliary data structures and temporary storage are not included
Scale Factor Database Size
1 1 GB
100 100 GB
300 300 GB
1000 1 TB
3000 3 TB
10000 10 TB
30000 30 TB
100000 100 TB
August 31, 2006 32nd International Conference on Very Large Data Bases 33
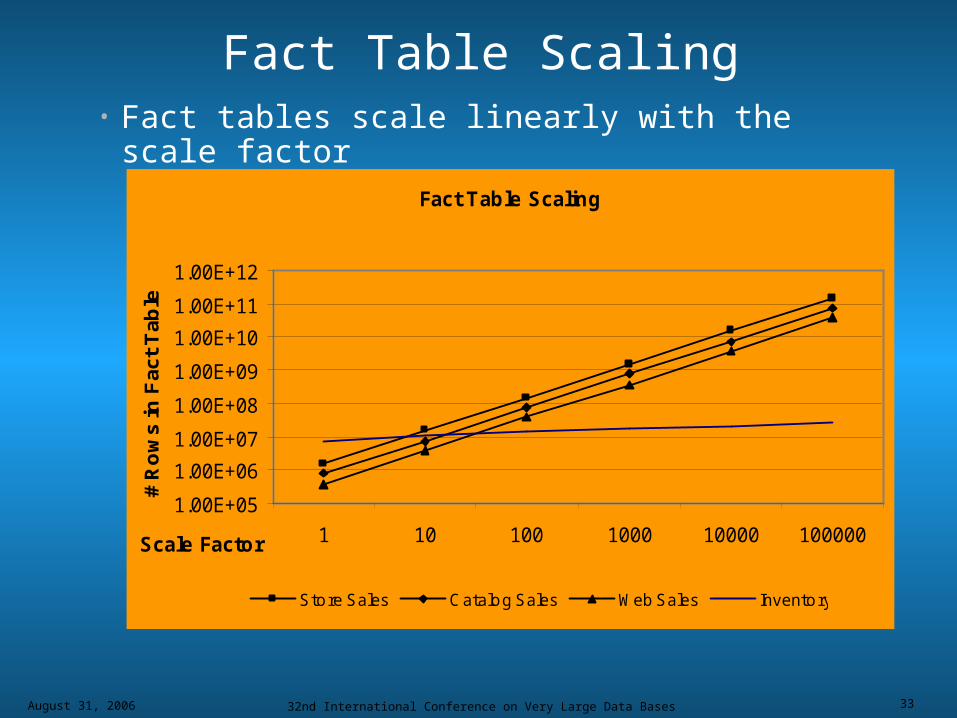
Fact Table Scaling• Fact tables scale linearly with the scale factor
Fact Table Scaling
1.00E+05
1.00E+06
1.00E+07
1.00E+08
1.00E+09
1.00E+10
1.00E+11
1.00E+12
1 10 100 1000 10000 100000Scale Factor
# R
ow
s in
Fac
t T
able
Store Sales Catalog Sales Web Sales Inventory
August 31, 2006 32nd International Conference on Very Large Data Bases 34
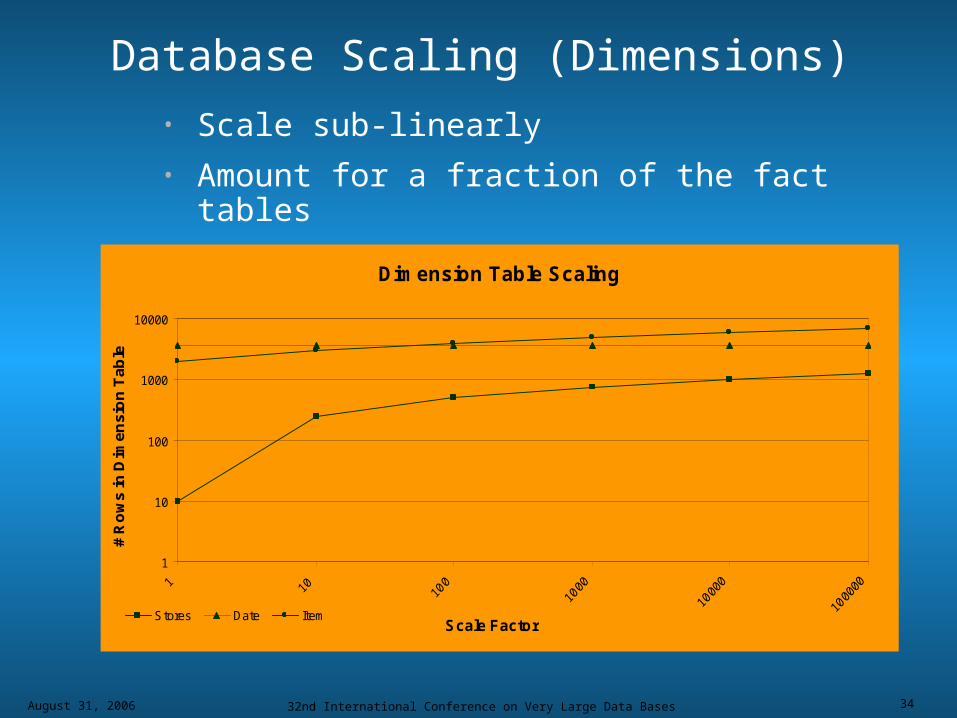
Database Scaling (Dimensions)
Dimension Table Scaling
1
10
100
1000
10000
Scale Factor
# R
ow
s in
Dim
en
sio
n T
ab
le
Stores Date Item
• Scale sub-linearly• Amount for a fraction of the fact tables
August 31, 2006 32nd International Conference on Very Large Data Bases 35
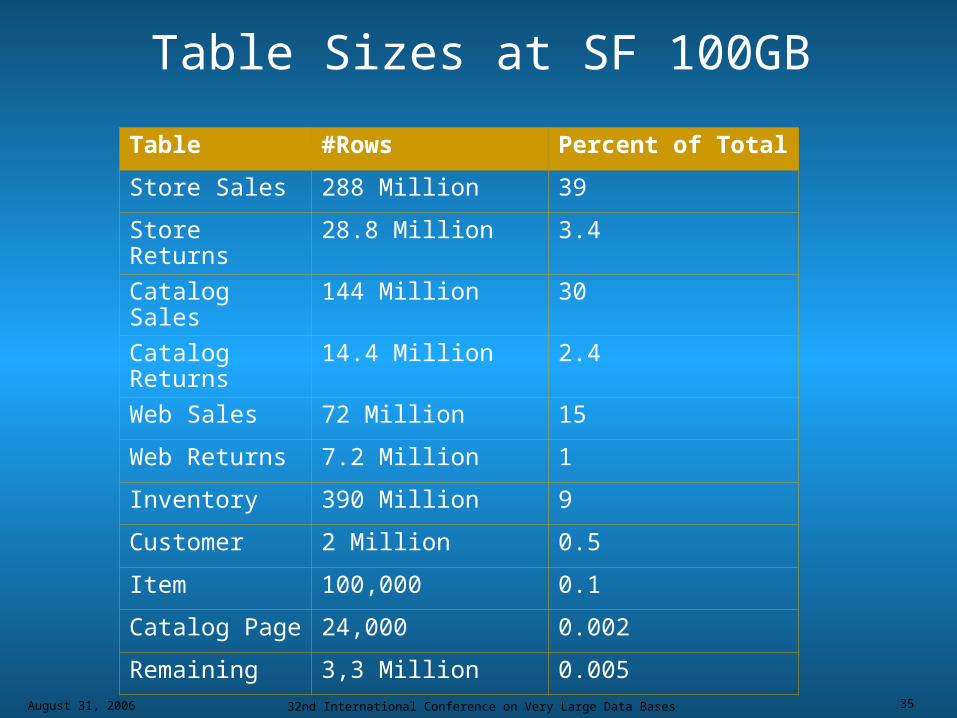
Table Sizes at SF 100GB
Table #Rows Percent of Total
Store Sales 288 Million 39
Store Returns 28.8 Million 3.4
Catalog Sales 144 Million 30
Catalog Returns
14.4 Million 2.4
Web Sales 72 Million 15
Web Returns 7.2 Million 1
Inventory 390 Million 9
Customer 2 Million 0.5
Item 100,000 0.1
Catalog Page 24,000 0.002
Remaining 3,3 Million 0.005
August 31, 2006 32nd International Conference on Very Large Data Bases 36
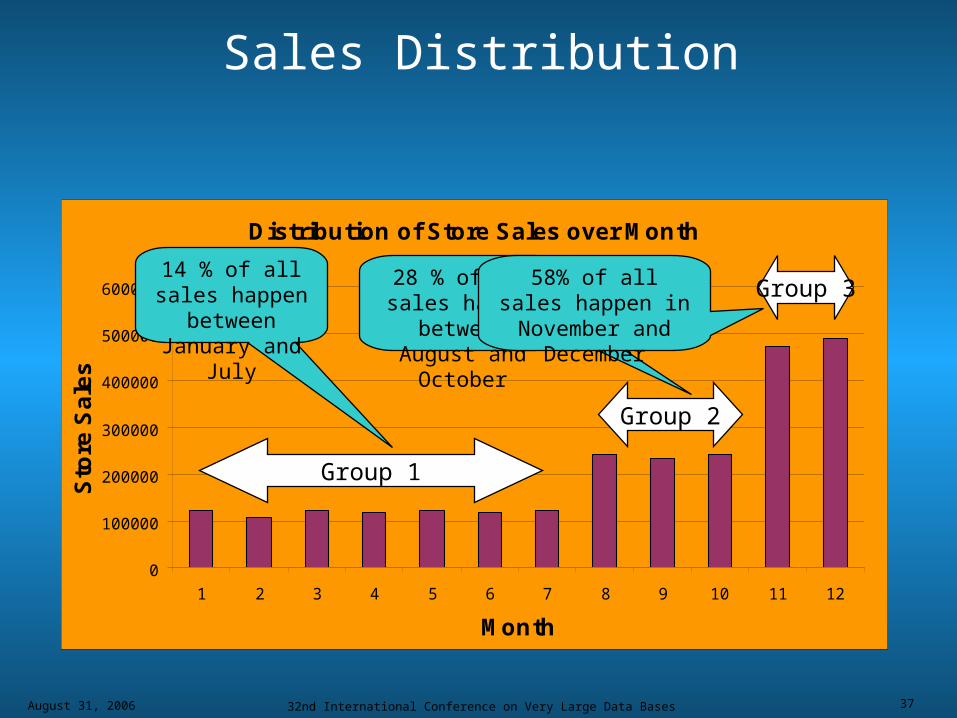
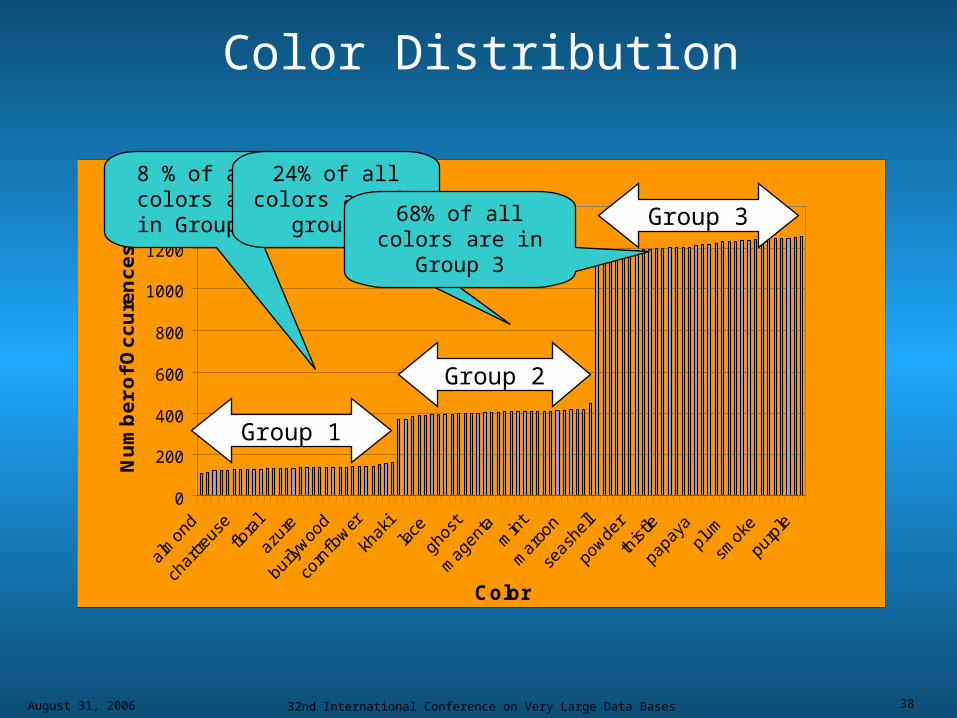
Data Content
• Some data has “real world” content:− Last name “Sanchez”, “Ward”, “Roberts”− Addresses “630 Railroad, Woodbine,
Sullivan County,MO-64253”
• Data is skewed− Sales are modeled after US census data − More green items than red− Small and large cities
August 31, 2006 32nd International Conference on Very Large Data Bases 37
Distribution of Store Sales over Month
0
100000
200000
300000
400000
500000
600000
1 2 3 4 5 6 7 8 9 10 11 12
Month
Sto
re S
ale
sSales Distribution
Group 1
Group 2
Group 314 % of all sales happen between January and July
28 % of all sales happen between
August and October
58% of all sales happen in November
and December
August 31, 2006 32nd International Conference on Very Large Data Bases 38
Color Distribution
0
200
400
600
800
1000
1200
1400
Color
Nu
mb
er
of
Oc
cu
ren
ce
s
Group 1
Group 2
Group 3
8 % of all colors are in Group 1
24% of all colors are in group 2
68% of all colors are in Group 3
August 31, 2006 32nd International Conference on Very Large Data Bases 39
Dataset Advantages
• Realistic table scaling• Real world data content• Non-uniform distributions
challenging for:− statistics collection− query optimizer
August 31, 2006 32nd International Conference on Very Large Data Bases 40
Query Model
August 31, 2006 32nd International Conference on Very Large Data Bases 41
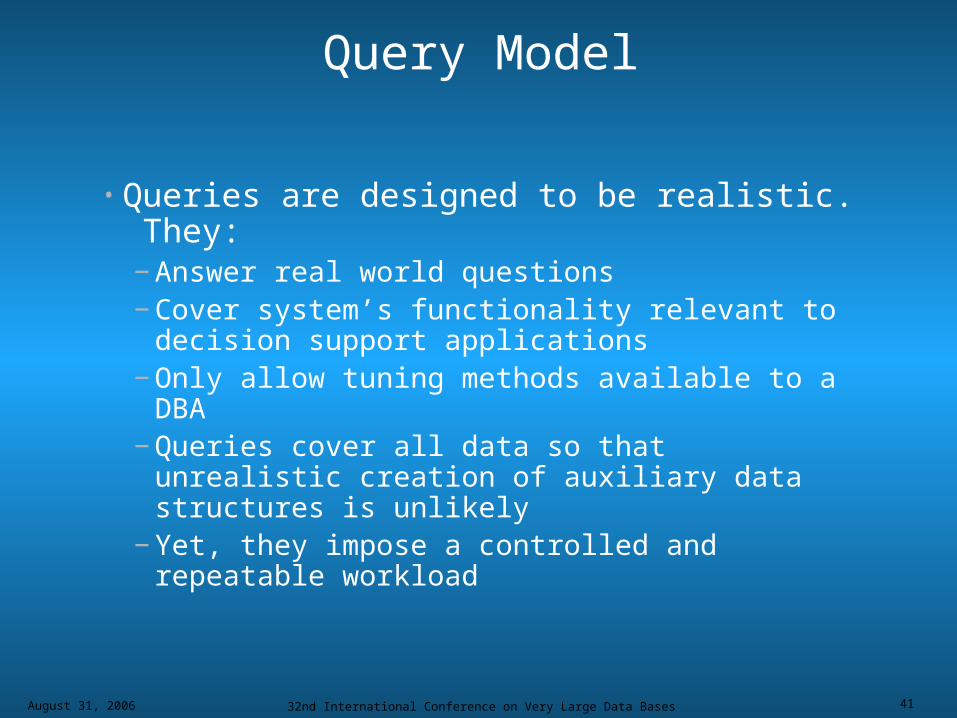
Query Model
• Queries are designed to be realistic. They:− Answer real world questions− Cover system’s functionality relevant to
decision support applications− Only allow tuning methods available to a DBA− Queries cover all data so that unrealistic
creation of auxiliary data structures is unlikely− Yet, they impose a controlled and repeatable
workload
August 31, 2006 32nd International Conference on Very Large Data Bases 42
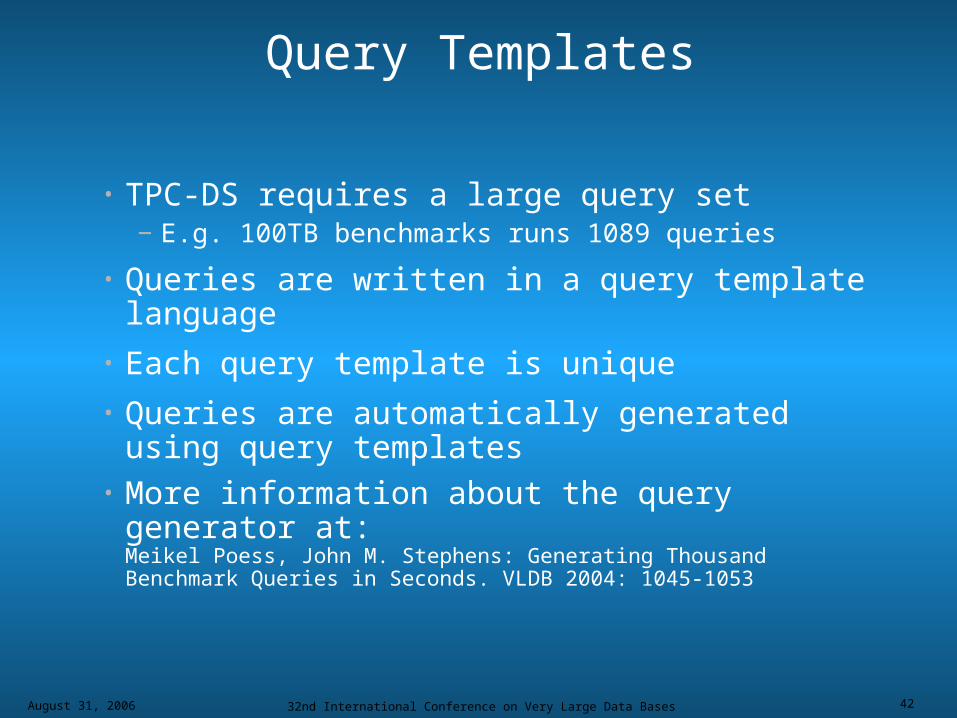
Query Templates
• TPC-DS requires a large query set− E.g. 100TB benchmarks runs 1089 queries
• Queries are written in a query template language
• Each query template is unique• Queries are automatically generated using
query templates• More information about the query generator
at:Meikel Poess, John M. Stephens: Generating Thousand Benchmark Queries in Seconds. VLDB 2004: 1045-1053

August 31, 2006 32nd International Conference on Very Large Data Bases 43
Query Model
• Query Language: SQL99 + OLAP extensions• Query needs to be executed “as is”
− No hints or rewrites allowed,except when approved by TPC
• 99 different query templates• 4 different query types:
Data Mining
Iterative
Ad-hoc
Reporting
Type
Queries feeding Data Mining Tools for further processing
Users issuing sequences of queries
Sporadic queries, minimal tuning
Finely tuned reoccurring queries
simulate
Return large number of rows
Sequence of queries where each query adds SQL elements
Access Store and Web Sales Channel tables
Access catalog sales channel tables
Implemented via
10
4
47
38
Templates
August 31, 2006 32nd International Conference on Very Large Data Bases 44
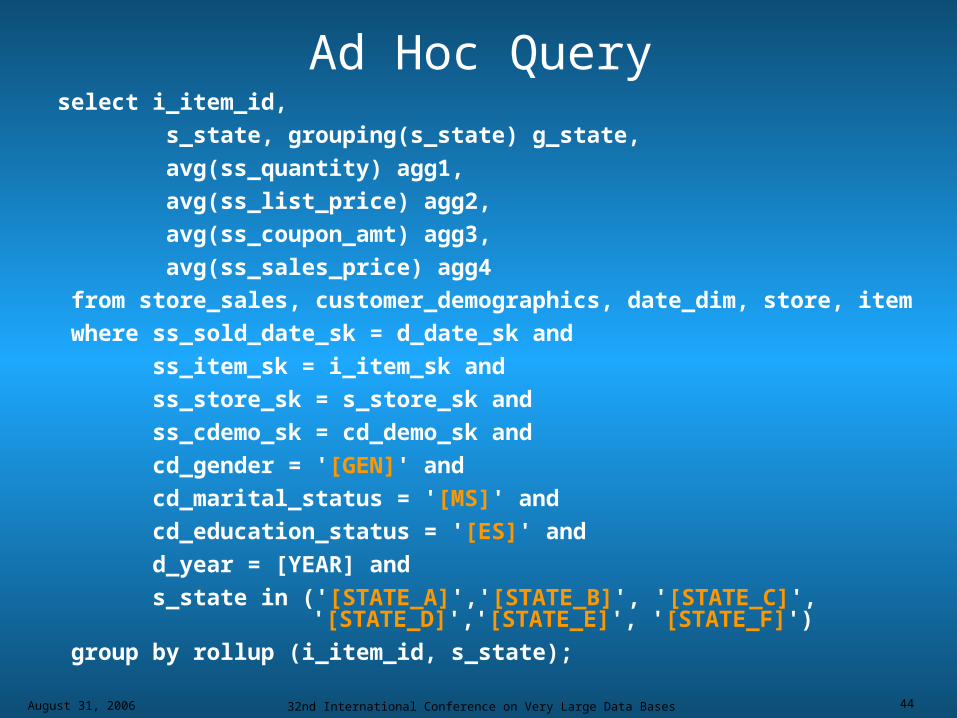
Ad Hoc Queryselect i_item_id,
s_state, grouping(s_state) g_state,
avg(ss_quantity) agg1,
avg(ss_list_price) agg2,
avg(ss_coupon_amt) agg3,
avg(ss_sales_price) agg4
from store_sales, customer_demographics, date_dim, store, item
where ss_sold_date_sk = d_date_sk and
ss_item_sk = i_item_sk and
ss_store_sk = s_store_sk and
ss_cdemo_sk = cd_demo_sk and
cd_gender = '[GEN]' and
cd_marital_status = '[MS]' and
cd_education_status = '[ES]' and
d_year = [YEAR] and
s_state in ('[STATE_A]','[STATE_B]', '[STATE_C]', '[STATE_D]','[STATE_E]', '[STATE_F]')
group by rollup (i_item_id, s_state);
August 31, 2006 32nd International Conference on Very Large Data Bases 45
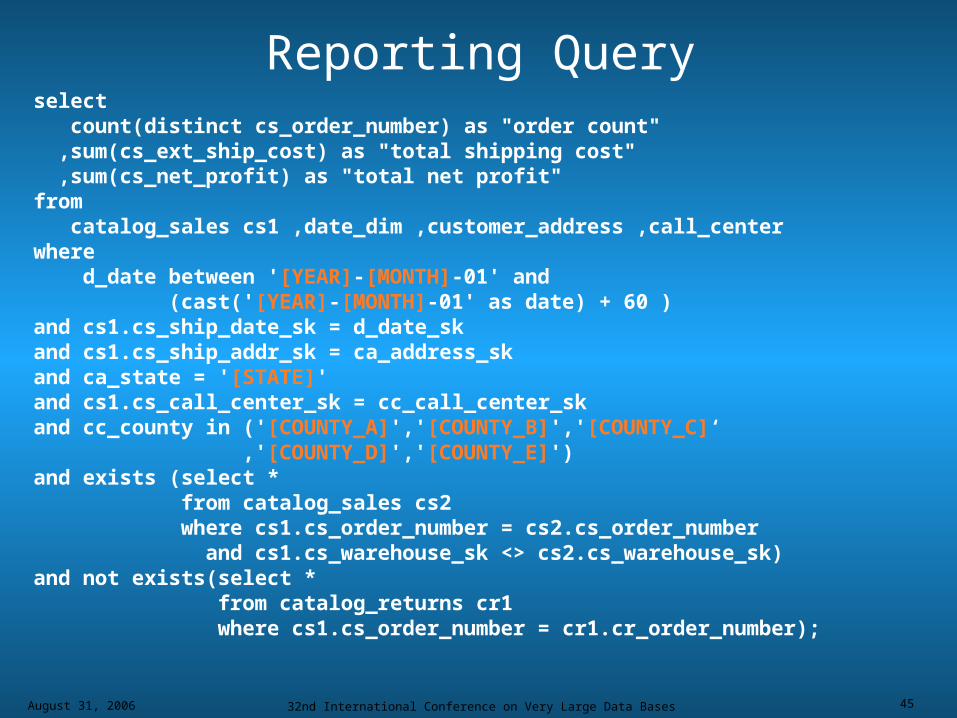
Reporting Queryselect count(distinct cs_order_number) as "order count" ,sum(cs_ext_ship_cost) as "total shipping cost" ,sum(cs_net_profit) as "total net profit"from catalog_sales cs1 ,date_dim ,customer_address ,call_centerwhere d_date between '[YEAR]-[MONTH]-01' and (cast('[YEAR]-[MONTH]-01' as date) + 60 )and cs1.cs_ship_date_sk = d_date_skand cs1.cs_ship_addr_sk = ca_address_skand ca_state = '[STATE]'and cs1.cs_call_center_sk = cc_call_center_skand cc_county in ('[COUNTY_A]','[COUNTY_B]','[COUNTY_C]‘ ,'[COUNTY_D]','[COUNTY_E]')and exists (select * from catalog_sales cs2 where cs1.cs_order_number = cs2.cs_order_number and cs1.cs_warehouse_sk <> cs2.cs_warehouse_sk)and not exists(select * from catalog_returns cr1 where cs1.cs_order_number = cr1.cr_order_number);
August 31, 2006 32nd International Conference on Very Large Data Bases 46
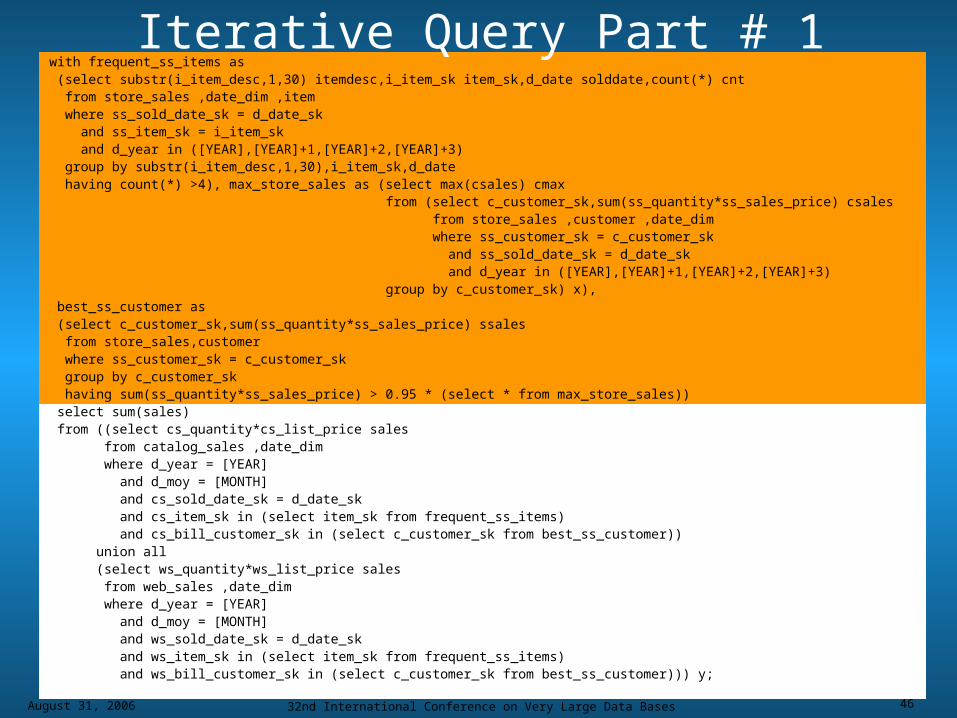
Iterative Query Part # 1with frequent_ss_items as (select substr(i_item_desc,1,30) itemdesc,i_item_sk item_sk,d_date solddate,count(*) cnt from store_sales ,date_dim ,item where ss_sold_date_sk = d_date_sk and ss_item_sk = i_item_sk and d_year in ([YEAR],[YEAR]+1,[YEAR]+2,[YEAR]+3) group by substr(i_item_desc,1,30),i_item_sk,d_date having count(*) >4), max_store_sales as (select max(csales) cmax from (select c_customer_sk,sum(ss_quantity*ss_sales_price) csales from store_sales ,customer ,date_dim where ss_customer_sk = c_customer_sk and ss_sold_date_sk = d_date_sk and d_year in ([YEAR],[YEAR]+1,[YEAR]+2,[YEAR]+3) group by c_customer_sk) x), best_ss_customer as (select c_customer_sk,sum(ss_quantity*ss_sales_price) ssales from store_sales,customer where ss_customer_sk = c_customer_sk group by c_customer_sk having sum(ss_quantity*ss_sales_price) > 0.95 * (select * from max_store_sales)) select sum(sales) from ((select cs_quantity*cs_list_price sales from catalog_sales ,date_dim where d_year = [YEAR] and d_moy = [MONTH] and cs_sold_date_sk = d_date_sk and cs_item_sk in (select item_sk from frequent_ss_items) and cs_bill_customer_sk in (select c_customer_sk from best_ss_customer)) union all (select ws_quantity*ws_list_price sales from web_sales ,date_dim where d_year = [YEAR] and d_moy = [MONTH] and ws_sold_date_sk = d_date_sk and ws_item_sk in (select item_sk from frequent_ss_items) and ws_bill_customer_sk in (select c_customer_sk from best_ss_customer))) y;
August 31, 2006 32nd International Conference on Very Large Data Bases 47
Iterative Query Part # 2
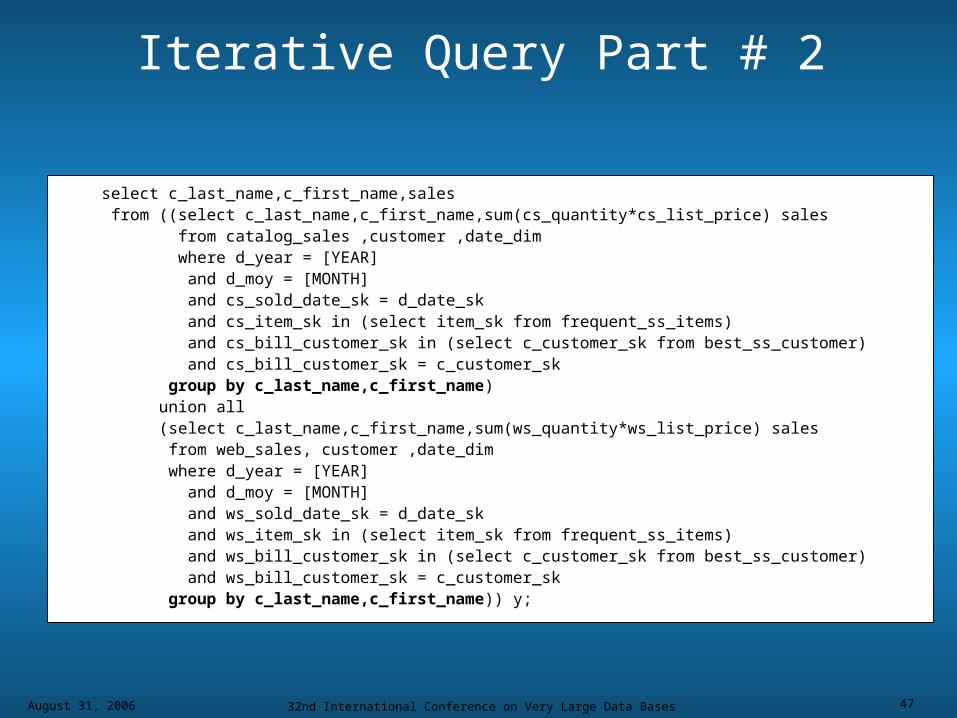
select c_last_name,c_first_name,sales from ((select c_last_name,c_first_name,sum(cs_quantity*cs_list_price) sales from catalog_sales ,customer ,date_dim where d_year = [YEAR] and d_moy = [MONTH] and cs_sold_date_sk = d_date_sk and cs_item_sk in (select item_sk from frequent_ss_items) and cs_bill_customer_sk in (select c_customer_sk from best_ss_customer) and cs_bill_customer_sk = c_customer_sk group by c_last_name,c_first_name) union all (select c_last_name,c_first_name,sum(ws_quantity*ws_list_price) sales from web_sales, customer ,date_dim where d_year = [YEAR] and d_moy = [MONTH] and ws_sold_date_sk = d_date_sk and ws_item_sk in (select item_sk from frequent_ss_items) and ws_bill_customer_sk in (select c_customer_sk from best_ss_customer) and ws_bill_customer_sk = c_customer_sk group by c_last_name,c_first_name)) y;
August 31, 2006 32nd International Conference on Very Large Data Bases 48
Iterative Query Part # 3
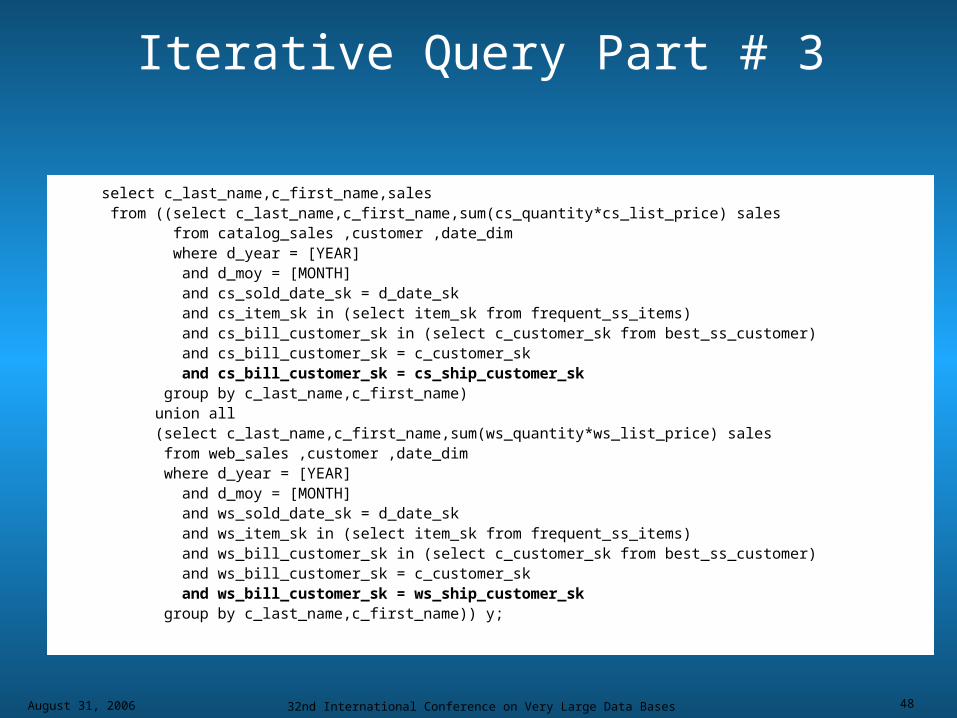
select c_last_name,c_first_name,sales from ((select c_last_name,c_first_name,sum(cs_quantity*cs_list_price) sales from catalog_sales ,customer ,date_dim where d_year = [YEAR] and d_moy = [MONTH] and cs_sold_date_sk = d_date_sk and cs_item_sk in (select item_sk from frequent_ss_items) and cs_bill_customer_sk in (select c_customer_sk from best_ss_customer) and cs_bill_customer_sk = c_customer_sk and cs_bill_customer_sk = cs_ship_customer_sk group by c_last_name,c_first_name) union all (select c_last_name,c_first_name,sum(ws_quantity*ws_list_price) sales from web_sales ,customer ,date_dim where d_year = [YEAR] and d_moy = [MONTH] and ws_sold_date_sk = d_date_sk and ws_item_sk in (select item_sk from frequent_ss_items) and ws_bill_customer_sk in (select c_customer_sk from best_ss_customer) and ws_bill_customer_sk = c_customer_sk and ws_bill_customer_sk = ws_ship_customer_sk group by c_last_name,c_first_name)) y;
August 31, 2006 32nd International Conference on Very Large Data Bases 49
Query Model Advantages
• SQL99 + OLAP extensions• Query templates allow for the generation of
thousands of different queries• Combining of different query classes
− Ad-hoc− Reporting− Iterating− Data mining
• Star schema and “traditional” query execution
August 31, 2006 32nd International Conference on Very Large Data Bases 50
Execution Rules
August 31, 2006 32nd International Conference on Very Large Data Bases 51
SystemSetup
Database Load
QueryRun #1
DataMaintenance
QueryRun #2
Un-timed Timed
DatabaseSetup
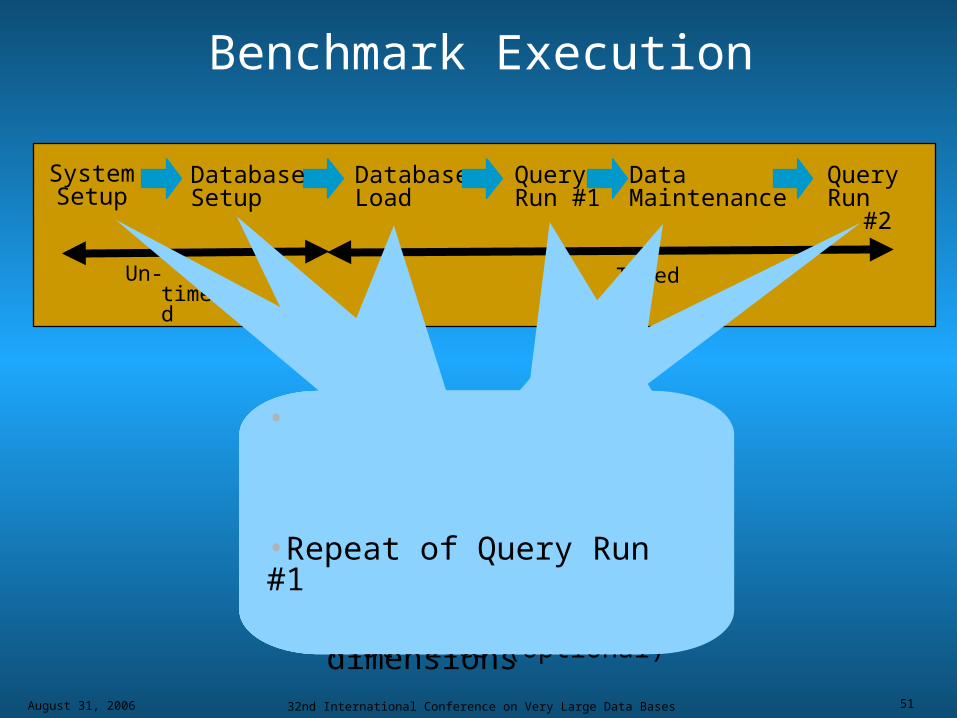
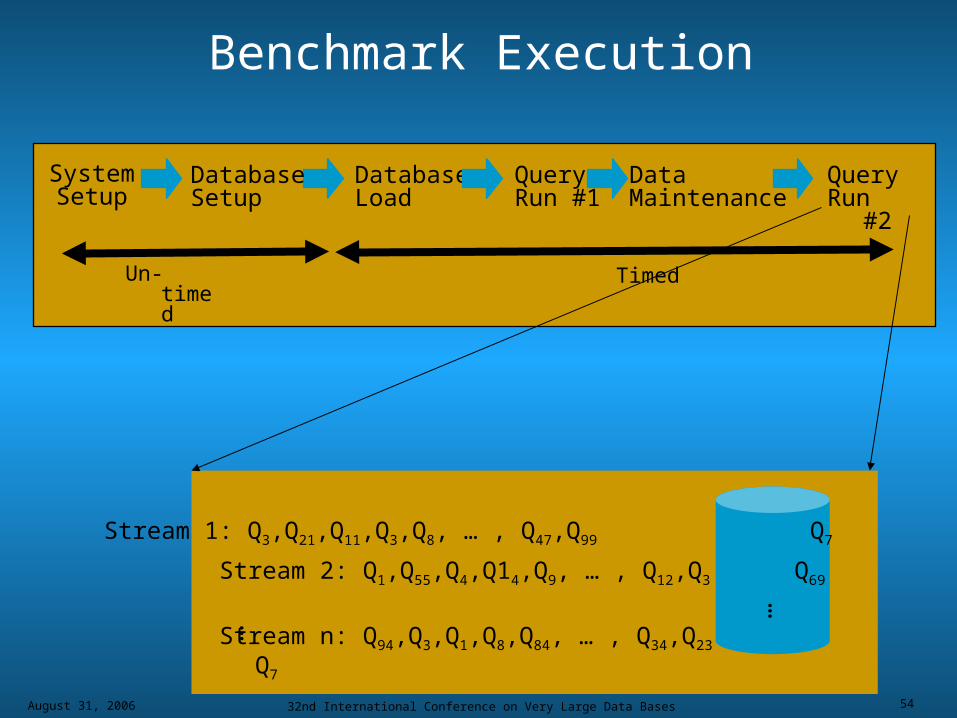
Benchmark Execution
•Creation of: •System tables
•Table spaces
•File Groups
•Log files
•Load of raw data
•Creation of auxiliary data structures
•Statistics gathering
•Setup of:•Servers/ Operating System•Storage Arrays including RAID•Networks•Database Software•Flat files (optional)
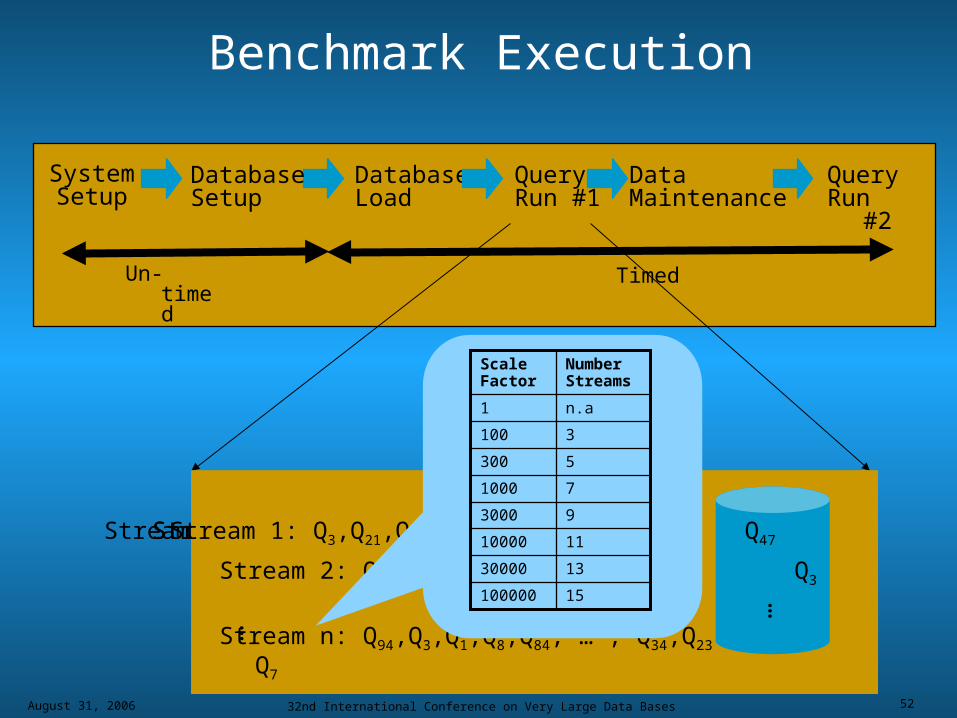
• Runs n streams concurrently, each running• 99 queries • different, random substitutions• simulates n concurrent users
•Load into fact tables•Delete from fact
tables•Maintain slowly
changing dimensions
•
•Repeat of Query Run #1
August 31, 2006 32nd International Conference on Very Large Data Bases 52
SystemSetup
Database Load
QueryRun #1
DataMaintenance
QueryRun #2
Un-timed Timed
DatabaseSetup
Stream 1: Q3,Q21,Q11,Q3,Q8, … , Q47,Q99 Q7
Stream 2: Q1,Q55,Q4,Q14,Q9, … , Q12,Q3 Q69
Stream n: Q94,Q3,Q1,Q8,Q84, … , Q34,Q23
Q7
…
…
Benchmark Execution
Stream 1: Q3,Q21,Q11,Q3,Q8, … , Q47 Q99
Stream 2: Q1,Q55,Q4,Q14,Q9, … , Q12,Q3 Q69
Stream n: Q94,Q3,Q1,Q8,Q84, … , Q34,Q23
Q7
…
…
Stream 1: Q3,Q21,Q11,Q3,Q8, … , Q47 Q99
Stream 2: Q1,Q55,Q4,Q14,Q9, … , Q12 Q3
Stream n: Q94,Q3,Q1,Q8,Q84, … , Q34,Q23
Q7
…
…
Stream 1: Q3,Q21,Q11,Q3,Q8, Q47
Stream 2: Q1,Q55,Q4,Q14,Q9, … , Q12 Q3
Stream n: Q94,Q3,Q1,Q8,Q84, … , Q34,Q23
Q7
…
…
1330000
15100000
1110000
93000
71000
5300
3100
n.a1
Number Streams
Scale Factor
August 31, 2006 32nd International Conference on Very Large Data Bases 53
SystemSetup
Database Load
QueryRun #1
DataMaintenance
QueryRun #2
Un-timed Timed
DatabaseSetup
Benchmark Execution
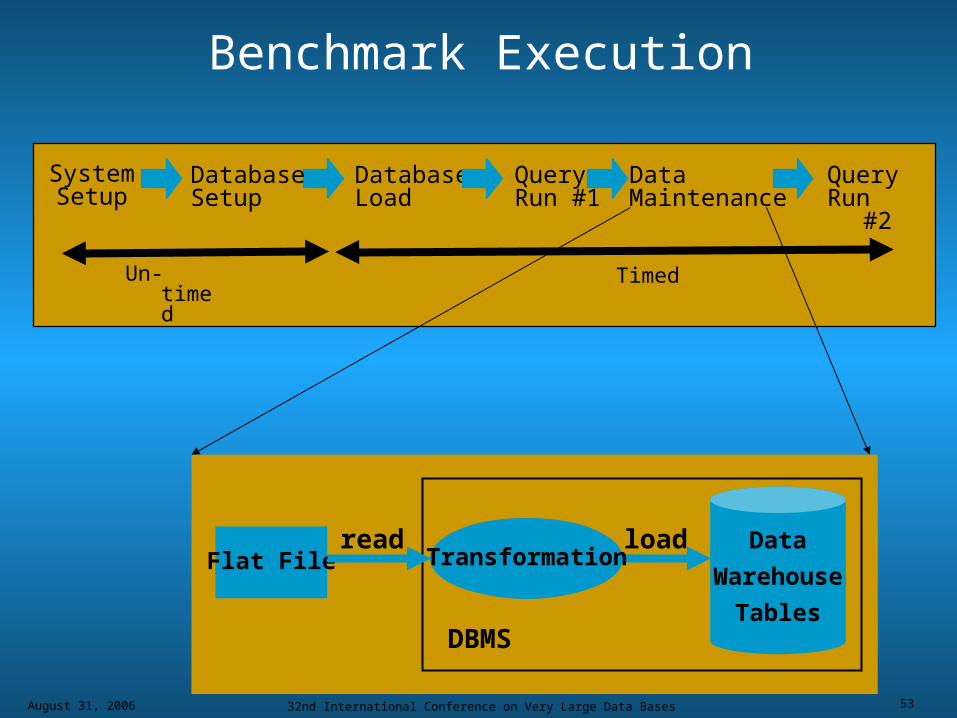
Data
Warehouse
Tables
Flat File
DBMS
read loadTransformation
August 31, 2006 32nd International Conference on Very Large Data Bases 54
SystemSetup
Database Load
QueryRun #1
DataMaintenance
QueryRun #2
Un-timed Timed
DatabaseSetup
Stream 1: Q3,Q21,Q11,Q3,Q8, … , Q47,Q99 Q7
Stream 2: Q1,Q55,Q4,Q14,Q9, … , Q12,Q3 Q69
Stream n: Q94,Q3,Q1,Q8,Q84, … , Q34,Q23
Q7
…
…
Benchmark Execution
August 31, 2006 32nd International Conference on Very Large Data Bases 55
Database Load
• Simulates data warehouse reload• Measures the system’s ability to:
− Load data− Create auxiliary data structures− Gather statistics
• Is part of metric because− Data warehouses get recreated− It prevents using unrealistic auxiliary data
structures
August 31, 2006 32nd International Conference on Very Large Data Bases 56
Execution Query Run #1
• Simulates execution of queries by multiple concurrent users
• Measures the system’s ability to:− Process concurrent query executions in the least
amount of time− Allocate resources efficiently among multiple
concurrent users
• Minimum number of streams required
• Maximum number of streams not limited
August 31, 2006 32nd International Conference on Very Large Data Bases 57
Data Maintenance
• Simulates incremental raw data feeds from an OLTP system
• Costs auxiliary data structures
• Amount of data loaded is linear to the number of streams guarantees significance of DM
• Approach is database centric no ETL tools
August 31, 2006 32nd International Conference on Very Large Data Bases 58
Execution Query Run #2
• Rerun of Query Run #1• Measures the system’s ability to repeat
the results of Query Run #1 after Data Maintenance
August 31, 2006 32nd International Conference on Very Large Data Bases 59
Metric
August 31, 2006 32nd International Conference on Very Large Data Bases 60
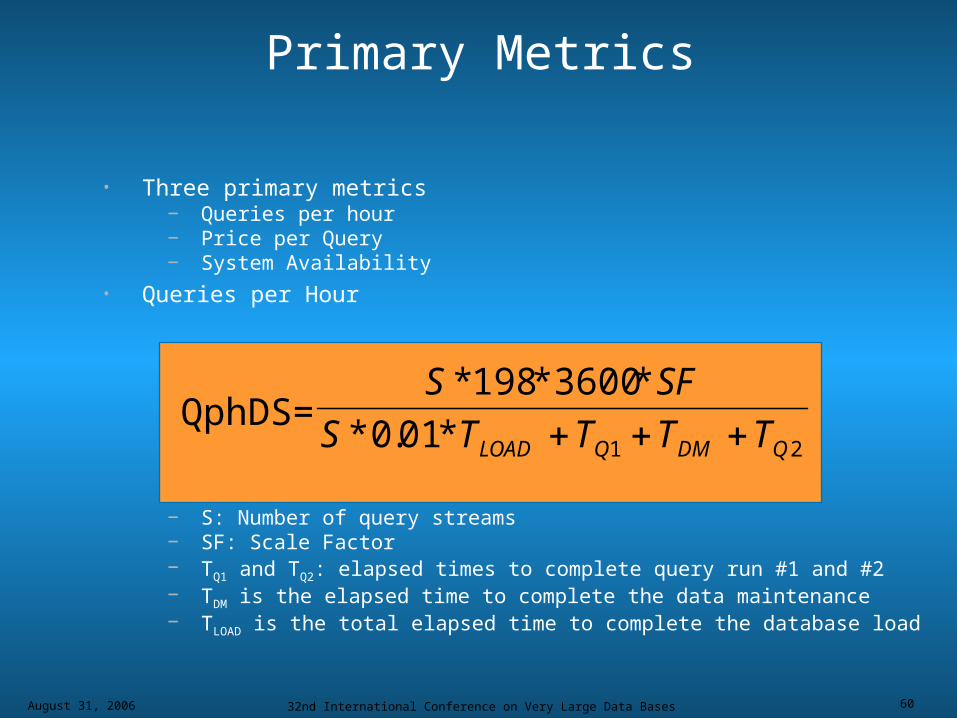
Primary Metrics
• Three primary metrics− Queries per hour− Price per Query− System Availability
• Queries per Hour
− S: Number of query streams− SF: Scale Factor− TQ1 and TQ2: elapsed times to complete query run #1 and #2− TDM is the elapsed time to complete the data maintenance − TLOAD is the total elapsed time to complete the database load
QphDS=21*01.0*
*3600*198*
QDMQLOAD TTTTS
SFS
August 31, 2006 32nd International Conference on Very Large Data Bases 61
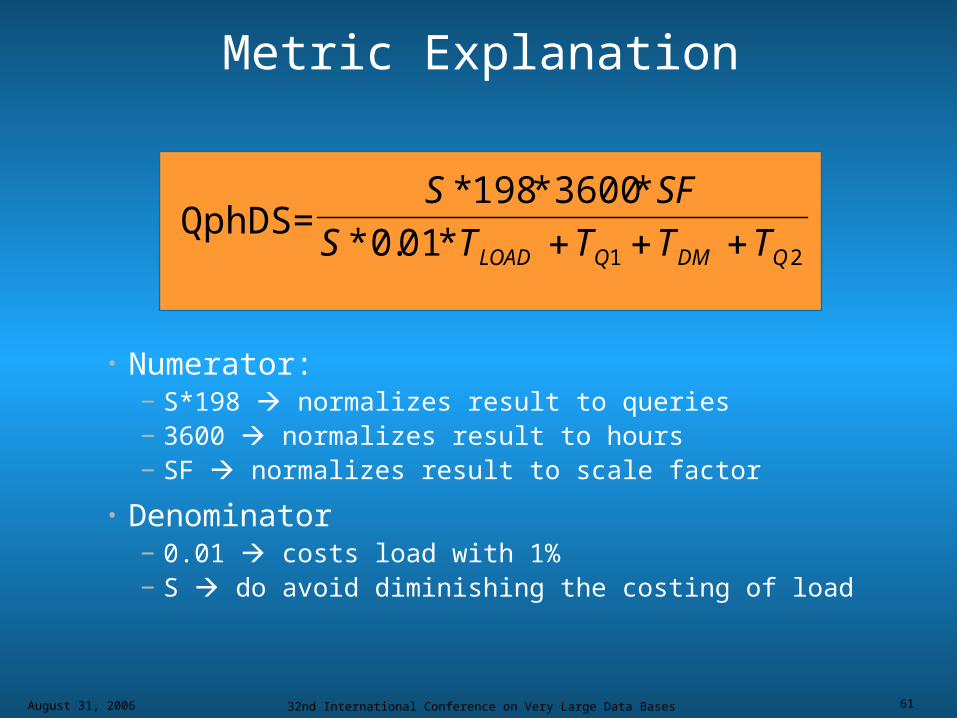
• Numerator:− S*198 normalizes result to queries − 3600 normalizes result to hours− SF normalizes result to scale factor
• Denominator− 0.01 costs load with 1%− S do avoid diminishing the costing of load
QphDS=21*01.0*
*3600*198*
QDMQLOAD TTTTS
SFS
Metric Explanation
August 31, 2006 32nd International Conference on Very Large Data Bases 62
Current Status of TPC-DS Spec
August 31, 2006 32nd International Conference on Very Large Data Bases 63
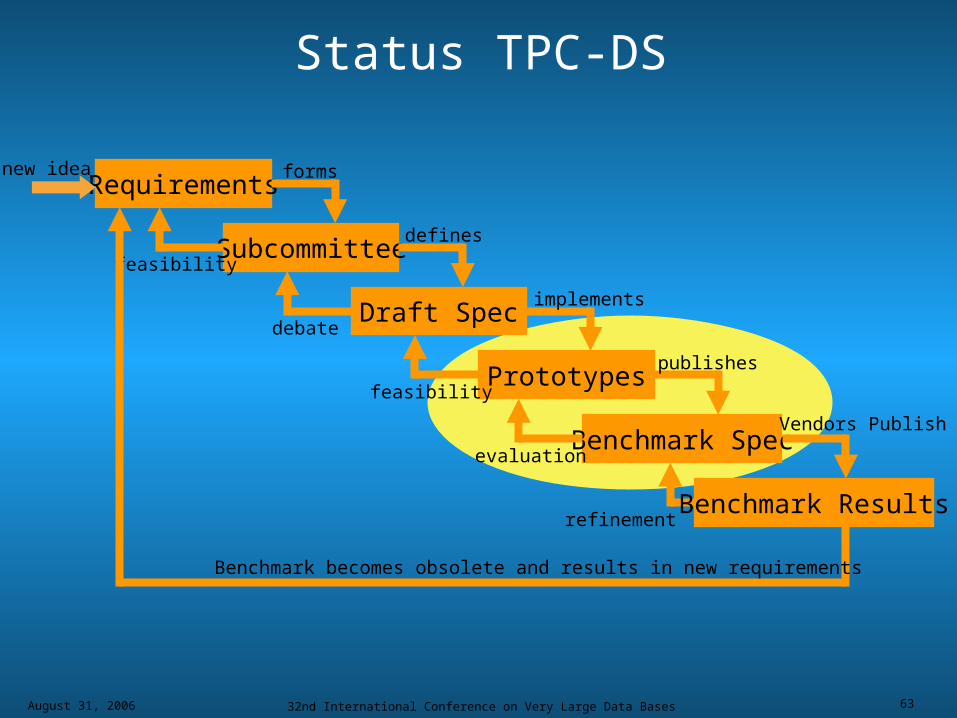
Status TPC-DS
Requirements
Subcommittee
forms
feasibility
Draft Spec
defines
debate
Prototypes
implements
feasibility
Benchmark Spec
publishes
evaluation
Benchmark Results
Vendors Publish
refinement
Benchmark becomes obsolete and results in new requirements
new idea
August 31, 2006 32nd International Conference on Very Large Data Bases 64
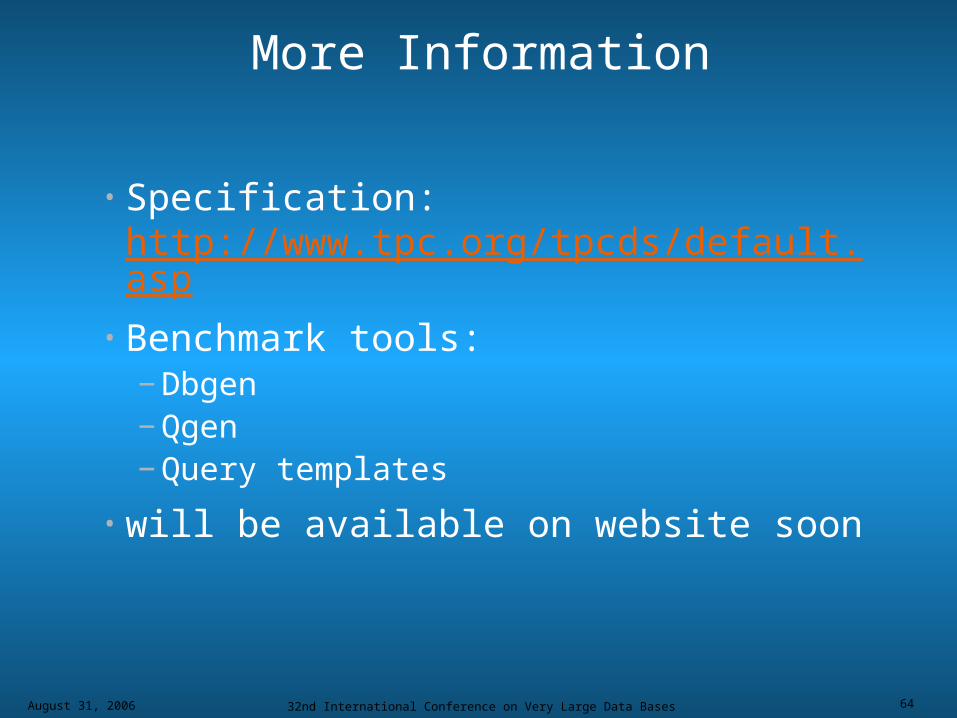
More Information
• Specification: http://www.tpc.org/tpcds/default.asp
• Benchmark tools:− Dbgen− Qgen− Query templates
• will be available on website soon
August 31, 2006 32nd International Conference on Very Large Data Bases 65
Q & A