the management of data, events, and information ... · the management of data, events, and...
TRANSCRIPT
The Management of Data, Events, and InformationPresentation for Network Management
by
Masum Z. Hasan
A thesis
presented to the University of Waterloo
in fulfilment of the
thesis requirement for the degree of
Doctor of Philosophy
in
Computer Science
Waterloo, Ontario, Canada, 1996
c Masum Z. Hasan 1996

I hereby declare that I am the sole author of this thesis.
I authorize the University of Waterloo to lend this thesis to other institutions or indi-
viduals for the purpose of scholarly research.
I further authorize the University of Waterloo to reproduce this thesis by photocopy-
ing or by other means, in total or in part, at the request of other institutions or individuals
for the purpose of scholarly research.
ii

The University of Waterloo requires the signatures of all persons using or photocopy-
ing this thesis. Please sign below, and give address and date.
iii

Abstract
The purpose of a network management (NM) system is to monitor and control a network.Monitoring and control functions entail dealing with large volumes of data, events, and the pre-sentation of relevant information on a management station. In this thesis we focus on data andevents management and information presentation issues of an NM system. Existing NM systemseither use traditional database systems which are not well suited for an NM system or they lackintelligent event and information presentation management frameworks. None of the systemsprovides a unified framework for managing data, events and information presentation tasks on anNM station.
We believe that the complexities of network management can be reduced substantially byexploiting, enhancing and combining the features of new generation database systems such asactive temporal and database visualization systems. In this thesis we show that an active databasesystem where active behaviors are specified as Event-Condition-Action (ECA) rules is a suitableframework for NM data and events management. The Hy+ database visualization system withits sophisticated abstraction and visualization capabilities is well-suited to meet the requirementsof NM information presentation. We also show that by viewing the network as a conceptualglobal database the network management functions can be specified as declarative databasemanipulation operations and Event-Condition-Action (ECA) rules.
But the facilities provided by existing active database systems are not enough for an NMsystem. A number of existing active temporal database systems provide support for a compositeevent specification language (CESL) (used in the E part of an ECA rule) that allows one to relateevents in the temporal dimension. But these languages lack features that otherwise are requiredby certain applications.
We propose a CESL called CEDAR that extends the power of existing languages. CEDARallows a user to specify various event management functionalities in the NM domain, which aredifficult or impossible to specify in existing languages. An implementation model of the lan-guage operators using Colored Petri Nets is proposed. We also propose a model of a networkmanagement database system that incorporates CEDAR into an active database system, and var-ious features required by an NM system. The resulting system (the Hy+-CEDAR system) isintegrated with the Hy+ database visualization system.
iv

Acknowledgements
During the past few years I have had the pleasure and good fortune to meet and work
with many talented and supportive individuals.
First I would like to thank my office mates and colleagues, Mariano Consens, Manny
Noik, and Dimitra Vista for their friendship, and help.
I am indebted to my advisor at the University of Waterloo, Prof. William Cowan for
his support and encouragement. Thanks Bill so much.
I owe much to Prof. Alberto Mendelzon, my co-advisor at the University of Toronto,
who always backed me, both financially and morally, and allowed me unlimited freedom
to explore and to grow, and for that I will remain eternally grateful to him.
In addition to Alberto and Bill, I would like to thank the other members of my thesis
committee: Prof. Mike Bauer, Prof. Edward P.F. Chan, Prof. Ji-Ye Mao, and Prof.
Michael D. McCool.
My warmest thanks to my brothers Shaheen, Miku, and Mamun and my sister Asma
who always wanted to see their brother rise and shine.
Finally, my dear parents. I could not have come to this point without their constant
encouragement from childhood. ”Pursue your studies, no matter what, until you achieve
the highest possible degree” is my father’s motto for us. Yes, I did it. Thanks Abba and
Amma for everything (dad and mom in Bengali), this thesis is dedicated to you.
v
Contents
1 Introduction 1
1.1 Thesis Overview . . . . . . . . . . . . . . . . . . . . . . . . . . . . . 8
2 Network Management Systems 11
2.1 The OSI Reference Model . . . . . . . . . . . . . . . . . . . . . . . . 11
2.2 Network Management . . . . . . . . . . . . . . . . . . . . . . . . . . 14
2.2.1 Functional Management . . . . . . . . . . . . . . . . . . . . . 16
2.3 NM Data and Events . . . . . . . . . . . . . . . . . . . . . . . . . . . 17
2.4 DTNM information presentation . . . . . . . . . . . . . . . . . . . . . 22
2.5 Existing NMDB systems . . . . . . . . . . . . . . . . . . . . . . . . . 24
2.5.1 Commercial Systems . . . . . . . . . . . . . . . . . . . . . . . 25
2.5.2 Yemini et. al.’s System . . . . . . . . . . . . . . . . . . . . . . 25
2.5.3 MANDATE System . . . . . . . . . . . . . . . . . . . . . . . 27
2.5.4 DECmcc System . . . . . . . . . . . . . . . . . . . . . . . . . 28
2.5.5 X.500 based System . . . . . . . . . . . . . . . . . . . . . . . 28
2.5.6 Event Correlation Systems . . . . . . . . . . . . . . . . . . . . 28
2.6 Discussion . . . . . . . . . . . . . . . . . . . . . . . . . . . . . . . . . 29
vi

2.6.1 Proposal for a Network Management Database System . . . . . 31
3 Active and Temporal Databases 33
3.1 Active Databases . . . . . . . . . . . . . . . . . . . . . . . . . . . . . 34
3.1.1 Events in ECA rules . . . . . . . . . . . . . . . . . . . . . . . 35
3.2 Temporal Databases . . . . . . . . . . . . . . . . . . . . . . . . . . . . 38
3.3 Active temporal Databases . . . . . . . . . . . . . . . . . . . . . . . . 42
3.4 Composite Event Specification Languages . . . . . . . . . . . . . . . . 45
3.4.1 ODE . . . . . . . . . . . . . . . . . . . . . . . . . . . . . . . 45
3.4.2 SAMOS . . . . . . . . . . . . . . . . . . . . . . . . . . . . . . 48
3.4.3 Snoop . . . . . . . . . . . . . . . . . . . . . . . . . . . . . . . 49
3.4.4 EPL . . . . . . . . . . . . . . . . . . . . . . . . . . . . . . . . 50
3.4.5 Limitations of the Languages . . . . . . . . . . . . . . . . . . . 53
3.5 Temporal Logic . . . . . . . . . . . . . . . . . . . . . . . . . . . . . . 58
3.6 Discussion . . . . . . . . . . . . . . . . . . . . . . . . . . . . . . . . . 60
4 CEDAR, The Event Specification Language 62
4.1 Events in CEDAR . . . . . . . . . . . . . . . . . . . . . . . . . . . . . 65
4.1.1 Chronon . . . . . . . . . . . . . . . . . . . . . . . . . . . . . 66
4.1.2 Intervals . . . . . . . . . . . . . . . . . . . . . . . . . . . . . . 66
4.2 Definition of CEDAR . . . . . . . . . . . . . . . . . . . . . . . . . . . 67
4.2.1 Syntax and Semantics . . . . . . . . . . . . . . . . . . . . . . 67
4.2.2 Interval operator . . . . . . . . . . . . . . . . . . . . . . . . . 71
4.2.3 Additional Operators . . . . . . . . . . . . . . . . . . . . . . . 71
vii

4.2.4 Event Attributes . . . . . . . . . . . . . . . . . . . . . . . . . 72
4.2.5 Constraining Events through Attributes . . . . . . . . . . . . . 73
4.2.6 Event Expressions with Attributes . . . . . . . . . . . . . . . . 74
4.2.7 Parameter Context . . . . . . . . . . . . . . . . . . . . . . . . 74
5 Operational Semantics of CEDAR using Colored Petri Nets 76
5.1 Colored Petri Net . . . . . . . . . . . . . . . . . . . . . . . . . . . . . 76
5.1.1 Behavior of CPN . . . . . . . . . . . . . . . . . . . . . . . . . 78
5.1.2 Properties - Liveness, Boundedness . . . . . . . . . . . . . . . 80
5.1.3 CPN of the Operators . . . . . . . . . . . . . . . . . . . . . . . 82
5.1.4 Attribute Constraints in CPN . . . . . . . . . . . . . . . . . . . 94
5.1.5 Parameter Context in CPN . . . . . . . . . . . . . . . . . . . . 96
5.1.6 Mapping CEDAR Expressions to CPNs . . . . . . . . . . . . . 97
5.1.7 Implementation . . . . . . . . . . . . . . . . . . . . . . . . . . 98
6 A Network Management Database System 101
6.1 The DB2 Active Database System . . . . . . . . . . . . . . . . . . . . 102
6.2 Mapping CEDAR Expressions to DB2 Triggers . . . . . . . . . . . . . 105
6.3 The Hy+ System . . . . . . . . . . . . . . . . . . . . . . . . . . . . . 107
6.4 Network Management Database . . . . . . . . . . . . . . . . . . . . . 114
6.4.1 CEDAR Rules . . . . . . . . . . . . . . . . . . . . . . . . . . 115
6.4.2 Defining Events in the NMDB . . . . . . . . . . . . . . . . . . 116
6.4.3 Polling or sampling . . . . . . . . . . . . . . . . . . . . . . . . 118
6.4.4 NM by Delegation . . . . . . . . . . . . . . . . . . . . . . . . 119
viii

6.5 The architecture . . . . . . . . . . . . . . . . . . . . . . . . . . . . . . 121
7 Case Study 128
7.1 Visualizing the Network Database . . . . . . . . . . . . . . . . . . . . 129
7.2 A Fault Management Scenario . . . . . . . . . . . . . . . . . . . . . . 134
7.2.1 Defining and Observing Problem Symptoms . . . . . . . . . . 135
7.2.2 Diagnosing a Fault . . . . . . . . . . . . . . . . . . . . . . . . 139
7.3 Example Event Expressions . . . . . . . . . . . . . . . . . . . . . . . 143
7.4 Example ECA Specifications . . . . . . . . . . . . . . . . . . . . . . . 148
7.5 Event Correlation using Hy+ . . . . . . . . . . . . . . . . . . . . . . . 149
8 Conclusion 154
8.1 Limitations and Future Work . . . . . . . . . . . . . . . . . . . . . . . 156
Bibliography 159
A Portion of TCP/IP MIB 170
B Implementation of CEDAR 175
B.1 Composite Event Detector . . . . . . . . . . . . . . . . . . . . . . . . 175
B.2 Sample Run of CEDAR System . . . . . . . . . . . . . . . . . . . . . 180
ix
List of Figures
1.1 TCP links superimposed on the physical topology map. . . . . . . . . . 6
1.2 Thesis Overview . . . . . . . . . . . . . . . . . . . . . . . . . . . . . 10
2.1 The ISO/OSI Reference Model . . . . . . . . . . . . . . . . . . . . . . 12
2.2 Communication between nodes in a network . . . . . . . . . . . . . . . 13
2.3 Manager-Agent Network Management Model . . . . . . . . . . . . . . 16
2.4 Global Network Management Database . . . . . . . . . . . . . . . . . 19
2.5 Example causal relationship between alarm events . . . . . . . . . . . . 21
3.1 A simple Architectural View of Execution of ECA rules . . . . . . . . . 35
3.2 Example: Discount rate cut composite event . . . . . . . . . . . . . . . 37
3.3 Example: Sampling of stock sell events . . . . . . . . . . . . . . . . . 44
3.4 FSM for sequence(E1;E2) . . . . . . . . . . . . . . . . . . . . . . . . 47
3.5 Illustration of Event Detection . . . . . . . . . . . . . . . . . . . . . . 51
3.6 Examples for Parameter Contexts . . . . . . . . . . . . . . . . . . . . . 52
3.7 Parallel entities contributing to global history . . . . . . . . . . . . . . 55
3.8 Comparison of language features . . . . . . . . . . . . . . . . . . . . . 61
x
4.1 Specification of Hysteresis Mechanism . . . . . . . . . . . . . . . . . . 63
4.2 “Persistence” of sampled event . . . . . . . . . . . . . . . . . . . . . . 64
4.3 Eample Composite Event Expression with Aggregation . . . . . . . . . 65
4.4 Example event history of E1 and E2 . . . . . . . . . . . . . . . . . . . 71
5.1 CPN for E1 E2 . . . . . . . . . . . . . . . . . . . . . . . . . . . . . 82
5.2 CPN for E1 fby E2 . . . . . . . . . . . . . . . . . . . . . . . . . . . . 84
5.3 CPN for E1 conc E2 . . . . . . . . . . . . . . . . . . . . . . . . . . . . 85
5.4 CPN for E1 in [I] . . . . . . . . . . . . . . . . . . . . . . . . . . . . . 86
5.5 CPN for E1 in end [I] . . . . . . . . . . . . . . . . . . . . . . . . . . . 87
5.6 CPN for E1 not in [I] . . . . . . . . . . . . . . . . . . . . . . . . . . . 88
5.7 CPN for E1 2 [I] . . . . . . . . . . . . . . . . . . . . . . . . . . . . . 89
5.8 CPN for first(E1) in end [I] . . . . . . . . . . . . . . . . . . . . . . . 90
5.9 CPN for last(E1) in end [I] . . . . . . . . . . . . . . . . . . . . . . . . 91
5.10 CPN for nth (E1) . . . . . . . . . . . . . . . . . . . . . . . . . . . . . 91
5.11 CPN for E1 fs E2 . . . . . . . . . . . . . . . . . . . . . . . . . . . . . 92
5.12 The default CPN for E1 � E2 . . . . . . . . . . . . . . . . . . . . . . . 93
5.13 CPN for [E1, 10 minute] . . . . . . . . . . . . . . . . . . . . . . . . . 94
5.14 CTPN for [E1, 10 minute] . . . . . . . . . . . . . . . . . . . . . . . . . 95
5.15 CPN for max(E1:a) fs E2 . . . . . . . . . . . . . . . . . . . . . . . . . 96
5.16 CPN for count and avg . . . . . . . . . . . . . . . . . . . . . . . . . . 97
5.17 CPN for� and fby operators in Chronicle context . . . . . . . . . . . . 99
5.18 Parse tree for E = ((E1 � E2) fby (E3 E4)) in [E5;E6] . . . . . . . . 100
6.1 Mapping CEDAR expressions to DB2 Triggers . . . . . . . . . . . . . 108
xi

6.2 Visualizing tuples. . . . . . . . . . . . . . . . . . . . . . . . . . . . . . 109
6.3 Visualizing a Hygraph. . . . . . . . . . . . . . . . . . . . . . . . . . . 109
6.4 Browsing the example database. . . . . . . . . . . . . . . . . . . . . . 110
6.5 Example GraphLog queries and result. . . . . . . . . . . . . . . . . . . 112
6.6 Request for NM data . . . . . . . . . . . . . . . . . . . . . . . . . . . 115
6.7 Translation of data-pattern statement . . . . . . . . . . . . . . . . . . . 123
6.8 Example translation of data-pattern event statement . . . . . . . . . . . 124
6.9 NM by Delegation . . . . . . . . . . . . . . . . . . . . . . . . . . . . 125
6.10 A conceptual architecture of an NM system . . . . . . . . . . . . . . . 126
6.11 An example distributed architecture of an NM system . . . . . . . . . . 127
7.1 Defining subnets over the physical network topology. . . . . . . . . . . 129
7.2 Defining and displaying the logical network layer map. . . . . . . . . . 132
7.3 History trace of MIB objects for boomer. . . . . . . . . . . . . . . . . 133
7.4 Traffic information displayed against the topology map. . . . . . . . . . 137
7.5 Defining an alert for possible problem symptoms. . . . . . . . . . . . . 138
7.6 Highlighting congested gateways in the logical map. . . . . . . . . . . 140
7.7 TCP links superimposed on the physical topology map. . . . . . . . . . 142
7.8 Specification of Hysteresis Mechanism . . . . . . . . . . . . . . . . . . 146
7.9 “Persistence” of sampled event . . . . . . . . . . . . . . . . . . . . . . 147
7.10 Diagramatic View of the rule sequences . . . . . . . . . . . . . . . . . 151
7.11 Queries to form causality graph. . . . . . . . . . . . . . . . . . . . . . 152
7.12 Event correlation group hygraphs. . . . . . . . . . . . . . . . . . . . . 153
B.1 CEDAR expression mapping process . . . . . . . . . . . . . . . . . . . 175
xii
Chapter 1
Introduction
Data and telecommunications network management (DTNM) is an emerging research
area where the issues of monitoring and control of large heterogeneous networks are ad-
dressed. A DTNM system has to deal with large volumes of data and events and present
relevant information for human operators on a management station. The management
of network management (NM) data, events, and information presentation poses a ma-
jor research and development challenge. In this thesis we propose that management of
NM data, events and information presentation can be carried out gracefully by state-of-
the-art next-generation database systems. Over the past several years there has been a
surge of research interests in the area of active and temporal database systems. Visu-
alization of large data-sets or databases is also an active research area. Active temporal
databases and database visualization systems have been proved to be useful for various
applications. We propose that a database system that combines and extends the features
of active temporal and database visualization systems, is well suited for an NM system
(NMS).
1

CHAPTER 1. INTRODUCTION 2
The purpose of a DTNM system is to provide smooth functioning of a large het-
erogeneous network through monitoring and controlling of network behavior. Various
standards organizations for data and telecommunications networking have defined five
management functionalities that are needed to aid in overall management of a network:
configuration, fault, performance, security, and accounting management [ISOb]. These
management functionalities provide facilities for overall graceful functioning of a net-
work on both day-to-day and long-term basis. All of the functionalities entail dealing
with large volumes of data and events. Management data and events have to be mapped
into appropriate form and presented on a management station for human consumption.
Hence network management in a sense is management of data, events, and information
presentation.
A database system is one of the major components of an NMS. Existing NMSs use
traditional database systems which are not well suited for an NMS. The database systems
used in these systems are not well integrated into the system and are mainly used for
offline analysis of data (trends analysis).
A management system also has to manage large volumes of events. An NMS has to
react to events occurring in the network and perform appropriate monitoring and con-
trol actions. The management system can not and should not react to every single event
occurring in the network. There should be facilities for intelligent reaction to events,
for example, reacting to events only when certain criteria are satisfied. In other words,
events have to be filtered based on certain criteria. Event filtering can be performed by
correlating events based on various relationships such as, temporal or causal relationship
between events. When the correlated composite event happens the system should be ca-
CHAPTER 1. INTRODUCTION 3
pable of automatically initiating necessary action(s). Most of the existing event manage-
ment or event correlation systems do not provide facilities for declarative specification of
event correlation. They provide only causality based event correlation. Temporal event
correlation is not provided by these systems.
A fundamental feature of an advanced network management station is the capability
to present to the human manager a complete picture of the relevant scenarios. The over-
whelming volume and complexity of the information involved in network management
scenarios poses a major challenge. In existing systems information presentation or visu-
alization is fixed, that is, a mechanism for declarative specification of what we want to
visualize, is not provided by these systems.
The unique properties of NM data, events, and functionalities require the support of
non-traditional database systems. We consider NM as NM database management, where
the management system manages data, events, and information presentation from a uni-
fied framework. We show that by viewing the network as a conceptual global database,
the network management functions can be specified as declarative database manipulation
operations, which reduces the complexity involved in managing data to a great extent.
We believe that an active temporal database system with the added features of a database
visualization system is a framework well-suited for an NMS.
An active database system (ADB) is capable of dealing with large volumes of data
and events, and firing necessary action(s) in response to events. The active behavior in
an active database system is specified as Event-Condition-Action (ECA) rules [MD89].
An ECA rule specifies that if event(s) happen (E), the specified condition (C) is satisfied
on the database, then fire the action (A), which can be a database manipulation operation
CHAPTER 1. INTRODUCTION 4
and/or a procedural action. We propose that NM functions be specified as ECA rules.
A number of ADB systems support composite event specification languages (CESL)
[GJS92a, GD94, CKAK94, MZ96] that allow temporal correlation of ADB events. But
the existing CESLs are not well-suited for the specification of event management re-
quirements of NM. For example, composite event expression involving aggregation on
event attributes, and “persistent” composite events, that is events that are repeated at ev-
ery sampling interval points in a particular time interval, can not be easily expressed (if at
all) in existing languages. We have developed a composite event specification language
called CEDAR (Composite Event Definition for Active Rules) to be used in the E part of
an ECA rule, whose operators allow one to specify temporal relationship between basic
events (for example, first rising threshold crossing event since the recent falling thresh-
old crossing event), and other operations on events, such as, compression, suppression,
filtering, aggregation, and counting. The language is well suited for network manage-
ment domain. An implementation model of the language operators using Colored Petri
Nets [JR91] is proposed. A colored Petri net is a suitable framework for expressing the
operational semantics of the language operators, and also for implementing composite
event detectors. The net is incremental by nature, that is, we do not have to look at the
whole past history when a new event occurs.
The novel database visualization concepts used in the Hy+ system [CEH+94] can
provide a suitable framework for the information presentation requirements of advanced
network management stations. A database visualization system is capable of manipu-
lating data visualization through visually expressed queries. The Hy+ system provides
a uniform framework for hygraph based data visualization, queries, and their results.

CHAPTER 1. INTRODUCTION 5
Visual queries, expressed in the GraphLog language [CM90a], are interpreted as pat-
terns that match existing visualization and create new ones. A prime example of the
functionality supported by the system consists of describing a query that filters a large
visualization to retain the portion that is of interest for the network manager in the con-
text of a particular task. Examples of data visualization that are relevant for network
management are the network topology at different levels of abstraction, the presentation
of relevant management information in response to events in the system, etc.
To manage NM data, events, and information presentation from a unified framework,
a unified architecture for a network management database system (the Hy+-CEDAR
system) that combines and extends the features of an active temporal database system
and the Hy+ database visualization system, is proposed. The Hy+-CEDAR system
� supports unique properties of NM data and functions,
� supports Declarative specification of NM functions,
� provides transparent access to the underlying system.
The system will allow one to specify network management functions as ECA rules,
where the action of a rule among other supported actions in an active database system,
may also refer to Graphlog statements. Graphlog statements, for example, may be used
to filter out appropriate visualization in response to events and, present the result to the
management station. For example, when an alert is generated, only the affected portion
of the network (topology) will be visualized. Following is a motivating example where
NM functions are specified as ECA rules: event correlation as CEDAR expressions and
management of data and NM information visualization as GraphLog statements. The
CHAPTER 1. INTRODUCTION 6
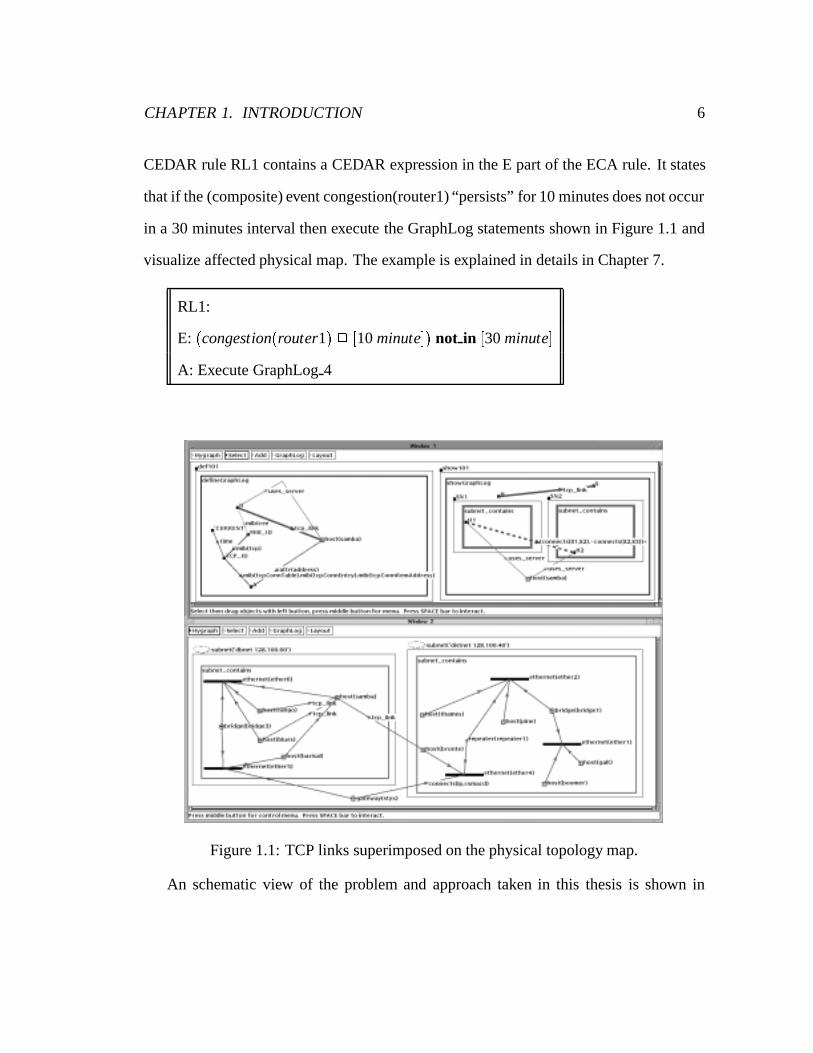
CEDAR rule RL1 contains a CEDAR expression in the E part of the ECA rule. It states
that if the (composite) event congestion(router1) “persists” for 10 minutes does not occur
in a 30 minutes interval then execute the GraphLog statements shown in Figure 1.1 and
visualize affected physical map. The example is explained in details in Chapter 7.
RL1:
E: (congestion(router1) 2 [10 minute]) not in [30 minute]
A: Execute GraphLog 4
Figure 1.1: TCP links superimposed on the physical topology map.
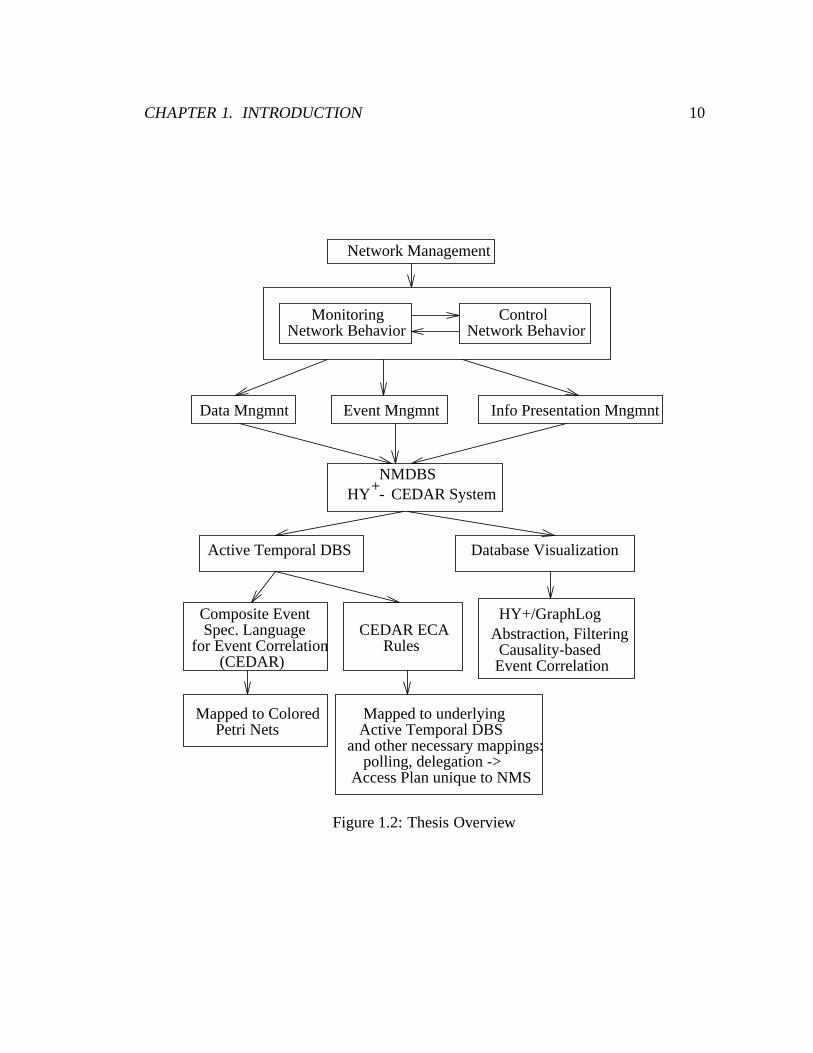
An schematic view of the problem and approach taken in this thesis is shown in
CHAPTER 1. INTRODUCTION 7
Figure 1.2.
The thesis contributions can be summerised as follows:
� Network Management:
1. Proposal for a NM database system that
– considers properties of NM data, events, and functionalities,
– provides transparent access to NM data.
2. A powerful framework for NM events management:
– deals with sophisticated event correlation.
3. A model of visual information presentation on NM stations.
4. An architecture of an NM system (Hy+- CEDAR System) that
– combines and extends the features of active temporal databases and database
visualization systems,
– deals with NM data, events, and information presentation from a unified
framework.
� Active Temporal Databases:
1. An expressive Composite Event Specification Language (CEDAR) with fea-
tures lacking in others.
2. An incremental implementation model of the language operators and expres-
sions using Colored Petri Nets.

CHAPTER 1. INTRODUCTION 8
1.1 Thesis Overview
The rest of the thesis is organized as follows.
In Chapter 2 we introduce NM systems, standards, and terminologies. We then in-
vestigate the properties of NM data, events, and functionalities. Issues related to event
management and DTNM information presentation are discussed. We then proceed to
discuss the existing NM database systems, and their limitations.
A brief introduction to active, temporal, and active temporal databases is provided in
Chapter 3. The existing CESLs are introduced with a discussion on their limitations.
The proposed CESL CEDAR is introduced in Chapter 4. The syntax and semantics
of CEDAR are provided.
The implementation model of CEDAR using colored Petri nets is discussed in Chap-
ter 5. The CPNs of the basic CEDAR operators and a number of additional operators are
provided in this chapter.
In Chapter 6 we propose a network management database system that combines the
features of active temporal and database visualization system. The DB2 active relational
and the Hy+ database visualization systems are discussed in the chapter. We show how
the composite events corresponding to CEDAR expressions can be detected using the
primitive DB2 trigger facilities. Various features of the proposed NMDB system will
be discussed in this chapter. We then proceed to show the architecture of the proposed
NMDB system.
An extensive case study employing the features of CEDAR, active temporal databases,
GraphLog and the Hy+ database visualization system is provided in Chapter 7. We
show various visualization of NM databases at different levels of abstraction, interesting

CHAPTER 1. INTRODUCTION 9
CEDAR expressions specifying composite events and ECA rules specifying the moni-
toring and controlling actions for network management. We then show how the Hy+
system can be used for causality based event correlation and the necessary visualization.
We conclude in Chapter 8 with a discussion of limitations of the proposed system
and references to future works.
Appendix A provides an example specification of a Management Information Base
(MIB), in particular, a portion of the TCP/IP MIB.
Appendix B describes the current implementation of the CEDAR system. A script of
a number of execution sessions of the CEDAR system is also provided.
CHAPTER 1. INTRODUCTION 10
ControlNetwork Behavior
MonitoringNetwork Behavior
Network Management
Data Mngmnt Info Presentation MngmntEvent Mngmnt
Database Visualization
and other necessary mappings:
Access Plan unique to NMS
RulesCEDAR ECA
Mapped to underlyingActive Temporal DBS
polling, delegation ->
Petri NetsMapped to Colored
HY+/GraphLogAbstraction, FilteringCausality-based Event Correlation
Active Temporal DBS
NMDBSHY+- CEDAR System
Composite Event Spec. Language
for Event Correlation(CEDAR)
Figure 1.2: Thesis Overview
Chapter 2
Network Management Systems
In this chapter we will first briefly discuss the ISO/OSI network model. The issues of
NM, and NM standards will be discussed next. We will then discuss the nature of NM
data and events, issues involving event management, and the information presentation
(visualization) requirements of an NM station. We will investigate how and whether the
existing NMDB systems provide the facilities required to deal with the management of
NM data and events, and the information presentation on an NM station.
2.1 The OSI Reference Model
Modern computer networks are complex systems consisting of wide variety of hardware
and software resources. To reduce the complexities involved in the design, installation
and operation of a network, the network resources have to be organized in a structured
way. It is also necessary to devise standards so that the wide variety of resources can
communicate with one another in a graceful manner. The International Organization of
11

CHAPTER 2. NETWORK MANAGEMENT SYSTEMS 12
1
2
3
4
5
6
7
Physical
Data Link
Network
Transport
Session
Presentation
Application
Figure 2.1: The ISO/OSI Reference Model
Standardization (ISO) has developed a network model called Open Systems Interconnec-
tion (OSI) reference model [Tan88]. The model divides the network into seven abstract
layers as shown in Figure 2.1. Each layer in the model performs its unique functional
subtasks (services) independently and in coordination with the other layers. In general,
the services provided by the layer n use the services provided by the layer n�1. A layer
n in one machine carries a conversation with the layer n on another machine (Figure 2.2).
The rules used in these conversations are collectively known as the layer n (communica-
tion) protocol.

CHAPTER 2. NETWORK MANAGEMENT SYSTEMS 13
The application layer is the layer where an end-user interacts with the network. For
example, the application software such as electronic mail, file transfer etc. reside at this
layer. The network itself is abstracted into the lower three layers. The physical layer
is responsible for transmitting raw bits or signals through the transmission media that
connect the networks together. The data link layer provides an error free transmission
service to the network layer. The functionalities in this layer are dependent on various
networking technologies, such as, Ethernet, Token-ring, FDDI, etc. The main purpose
of the network layer is to route data packets from one network to another. The transport
layer deals with end to end (reliable) delivery of data packets exchanged between appli-
cation systems at the layer seven. An example of data flow and protocol conversation
between two end nodes (hosts) is shown in Figure 2.2.
1
2
3
4
5
6
7
1
2
3
4
5
6
7
1
2
3
1
2
3
Router
Host Host
Router
Protocol Conversation
Figure 2.2: Communication between nodes in a network

CHAPTER 2. NETWORK MANAGEMENT SYSTEMS 14
2.2 Network Management
Managing a large heterogeneous network is a complex task. The proposed network man-
agement standards for TCP/IP based Internets [RM, CFSD, MR] and the ISO-OSI net-
work management standard [ISOb, ISOc, ISOd, ISOe, ISOa] are attempts by the stan-
dards organizations to reduce the complexity involved. The manager-agent paradigm,
where the manager maintains a global picture of the network, has been proposed in both
standards. The management station is the control center of the network. An NMS is
specially concerned with managing and controlling the network resources (hardware and
software) residing in the lower four layers of the ISO OSI reference model. An NMS
itself resides in the application layer.
The hardware resources such as hosts, routers, bridges, workstations, switches, trans-
mission media, etc., are known as network elements (NE) or managed devices. The soft-
ware resources managed by an NMS system are generally the abstract protocol related
objects in an NE. For example, the number of data packets flowing in and out of an in-
terface, the routing table of a router, etc. The hardware and software resources managed
by an NMS are abstracted into what are called managed objects (MO). The collection of
managed object instances defines a virtual information store called a management infor-
mation base (MIB). The structure or the schema of managed objects or a MIB is defined
using a framework called the structure of management information (SMI). The SMI de-
fines the rules for grouping and naming of MOs, the allowed operations, permitted data
types, and the syntax for specifying MIB. The abstract syntax notation one (ASN.1) is
used to define the syntax of MOs in a MIB. The ASN.1 is the OSI language for de-
scribing syntax of abstract objects in a machine-independent format. The SMI rules and

CHAPTER 2. NETWORK MANAGEMENT SYSTEMS 15
the ASN.1 language can be thought as a data definition language (DDL) for defining
schema of a MIB. An example of a MIB definition (a portion of the TCP MIB) is shown
in Appendix A.
The exchange of management information is based on a manager-agent model. An
agent is a management software residing in the application layer of a managed device.
The agent collects and stores the data (MO instances) embodied in a MIB. A manager is
a management software residing in the application layer of a management station which
is the control center of a network. A management protocol is used to exchange man-
agement information between agents and managers. For example, simple network man-
agement protocol (SNMP) [Sta93] is the standard management protocol for the TCP/IP
based Internet and common management information protocol (CMIP) [Sta93] is the
management protocol for ISO/OSI based networks. A protocol consists of a set of ac-
cess methods (operations) that are used to exchange MIB data between a manager and
an agent. Examples of protocol operations include Get, to fetch a managed object, Set,
to update a managed object, Inform/Notify, to notify asynchronously a manager about
an event. Figure 2.3 shows the interaction between a manager and NEs managed by the
manager.
The management model shown in Figure 2.3 is one to many, that is, a single manager
manages multiple devices. There exist also hierarchical management models where an
agent can function as a mid-level manager. The ISO/OSI management model and the
Internet management system SNMPv2 [Sta93] are based on a hierarchical model.

CHAPTER 2. NETWORK MANAGEMENT SYSTEMS 16
Agent Agent Agent
MIB MIB MIB
Network Management Station
Manager
Management Protocol Request
(SNMP or CMIP)
Managed Device Managed Device Managed Device
Figure 2.3: Manager-Agent Network Management Model
2.2.1 Functional Management
The Management Framework for OSI [ISOb] defines the following five functional ele-
ments for NM:
� Performance management (PM): deals with the task of optimizing the quality of
service (QOS) of a network. PM includes performance measurement of managed
objects at regular intervals (such as, monitor traffic load, network utilization), iden-
tification, correction and avoidance of performance problems. The measurement
data may be logged for future use, for example, for trends analysis.
CHAPTER 2. NETWORK MANAGEMENT SYSTEMS 17
� Fault management (FM) provides mechanism for the detection of problems, fault
isolation and correction to normal operation. Faults are generally exhibited through
alarms or events. Alarms can be notified asynchronously by an NE or detected
through monitoring. PM and FM are interrelated. For example, performance
degradation can be thought as a (soft) fault.
� Configuration management (CM) deals with the logical and physical configura-
tions of MOs and NEs. For example, recording of current topology of the network,
provisioning of new NEs and services, etc., are part of the functions provided by
CM.
� Accounting management (AM) pertains to logging information relating to the us-
age of the network resources by the customers. The information is used to provide
billing to the network users.
� Security management (SM) deals with authorization and authentication of the us-
age of network resources. SM includes alarm generation upon a security violation,
and recording of security logs.
All of the above functions are interrelated and an NMS supporting these functions
has to deal with large volumes of distributed data and events.
2.3 NM Data and Events
The management of a network is generally performed through two activities: monitoring
and controlling. Monitoring is performed for two purposes: collection of data traces
CHAPTER 2. NETWORK MANAGEMENT SYSTEMS 18
for current and future analysis and watching for interesting events. An occurrence of an
event or a set of interrelated events may cause further monitoring or controlling action.
Note that, since events formalized as tuples may be stored in the database, when we use
the word data, it will mean both data and events.
An NMS generally has to deal with two types of data: static and dynamic. Static
data either never changes or changes very infrequently. The configuration management
data such as the topology of the network, hardware and software network configurations,
customers information etc. and the stored history traces of both dynamic and static data
constitute the static portion of the NM-related data. For the purpose of management and
control, the behavior of a network is continuously monitored. The behavior is observed
by monitoring the states of the MOs. An NE can also emit data or events asynchronously,
for example, the various alarms generated by NEs. The monitored, sampled or measured
data and the data generated asynchronously constitute the dynamic portion of the NM-
related data. The past and present, static and dynamic data form a conceptual global
database which allows a management station to see the global picture of the network
(Figure 2.4).
An event is generally defined as an instantaneous “happening” at a point in time. The
NM Events are detected through observation from one or more observation control points
(OCP), for example, a manager. An event may occur asynchronously (for example, link
down), and as soon as it happens it is reported to the OCP. Other events that happen in
the network may not be reported asynchronously to the OCP, but they are detected when
they are observed through monitoring actions. For example, polling (or sampling) of
MO values at regular intervals is one form of monitoring action performed by an OCP

CHAPTER 2. NETWORK MANAGEMENT SYSTEMS 19
Static Data History of (observed)Dynamic Data
Distributed (MIB) Data
Manager
Network Management Database
(Served by Agents and/orother Managers )
Network
Figure 2.4: Global Network Management Database
or NMS. In this case, events are detected at the time of sampling, that is, the events are
said to happen at a point in time when the OCP polls or samples them. The polling
action itself can be considered as an event whose occurrence at regular intervals triggers
monitoring action, for example, retrieval of MO values from the network. An event can
also be inferred from a (complex) pattern of data appearing in the observed world. As
soon as the pattern appears, the event is said to happen. The latter is called a data-pattern
event in [WSY91]. An example of a data pattern event is the crossing of a threshold value
of an MO. A data pattern event may also be defined as a more complex pattern involving
more than one MO.
Event management is one of the central topics in NM. All of the functional elements

CHAPTER 2. NETWORK MANAGEMENT SYSTEMS 20
defined by the standards organizations (discussed before) have to deal with or manage
large volumes of events. Event management pertains to detection, isolation and correla-
tion of events occurring in a network. Event correlation aids in the:
� Reduction in alarm events reported to an NM station.
� Quick isolation and possible correction of fault.
� Detection of various composite events or event patterns which are a set of interre-
lated events, related on various properties.
� Execution of monitoring and control function in a more controlled way.
� Prediction of network behavior, and trends analysis.
Event correlation is a complex task. In order to correlate huge number of disparate
events various factors, such as, type of events, structure or topology of networks, causal,
temporal relationship between events, etc., have to be considered. For example, a single
fault or problem (manifested as an alarm or event) may cause various other alarms, which
in turn may show a resulting fault or problem (manifested as an alarm). If all of these
alarms are reported to an NM station without analysis, then the operator will be over-
whelmed and may not be able to detect the real cause, as the number of alarms generated
may be very large. If the various relationships between events (an example taken from
[Nyg95] is shown in Figure 2.5 where the causal relationship between alarms generated
from a switch is shown) and the network configuration information are known, then the
alarm(s) that have to be taken care of can be quickly isolated. The other intermediary
alarms can just be ignored. Events may also have to be correlated based on their order

CHAPTER 2. NETWORK MANAGEMENT SYSTEMS 21
SWITCH ISO
PATH LOSS
LINK FAIL
HDWR FAIL CNGSTN RESTART
OVERLOAD FAIL
HI TRAFFIC DEMAND
Figure 2.5: Example causal relationship between alarm events
of occurrences (temporal relationship). For example, a composite (alert) event may be
defined which occurs when
� the interval during which three successive server overload events occur is over-
lapped with the interval of three successive observation of large packets on the
local net from unauthorized destination, or
� server utilization crosses (up) a rising threshold for the first time since an earlier
crossing (up) of a falling threshold (Figure 7.8), etc.
In general, an event correlation system may have to deal with the following:
� compression,

CHAPTER 2. NETWORK MANAGEMENT SYSTEMS 22
� suppression,
� filtering,
� aggregation,
� counting of events, and
� establishment of temporal,
� causal,
� structural (as defined by the network connectivity) relationships between events.
In order to correlate events certain “rules” or specifications have to be provided to
an NM system. A composite event is detected or events are correlated when a pat-
tern of events satisfies a specification or a rule. The specifications or rules constitute a
knowledge-base which aids in correlating events.
2.4 DTNM information presentation
Data in a network database can be characterized in terms of the five functional manage-
ment subsystems identified by ISO: configuration, fault, performance, security and ac-
counting [ISOb]. All of these subsystems and their related data are heavily interrelated.
Furthermore, the complexity of interconnection networks requires views at different lev-
els of abstraction for managing, operating and controlling these networks.
One of the most important features that a network management station should possess
is a powerful presentation mechanism: i.e., one capable of displaying a variety of man-
agement scenarios. The complexity of managing, operating and controlling networks is

CHAPTER 2. NETWORK MANAGEMENT SYSTEMS 23
reduced by systematically imposing different levels of abstraction onto the network. By
doing so, functional management can be performed in a meaningful and structured way.
One of the abstractions is the ISO-OSI reference model based protocol software layering
(vertical layering). To manage and control the network in a structured and graceful man-
ner we also need a horizontal layering as stated in [Val91] where the following views at
different levels of abstraction are listed: geographical view (site of components, struc-
tured by countries, areas, cities, buildings, floors, rooms), physical view (components
and media with their connectivity and physical characteristics), protocol view (protocol-
specific attributes for LAN-segments and subnets, etc.), application view (client-server
relationships), and administrative view (structured according to administrative responsi-
bilities within the network, e.g., domains). In addition, views may incorporate a history
view consisting of information about the evolution of the network and its status over time
[WSY91].
There is an explicit visual component, the topology of the network, that we need to
incorporate in the network management system. It is common to visualize the logical
and physical maps as graphs. Data that are not commonly presented as interconnection
structure, can also be visualized as virtual interconnection structures. For example, a
TCP connection table can be depicted as a host connecting to another host. For the pur-
pose of abstraction and visualization it is often advantageous to consider the physical
view together with the protocol view. Then we must distinguish between two different
views of the topology map: the logical map which corresponds to the network layer,
and the physical map which corresponds to the datalink and physical layers. The net-
work addressing mechanism (e.g., IP) imposes a logical or network layer map of the

CHAPTER 2. NETWORK MANAGEMENT SYSTEMS 24
network. For example, the subnet mechanism in a TCP/IP network imposes a logical
(subnet) map (Window 2 of Figure 7.2). Bridges, repeaters, cables, etc. are datalink and
physical layer objects. The interconnection of these objects constitutes a physical map
(Window 2 of Figure 7.1). The logical and physical layer maps can further be abstracted
into maps corresponding to geographical and administrative views. The clustering of
network elements according to the views of the network at different levels of abstraction
is emphasized in [KMG88].
The limitation in the size of the presentation media makes it difficult to visualize
what is going on in the network. It might be impossible to squeeze a large and complex
network with hundreds and thousands of devices and complex interconnection structures
into one single screen, even if we use very sophisticated layout algorithms. When a
problem occurs in the network, it would be helpful to see only the relevant areas of the
network (for example, overloaded areas or local area networks that are having unusual
delays). It would be nice to be able to specify what we want in a simple and declarative
way, filter out the problem area and visualize it in terms of the topology of the network
and the views at different levels of abstraction.
2.5 Existing NMDB systems
An NM system has to deal with large volumes of data and events. Hence a database
system should be a major component of an NM system. But relatively little work has
been done on the issues of a network management database system.

CHAPTER 2. NETWORK MANAGEMENT SYSTEMS 25
2.5.1 Commercial Systems
A number of existing commercial systems, such as, HP OpenView, IBM’s NetView,
Sun’s SunNet Manager, etc., have facilities for capturing the log of NM data and events.
The log of data can be exported to an SQL database for Off-line (trends) analysis and
report generation.
2.5.2 Yemini et. al.’s System
The database issues for network management similar to the ones discussed in this work
have been considered in [WSY91]. We briefly discuss the proposed system in [WSY91]
below.
A number of DB manipulation language features are proposed in [WSY91] that are
useful for a DBMS which receives an automatic inflow of data from various sources. The
NM functions in this system are specified as database manipulation operations. The new
capabilities augmented with a data manipulation language are specification of events,
correlation among events, and change tracking.
The following basic events are supported in the system: 1) data-pattern events in the
network database; 2) data manipulation operations, namely, retrieve, add, delete, or up-
date of the network database; 3) calendar-time. Watching for an event means continuous
retrieval of a data-pattern from the network database. A data-pattern event is specified as
a data-retrieval operation which supposedly executes continuously (in practice, the NMS
executes it only if at least one of the retrieved object changes).
A parameter of a data-pattern event is the following: PERSISTENCE � “time-
interval”. It indicates that the event is to occur only if the data-pattern persists in the

CHAPTER 2. NETWORK MANAGEMENT SYSTEMS 26
database at least for the specified duration.
Basic events can be grouped into correlated events. Formally, a correlated event is
a disjunction of conjunctions of events and is specified using correlation rules. Two pa-
rameters (time order and time constraint) are associated with a correlation rule to capture
the temporal relationships among events in the specification.
The following example specifies that OVERLOAD-AT-12 occurs when the basic
event OVERLOAD (a data-pattern event) occurs at the same time as the basic event
12 AM (a calendar-time event).
Example 5.1. OVERLOAD-AT-12 :- OVERLOAD, 12 AM.
The following example specifies that OVERLOAD-AT-12 occurs, but UNDERUTI-
LIZED does not occur at that time.
Example 5.2. D-NEG :- OVERLOAD-AT-12, ~UNDERUTILIZED.
The following example specifies that OVERLOAD-OR-12 occurs when either OVER-
LOAD or 12 AM occurs.
Example 5.3. OVERLOAD-OR-12 :- OVERLOAD. OVERLOAD-OR-12 :- 12 AM.
Temporal order: The events represented by the positive atoms in the body of the rule
may be required to occur in a certain temporal order. The order is specified as order
= G in the body of a rule, where G is a directed acyclic graph representing the tem-
poral order. The following example specifies that if OVERLOAD-AT-12 occurs before
UNDERUTILIZED, then OVERLOAD-UNDERUTILIZED occurs.
Example 5.4. OVERLOAD-UNDERUTILIZED :- OVERLOAD-AT-12, UNDERUTI-
LIZED, order = OVERLOAD-AT-12! UNDERUTILIZED.

CHAPTER 2. NETWORK MANAGEMENT SYSTEMS 27
If G does not have any arcs, then OVERLOAD-UNDERUTILIZED occurs when
both events in the body occur, regardless of order.
Time constraint: The events represented by the atoms in the body of the rule are
required by the keyword time-constraint to satisfy certain temporal constraint C. The
following example specifies that D-NEG occurs if OVERLOAD-AT-12 occurs and UN-
DERUTILIZED does not occur within 5 second of the occurrence of OVERLOAD-AT-
12.
Example 5.5. D-NEG :- OVERLOAD-AT-12, ~UNDERUTILIZED, time-constraint =
fOVERLOAD-AT-12, UNDERUTILIZEDg = 5 s.
Each data pattern and data manipulation event is associated with a variable which
is instantiated when the event occurs. The variable is instantiated to the set of tuples
whose retrieval or manipulation triggered the event. Variables may be used to constrain
occurrence of correlated events.
Example 5.6. OU :- OVERLOAD(X), UNDERUTILIZED(Y), X < Y.
The rest of the paper discusses specification of trace collection (similar to sampling
of managed objects) in a history database and the specification of inferences using a rule
language called RDL1 [KdMS90].
2.5.3 MANDATE System
The MANDATE MIB project [HBNRD93] addresses network management database is-
sues. The MANDATE system is a special purpose database management system that
considers the unique properties of network management data and functionalities. An
MIB for a management station is proposed. The users of a management station interacts

CHAPTER 2. NETWORK MANAGEMENT SYSTEMS 28
with the MIB through data manipulation statements and various views.
2.5.4 DECmcc System
The work in [Shv93] discusses the issues of a static (historical) temporal database service
of DECmcc network management system. The system is geared towards trends analysis,
that is, after the fact analysis of NM data.
2.5.5 X.500 based System
The work in [HBM93] proposes the X.500 directory service [x50] as a distributed man-
agement information repository. The X.500 standards specify a Directory Service which
provides and manages information about network entities. The Directory Service and
its Directory information is distributed physically over the network, but that is made
transparent to an end user.
2.5.6 Event Correlation Systems
A number of commercial event correlation systems for telecommunication networks ex-
ist. Their main purpose is to correlate large number of alarm events generated by vari-
ous telecommunication equipments, so that the operators are not overwhelmed with the
alarms. The correlators use an event model to analyze the alarms. The event model
represents knowledge of various events and their causal relationships. The correlator
determines the common problems that caused the observed alarms.
The ECXpert system described in [Nyg95] is an expert system that correlate events
based on causal relationship between events. The users specify the causality between

CHAPTER 2. NETWORK MANAGEMENT SYSTEMS 29
events and groups related events into a correlation group. The causality between events
defines a tree called a correlation tree skeleton (shown in Figure 2.5). As events are re-
ported to the system forest of trees (as defined by groups) are formed. The main purpose
of the system is to group events based on specified causality relationship. The network
configuration information and a time window can be added while specifying a correlation
group.
The IMPACT system [JW95] is a similar event correlation system as above. But it
also supports specification of temporal relationship between events.
2.6 Discussion
A search in the literature indicates that very little work has been done in the area of
NMDB systems. Traditional database systems are not suitable as a component for an NM
system. A new generation of database system that incorporates the facilities required by
the unique properties of NM data, event and functionalities, is required.
The existing commercial systems use traditional DB systems, which do not provide
the database functionalities required by an NM system. The DB systems are not tightly
integrated with the system. All of the systems provide rudimentary event management
facilities. When an alert (event) is generated from one NE, unnecessary other trouble
tickets (of the same severity) may be reported by the NMS. This is because these systems
do not have facilities that consider the structure (topology) of the network while report-
ing alerts. Hence an NM station may be swamped with trouble tickets of the same nature
or red signals. For example, outage of a router link will make the network beyond this
link unreachable. The NEs beyond may generate alarms due to this outage. If the overall

CHAPTER 2. NETWORK MANAGEMENT SYSTEMS 30
structure of the network is not considered by the NM application, then all of the NEs will
be marked red, even though only the router should have been marked red. None of the
systems are capable of relating alarm events based on causal and temporal relationships.
Some of the commercial systems address the problem of NM information presentation
on an NM station. But the solutions provided are rudimentary and ad-hoc. The visualiza-
tion are fixed and no mechanism for declarative specification of information presentation
requirements is provided. None of the systems integrates information presentation with
other functionalities such as data and event management. The visualization of NM sce-
narios in a consistent and graceful manner is very important for network management to
be useful.
The event correlation systems ECXpert and IMPACT lack the support of sophisti-
cated database systems. Their main purpose is to correlate events and report the results
to an operator. The ECXpert system does not support event correlation based on temporal
relationship between events.
The only known extensive work for an NMDB system has been reported in [WSY91]
(as discussed briefly above). But the system described in [WSY91] lacks a more uni-
form and consistent framework for specifying NM functions. The separate mechanism
for event correlation and trace collection is unnecessary (as will be seen from our pro-
posed system). The event correlation mechanism proposed in this system is not powerful
enough to specify wide variety of correlated NM events. As a result, polling and other
composite events can not be specified in their system, that could control uniformly the
detection of data pattern events, collection of traces and control other actions. The notion
of persistence is mentioned in their work, but no formal definition of it is provided. The

CHAPTER 2. NETWORK MANAGEMENT SYSTEMS 31
issues of information presentation are not addressed in this system.
The MANDATE MIB system does not provide event management facilities, that is,
no event correlation or composite event specification mechanism is provided. The infer-
ence mechanism required for event management and other NM functions is lacking in
their work. Information presentation issues are not addressed in this system.
The proposal for X.500 Directory Service as information repository has its limitations
which emanate from the nature of the system itself. First, X.500 system is not a database
system. It has only rudimentary data manipulation capabilities. Second, the proposal
or the X.500 system does not address the issues of events, and information presentation
management.
Some of the commercial systems address the problem of NM information presen-
tation on an NM station. But the solutions provided are rudimentary and ad-hoc. The
visualizations are fixed and no mechanism for declarative specification of information
presentation requirements is provided. None of the systems integrates information pre-
sentation with other functionalities, such as, data and events management. The visualiza-
tion of NM scenarios in a consistent and graceful manner is very important for network
management to be useful.
In conclusion the existing works lack a unified framework for managing NM data,
events, and information presentation for an NMS.
2.6.1 Proposal for a Network Management Database System
We will propose an architecture of an NM system called the Hy+-CEDAR NMDBS
based on active temporal databases and database visualization, that addresses the prob-

CHAPTER 2. NETWORK MANAGEMENT SYSTEMS 32
lems and issues mentioned in this chapter.
An active temporal database system allows one to specify composite events and
declarative ECA rules. The composite events in the E part of an ECA rule may pro-
vide sophisticated mechanisms for event correlation. The actions of an ECA rule can be
both declarative database manipulation operations and procedural operations. Thus ECA
rules may provide a unified mechanism for data and event management and automating
the process of monitoring and control. The information presentation or visualization re-
quirements of an NM station can be met by a database visualization system that is capable
of manipulating not just large volumes of data, but the associated visualization as well
at different levels of abstraction. Thus an active temporal database system combined
with a sophisticated database visualization system can serve as a powerful framework
for a network management database system. In a later chapter we will propose such a
system where an active temporal database system is integrated with the Hy+ database vi-
sualization system [CEH+94]. The Hy+-CEDAR system differs from the discussed sys-
tems in the emphasis given by the former to the manipulation of database visualizations
and event management as an integral part of a toolset for network management stations.
Another important difference is the expressive power of the GraphLog query language.
SQL-based systems are not capable of expressing transitive closure queries, while these
are directly supported in the GraphLog query language in a very intuitive way. Transitive
closure queries are necessary when we want to retrieve network management information
in terms of the connectivity and topology of the network. The composite event specifica-
tion language CEDAR is much more powerful than the existing languages proposed for
various active database systems. The combined capabilities of CEDAR, GraphLog and

CHAPTER 2. NETWORK MANAGEMENT SYSTEMS 33
ECA rules can provide a very powerful mechanism for specification and presentation of
NM functionalities and scenarios.

Chapter 3
Active and Temporal Databases
In this chapter we will briefly discuss the concepts involved in active and temporal
databases. We will then introduce the existing composite event specification languages
and temporal logic with a discussion on the limitations of these languages. Note that
in this thesis we assume that the underlying network management database is an active
temporal database. An active temporal database is a database where the core database
can be
1. an active relational or object-oriented temporal database,
2. a plain relational or object-oriented database.
In the second case a layer on top of the database is assumed, which provides facilities
for specification of composite events. Composite event languages allow one to relate
basic events occurring at different time points, in as much the same way as temporal
queries in a temporal database enable one to specify pattern of values in successive ver-
sions (history) of relations. Thus composite event specifications are a form of temporal
34

CHAPTER 3. ACTIVE AND TEMPORAL DATABASES 35
queries. For the purpose of this thesis we will assume the second case.
3.1 Active Databases
The conventional DBMSs are passive in that they manipulate data only when requests
from applications are made. On the other hand, an Active DBMS (ADBMS) provides
facilities for specifying procedural actions or database operations to be performed auto-
matically in response to certain events and conditions. Active behavior in an ADBMS
is achieved through Event-Condition-Action (ECA) [MD89] rules. The rules state that
when the specified event(s) occurs and the condition holds, perform the action. A condi-
tion is defined over the state of the database. An action can be an arbitrary program or a
database operation.
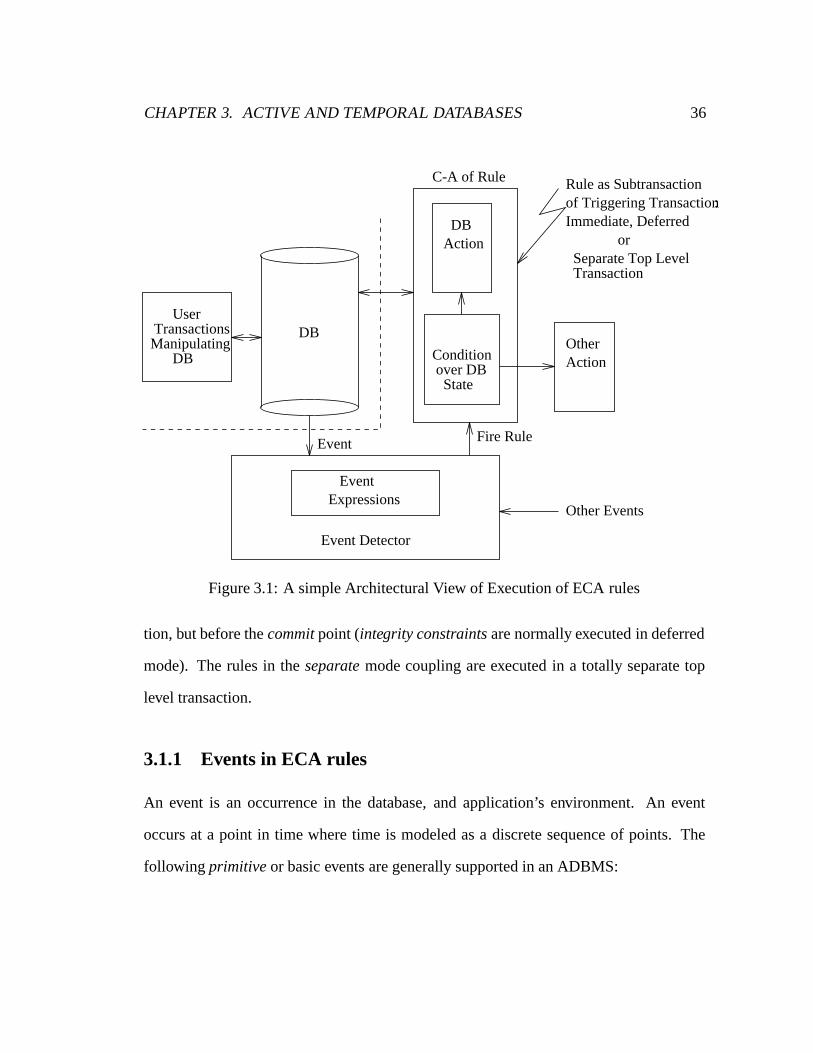
Figure 3.1 shows a simple architectural view of an active database system. The events
corresponding to update operations on the database performed by user transactions and
other events (such as method execution, time) are reported to the event detector. If a
rule fires, the C-A part may be executed as database transactions, if C and A contain
database operations. Various transactions models for rule execution have been pro-
posed [Cea89, HLM88, DHL91], that deal with the coupling and synchronization of
user-invoked transactions and system-triggered rules. For example, the triggering and
triggered transaction can be coupled as immediate, deferred and separate. In the imme-
diate coupling mode the fired rule is executed immediately as a subtransaction of the
top level transaction of the triggering transaction. If multiple rules fire and there is an
imposed order, then all the rules are executed in that order, otherwise, in arbitrary order.
The rules in the deferred mode are scheduled to be executed at the end of the transac-
CHAPTER 3. ACTIVE AND TEMPORAL DATABASES 36
Transactions
C-A of Rule
Other Events
DB
Rule as Subtransactionof Triggering Transaction:
orSeparate Top LevelTransaction
over DB
Fire Rule
Event Detector
ExpressionsEvent
User
DB
DB
State
Other
Immediate, Deferred
Action
Condition ActionManipulating
Event
Figure 3.1: A simple Architectural View of Execution of ECA rules
tion, but before the commit point (integrity constraints are normally executed in deferred
mode). The rules in the separate mode coupling are executed in a totally separate top
level transaction.
3.1.1 Events in ECA rules
An event is an occurrence in the database, and application’s environment. An event
occurs at a point in time where time is modeled as a discrete sequence of points. The
following primitive or basic events are generally supported in an ADBMS:
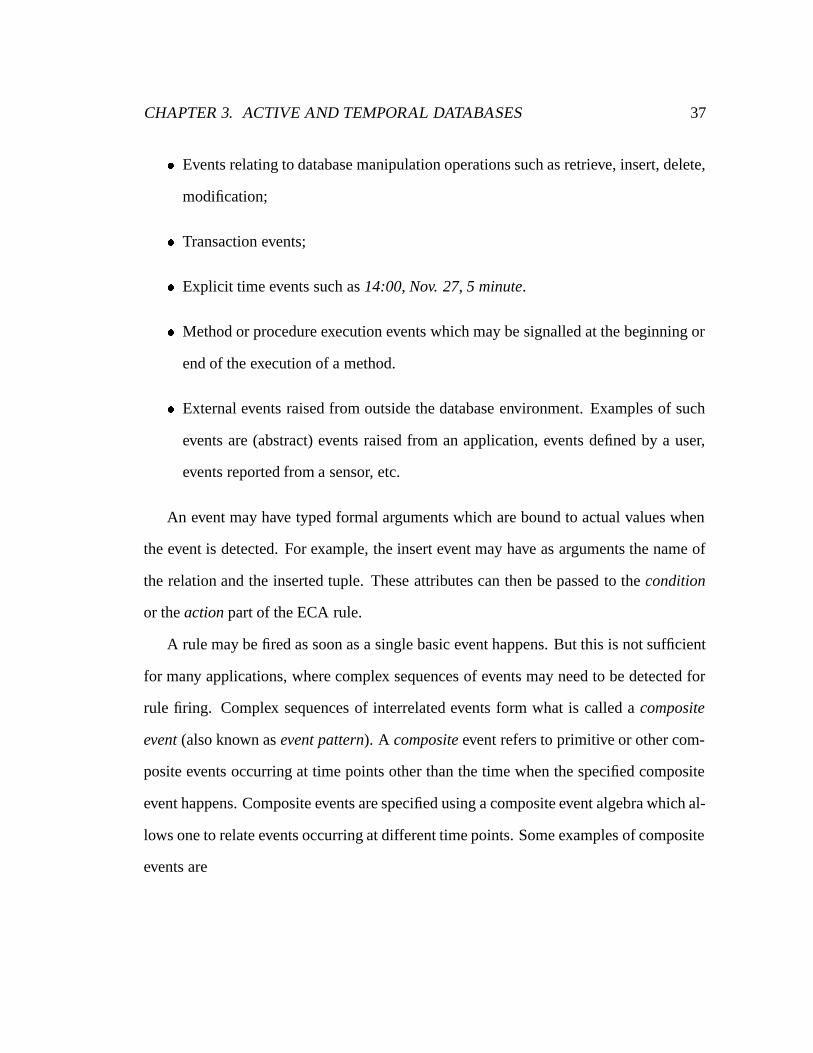
CHAPTER 3. ACTIVE AND TEMPORAL DATABASES 37
� Events relating to database manipulation operations such as retrieve, insert, delete,
modification;
� Transaction events;
� Explicit time events such as 14:00, Nov. 27, 5 minute.
� Method or procedure execution events which may be signalled at the beginning or
end of the execution of a method.
� External events raised from outside the database environment. Examples of such
events are (abstract) events raised from an application, events defined by a user,
events reported from a sensor, etc.
An event may have typed formal arguments which are bound to actual values when
the event is detected. For example, the insert event may have as arguments the name of
the relation and the inserted tuple. These attributes can then be passed to the condition
or the action part of the ECA rule.
A rule may be fired as soon as a single basic event happens. But this is not sufficient
for many applications, where complex sequences of events may need to be detected for
rule firing. Complex sequences of interrelated events form what is called a composite
event (also known as event pattern). A composite event refers to primitive or other com-
posite events occurring at time points other than the time when the specified composite
event happens. Composite events are specified using a composite event algebra which al-
lows one to relate events occurring at different time points. Some examples of composite
events are

CHAPTER 3. ACTIVE AND TEMPORAL DATABASES 38
� three successive discount rate cuts without an intervening increase [GJS92a] (hap-
pens at the events marked with “*” as shown in Figure 3.2),
� first rising threshold crossing event since the recent falling threshold crossing event
[Has95] (Figure 7.8),
� server overload observed at all discrete points of a five minutes interval [Has95]
(Figure 7.9),
� selling events of a stock, where the maximum values of the sell price of the stock
are sampled at the end of every 30 minute intervals every day from 9AM to 5PM
(Figure 3.3).
D I D D I D D D D I D
* *
Figure 3.2: Example: Discount rate cut composite event
Rule firings in response to the occurrence of a single primitive event, where the events
are only database update events, are supported in commercial systems such as Sybase,
Oracle, and DB2. The SQL3 standard defines a triggering mechanism where a rule is
fired in response to a single primitive database operation event. A number of compos-
ite event specification languages have been proposed by researchers: ODE [GJS92a],
SAMOS [GD94], Snoop [CKAK94], EPL [MZ96] and CEDAR [Has95] proposed by
the author.

CHAPTER 3. ACTIVE AND TEMPORAL DATABASES 39
3.2 Temporal Databases
A temporal database in [ea93] is defined as a database that supports some aspect of
time. In other words, a TDBMS “understands” the notion of time and provides temporal
operators that allow one to specify temporal queries. A temporal database contains the
history of the modeled world as opposed to the traditional snapshot databases where the
past states of the database are discarded.
Various models for TDBs exist, which are defined by the choice of
� temporal ontology,
� temporal domain that is used to model time,
� time granularity, and
� time dimensions.
Temporal ontology: basically two options exist: points vs. intervals. In the database
context the point-based is predominant. In the point-based view intervals are obtained as
pairs of points.
Temporal domain: various models of time have been proposed in the philosophical
and logical literature of time, where time is viewed as discrete, dense, or continuous.
Intuitively, discrete models of time are isomorphic to natural numbers, i.e., there is the
notion that every moment of time has a unique successor. Dense models of time are
isomorphic to (either) real or rational numbers: between any two moments of time there
is always another. Continuous models of time are isomorphic to the real numbers, i.e.,
both dense and also, unlike the rational numbers, with no “gaps”. In TDB generally the
discrete model of time is assumed.
CHAPTER 3. ACTIVE AND TEMPORAL DATABASES 40
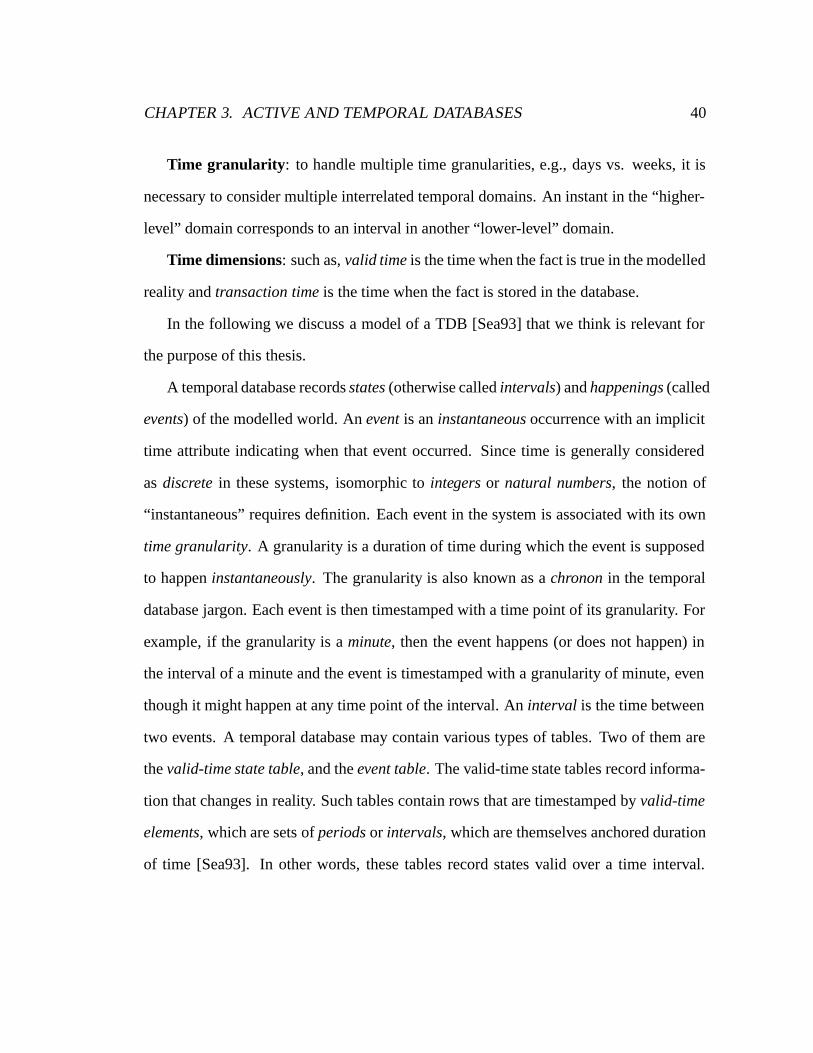
Time granularity: to handle multiple time granularities, e.g., days vs. weeks, it is
necessary to consider multiple interrelated temporal domains. An instant in the “higher-
level” domain corresponds to an interval in another “lower-level” domain.
Time dimensions: such as, valid time is the time when the fact is true in the modelled
reality and transaction time is the time when the fact is stored in the database.
In the following we discuss a model of a TDB [Sea93] that we think is relevant for
the purpose of this thesis.
A temporal database records states (otherwise called intervals) and happenings (called
events) of the modelled world. An event is an instantaneous occurrence with an implicit
time attribute indicating when that event occurred. Since time is generally considered
as discrete in these systems, isomorphic to integers or natural numbers, the notion of
“instantaneous” requires definition. Each event in the system is associated with its own
time granularity. A granularity is a duration of time during which the event is supposed
to happen instantaneously. The granularity is also known as a chronon in the temporal
database jargon. Each event is then timestamped with a time point of its granularity. For
example, if the granularity is a minute, then the event happens (or does not happen) in
the interval of a minute and the event is timestamped with a granularity of minute, even
though it might happen at any time point of the interval. An interval is the time between
two events. A temporal database may contain various types of tables. Two of them are
the valid-time state table, and the event table. The valid-time state tables record informa-
tion that changes in reality. Such tables contain rows that are timestamped by valid-time
elements, which are sets of periods or intervals, which are themselves anchored duration
of time [Sea93]. In other words, these tables record states valid over a time interval.

CHAPTER 3. ACTIVE AND TEMPORAL DATABASES 41
Following is an example of valid-time state table [Sea93]:
CREATE TABLE NBCShows
(ShowName CHARACTER ( 30 ) NOT NULL,
InsertionLength INTERVAL SECOND,
Cost INTEGER)
AS VALID STATE YEAR ( 2 ) TO NBCSeason;
In the above example, the NBCShows table stores so-called media plans of a TV network
(NBC in the example). ShowName is the name of a program on NBC. InsertionLength is
the duration of a commercial shown during the program, and Cost is the price in dollars
of the advertisement. SECOND and YEAR are two time granularities available in SQL-
92. NBCSeason is a user-defined time granularity. It partitions a year into 3 distinct
seasons. TSQL2 allows a database administrator to define new calendars, which provide
one or more granularities. NBCSeason is the time granularity of the valid-time state table
NBCShows. Each period (interval, datetime) has an associated range, the maximum time
that can be represented, and an underlying granularity. A range of 100 years is defined
for the table, via the syntax “YEAR ( 2 )”, which indicates 102 years.
The event tables record events whose occurrence change the states of the objects in
the state table. An example of an event table (data) definition is shown below [Sea93].
CREATE TABLE NBC_FB_Insertion
(GameName CHARACTER ( 30 ),
InsertionWindow INTERVAL FootballSegment,
InsertionLength INTERVAL SECOND (3, 0),
CommercialID CHARACTER ( 30 ))

CHAPTER 3. ACTIVE AND TEMPORAL DATABASES 42
AS VALID EVENT YEAR ( 2 ) TO HOUR;
This table records a particular insertion purchase, for a particular football game broadcast
in a particular hour on NBC. Commercials for football games are often sold for particular
game quarters. The InsertionWindow specifies the quarter in which the commercial is to
appear in, and is relative to the start of the game. FootballSegment is a user-defined time
granularity. InsertionLength has an underlying granularity of SECOND, and a range of
103 = 1000 seconds. The Rows in the table above are timestamped with a granularity of
HOUR, with a range of 100 (102) years.
The valid-time in a TDB is implicit. The valid-time elements are referred through
temporal operators, for example, at, precede, overlap, first etc. It is also possible to refer
to various forms of explicit time:
� absolute time, a specific valid time, for example, August 19, 1994;
� relative time, valid time of a fact is related to either the valid time of another fact
or the current time now;
� span, a directed duration of time with no specific starting or ending time points,
for example, week, month.
Following is a query in TSQL2 (How did the monthly budget on NBC football games
for the current media plan compare with that of the media plan prepared two weeks ago,
which did not take this new product introduction into account?):
SELECT SUM(N.Cost), SUM(N2.Cost)
VALID VALID(NI)

CHAPTER 3. ACTIVE AND TEMPORAL DATABASES 43
FROM NBC_FB_Insertion AS NI NI2, NBCShows AS N N2
WHERE NI.GameName = N.ShowName AND VALID(NI) OVERLAPS VALID(N) AND
NI2.GameName = NI2.ShowName AND VALID(NI2) OVERLAPS VALID(N2) AND
TRANSACTION(NI2) OVERLAPS DATE 'now - 14 days' AND
TRANSACTION(N2) OVERLAPS DATE 'now - 14 days' AND
GROUP BY VALID(NI) USING MONTH
Since the query involves several underlying tables, the VALID VALID(NI) clause en-
sures that the data will be coupled with appropriate timestamps. The query compares
the cost of the current media plan with that of two weeks ago, on a month to month ba-
sis. The construct “now” is used for the current time (the most recent transaction time).
OVERLAPS is a temporal operator which becomes true when two intervals overlap.
3.3 Active temporal Databases
An active framework for temporal databases (TDB) is defined in [ea94]. Composite
event algebras allow one to relate basic events occurring at different time points, in as
much the same way as temporal queries in a TDB enable one to specify pattern of values
in successive versions (history) of relations. Thus composite event specifications are a
form of temporal queries.
An active temporal database in [ea94] is defined as a database that supports active
temporal rules. An active rule is said to be temporal if
1. the event is a composite event that refers to basic events occurring at time points
other than the time when the rule is fired, or

CHAPTER 3. ACTIVE AND TEMPORAL DATABASES 44
2. the event refers to explicit time basic events, or
3. the condition contains a temporal database query that can not be expressed in a
non-temporal query language that can reference the basic event (or the last basic
event in the composite event that caused the rule to fire), operating over a database
that does not maintain a temporal history.
In a non-temporal database, the query language is non-temporal, so the condition of a
rule can not contain a temporal query. Hence active rules in a non-temporal database are
temporal if and only if condition (1) and (2) above hold.
Most of the temporal operators supported in composite event specification languages
for active databases are also supported in (static) temporal databases. A TDB stores the
history of events as event tables. If the underlying database is a TDB with simple trigger
support, that is, no support for the detection of composite events specified through a
composite event algebra, then a composite event specification in the E part of an ECA
rule can be translated into an equivalent temporal query, and moved to the C part of the
rule. The modified ECA rule, in this case, will contain in the E part the (last) event
at which the composite event occurs. The rest of the (previous) events stored in the
event table in the TDB will be referred through the temporal operators in the C part
of the rule. The event expressions can also be regarded as views. In fact, given an
expressive TDB query language, it may be possible to specify composite events as views.
If the views incorporate the operators supported in CEDAR, then a Colored Petri Net
(CPN) implementation of the operators can function as incremental evaluators of the
views specifying composite events. In other words, we can rewrite TDB views as CPNs
and evaluate them as their corresponding (base) event tables are updated.
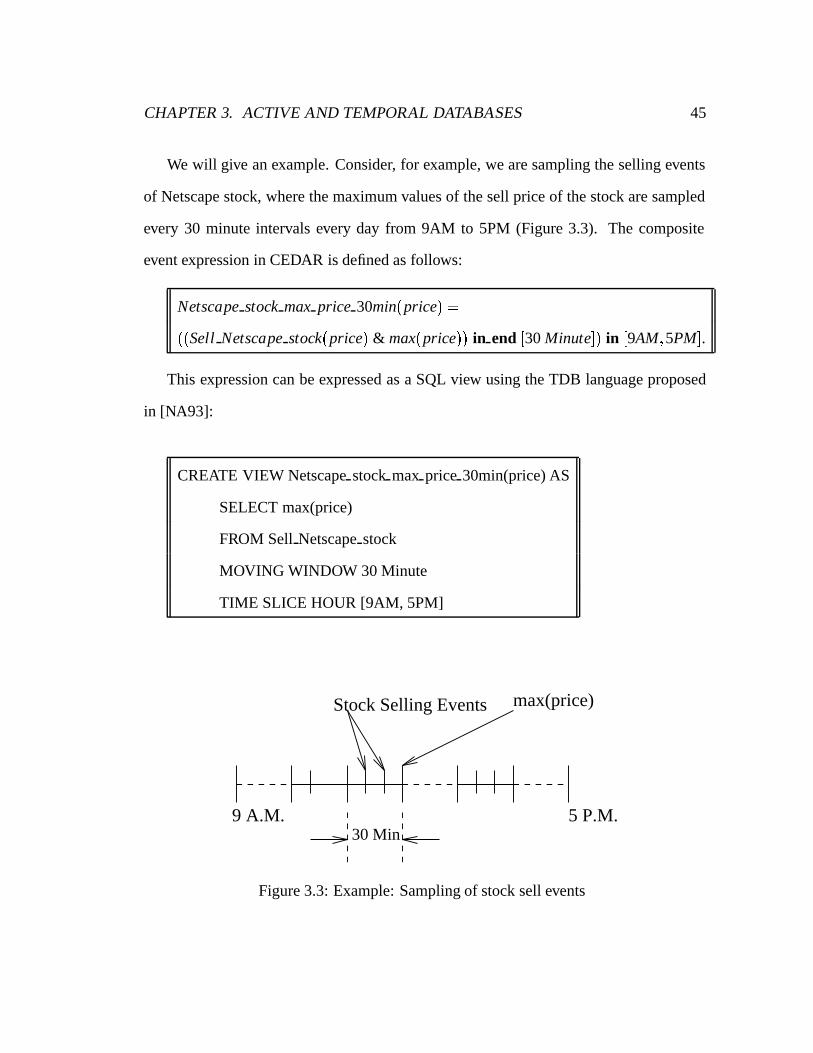
CHAPTER 3. ACTIVE AND TEMPORAL DATABASES 45
We will give an example. Consider, for example, we are sampling the selling events
of Netscape stock, where the maximum values of the sell price of the stock are sampled
every 30 minute intervals every day from 9AM to 5PM (Figure 3.3). The composite
event expression in CEDAR is defined as follows:
Netscape stock max price 30min(price) =
((Sell Netscape stock(price) & max(price)) in end [30 Minute]) in [9AM;5PM].
This expression can be expressed as a SQL view using the TDB language proposed
in [NA93]:
CREATE VIEW Netscape stock max price 30min(price) AS
SELECT max(price)
FROM Sell Netscape stock
MOVING WINDOW 30 Minute
TIME SLICE HOUR [9AM, 5PM]
Stock Selling Events
5 P.M.9 A.M.
max(price)
30 Min
Figure 3.3: Example: Sampling of stock sell events

CHAPTER 3. ACTIVE AND TEMPORAL DATABASES 46
3.4 Composite Event Specification Languages
In this section we will briefly describe the known composite event specification lan-
guages, and their limitations.
3.4.1 ODE
Composite events in ODE [GJS92a] are specified as event expressions using event spec-
ification operators. There are two categories of operators, basic and additional. The
additional operators, with few exceptions, can be expressed in terms of the basic opera-
tors. Primitive events can have attributes. The attributes can be associated with the event
itself: transaction id, parameters to a function invocation, etc. Event attributes can also
be determined from the state of the world at the time the event occurred: by reading
the system clock or performing a database query. Arbitrary predicates can be defined
on these attributes and when false they mask the occurrence of the corresponding event.
The event expressions in this system combine the event and condition parts of a rule: the
rules are EA, rather than ECA (even though the papers do not discuss database access
while evaluating the event expression).
An event occurrence is a tuple of the form (primitive event, event-identifier). Event
identifiers define a total order (<). A event history is a finite set of event occurrences in
which no two event occurrences have the same event identifier. An example of an event
identifier is a time-stamp specifying the time at which the primitive event occurred.
An event expression E is a mapping from histories to histories:
E : histories! histories.
Following are the basic operators supported in ODE:

CHAPTER 3. ACTIVE AND TEMPORAL DATABASES 47
� a[h], where a is a primitive event, is the maximal subset of history h composed of
event occurrences of the form (a;eid).
� (E ^ F) = h1\h2, where h1 = E[h] and h2 = F [h];
� (!E)[h] = (h�E[h]);
� relative(E;F)[h] are the event occurrences in h at which F is satisfied assuming
that the history started immediately following some event occurrence in h at which
E takes place.
Formally relative(E;F)[h] is defined as follows. Let Ei[h] be the ith event oc-
currences in E[h]; let hi be obtained from h by deleting all event occurrences
whose event-identifiers are less than or equal to the event-identifier of Ei[h]. Then
relative(E;F)[h] = [iF[hi]; where i ranges from 1 to the cardinality of E[h].
� relative+(E;F)[h] = [∞i relativei(E)[h]
where;
relative0(E) = E;
relativei(E) = relative(relativei�1(E);E):
The operators defined above are the minimal operator set. Various other operators
can be defined in terms of the above operators.
The following additional operators are defined in terms of the basic operators:
� prior(E1;E2) = relative(E1;any) ^ E2, E2 follows any time after E1.
� sequence(E1;E2) = relative(E1; !(relative(any;any))) ^ E2, E2 strictly follows
after E1.

CHAPTER 3. ACTIVE AND TEMPORAL DATABASES 48
� f irstA f ter(E1 ;E2;F)[h] = (E2 ^ !prior(F;any)) =+ E1, specifies that events E2
take place relative to the last preceding occurrence of E1 without an intervening
occurrence of F relative to the same E1. The operator F =+ E[h] defines the F
events between two successive E events. Note that, this additional operator ( and
one another operator called pipe) is not defined in terms of the basic operators! The
above operators can be explained as follows: 1) Let, r1 = (E2 ^ !prior(F;any)), r1
is computed as follows: get the (set of) sub-historys where F events do not precede
any other events, take an intersection of these historys with E2; 2) apply =+ to E1,
that is, get the sub-historys (r2) between successive E1 events; 3) apply r1 to r2.
In the absence of attributes in events, event expressions (E.E) are equivalent to regu-
lar expressions (R.E) on the set of primitive events. The E.Es differ from R.Es in that the
focus is on ordered sets rather than strings. The E.E then can be processed by construct-
ing a finite-state machine (FSM). E.Es with attributes are not equivalent to R.E, and can
not be recognized by FSM. An FSM for sequence(E1;E2) is shown in Figure 3.4. Also
E1 E2
not E2
fail
0 1
Figure 3.4: FSM for sequence(E1;E2)
attributes of interest may not be “immediate”, that is, their values are derived from events
occurring in the past. For events with attributes, the authors of ODE propose to augment
the states of the automaton with a data structure that “remembers” attribute history from

CHAPTER 3. ACTIVE AND TEMPORAL DATABASES 49
the past. An extended automaton, like regular automaton, makes a transition at the oc-
currence of each event in the history. In addition, an extended automaton may look at the
attributes of the event, and may also compute a set of relations at the transition.
3.4.2 SAMOS
The primitive and composite events in SAMOS have attributes and are formalized as
tuples.
Let E1 and E2 be any primitive or composite event. The operators supported in the
event specification language SAMOS [GD94] are as follows:
� Disjunction (E1jE2), when either E1 or E2 happens;
� Conjunction (E1;E2), when both of E1 and E2 happen in any order;
� Sequence (E1;E2), when E1 and E2 happen in that order; Note that, this is not the
same sequence operator as in ODE. E1 and E2 does not necessarily have to strictly
follow each other.
� History (TIMES(n;E) IN I), when nth occurrence of E during the interval I hap-
pens;
� Negative event (NOT E IN I), when E does not happen in the interval I.
A modified version of a Colored Petri Net (CPN) called the SAMOS Petri Net (S-PN)
is used to implement the operators.

CHAPTER 3. ACTIVE AND TEMPORAL DATABASES 50
3.4.3 Snoop
Let E1, E2, E3 be any primitive or composite event. The operators supported in Snoop
[CKAK94] are:
� Disjunction (∇ ), Conjunction (4), Sequence (;), Negative (:) as above;
� Any(m;E1;E2; :::;En), when m events out of n distinct events occur in any order;
� Aperiodic events (A(E1;E2;E3), A�(E1;E2;E3)), A is signalled when E2 occurs
everytime in the interval defined by the ccurrence time of E1 and E3, and A�, at the
end of the interval;
� Periodic events (P(E1;TI;E3), P�(E1;TI[: parameters];E3)), P is signalled every
TI time interval during the interval [E1, E3], TI is a time constant. In case of P� pa-
rameters are collected every TI interval, but signalled (parameters made available)
at the end of the interval [E1, E3].
Snoop introduces a concept called parameter context. Parameter context specifies
restrictions on which events contribute to a composite event. The default is unrestricted
context. For example, events detected in unrestricted context are shown in the Figure 3.5
(in SAMOS syntax).
The following parameter contexts are introduced:
� Recent: only the most recent initiator (Snoop uses this term for the event that
initiates the detection of a composite event) event is considered in the detection of
a composite event. When a composite event is detected all the events that cannot
be the initiators of the composite event in the future are deleted.

CHAPTER 3. ACTIVE AND TEMPORAL DATABASES 51
� Chronicle: in this context the oldest initiator event is paired with the oldest ter-
minator event ( a terminator event is the last event that signals the detection of a
composite event). The constituent events are deleted once a composite event is
detected.
� Continuous: Multiple initiator events may be paired with a single terminator event.
After detection of a composite event the initiator events are deleted. A terminator
event is deleted if it cannot be an initiator in the future. This context can be used
for the cases where sliding time point or moving window is required. The slider is
controlled by the initiator events and the terminator event may be used as the end
point of the slider.
� Cumulative: All the constituent events are accumulated before the composite event
is detected.
Examples of event sequences for the first three parameter contexts above are shown
in Figure 3.6.
The event expressions are evaluated using event graphs.
3.4.4 EPL
The Above languages are algebra based, where EPL [MZ96] is logic based.
Let E1;E2; :::;En, n > 1, be EPL event expressions (maybe composite themselves).
The following is also an EPL event expression:
� (E1;E2; :::;En): A sequence consisting of an instance of E1, immediately followed
by an instance of E2, ..., immediately followed by an instance of En.
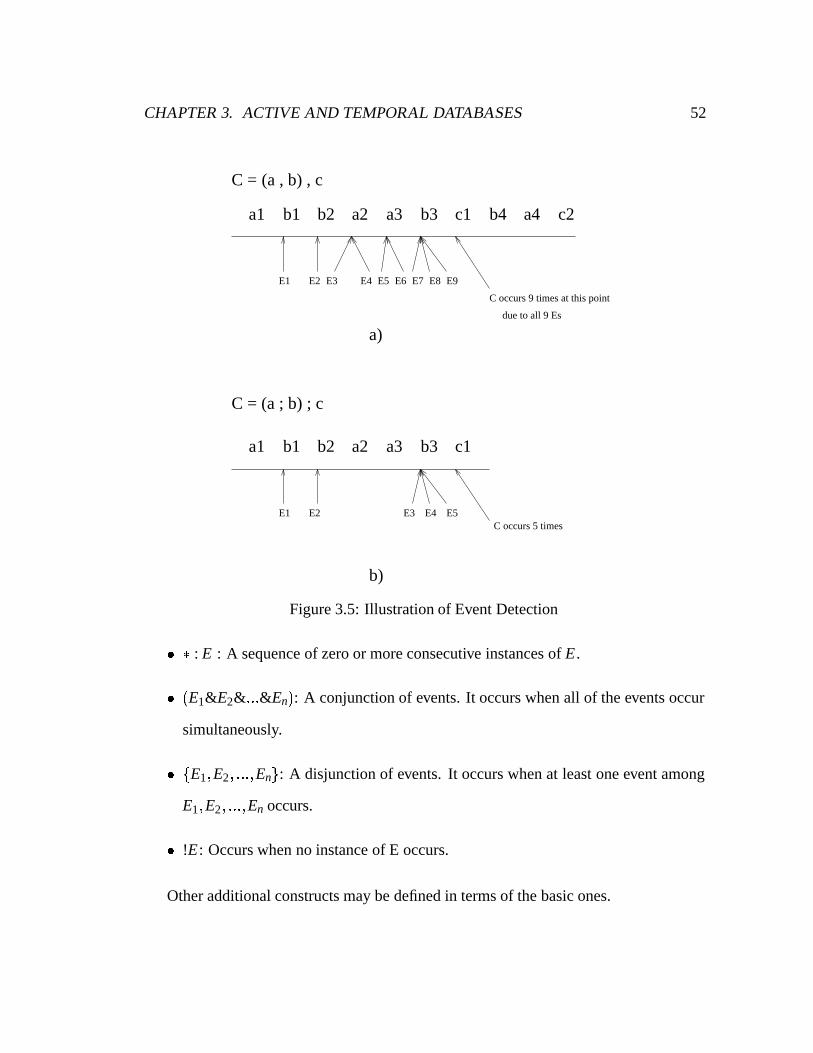
CHAPTER 3. ACTIVE AND TEMPORAL DATABASES 52
C occurs 9 times at this point
due to all 9 Es
E1 E2C occurs 5 times
C =
a)
b)
C = (a ; b) ; c
(a , b) , c
E1 E2 E3 E4 E5 E6 E7 E8 E9
a1 b1 b2 a2 a3 b3 c1 b4 a4 c2
a1 b1 b2 a2 a3 b3 c1
E3 E4 E5
Figure 3.5: Illustration of Event Detection
� � : E : A sequence of zero or more consecutive instances of E .
� (E1&E2&:::&En): A conjunction of events. It occurs when all of the events occur
simultaneously.
� fE1;E2; :::;Eng: A disjunction of events. It occurs when at least one event among
E1;E2; :::;En occurs.
� !E: Occurs when no instance of E occurs.
Other additional constructs may be defined in terms of the basic ones.
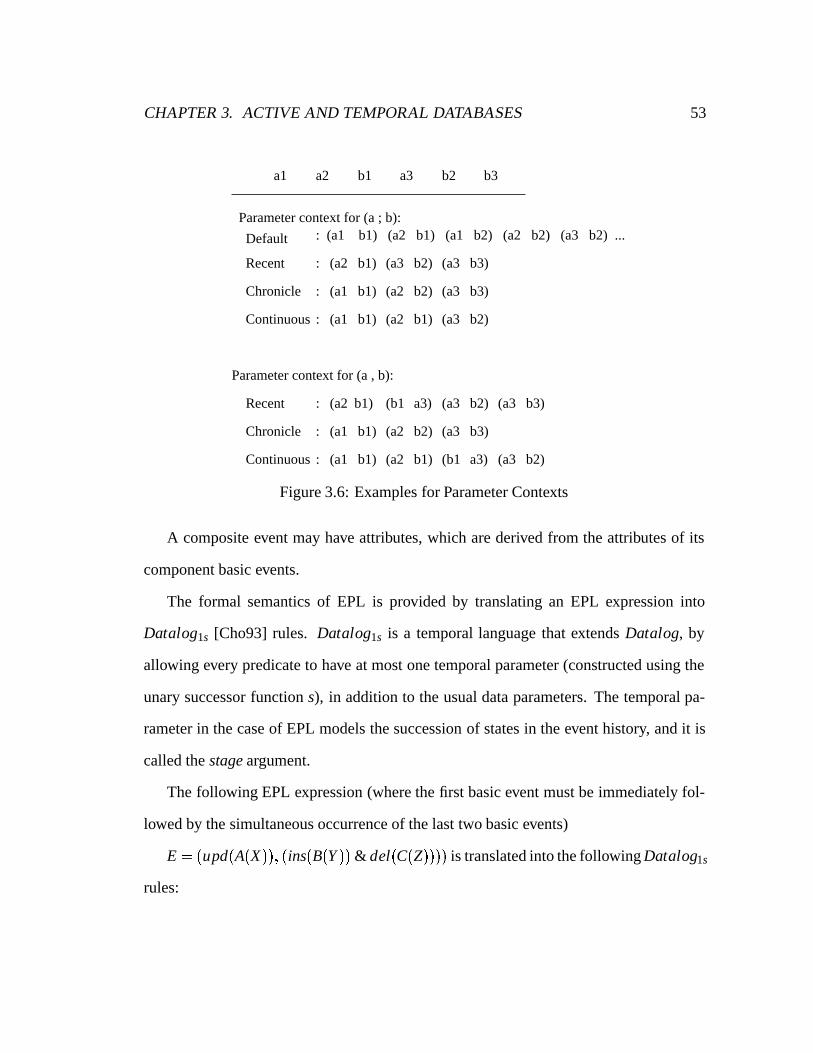
CHAPTER 3. ACTIVE AND TEMPORAL DATABASES 53
a1 a2 b1 a3 b2 b3
Chronicle
Continuous :
:
Recent : (a2 b1) (a3 b2) (a3 b3)
(a1 b1) (a2 b2) (a3 b3)
(a1 b1) (a2 b1) (a3 b2)
Parameter context for (a , b):
Recent
Chronicle
Continuous :
:
: (a2 b1) (b1 a3) (a3 b2) (a3 b3)
(a1 b1) (a2 b2) (a3 b3)
(a1 b1) (a2 b1) (b1 a3) (a3 b2)
Parameter context for (a ; b):
Default : (a1 b1) (a2 b1) (a1 b2) (a2 b2) (a3 b2) ...
Figure 3.6: Examples for Parameter Contexts
A composite event may have attributes, which are derived from the attributes of its
component basic events.
The formal semantics of EPL is provided by translating an EPL expression into
Datalog1s [Cho93] rules. Datalog1s is a temporal language that extends Datalog, by
allowing every predicate to have at most one temporal parameter (constructed using the
unary successor function s), in addition to the usual data parameters. The temporal pa-
rameter in the case of EPL models the succession of states in the event history, and it is
called the stage argument.
The following EPL expression (where the first basic event must be immediately fol-
lowed by the simultaneous occurrence of the last two basic events)
E = (upd(A(X)); (ins(B(Y )) & del(C(Z)))) is translated into the following Datalog1s
rules:

CHAPTER 3. ACTIVE AND TEMPORAL DATABASES 54
sat1(X ;J) upd A(X ;J)
sat2(X ;Y;J) ins B(Y; s(J)), sat1(X ;J),
sat3(X ;Y;J) del C(Z; s(J)), sat1(X ;J),
satE(X ;Y;Z;J) sat2(X ;Y;J), sat3(X ;Z;J),
The arguments J and s(J) denote successive entries in the history of basic events.
Hence in the above rules if upd A occurs at stage J, then ins B occurs at the next stage
s(J).
3.4.5 Limitations of the Languages
� In ODE the concept of interval is missing. Specifications of events using inter-
vals are easily readable. For example, consider the example provided in [GJS92a]:
three successive discount rate cuts (D) without an intervening discount rate in-
crease (I). In ODE this will be specified as: relative(relative(D, !prior(I, D) &&
D), !prior(I, D) && D). Using an interval based language like the proposed CESL
CEDAR, this can be specified as I not in [D, 3 D].
� ODE does not consider explicit time as an event. As mentioned in [GJS92b], the
automaton for an event expression containing a condition like within 1 hour, has to
count 3600 ticks, if a tick occurs every second. The automaton for the expression
has to have 3600 states. They rather propose to specify time as an attribute. For
example, two IBM stock sales by the same customer within one hour of each other
is specified as follows: relative(sell(IBM, Y, A1, T1), sell(IBM, Y, A2, T2)) & (T2 -
T1) < 3600) [aIMS92]. None of the other two languages deal with explicit time.
� In ODE arbitrary (boolean and relational) predicates can be specified on event

CHAPTER 3. ACTIVE AND TEMPORAL DATABASES 55
attributes, but aggregate operations are not supported.
� The support for predicates or operations on event attributes is very limited in
SAMOS, only a limited set of predefined predicates on a predefined set of at-
tributes are supported. For example, the same transaction operation defined on an
implicit attribute called occ tid, the id of the transaction where the event occurred.
SAMOS does not support aggregation on event attributes.
� Snoop does not support event attributes.
� The operators supported by all the approaches are not enough for certain appli-
cations. For example, repeated occurrences of events at each sampling point of a
specified interval can not be expressed in any of the languages. This is because the
notion of chronon associated with an event is lacking in these languages.
� None of the above languages except EPL support specification of concurrent or
simultaneous events, which are very useful in certain applications. All of the ap-
proaches above impose a total order on the history. Strict total ordering of the
events in the global history is restrictive, since it introduces an artificial ordering.
For example, two events that occur simultaneously in two different entities will
appear as happening one after another in the global history.
� SAMOS and Snoop do not allow us to specify events of interest per entity, thus
restricting specification of certain event expressions. For example, consider Fig-
ure 3.7, in which parallel entities are shown to contribute events to the global
event history. For example, in network monitoring and control, different ma-
chines (agents) send their events to a central machine (manager) that monitors

CHAPTER 3. ACTIVE AND TEMPORAL DATABASES 56
Entity 1 Entity 2
Entity 3
Global History
Figure 3.7: Parallel entities contributing to global history
and controls the network. Yet other examples are the recordings into a database
of the activities (events) performed by individual human beings, for example,
hire/fire/promotion/buy/sell etc. events.
Assume that we want to check whether certain number of events happening in
Entity 1 strictly follow each other. If we consider the figure, we will see that other
entities get to insert their events between the events of Entity 1 into the global
history. Therefore, any operator checking immediate sequences of events in Entity
1 will not be satisfied in the global history shown in Figure 3.7, but it could have
been satisfied in a history local to the Entity 1.
In ODE presumably one can filter out events belonging to a particular entity through
the use of attributes. But the semantics of the operators is defined in terms of the

CHAPTER 3. ACTIVE AND TEMPORAL DATABASES 57
totally ordered global history. Hence, when evaluating the sequence operator, it
is checked whether events strictly follow each other in the totally ordered global
history.
� The features related to parameter context introduced in Snoop are missing in other
languages. The default context supported in SAMOS is a chronicle, as can be seen
from the few Petri nets discussed in [GD93].
� ODE implements event expressions (EE) as automata. The EEs without attributes
are equivalent to regular expressions. The EEs then can be processed by construct-
ing a finite-state machine (FSM). The event expressions with attributes are not
equivalent to R.Es, and cannot be recognized by FSMs. Furthermore, attributes
of interest may not be “immediate”, that is, their values are derived from events
occurring in the past. For events with attributes, the authors of ODE propose to
augment the states of the automata with a data structure that “remembers” attribute
history from the past. An extended automaton, like regular automaton, makes a
transition at the occurrence of each event in the history. In addition, an extended
automaton may look at the attributes of the event, and may also compute a set of
relations at the transition.
The implementation of operators using extended automata surrenders the initial
simplicity of FSMs. Even when variables are not used, the size of the automaton
can be super-exponential in the length of the event expression [Sto74]. For exam-
ple, the conjunction operator whose FSM is built by constructing the cross-product
of the FSMs for the operands.
CHAPTER 3. ACTIVE AND TEMPORAL DATABASES 58
� Snoop implements EEs using an event graph method. The event graph method also
suffers from an exponential blow-up problem.
� SAMOS implements EE using a Colored Petri Net. The Petri net does not suffer
from the exponential blow-up problem of FSMs and event graphs. But SAMOS
does not use the full power of the CPN. For example, transitions in a CPN can
be concurrently enabled and when enabled, can be fired at the same step. But
since SAMOS assumes a totally ordered history it does not exploit this particular
capability of a CPN. SAMOS also does not use the capabilities of a CPN to support
the concept of parameter context.
� EPL expressions are translated into Datalog1s rules. The rule set generated can be
large. The efficiency of execution of Datalog rules can be questioned, unless the
evaluation is incremental. Other methods such as FSM, Petri net are incremental
in nature.
� The expressive power of any of the discussed languages has not been investigated,
except that in the absence of event attributes ODE event expressions are equivalent
to regular expressions.
� The performance issues of the evaluation of event expressions have not been re-
ported in any of the works.
� All of the above three works have been conducted in an object-oriented database
framework [GJS92b, GD93, CAM93]. A number of event specification languages
have been defined in the relational database framework [SPAM91, WCL91], but
the operators supported in these languages are very limited. In fact, composite

CHAPTER 3. ACTIVE AND TEMPORAL DATABASES 59
event specification in the relational and temporal database framework has not been
investigated.
3.5 Temporal Logic
Temporal Logic (TL) [Eme90] was introduced for reasoning about systems that change
with time. Propositional Temporal Logic (PTL) is an extension of classical propositional
logic geared toward the description of sequences. In the linear time temporal logic (LTL)
[Pnu81] time is viewed as linear, that is, each time instant has a unique successor. The
structures over which LTL is interpreted are linear sequences. In the branching time
TL (BTL) [BAMP81], [EH85], each time instant may have several immediate succes-
sors corresponding to different futures, for example, branches corresponding to nonde-
terministic choices (or concurrency). The structures over which BTL expressions are
interpreted can be viewed as infinite trees.
Temporal logic formulas are interpreted over models that abstract away from the
actual times at which events occur, retaining only temporal ordering information about
the states of a system.
Conventional TL (linear time PTL) works with three modal operators 2 (always), 3
(eventually) and if the time domain is discrete, the (next) operator. In general, only
two operators and U (until) are essential.
The 2 and 3 operators can be defined from these two operators.
Definition 5.0.
Formulas are built from:
� A set of atomic propositions p 2 AP.

CHAPTER 3. ACTIVE AND TEMPORAL DATABASES 60
� Boolean connectives ^, :.
� Temporal operators (next), U (until).
The formulation rules are:
� An atomic proposition p 2 AP is a formula.
� If f1 and f2 are formulas, then so are f1 ^ f2, : f1, f1, [ f1U f2] ( f1 is true at all
the states until f2 is true).
Abbreviations:
� _ and! (implication).
� 3 f (eventually) � true U f .
� 2 f (always)� :3: f � f U f alse.
Example 5.1.
2(I! 2 I), means that if I ever becomes true, then it will remain true forever.
Example 5.2.
2(P! 3 Q), states that if P ever becomes true, then Q will be true at the same time
or later.
The formulas are evaluated over a static history, whereas the histories treated by the
CESLs discussed above are dynamic. The TL is used to reason about sequences of states
in some temporal order. A composite event algebra or logic is geared towards detecting
sequences of events occurring in some temporal order. Absolute time is not supported in
TL.
CHAPTER 3. ACTIVE AND TEMPORAL DATABASES 61
3.6 Discussion
To overcome the problems associated with the languages discussed above, we have pro-
posed a composite event specification language called CEDAR (Composite Event Def-
inition for Active Rules) [Has95]. An implementation model of the language opera-
tors using Colored Petri Nets (CPN) is also proposed. We believe that this language
is well-suited for a number of application domains requiring active database support.
The language was developed in the course of our research in network management
[CH93, Has95]. This particular application requires certain facilities that are difficult
or not possible to express in existing languages. The definition of events in the proposed
language is similar to the definition of the same in temporal databases. We also sup-
port intervals in the proposed language and the definition of it follows that of a temporal
database.
The notion of chronon (sampling points) associated with an event is new to a CESL.
We use this particular feature to define a new CESL operator called always (2). It differs
from the temporal logic2 operator in that the occurrences of events are checked at every
single chronon point in a specified interval. If an event does not occur in any of the
chronon points of the interval, then the next interval is awaited.
Aggregation not supported in other languages, is supported in CEDAR.
Concurrency, not supported in most other languages, is supported in CEDAR.
All the parameter contexts supported in Snoop are supported in CEDAR, but in a
more succinct, formal and declarative way than Snoop. In contrast to SAMOS, where
only the chronicle context is supported, we support all the contexts in our implementation
of CPNs.

CHAPTER 3. ACTIVE AND TEMPORAL DATABASES 62
A table comparing the features of the languages is shown in Figure 3.8.

CHAPTER 3. ACTIVE AND TEMPORAL DATABASES 63
Interval Concurrency Parameter
Context
Event
Attributes
Aggregation
on Attributes
Ordering Explicit Time
as Event
ODE
SAMOS
SNOOP
EPL
CEDAR
No
Yes
Yes
Yes
No
No
No
No
Yes
Yes
No
No
No
No
Yes
Finite State
Machine
Colored Petri
Net
Event Graph
Datalog 1s
Colored PetriNet (Full power)
No
No
Yes
Partial
Yes
Yes
Yes
Yes
No
Limited
No
No
No
No
Yes
Total
Total
Total
semi-total
semi-total
No
No
Yes
Yes
Semantics
OperationalFeatures
CESLatAlways op
Persistence
Chronon points)(
Partial
Figure 3.8: Comparison of language features
Chapter 4
CEDAR, The Event Specification
Language
In this section we introduce our proposed event specification language for specifying
composite events. We call the language CEDAR: Composite Event De�nition for Active
Rules. A number of operators are defined which operate on a sequence (or history) of
events.
CEDAR attempts to address the limitations of the existing languages (and their imple-
mentations) discussed in Chapter 3. Before we introduce the language we will motivate
it through a number of practical examples from NM domain.
A mechanism for event filtering called the hysteresis mechanism is defined in the
RMON (Remote MONitoring) specification [Wal] (a network management standard).
The mechanism by which small fluctuations are prevented from causing alarm is referred
to in the RMON specification as hysteresis mechanism. Hysteresis mechanism is best
explained through the Figure 7.8.a (similar to the figure in [Sta93]. We modify it to
64

CHAPTER 4. CEDAR, THE EVENT SPECIFICATION LANGUAGE 65
Time
Sampled object value
RT
FT
1
2
3
RT - Rising ThresholdFT - Falling Threshold
1 1 2 2 3 3 3 1 1 1 2 1 1 1 2 2 2 3 3 3 1 1
* * * * *
2 2 2 2 2 2
b)
e_3 fs e_1
not (e_3 fs e_1)a)
e_1 fs e_3
Figure 4.1: Specification of Hysteresis Mechanism
suit our purpose). As the rules for the hysteresis mechanism stipulates only the events
marked as stars (*) will be reported. The hysteresis can be specified declaratively as a
composite event. For example, if e1 and e3 are the (sampling) events in the regions 1
and 3 respectively (in Figure 7.8), then hysteresis is defined as first e3 event since the
recent e1 event or first e1 event since the recent e3 event. This composite event may be
possible to express in some of the existing languages discussed in Chapter 3, albeit with
difficulty. But let us consider the Figure 7.9, which, shows that an event (congestion, for
example) “persists” for long time in the region 1. Since the model of time in our system

CHAPTER 4. CEDAR, THE EVENT SPECIFICATION LANGUAGE 66
Sampled object value
RT
FT
1
2
3
RT - Rising ThresholdFT - Falling Threshold
Time
Figure 4.2: “Persistence” of sampled event
is not continuous, rather discrete, we have to define the notion of “persistence” in this
discrete world. In network management an event may be defined by sampling an MO at
regular intervals and evaluating a predicate on the sampled data. For example, the values
of ifOutDiscards MIB variable of a router may be sampled each minute (the chronon in
TDB term is one minute) and an event called congestion defined when the values exceed
a threshold. The chronon of the congestion event is one minute. In defining persistence
the sampling interval (chronon) has to be considered. If the event happens at all points of
the chronon for the specified duration, then the event “persists” for that duration. If the
event does not happen at any of the sampling or chronon point, then the event does not
“persist” in the specified interval, and we have to look for a new interval (starting from
the point where the event did not happen at the sampling point). To specify “persistence”

CHAPTER 4. CEDAR, THE EVENT SPECIFICATION LANGUAGE 67
we introduce an operator (the always operator described below) which no other existing
lnguage supports. Hence it may not be possible to specify “persistence” in the exisiting
languages.
None of the existing languages support aggregation on event attributes. In NM max-
imum/minimum values of certain MOs have to be sampled at regular intervals, and the
result shown as graphs on the management console. For example, sample and report
maximum values of Server overload events at the end of every 30 minutes intervals
from 9AM to 5PM (the corresponding diagram is shown in Figure 4.3).
5 P.M.9 A.M.30 Min
Server_overload Events max (value)
Figure 4.3: Eample Composite Event Expression with Aggregation
A number of interesting event expressions for the NM domain is provided in Chapter
7.
4.1 Events in CEDAR
The primitive events are the basic objects in CEDAR. A primitive event is a pair (event
name (attributes), time instant). The event name is a (symbolic) name e of the event and
time instant is the time t (on the system clock) at which the event has happened. The
CHAPTER 4. CEDAR, THE EVENT SPECIFICATION LANGUAGE 68
attibutes are optional and can carry information about the state of the object at which
the event has occurred. Explicit time events are also primitive events and represented
as (following the same definition as above) (time name (attribute), time instant). The
possible time names are second, minute, hour, day, week, month, year.
We asume a discrete time domain (for time instant or timestamp), isomorphic to
integer.
An event name defines an event type. Multiple instances of the same type name may
happen at different time instants or concurrently.
A composite Event is a sequence of primitive events in some temporal order. Com-
posite events are specified using event expressions which are formed using primitive
events, intervals (defined later) and CEDAR language operators (defined later). The lan-
guage operators defines the (temporal) order between primitive events.
4.1.1 Chronon
A chronon defines the sampling points of an event or the granularity with which the event
is timestamped. If the chronon is 1 minute, then the event happens (or does not happen)
at 1 minute boundaries. Following the concept in temporal databases, we assume that
every primitive event type defined in the system has a chronon associated with it.
4.1.2 Intervals
Let Is and Ie be the start and end points of an interval I. Is and Ie are any primitive or
composite events. An interval is defined as follows:
[Is [; Ie]], where Ie can be optional.
CHAPTER 4. CEDAR, THE EVENT SPECIFICATION LANGUAGE 69
If Ie is not specified and Is is defined as a composite event using the operators defined
next, the interval is defined by the occurrence times of the start and end events of the
composite event.
An interval [I] defines a sub-history delimited by the start and end events. Let tstart be
the start time of the global history, and tnow is the time of the currently occurring event.
Then the interval [tstart , tnow] defines the global history of events occurring from the start
to the occurrence time of the recent event.
4.2 Definition of CEDAR
We define a number of basic operators we think are useful for a number of applica-
tions requiring active database support. The operators provide support for compression,
suppression, filtering, aggregation, and counting of events, and establishing temporal
relationship between events.
4.2.1 Syntax and Semantics
The syntax of a primitive event is the following: event name (attributes), where attributes
can be optional. For example, congestion (router1, 145), hour (14) (2PM). The occur-
rence time of an event is implicit. The reference to time instants (occurrence times of
events) are made through the use of the language operators.
A (event) history is a finite set of primitive events. A global history is the history of
events in all the observed entities observed from a single observing point. Let H be the
event history containing the occurred events (instances of event types), where events are
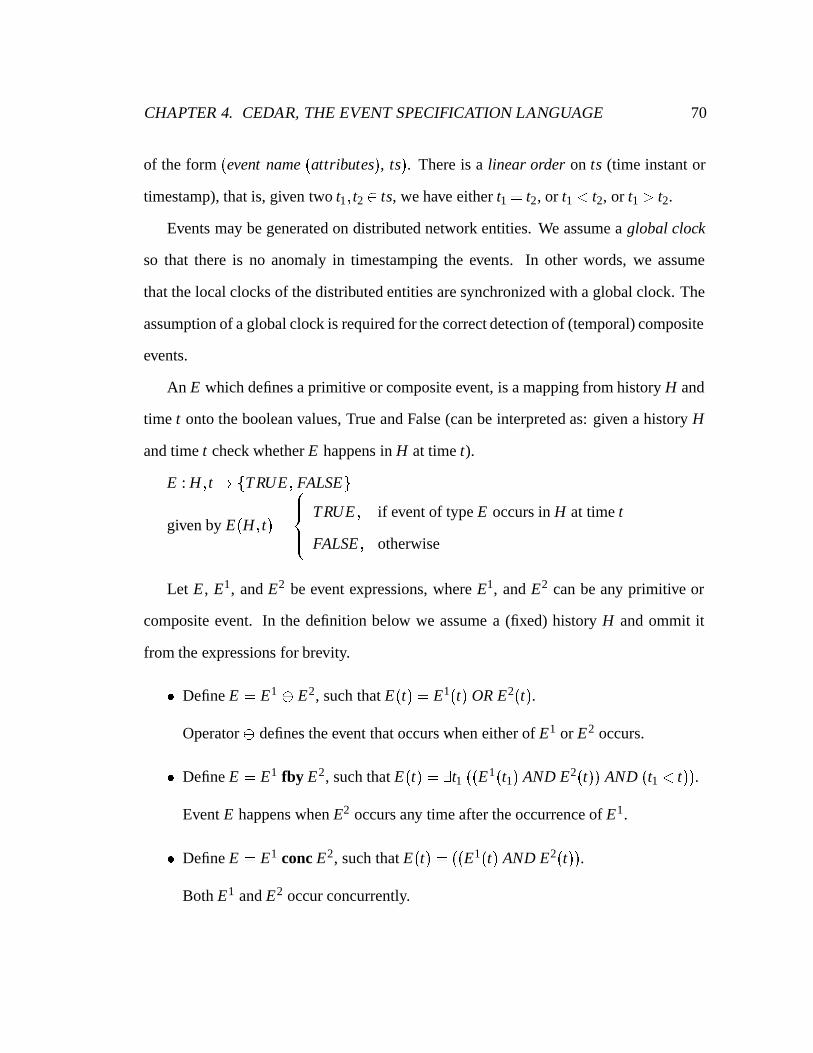
CHAPTER 4. CEDAR, THE EVENT SPECIFICATION LANGUAGE 70
of the form (event name (attributes), ts). There is a linear order on ts (time instant or
timestamp), that is, given two t1; t2 2 ts, we have either t1 = t2, or t1 < t2, or t1 > t2.
Events may be generated on distributed network entities. We assume a global clock
so that there is no anomaly in timestamping the events. In other words, we assume
that the local clocks of the distributed entities are synchronized with a global clock. The
assumption of a global clock is required for the correct detection of (temporal) composite
events.
An E which defines a primitive or composite event, is a mapping from history H and
time t onto the boolean values, True and False (can be interpreted as: given a history H
and time t check whether E happens in H at time t).
E : H; t! fTRUE; FALSEg
given by E(H; t) =
8><>:
TRUE; if event of type E occurs in H at time t
FALSE; otherwise
Let E , E1, and E2 be event expressions, where E1, and E2 can be any primitive or
composite event. In the definition below we assume a (fixed) history H and ommit it
from the expressions for brevity.
� Define E = E1 E2, such that E(t) = E1(t) OR E2(t).
Operator defines the event that occurs when either of E1 or E2 occurs.
� Define E = E1 fby E2, such that E(t) = 9t1 ((E1(t1) AND E2(t)) AND (t1 < t)).
Event E happens when E2 occurs any time after the occurrence of E1.
� Define E = E1 conc E2, such that E(t) = ((E1(t) AND E2(t)).
Both E1 and E2 occur concurrently.

CHAPTER 4. CEDAR, THE EVENT SPECIFICATION LANGUAGE 71
� Define E = E1 in [I], where I is an interval delimited by the start event Is and end
event Ie,
such that E(t) = 9t1 8t2 (((Is(t1) AND E1(t) AND (t1 < t)) AND ((t1 < t2 < t)!
:Ie(t2)))).
E happens when E1 happens in the interval I. Note that E is signalled as soon as
E1 happens, no matter whether the end of interval happens. For this reason, we
define another operator in end where E is signalled with delay, that is the system
accumulates the E1 events and signal only when the end of interval Ie happens.
� Define E = E1 in end [I], such that
E(t) = 9t1 9t2 8t3 (((Is(t1) AND E1(t2) AND Ie(t)) AND (t1 < t2 < t)) AND
((t1 < t3 < t)!:Ie(t3))).
� Define E = E1 not in [I], such that
E(t) = 9t1 8t2 8t3 (((Is(t1) AND Ie(t)) AND (t1 < t)) AND ((t1 < t3 < t) !
:Ie(t3)) AND ((t1 < t2 < t)!:(E1(t2)))).
E happens if E1 does not happen in the interval I. E is signalled at the end point Ie
of I.
� Define E = E12 [I].
Let t2 be the chronon points (sampling points) of the instances of event E1. E
occurs when instances of E1 occur at all chronon points t2 in the interval I.
E(t) = 9t1 8t2 8t3 ((((Is(t1) AND E1(t2) AND Ie(t)) AND (t1 < t2 < t)) AND
((t1 < t3 < t)!:Ie(t3))).
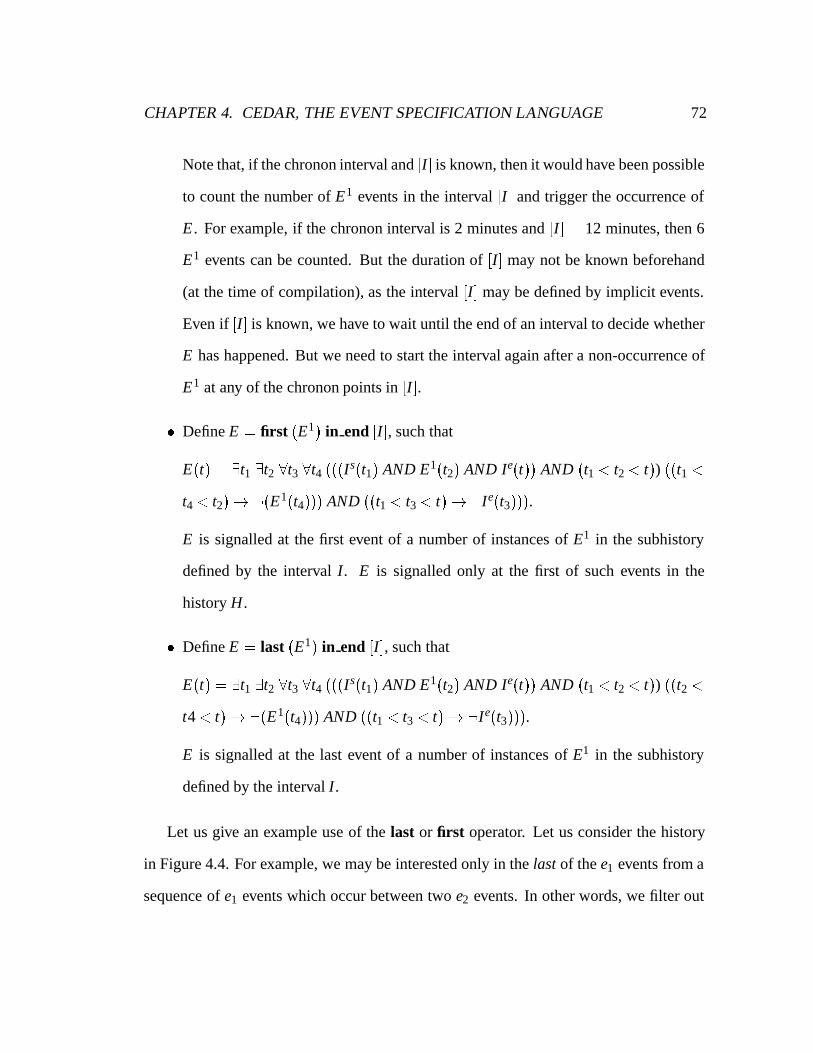
CHAPTER 4. CEDAR, THE EVENT SPECIFICATION LANGUAGE 72
Note that, if the chronon interval and [I] is known, then it would have been possible
to count the number of E1 events in the interval [I] and trigger the occurrence of
E . For example, if the chronon interval is 2 minutes and [I] = 12 minutes, then 6
E1 events can be counted. But the duration of [I] may not be known beforehand
(at the time of compilation), as the interval [I] may be defined by implicit events.
Even if [I] is known, we have to wait until the end of an interval to decide whether
E has happened. But we need to start the interval again after a non-occurrence of
E1 at any of the chronon points in [I].
� Define E = first (E1) in end [I], such that
E(t) = 9t1 9t2 8t3 8t4 (((Is(t1) AND E1(t2) AND Ie(t)) AND (t1 < t2 < t)) ((t1 <
t4 < t2)! :(E1(t4))) AND ((t1 < t3 < t)!:Ie(t3))).
E is signalled at the first event of a number of instances of E1 in the subhistory
defined by the interval I. E is signalled only at the first of such events in the
history H .
� Define E = last (E1) in end [I], such that
E(t) = 9t1 9t2 8t3 8t4 (((Is(t1) AND E1(t2) AND Ie(t)) AND (t1 < t2 < t)) ((t2 <
t4 < t)! :(E1(t4))) AND ((t1 < t3 < t)!:Ie(t3))).
E is signalled at the last event of a number of instances of E1 in the subhistory
defined by the interval I.
Let us give an example use of the last or first operator. Let us consider the history
in Figure 4.4. For example, we may be interested only in the last of the e1 events from a
sequence of e1 events which occur between two e2 events. In other words, we filter out

CHAPTER 4. CEDAR, THE EVENT SPECIFICATION LANGUAGE 73
repeated instances of e1 or e2 events occurring in (strict) sequence. The first or the last
of the event instances of the same type can only be decided at the end of the interval (not
before that). Hence a delay may be introduced before a composite event is detected.
e2 e2 e2 e1 e1 e1 e2 e2 e1 e2 e2 e1 e1
Figure 4.4: Example event history of E1 and E2
4.2.2 Interval operator
To set end points of an interval it is useful to define a special operator called prior. This
operator defines the last preceding occurrence time of a composite event.
Let E = E1 op E2, It = prior (E) defines the last preceding occurrence time It of the
composite event E . E is supposed to happen (vacuously) at tstart .
4.2.3 Additional Operators
Various useful derived operators can be defined in terms of the basic operators defined
above. A few of them are define below:
� E = any = e1 e2 ::: en is satisfied when any of primitive events e 2 P
happens.
� E = E1 � E2 = (E1 fby E2) (E2 fby E1) (E1 conc E2).
E occurs when both of E1 and E2 occur in any order.
CHAPTER 4. CEDAR, THE EVENT SPECIFICATION LANGUAGE 74
� E = nth (n; E1) = E11 � E1
2 ::: � E1n , E occurs at the nth occurrence of E1. The
expression can be abbreviated as n E1 (for example, 2 minute).
� E = (E1 seq E2) = any not in [E1, E2].
E1 and E2 happens in strict sequence and no other (any) event happens between
them.
� E = E1 fs E2 = last(E1) in end [prior(E), E2], specifies the first E2 event since
the last (recent) E1 event that happens between the last preceding occurrence of E
and E2. E is supposed to happen at tstart initially.
� E = I1 ovl I2 = (Is2 in [I1]) fby (Ie
1 in end [I2])
E happens when the two intervals I1 and I2 overlap.
4.2.4 Event Attributes
Event attributes may serve a number of purposes:
1. Event attributes can be used to constrain the detection of events.
2. Event attributes can supply parameters to the conditions and/or actions of an ECA
rule.
3. The attributes of constituent events of a composite event can be collected, for ex-
ample, in the form of a relation to which queries may be applied.

CHAPTER 4. CEDAR, THE EVENT SPECIFICATION LANGUAGE 75
4.2.5 Constraining Events through Attributes
Boolean and relational conditions, and aggregate operators can be defined on event at-
tributes to constrain the detection of events.
Let E1:Ak be a user-defined attribute of event type E1. Let expr (E1
:Ak) be a boolean,
relational, or an aggregate operator on attribute(s) E1:Ak (cardinality of attributes defined
by the operators).
Define E = E1 & expr (E1:Ak), such that
E(t) = E1(t) AND (expr (E1(t):Ak) = TRUE).
Following is an example with a condition on an attribute. The example expression
specifies that two insert events strictly follow each other, and the difference between the
values of V 1 and V 2 exceeds a threshold value (which is a constant).
(insert(tcp tab;Node;V1) seq insert(tcp tab;Node;V2)) & (V2�V1)> threshold.
Aggregate Operators
Various aggregate operators can be applied to event attributes to filter events of interest.
These operators should be used in an interval (as in the case of first and last operators
defined above).
Let E1:A defines a user-defined attribute of event type E1.
� Define E = E1 & max (E1:A) in end [I], such that
E(t) = 9t1 9t2 8t3 8t4 (((Is(t1) AND E1(t2) AND Ie(t)) AND (t1 < t2 < t)) (((t4 6=
t2) AND (t2 < t4 < t))! (E1(t4):A < E1(t2):A)) AND ((t1 < t3 < t)!:Ie(t3))).
� Define E = E1 & min (E1:A) in end [I], such that

CHAPTER 4. CEDAR, THE EVENT SPECIFICATION LANGUAGE 76
E(t) = 9t1 9t2 8t3 8t4 (((Is(t1) AND E1(t2) AND Ie(t)) AND (t1 < t2 < t)) (((t4 6=
t2) AND (t2 < t4 < t))! (E1(t4):A > E1(t2):A)) AND ((t1 < t3 < t)!:Ie(t3))).
In the same way count and avg (average) aggregate operators are defined.
4.2.6 Event Expressions with Attributes
Each primitive event has a set of typed attributes. When a composite event happens the
attributes of the constituent events become the attribute of the composite event. When a
composite event is detected the resulting attributes are output.
Let E(X ) be a composite event expression, where X are the free variables in E . For
each point in history H where E(X ) is satisfied, a set of tuples for attributes X is returned.
In other words, the result of evaluation of a composite event expression is a relation.
The attributes of a composite event are defined as follows:
� E(X) = E1(X ) E2(X ), E1 and E2 have to have the same signature (number and
type of attributes).
� For the rest of the operators the attributes of E are the union of attributes of the
constituent events.
4.2.7 Parameter Context
The parameter contexts proposed in [CKAK94] can be used with the operators � and
fby.
Let E = E1 op E2, where op is either � or fby. The parameter contexts can be
defined as follows:

CHAPTER 4. CEDAR, THE EVENT SPECIFICATION LANGUAGE 77
� Recent: last (E1) in end [tstart; tnow] op E2.
� Chronicle: In this context the accumulated events corresponding to the first operand
are considered in FIFO order. Let us introduce a qualifier called fifo. We have then,
fifo (E1) op E2. In this way, each unique E2 is paired with each unique E1.
� Continuous: This context is similar to the unrestricted or default context, but all
of the instances of the first operand are removed after being paired with the recent
instance of the second operand. Let us introduce a qualifier called all. We have
then, all (E1) op E2.

Chapter 5
Operational Semantics of CEDAR
using Colored Petri Nets
In this section we will provide an implementation model of CEDAR operators using
colored Petri nets (CPN) [JR91]. The CPNs provide a good abstraction for describing the
operational semantics of language operators, thus providing a vehicle for implementing
the composite event detectors.
5.1 Colored Petri Net
A non-hierarchical CPN is a tuple CPN = (Σ, P, T , A, N, C, G, E , IN).
� The net structure is a directed graph with two kinds of nodes, places P and transi-
tions T , interconnected by arcs A.
78
CHAPTER 5. OPERATIONAL SEMANTICS OF CEDAR USING COLORED
PETRI NETS 79
� A is a finite set of arcs. Each arc A connects a place and a transition, as given by
the node function N.
� N is a node function, defined as N : A! P � T [ T � P.
� Σ is a non-empty finite set of types, called colored sets. A token of a CPN, as op-
posed to simple Petri net, can carry complex information. Color sets are analogous
to types in programming languages. Each place P has a color set attached to it,
that is, that place can contain token of the type(s) defined by color set(s) attached
to it. Color sets also define the operations and functions which can be applied to
the colors.
� C is a color function, defined as C : P ! Σ. C maps each place p into a set of
possible token colors C(p).
The distribution of tokens on the places is called a marking.
� A guard function G may be attached to a transition T . It is defined from T into
expressions such that:
8t 2 T : [Type(G(t)) = Bool ^ [Type(Var(G(t))) � Σ]]
Type(Var(expression)) means the type of all the variables in the expression.
The guard function maps each transition t into an expression of type boolean.
Moreover, all variables in G(t) must have types that belongs to Σ.
� An arc expression E is defined from A into expressions such that:
8a 2 A : [Type(E(a)) = C(p(a))MS ^ Type(Var(E(a))) � Σ]

CHAPTER 5. OPERATIONAL SEMANTICS OF CEDAR USING COLORED
PETRI NETS 80
An arc expression E is attached to an arc. E maps each arc a into an expression
which must of be of type C(p(a))MS (MS stands for multi-set), that is, the evalua-
tion of an arc expression yields a multi-set over the color set that is attached to the
corresponding place.
� Places may have an initialization function IN inscribed to them which describes
the initial marking of the net. An initialization function IN is defined from P into
expressions such that:
8p 2 P : [Type(IN(p)) = C(p)MS ^ Var(IN(p)) = /0]
The expression is not allowed to contain any variable.
Places are depicted as circles, transitions as vertical line segments, and arcs as arrows.
5.1.1 Behavior of CPN
A transition fires when it is enabled. A transition is enabled when 1) enough tokens are
available at all the input places of a transition t, 2) the variables of input arc expressions
(if any) can be bound with appropriate tokens present on the input places and evaluated,
3) the guard (if present) evaluates to true. When a transition fires, tokens are removed
from the input places and placed on the output places. The number of removed/added to-
kens and the colors of these tokens are determined by the value/type of the corresponding
input and output arc expressions evaluated with respect to the binding in question.
A distribution of tokens on the places is called a marking. The initial marking is the
marking determined by evaluating the initialization expressions. A pair, where the first
element is a transition and the second element a binding of that transition, is called an

CHAPTER 5. OPERATIONAL SEMANTICS OF CEDAR USING COLORED
PETRI NETS 81
occurrence element. Several occurrence elements may be enabled in the same marking.
In that case there are two different possibilities: either there are enough tokens (so that
each occurrence element can get its own share) or there are too few tokens (so that several
occurrence elements have to compete for the same input tokens). In the first case the
occurrence elements are said to be concurrently enabled. They can occur in the same
step and they each remove their own input tokens and produce their own output tokens.
In the second case the occurrence elements are said to be in conflict with each other and
they can not occur in the same step. Note that multiple tokens in one place are ordered
in the order of their occurrence: the tokens are placed in FIFO (First In First Out queue).
Formally the behavior of a CPN can be defined as follows:
� A marking of CPN is a function M defined on P, such that M(p) 2C(p)MS for all
p 2 P.
� A step of CPN is function Y defined on T , such that Y(t) 2C(t)MS for all t 2 T .
� A step Y is enabled in a marking M iff the following property is satisfied:
8p 2 P : [∑(t;b)2Y E(p; t) : b �M(p)], Where (t;b) 2 Y indicates that t is enabled
in M for the binding b and E(p; t) : b indicates the binding of the variables in the
arc expressions on the arc P�T .
If two different transitions t1; t2 2 T satisfy Y(t1) 6= /0 6= Y (t2), then t1 and t2 are
said to be concurrently enabled. If a transition t 2 T satisfies jY (t)j � 2, then t is
said to be concurrently enabled with itself. When a binding b 2 B(t) of t satisfies
Y(t) � 2 rm b, we say that (t;b) is concurrently enabled with itself, where rm is a
function that takes an integer n and a color c and returns the multi-set that contains

CHAPTER 5. OPERATIONAL SEMANTICS OF CEDAR USING COLORED
PETRI NETS 82
n appearances of c.
� When a step Y is enabled in a marking M1, it may occur, changing the marking M1
to another marking M2, defined by:
8p 2 P : [M2(p) = M1(p)�∑(t;b)2Y E(p; t) : b+∑(t;b)2Y E(t; p) : b]:
The first sum contains the removed tokens, whereas the second the added tokens.
Moreover, we say that M2 is directly reachable from M1 by the occurrence of the
step Y , which is denoted by M1[YiM2. A reachable set R(CPN, M) of a CPN with
marking M is defined as a set of all markings which are reachable from M. Reach-
ability is the reflexive, symmetric, and transitive closure of direct reachability.
5.1.2 Properties - Liveness, Boundedness
The properties for simple Petri net have been well defined. The general properties of
the advanced Petri nets such as CPNs are difficult to define. But the the properties are
generally defined for the convenience of specific application domain. In this section
we introduce various properties of a system that can be proved using various analysis
methods defined for Petri nets, even though we do not define and prove the properties of
the CPNs defined in this chapter.
Liveness: The liveness property is defined based on the change of markings due to
transitions. A transition t j of a CPN is potentially firable in a marking M if there exists
a marking Mi 2 R(CPN;M) and tj is enabled in Mi. A transition is live in a marking M
if it is potentially firable in every marking in R(CPN;M). If PN represents a model of a
system, the liveness property of PN implies that the modeled system will never deadlock.

CHAPTER 5. OPERATIONAL SEMANTICS OF CEDAR USING COLORED
PETRI NETS 83
Boundedness: A place is said to be k-color-bounded with respect to a set of k token
colors if that place can only be marked with tokens belonging to that token color set. A
place in a CPN is said to be color-safe with respect to one specific token color if the place
can only be marked by that type or color token.
Petri Nets have been used mainly for modeling and analysing real-world problems.
But in this thesis we do not model any real-world problem such as the readers/writers
problem, or dining philosophers problem, or modelling a manufacturing process. The
analysis method of Petri nets, for example, depends on so called place-invariant. Finding
place-invariants are not easy for a particular system. Place-invariants are defined based
on the properties of a modelled system. Place-invariants, for example, can be used for
analysing the liveness (deadlock) property of a modelled system. It is not clear what
could be the properties of a CEDAR operator such as fby or in. Hence finiding a place-
invariant for them will be difficult or may not be possible. The use of CPN in this thesis
also differs from its usual use in that the places are getting constant feed of token from
outside environment, which is not the case in the case of usual modelling using CPN. It
is clear though that a place for the CPN of the fby operator may be unbounded.
The CPN in this thesis has been used mainly to define the operational semantics
of CEDAR expressions. It has been used since it provides a succint mechanism for
incremental evaluation of event expressions. In other words, it provides a mechanism for
developing incremental detectors of composite events.
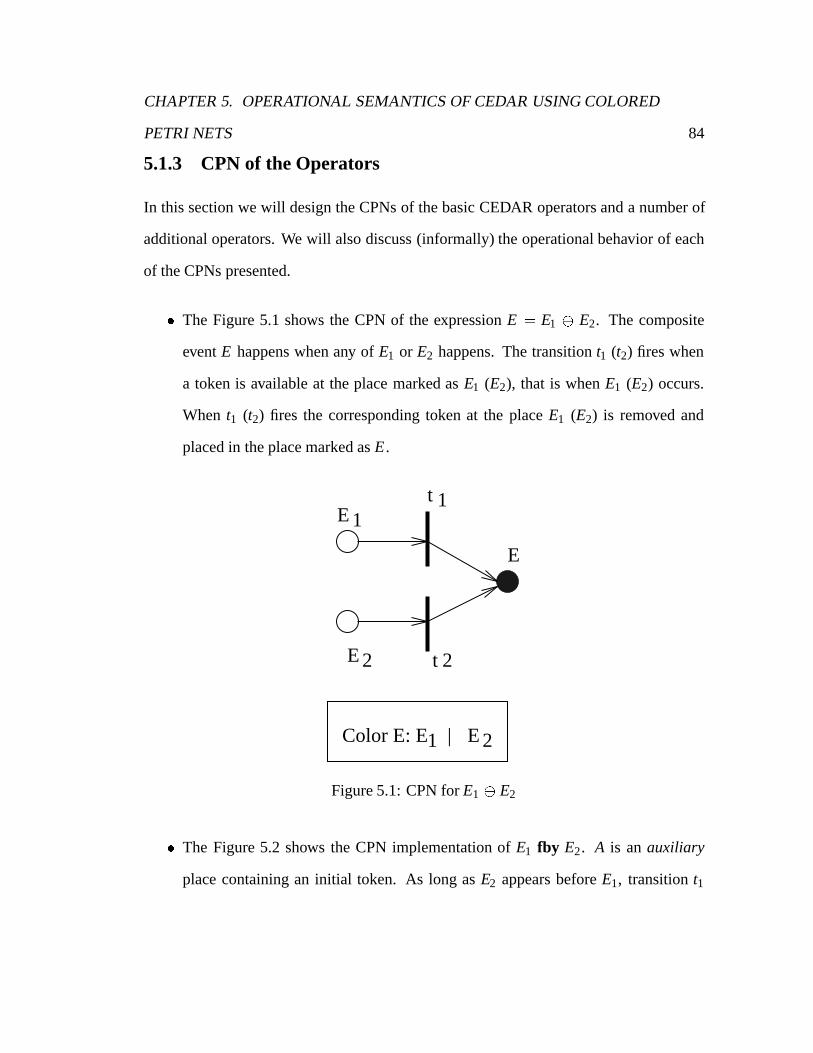
CHAPTER 5. OPERATIONAL SEMANTICS OF CEDAR USING COLORED
PETRI NETS 84
5.1.3 CPN of the Operators
In this section we will design the CPNs of the basic CEDAR operators and a number of
additional operators. We will also discuss (informally) the operational behavior of each
of the CPNs presented.
� The Figure 5.1 shows the CPN of the expression E = E1 E2. The composite
event E happens when any of E1 or E2 happens. The transition t1 (t2) fires when
a token is available at the place marked as E1 (E2), that is when E1 (E2) occurs.
When t1 (t2) fires the corresponding token at the place E1 (E2) is removed and
placed in the place marked as E .
E 1
E 2
t 1
t 2
E
Color E: E 1 E 2|
Figure 5.1: CPN for E1 E2
� The Figure 5.2 shows the CPN implementation of E1 fby E2. A is an auxiliary
place containing an initial token. As long as E2 appears before E1, transition t1
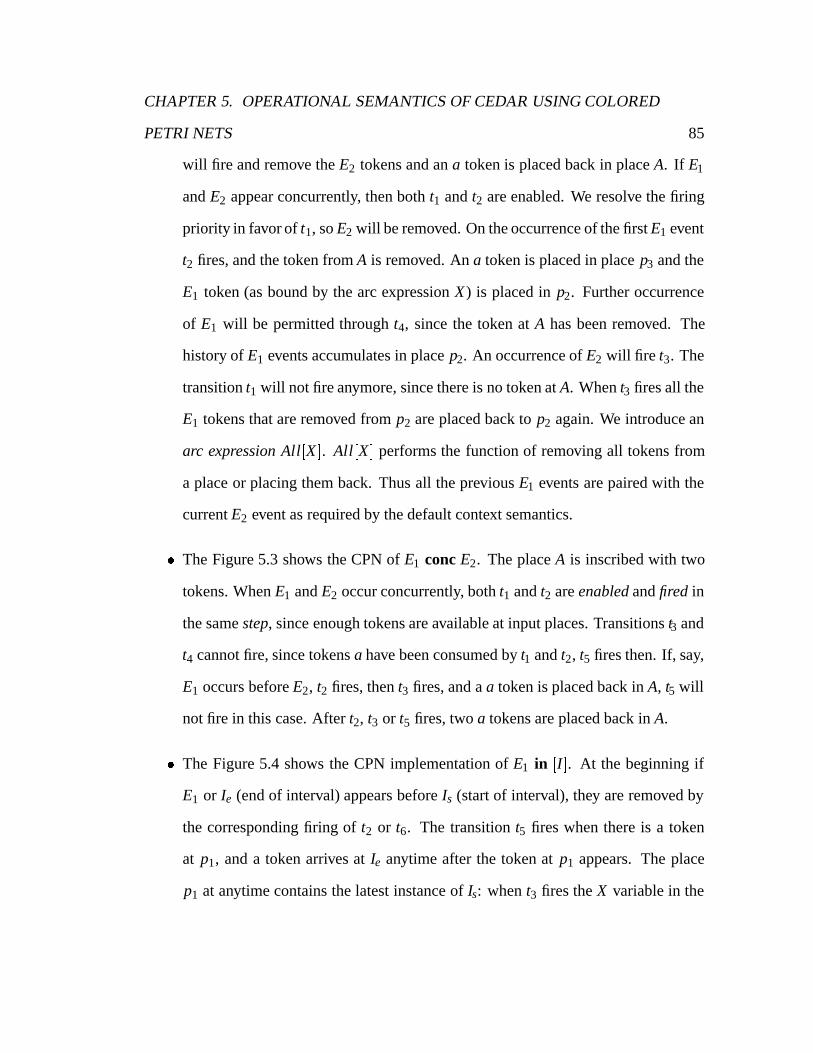
CHAPTER 5. OPERATIONAL SEMANTICS OF CEDAR USING COLORED
PETRI NETS 85
will fire and remove the E2 tokens and an a token is placed back in place A. If E1
and E2 appear concurrently, then both t1 and t2 are enabled. We resolve the firing
priority in favor of t1, so E2 will be removed. On the occurrence of the first E1 event
t2 fires, and the token from A is removed. An a token is placed in place p3 and the
E1 token (as bound by the arc expression X ) is placed in p2. Further occurrence
of E1 will be permitted through t4, since the token at A has been removed. The
history of E1 events accumulates in place p2. An occurrence of E2 will fire t3. The
transition t1 will not fire anymore, since there is no token at A. When t3 fires all the
E1 tokens that are removed from p2 are placed back to p2 again. We introduce an
arc expression All[X ]. All[X ] performs the function of removing all tokens from
a place or placing them back. Thus all the previous E1 events are paired with the
current E2 event as required by the default context semantics.
� The Figure 5.3 shows the CPN of E1 conc E2. The place A is inscribed with two
tokens. When E1 and E2 occur concurrently, both t1 and t2 are enabled and fired in
the same step, since enough tokens are available at input places. Transitions t3 and
t4 cannot fire, since tokens a have been consumed by t1 and t2, t5 fires then. If, say,
E1 occurs before E2, t2 fires, then t3 fires, and a a token is placed back in A, t5 will
not fire in this case. After t2, t3 or t5 fires, two a tokens are placed back in A.
� The Figure 5.4 shows the CPN implementation of E1 in [I]. At the beginning if
E1 or Ie (end of interval) appears before Is (start of interval), they are removed by
the corresponding firing of t2 or t6. The transition t5 fires when there is a token
at p1, and a token arrives at Ie anytime after the token at p1 appears. The place
p1 at anytime contains the latest instance of Is: when t3 fires the X variable in the

CHAPTER 5. OPERATIONAL SEMANTICS OF CEDAR USING COLORED
PETRI NETS 86
t3
A
CE
Y
p2
(X, Y)
t1
E
a
Y
2
E1
All [X]a
a
t2
p3
t4
a
a
a
X
X
X
E 1aColor A aE U E1 2
All [X]
Color p2 ::
Color p3 :Color CE:
Var X: E 1Var Y: E 2
Figure 5.2: CPN for E1 fby E2
output arc is bound with the value of the input arc (where from the latest Is appears)
inscribed with X variable (when the same variable appears more than once in the
guard/arc expressions of a single transition, all these appearances must be bound
to the same colour [JR91]). Each Is is paired with a unique Ie. The transition t4
fires when E1 follows Is, but before Ie.

CHAPTER 5. OPERATIONAL SEMANTICS OF CEDAR USING COLORED
PETRI NETS 87
E 2
Color A
E1
A
E
t1
t2
t3
t4
t5
2 a
Color E E U E 2
p1
p2
E 2E 1
:Color p1 :Color p2 :
: 1
2 a
aa
aa
2 a
X
Y
2 a
Var X : E2Var Y : E1
Figure 5.3: CPN for E1 conc E2
� The Figure 5.5 shows the CPN implementation of E1 in end [I]. Same as above,
but t10 fires only when end of interval Ie occurs. The transition t9 removes any
[Is; Ie] interval during which E1 did not happen. Transition t9 fires only if no E1
was followed by Is (the start of interval). If E1 events follow Is, then t7 fires on the
first such occurrence and t8 fires on the next such occurrences. The tokens keep
accumulating in place p5 until the end of interval Ie happens.
� The Figure 5.6 shows the CPN implementation of E1 not in [I]. The CPN of E1
not in [I] is almost the same as the CPN of E1 in end [I]. But in this case the firing
of t9 signals the occurrence of E . Because t9 fires when the interval [Is; Ie] occurs,
but no intervening E1 occurs (place p3 does not contain any token if E1 does not
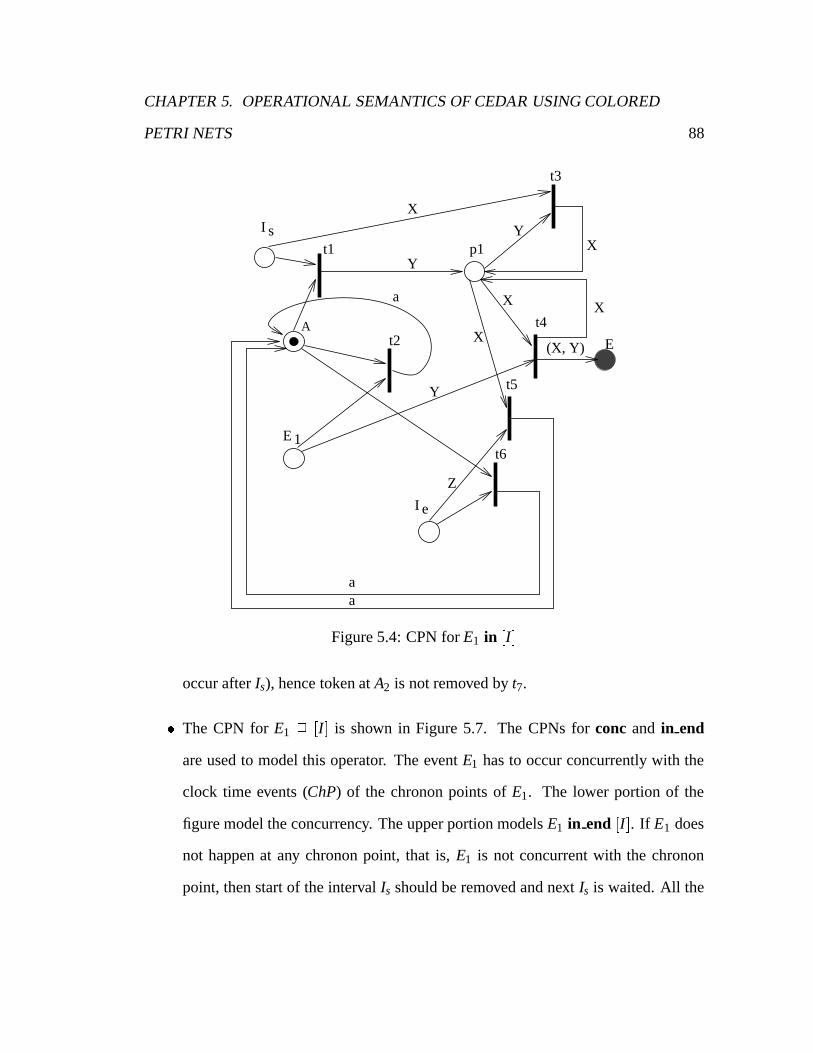
CHAPTER 5. OPERATIONAL SEMANTICS OF CEDAR USING COLORED
PETRI NETS 88
Y t5
X
Z
a
E
X
Y
YX
X
t1
t2
t3
t4
I s
I e
E 1
p1
(X, Y)
t6
A
a
aX
Figure 5.4: CPN for E1 in [I]
occur after Is), hence token at A2 is not removed by t7.
� The CPN for E1 2 [I] is shown in Figure 5.7. The CPNs for conc and in end
are used to model this operator. The event E1 has to occur concurrently with the
clock time events (ChP) of the chronon points of E1. The lower portion of the
figure model the concurrency. The upper portion models E1 in end [I]. If E1 does
not happen at any chronon point, that is, E1 is not concurrent with the chronon
point, then start of the interval Is should be removed and next Is is waited. All the

CHAPTER 5. OPERATIONAL SEMANTICS OF CEDAR USING COLORED
PETRI NETS 89
IsX
X2p1
X2t1
A
a
a t2
YY
E1
X
X
X
X
(X, Y)t4
a
eIZ
Z
t6
a
a
t5
p3
Z
t9
t7
t8
Z
Z
p2
p4 p5
A2
t10
E
t3
a
a
(X, Y)
a
a
a(X, Y)
a(X, Y)
aa
Var X: IsVar Y: E1Var Z: IeVar X1: All [X, Y]Var X2: U (All [X, Y], Z)
U stands for Union
X2
X2
X1
Figure 5.5: CPN for E1 in end [I]
accumulated tokens at the palce p5 are also removed. Transition t13 fires when E1
does not happen concurrently with ChP (choronon time tick). Hence Is at place
p1 is removed when t13 fires. In other words, non-occurrence of E1 at any of the
chronon points restarts the specified interval [I].
� A portion of the CPNs corresponding to first(E1) in end [I] is shown in Figure 5.8.
The first E1 fires t1. The next E1 events are permitted through the firing of t3. The

CHAPTER 5. OPERATIONAL SEMANTICS OF CEDAR USING COLORED
PETRI NETS 90
IsX
X2p1
X2t1
A
a
a t2
YY
E1
X
X
X
Xt4
a
eIZ
Z
t6
a
a
t5
p3
t9
t7
t8
p2
p4 p5
Ea
aa
a
aE1
t10
Var E1 : All[X,Y]Var E2 : (X,Y)Var E3 : (X,Z)
E2
E2
E2
E3 E3 E3
E3
a
a
E2
t3
p6
t11
a
a
E3
E3
Figure 5.6: CPN for E1 not in [I]
place p1 is always marked with the first E1 event. When t3 fires the Y variable in
the output arc is bound with the value of the input arc inscribed with Y variable.
The transition t4 fires when the end of the specified interval Ie occurs.
� A portion of the CPNs corresponding to last(E2) in end [I] is shown in Figure 5.9.
Since the X variable in the input arc is bound with the latest E1 event, the place p3
is always marked with the latest E1.

CHAPTER 5. OPERATIONAL SEMANTICS OF CEDAR USING COLORED
PETRI NETS 91
I sX
t3
X2p1
X2t1
A
a
a t2
YY
X
X
X
X
(X, Y)t4
a
eIZ
Z
t6
t5
p3
Z
t9
t7
t8
Z
Z
p2
p4 p5E1
E1
A
2 a
aa
aa
a
a
a2 a
ChPt11
t12
t13
t14
p6
p7
p8
t15
t16
t10
E2
E
a
a
a
p9
A1
Figure 5.7: CPN for E1 2 [I]
� The CPN for nth (n, E1) is shown in Figure 5.10. Previously we have defined nth
as E1 = E11 � E1
2 ::: � E1n . But this is not necessary, since a CPN allows to count
the number of tokens in a place. This is done by inscribing an arc with a number
(n).
� The Figure 5.11 shows the CPN implementation of E1 fs E2. The upper portion
of the figure corresponds to last(E1) before the first E2 appears. Since the last E1

CHAPTER 5. OPERATIONAL SEMANTICS OF CEDAR USING COLORED
PETRI NETS 92
E1 p1
p2
X
YY
A
t1
t3
t4
Y
YY
I e
Figure 5.8: CPN for first(E1) in end [I]
token is removed from p1 when t3 fires, all E2s appearing after the firing and until
the occurrence of next E1, will be removed through the firing of t2.
� The CPN for the expression E1 � E2 in the default context (unrestricted context in
[CKAK94]) is shown in Figure 5.12.
In the default context the entire previous history of events have to be maintained in
the appropriate places of the net. When an instance of E2 occurs at which the com-
posite event happens, E2 has to be paired with the history of instances of E1 and
E1 with the previous history of E2. The appropriate places (places corresponding
to the p2 place of the CPN of the fby operator shown in Figure 5.2) of the two fby
boxes in Figure 5.12 keeps the history of E1 (the upeer box) and E2 (the middle
box).

CHAPTER 5. OPERATIONAL SEMANTICS OF CEDAR USING COLORED
PETRI NETS 93
p4
p3
A
t2
t6
t7
I e
E 1 XX
YY
X X
Figure 5.9: CPN for last(E1) in end [I]
E1 En
Figure 5.10: CPN for nth (E1)
� Relative time: The CPN for [E1, 10 minute] (E1 + 10 minute) is shown in Fig-
ure 5.13. The place p2 receives minute events from a clock (gets a token every
minute). On the occurrence of E1, all the tokens from p1 is flushed. The arc from
p2 to t3 is marked with 10, that is, ten (minute) tokens are counted before t3 fires.
The next [E1, 10 minute] interval is computed only when the previous interval is
over. The auxiliary Place A is used for this purpose.
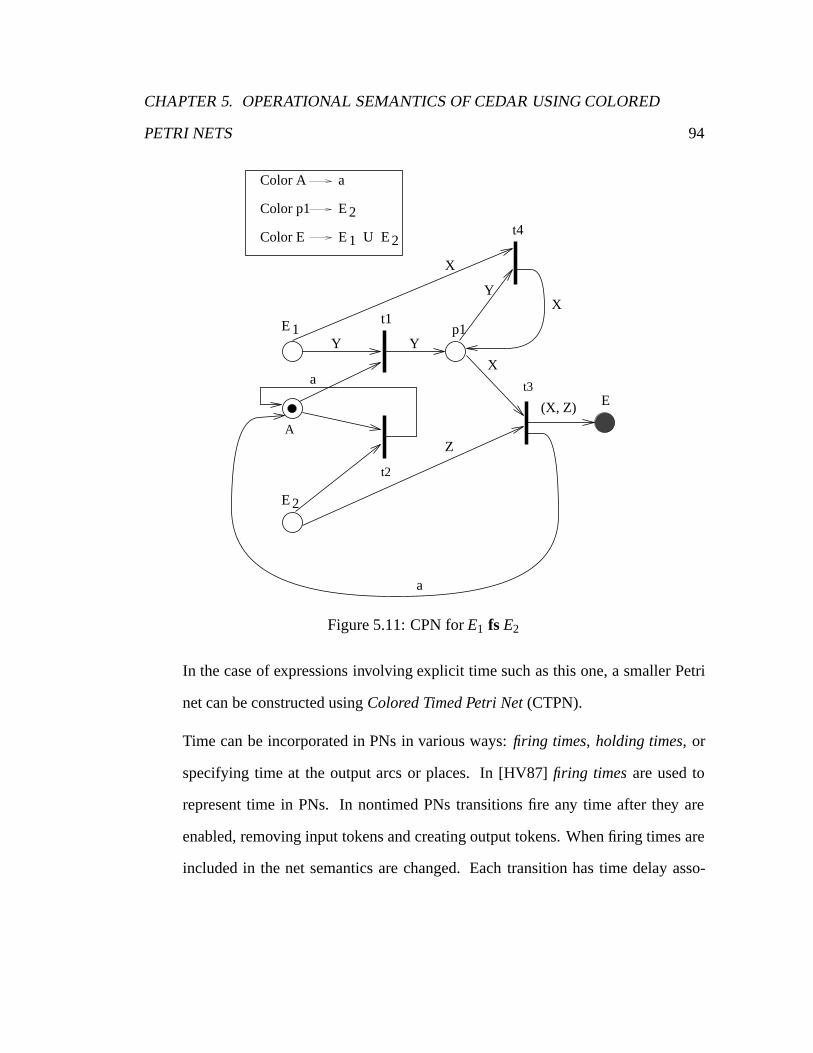
CHAPTER 5. OPERATIONAL SEMANTICS OF CEDAR USING COLORED
PETRI NETS 94
t2
t3
A
p1
t4
E
E
Color A a
E
1
2
a
Color E E 1 U E 2
Y
t1
Y
YX
X
(X, Z)
Z
X
a
Color p1 E 2
Figure 5.11: CPN for E1 fs E2
In the case of expressions involving explicit time such as this one, a smaller Petri
net can be constructed using Colored Timed Petri Net (CTPN).
Time can be incorporated in PNs in various ways: firing times, holding times, or
specifying time at the output arcs or places. In [HV87] firing times are used to
represent time in PNs. In nontimed PNs transitions fire any time after they are
enabled, removing input tokens and creating output tokens. When firing times are
included in the net semantics are changed. Each transition has time delay asso-

CHAPTER 5. OPERATIONAL SEMANTICS OF CEDAR USING COLORED
PETRI NETS 95
E1
E2
E1
E2
E1
E2
E1
E2
E1 fby E2
E2 fby E1
E1 conc E2
Figure 5.12: The default CPN for E1 � E2
ciated with it. When transition becomes enabled it removes the input tokens but
does not create the output tokens until the delay time has elapsed. Holding times
[vdA93] are similar to firing times. Holding times work by calssifying tokens into
two types, available and unavailable. Available tokens can be used to enable a tran-
sition where unavailable ones cannot. Each transition is assigned a duration, and
when a transition fires the action of removing and creating tokens is done instan-
taneously. However, the created tokens are not available to enable new transitions
until they have been in their output place for the time specified by the transition
which created them.
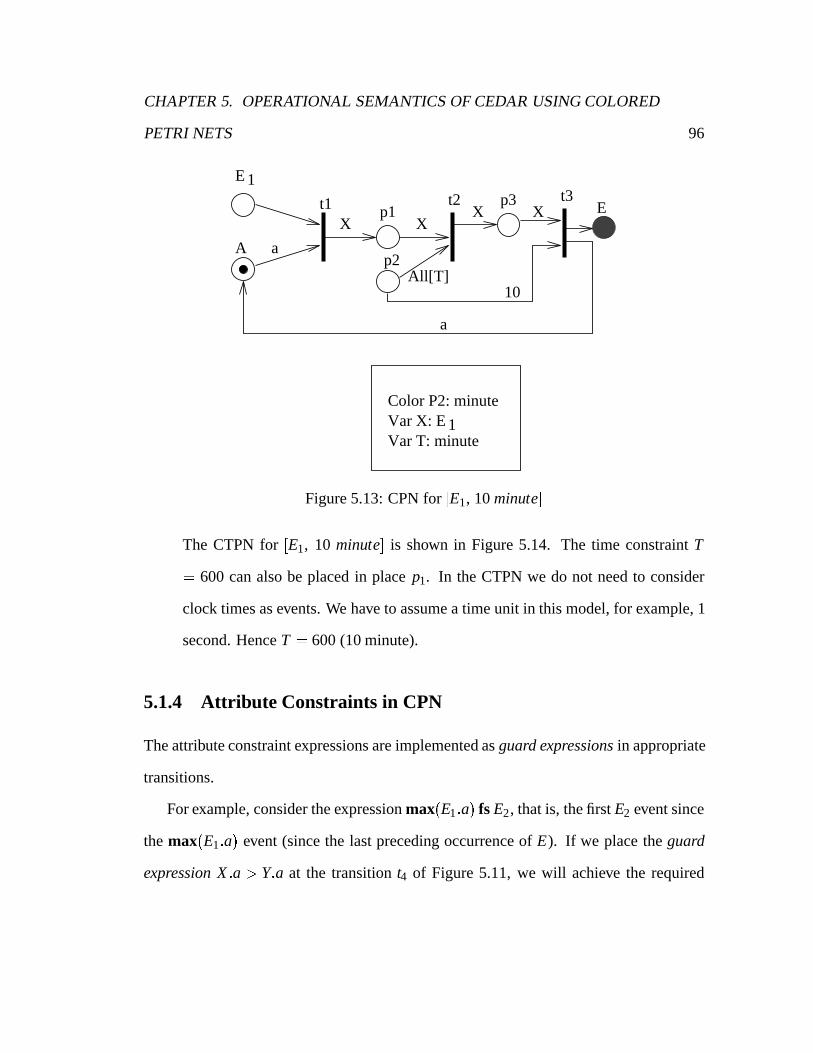
CHAPTER 5. OPERATIONAL SEMANTICS OF CEDAR USING COLORED
PETRI NETS 96
E 1t2
10
EX X
X Xp1
p2
p3t1 t3
Var X: E 1
a
a
A
All[T]
Var T: minute
Color P2: minute
Figure 5.13: CPN for [E1, 10 minute]
The CTPN for [E1, 10 minute] is shown in Figure 5.14. The time constraint T
= 600 can also be placed in place p1. In the CTPN we do not need to consider
clock times as events. We have to assume a time unit in this model, for example, 1
second. Hence T = 600 (10 minute).
5.1.4 Attribute Constraints in CPN
The attribute constraint expressions are implemented as guard expressions in appropriate
transitions.
For example, consider the expression max(E1:a) fs E2, that is, the first E2 event since
the max(E1:a) event (since the last preceding occurrence of E). If we place the guard
expression X :a > Y:a at the transition t4 of Figure 5.11, we will achieve the required

CHAPTER 5. OPERATIONAL SEMANTICS OF CEDAR USING COLORED
PETRI NETS 97
XE1 E
T = 600
X Xp1
Figure 5.14: CTPN for [E1, 10 minute]
result. The transition t5 is required to add to remove the new E1 token and mark p1 with
the old one, if the above condition is not satisfied, that is, X :a� Y:a. The resulting CPN
is shown in Figure 5.15.
The CPNs for count and avg are shown in Figure 5.16. The first occurrence of E1
causes the integer token 1 to be placed in p1. With the occurrence of subsequent E1, t3
fires and variable T is incremented by 1 and the result placed in p1. With the firing of t4,
the sum of X :a is placed in p3. At the end of the specified interval t5 fires and the average
is computed (as inscribed on the output arc).
The evaluations of the aggregation operators are incremental. For Example, any time
new E1 appears, the previous E1s need not be considered. The CPNs are incremental in
nature. To evaluate an expression we do not necessarily have to look at the history from
the beginning.

CHAPTER 5. OPERATIONAL SEMANTICS OF CEDAR USING COLORED
PETRI NETS 98
t3
A
CE
p2
t1
a
Y
a
a
t2
Color p2 E 1aColor A aColor p3
Color CE E U E1 2
X
XY
Y
X
Y
t5
t4
X.a <= Y.a
X.a > Y.a
a
X
Y
Y
E1
E2
Z
(X, Z)
Figure 5.15: CPN for max(E1:a) fs E2
5.1.5 Parameter Context in CPN
� Recent: The corresponding CPN is shown in Figure 5.9.
� Chronicle: In this context the first operand is considered in FIFO order. The CPN
in this context can be implemented by removing the output arc from t3 to p2 of the
CPN of fby shown on Figure 5.2. The place p3 and transition t4 in Figure 5.2 can
also be removed. For the operators � operator the resulting CPN can be substan-
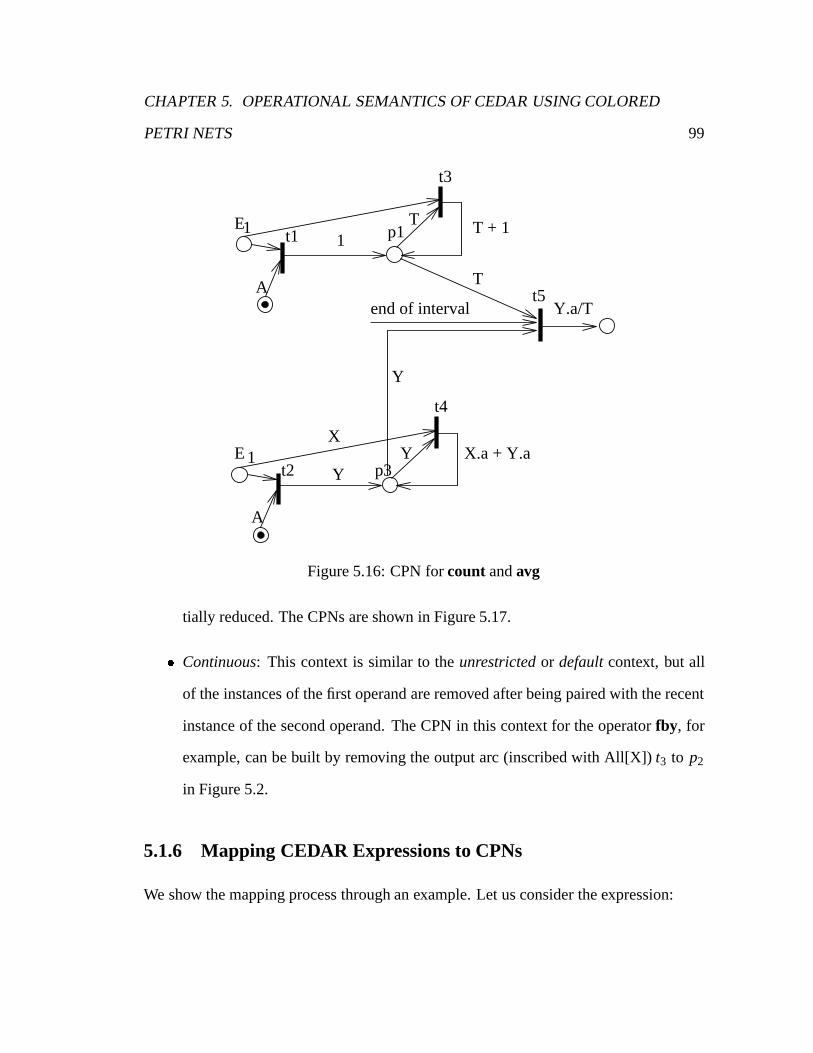
CHAPTER 5. OPERATIONAL SEMANTICS OF CEDAR USING COLORED
PETRI NETS 99
E1 p1
A
t1
t3
1T T + 1
Ep3
A
t21
X
YY X.a + Y.a
end of interval
T
Y
Y.a/T
t4
t5
Figure 5.16: CPN for count and avg
tially reduced. The CPNs are shown in Figure 5.17.
� Continuous: This context is similar to the unrestricted or default context, but all
of the instances of the first operand are removed after being paired with the recent
instance of the second operand. The CPN in this context for the operator fby, for
example, can be built by removing the output arc (inscribed with All[X]) t3 to p2
in Figure 5.2.
5.1.6 Mapping CEDAR Expressions to CPNs
We show the mapping process through an example. Let us consider the expression:

CHAPTER 5. OPERATIONAL SEMANTICS OF CEDAR USING COLORED
PETRI NETS 100
E = ((E1 � E2) fby (E3 E4)) in [E5;E6].
The corresponding parse tree is shown in Figure 5.18.
Each of the non-leaf node corresponds to a Petri net modelling the inscribed operator.
The input arcs correspond to the input places of the Petri nets. The output arc of a node
corresponds to the output place of a CPN which in turn may be the input place of a CPN.
The leaf nodes correspond to the primitive events.
5.1.7 Implementation
The operational semantics of a trimmed down version of CEDAR has been implemented.
As mentioned before an event expression defining a composite event is mapped to a cor-
responding CPN. The CPN and the implementation of its operational behavior (place-
transition token firing) function as the composite event detector. The composite event
detector program reads in the ASCII representation of a CPN (as generated by the com-
piler) and builds the in-memory CPN. The detector then goes in an infinite loop waiting
for events. As an event is received, the transition firing process starts. If the final output
place of the CPN contains a token, the composite event is detected. More description of
the implementation and a number of sessions running the system is shown in Appendix B.

CHAPTER 5. OPERATIONAL SEMANTICS OF CEDAR USING COLORED
PETRI NETS 101
E1
E 2
t3
A
Y
p2
t1
a
Y
a
a
t2
X
(X, Y)
X
E 1 fby E 2
E1
E 2
E
E
E 1 E 2
Figure 5.17: CPN for� and fby operators in Chronicle context

CHAPTER 5. OPERATIONAL SEMANTICS OF CEDAR USING COLORED
PETRI NETS 102
E
E1 E2 E3 E4
E5 E6
i1 i2 i3 i4
o1/i5 o2/i6
o3/i7 i8 i9
o4
fby
in
Figure 5.18: Parse tree for E = ((E1 � E2) fby (E3 E4)) in [E5;E6]

Chapter 6
A Network Management Database
System
In this chapter we will propose an architecture for an NM database system (NMDBS).
The proposed system combines and extends the features of active temporal and database
visualization systems. As a front-end visualization system we will propose an enhanced
version of the Hy+system. We will use an active relational database system such as DB2,
as a backend system. The purpose of the architecture is to show required features of an
NMDB system as it pertains to data, events, and information presentation management
issues. Any other active relational or active object-oriented system could equally be
used. Before we propose the architecture we will first briefly describe the active features
of DB2 and the Hy+database visualization system.
103
CHAPTER 6. A NETWORK MANAGEMENT DATABASE SYSTEM 104
6.1 The DB2 Active Database System
The DB2 relational database system supports basic active database functionalities. Fol-
lowing are some of the active features supported by DB2:
� The only events supported in this system are the events associated with database
manipulation operations: insert, update and delete.
� Every event, and consequently every trigger in an ECA rule can be associated with
exactly one subject table and exactly one triggering operation or an action.
� The trigger activation time AFTER or BEFORE can be specified with an event. For
example, BEFORE INSERT means, that the triggered action is performed before
the insert operation.
� A triggering SQL operation may affect multiple rows in a table. In that case, a
trigger may be activated as many times as there are tuples in the set of affected
rows, or it may be activated once for the trigerring operation. In the first case
the construct “FOR EACH ROW” is used and in the second case, “FOR EACH
STATEMENT” is used.
� It is also possible to refer to old or new affected tuples or table of all affected tuples,
which are/is a result of a trigerring operation. The construct “REFERENCING
NEW AS <transition variable>” specifies a correlation name which captures the
value that is, or was, used to update the row in the database when the trigerring
SQL operation is applied to the database. Similarly, if “OLD” is used instead of
CHAPTER 6. A NETWORK MANAGEMENT DATABASE SYSTEM 105
“NEW”, then it specifies a correlation name which captures the original state of
the row, that is, before the triggering SQL operation is applied to the database.
� The construct “REFERENCING NEW TABLE/OLD TABLE AS<table-name>”
refers to affected table of rows. The latter construct can be used to apply aggregate
functions to affected rows.
� A condition is specified in a “WHEN” clause.
� An action can be both an SQL operation on the database and a function (specified
in the “VALUES” clause).
Following are two examples of DB2 trigger specifications.
The following trigger specification defines a trigger called REORDER, which is fired
(the actions after the BEGIN ATOMIC executed) for each updated (NEW) tuple (ROW)
when the columns ON HAND and MAX STOCKED of the PARTS relation are updated
and the condition (the value of the ON HAND column is less than ten per cent of the
value of the MAX STOCKED column) satisfies. The action launches a procedural func-
tion ISSUE SHIP REQUEST by passing the appropriate column values of the newly up-
dated tuples. The action part also contains an SQL statement which updates the PARTS
table.

CHAPTER 6. A NETWORK MANAGEMENT DATABASE SYSTEM 106
CREATE TRIGGER REORDER
AFTER UPDATE OF ON HAND, MAX STOCKED ON PARTS
REFERENCING NEW AS N ROW
FOR EACH ROW MODE DB2SQL
WHEN (N ROW.ON HAND < 0.10 * N ROW.MAX STOCKED
AND NROW.ORDER PENDING = ”N”)
BEGIN ATOMIC
VALUES(ISSUE SHIP REQUEST(N ROW.MAX STOCKED -
N ROW.ON HAND,
N ROW.PARTNO));
UPDATE PARTS SET PARTS.ORDER PENDING = ”Y”
WHERE PARTS.PARTNO = N ROW.PARTNO;
END
Following is another DB2 trigger specification. It is almost the same as above. But
here an aggregate operation (AVG) is applied to the newly updated tuples (stored in the
transition table N TABLE).

CHAPTER 6. A NETWORK MANAGEMENT DATABASE SYSTEM 107
CREATE TRIGGER REORDER
AFTER UPDATE OF ON HAND, MAX STOCKED ON PARTS
REFERENCING NEW TABLE AS N TABLE
NEW AS N ROW
FOR EACH ROW MODE DB2SQL
WHEN ((SELECT AVG (ON HAND) FROM N TABLE) > 35)
BEGIN ATOMIC
VALUES(INFORM SUPERVISOR(N ROW.PARTNO,
N ROW.MAX STOCKED,
N ROW.ON HAND));
END
6.2 Mapping CEDAR Expressions to DB2 Triggers
The DB2 system supports only database manipulation operations as basic events. But
it is possible to simulate CEDAR expressions (in other words, detect composite events)
using the trigger facilities provided by the DB2 system.
Assume that the following ECA has been specified by a user:
E: CE
C: user condition
A: user action
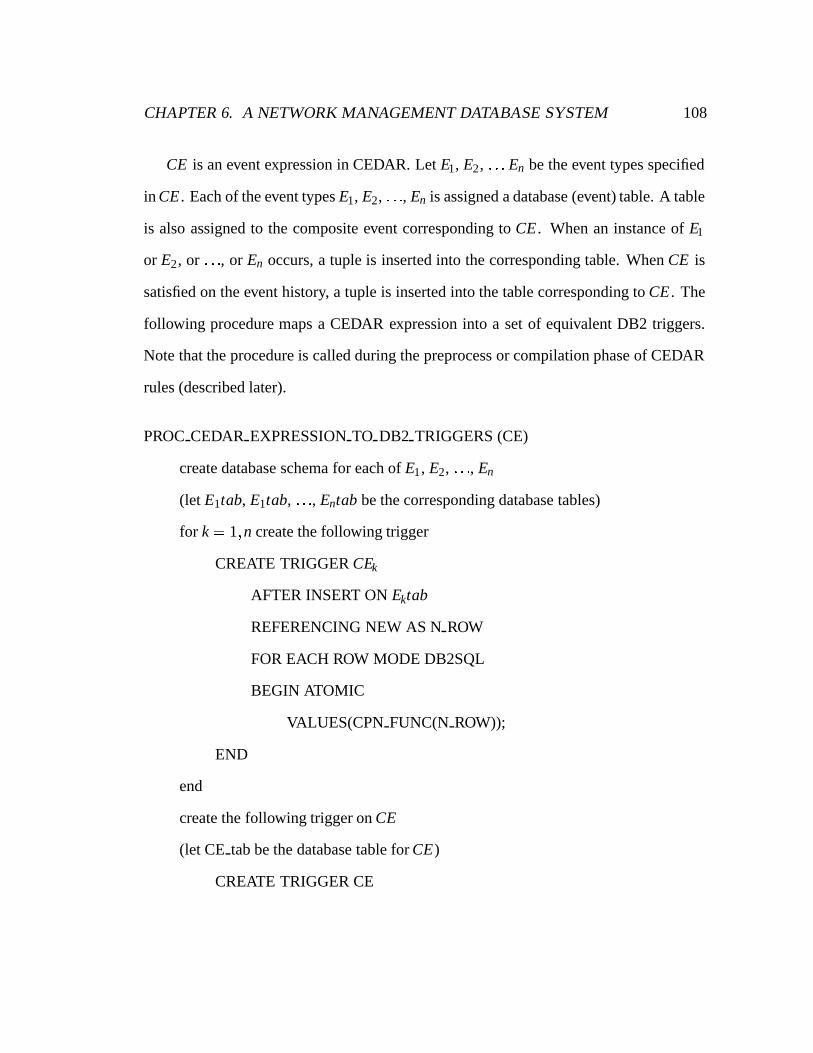
CHAPTER 6. A NETWORK MANAGEMENT DATABASE SYSTEM 108
CE is an event expression in CEDAR. Let E1, E2, : : : En be the event types specified
in CE . Each of the event types E1, E2, : : :, En is assigned a database (event) table. A table
is also assigned to the composite event corresponding to CE . When an instance of E1
or E2, or : : :, or En occurs, a tuple is inserted into the corresponding table. When CE is
satisfied on the event history, a tuple is inserted into the table corresponding to CE . The
following procedure maps a CEDAR expression into a set of equivalent DB2 triggers.
Note that the procedure is called during the preprocess or compilation phase of CEDAR
rules (described later).
PROC CEDAR EXPRESSION TO DB2 TRIGGERS (CE)
create database schema for each of E1, E2, : : :, En
(let E1tab, E1tab, : : :, Entab be the corresponding database tables)
for k = 1;n create the following trigger
CREATE TRIGGER CEk
AFTER INSERT ON Ektab
REFERENCING NEW AS N ROW
FOR EACH ROW MODE DB2SQL
BEGIN ATOMIC
VALUES(CPN FUNC(N ROW));
END
end
create the following trigger on CE
(let CE tab be the database table for CE)
CREATE TRIGGER CE

CHAPTER 6. A NETWORK MANAGEMENT DATABASE SYSTEM 109
AFTER INSERT ON CE tab
FOR EACH STATEMENT MODE DB2SQL
WHEN(user condition)
BEGIN ATOMIC
VALUES(user action);
END
end proc
An schematic view of the mapping process is shown in Figure 6.1. Each of the
CPNs defined in the system as the result of a rule definition has to run continuously (as
a separate process) and keep the state of the CPN from one invocation of a DB2 trigger
to the next. The purpose of the CPN FUNC function in the body of the DB2 triggers
is to pass the event tuples to the corresponding continuously running instances of CPNs
implementing CEDAR expressions.
6.3 The Hy+ System
The Hy+ system [CEH+94] provides extensive support for query visualization, visual-
izing the input instance, and visualizing the output instance in several different modes.
The visualizations manipulated by the system are labeled graphs and hygraphs.
Many databases can be naturally viewed as graphs. A relational database can be
represented by a directed multigraph having an edge labeled r(c1; : : :;ck) from a node la-
beled (a1; : : :;ai) to a node labeled (b1; : : :;b j) corresponding to each tuple (a1; : : :;ai;b1; : : :;b j;
c1; : : :;ck) of each relation r in the database. Consider, for example, the following tuples:

CHAPTER 6. A NETWORK MANAGEMENT DATABASE SYSTEM 110
E1_table
E1/E2
insert(E1)
E1
E2E2_table
insert(CE)
User_action
User_condition
fires
insert(E2)
Continuously running
CE_table
CPN_FUNC Function CPN for CE
Figure 6.1: Mapping CEDAR expressions to DB2 Triggers
connects(gateway(’geol.gw’), ethernet(ether8), ip, csmacd) and connects(gateway(’geol.gw’),
tokenring(tokenring1), ip, tokenring). The first tuple stores the following information:
gateway geol.gw is connected (connects) to the ethernet segment ether8 and protocols IP
over CSMA/CD is run over the link. Figure 6.2 shows the graph representation of these
tuples.
Hygraphs, defined in [Con92], are a hybrid between Harel’s higraphs [Har88] and
directed hypergraphs. A hygraph extends the notion of a graph by incorporating blobs in
addition to edges. A blob relates a containing node with a set of contained nodes, and is
diagrammatically represented as a region associated with the container node that encloses
the contained nodes. Figure 6.3 shows a blob where the subnet (blob node) contains other
network nodes. This containment relationship (blob relation or edge) subnet contains is

CHAPTER 6. A NETWORK MANAGEMENT DATABASE SYSTEM 111
Figure 6.2: Visualizing tuples.
Figure 6.3: Visualizing a Hygraph.
depicted as a box. The outer box may contain more than one blob relation box or other
blob nodes deeply nested. Extending the representation to hygraphs allows varying levels
of abstraction in the display of hierarchical data (e.g., by interactively hiding and showing
blob contents) and provides a flexible mechanism for clustering information.
The Hy+ system has browsers with extensive facilities for editing hygraphs (e.g.,
copy, cut and paste; panning and zooming; executing several layout algorithms; mov-
ing hygraphs to and from files; editing of node and edge labels; etc.). These hygraph
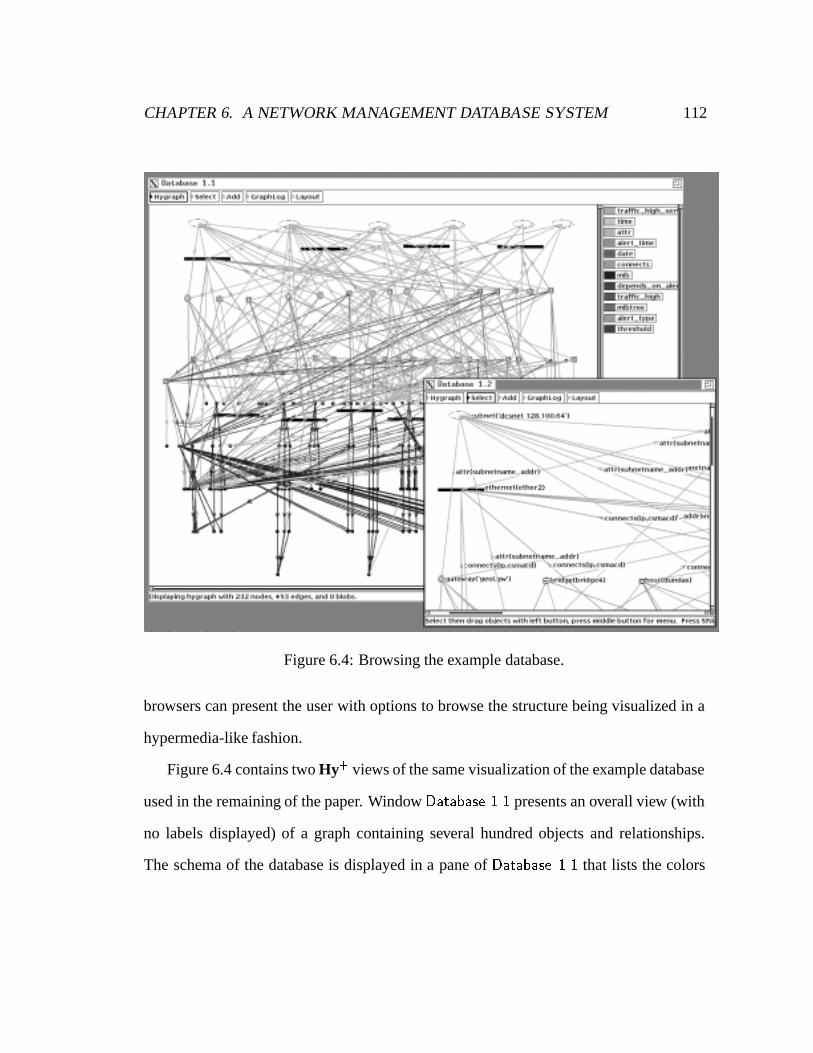
CHAPTER 6. A NETWORK MANAGEMENT DATABASE SYSTEM 112
Figure 6.4: Browsing the example database.
browsers can present the user with options to browse the structure being visualized in a
hypermedia-like fashion.
Figure 6.4 contains two Hy+ views of the same visualization of the example database
used in the remaining of the paper. Window Database 1.1 presents an overall view (with
no labels displayed) of a graph containing several hundred objects and relationships.
The schema of the database is displayed in a pane of Database 1.1 that lists the colors

CHAPTER 6. A NETWORK MANAGEMENT DATABASE SYSTEM 113
assigned to the edges corresponding to each of the relations in the adjacent visualization.
Color-coding relations constitute a very primitive, but visually appealing, example of
tailoring a visualization to the semantics of the application. Another instance of the
customization of the visualizations supported by the system is the selection of different
icons for nodes based on the properties of the database objects represented by the nodes.
Window Database 1.2 contains a zoomed-in view of the top-left portion of the graph
(with labels displayed). The information contained in the example database has been
partly acquired using the programs described in [Has92].
The visual queries supported by the Hy+ system are expressions in the GraphLog
query language [CM90a]. GraphLog queries are graph patterns with nodes labeled by
sequences of variables and constants, and whose edges are labeled by path regular ex-
pressions on relations. The query evaluation process consists of finding in the database
all instances of the given pattern and for each such instance performing some action, such
as defining new edges, blobs or nodes in the database graph (Define mode), or extracting
from the database the instances of the pattern (Show mode). GraphLog has higher ex-
pressive power than SQL; in particular, it can express, with no need for recursion, queries
that involve computing transitive closures or similar graph traversal operations. The lan-
guage is also capable of expressing first order aggregate queries as well as aggregation
along path traversals (e.g., shortest path queries)[CM90b]. Precise theoretical character-
izations of the expressive power of GraphLog and of its computational complexity can
be found in the references cited above.
We will now give simple examples of GraphLog queries and show how the visual
pattern that a user wants to see can be specified in GraphLog. If the required visualiza-

CHAPTER 6. A NETWORK MANAGEMENT DATABASE SYSTEM 114
Figure 6.5: Example GraphLog queries and result.
tion is not in the database, it is defined using the define mode of the query and added to
the database. This visualization can then be filtered out of the database using the show
mode of the query. Consider the visualization of the database shown in Figure 6.4. This
database contains enough information to create different visualizations required for a
network management station. For example, we can create visualizations of the topology
of the network at different levels of abstraction. To simplify the example we will work

CHAPTER 6. A NETWORK MANAGEMENT DATABASE SYSTEM 115
on a small portion of the example database shown in Figure 6.4, so that the structure of
the database is comprehensible. The portion of the database is shown in Window 1 of
Figure 6.5. We want to create from this database, for example, the visualization shown in
Figure 6.3. Query def in Window 2 of Figure 6.5 is executed in define mode (note the de-
�neGraphLog box). This query states that any node N1 that has a attr(subnetname addr)
edge to the node subnet('geolnet 128.100.78') should be clustered together and blob edge
called subnet contains be created. The crossed out edge labeled ^attr(type) (represent-
ing negation) excludes the gateways from being part of the resulting subnet. Note that
the blob subnet contains has been drawn thick. Any blob or edge that is drawn thick
in the define mode is created and added to the database. The resulting subnet blob can
be filtered out and visualized through the query show executed in show mode (note the
showGraphLog box). The thick edges are the ones we want to see.
The Hy+ visual query system is implemented as a front-end that can communicate
with multiple back-ends for the actual evaluation of the queries. The front-end, written
in Smalltalk, includes the user interface of the system. We have experimented with sev-
eral different back-end query processors: Prolog [Fuk91], the LDL deductive database
system from MCC [NS89], CORAL [RSS92], the deductive database system from Wis-
consin, and the DB2 database system [Eig94].
The system has the ability to invoke external programs that, for instance, browse an
object being represented by a node in one of the graphs displayed by the system. This fea-
ture, which is part of the overall Hy+ goal of providing an open architecture, can be used
to support network management stations that require the co-existence of several browsers
provided by different tools. The user can navigate, in hypermedia style, through the in-

CHAPTER 6. A NETWORK MANAGEMENT DATABASE SYSTEM 116
formation contained in management information bases. The Hy+ visualizations are used
as overviews to locate information and then invoke third-party browsers to display the
contents associated with the relevant objects. An important advantage of this approach
over a purely navigational one is the ability to use the convenience and expressive power
of GraphLog patterns to retrieve the objects of interest, instead of attempting an often
impractical brute force search.
6.4 Network Management Database
As discussed earlier a NMDBS, as opposed to a traditional database system, deals with
both static and dynamically changing data. Unlike traditional systems the requested data
may not be available in a (local) data store. Rather, the data may have to be fetched over
a network when the request is made, or may be fetched continuously at regular intervals,
or may be reported asynchronously to an NM station. An NMDBS should “understand”
what is available locally and what has to be fetched over the network. The type of data
(static, dynamic) and distributed nature of data should be transparent to an end user
or a programmer. The user considers an NMDB as a conceptual global database. For
example, a single data request may refer to (static) topology data and (dynamic) MIB
data served by the agents. The system should be capable of partitioning the request into
two requests, one accessing the local data, the other the dynamic MIB data over the
network (Figure 6.6).

CHAPTER 6. A NETWORK MANAGEMENT DATABASE SYSTEM 117
Static Data History of (observed)Dynamic Data
Distributed (MIB) Data
Network Management Database
(Served by Agents and/orother Managers )
Network
Request for Data
Manager
Figure 6.6: Request for NM data
6.4.1 CEDAR Rules
The CEDAR rules are defined as follows:
<Rule alias>:
E: <CEDAR event expression>
[C: Condition on DB - SQL or other DB statements supported
by the underlying system]
A: <Procedural action> [,/OR <Procedural action>]*
[, Execute <GraphLog/DML statements>]*

CHAPTER 6. A NETWORK MANAGEMENT DATABASE SYSTEM 118
[, GENERATE <event-name> [AS <data-pattern event statement/
reference to GraphLog statement>]
[,/OR GENERATE <event-name> [AS <data-pattern event statement/
reference to GraphLog statement>]*
The star (*) in the syntax indicates zero or more times. The square brackets stand for
optional and comma (,) signifies and. The purpose of the GENERATE construct is to
define and subsequently generate an event when the retrieval succeeds.
6.4.2 Defining Events in the NMDB
We assume that all the event types supported in a traditional ADB (as discussed in Sec-
tion 3.2) are supported in the proposed system. There should be facilities for defining
external events. External events are events defined by a user and registered with the
system. An external event may be defined through a data manipulation statement (a
data-pattern event as defined in [WSY91]) or through a data definition statement. In the
latter case, a data definition statement similar to an event table definition in a temporal
database can be used [Sea93] (as discussed in Chapter 3). The usage of a data manip-
ulation statement to define a data-pattern event provides more flexibility in defining an
event. Other external events, such as those generated by various data and telecom equip-
ment are fixed in structure, and should be registered with the system by defining them
through data definition statements. Following are a few examples of the definitions of
such external events generated by a telecom switch [Nyg95]:
PATH LOSS( VIRTUAL PATH, OFFICE 1, OFFICE 2, SYSTEM, TIME, DATE).
LINK FAIL( LINK ID, OFFICE 1, OFFICE 2, SYSTEM, TIME, DATE).
CHAPTER 6. A NETWORK MANAGEMENT DATABASE SYSTEM 119
HIGH TRAFFIC DMND( OFFICE 1, SYSTEM, TIME, DATE).
A data-pattern event is defined as a declarative data retrieval statement such as an
SQL statement. A data-pattern event may be defined in the action part of a CEDAR
ECA rule. Each ECA rule in the proposed system is translated into an appropriate form
supported by the underlying system. If we assume that the underlying system is an active
database system (such as, DB2), then a data-pattern statement specified in a CEDAR
ECA specification can be translated as shown in Figure 6.7.
The translation procedure needs to distinguish between static and dynamic tables.
A retrieval from a dynamic table with a reference to current value is translated into a
procedure to fetch data from the network, and update the respective table. Since the
underlying database is assumed to be an active database (such as, DB2), an ECA is
generated as shown in Figure 6.7. We assume that each event type has an associated
table in the database. Hence generation of an event is equivalent to insertion in the
respective event table.
Let us assume that we have the following tables (the first one is a static table, and the
second a dynamic table):
HOST(NAME, TYPE).
MIB TCP(HOST NAME, TCPINSEGS)
Following is an example of a data-pattern event. The corresponding translation and
evaluation step is shown in Figure 6.8.

CHAPTER 6. A NETWORK MANAGEMENT DATABASE SYSTEM 120
Q1:
GENERATE S U (NAME, TCPINSEGS) AS
SELECT NAME, TCPINSEGS
FROM HOST, MIB TCP
WHERE TYPE = ‘server’
AND HOST.NAME = MIB TCP.HOST NAME
AND TCPINSEGS � falling threshold
6.4.3 Polling or sampling
Management actions are performed by monitoring the network database. Polling or sam-
pling is one form of monitoring. Monitoring for a data pattern event, collection of traces
and launching of other actions can be specified as follows:
E: Poll at regular intervals
C: TRUE
A: Evaluate DML/GraphLog queries or other actions
We specify polling in the E part as a composite event, because it is a time event
occurring at regular intervals. By specifying it as a composite event using CEDAR the
polling actions can be controlled in an easy way, for example, activating or deactivating
polling actions on demand.
Special poll control events: Two event types that control polling action are defined:
� poll(X), where X is the Rule alias of a CEDAR ECA rule. This event may be
CHAPTER 6. A NETWORK MANAGEMENT DATABASE SYSTEM 121
used to start a polling action. As a result the action(s) specified in the A part of a
CEDAR ECA rule will be executed at regular intervals.
� deactivate (X), where X is the Rule alias of an ECA rule. This event may be used
to deactivate a perpetually running instance of an event expression.
Note that both poll and deactivate are events, not procedures. Instances of these event
types can be generated (raised) through the special construct Generate(eca id).
The following is a CEDAR expression that specifies a poll action which signals CE4
every 2 minute starting at a time when the poll(rule1) event is raised and ending when
the deactivate(rule1) is raised:
Example 4.1. CE4 = (2 minute) in [poll(rule1) fs deactivate(rule1)]
6.4.4 NM by Delegation
A mechanism for NM by delegation is proposed in [GY91], where NM functions are
delegated to remote agents or other managers. The declarative nature of CEDAR ex-
pressions makes it easier to delegate NM functions to remote nodes (Figure 6.9). The
CEDAR expressions or the equivalent CPN or the CEDAR ECA rules may be delegated
to a remote node. If the composite event corresponding to the expression happens, it will
be reported to the manager (that delegated).
We will explain the possible delegation mechanism using the following CEDAR
rules.
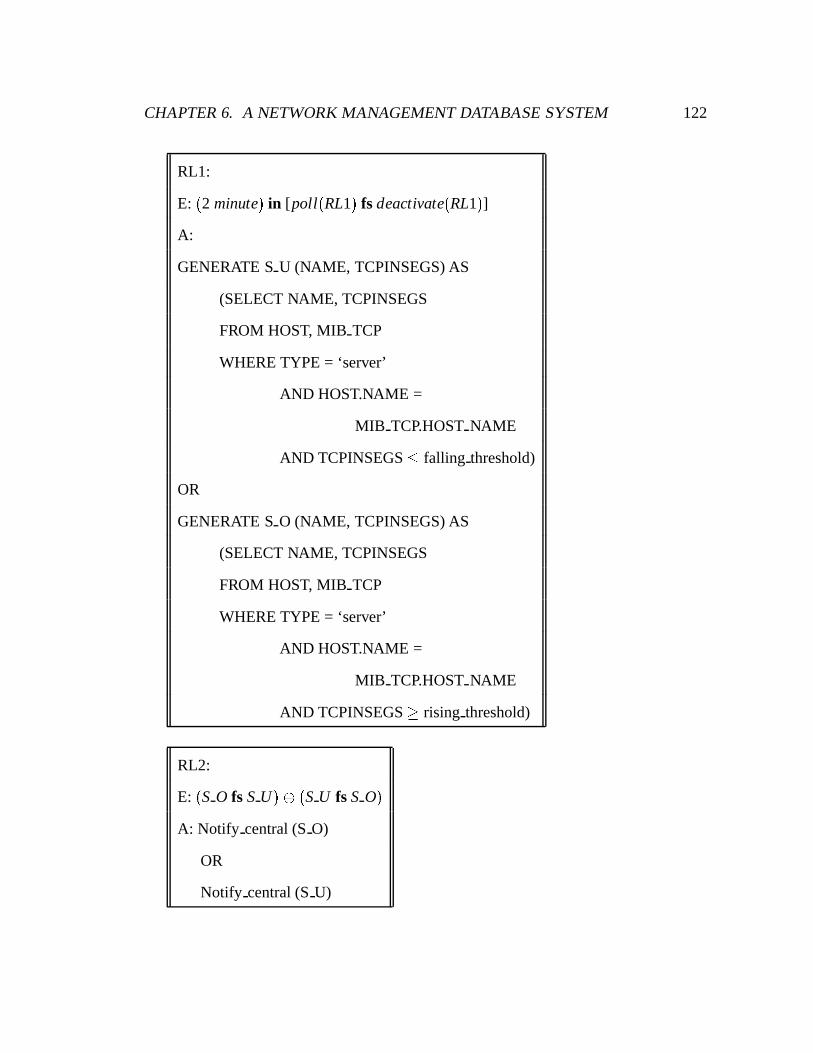
CHAPTER 6. A NETWORK MANAGEMENT DATABASE SYSTEM 122
RL1:
E: (2 minute) in [poll(RL1) fs deactivate(RL1)]
A:
GENERATE S U (NAME, TCPINSEGS) AS
(SELECT NAME, TCPINSEGS
FROM HOST, MIB TCP
WHERE TYPE = ‘server’
AND HOST.NAME =
MIB TCP.HOST NAME
AND TCPINSEGS � falling threshold)
OR
GENERATE S O (NAME, TCPINSEGS) AS
(SELECT NAME, TCPINSEGS
FROM HOST, MIB TCP
WHERE TYPE = ‘server’
AND HOST.NAME =
MIB TCP.HOST NAME
AND TCPINSEGS � rising threshold)
RL2:
E: (S O fs S U) (S U fs S O)
A: Notify central (S O)
OR
Notify central (S U)

CHAPTER 6. A NETWORK MANAGEMENT DATABASE SYSTEM 123
The rule RL1 generates S U (server underutilized) events when the values of TCPIN-
SEGS MIB object of the servers in the system falls below a falling threshold and S O
(server overload) events when the values go up a rising threshold. The rule RL2 defines a
composite event (the so called Hysteresis mechanism explained later) whose occurrence
triggers the procedure Notify central.
Rules RL1 and RL2 can be delegated to the servers. The polling and generation
of events then happen locally (in each server). When E in RL2 is satisfied, the central
manager which delegated the rule is notified with the S U or S O events (by firing the
Notify central procedure).
6.5 The architecture
A conceptual architecture of the proposed Hy+-CEDAR based NM system is shown in
Figure 6.10. The core of the system is a conceptual global active temporal database
system (relational or object-oriented). The database in Figure 6.10 is distributed. Each
agent maintains its own (virtual MIB related) store. An agent may also maintain a main
memory active database system. In the case of hierarchical management, the intermedi-
ate or domain managers may maintain their own active temporal database systems. The
CEDAR event expressions and consequently their CPNs (event detectors) and CEDAR
rules may be distributed (delegated) to arbitrary nodes in the network. An example dis-
tributed architecture of an NM system is shown in Figure 6.11
The network management functions are specified as CEDAR ECA rules which may
refer to database manipulation and GraphLog statements. That the relevant data are
distributed over the network is made transparent to the user by appropriate mapping of
CHAPTER 6. A NETWORK MANAGEMENT DATABASE SYSTEM 124
CEDAR ECA rules to the facilities/functions of the underlying system, such as generat-
ing appropriate code for fetching MIB data, delegating CEDAR expressions or CPNs, or
CEDAR rules, if necessary. The CEDAR ECA rules provide the necessary functional-
ities for data and event management. The GraphLog queries which can be launched as
actions of an ECA rule provide the necessary mechanism for information presentation on
an NM station. The GraphLog queries are evaluated over the same database, thus provid-
ing a unified framework for management of data, events, and information presentation.
The GraphLog queries further aid in events management (correlation) by providing a
mechanism for causality-based reasoning and providing the appropriate Hygraph-based
visualizations to aid a human operator in understanding the event correlation process.
(An example will be shown later in the Case Study chapter.)

CHAPTER 6. A NETWORK MANAGEMENT DATABASE SYSTEM 125
A: Generate event, that is, insert a tuple in the corresponding event table
Evaluate on Static tables
Data-pattern statement
result
procedure_to_fetch_data_from_net (result)table
GenerateIf reference to current value in Dynamic MIB
E: Insert into dynamic MIB tableC: Original condition in Data-pattern event
Generate ECA:
Figure 6.7: Translation of data-pattern statement

CHAPTER 6. A NETWORK MANAGEMENT DATABASE SYSTEM 126
Fetch_TCPINSEGS_from_net (servers)
AND HOST.NAME = MIB_TCP.HOST_NAMEAND TCPINSEGS <= falling_threshold
Action: Generate S_U -> insert into S_U table
MIB_TCP table
insert
fires
HOST table
TYPE = ’server’Condition:
serversResult set:
HOST.TYPE = ’server’Condition:
ECA
Figure 6.8: Example translation of data-pattern event statement
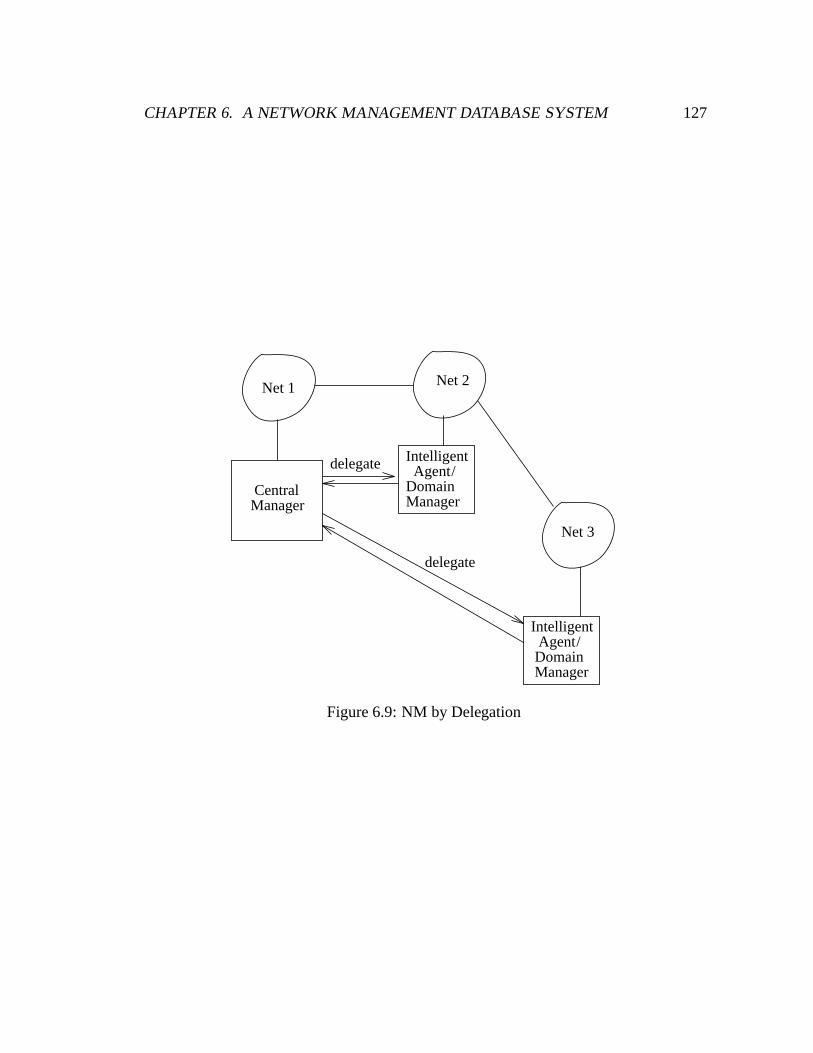
CHAPTER 6. A NETWORK MANAGEMENT DATABASE SYSTEM 127
Net 3
Net 2Net 1
IntelligentAgent
delegate
delegate
IntelligentAgent
CentralManager
/Domain
/DomainManager
Manager
Figure 6.9: NM by Delegation

CHAPTER 6. A NETWORK MANAGEMENT DATABASE SYSTEM 128
Event
C-A of Rule
Other Events
DB
over DB
Fire Rule
State
Other
DBActions
Condition Action
GraphLogQueries Hy+ Visualization
( such as Time events )
CPNs for Event Expressionsor
DB manipulation events
TemporalActive
Poll,Activate,
DeactivateEvents
User
Queries)GraphLog(Includes
TransactionsApplication
Distributed
or
DBManipulating
Figure 6.10: A conceptual architecture of an NM system

CHAPTER 6. A NETWORK MANAGEMENT DATABASE SYSTEM 129
Net 3
Net 2Net 1
IntelligentAgent/
DomainManagerActive DB(Main-memory/
Disk based)
IntelligentAgent/DomainManager
Active DB(Main-memory/
Disk based)
Network Eelement
MIB agent/storeMain-memoryActive DB
Poll
CentralManager
Active DB
Data/Event
delegate
Data/Event
Data/Event
delegate
Figure 6.11: An example distributed architecture of an NM system

Chapter 7
Case Study
We have proposed the Hy+CEDAR system, an active temporal database and database
visualization based framework for NM in Chapter 6. The Hy+CEDAR system attempts
to address the limitations (discussed in Chapter 2) of the existing NMDB systems and
existing CESLs (discussed in Chapter 3) used in active database systems. Active database
based CESLs have been found to be useful for NM event management purposes. But
since the existing CESLs lacks certain features that are otherwise required by an NM
system (discussed in Chapter 3 and 4), we have proposed a CESL called CEDAR. By
combining CEDAR with the Hy+ database visualization system and an active temporal
database system we achieve a powerful framework which can be used to build an NMS.
In this chapter first we will show how the information presentation or visualization
requirements of an NM system can be met by the Hy+ system. We will show how we
obtain different views of the network using querying capabilities provided by the Hy+
system. We will then show how the combined capabilities of CEDAR, CEDAR ECA
rules, active temporal databases, GraphLog and the Hy+ visualization system can be
130
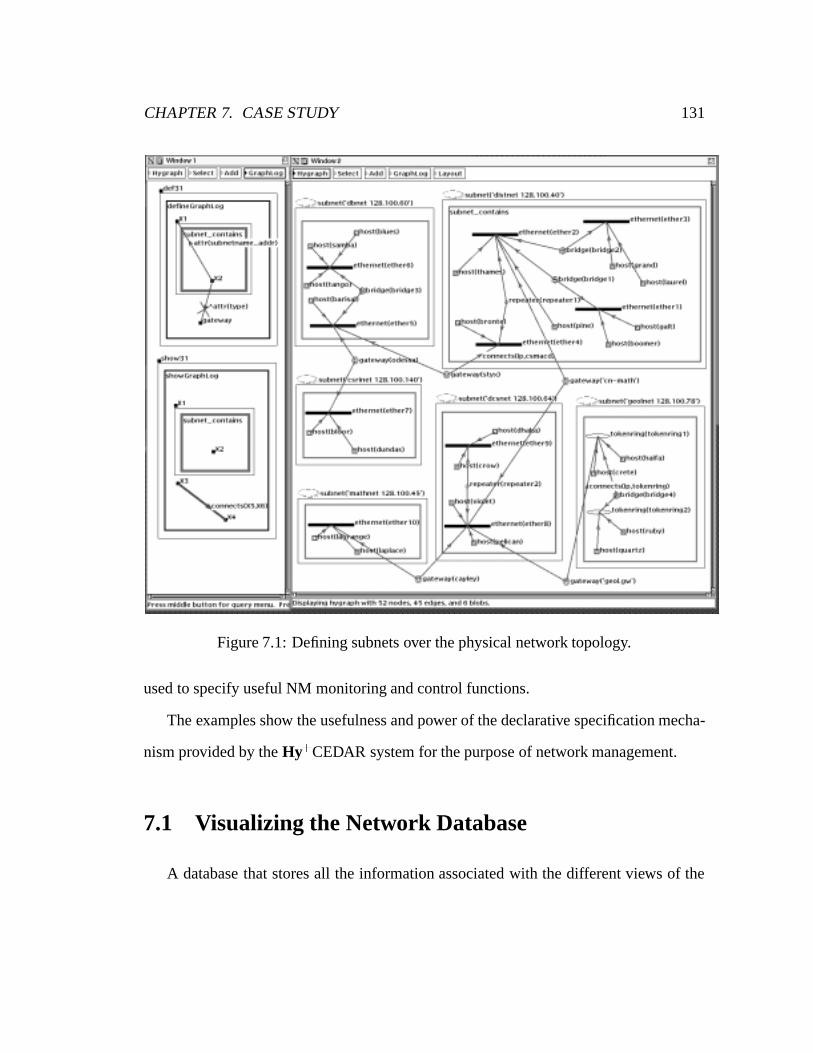
CHAPTER 7. CASE STUDY 131
Figure 7.1: Defining subnets over the physical network topology.
used to specify useful NM monitoring and control functions.
The examples show the usefulness and power of the declarative specification mecha-
nism provided by the Hy+CEDAR system for the purpose of network management.
7.1 Visualizing the Network Database
A database that stores all the information associated with the different views of the
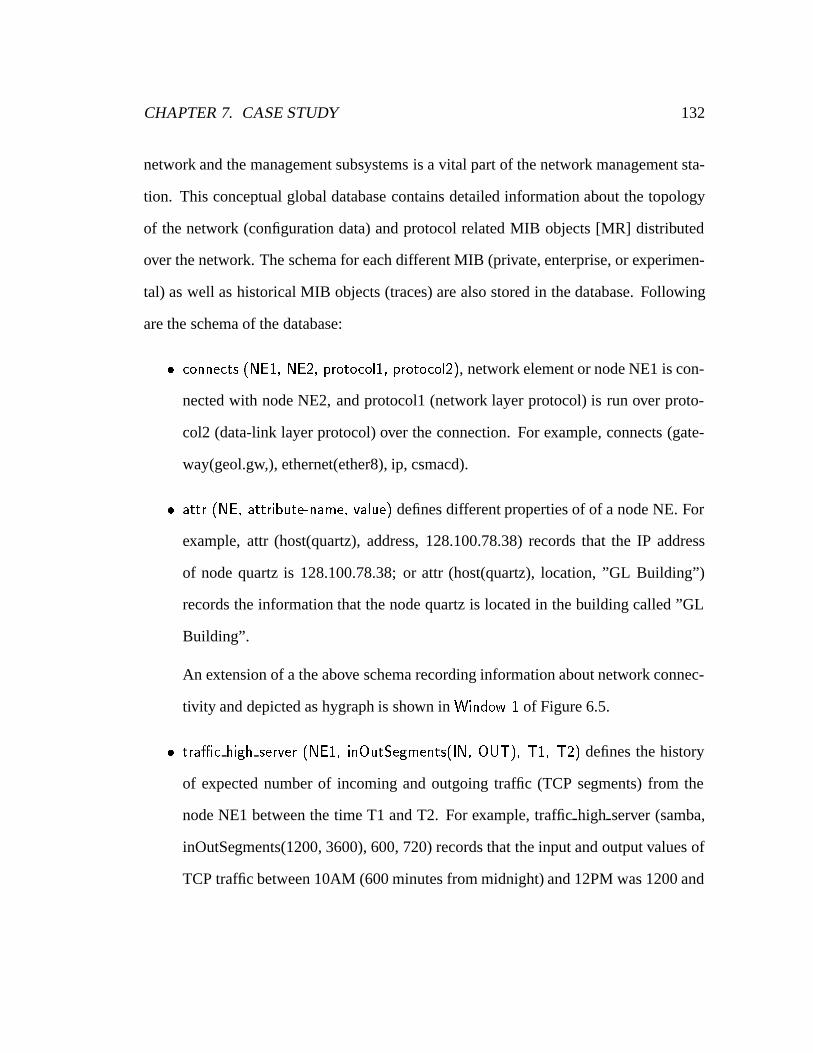
CHAPTER 7. CASE STUDY 132
network and the management subsystems is a vital part of the network management sta-
tion. This conceptual global database contains detailed information about the topology
of the network (configuration data) and protocol related MIB objects [MR] distributed
over the network. The schema for each different MIB (private, enterprise, or experimen-
tal) as well as historical MIB objects (traces) are also stored in the database. Following
are the schema of the database:
� connects (NE1, NE2, protocol1, protocol2), network element or node NE1 is con-
nected with node NE2, and protocol1 (network layer protocol) is run over proto-
col2 (data-link layer protocol) over the connection. For example, connects (gate-
way(geol.gw,), ethernet(ether8), ip, csmacd).
� attr (NE, attribute-name, value) defines different properties of of a node NE. For
example, attr (host(quartz), address, 128.100.78.38) records that the IP address
of node quartz is 128.100.78.38; or attr (host(quartz), location, ”GL Building”)
records the information that the node quartz is located in the building called ”GL
Building”.
An extension of a the above schema recording information about network connec-
tivity and depicted as hygraph is shown in Window 1 of Figure 6.5.
� tra�c high server (NE1, inOutSegments(IN, OUT), T1, T2) defines the history
of expected number of incoming and outgoing traffic (TCP segments) from the
node NE1 between the time T1 and T2. For example, traffic high server (samba,
inOutSegments(1200, 3600), 600, 720) records that the input and output values of
TCP traffic between 10AM (600 minutes from midnight) and 12PM was 1200 and

CHAPTER 7. CASE STUDY 133
3600 segments respectively.
� tra�c high (NE1, NE2, T1, T2, IN, OUT), where T1 and T2 are the start and end
time respectively when the traffic sample was taken, and IN and OUT are the input
and output traffic values. It records the expected values of high volumes of traffic
between nodes NE1 and NE2 during the interval [T1, T2].
An example database of the above two is shown in Window 2 of Figure 7.4.
� mibtree (NE, ID) defines a (history version of) mibtree of an NE.
� date (mibtree-id, date-value) defines the date of a version of a mibtree.
� mib (id, MO-value, MO) defines various history values of managed objects (MO).
For example, mib(tcp boomer 1, 48, tcpInSegs) records a snapshot of tcpInSegs
value (48) for a node called boomer.
� time (MO-id, time-value) defines time at which the sample was taken.
An example database of the above four schema is shown inWindow 2 of Figure 7.3.
Using the sample network database shown in Figure 6.4, we will now show how the
physical and logical maps can be created. By executing the queries shown in Window 1
of Figure 7.1 on the full database we get the physical topology map shown in Window 2
of the same figure.
The database is transformed using queries to obtain yet another different view of
the network: the logical network layer map. Queries def41 and def42 in Window 1
of Figure 7.2 define a new relationship (nlayer) between the hosts, the gateways and the
subnet logical objects. In other words, these queries express that only hosts and gateways

CHAPTER 7. CASE STUDY 134
Figure 7.2: Defining and displaying the logical network layer map.
are shown at the network layer map. The logical map shown in Window 2 is obtained
using the filter query show41 in Window 1.
We can browse the current values and the history traces of MIB objects. For example,
the query in Window 1 of Figure 7.3 displays (in Window 2) the history trace of MIB
objects for the host named boomer. This involves filtering the values as well as the
timestamps of the traces. The edge labeled with the regular expression mib( )+ (shown

CHAPTER 7. CASE STUDY 135
Figure 7.3: History trace of MIB objects for boomer.
dashed to emphasize that the edge in the query graph matches a path in the input graph)
is used to return the entire MIB subtree for boomer.
Administrative and geographical views of the network can be created and displayed
in a similar way.
CHAPTER 7. CASE STUDY 136
7.2 A Fault Management Scenario
In this section we describe how the Hy+ system can be used in the context of a fault
management scenario. The following detailed example is meant to emphasize, in the
context of one typical network management activity, how the use of powerful and flex-
ible visualization tools can contribute to the understanding of the complex information
required for successfully completing the task at hand.
Fault management is a complex task. Due to the layered structure of protocol soft-
ware, a fault caused at one level may show up at other levels. Additionally, the combina-
tion of protocol software incorporating mechanisms to recover from problems together
with the hiding of lower level problems to the higher levels, contributes to make fault
analysis and diagnosis difficult. For example, a connection failure or a long response
time could be caused by congestion or it could be the result of a hardware problem. This
is not to say that protocol software should not try to recover, but that fault analysis and
diagnosis requires sophisticated tools. It is quite helpful to visualize the problem area and
to be able to deduce possible causes by exploiting the capabilities of a powerful database
querying mechanism combined with an inference engine.
To find out the exact cause of a problem we need to proceed in a structured manner.
The fault diagnosis process incorporates the following steps: observe the symptoms,
develope a hypothesis about the cause of a symptom, test the hypothesis, and if the
hypothesis fails, iterate the above steps until a conclusion is reached.

CHAPTER 7. CASE STUDY 137
7.2.1 Defining and Observing Problem Symptoms
Before we can perform fault analysis and diagnosis, we have to find out what kind of
network behavior we can consider as problem symptoms. Defining potential problem
symptoms is very difficult without a priori knowledge of the behavior of the network.
Symptoms can be defined in terms of statistics or the expected behavior of the network.
In [GL91], it is observed that a temporal cycle exists in the traffic distribution of a net-
work. Therefore, a suitable approach consists of defining problem symptoms in terms
of traffic patterns. For example, during high traffic periods, it is natural that network ac-
cesses are slowed down. But if the delays reach a certain threshold (the threshold being
a function of period and traffic pattern) or the utilization of the network drops during
a high traffic period, then this may indicate a possible problem symptom. Henceforth,
we require access to statistics about the behavior of the network (e.g., utilization, traffic
patterns, etc.).
Information about high volumes of traffic can be obtained by monitoring interesting
points in the network. Traffic patterns among individual hosts can be established by
monitoring the tcpInSegs and tcpOutSegs TCP MIB variables, assuming that the only
activity that clients perform is accessing a server by establishing TCP links. Current
SNMP TCP MIB variables do not provide us with traffic information on a per TCP link
basis. However, given SNMP’s widespread usage and simplicity, we will use SNMP
MIB objects in our example. Traffic patterns can also be established using the procedure
mentioned in [GL91].
The traffic information between two subnets (dbnet and distnet) taken from the ex-
ample network in Figure 6.4) is shown against the topology map in Figure 7.4. The server

CHAPTER 7. CASE STUDY 138
samba located in the subnet dbnet is accessed by clients, in the same as well as in other
subnets. The edge labeled tra�c high server(600,720) from the node labeled samba to
the node labeled inOutSegments(1200,3600) tells the expected number of incoming and
outgoing TCP segments from the server samba between 10 a.m (600 minutes from mid-
night) and 12 p.m. (720 minutes from midnight). Other edges labeled tra�c high(Time1,
Time2, In, Out) between individual hosts and samba indicate the (In, Out) expected val-
ues of high volumes of traffic between the server and the hosts during the periods from
Time1 to Time2.
The query show71 in Window 1 of Figure 7.4 is used to filter the physical map
to display the contents of the two subnets of interest, 'dbnet 128.100.60' and 'distnet
128.100.40', together with the tra�c high server and tra�c high edges. In this way,
high traffic spots are visualized directly against the topology, instead of presenting them
as tables or rules. If we were dealing with a large network filtering out all the subnets we
are interested in produces a more understandable and a less cluttered map. The resulting
display (Window 2) helps the human network manager to understand the traffic pattern
directly in terms of the topology of the network.
Now, assume that we monitor the utilization of the server samba. For this purpose
we poll the tcpInSegs and tcpOutSegs TCP objects of the server. The values returned are
kept in the database as history traces.
An alert can be generated if the server utilization falls below a certain threshold in
a particular period of time, which in this case coincides with an expected high traffic
period. If the alert goes off, it indicates a possible problem symptom. The queries in
Figure 7.5 define the alert server uu. Query de�ne81 finds out the time (pointed by the
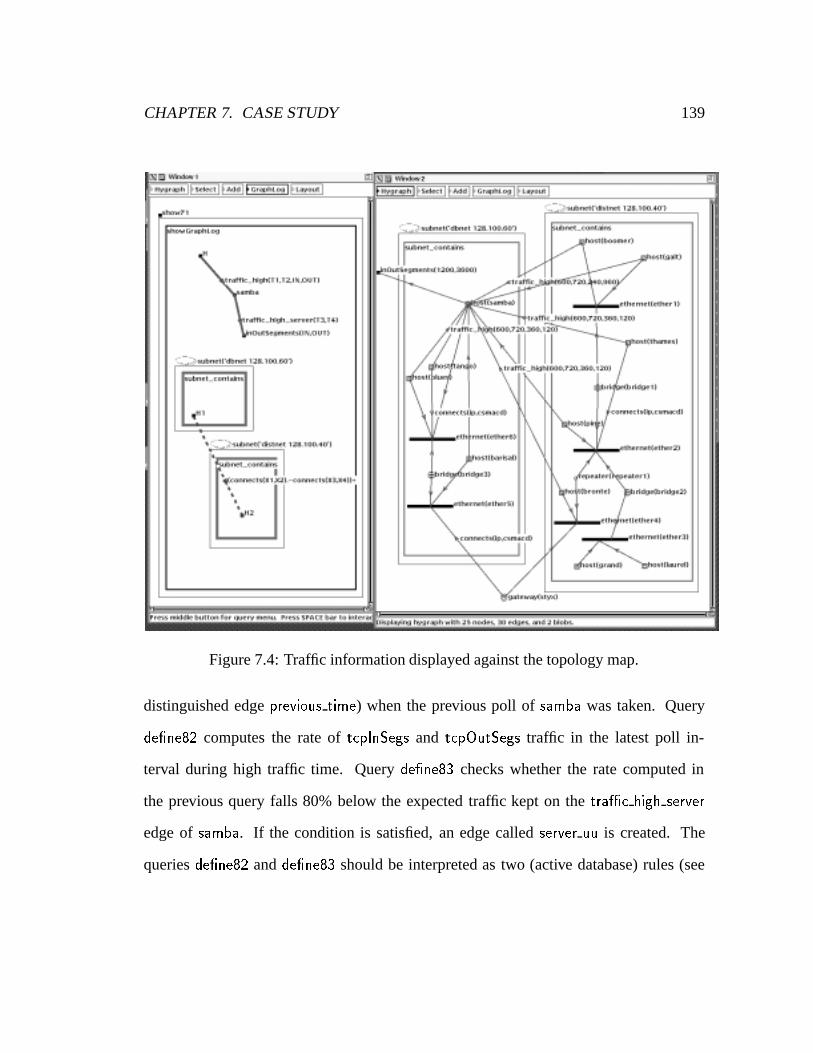
CHAPTER 7. CASE STUDY 139
Figure 7.4: Traffic information displayed against the topology map.
distinguished edge previous time) when the previous poll of samba was taken. Query
de�ne82 computes the rate of tcpInSegs and tcpOutSegs traffic in the latest poll in-
terval during high traffic time. Query de�ne83 checks whether the rate computed in
the previous query falls 80% below the expected traffic kept on the tra�c high server
edge of samba. If the condition is satisfied, an edge called server uu is created. The
queries de�ne82 and de�ne83 should be interpreted as two (active database) rules (see

CHAPTER 7. CASE STUDY 140
Figure 7.5: Defining an alert for possible problem symptoms.
[Day88, BM91, Cer92]) that are triggered on non-empty retrieval events and perform the
action of adding the distinguished edges. These queries defining an alert shows how rel-
evant network management functions can be specified as declarative GraphLog queries.
We are considering the addition of features to the system that address temporal monitor-
ing of database changes similar to the ones proposed in [WSY91].

CHAPTER 7. CASE STUDY 141
7.2.2 Diagnosing a Fault
Let us consider that the alert named server uu (the one we defined in the previous sub-
section) has gone off and the problem area is the server samba.
Our first hypothesis is that the cause is congestion at nearby gateways (routers). It is
possible that other sources of traffic are placing an unexpected demand on the gateways
through which traffic to the server passes. As a consequence the packets destined for the
server are being excessively discarded.
To prove this hypothesis we check the gateways through which packets addressed
to the server are likely to flow. While investigating for congestion we are interested
in focusing on the portion of the logical map of the network that is related to the alert
server uu. For each host that uses the server samba, (and is therefore affected by the alert
server uu) an edge called uses server is created from the host to the server samba.
When we are presented with the logical map, we can easily identify the gateways that
should be checked for congestion. In addition, the gateways can be identified automat-
ically by querying and highlighting them. The queries and the resulting network layer
map are shown in Figure 7.6, with the potentially congested gateway styx highlighted.
Note that focusing on the physical map is not necessary at this stage, it might complicate
the analysis procedure.
Query de�ne91 inWindow 1 of Figure 7.6 creates a direct edge called snc(gateway(G))
between two subnets S1 and S2 with the gateway information carried along the edge.
Query de�ne92 finds the simple paths [MW89] between high traffic nodes and highlights
the gateways traversed along the paths.
As a result of the filter query show91 in Window 1, window Window 2 shows the

CHAPTER 7. CASE STUDY 142
Figure 7.6: Highlighting congested gateways in the logical map.
subset of the logical map of the network that depends on the alert server uu, with a
loop labeled highl around the gateways we are interested in highlighting. Note that the
uses server edges are not shown as thick in the query show91, indicating that we are not
interested in showing these edges in the resulting visualization, thus reducing cluttering.
Filtering out the problem area through a powerful querying mechanism as shown above,
definitely helps.

CHAPTER 7. CASE STUDY 143
After identifying the gateways we check for congestion. The query de�ne93 in Win-
dow 3 checks the current value of the ifOutDiscards variable of the interfaces MIB object
for the highlighted gateways. If the value exceeds the specified threshold, then the dis-
tinguished edge called congestion is created.
If no congestion is detected at the gateway styx, we have to come up with a second
hypothesis. For now, assume that there is indeed congestion at the gateway styx. The
source of the congestion could be the clients of the server samba, or it could originate
somewhere else. To find out the source of the congestion we check whether the hosts
using the server are placing the expected traffic to the server samba. As discussed earlier,
the expected traffic patterns between the server and its clients have been established
earlier. We can use a query to check whether the sum of the current values of tcpOutSegs
for all the clients is 20% less or more than the sum of the expected values that are kept
on the tra�c high edges.
If the answer to the above query is no, we may hypothesize that other sources are
causing the congestion, since the clients of samba are generating traffic as expected.
We could continue tracing the source of the congestion by looking at the other hosts in
the network. This can be done by querying the current tcpConnTable for those hosts
and creating visualizations to help locate the TCP links that have routes through the
congested gateway styx.
Assume that no congestion was detected, but it was found that the clients of samba
are not generating the expected traffic to the server. Our second hypothesis is that the
cause of the alert is due to a hardware problem. In this case the map is brought up
showing physical details like repeaters, bridges, datalink layer protocols (CSMA/CD,

CHAPTER 7. CASE STUDY 144
Figure 7.7: TCP links superimposed on the physical topology map.
tokenring), cable types (coax, fiber), and so on. Before looking for the physical causes
of the problem, we superimpose the currently active TCP links on the portion of the
physical map that depends on the alert.
Query de�ne101 in Window 1 of Figure 7.7 can be interpreted as follows: create an
edge called tcp link between the hosts H that use the server samba if the IP address
found in the tcpConnRemAddress of H’s TCP connection table matches the address

CHAPTER 7. CASE STUDY 145
of samba (which is stored in the attribute attr(address) of the configuration database).
Query show101 in Window 1 produces, as a result, the visualization in window Window
2 showing the portion of the physical topology map that depends on the alert, together
with the previously defined tcp link edges superimposed on the map.
The visualization of TCP links allows us to pin-point the problem area at the portion
of the network beyond ether4. The problem could be at the repeater repeater1, or at the
ethernet segments ether2. This follows from noticing that no TCP connection originates
at ether1 or ether2. The SNMP manager could not access the current TCP objects from
that part of the network.
The example shows how when isolating faults in a network it is advantageous to
view network maps at different abstract levels, while proceeding in a structured manner
to pin-point the problem area. If we were limited to work only with the entire physical
map of a large network, the complexity of the fault analysis and diagnosis procedure
would increase significantly. This is just one particular instance that illustrates how the
capabilities of the Hy+ system can be exploited by human network managers.
7.3 Example Event Expressions
We will now give a number of examples showing how the CEDAR operators can be used
to declaratively specify interesting events of interest in the network management domain.
� A server underutilized (su) event follows a router congestion (co) event within 2
minutes.
co(router1) fby su(server1)) in [co(router1), (2 minute)]
CHAPTER 7. CASE STUDY 146
� We will now show how the “persistence” or the occurrence of an event at all the
chronon points for the duration of an interval can be specified in CEDAR. In a dy-
namic environment transient events happen which may be of no interest. But if the
event(s) of interest “persists” for a specified interval of time, we may want to de-
tect it. Since the model of time in our system is not continuous, but rather discrete,
we have to define the notion of “persistence”. In network management an event
may be defined by sampling a managed object (MO) at regular intervals and eval-
uating a predicate on the sampled data. For example, the values of ifOutDiscards
MIB variable of a router may be sampled each minute and an event called conges-
tion defined when the values exceed a threshold. The chronon of the congestion
event is one minute. In defining persistence the sampling interval (chronon) has to
be considered. If the event happens at all points of the chronon for the specified
duration, then the event “persists” for that duration.
For example, “persistence” of a server underutilized (su) event for five minutes
can be specified as follows.
CE2 = su 2 [5 minute]
Event su has to occur at all chronon points of the 5 minutes interval. If it does
not happen at any point, then the interval is pushed forward starting from the first
occurrence of su after a non-occurrence of su.
� Polling or Sampling is an important function in network management.
An event polling every 2 minutes for 1 hour can be specified as follows:
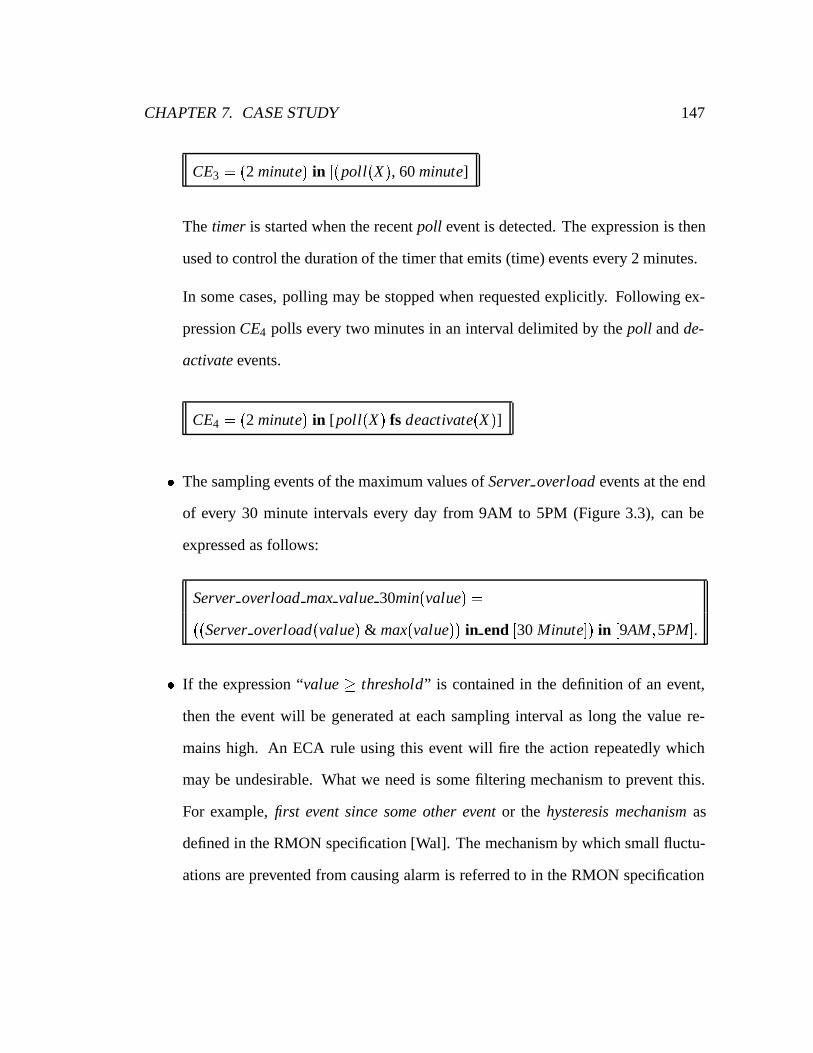
CHAPTER 7. CASE STUDY 147
CE3 = (2 minute) in [(poll(X), 60 minute]
The timer is started when the recent poll event is detected. The expression is then
used to control the duration of the timer that emits (time) events every 2 minutes.
In some cases, polling may be stopped when requested explicitly. Following ex-
pression CE4 polls every two minutes in an interval delimited by the poll and de-
activate events.
CE4 = (2 minute) in [poll(X) fs deactivate(X)]
� The sampling events of the maximum values of Server overload events at the end
of every 30 minute intervals every day from 9AM to 5PM (Figure 3.3), can be
expressed as follows:
Server overload max value 30min(value) =
((Server overload(value) & max(value)) in end [30 Minute]) in [9AM;5PM].
� If the expression “value � threshold” is contained in the definition of an event,
then the event will be generated at each sampling interval as long the value re-
mains high. An ECA rule using this event will fire the action repeatedly which
may be undesirable. What we need is some filtering mechanism to prevent this.
For example, first event since some other event or the hysteresis mechanism as
defined in the RMON specification [Wal]. The mechanism by which small fluctu-
ations are prevented from causing alarm is referred to in the RMON specification
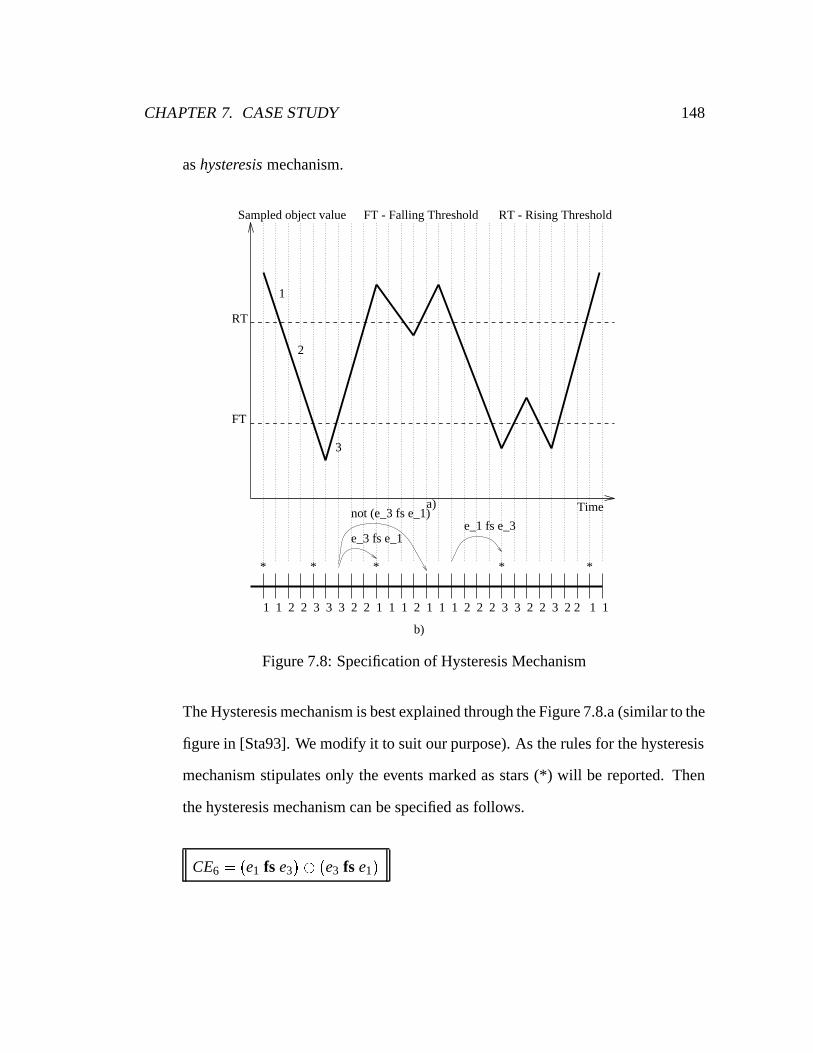
CHAPTER 7. CASE STUDY 148
as hysteresis mechanism.
Time
Sampled object value
RT
FT
1
2
3
RT - Rising ThresholdFT - Falling Threshold
1 1 2 2 3 3 3 1 1 1 2 1 1 1 2 2 2 3 3 3 1 1
* * * * *
2 2 2 2 2 2
b)
e_3 fs e_1
not (e_3 fs e_1)a)
e_1 fs e_3
Figure 7.8: Specification of Hysteresis Mechanism
The Hysteresis mechanism is best explained through the Figure 7.8.a (similar to the
figure in [Sta93]. We modify it to suit our purpose). As the rules for the hysteresis
mechanism stipulates only the events marked as stars (*) will be reported. Then
the hysteresis mechanism can be specified as follows.
CE6 = (e1 fs e3) (e3 fs e1)
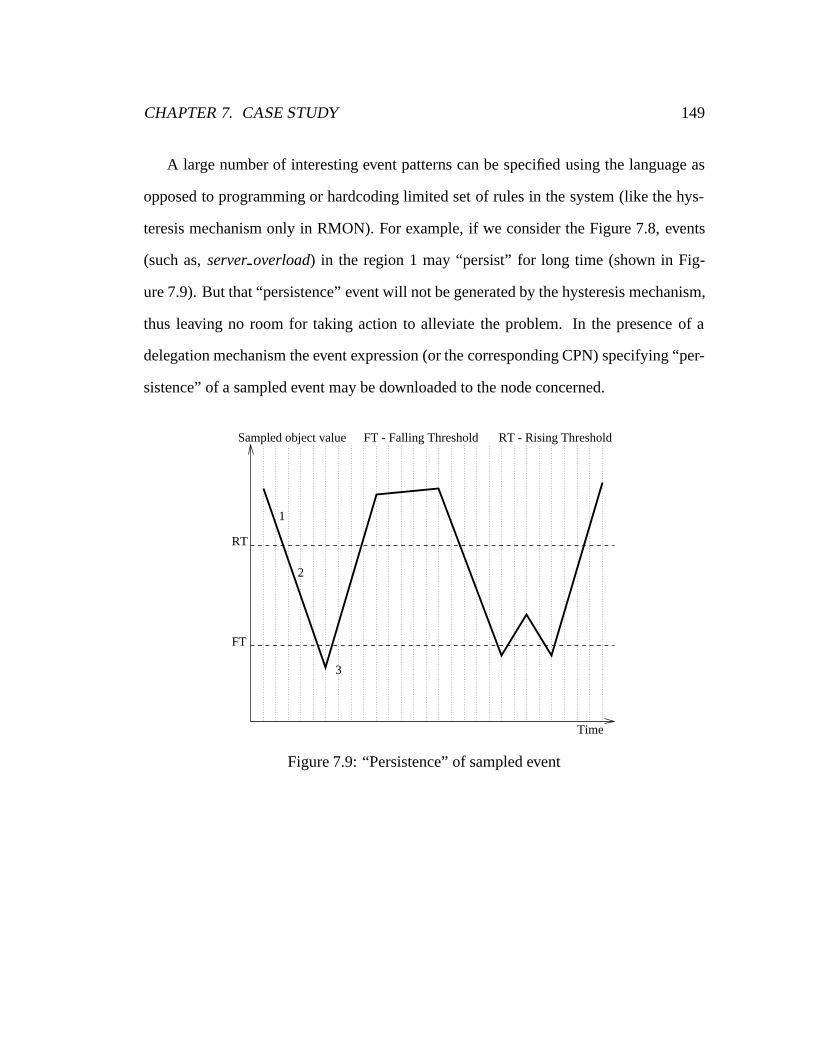
CHAPTER 7. CASE STUDY 149
A large number of interesting event patterns can be specified using the language as
opposed to programming or hardcoding limited set of rules in the system (like the hys-
teresis mechanism only in RMON). For example, if we consider the Figure 7.8, events
(such as, server overload) in the region 1 may “persist” for long time (shown in Fig-
ure 7.9). But that “persistence” event will not be generated by the hysteresis mechanism,
thus leaving no room for taking action to alleviate the problem. In the presence of a
delegation mechanism the event expression (or the corresponding CPN) specifying “per-
sistence” of a sampled event may be downloaded to the node concerned.
Sampled object value
RT
FT
1
2
3
RT - Rising ThresholdFT - Falling Threshold
Time
Figure 7.9: “Persistence” of sampled event

CHAPTER 7. CASE STUDY 150
7.4 Example ECA Specifications
We will now show how the power of CEDAR, active temporal databases, the GraphLog
and Hy+ system can be combined to specify useful NM scenarios. An example sequence
of ECA rules is shown in Figure 7.10.
ECA r1: The values of tcpInSegs and tcpOutSegs MIB variables for a particular
server (in the example, server samba) are sampled after every 2 minute interval. The
sampling is carried out in an interval delimited by a poll event and a deactivate event
raised by rule r3. The sampled values are inserted into the tables mib (id, MO-value,
tcpInSegs) and mib (id, MO-value, tcpOutSegs).
ECA r2: Each insertion into any of above mentioned tables fires referenced GraphLog
statements. The GraphLog 1 is a reference to GraphLog statements shown in Figure 7.5.
The non-empty results (server uu event tuples) of def83 are inserted into the server uu
table.
ECA r3: If the server underutilized (server uu) event “persists” for 10 minutes, then
the timer in rule r1 is stopped (r1 deactivated) and the rule r4 is activated by raising the
poll(r4) event in the action.
ECA r4: The Get from network IF Tab procedure first executes the GraphLog state-
ments def91 and def92 of Figure 7.6, which finds out the routers (gateways) that are lo-
cated between the server and its clients. The query required to find out the routers needs
to operate on the topology of the network, which requires a transitive closure query. The
GraphLog queries are used for that purpose. The routers are then passed to a procedure
which samples the ifOutDiscards MIB object every 2 minutes interval for half an hour or
until the event deactivate(r4) occurs (whichever comes first).

CHAPTER 7. CASE STUDY 151
ECA r5: As the values of ifOutDiscards are inserted into mib (id, MO-value, ifOut-
Discards), the GraphLog statement def93 of Figure 7.6 is fired. This GraphLog statement
determines if a congestion event has happened at the current sampling point.
ECA r6: If the congestion event “persists” for 10 minutes, then the GraphLog state-
ment show91 of Figure 7.6 is evaluated, which shows the affected area of the network
(Window 2) of Figure 7.6). This rule also generate the deactivate(r4) event.
ECA r7: If for a 30 minute interval the composite event in the ECA r6 did not occur,
then execute the GraphLog statements def101 and show101 in Figure 7.7, as a result of
which the affected physical map is shown in Window 2 of Figure 7.7.
7.5 Event Correlation using Hy+
The event correlation with CEDAR deals with the compression, suppression, filtering,
aggregation, counting, and establishment of temporal relationship between events. But
the causal, and structural relationships between events are not dealt with in CEDAR.
The Hy+ system is capable of providing these event correlation facilities. In addition
the hygraph based visualization provided by the Hy+ system adds power to the event
correlation mechanism as it provides the human operator with sophisticated visual in-
formation about the event correlation process. The ECXpert event correlation system
[Nyg95] (described in Chapter 2), for example, provides textual information about a cor-
relation group (which is in fact a tree). The correlation group is decided based on a
specification that specifies the causal pattern (correlation tree skeleton in [Nyg95]). As
the system receives alert events from the network, it tries to correlate events based on
the specified causal pattern, the result of which is the correlation tree. The Hy+ system
CHAPTER 7. CASE STUDY 152
can be used in the same way. The causal pattern corresponds to GraphLog queries. The
correlation group corresponds to a hygraph. As the database is updated with alert events
the specified GraphLog queries are evaluated (incremental evaluation is assumed). The
result of which is the causality graph or hygraph. It is also possible to superimpose the
causality graph or hygraph on the topology of the (portion of the) managed network.
The Hy+ system has been used for analyzing distributed program event traces [CHM94]
to observe program behavior. The set of alert events generated by managed elements de-
fines a partial ordering or causality graph, in as much the same way that distributed
program event traces do. The Hy+ system can be used effectively for dealing with graph
structured databases. The causality graph which is a (forest of) directed acyclic graph
can be created by simple GraphLog queries. Each graph (or hygraph) corresponds to a
correlation group (as in [Nyg95]) and the (set of) GraphLog queries to the specifications
of causal pattern. We show a number of examples from [CHM94]. The queries shown
in Figure 7.11 create the causality graph (as shown in Figure 7.12) from the set of raw
events reported to the system.

CHAPTER 7. CASE STUDY 153
E:
r1:
r2:
r3:E:
r4:Router1 Routern
Activate
A: Get_from_network_TCP_Tab
A: Get_from_network_IF_Tab
server_uu
deactivate(r4))]
E:
r5:E:
E: 2 minute in [poll(r4), (30 minute
r6:congestion (router) [10 minute]
r7:E: congestion (router) not_in
[30 minute]( [10 minute] )
Server Samba
server_uu (samba) [10 minute] Deactivate
Generate poll (r4)
, Generate deactivate (r4)
problem area filtered out
TCP connection shownon physical map
Network layer map shown
server_uu generated
A: Execute GraphLog_2
A: Execute GraphLog_3
A: Execute GraphLog_4
E: nth (2, minute) in [poll(r1) fs deactivate(r1)]
A: Generate deactivate (r1),
Insert (mib (ifOutDiscards)) congestion eventgenerated
A: Execute GraphLog_1Insert( mib (tcpOutSegs))Insert (mib (tcpInSegs))
Figure 7.10: Diagramatic View of the rule sequences
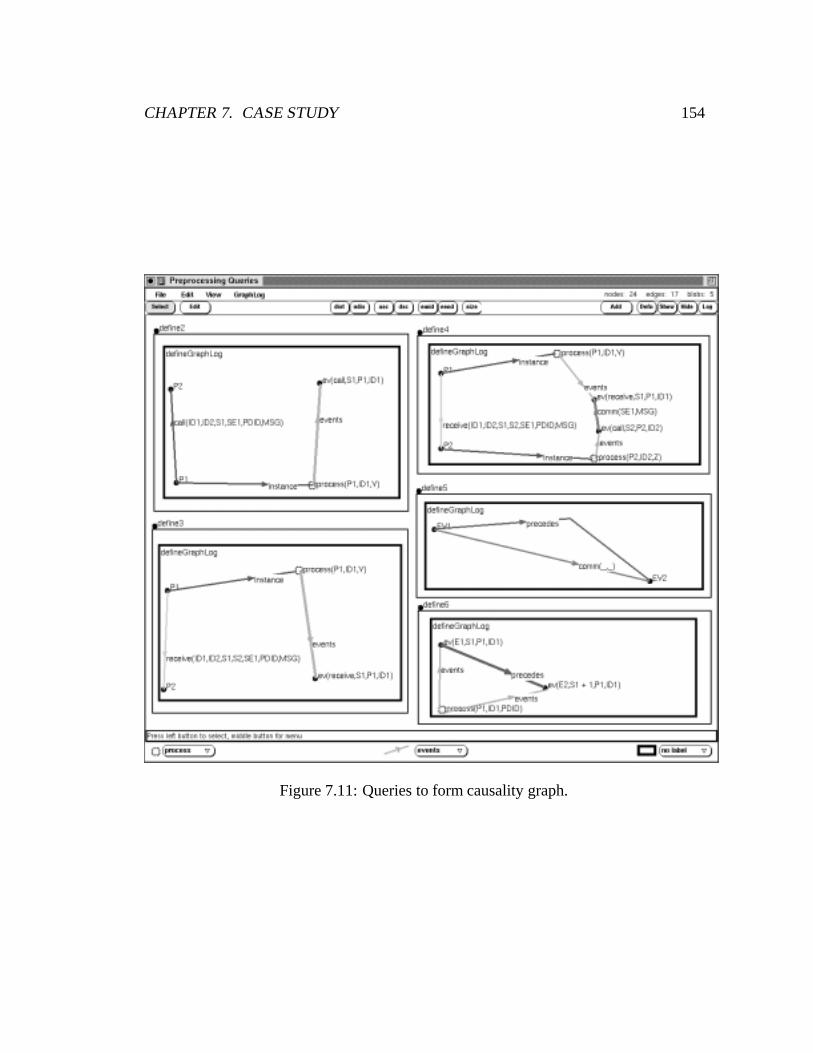
CHAPTER 7. CASE STUDY 154
Figure 7.11: Queries to form causality graph.
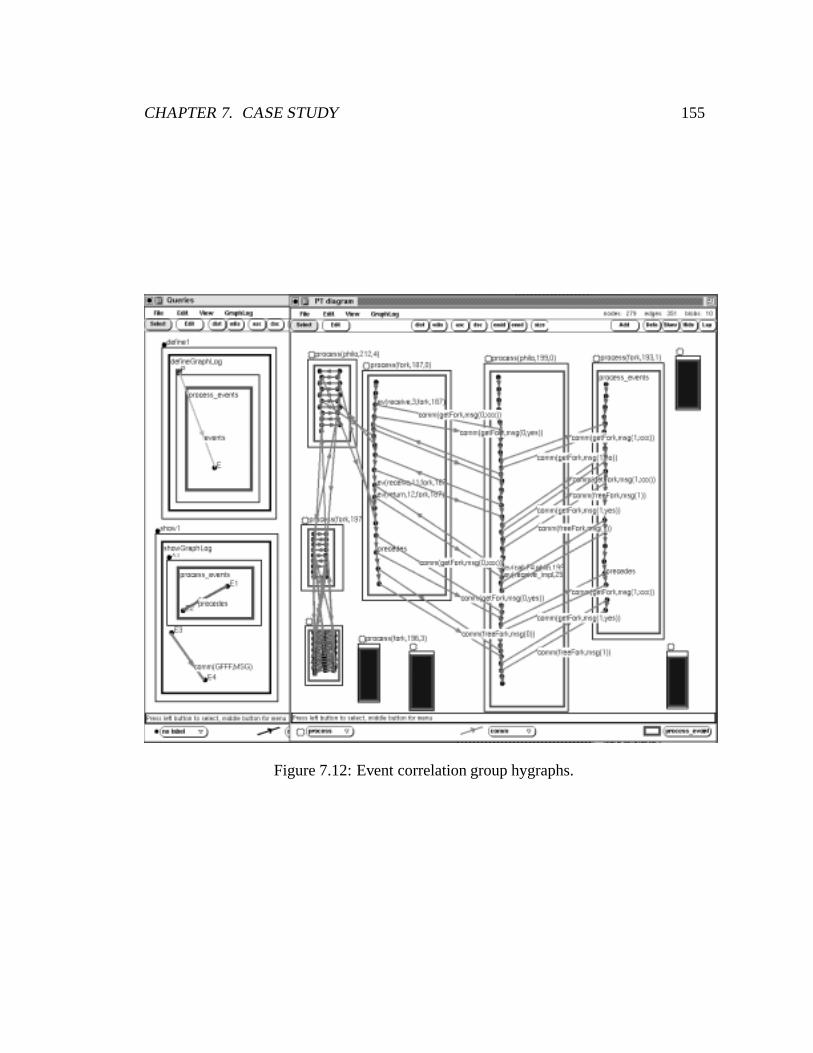
CHAPTER 7. CASE STUDY 155
Figure 7.12: Event correlation group hygraphs.

Chapter 8
Conclusion
This thesis introduces a uniform framework for the management of data, events, and
information presentation for network management. The investigation of unique proper-
ties of NM data, events, and information presentation tasks reveal that an active temporal
database based and hygraph based database visualization system are suitable frameworks
for an NMS.
The emphasis in this thesis is declarative specification of NM functions:
� NM data manipulation using declarative database manipulation statements, such
as, SQL/GraphLog.
� Declarative specification of event management or event correlation functions using
CEDAR and GraphLog.
� Declarative specification of information presentation or visualization using GraphLog.
� Declarative specification of network monitoring and control from a unified frame-
work, that is, as ECA rules.
156
CHAPTER 8. CONCLUSION 157
The contributions of this work are summarized below.
� Network Management
1. Investigation of properties of NM data, events, and functionalities from a
database perspective. The nature of NM data fall into two basic categories:
static and dynamic. Events ifall into polling/sampling and asynchronous cat-
egories. The main functionalities provided by an NMS are data and event
management, monitoring and control, and information presentation. The
main functions of event management are event correlation; The information
presentation has to deal with (mostly) graph structured and various necessary
abstract views of data. As a result we have shown that network management
can be seen as database management that deals with the management of NM
data, events, and information presentation.
2. Proposal for a NM database system that takes into consideration the proper-
ties of NM data, events, and functionalities.
3. A powerful framework for NM event management that deals with event cor-
relation based on various properties of NM events.
4. A model of visual information presentation on NM stations.
5. An architecture for an NM system that deals with NM data, events, and in-
formation presentation from a unified framework and combines and extends
the features of active temporal databases and database visualization systems.
� Active Temporal Databases
CHAPTER 8. CONCLUSION 158
1. An expressive composite event specification language with features lacking
in others.
2. An incremental implementation model of the language operators and expres-
sions using Colored Petri Nets.
8.1 Limitations and Future Work
The CEDAR language does not address the problem of causality based event manage-
ment. The causality based event management is performed with the Hy+ system. But a
tightly integrated framework will be more desirable.
Events happen in distributed network elements (NE). In order to decide the temporal
ordering between two events occurring in two different NEs the following assumtions
have to be made:
1. a system-wide global clock and
2. messages are delivered to a location where a composite event is detected in the
order they occur in distributed network elements.
The second assumption requires the existence of a global clock. Consider, for example,
the composite event E = e1 fby e2, where e1 and e2 occur in two different NEs. The
correct detection of E depends on the above assumptions.
The assumption of a global clock in a distributed system has its own inherent prob-
lems which have implications on the processing of CEDAR expressions. A system wide
global clock is achieved through sysnchronizing the local clocks of the network elements.
The quality of synchronization is measured by its precision, i.e., how close together it

CHAPTER 8. CONCLUSION 159
brings the clocks at different network elements. The best precision that can be achieved
is determined by the timing uncertainty that is inherent in the system. There are two main
sources of timing uncertainty in a distributed system. First, local clocks at different NEs
are independent: they do not start together and may run at different speeds. Second, mes-
sages sent between NEs incur uncertain delays. The precision influences the correctness
and the efficiency of application using the synchronized clocks. For example, without
the assumption of a global clock the composite event E = e1 fby e2, where e1 and e2
occur in two different NEs, cannot be detected properly. If the local clocks (of NEs) are
not properly synchronized, the correctness of detection of E can be questioned. Con-
siderable work has been dedicated to clock synchronization (such as [SWL88, AHR]).
The protocols used for clock synchronization places extra burden on the system and are
generally based on various assumptions. For example, [Lam78] proposes algorithms for
systems where processors and links are reliable, but both delays and clock drifts are un-
certain. The Internet network time protocol (NTP) [Mil91] assumes that message delays
in opposite directions of a bi-directional link are usually close. Hence in a heterogenous
network the correctness of the evaluation of CEDAR expressions cannot be guaranteed.
The presence of a global clock also brings up the question of performance and scal-
ability of the system due to the overhead imposed by synchronization protocols. The
solution is not to assume a global clock and provide some sort of (delta) bound or inter-
val about the occurrence of a (composite) event, which is possible to specify in CEDAR.
For example, A server underutilized (su) event follows a router congestion (co) event
within 2 minutes can be specified as: co(router1) fby su(server1)) in [co(router1), (2
minute)].

CHAPTER 8. CONCLUSION 160
It will be worthwhile to investigate how the proposed NMDB system fits into CORBA
[COR] and World Wide Web [HMV95, HGN+95] frameworks. These two technologies
open up whole new opportunities for distributed network management.
One area of future research is to investigate whether a CPN corresponding to an event
expression can be minimized while still preserving the semantics of the expression. It
may also be possible to decompose a CPN so that places and transitions dependent on
particular events are placed close to the source of the corresponding events. Consider,
for example, the CPN in Figure 5.7. The lower portion of the CPN may be located close
to the source of E1 and ChP and the upper portion close to the source of [Is; Ie]. This
may be useful for various reasons, for example, reducing network overload in transport-
ing the events and distributing the loads of composite event detectors to the distributed
computing resources.
In the temporal database area it is worth investigating whether the CPNs can be used
as a vehicle for incremental view maintenance in a temporal database. The event ex-
pressions in CEDAR can be regarded as views. In fact, given an expressive TDB query
language, it may be possible to specify composite events as views in that language. If
the views incorporate operators supported in CEDAR, then the CPN implementation of
the operators can function as the incremental evaluators of the views specifying compos-
ite events. In other words, we rewrite TDB views as CPNs and evaluate them as their
corresponding (base) event tables are updated (discussed in Chapter 3).
It will probably be useful to work out visual equivalents of CEDAR expressions and
incorporate them tightly with the GraphLog visual query language.

Bibliography
[AHR] H. Attiya, A. Herzberg, and S. Rajsbaum. Optimal clock synchronization
under different delay assumptions.
[aIMS92] H.V. Jagadish anf I.S. Mumick and O. Shmueli. Events with attributes in
an active database. Technical report, AT&T, 1992.
[BAMP81] M. Ben-Ari, Z. Manna, and A. Pnueli. The logic of nexttime. In Eighth
ACM Symposium on Principles of Programming Languages, pages 164–
176, January 1981.
[BM91] Catriel Beeri and Tova Milo. A model for active object oriented database.
In Proceedings of the 17th International Conference on Very Large Data
Bases, pages 337–349, September 1991.
[CAM93] S. Chakravarthy, E. Anwar, and L. Maugis. Design and implementation of
active capability for an object-oriented database. Technical Report UF-
CIS-TR-93-001, University of Florida, Computer and Information Sci-
ences, 1993.
161
BIBLIOGRAPHY 162
[Cea89] S. Chakravarthy and et. al. HiPAC: A research project in active time-
constrained database management, final techincal report. Technical report,
Xerox advanced information technology, Cambridge, Mass., 1989.
[CEH+94] M.P. Consens, F.Ch. Eigler, M.Z. Hasan, A.O. Mendelzon, M.G. Noik,
A.G. Ryman, and D. Vista. Architecture and Applications of the Hy+
Visualization System. IBM Systems Journal, 33(3), 1994.
[Cer92] Stefano Ceri. A declarative approach to active databases. In Proceedings
of the Data Engineering, pages 452–456, 1992.
[CFSD] J. D. Case, M. S. Fedor, M. L. Schoffstal, and J. R. Davin. A simple net-
work management protocol (SNMP). RFC 1157, SNMP Research, Per-
formance Systems International, MIT Laboratory for Computer Science,
May 1990.
[CH93] Mariano Consens and Masum Hasan. Supporting network management
through declaratively specified data visualizations. In H.G. Hegering and
Y. Yemini, editors, Proceedings of the IEEE/IFIP Third International Sym-
posium on Integrated Network Management, III, pages 725–738. Elsevier
North Holland, April 1993.
[CHM94] Mariano Consens, Masum Hasan, and Alberto Mendelzon. Visualizing
and querying distributed event traces with hy+. In Proceedings of the
International Conference on Application of Databases, Lecture Notes in
Computer Science 819, pages 123–141. Springer-Verlag, June 1994.
BIBLIOGRAPHY 163
[Cho93] J. Chomicki. Temporal Deductive Databases. Benjamin-Cummings, 1993.
[CKAK94] S. Chakravarthy, V. Krishnaprasad, E. Anwar, and S.K. Kim. Composite
events for active databases: Semantics, context and detection. In Proceed-
ings of the 20th VLDB Conference, pages 606–617, 1994.
[CM90a] Mariano Consens and Alberto Mendelzon. GraphLog: a visual formalism
for real life recursion. In Proceedings of the Ninth ACM SIGACT-SIGMOD
Symposium on Principles of Database Systems, pages 404–416, 1990.
[CM90b] Mariano Consens and Alberto Mendelzon. Low complexity aggregation
in GraphLog and Datalog. In Proceedings of the Third International Con-
ference on Database Theory, Lecture Notes in Computer Science Nr. 470,
pages 379–394. Springer-Verlag, 1990. A revised version has been ac-
cepted for publication in TCS.
[Con92] Mariano P. Consens. Visual manipulations of database visualizations. PhD
Thesis Proposal, 1992.
[COR] The common object request broker: Architecture and specification. Object
Management Group, July 1995.
[Day88] U. Dayal. Active database management systems. In Proceedings of the
third International Conference on Management of Data, pages 225–234,
June 1988.

BIBLIOGRAPHY 164
[DHL91] U. Dayal, M. Hsu, and R. Ladin. A transactional model for long-running
activities. In Proceedings of the 17th International conference on very
large databases, pages 113–122, 1991.
[ea93] C. Jensen et. al. Proposed temporal database concepts - may 1993. In Pro-
ceedings of the International Workshop On an Infrastructure for Temporal
Databases, pages A–1–A–29, June 1993.
[ea94] N. Pissinou et. al. Towards an infrastructure for temporal databases, re-
port of an invitational ARPA/NSF workshop. Technical Report TR 94-01,
Department of Computer Science, University of Arizona, March 1994.
[EH85] E. A. Emerson and J. Y. Halpern. Decision procedures and expressiveness
in the temporal logic of branching time. Journal of Computer and System
Sciences, 30:1–24, 1985.
[Eig94] Frank Ch. Eigler. Translating GraphLog to SQL. In Proceedings of the
1994 CAS Conference, Toronto, Ontario, November 1994. IBM.
[Eme90] E. A. Emerson. Handbook of Theoretical Computer Science. Elsevier
Science, 1990.
[Fuk91] Milan Fukar. Translating GraphLog into Prolog. Technical report, Center
for Advanced Studies IBM Canada Limited, October 1991.
[GD93] S. Gatziu and K.R. Dittrich. Events in an object-oriented database system.
In Proceedings of the 1st International conference on rules in database
systems, pages 23–39, 1993.

BIBLIOGRAPHY 165
[GD94] S. Gatziu and K. Dittrich. Detecting composite events in active database
systems using petri nets. In Proceedings of the Fourth International Work-
shop on Research Issues in Data Engineering, pages 2–9, February 1994.
[GJS92a] N. Gehani, H. Jagadish, and O. Shmueli. Composite event specification in
active databases: Model and implementation. In Proceedings of the 18th
International Conference on Very Large Data Bases, 1992.
[GJS92b] N. Gehani, H. Jagadish, and O. Shmueli. Event specification in an ac-
tive object-oriented database. In Proceedings of the ACM-SIGMOD 1992
International Conference on Management of Data, pages 81–90, 1992.
[GL91] Mario Gerla and Ying-Dar Lin. Network management using database dis-
covery tools. IEEE proceedings on Distributed Computing Systems 1991,
pages 378–385, 1991.
[GY91] G. Goldszmidt and Y. Yemini. The design of management delegation en-
gine. In Proceedings of the IFIP/IEEE International Workshop on Dis-
tributed Systems: Operations and Management, 1991.
[Har88] David Harel. On visual formalisms. Communications of the ACM,
31(5):514–530, 1988.
[Has92] Masum Z. Hasan. Topology and device discovery in an Internet environ-
ment. Course Report, University of Waterloo, 1992.
[Has95] Masum Hasan. An active temporal model for network management
databases. In A.S. Sethi, Y. Raynaud, and F. Faure-Vincent, editors, Pro-

BIBLIOGRAPHY 166
ceedings of the IEEE/IFIP Fourth International Symposium on Integrated
Network Management, pages 524–535. Chapman and Hall, May 1995.
[HBM93] J. W. Hong, M. A. Bauer, and A. D. Marshall. Distributed information
repository for supporting integrated network management. In Proceed-
ings of 2nd IEEE Network Management and Control Workshop, September
1993.
[HBNRD93] J. Haritsa, M. Ball, J. Baras N. Roussopoulas, and A. Datta. Design of the
MANDATE MIB. In H.G. Hegering and Y. Yemini, editors, Proceedings
of the IEEE/IFIP Third International Symposium on Integrated Network
Management, III, pages 85–96. Elsevier North Holland, April 1993.
[HGN+95] M. Hasan, G. Golovchinsky, E. Noik, N. Charoenkitkarn, M. Chignell,
A. Mendelzon, and D. Modjeska. Browsing local and global information.
In Proc. of CASCON 95, pages 228–240, 1995.
[HLM88] M. Hsu, R. Ladin, and D. McCarthy. An execution model for active
database management system. In Proceedings of the 3rd International
conference on data and knowledge bases, 1988.
[HMV95] M. Hasan, A. Mendelzon, and D. Vista. Visual web surfing with hy+. In
Proc. of CASCON 95, pages 218–227, 1995.
[HV87] M. Holliday and M. Vernon. A generalized timed petri net model for per-
formance analysis. IEEE Transactions on Software Engineering, 13(12),
1987.

BIBLIOGRAPHY 167
[ISOa] ISO 9596, information processing systems, open systems interconnec-
tion, management information protocol specification, common manage-
ment information protocol. International Organization for Standardization,
November 1990.
[ISOb] ISO 7498, information processing systems, open systems interconnection,
basic reference model part 4, OSI management framework. International
Organization for Standardization, October 1986.
[ISOc] ISO/IEC DIS 10165-1, information processing systems, open systems in-
terconnection, structure of management information, part 1: Management
information model. International Organization for Standardization, July
1990.
[ISOd] ISO/IEC DIS 10165-2, information processing systems, open systems in-
terconnection, structure of management information, part 2: Definition of
management information. International Organization for Standardization,
July 1990.
[ISOe] ISO/IEC DIS 10165-4, information processing systems, open systems in-
terconnection, structure of management information, part 4: Guidelines
for the definition of managed objects. International Organization for Stan-
dardization, June 1990.
[JR91] K. Jensen and G. Rozenberg, editors. High Level Petri Nets, Theory and
Application. Springer-Verlag, 1991.

BIBLIOGRAPHY 168
[JW95] G. Jakobson and M. Weissman. Real-time telecommunication network
management: extending event correlation with temporal constraints. In
A.S. Sethi, Y. Raynaud, and F. Faure-Vincent, editors, Proceedings of the
IEEE/IFIP Fourth International Symposium on Integrated Network Man-
agement, pages 290–301. Chapman and Hall, May 1995.
[KdMS90] G. Kiernan, C. de Maindreville, and E. Simon. Making deductive database
a practical technology: a step forward. In Proceedings of the ACM SIG-
MOD Conference on Management of Data, 1990.
[KMG88] G. Kar, B. Madden, and R. S. Gilbert. Heuristic layout algorithms for net-
work management presentation services. IEEE Network Magazine, pages
29–36, November 1988.
[Lam78] L. Lamport. Time, clocks, and the ordering of events in a distributed sys-
tem. Comm. ACM, 21(7):558–565, 1978.
[MD89] D. McCarthy and U. Dayal. The architecture of an active data base man-
agement system. In Proceedings of the ACM-SIGMOD 1989 International
Conference on Management of Data, pages 215–224, 1989.
[Mil91] D. Mills. Internet time synchronization: the Network Time Protocol. IEEE
Transaction on Communications, 39(10):1482–1493, 1991.
[MR] K. McCloghrie and M. T. Rose. Management information base for network
management of TCP/IP based internets - MIB-II. RFC 1213, Hughes LAN
Systems, Performance Systems International, March, 1991.

BIBLIOGRAPHY 169
[MW89] A.O. Mendelzon and P.T. Wood. Finding regular simple paths in graph
databases. In Proc. 15th International Conference on Very Large Data
Bases, pages 185–194, 1989.
[MZ96] I. Motakis and C. Zaniolo. Composite temporal events in active database
rules: A logic-oriented approach. In Proc. International Conference on
Very Large Data Bases, 1996. To appear.
[NA93] S.B. Navathe and R. Ahmed. Temporal extensions to the relational model
and SQL. Temporal Databases, Theory, Design, and Implementation,
pages 92–109, 1993.
[NS89] Shamim Naqvi and Tsur Shalom. A logical language for data and knowl-
edge bases. Computer Science Press, New York, 1989.
[Nyg95] Y. A. Nygate. Event correlation using rule and object based techniques. In
A.S. Sethi, Y. Raynaud, and F. Faure-Vincent, editors, Proceedings of the
IEEE/IFIP Fourth International Symposium on Integrated Network Man-
agement, pages 278–289. Chapman and Hall, May 1995.
[Pnu81] A. Pnueli. The temporal logic of concurrent programs. Theoretical Com-
puter Science, 13:45–60, 1981.
[RM] M. Rose and K. McCloghrie. Structure and indentification of management
information for TCP/IP-based internets. RFC 1155, Performance Systems
International, Hughes LAN Systems, May, 1990.
BIBLIOGRAPHY 170
[RSS92] R. Ramakrishnan, D. Srivastava, and S. Sudarshan. CORAL: Control,
Relations and Logic. In Proceedings of International Conference on Very
Large Databases, 1992.
[Sea93] R. Snodgrass and et. al. The TSQL2 language specification. Technical
report, The TSQL2 design committe, 1993.
[Shv93] A. A. Shvartsman. An historical object base in an enterprise management
director. In H.G. Hegering and Y. Yemini, editors, Proceedings of the
IEEE/IFIP Third International Symposium on Integrated Network Man-
agement, III, pages 123–134. Elsevier North Holland, April 1993.
[SPAM91] U. Schreier, H. Pirahesh, R. Agrawal, and C. Mohan. Alert: An architec-
ture for transforming a passive DBMS into an active DBMS. In Proceed-
ings of the 17th International Conference on Very Large Data Bases, pages
469–478, 1991.
[Sta93] W. Stallings. SNMP, SNMPv2, and CMIP, The Practical Guide to Net-
work Management Standards. Addison-Wesley Publishing Company, Inc.,
1993.
[Sto74] L.J. Stockmeyer. The complexity of decision procedures in automata the-
ory and logic. Technical Report TR 133, MIT, 1974.
[SWL88] B. Simmons, J. Welch, and N. Lynch. An overview of clock synchroniza-
tion. Technical report, Research report RC 6505 (63306), IBM, 1988.
[Tan88] A.S. Tanenbaum. Computer Networks. Prentice Hall, 1988.

BIBLIOGRAPHY 171
[Val91] R. F. Valta. Design concepts for a global network management database.
Integrated Network Management, II, pages 777–788, 1991.
[vdA93] W. van der Aalst. Interval timed coloured petri nets and their analysis. In
Lecture Notes in Computer Science Nr. 691. 1993.
[Wal] S. Waldbusser. Remote network monitoring management information
base. RFC 1271, Carnegie Mellon University.
[WCL91] J. Widom, R. Cochrane, and B. Lindsay. Implementing set-oriented pro-
duction rules as an extension to Starburst. In Proceedings of the 17th In-
ternational conference on very large databases, pages 275–285, 1991.
[WSY91] O. Wolfson, S. Sengupta, and Y. Yemini. Managing communication net-
works by monitoring databases. IEEE Transactions on Software Engineer-
ing, 17(9):944–953, September 1991.
[x50] CCITT. the directory - overview of concepts, models and services. CCITT
X.500 Series Recommendations. CCITT, December 1988.

Appendix A
Portion of TCP/IP MIB
Following is a definition of a portion of a MIB defined in ASN.1 language. It defines
the (schema of) TCP (Transport Control Protocol) MIB. A MIB definition specifies the
variables of a managed object (in this case TCP) that have to be instrumented for man-
agement purposes. In the following definition various keywords define the following
(details can be found in [Sta93]):
� SYNTAX: the abstract syntax for the object type. Defines the type of data such as
INTEGER, IPAddress (a 32-bit address using the format specified in IP), Counter
(a non-negative integer that may be incremented but not decremented), etc.
� ACCESS: defines the way in which an instnce of the object may be accessed, via
SNMP or some other protocol. The options are “read-only”, “read-write”, “write-
only”, “not-accessible”.
� STATUS: indicates the implementation support required for this object. Support
may be “mandatory” or “optional”.
172

APPENDIX A. PORTION OF TCP/IP MIB 173
� INDEX: used in defining tables. This clause may be present only if the object type
corresponds to a conceptual row. It defines the (primary) key for a table.
tcpInSegs OBJECT-TYPE
SYNTAX Counter
ACCESS read-only
STATUS mandatory
DESCRIPTION
"The total number of segments received, including those
received in error. This count includes segments received on
currently established connections."
::= { tcp 10 }
tcpOutSegs OBJECT-TYPE
SYNTAX Counter
ACCESS read-only
STATUS mandatory
DESCRIPTION
"The total number of segments sent, including those on
current connections but excluding those containing only
retransmitted octets."
::= { tcp 11 }

APPENDIX A. PORTION OF TCP/IP MIB 174
tcpConnTable OBJECT-TYPE
SYNTAX SEQUENCE OF TcpConnEntry
ACCESS not-accessible
STATUS mandatory
DESCRIPTION
"A table containing TCP connection-specific information."
::= { tcp 13 }
tcpConnEntry OBJECT-TYPE
SYNTAX TcpConnEntry
ACCESS not-accessible
STATUS mandatory
DESCRIPTION
"A conceptual row of the tcpConnTable containing information
about a particular current TCP connection. Each row of this
table is transient, in that it ceases to exist when (or soon
after) the connection makes the transition to the CLOSED
state."
INDEX {
tcpConnLocalAddress,
tcpConnLocalPort,
tcpConnRemAddress,

APPENDIX A. PORTION OF TCP/IP MIB 175
tcpConnRemPort
}
::= { tcpConnTable 1 }
TcpConnEntry ::=
SEQUENCE {
tcpConnState
INTEGER,
tcpConnLocalAddress
IpAddress,
tcpConnLocalPort
INTEGER,
tcpConnRemAddress
IpAddress,
tcpConnRemPort
INTEGER
}
.
.
.
tcpConnLocalAddress OBJECT-TYPE
APPENDIX A. PORTION OF TCP/IP MIB 176
SYNTAX IpAddress
ACCESS read-only
STATUS mandatory
DESCRIPTION
"The local IP address for this TCP connection. In the case
of a connection in the listen state which is willing to
accept connections for any IP interface associated with the
node, the value 0.0.0.0 is used."
::= { tcpConnEntry 2 }
tcpConnLocalPort OBJECT-TYPE
SYNTAX INTEGER
ACCESS read-only
STATUS mandatory
DESCRIPTION
"The local port number for this TCP connection."
::= { tcpConnEntry 3 }
.
.
.

Appendix B
Implementation of CEDAR
B.1 Composite Event Detector
The mapping process of CEDAR expressions into a corresponding CPN and the com-
posite event detector is shown in Figure B.1.
CompilerEvent Expression ASCII representation
Detectorof resulting CPN
ASCII representationof the CPNs of thebasic operators
Events
Figure B.1: CEDAR expression mapping process
A CEDAR expression is mapped to a corresponding CPN by the compiler. The com-
piler builds the parse tree corresponding to the expression. It then reads in the ASCII
177

APPENDIX B. IMPLEMENTATION OF CEDAR 178
representation of the CPNs corresponding to the basic CEDAR operators found in the
event expression. The compiler then combines the basic CPNs into a CPN which cor-
responds to the parse tree. The output of the compiler is the ASCII representation of
the resulting CPN. For example, following is the ASCII representation of the CPN (Fig-
ure 5.11) of the fs operator.

APPENDIX B. IMPLEMENTATION OF CEDAR 179
$E1 $E2
A a
T1:$E1 Y A a:P1 Y
T2:A a $E2 Z:A a
T3:$E1 X P1 Y:P1 X
T4:P1 X $E2 Z:E (X, Z) A a
The first line lists the input events. The strings marked with the dollar sign are replaced
with appropriate event name found in the event expression. The second line indicates the
initial marking. All the other lines list the transitions. The syntax for the transitions is
the following:
<transition name>:<input-place arc-inscription>+:
<output-place arc-inscription>+
The ASCII representation of the CPN (Figure 5.5) of the in end operator is shown below:
$Is $E1 $Ie
A1 a A2 a
T1:$Is X2 A1 a:P1 X2
T2:$E1 Y A1 a:A1 a
T3:$Is X P1 X2:P1 X
T4:P1 X $E1 Y:P1 X P3 (X, Y)
T5:P1 X $Ie Z:P2 Z
T6:$Ie Z A1 a:A1 a
T7:P3 (X, Y) A2 a:P5 (X, Y) P4 a
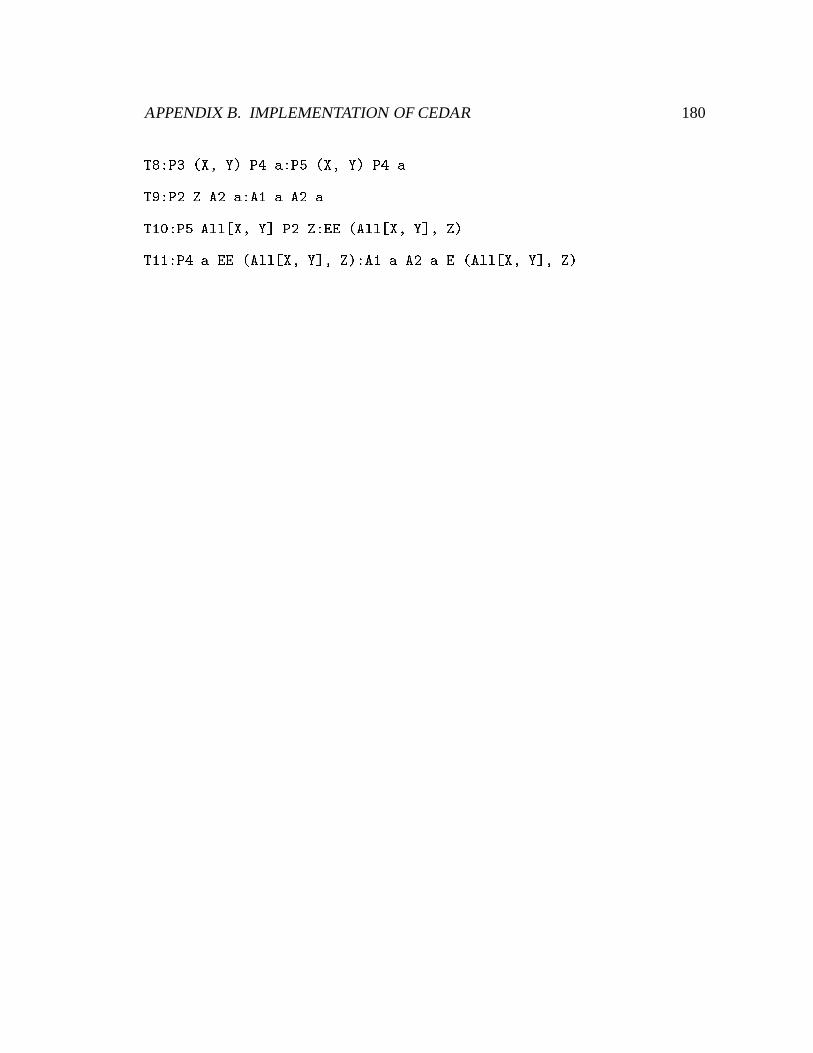
APPENDIX B. IMPLEMENTATION OF CEDAR 180
T8:P3 (X, Y) P4 a:P5 (X, Y) P4 a
T9:P2 Z A2 a:A1 a A2 a
T10:P5 All[X, Y] P2 Z:EE (All[X, Y], Z)
T11:P4 a EE (All[X, Y], Z):A1 a A2 a E (All[X, Y], Z)
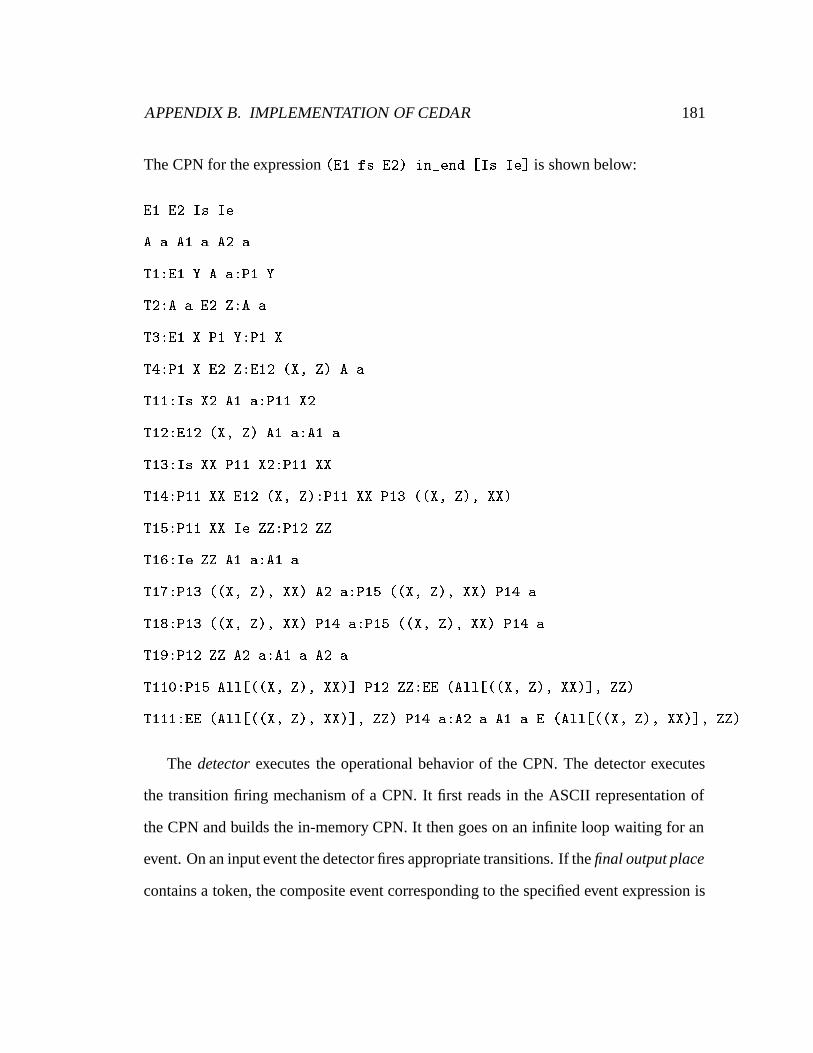
APPENDIX B. IMPLEMENTATION OF CEDAR 181
The CPN for the expression (E1 fs E2) in_end [Is Ie] is shown below:
E1 E2 Is Ie
A a A1 a A2 a
T1:E1 Y A a:P1 Y
T2:A a E2 Z:A a
T3:E1 X P1 Y:P1 X
T4:P1 X E2 Z:E12 (X, Z) A a
T11:Is X2 A1 a:P11 X2
T12:E12 (X, Z) A1 a:A1 a
T13:Is XX P11 X2:P11 XX
T14:P11 XX E12 (X, Z):P11 XX P13 ((X, Z), XX)
T15:P11 XX Ie ZZ:P12 ZZ
T16:Ie ZZ A1 a:A1 a
T17:P13 ((X, Z), XX) A2 a:P15 ((X, Z), XX) P14 a
T18:P13 ((X, Z), XX) P14 a:P15 ((X, Z), XX) P14 a
T19:P12 ZZ A2 a:A1 a A2 a
T110:P15 All[((X, Z), XX)] P12 ZZ:EE (All[((X, Z), XX)], ZZ)
T111:EE (All[((X, Z), XX)], ZZ) P14 a:A2 a A1 a E (All[((X, Z), XX)], ZZ)
The detector executes the operational behavior of the CPN. The detector executes
the transition firing mechanism of a CPN. It first reads in the ASCII representation of
the CPN and builds the in-memory CPN. It then goes on an infinite loop waiting for an
event. On an input event the detector fires appropriate transitions. If the final output place
contains a token, the composite event corresponding to the specified event expression is
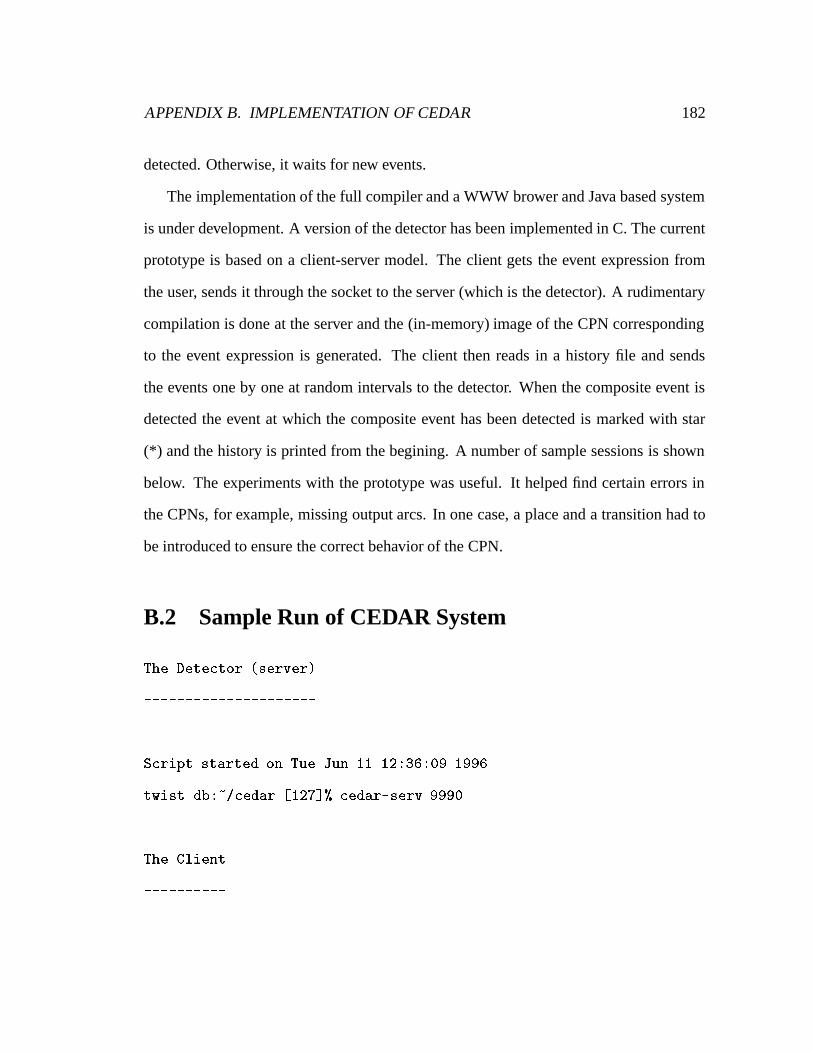
APPENDIX B. IMPLEMENTATION OF CEDAR 182
detected. Otherwise, it waits for new events.
The implementation of the full compiler and a WWW brower and Java based system
is under development. A version of the detector has been implemented in C. The current
prototype is based on a client-server model. The client gets the event expression from
the user, sends it through the socket to the server (which is the detector). A rudimentary
compilation is done at the server and the (in-memory) image of the CPN corresponding
to the event expression is generated. The client then reads in a history file and sends
the events one by one at random intervals to the detector. When the composite event is
detected the event at which the composite event has been detected is marked with star
(*) and the history is printed from the begining. A number of sample sessions is shown
below. The experiments with the prototype was useful. It helped find certain errors in
the CPNs, for example, missing output arcs. In one case, a place and a transition had to
be introduced to ensure the correct behavior of the CPN.
B.2 Sample Run of CEDAR System
The Detector (server)
---------------------
Script started on Tue Jun 11 12:36:09 1996
twist.db:~/cedar [127]% cedar-serv 9990
The Client
----------
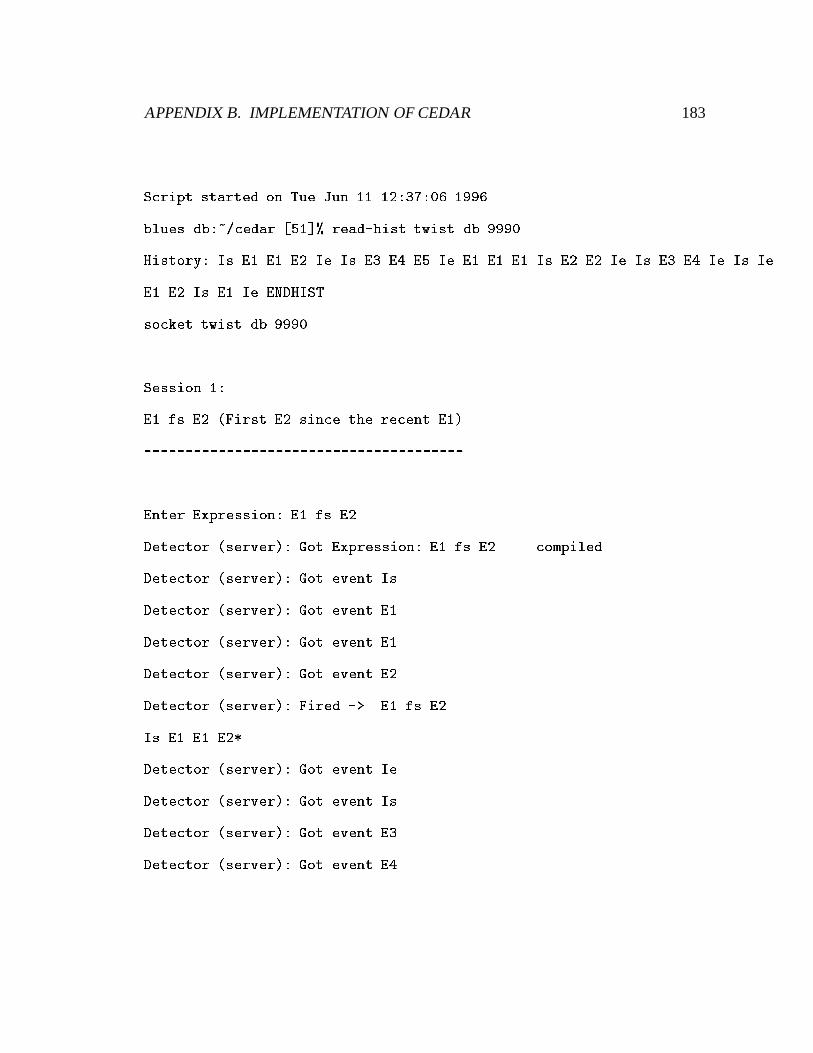
APPENDIX B. IMPLEMENTATION OF CEDAR 183
Script started on Tue Jun 11 12:37:06 1996
blues.db:~/cedar [51]% read-hist twist.db 9990
History: Is E1 E1 E2 Ie Is E3 E4 E5 Ie E1 E1 E1 Is E2 E2 Ie Is E3 E4 Ie Is Ie
E1 E2 Is E1 Ie ENDHIST
socket twist.db 9990
Session 1:
E1 fs E2 (First E2 since the recent E1)
---------------------------------------
Enter Expression: E1 fs E2
Detector (server): Got Expression: E1 fs E2 ... compiled
Detector (server): Got event Is
Detector (server): Got event E1
Detector (server): Got event E1
Detector (server): Got event E2
Detector (server): Fired -> E1 fs E2
Is E1 E1 E2*
Detector (server): Got event Ie
Detector (server): Got event Is
Detector (server): Got event E3
Detector (server): Got event E4

APPENDIX B. IMPLEMENTATION OF CEDAR 184
Detector (server): Got event E5
Detector (server): Got event Ie
Detector (server): Got event E1
Detector (server): Got event E1
Detector (server): Got event E1
Detector (server): Got event Is
Detector (server): Got event E2
Detector (server): Fired -> E1 fs E2
Is E1 E1 E2* Ie Is E3 E4 E5 Ie E1 E1 E1 Is E2*
Detector (server): Got event E2
Detector (server): Got event Ie
Detector (server): Got event Is
Detector (server): Got event E3
Detector (server): Got event E4
Detector (server): Got event Ie
Detector (server): Got event Is
Detector (server): Got event Ie
Detector (server): Got event E1
Detector (server): Got event E2
Detector (server): Fired -> E1 fs E2
Is E1 E1 E2* Ie Is E3 E4 E5 Ie E1 E1 E1 Is E2* E2 Ie Is E3 E4 Ie Is Ie E1 E2*
Detector (server): Got event Is
Detector (server): Got event E1
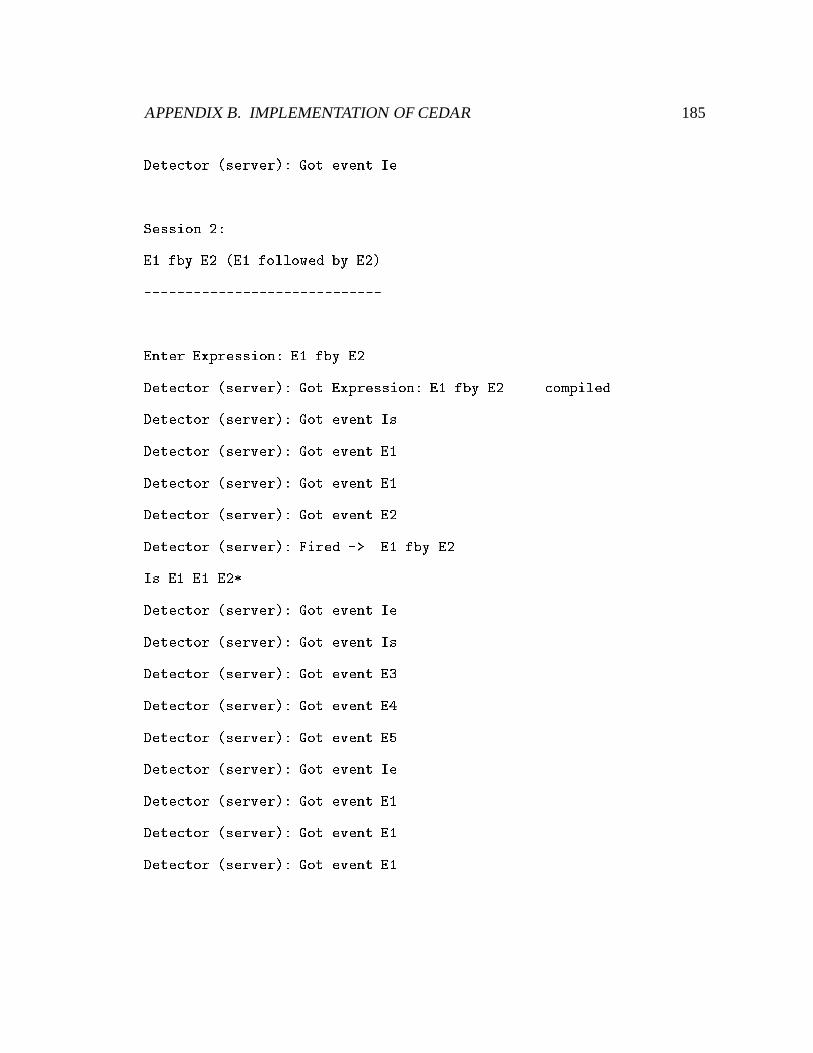
APPENDIX B. IMPLEMENTATION OF CEDAR 185
Detector (server): Got event Ie
Session 2:
E1 fby E2 (E1 followed by E2)
-----------------------------
Enter Expression: E1 fby E2
Detector (server): Got Expression: E1 fby E2 ... compiled
Detector (server): Got event Is
Detector (server): Got event E1
Detector (server): Got event E1
Detector (server): Got event E2
Detector (server): Fired -> E1 fby E2
Is E1 E1 E2*
Detector (server): Got event Ie
Detector (server): Got event Is
Detector (server): Got event E3
Detector (server): Got event E4
Detector (server): Got event E5
Detector (server): Got event Ie
Detector (server): Got event E1
Detector (server): Got event E1
Detector (server): Got event E1
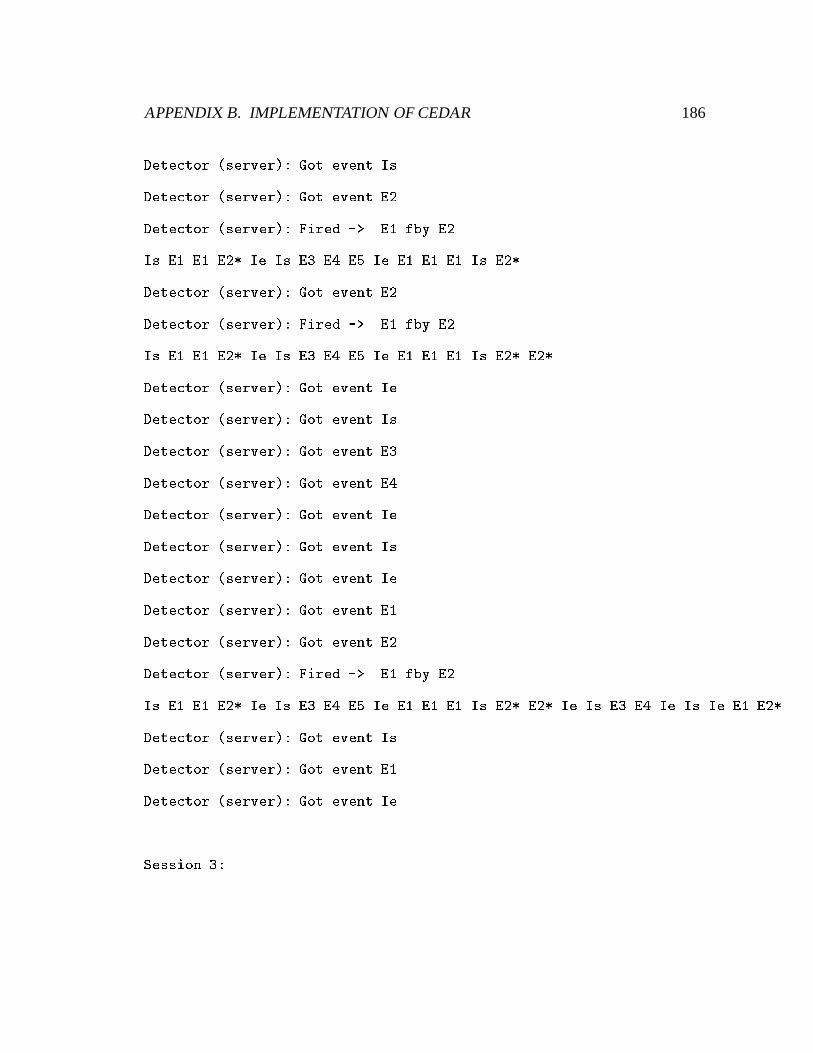
APPENDIX B. IMPLEMENTATION OF CEDAR 186
Detector (server): Got event Is
Detector (server): Got event E2
Detector (server): Fired -> E1 fby E2
Is E1 E1 E2* Ie Is E3 E4 E5 Ie E1 E1 E1 Is E2*
Detector (server): Got event E2
Detector (server): Fired -> E1 fby E2
Is E1 E1 E2* Ie Is E3 E4 E5 Ie E1 E1 E1 Is E2* E2*
Detector (server): Got event Ie
Detector (server): Got event Is
Detector (server): Got event E3
Detector (server): Got event E4
Detector (server): Got event Ie
Detector (server): Got event Is
Detector (server): Got event Ie
Detector (server): Got event E1
Detector (server): Got event E2
Detector (server): Fired -> E1 fby E2
Is E1 E1 E2* Ie Is E3 E4 E5 Ie E1 E1 E1 Is E2* E2* Ie Is E3 E4 Ie Is Ie E1 E2*
Detector (server): Got event Is
Detector (server): Got event E1
Detector (server): Got event Ie
Session 3:

APPENDIX B. IMPLEMENTATION OF CEDAR 187
(E1 fs E2) in_end [Is Ie] (First E2 since the recent E1 in interval Is,Ie)
--------------------------------------------------------------------------
Enter Expression: (E1 fs E2) in_end [Is Ie]
Detector (server): Got Expression: (E1 fs E2) in_end [Is Ie] ... compiled
Detector (server): Got event Is
Detector (server): Got event E1
Detector (server): Got event E1
Detector (server): Got event E2
Detector (server): Got event Ie
Detector (server): Fired -> (E1 fs E2) in_end [Is Ie]
Is E1 E1 E2 Ie*
Detector (server): Got event Is
Detector (server): Got event E3
Detector (server): Got event E4
Detector (server): Got event E5
Detector (server): Got event Ie
Detector (server): Got event E1
Detector (server): Got event E1
Detector (server): Got event E1
Detector (server): Got event Is
Detector (server): Got event E2
Detector (server): Got event E2

APPENDIX B. IMPLEMENTATION OF CEDAR 188
Detector (server): Got event Ie
Detector (server): Fired -> (E1 fs E2) in_end [Is Ie]
Is E1 E1 E2 Ie* Is E3 E4 E5 Ie E1 E1 E1 Is E2 E2 Ie*
Detector (server): Got event Is
Detector (server): Got event E3
Detector (server): Got event E4
Detector (server): Got event Ie
Detector (server): Got event Is
Detector (server): Got event Ie
Detector (server): Got event E1
Detector (server): Got event E2
Detector (server): Got event Is
Detector (server): Got event E1
Detector (server): Got event Ie
Session 4:
(E1 fby E2) in [Is Ie] (E1 followed by E2 in interval Is,Ie)
------------------------------------------------------------
Enter Expression: (E1 fby E2) in [Is Ie]
Detector (server): Got Expression: (E1 fby E2) in [Is Ie] ... compiled
Detector (server): Got event Is
Detector (server): Got event E1
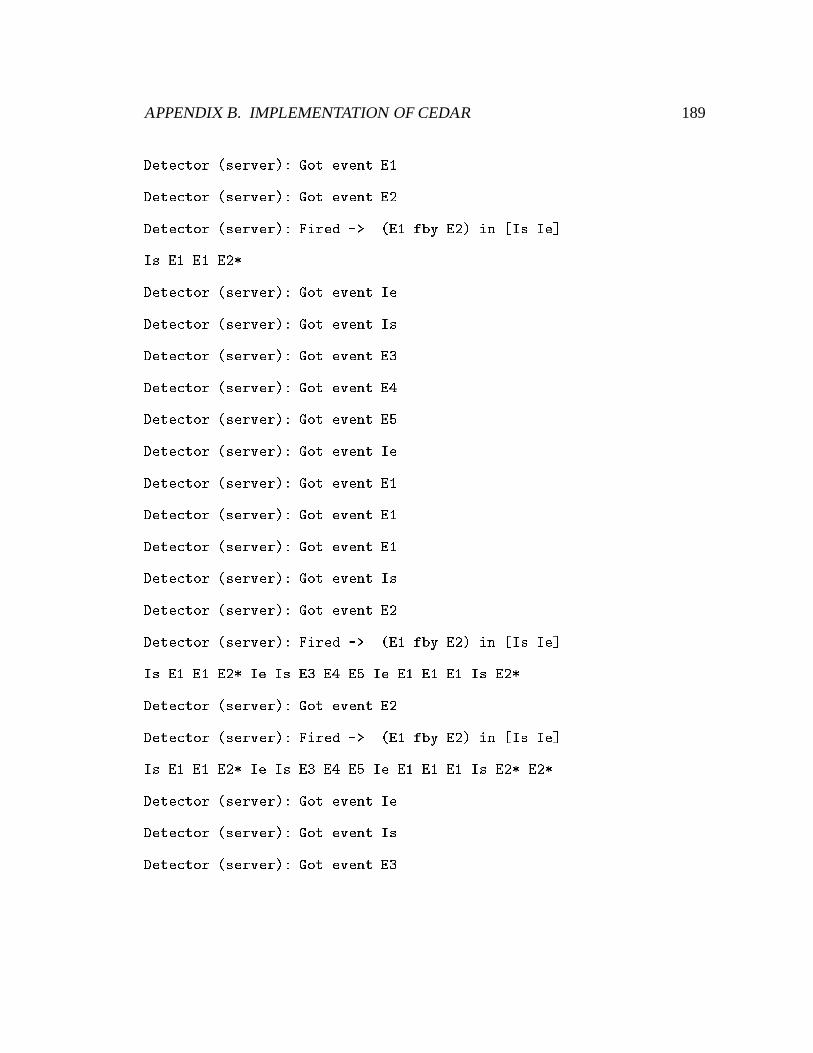
APPENDIX B. IMPLEMENTATION OF CEDAR 189
Detector (server): Got event E1
Detector (server): Got event E2
Detector (server): Fired -> (E1 fby E2) in [Is Ie]
Is E1 E1 E2*
Detector (server): Got event Ie
Detector (server): Got event Is
Detector (server): Got event E3
Detector (server): Got event E4
Detector (server): Got event E5
Detector (server): Got event Ie
Detector (server): Got event E1
Detector (server): Got event E1
Detector (server): Got event E1
Detector (server): Got event Is
Detector (server): Got event E2
Detector (server): Fired -> (E1 fby E2) in [Is Ie]
Is E1 E1 E2* Ie Is E3 E4 E5 Ie E1 E1 E1 Is E2*
Detector (server): Got event E2
Detector (server): Fired -> (E1 fby E2) in [Is Ie]
Is E1 E1 E2* Ie Is E3 E4 E5 Ie E1 E1 E1 Is E2* E2*
Detector (server): Got event Ie
Detector (server): Got event Is
Detector (server): Got event E3

APPENDIX B. IMPLEMENTATION OF CEDAR 190
Detector (server): Got event E4
Detector (server): Got event Ie
Detector (server): Got event Is
Detector (server): Got event Ie
Detector (server): Got event E1
Detector (server): Got event E2
Detector (server): Got event Is
Detector (server): Got event E1
Detector (server): Got event Ie
Session 5:
(E1 and E2) not_in [Is Ie] (E1 and E2 in any order not in interval Is,Ie)
-------------------------------------------------------------------------
Enter Expression: (E1 and E2) not_in [Is Ie]
Detector (server): Got Expression: (E1 and E2) not_in [Is Ie] ... compiled
Detector (server): Got event Is
Detector (server): Got event E1
Detector (server): Got event E1
Detector (server): Got event E2
Detector (server): Got event Ie
Detector (server): Got event Is
Detector (server): Got event E3

APPENDIX B. IMPLEMENTATION OF CEDAR 191
Detector (server): Got event E4
Detector (server): Got event E5
Detector (server): Got event Ie
Detector (server): Fired -> (E1 and E2) not_in [Is Ie]
Is E1 E1 E2 Ie Is E3 E4 E5 Ie*
Detector (server): Got event E1
Detector (server): Got event E1
Detector (server): Got event E1
Detector (server): Got event Is
Detector (server): Got event E2
Detector (server): Got event E2
Detector (server): Got event Ie
Detector (server): Got event Is
Detector (server): Got event E3
Detector (server): Got event E4
Detector (server): Got event Ie
Detector (server): Fired -> (E1 and E2) not_in [Is Ie]
Is E1 E1 E2 Ie Is E3 E4 E5 Ie* E1 E1 E1 Is E2 E2 Ie Is E3 E4 Ie*
Detector (server): Got event Is
Detector (server): Got event Ie
Detector (server): Fired -> (E1 and E2) not_in [Is Ie]
Is E1 E1 E2 Ie Is E3 E4 E5 Ie* E1 E1 E1 Is E2 E2 Ie Is E3 E4 Ie* Is Ie*
Detector (server): Got event E1
APPENDIX B. IMPLEMENTATION OF CEDAR 192
Detector (server): Got event E2
Detector (server): Got event Is
Detector (server): Got event E1
Detector (server): Got event Ie
script done on Tue Jun 11 12:41:13 1996