the marketization of higher education: a causal …...2 the marketization of higher education: a...
TRANSCRIPT

1
PAGE TITLE HERE
The marketization of higher
education: A causal analysis of
innovation in UK universities
ERC Research Paper No.39
February 2016

2
The marketization of higher
education: A causal analysis of
innovation in UK universities
Nola Hewitt-Dundas Queen’s University Belfast
Stephen Roper Warwick University
The Enterprise Research Centre is an independent research centre which focusses on SME growth and productivity. ERC is a partnership between Warwick Business School, Aston Business School, Imperial College Business School, Strathclyde Business School, Birmingham Business School and Queen’s University School of Management. The Centre is funded by the Economic and Social Research Council (ESRC); the Department for Business, Innovation & Skills (BIS); Innovate UK and the British Business Bank. The support of the funders is acknowledged. The views expressed in this report are those of the authors and do not necessarily represent those of the funders.

3
ABSTRACT
Higher education is increasingly a marketised service sharing many
characteristics with other professional services such as legal, medical or
financial services. With marketization comes competition, and the need for
HEIs to develop and maintain attractive undergraduate programmes to
attract and retain strong faculty and fee-paying students. Here, we consider
the drivers of programme innovation – the introduction of new programmes
– and the withdrawal of existing programmes in UK universities. Using
panel data for all UK universities provided by UCAS we identify significant
resource, internationalisation and business engagement effects. Financial
stringency encourages both programme innovation and withdrawal. More
extensive international market engagement and research collaboration with
business have similar effects increasing programme innovation. The results
have both strategic and systemic implications.
Keywords: Higher education; Under-graduate: Innovation; Globalisation;
Business engagement

4
CONTENTS
ABSTRACT ....................................................................................... 3
INTRODUCTION ............................................................................... 5
CONCEPTUAL FRAMEWORK AND HYPOTHESES ....................... 7
DATA AND METHODS ................................................................... 12
Estimation approach .............................................................. 18
EMPIRICAL ANALYSIS .................................................................. 18
CONCLUSIONS .............................................................................. 21
REFERENCES ................................................................................ 36

5
INTRODUCTION
Internationally higher education ‘is moving from being a public good,
funded through governments, to a private good where more of the cost is
put on students and families’ (Kandiko and Blackmore 2010, p. 29). This
trend positions undergraduate higher education as a ‘marketable service’
sharing many characteristics with other professional services such as legal,
medical or financial services - i.e. their intangible nature, inseparability, and
extensive inter-activity between client and provider (Miozzo and Soete
2001). With this marketization comes competition, and the need for HEIs to
develop and maintain attractive programme portfolios which can help to
attract and retain strong faculty and fee-paying students. This requires
programme innovation – the development and implementation of new
programmes – and potentially the withdrawal of programmes which are
out-dated, unattractive or unviable. To date studies of programme
innovation have been case-based, focussing on the formulation of
organisational strategy in HEIs and the delivery of programme change
(Brennan et al. 2014; Kandiko and Blackmore 2010)1. Here, we provide an
alternative, quantitative, perspective identifying the drivers of programme
innovation and withdrawal across the UK university sector.
Our starting point is a recognition of the complex stakeholder pressures
and organisational objectives of universities (Jarzabkowski 2005), and the
inherently interactive and social nature of the innovation process in which
outcomes depend on the capabilities of those contributing to the process,
and the level and openness of interaction between actors (de Medeiros,
Ribeiro, and Cortimiglia 2014; Harrison and Leitch 2010). As such,
systemic perspectives provide a useful analytical framework in both the
commercial (de Zubielqui et al. 2015; Kauffeld-Monz and Fritsch 2013;
Trippl 2011) and higher education contexts (Brennan et al. 2014) of
examining innovation. Brennan et al. (2014, p. 37), for example, define a
1 As Perkmann et al. (2013, p. 431) suggest the result has been that ‘extant analyses have neglected to consider [innovations’] impact on educational output, such as time devoted to teaching, curriculum and programmes development, and teaching quality’.

6
higher education innovation system as ‘a sub-set of an [economy wide]
innovation system concentrated particularly in higher education institutions
(universities and associated research institutes, vocational training
institutions, master’s colleges, etc.), which are in close connection with
other institutional spheres, such as industry, government and non-
government agencies, and the society at large’. Here, we therefore
consider three main drivers of undergraduate programme innovation and
withdrawal: the financial performance of each HEI, engagement with
international markets and the extent of business engagement.
Our programme analysis is based on data provided by the Universities and
Colleges Admissions Service (UCAS), and draws on concepts from the
study of innovation in commercial organisations. We make three main
contributions. First, we develop a range of new quantitative indicators of
programme innovation and withdrawal in HEIs and use these metrics to
profile the main trends in UK HEIs’ programme innovation and withdrawal
over the last decade. Second, we use panel data econometric techniques
to examine the impact of financial performance, international engagement
and business engagement on programme innovation and withdrawal
across the UK higher education sector. Each turns out to play a significant
role in shaping some aspects of HEI’s undergraduate programme portfolio.
Finally, we consider separately levels of programme innovation and
withdrawal in the priority STEM and non-STEM programmes.
The remainder of the paper is organised as follows. Section 2 outlines our
conceptual framework and hypotheses focussing on the role of resources,
internationalisation and business engagement on programme innovation
and withdrawal. Section 3 describes our data which covers the period
2005-2013 and draws on information provided by UCAS and the Higher
Education Statistics Agency (HESA). Section 4 reports our empirical
analysis and Section 5 considers some of the strategic and systemic
implications of the findings.

7
CONCEPTUAL FRAMEWORK AND HYPOTHESES
Definitions of innovation vary, but generally in the context of ‘for profit’
enterprises the commercialisation of new knowledge or technology to
generate increased sales or value for consumers or related stakeholders is
stressed. The US Advisory Committee on Measuring Innovation, for
example, defines innovation as: ‘The design, invention, development
and/or implementation of new or altered products, services, processes,
systems, organisational structures or business models for the purpose of
creating new value for customers and financial returns for the firm’
(Advisory Committee on Measuring Innovation in the 21st Century
Economy 2008, p. i). Our focus here is on the introduction of new
programmes at an undergraduate level which may be attractive – offer
value – to students, and which may generate financial returns or strategic
or reputational benefits for universities (Schatzel, Calantone, and Droge
2001). We are also concerned here with the withdrawal or cancellation of
programmes, a subject which has received considerably less attention in
the management literature outside pharmaceuticals (Bunniran et al. 2009).
Both programme innovation and withdrawal are inherantly social and inter-
active processes, in which outcomes are dependent on the pressures on
the actors involved in the process, the capabilities of those contributing to
the process, and their level and openness of interaction (de Medeiros,
Ribeiro, and Cortimiglia 2014; Harrison and Leitch 2010). As a result, little
commonality emerges in innovation processes with heads of department in
leading universities adopting varied top-down and bottom-up mechanisms
to manage change (Gibbs et al. 2008). As Jarzabkowski (2005) outlines,
‘Curriculum change is often a contentious and political endeavour’ (p.26) as
a result of a complex stakeholder landscape (Jarzabkowski 2005) and a
frequent lack of agreement about objectives between academic and
administrative staff (McInnis 1998). Systemic perspectives which can
embody this diverse group of success factors for innovation processes
have proved valuable in both the commercial (de Zubielqui et al. 2015;
Kauffeld-Monz and Fritsch 2013; Trippl 2011) and higher education
contexts. The higher education system is an integral part of a wider

8
economy-wide innovation system comprising commercial, social and
political actors and institutional contexts (Brennan et al. 2014).
Beyond actors and institutional characteristics, innovation systems also
comprise ‘functions’ which, in the case of higher education, Brennan et al.
(2014) suggest can be identified as education, research and third mission
activities. Programme innovation and withdrawal are central to the
education function of the higher education innovation system, and may be
driven either by endogenous processes, factors outside the immediate
innovation system, or a complex combination both (Kandiko and Blackmore
2010).
At a systemic level, drivers of innovation in higher education may include
economic crises as witnessed during the 2008 global economic recession,
budget increases or cuts to the funding structure of higher education etc.
In recent years, many countries have replaced trust-based funding regimes
where universities automatically received a grant allocation from
government with little account of their output and outcomes, to
performance-based or competitive funding mechanisms (Geuna and
Martin, 2001; Conraths and Smidt, 2005; Orr et al 2007; Sorlin, 2007). The
rationale for this being that this leads to more efficient allocation of public
resources and creates diversity in the university sector (Sorlin, 2007).
In the UK, the adoption of a performance-based funding regime was
coupled in the 1990s with a greater emphasis on the inter-relatedness of
research and economic benefit and the realisation that differentiation
existed in the university sector (HM Treasury 2007). This ‘diversity of
excellence’ in the research base was described as distinguishing between
‘research universities focusing on curiosity-driven research, teaching and
knowledge transfer, and business-facing universities focusing on the
equally important economic mission of professional teaching, user-driven
research and problem-solving with local and regional companies’ (HM
Treasury 2007, p.5). In other words, research quality was a key
differentiating feature of heterogeneity in knowledge transfer strategies and
activities in the university sector. In terms of programmes being offered by

9
universities, government pressure to increase the economic benefit of
universities was evidenced in proposals to reduce support for arts-based
degree programmes (Kandiko and Blackmore 2010).
Aligned to changes in government funding priorities, at an organisational
level, factors such as the autonomy of a university can be a key
determinant of innovative activity (Brennan et al. 2014). Financial
stringency may be used by senior managers in universities as a pretext for
driving programme change: ‘Finance and marketing often provide the
motivation for change but may be part of an agenda that is not made
explicit, and is sometimes perceived to be hidden’ (Kandiko and Blackmore
2010, p.28). We therefore suggest that (Figure 1):
Hypothesis 1a: Stronger HEI financial performance will be
associated with reduced programme innovation rates;
Hypothesis 1b: Stronger HEI financial performance will be
associated with reduced programme withdrawal rates.
Sorlin (2007) argues that performance-based funding acts as an important
policy instrument in the allocation of resources to universities. Specifically,
through the use of metrics to measure deliverables and outputs, it allows
governments to invest more efficiently in R&D while also creating diversity
in the university sector. In the UK, a meritocratic funding system for higher
education, tends to reward successful research universities creating
differentiation in the university sector as the ‘existing research elite is
further reinforced and the status quo is maintained’ (Guena and Martin
2001, 28) through vertical differentiation with the potential for functional
specialization (Sorlin 2007). In other words, the effects of financial
performance on innovation activity will be greater where teaching is a
higher proportion of total university income. This leads to our second
hypothesis:
Hypothesis 2: The more important teaching income is in the
revenue mix of a university, the stronger the financial performance

10
effect on innovation and withdrawal rates.
Brennan et al. (2014) argue too that one of the key external forces on
higher education innovation has been pressures from the globalisation of
competition for students and faculty and the changing supply of, and
demand for, higher education 2 . For example, following McMahon et
al.(1992) analyses of the study choices of international students have
emphasised quality and reputational factors as the primary drivers of
institutional choice. Gatfield and Chen (2006), for example, analysed the
preferences of 518 Taiwanese students and suggested that UK universities
should ‘continue to emphasise and promote the high quality and reputation
of [their] educational services’ (2006, p.90)3. Similarly, Maringe and Carter
(2007, p. 460) investigated the preferences of African students studying in
the UK and argued that ‘a good understanding of students’ decision-
making processes creates a sound basis for developing curriculum
programmes that address the real rather than the perceived needs of this
group of scholars’. They explored the preferences of 28 African students
studying in England, and while the quality of UK higher education
qualifications was the primary ‘pull’ factor at the country level, the primary
institutional pull factor was programme availability (Mariange and Carter,
2007, Figure 1, p. 471). In the UK, based on a sample of 160
predominantly post-graduate students Wilkins et al. (2011) also found that
the factors most often identified as being “very important” in determining
their decision to study in the UK were quality of education, high
international league table rankings, employment prospects and
opportunities to improve English language skills. Students’ choice of
institution then depended most strongly on the reputation of a university,
2 In terms of programme innovation specifically we might also add the potential impact of initiatives such as the European Bologna Process although the impact of this remains ‘patchy’ across UK universities. See, for example, ‘UK must wake up to Bologna benefits, Times Higher Education Supplement, April 6, 2007. 3 Some other issues are perhaps more difficult to overcome, viz ‘according to the results from in-depth interviews, some Taiwanese people have the stereotype of the UK that it has a cloudy, snowy and cold winter, not an exciting place to live and with some personal safety problems’ (Gatfield and Chen, 2006, p. 90).

11
the quality of programme, rankings, programme content, and the reputation
of faculty.
In terms of the domestic environment for higher education, the removal of
the cap on domestic undergraduate student numbers announced in the UK
Autumn Statement in 2013 removed one major constraint on competition, a
trend which may be exacerbated if – as some have anticipated – the cap
on tuition fees is removed in future4. Interestingly, however, recent studies
have suggested that home students’ institutional choices are only weakly
linked to the level of tuition fees (Burge et al. 2014), or as one study put it,
there is little evidence that ‘student mobility is driven by economic
rationality’ (Wakeling and Jefferies 2013, p.510). Instead, what seems to
dominate students’ choices are quality – as reflected in student satisfaction
surveys - and employability. In Australia, Maazzarol et al. (2001), for
example, surveyed 828 domestic students and found that future
employment prospects were the primary factor governing institutional
choice followed by a range of factors linked to ‘resources and
programmes’.
This suggests that the incentives for effective programme innovation are
strong particularly where ‘national systems have become heavily
dependent on the recruitment of overseas students paying high fees in
order to sustain their internationally-focussed layer of universities’ (Kandiko
and Blackmore 2010, p.26). We therefore suggest that (Figure1):
Hypothesis 3a: Greater engagement with international markets will
be associated with increased innovation rates;
Hypothesis 3b: Greater engagement with international markets will
be associated with increased withdrawal rates;
4 Scott, P (2014) ‘End to cap on university student numbers clears path for private equity’, The Guardian, 4th March 2014. Available at: http://www.theguardian.com/education/2014/mar/04/george-osborne-fee-cap-policy-private-equity. Accessed 21st May 2015.

12
Alongside the marketization of UK universities’ teaching activities in recent
years there has also been a considerable development of third mission
activities related primarily to business engagement (Muscio, Quaglione,
and Vallanti 2015). These linkages create the potential for knowledge co-
creation and the more effective tailoring of university programmes to meet
industry needs, hence: as Kandiko and Blackmore (2010, p.27) found, ‘In
general, we found institutions that made successful change worked with
external agencies to gather opinions about curricula and graduate
attributes, feeding the ideas into the processes of change’. More recently
Plewa et al. (2015) investigated the role of five different forms of university-
business interaction on the design and delivery of university programmes
across a range of countries and concluded that ‘the instruments examined
in this study emerge as encouraging business to collaborate with HEIs in
the context of curriculum design and development, aimed at co-creating
value with the business community’ (Plewa et al., 2015, p. 46). Evidence
on this relationship is limited (Plewa et al, 2015) however based on these
findings we suggest that (Figure 1):
Hypothesis 4a: Greater engagement with business will be
associated with increased innovation rates;
Hypothesis 4b: Greater engagement with business will be
associated with increased withdrawal rates;
DATA AND METHODS
Our empirical analysis relates to the 2005 to 2013 period and is based on
data compiled from three main sources: programme data for each
individual degree programme was provided by UCAS; data on business
interaction by each HEI is taken from the HE-BCI survey; and, data on
institutions’ financial performance and market positioning was derived from
the Higher Education Statistics Agency (HESA) HEIDI database. Each is
described in turn.
Programme data: This was provided on a year-by-year basis for all
individual programmes offered through the UCAS system from 2005 to

13
2013. For each programme we were provided with a unique identifier,
programme title, the number of places accepted and the breakdown of
places accepted by UK, EU and non-EU applicants5. This data was collated
into a time series for each programme providing an indication of whether
programmes were in place for the whole of the 2005 to 2013 period or
whether they were newly introduced or withdrawn in each year during this
period6. Programme innovation we then define as the introduction of a new
programme by an HEI7. Programme withdrawal is when a programme is
dropped from the range of programmes provided by an individual HEI.
These individual time series for each programme were then aggregated to
provide time series for each institution. While the absolute number of
programme innovations and withdrawals may be interesting in its own right
we focus here on the innovation and withdrawal rates, both of which
provide an indication of the dynamism of the portfolio of programmes
offered by an institution normalised for institution size. If Iit is the number of
programme innovations made by institution i in period t, W it the number of
programme withdrawals and Pit the total number of programmes on offer by
institution I, then the innovation and withdrawal rate are defined as:
𝑰𝒏𝒏𝒐𝒗𝒂𝒕𝒊𝒐𝒏 𝒓𝒂𝒕𝒆𝒊𝒕 = 𝑰𝒊𝒕𝒙 𝟏𝟎𝟎
𝑷𝒊𝒕−𝟏
5 UCAS provides access to undergraduate programmes provided by both Higher Education and some Further Education providers. The Higher Education Statistics Agency identifies 164 Higher Education Providers in the UK (Source: https://www.hesa.ac.uk/component/heicontacts. Accessed: 10 April 2015) of which fifteen do not accept applications through UCAS either because they are specialist institutions and handle their own admissions (e.g. the Royal Northern College of Music, Open University) or because they are postgraduate only institutions (e.g. Cranfield, London Business School). Our analysis therefore covers 149 or 90.8 per cent of higher education providers in the UK, i.e. those engaged in the provision of undergraduate programmes and who accept applications through UCAS. In terms of the programmes on offer through UCAS this group of HE providers accounted for 90.1 per cent of all programmes on offer in 2013 (2006, 94.1 per cent) with the remainder being offered primarily by further education providers. 6 In a limited number of cases programmes accepted no applicants in year t but did have acceptances in years t-1 and t+1. In this situation the programme was said to be ‘in place’ throughout the t-1 to t+1 period. 7 A programme may be new-to-the-institution, having previously been provided elsewhere, or new-to-the-market, the first time a programme is introduced across the HEI sector.

14
𝑾𝒊𝒕𝒉𝒅𝒓𝒂𝒘𝒍 𝒓𝒂𝒕𝒆𝒊𝒕 = 𝑾𝒊𝒕𝒙 𝟏𝟎𝟎
𝑷𝒊𝒕−𝟏
On average over the 2005 to 2013 period HEIs’ average innovation rate
averaged 18.8 per cent while the withdrawal rate was marginally higher at
20.2 per cent (Table 1).
Within HEIs’ programme portfolios we make two other distinctions. First, we
distinguish between the innovation and withdrawal of STEM and non-
STEM programmes. Here, we use the JACs 3 programme coding to
allocate programmes to either the STEM or non-STEM categories8. On
average around 35.4 per cent of programmes were in STEM subjects
(Table 1). Second, we distinguish between single subject programmes,
those involving joint subjects and those which offer a major-minor
combination. Single subject programmes include traditional disciplinary
degrees (e.g. Zoology, Veterinary Science) but also more contemporary
additions such as Visual Communications, Web Technologies and Viking
Studies 9 . Joint subject programmes are those where two subjects are
named, where each one might be a single subject programme in its own
right, and where no prioritisation is implied in the programme name.
Examples would be: Sport and Physical Education, Business and
Management, Theology and Religious Studies. Finally, major-minor
programmes would be those where again each element of the degree
might be a single programme in its own right but where there is clearly a
primary discipline. Examples here would be: Zoology with Animal Ecology,
Theatre Studies with English Literature or Politics with History. Over the
2005 to 2013 period single subject courses accounted for around 53.5 per
cent of all undergraduate programmes on offer, 11.8 per cent were
major/minor combinations and the remainder joint programmes (Table 1).
8 Where degrees are joint or major/minor we base the allocation on the first named subject. So biology and French would be STEM while French and Biology would be categorised as non-STEM. 9 One limitation of this approach – and one which it is hard to overcome with our data – is the extent to which new programmes are inter-disciplinary focussing on specific topic areas. European Studies, for example, is generally an inherently inter-disciplinary degree programme but would be categorised in our data as a single-subject programme.

15
Financial performance data: To reflect the financial viability of the HEI
and the importance of teaching income as a source of revenue we
extracted three indicators from the Key Financial Indicators section of the
Higher Education Information Database for Institutions (HEIDI) database
run by the Higher Education Statistics Agency. These are: the percentage
ratio of tuition fees & education contracts to total income (%); the
percentage ratio of historical surplus/(deficit) for the year after taxation to
total income (%); and the ratio of current assets to liabilities.
External market engagement: We measure HEIs’ engagement with
international markets using the percentage of non-EU students accepting
places in each year. This is derived from the UCAS data.
Business engagement: This is measured using two indicators derived
from the Higher Education – Business and Community Interaction Survey
(HE-BCI) database which is the main source of information on knowledge
exchange activities in UK universities. Collected by HESA this is an annual
and mandatory survey of all UK Universities and therefore provides a
comprehensive profile of engagement activities 10 . The survey provides
information on specific interactions with external partners, such as contract
and collaborative research, consultancy, continuing professional
development and intellectual property. We derive two measures from the
HE-BCI survey designed to reflect the breadth of university-business
interaction. In each case measures from the HE-BCI survey are normalised
by the number of academic staff in the institution. The two measures are:
income from research contracts with business per academic staff employee
and income from facilities and equipment contracts per academic staff
employee.
10 https://www.hesa.ac.uk/index.php?option=com_studrec&Itemid=232&mnl=14032

16
Control variables: Three groups of time-variant control variables are
included in the estimation. First, it is often argued that organisations with
more diverse staff composition may be more likely to innovate (Konnola,
Brummer, and Salo 2007; Ostergaard, Timmermans, and Kristinsson 2011;
Winkler and Bouncken 2011). We therefore include three indicators to
represent the diversity of university staff based on categorical breakdowns
of staff by age band, ethnicity and gender derived from the HEIDI
database. In each case we construct Blau indices where p is the
proportion of staff in a category and N is the number of categories (Blau
1977) :
𝐵 = 1 − ∑ 𝑝𝑖2
𝑁
𝑖=1
Higher values of the Blau indices occur when staff are divided equally
between either age, gender or ethnicity groups suggesting greater
diversity. Second, we include four measures intended to control for the
resource base of the HEI: an indicator of the overall size of the HEI (log
employment), a measure which is standardly used in studies of innovation
as a proxy for corporate resources (Jordan and O’Leary 2007); a staff-
student ratio derived from the HEIDI database; and two indicators of the
(log) number of academic staff and number of students per programme11.
Third, recognising that levels of programme innovation and withdrawal may
also vary between different subject groups we also include variables
representing the share of programmes in STEM subjects and those which
are either single subject or major/minor combinations. Each of these
variables was derived from the UCAS programme data.
In addition to these time-variant controls we also include a number of time
invariant controls intended to reflect other aspects of HEIs’ profile. We
include a set of locational variables which will capture policy differences
between the home nations. We also include variables which identify the
11 In each case staff and student numbers were derived from the HEIDI database. The number of programmes per institution is taken from the UCAS data.

17
mission groups to which individual HEIs belong12. Here we consider three
mission groups:
The Russell Group (www.russellgroup.ac.uk) is a consortium of
(now) 24 research intensive universities including Oxford,
Cambridge, Imperial, Queen’s Belfast and most recently Durham
and York;
The University Alliance (www.unialliance.ac.uk/member) is a group
of 20 universities most of which were established in the post-1992
period. The grouping includes universities such as Manchester Met,
Coventry, Greenwich and Huddersfield.
The Million+ (www.millionplus.ac.uk) formerly the Campaign for
Mainstream Universities (CMU) represents 17 universities
established since 1992 including London South Bank, the University
of the West of England and Abertay University.
The remaining universities have no established mission group alliances
and form the reference group in our analysis.
12 ‘The mission groups ... are a product of the desire of different self-identified groups of universities to express policy positions that they believe will enhance the welfare of their own members (although invariably making their case with reference to the general welfare of the higher education system) and to lobby to achieve their implementation. (Filippakou and Tapper 2015, p. 123).
18
Estimation approach
Our data forms a balanced panel from 2006 to 2013 and we therefore use
panel data estimation approaches. Our dependent variables – the
innovation and withdrawal rates – are percentages, and panel tobit models
with lower limits are therefore appropriate. We therefore report panel tobit
estimates with random effects designed to capture the full population
effect. For robustness we also report panel regressions with both random
and fixed effects, with the latter intended to capture specific institutional
effects. In all models we include a lagged dependent variable and all
independent variables are all lagged one year to eliminate any issues of
reverse causality.
EMPIRICAL ANALYSIS
The total number of undergraduate programmes on offer from UK HEIs has
fallen steadily over the last decade peaking at over 17,500 in 2006 and
falling below 14,500 in 2013, a fall of around 7.4 per cent relative to 2005
(Figure 1). Around 1:5 programmes are newly introduced or withdrawn
each year (Figure 2) with the withdrawal rate running ahead of the
innovation rate from 2010 to 2012 (Figure 3). The largest number of
individual programmes on offer in 2013 was from Manchester Metropolitan
University (316) with a number of other universities offering more than two
hundred separate programmes (Kingston, 229; Leeds, 229; Edinburgh,
218; Manchester, 218; Central Lancs, 211 and Kent, 203). The mean
number of programmes offered per institution was 98.9 (SD=60.6).
Interestingly – and perhaps counter-intuitively given the focus of UK public
support on STEM subjects – the number of STEM and non-STEM
programmes on offer have experienced a very similar time profile over the
last decade (Figure 4). The proportion of STEM programmes on offer has
only increased marginally from 36.7 per cent in 2005 to 37.5 per cent by
2013 with most of this increase coming prior to 2008. Innovation and
withdrawal rates for each type of programme have also been similar, with
withdrawals running ahead of innovation in most recent years (Figure 6).
As a result there has been little change in the STEM/Non-STEM mix of

19
programmes with the number of both declining slightly in recent years.
Models for the innovation and withdrawal rates for all programmes are
given in Table 2. For both the innovation rate and withdrawal rate we
present three models for robustness: a panel tobit estimator with random
effects, a panel regression with random effects and a panel regression with
fixed effects for each institution. All models include a lagged dependent
variable and year dummies as well as the range of control variables
described earlier. Hypothesis 1 suggests that where an HEI is in a stronger
financial position this might reduce the impetus to make costly programme
innovations or withdrawals. For all programmes we find strong support for
both hypothesis H1a (innovation rates) and H1b (withdrawal rates) across
each of the different model specifications (Table 2).
Looking more specifically at STEM and non-STEM programmes suggests a
slightly more complex picture with a stronger financial position having its
most significant effects on reducing withdrawal rates for STEM
programmes and – in the fixed effects models at least – on reducing the
introduction of non-STEM programmes (Tables 3 and 4). Table 6 provides
a summary of the key results. The implication is of a strong link between
financial stringency and programme innovation and withdrawal: When UK
universities are in a stronger financial position rather than encouraging
programme innovation this has a negative effect. Conversely, financial
stringency drives both programme innovation and withdrawal.
Hypothesis 2 suggests that the link between financial well-being or
stringency and the innovation and withdrawal rates will be stronger where
teaching income is a more important source of revenue for the institution.
We again find strong support for this hypothesis for all programmes (Table
2) and non-STEM programmes (Table 4). The effect on STEM programmes
is weaker but takes the same sign. The effect of any given level of financial
stringency on HEIs’ programme innovation will therefore vary dependent on
the institution’s revenue profile. For example across our sample,
universities in the Russell Group derived 26.2 per cent of their income from
teaching compared to an average of 38.0 per cent for all other universities.

20
The implication being that financial stringency will have a stronger impact
on both innovation and withdrawal rates in non-Russell Group universities.
Reflecting other evidence that internationalisation can be a spur to
innovation (Boso et al. 2013; Chen 2012; Golovko and Valentini 2011;
Roper and Love 2002) Hypothesis 3 suggests that internationalisation will
have a positive stimulus on innovation and withdrawal rates. Again we find
strong support for this hypothesis in terms of all (Table 2), STEM (Table 3)
and non-STEM (Table 4) programmes. On average across our sample of
universities non-EU students accounted for 13.1 per cent of accepted
places in Russell Group universities and 4.8 per cent elsewhere suggesting
that internationalisation will be a more important driver of programme
innovation and withdrawal rates in Russell Group institutions 13 . It is
important to acknowledge, however, that within both the Russell Group and
other universities there is wide variation in the proportion of non-EU
students14.
Our final hypothesis, reflecting the increasing importance of third mission
activity and university-business engagement, suggests that the greater
university engagement with business the higher will be innovation and
withdrawal rates. Here, we find strongly contrasting results between
different types of university-business engagement. Contract research has
the anticipated positive sign: greater the university’s level of contract
research income the higher are levels of programme innovation and
withdrawal (Table 6). However, where universities are engaged in facilities
and equipment contracts with businesses this has a strong and
unanticipated negative effect on programme innovation and withdrawal.
Both business engagement effects are consistent across all programmes
(Table 2), STEM and non-STEM programmes (Tables 3 and 4). Two
potential – and non-exclusive - explanations are possible for the observed
13 These figures are based on the number of places accepted by non-EU students through the UCAS system. They do not include places offered directly from any universities and may therefore under-estimate the share of non-EU students 14 The coefficient of variation in terms of the share of accepted places by non-EU students for the Russell Group universities is 0.67 while that for other universities is 1.26.
21
negative effect of facilities and equipment contracts. First, it may be that
these contracts act as a distraction for staff leading to lower levels of
engagement with programme innovation and withdrawal. Another, perhaps
more plausible, interpretation is that these contracts are a source of
additional revenue for departments and may be reducing the pressure for
programme innovation and withdrawal.
While the value of facilities and equipment contracts is broadly similar
among the Russell Group and other universities, the Russell Group
universities have a level of contract research income from business (per
academic employee) which is four times as high as that of other
universities. The positive influence of university-business engagement on
innovation and withdrawal rates is therefore likely to be much stronger for
Russell Group universities with more uniformity to the negative effect of
facilities and equipment contracts.
CONCLUSIONS
A key function of universities is the provision of under-graduate education.
The increasing marketization of higher education requires that to remain
attractive to potential students and faculty, HEIs have to update and
change their portfolio of programmes. Here, we believe for the first time, we
adopt a quantitative approach to investigate the drivers of programme
innovation and withdrawal in the university sector. Five key empirical
results follow which prove broadly consistent across the STEM and non-
STEM subject areas. First, financial stringency stimulates both programme
innovation and withdrawal. That is, universities which are facing greater
financial pressures are more likely to introduce new programmes and drop
programmes from their undergraduate portfolio. Second, this financial
stringency effect is stronger where universities are more dependent on
teaching income. Third, internationalisation – and therefore a need to
appeal to international students – is a spur to both programme innovation
and withdrawal. Fourth, business engagement through contract research
increases programme innovation while engagement through facilities and

22
equipment contracts has the opposite effect.
Over the period covered by our estimation (2007-13) the number of study
programmes on offer to undergraduates in the UK fell markedly (Figure 2).
This is consistent with an increasingly difficult funding climate for higher
education and the consequent rationalisation of programmes which has
seen higher withdrawal than innovation rates (Figure 3). Two factors seem
likely to have offset this general trend – internationalisation and the
development of greater third mission activity through contract research for
businesses. An exacerbating factor has been an increase in the importance
of facilities and equipment contracts.
The strength of these effects is likely to be uneven across the UK university
sector. Financial effects prove more important where teaching represents a
greater proportion of an institution’s revenue – a characteristic of less
research intensive universities (Hewitt-Dundas, 2012). Conversely,
internationalisation and business engagement (through research contracts)
are likely to be more important drivers of programme innovation and
withdrawal in more strongly internationalised and research oriented
universities. The implication is that the key drivers of programme innovation
and withdrawal are likely to differ between institutions in a rather
predictable pattern.
At a systemic level our results suggest that trends towards
internationalisation and greater business engagement are having a
significant influence on the nature of the undergraduate programmes on
offer in the UK. These effects therefore go beyond the well-recognised
impacts on the content or delivery modes of particular programmes to
influence the subject focus of the programmes themselves (Brennan et al.
2014). The implication is that both the globalisation of under-graduate
higher education and the increasing importance of third mission activity are
re-shaping the UK university sector with a particularly strong impact on the
more research intensive universities. This creates potentially conflicting
pressures on HEIs’ programme offerings and raises potentially significant
structural issues. In terms of globalisation, HEIs’ reshaping of their

23
programme portfolios increases their exposure to the uncertainty
associated with international student demand. In terms of business
engagement, a move towards more ‘business friendly’ programmes would
be welcomed by many but may raise pedagogic issues related to the depth
of disciplinary training.
At a strategic level our study emphasises the complexity of influences
which shape university agendas (Jarzabkowski 2005). Changes in under-
graduate programmes are influenced by internal resource availability and
the priority given to teaching by each institution. They are also importantly
influenced by other elements of the higher education innovation eco-
system (Brennan et al. 2014), through links to international markets and
businesses. The latter link in particular emphasises the value of adopting a
systemic approach to HEI innovation, and the legacy effects of activities
such as collaborative research with businesses and facilities and
equipment contracts (Muscio, Quaglione, and Vallanti 2015). This
emphasises the importance of the governance arrangements covering
such interactions and institutions’ ability to capture the potential learning
from such relationships for subsequent programme development (Geuna
and Muscio 2009; Young et al. 2008).
Our study is subject to a number of limitations, some of which suggest
interesting avenues for further research. First, our study is limited to the UK
and inevitably therefore reflects national policy and institutional
specificities. International replication has obvious potential. Second, our
study is confined to under-graduate programmes while arguably the area of
most innovative activity in the HE sector in recent years has been at the
post-graduate level. Extending the type of analysis conducted here to look
at the influences on innovation in specialist masters programmes would be
a valuable next step but, for the UK at least, would be complex
operationally due to the lack of any co-ordinated student application
system. Finally, at present the range of innovation and programme
withdrawal indicators we use is relatively limited and does not reflect the
revenue impact of programme changes on each institution. Extending the
existing study to explore the revenue implications of programme innovation

24
and withdrawal is an obvious next step reflecting standard measures of the
impact of innovation on business revenues and the entire innovation value
chain in higher education (Roper and Arvanitis 2012; Hansen and
Birkinshaw 2007; Ganotakis and Love 2012).

25
Figure 1: Conceptual framework
Programme Portfolio
Programme Withdrawl
Programme Innovation
Financial Performance
International marketEngagement
Business Engagement
H3b
H4b
H3a
H4a
H1a H1b
Revenue share from teaching
programmes
H2H2

26
Figure 2: Total number of programmes offered by UK HEIs
Source: UCAS, Authors’ analysis
Figure 3: Number of new and withdrawn programmes by HEIs
Source: UCAS, Authors’ analysis

27
Figure 4: Innovation and withdrawal rates (%)
Source: UCAS, Authors’ analysis
Figure 5: Provision of STEM and non-STEM programmes
Source: UCAS, Authors’ analysis

28
Figure 6: Innovation and Withdrawal rates: STEM and non-STEM
programmes
A. Innovation and Withdrawal rates – STEM programmes
B. Innovation and Withdrawal rates – Non-STEM programmes

29
Table 1: Panel data descriptives
Variable Number of
observations Mean Std. Dev
Innovation rate (%) 1028 18.820 13.237
Withdrawal rate (%) 1028 20.160 11.219
Asset to liability ratio 984 1.780 1.232
Teaching (% of income) 984 38.796 14.295
Non-EU students (%) 874 6.512 7.617 Business research contract income (£000) 967 1.620 4.338
F&E contracts revenue (£000) 967 0.501 1.314
Control variables
University size (employment, log) 990 6.633 1.090
Staff-student ratio (log) 987 2.846 0.305
Russell Group university 1028 0.163 0.370
University Alliance member 1028 0.136 0.343
Million+ member 1028 0.116 0.320
English university 1028 0.804 0.398
Scottish university 1028 0.115 0.319
Northern Ireland university 1028 0.020 0.142
Faculty per programme (log) 1007 2.314 0.726
Students per programme (log) 1007 4.429 0.688
STEM subject programmes (%) 1000 35.380 17.227
Single subject programmes (%) 938 53.535 12.685
Major-minor programmes (%) 938 11.827 9.632
Age diversity of staff 990 0.878 0.007
Gender diversity of staff 990 0.489 0.013
Ethnic diversity of staff 990 0.167 0.109
Notes and sources: See text for variable definitions and sources of individual variables. Sources: UCAS, HE-BCI Survey, HESA HEIDI database.

30
Table 2: Modelling innovation and withdrawal rates for all programmes
Innovation Rate Withdrawal Rate
Panel Tobit RE
Panel OLS RE
Panel OLS FE
Panel Tobit RE
Panel OLS RE
Panel OLS FE
Innovation rate (-1) -0.035 0.019 -0.114*** (0.030) (0.027) (0.035) Withdrawal rate (-1)
0.055 0.114*** -0.074**
(0.038) (0.030) (0.036)
Asset to liability ratio -2.346 -1.812 -4.112** -3.230*** -2.866** -2.815**
(1.524) (1.478) (1.640) (1.211) (1.186) (1.413)
Teaching (%) -0.065 -0.043 -0.077 -0.181** -0.168** -0.145
(0.103) (0.091) (0.159) (0.079) (0.073) (0.137)
Teaching x A. to ratio 0.037 0.027 0.075* 0.056* 0.048 0.069*
(0.039) (0.038) (0.041) (0.031) (0.031) (0.035)
Non-EU students (%) 0.099 0.032 0.324** -0.112 -0.102 -0.038
(0.100) (0.084) (0.146) (0.074) (0.067) (0.125)
Business research contracts 0.872*** 0.760*** 1.175*** 0.698*** 0.613*** 1.152***
(0.278) (0.238) (0.448) (0.215) (0.192) (0.376)
F&E contract income -0.994** -0.860** -3.008*** -1.464*** -1.287*** -2.842***
(0.498) (0.414) (0.857) (0.384) (0.335) (0.735) University size (employment, log) -0.312 -0.217 -39.213*** 1.689** 1.285** 5.024
(1.014) (0.796) (6.142) (0.746) (0.642) (5.339)
Staff-student ratio (log) -8.326*** -7.058*** -5.44 -2.777 -2.804 -0.747
(2.947) (2.624) (3.881) (2.227) (2.083) (3.285)
Russell Group university -5.702*** -4.425*** -4.680*** -4.237*** (2.009) (1.537) (1.474) (1.248) University Alliance member -1.714 -1.418 -0.441 -0.174 (1.674) (1.294) (1.232) (1.042) Million+ member 2.538 2.282* 2.387* 2.253** (1.698) (1.316) (1.253) (1.063) England -5.058** -4.045** -0.927 -0.853 (2.338) (1.823) (1.713) (1.467) Scotland -6.291** -4.871** -1.546 -1.301 (2.741) (2.122) (2.006) (1.712) Northern Ireland -9.749** -6.336* -2.06 -0.78 (4.251) (3.235) (3.084) (2.602) Faculty per programme (log) -4.152* -3.002 44.608*** -3.070* -2.602* -10.106
(2.304) (1.915) (7.599) (1.687) (1.500) (6.565)
Students per programme (log) 1.966 -1.261 1.87 -6.842*** -6.546*** -2.784
(2.903) (2.259) (6.660) (2.025) (1.813) (5.774)
SEM programmes (%) -0.089** -0.084** -0.043 -0.071** -0.061** -0.07
(0.043) (0.034) (0.132) (0.032) (0.028) (0.114)
Single subject programmes (%) -0.045 -0.042 -0.258** -0.083** -0.080** -0.191*
(0.050) (0.041) (0.117) (0.038) (0.033) (0.101)
Major-minor programmes (%) 0.099* 0.097** 0.03 0.154*** 0.121*** 0.454***
(0.054) (0.045) (0.091) (0.043) (0.037) (0.079)
Age diversity index 46.138 36.057 -129.574 29.525 25.782 67.565
(78.903) (67.290) (123.888) (60.339) (54.249) (106.592)
Gender diversity index -162.595*** -145.769*** -224.184* -92.971** -86.941** -93.713
(53.331) (43.180) (124.057) (39.851) (34.779) (106.585)
Ethnic diversity index 0.822 1.557 -28.451 9.165* 9.142** -45.004**
(6.406) (5.047) (24.967) (4.729) (4.059) (21.547)
N 833 833 833 833 833 833
chi2 159.011 205.383
287.468 355.694 bic 6426.49 . 6039.733 6087.329 . 5794.339
Notes and Sources: See text for variable definitions and sources. Marginal effects are
reported. All models include year dummies. * denotes p<0.10; ** p<0.05 and *** p<0.01.

31
Table 3: Innovation and withdrawal rates for STEM programmes
Innovation Rate Withdrawal Rate
Panel Tobit RE
Panel OLS RE
Panel OLS FE
Panel Tobit RE
Panel OLS RE
Panel OLS FE
Innovation rate (-1) -0.018 -0.023* -0.071*** (0.014) (0.013) (0.025) Withdrawal rate (-1)
0.016 0.057* -0.129***
(0.045) (0.034) (0.040)
Asset to liability ratio -4.09 -3.036 -0.701 -3.773* -3.341* -4.129*
(2.570) (2.473) (2.708) (1.965) (1.825) (2.282)
Teaching (%) -0.115 -0.074 0.157 -0.199* -0.177* -0.158
(0.153) (0.153) (0.232) (0.116) (0.104) (0.196)
Teaching x A. to ratio 0.086 0.062 0.037 0.086* 0.075 0.089
(0.065) (0.062) (0.066) (0.050) (0.046) (0.056)
Non-EU students (%) 0.069 0.099 0.134 -0.092 -0.073 -0.124
(0.139) (0.141) (0.208) (0.105) (0.093) (0.175)
Business research contracts 0.793** 0.794** 0.89 0.602** 0.535** 0.929*
(0.390) (0.397) (0.707) (0.297) (0.262) (0.524)
F&E contract income -0.424 -0.435 -3.596*** -1.405*** -1.279*** -3.008***
(0.680) (0.710) (1.251) (0.526) (0.456) (1.022)
University size (employment, log) -0.066 -2.201 -62.758*** 3.300*** 1.604* 11.223
(1.391) (1.437) (8.853) (1.062) (0.889) (7.507)
Staff-student ratio (log) -11.675*** -12.314*** -15.233** -0.48 -0.486 2.067
(4.392) (4.332) (6.018) (3.164) (2.867) (4.620)
Russell Group university -5.375** -5.553** -4.945** -4.216** (2.641) (2.814) (2.014) (1.707) University Alliance member -4.024* -3.354 -4.603*** -3.764*** (2.207) (2.382) (1.695) (1.431) Million+ member 2.581 2.385 1.663 1.304 (2.262) (2.440) (1.711) (1.464) England -5.644* -5.707* 1.672 1.963 (3.109) (3.311) (2.333) (2.009) Scotland -8.017** -8.018** -2.073 -1.552 (3.610) (3.871) (2.747) (2.349) Northern Ireland -15.066*** -14.935** -1.717 -0.364 (5.712) (5.944) (4.235) (3.577) Faculty per programme (log) -6.950** -4.345 66.543*** -5.261** -2.803 -16.440*
(3.262) (3.343) (11.039) (2.378) (2.061) (9.294)
Students per programme (log) 3.716 5.347 0.844 -7.384*** -7.465*** 5.834
(4.043) (3.913) (9.627) (2.838) (2.488) (8.120)
SEM programmes (%) -0.108* -0.174*** -1.308*** 0.091** 0.037 0.697***
(0.061) (0.062) (0.191) (0.045) (0.038) (0.163)
Single subject programmes (%) -0.117 -0.111 -0.676*** -0.065 -0.041 -0.233
(0.071) (0.073) (0.172) (0.054) (0.046) (0.144)
Major-minor programmes (%) 0.092 0.098 0.023 0.011 0.017 0.119
(0.077) (0.080) (0.135) (0.059) (0.051) (0.114)
Age diversity index -2.125 3.355 -119.381 85.096 73.796 59.165
(110.496) (113.813) (178.847) (84.736) (74.819) (150.353)
Gender diversity index -112.974 -96.696 -96.144 -57.564 -39.426 -119.369
(74.561) (78.246) (188.427) (57.078) (49.007) (156.479)
Ethnic diversity index -1.137 -0.621 -63.538* 6.821 6.981 -23.689
(8.703) (9.271) (35.967) (6.561) (5.625) (30.285)
N 819 819 819 819 819 819
chi2 105.92 104.499
143.762 153.258 bic 6693.366 . 6519.484 6311.104 . 6239.423
Notes and Sources: See text for variable definitions and sources. Marginal effects are reported. All models include year dummies. * denotes p<0.10; ** p<0.05 and *** p<0.01.

32
Table 4: Innovation and withdrawal rates for Non-STEM programmes Innovation Rate Withdrawal Rate
Panel Tobit RE
Panel OLS RE
Panel OLS FE
Panel Tobit RE
Panel OLS RE
Panel OLS FE
Innovation rate (-1) --0.096** -0.001 -0.181*** (0.038) (0.033) (0.036) Withdrawal rate (-1)
0.051 0.120*** -0.044
(0.038) (0.032) (0.037)
Asset to liability ratio -3.103* -2.375 -5.522*** -4.035*** -3.794*** -2.617
(1.804) (1.728) (1.921) (1.433) (1.397) (1.639)
Teaching (%) -0.105 -0.063 -0.175 -0.237** -0.227*** -0.171
(0.123) (0.106) (0.187) (0.095) (0.086) (0.159)
Teaching x A. to ratio 0.049 0.037 0.098** 0.070* 0.066* 0.062
(0.046) (0.044) (0.048) (0.037) (0.036) (0.041)
Non-EU students (%) 0.122 0.05 0.449*** -0.125 -0.106 -0.032
(0.119) (0.098) (0.171) (0.090) (0.079) (0.145)
Business research contracts 0.963*** 0.921*** 0.864* 0.929*** 0.824*** 1.152***
(0.333) (0.279) (0.514) (0.260) (0.227) (0.439)
F&E contract income -1.286** -1.067** -3.224*** -1.899*** -1.726*** -2.550***
(0.601) (0.485) (0.998) (0.462) (0.396) (0.854)
University size (employment, log) -0.321 -0.346 -34.170*** 1.403 0.924 8.842
(1.227) (0.932) (7.208) (0.907) (0.756) (6.176)
Staff-student ratio (log) -8.624** -7.959*** -1.289 -4.033 -3.909 -2.323
(3.437) (3.045) (4.493) (2.669) (2.456) (3.815)
Russell Group university -6.948*** -5.341*** -5.127*** -4.653*** (2.435) (1.804) (1.797) (1.471) University Alliance member -0.258 0.212 2.223 2.249* (2.031) (1.515) (1.508) (1.229) Million+ member 2.952 2.682* 3.651** 3.315*** (2.058) (1.542) (1.539) (1.254) England -5.708** -4.904** -2.748 -2.795 (2.811) (2.134) (2.096) (1.733) Scotland -4.866 -3.58 -2.203 -2.168 (3.302) (2.484) (2.451) (2.018) Northern Ireland -9.692* -6.117 -2.607 -1.03 (5.110) (3.783) (3.768) (3.064) Faculty per programme (log) -4.095 -3.002 44.323*** -2.295 -2.005 -12.661*
(2.711) (2.211) (8.896) (2.037) (1.770) (7.611)
Students per programme (log) 2.141 -0.707 1.758 -7.839*** -6.882*** -5.305
(3.337) (2.637) (7.820) (2.462) (2.136) (6.690)
SEM programmes (%) -0.05 -0.062 0.522*** -0.088** -0.066** -0.487***
(0.053) (0.041) (0.156) (0.040) (0.033) (0.133)
Single subject programmes (%) -0.058 -0.069 -0.155 -0.109** -0.110*** -0.103
(0.061) (0.048) (0.137) (0.046) (0.039) (0.117)
Major-minor programmes (%) 0.149** 0.133** 0.173 0.203*** 0.156*** 0.526***
(0.065) (0.053) (0.107) (0.052) (0.043) (0.091)
Age diversity index 21.083 -0.073 -203.447 -26.784 -35.703 81.323
(94.667) (78.883) (145.450) (72.922) (63.970) (123.723)
Gender diversity index -189.771*** -160.808*** -161.706 -124.571** -119.828*** -105.424
(64.542) (50.729) (145.219) (48.448) (41.032) (123.698)
Ethnic diversity index -0.187 1.388 -42.946 9.908* 10.253** -52.684**
(7.747) (5.896) (29.300) (5.772) (4.782) (25.004)
N 832 832 832 832 832 832
chi2 116.885 151.53
256.042 329.705 bic 6642.09 . 6298.516 6336.379 . 6034.332
Notes and Sources: See text for variable definitions and sources. Marginal effects are reported. All models include year dummies. * denotes p<0.10; ** p<0.05 and *** p<0.01.

33
Table 5: Symbolic summary of key results Hypothesis Anticipated
Sign All
Programmes STEM
Programmes Non-STEM
Programmes
Innovation rates H1a: Finance - - (-) - H2a: Teaching share + + (+) + H3a: Internationalisation + + (+) + H4a: Business engagement: contract research/consultancy
+ + (+) +
H4a: Business engagement: F&E contracts
+ - - -
Withdrawal rates H1b: Finance - - - (-) H2b: Teaching share + + (+) (+) H3b: Internationalisation + (-) (+) (-) H4a: Business engagement: contract research/consultancy
+ + + +
H4a: Business engagement: F&E contracts
+ - - -

34
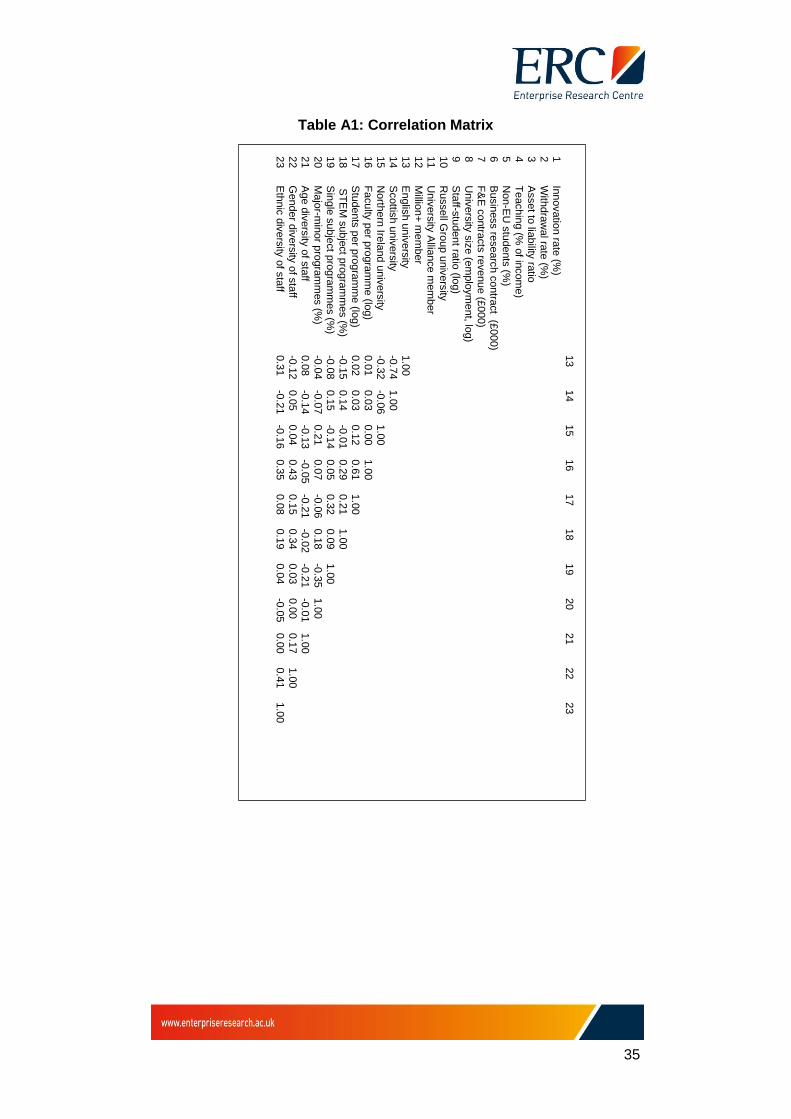
Table A1: Correlation Matrix
1
2
3
4
5
6
7
8
9
10
11
12
1
Innovatio
n ra
te (%
) 1.0
0
2
With
dra
wal ra
te (%
) 0.5
2
1.0
0
3
Asset to
liability
ratio
-0
.04
-0
.10
1.0
0
4
Te
achin
g (%
of in
com
e)
0.0
9
0.0
0
0.1
9
1.0
0
5
Non-E
U s
tudents
(%)
-0.1
0
-0.1
5
-0.1
8
-0.1
2
1.0
0
6
Busin
ess re
searc
h c
ontra
ct (£
000) -0
.07
0.0
6
-0.1
3
-0.3
3
0.1
6
1.0
0
7
F&
E c
ontra
cts
revenue (£
000)
-0.0
9
-0.1
1
-0.1
0
-0.1
0
0.0
4
0.3
6
1.0
0
8
Univ
ers
ity s
ize (e
mp
loym
ent, lo
g)
-0.1
6
-0.1
8
-0.2
4
-0.1
2
0.4
6
-0.0
2
-0.0
7
1.0
0
9
Sta
ff-stu
dent ra
tio (lo
g)
0.0
8
0.0
3
0.2
2
0.2
0
-0.4
3
0.0
8
0.3
8
-0.5
3
1.0
0
10
Russell G
roup u
niv
ers
ity
-0.1
7
-0.2
1
-0.1
2
-0.4
0
0.4
6
0.2
6
0.0
4
0.5
5
-0.4
3
1.0
0
11
Univ
ers
ity A
lliance m
em
ber
-0.0
8
-0.0
5
0.0
9
0.2
4
-0.2
0
-0.1
3
-0.0
9
0.1
3
0.1
3
-0.2
2
1.0
0
12
Millio
n+
me
mb
er
0.0
9
0.0
9
0.0
8
0.1
8
-0.2
2
-0.1
3
-0.1
1
-0.2
0
0.1
8
-0.1
9
-0.1
7
1.0
0
13
Englis
h u
niv
ers
ity
0.0
0
-0.0
3
0.0
3
0.3
8
0.0
8
-0.2
0
0.0
0
0.1
0
-0.0
5
0.0
3
0.1
2
0.0
2
14
Scottis
h u
niv
ers
ity
-0.0
2
0.0
2
-0.1
2
-0.3
7
0.0
0
0.2
6
0.0
6
-0.0
9
0.0
5
-0.0
5
-0.1
6
0.0
7
15
North
ern
Irela
nd u
niv
ers
ity
-0.0
6
-0.0
5
0.1
6
-0.1
6
-0.1
2
-0.0
1
0.0
0
-0.0
9
0.0
0
0.0
6
-0.0
7
-0.0
6
16
Fa
culty
per p
rogra
mm
e (lo
g)
-0.2
5
-0.2
6
-0.1
7
-0.2
7
0.6
3
0.1
1
-0.0
6
0.7
0
-0.6
3
0.6
3
-0.1
4
-0.2
7
17
Stu
dents
per p
rogra
mm
e (lo
g)
-0.3
3
-0.2
8
0.0
2
-0.1
2
0.1
1
0.2
1
-0.0
2
0.3
5
-0.1
4
0.4
0
0.0
8
-0.0
7
18
ST
EM
subje
ct p
rogra
mm
es (%
) -0
.16
-0
.10
-0.2
5
-0.2
6
0.2
2
0.2
3
0.1
5
0.4
3
-0.2
3
0.3
1
0.0
9
-0.0
5
19
Sin
gle
subje
ct p
rogra
mm
es (%
) -0
.16
-0
.13
0.0
1
0.1
1
-0.0
7
0.0
1
0.0
4
-0.0
4
0.1
5
-0.1
7
0.1
4
0.2
0
20
Ma
jor-m
inor p
rogra
mm
es (%
) 0.0
2
0.0
0
0.2
0
-0.1
9
0.1
4
0.0
7
0.0
0
0.1
1
-0.1
1
0.2
1
-0.0
2
-0.0
6
21
Age d
ivers
ity o
f sta
ff 0.0
6
0.0
8
-0.0
9
0.1
3
-0.1
5
-0.1
9
-0.0
4
0.1
5
-0.1
1
-0.1
4
0.1
0
-0.1
4
22
Gender d
ivers
ity o
f sta
ff -0
.20
-0
.18
-0.2
1
-0.1
3
0.3
9
0.1
0
0.0
7
0.5
4
-0.2
7
0.3
0
0.0
8
-0.1
0
23
Eth
nic
div
ers
ity o
f sta
ff -0
.06
-0
.06
-0.1
3
0.2
6
0.4
2
-0.0
2
0.0
2
0.3
8
-0.2
2
0.1
4
-0.0
5
0.0
7
35
Table A1: Correlation Matrix
13
14
15
16
17
18
19
20
21
22
23
1
Innovatio
n ra
te (%
)
2
With
dra
wal ra
te (%
)
3
Asset to
liability
ratio
4
Te
achin
g (%
of in
com
e)
5
Non-E
U s
tudents
(%)
6
Busin
ess re
searc
h c
ontra
ct (£
000)
7
F&
E c
ontra
cts
revenue (£
000)
8
Univ
ers
ity s
ize (e
mp
loym
ent, lo
g)
9
Sta
ff-stu
dent ra
tio (lo
g)
10
Russell G
roup u
niv
ers
ity
11
Univ
ers
ity A
lliance m
em
ber
12
Millio
n+
me
mb
er
13
Englis
h u
niv
ers
ity
1.0
0
14
Scottis
h u
niv
ers
ity
-0.7
4
1.0
0
15
North
ern
Irela
nd u
niv
ers
ity
-0.3
2
-0.0
6
1.0
0
16
Fa
culty
per p
rogra
mm
e (lo
g)
0.0
1
0.0
3
0.0
0
1.0
0
17
Stu
dents
per p
rogra
mm
e (lo
g)
0.0
2
0.0
3
0.1
2
0.6
1
1.0
0
18
ST
EM
subje
ct p
rogra
mm
es (%
) -0
.15
0.1
4
-0.0
1
0.2
9
0.2
1
1.0
0
19
Sin
gle
subje
ct p
rogra
mm
es (%
) -0
.08
0.1
5
-0.1
4
0.0
5
0.3
2
0.0
9
1.0
0
20
Ma
jor-m
inor p
rogra
mm
es (%
) -0
.04
-0
.07
0.2
1
0.0
7
-0.0
6
0.1
8
-0.3
5
1.0
0
21
Age d
ivers
ity o
f sta
ff 0.0
8
-0.1
4
-0.1
3
-0.0
5
-0.2
1
-0.0
2
-0.2
1
-0.0
1
1.0
0
22
Gender d
ivers
ity o
f sta
ff -0
.12
0.0
5
0.0
4
0.4
3
0.1
5
0.3
4
0.0
3
0.0
0
0.1
7
1.0
0
23
Eth
nic
div
ers
ity o
f sta
ff 0.3
1
-0.2
1
-0.1
6
0.3
5
0.0
8
0.1
9
0.0
4
-0.0
5
0.0
0
0.4
1
1.0
0

36
REFERENCES
Advisory Committee on Measuring Innovation in the 21st Century
Economy. 2008. Innovation Measurement - Tracking the state of innovation
in the US economy A report to the Secretary of Commerce.
Blau, P.M. 1977. Inequality and heterogeneity. New York: Free Press.
Boso, N.; J.W. Cadogan; and V.M. Story. 2013. Entrepreneurial orientation
and market orientation as drivers of product innovation success: A study of
exporters from a developing economy. International small business journal
31:57-81.
Brennan, J.; S. Ryan; M. Ranga; S. Broek; N. Durazzi; and B. Kamphuis.
2014. Study on innovation in higher education: final report, ed.
E.C.D.f.E.a.T.S.o.I.i.H. Education. Luxembourg: Publications Office of the
European Union.
Bunniran, S.; D.J. McCaffrey; J.P. Bentley; and A.S. Bouldin. 2009.
Pharmaceutical product withdrawal: Attributions of blame and its impact on
trust. Research in Social & Administrative Pharmacy 5:262-273.
Burge, P.; C.W. Kim; C. Rohr; M. Frearson; and B. Guerin. 2014.
Understanding the impact of differential university fees in England: Rand
Europe.
Chen, W.C. 2012. Innovation and duration of exports. Economics Letters
115:305-308.
Conraths, B., Smidt, H., 2005. Funding university-based research and
innovation in Europe, European University Association, Brussels, Belgium.
de Medeiros, J.F.; J.L.D. Ribeiro; and M.N. Cortimiglia. 2014. Success
factors for environmentally sustainable product innovation: a systematic
literature review. Journal of Cleaner Production 65:76-86.
de Zubielqui, G.C.; J. Jones; P.-S. Seet; and N. Lindsay. 2015. Knowledge
transfer between actors in the innovation system: a study of higher
education institutions (HEIS) and SMES. Journal of Business & Industrial
Marketing 30:436-458.
Filippakou, O. and T. Tapper. 2015. Mission Groups and the New Politics
of British Higher Education. Higher Education Quarterly 69:121-137.
Ganotakis, P. and J.H. Love. 2012. The Innovation Value Chain in New
Technology-Based Firms: Evidence from the UK. Journal of Product

37
Innovation Management 29:839-860.
Geuna, A. and A. Muscio. 2009. The Governance of University Knowledge
Transfer: A Critical Review of the Literature. Minerva 47:93-114.
Golovko, E. and G. Valentini. 2011. Exploring the complementarity
between innovation and export for SMEs' growth. Journal of International
Business Studies 42:362-380.
Geuna, A. and B.R. Martin. 2001. University research evaluation and
funding: An international comparison, SPRU Electronic Working Paper
Series, No. 71, University of Sussex, http://www.sussex.ac.uk/spru.
H.M. Treasury. 2007. The race to the top, A review of Government's
Science and Innovation Policies, Lord Sainsbury of Turville, October 2007
Hansen, M.T. and J. Birkinshaw. 2007. The Innovation Value Chain.
Harvard Business Review June 121-130.
Harrison, R.T. and C. Leitch. 2010. Voodoo Institution or Entrepreneurial
University? Spin-off Companies, the Entrepreneurial System and Regional
Development in the UK. Regional Studies 44:1241-1262.
Hewitt-Dundas, N. 2012. Research intensity and knowledge transfer
activity in UK universities. Research Policy 41.2:262-275.
Jarzabkowski, P. 2005. Strategy as Practice: An activity-based approach.
London, UK: Sage.
Jordan, D. and E. O’Leary. 2007. Sources of innovation in Irish SMEs:
Evidence from two Irish regions. In British-Irish Regional Science
Association Annual Conference. Bangor.
Kandiko, C. and P. Blackmore. 2010. Creating a 21st Century Curriculum:
The Kings-Warwick Project: Warwick University/Kings College.
Kauffeld-Monz, M. and M. Fritsch. 2013. Who Are the Knowledge Brokers
in Regional Systems of Innovation? A Multi-Actor Network Analysis.
Regional Studies 47:669-685.
Konnola, T.; V. Brummer; and A. Salo. 2007. Diversity in foresight: Insights
from the fostering of innovation ideas. Technological Forecasting And
Social Change 74:608-626.
Maringe, F. and S. Carter. 2007. International students' motivations for
studying in UK HE. The International Journal of Educational Management
21:459-475.
Mazzarol, T.; G.N. Soutar; and V. Thein. 2001. Critical success factors in

38
the marketing of an educational insititution: a comparison of institutional
and student perspectives. Journal of makreting in higher education 10:39-
57.
McMahon, M. 1992. Higher Education in a World Market. An Historical
Look at the Global Context of International Study. Higher Education
24:465-482.
Miozzo, M. and L. Soete. 2001. Internationalization of services: a
technological perspective. Technological Forecasting and Social Science
67:159-185.
Muscio, A.; D. Quaglione; and G. Vallanti. 2015. University regulation and
university-industry interaction: a performance analysis of Italian academic
departments. Industrial and Corporate Change 24:1047-1079.
Orr, D., Jaeger, M., Schwarzenberger, A., 2007. Performance-based
funding as an instrument of competition in German higher education.
Journal of Higher Education Policy and Management 29, 1, 3-23.
Ostergaard, C.R.; B. Timmermans; and K. Kristinsson. 2011. Does a
different view create something new? The effect of employee diversity on
innovation. Research Policy 40:500-509.
Plewa, C.; V. Galan-Muros; and T. Davey. 2015. Engaging business in
curriculum design and delivery: a higher education institution perspective.
Higher Education 70:35-53.
Roper, S. and S. Arvanitis. 2012. From knowledge to added value: A
comparative, panel-data analysis of the innovation value chain in Irish and
Swiss manufacturing firms. Research Policy 41:1093-1106.
Roper, S. and J.H. Love. 2002. Innovation and Export Performance:
Evidence from UK and German Manufacturing Plants. Research Policy
31:1087-1102.
Schatzel, K.E.; R.J. Calantone; and C. Droge. 2001. Beyond the firm's
initial declaration: Are preannouncements of new product introductions and
withdrawals alike? Journal of Product Innovation Management 18:82-95.
Sorlin, S., 2007. Funding diversity: Performance-based funding regimes as
drivers of differentiation in higher education systems. Higher Education
Policy 20, 413-40.
Trippl, M. 2011. Regional innovation systems and knowledge-sourcing
activities in traditional industries-evidence from the Vienna food sector.

39
Environment and Planning A 43:1599-1616.
Wakeling, P. and K. Jefferies. 2013. The effect of tuition fees on student
mobility: the UK and Ireland as a natural experiment. British Educational
Research Journal 39:491-513.
Wilkins, S. and J. Huisman. 2011. Student Recruitment at International
Branch Campuses: Can They Compete in the Global Market? Journal of
Studies in International Education 15:299-316.
Winkler, V.A. and R.B. Bouncken. 2011. How Does Cultural Diversity in
Global Innovation Teams Affect the Innovation Process? Emj-Engineering
Management Journal 23:24-35.
Young, B.; N. Hewitt-Dundas; and S. Roper. 2008. Intellectual Property
Management in Publicly Funded R&D Centres - A Comparison of
University-based and Company-based Research Centres. Technovation
28:473-484.

40
Centre Manager Enterprise Research Centre
Aston Business School Birmingham, B1 7ET
Centre Manager Enterprise Research Centre
Warwick Business School Coventry, CV4 7AL