the master key to the problem of reversible chemical
TRANSCRIPT

doi.org/10.26434/chemrxiv.6940379.v6
The Master Key to the Problem of Reversible Chemical HydrogenStorage and Reversible Energy Storage Alike is 12 kJ (mol H2)-1
Roland Hermann Pawelke
Submitted date: 10/04/2019 • Posted date: 11/04/2019Licence: CC BY-NC-ND 4.0Citation information: Pawelke, Roland Hermann (2019): The Master Key to the Problem of ReversibleChemical Hydrogen Storage and Reversible Energy Storage Alike is 12 kJ (mol H2)-1. ChemRxiv. Preprint.
This article outlines a potent theoretical formalism illuminating the boundaries to reversible solid hydrogenstorage based on the ideal gas law and classic equilibrium thermodynamics. A global picture of chemicalreversible hydrogen sorption is unveiled including a thermodynamic explanation of partial reversibility. This isutilized to elucidate a multitude of issues from metal hydride chemistry (as ESI): Highlights are explanationswhy the substitution of a mere 4 mol % Na by K in Ti-doped NaAlH4 raises the reversible storage capacity by42 % and elaboration of the utmost probable reaction pathway in (Rb/K)H-doped Mg(NH2)2/2LiH. The ESIfurther contains a demonstration of relevance to electrochemistry by means of the NAS-battery cell, conciselypredicting the starting point of the cell voltage drop where experiment shows it to be. The findings of this workallow for a change of paradigm towards the understanding of reversible chemical energy storage and providea hitherto sorely missing tool of tremendous analytic and predictive power, complementary to experiment.
File list (5)
download fileview on ChemRxivV5_12article.pdf (346.48 KiB)
download fileview on ChemRxivV5_12article_ESI_Figure2.pdf (0.98 MiB)
download fileview on ChemRxivV5_12article_ESI_Figure3.png (184.91 KiB)
download fileview on ChemRxivV5_12article_ESI_Worked_electrochemistry_examples.... (116.69 KiB)
download fileview on ChemRxivV5_12article_ESI_Worked_MH_problems.pdf (180.49 KiB)

1/5
The Master Key to the Problem of Reversible Chemical Hydrogen
Storage and Reversible Energy Storage Alike is 12 kJ (mol H2)-1
Roland H. Pawelke
This article outlines a potent theoretical formalism illuminating the boundaries to reversible solid hydrogen storage based
on the ideal gas law and classic equilibrium thermodynamics. A global picture of chemical reversible hydrogen sorption is
unveiled including a thermodynamic explanation of partial reversibility. This is utilized to elucidate a multitude of issues
from metal hydride chemistry (as ESI): Highlights are explanations why the substitution of a mere 4 mol % Na by K in Ti-
doped NaAlH4 raises the reversible storage capacity by 42 % and elaboration of the utmost probable reaction pathway in
(Rb/K)H-doped Mg(NH2)2/2LiH. The ESI further contains a demonstration of relevance to electrochemistry by means of the
NAS-battery cell, concisely predicting the starting point of the cell voltage drop where experiment shows it to be. The
findings of this work allow for a change of paradigm towards the understanding of reversible chemical energy storage and
provide a hitherto sorely missing tool of tremendous analytic and predictive power, complementary to experiment.
Introduction
Reversible metal hydrides for hydrogen storage1–4
are a means
for reducing the pV-energy inside a pressurized gas storage
container,5,6
and since consuming heat in the hydrogen
release,7 take harmoniously advantage of the waste heat from
the fuel cell.8 Metal hydrides fundamentally separate into
reversible and irreversible systems, distinguished by whether
the heat tone ∆H of the hydrogenation reaction is negative
(reversible) or positive (irreversible). In between are those
metal hydrides of partial reversibility, showing reversible
hydrogen storage capacities that fall short of the nominal
hydrogen content by sum formula.
Reversible metal hydrides file in three major sub-classes by
mode of hydrogen bonding: interstitial, complex and salt-
like,1–4,9,10
and hydrogen storage in reversible metal hydrides
represents a case of a thermodynamic two-phase equilibrium
system. Such a system features only one degree of freedom
according to the phase rule of Gibbs and in the temperature-
pressure domain of reversible metal hydrides, T > 200 K, p <
200 bar, hydrogen gas behaviour is approximately ideal. To the
author’s best of knowledge, the interrelation of these two
aspects at thermodynamic system level has never been really
elaborated in the history of chemical solid hydrogen storage.
The thermodynamics of a two-phase gas-sorbent system allow
only the free setting of either pressure or temperature: the
other quantity follows suit unless restrained by substance
amount (possible kinetic hindrance is beyond thermodynamic
scope).
Such a two-phase equilibrium system self-adjusts to a pressure
or temperature disturbance by mass transfer between the
phases until the chemical potentials of both are equal again.
Therefore, the maximum possible reversible hydrogen transfer
between both phases at distinct (T, p)-conditions is bound to
∆Gm.
The description of a reversible two-phase gas-sorbent system
is approachable from either the gas or sorbent phase end.
Opting for the gas phase is unorthodox but offers two big
advantages: first, an ideal gas is incomparably simpler to
describe than solid matter; yet there is full information
equivalency at the thermodynamic system level because of the
equilibrium relation between gas and sorbent phase. Second,
an intrinsic universality is organic to the approach since the
hydrogen gas phase is compellingly a common feature to all
reversible hydrogen storage systems while the sorbent is not.
A first reward from adopting the gas phase-centred vantage
point is the self-revealing explanation why the different levels
of stability observed for reversible metal hydrides are linked to
different hydrogen bonding principles because equalling a
certain level of chemical potential in the gas phase requires
appropriate minimum bond strength.
Methodical Approach
The thermodynamic reaction data ∆H and ∆S of a reversible
metal hydride respective hydrogen sorbent are commonly
determined via the van’t Hoff equation, shown in equation 1
for the desorption reaction (∆H positive).11
ln
p
p° =
–∆H
R T +
∆S
R (1)
∆H and ∆S of a hydrogen sorbent refer to the mole H2 and are
determined by a linear interpolation towards equilibrium at p°
= 1 bar pressure under the tacit premises of a) both being
constant over temperature and b) the transition p ⟷ p° occurs
in a reversible thermodynamic process. A feature of little
recognition is –∆H having the connotation of an ideal gas
phase chemical potential µH2 in this transition. Equation 2 is an
alternate writing of equation 1, showing the relation to the
chemical potential of an ideal gas.
RT ln
p°
p = ∆H – T∆S = (µ° – µ) = −µH2 (2)
Equation 2 contains with (µ° – µ) the negative definition of an
ideal gas phase chemical potential. Equation 3 subsumes
previous equations 1 and 2:
ln
p
p° =
–∆H
R T +
∆S
R =
µH2
RT (3)

2/5
In order to describe the reversible transition p ⟷ p° implicit to
equation 1, forming the derivative of equation 3 with respect
to temperature is due, shown in equation 4 under the
premises of constant system volume and substance amount.
This reveals that –∆H of the sorbent (∆H positive) equals µH2.
d ln (p/p°)
dT = –∆H
R T2 =
µH2
RT2 ⇒ –∆H = µH2 (4)
If a discharged reversible sorbent is placed into a hydrogen gas
phase at 1 bar, its presence induces due to the absorption of
hydrogen an excursion of the gas phase chemical potential
from µ° by –µH2 equal to the (positive) desorption enthalpy ∆H,
this opposite relation in arithmetic sign is vital.
This equivalency is not contradictory in a reversible process for
which ∆G is only infinitesimally negative yet virtually zero and
∆H = T∆S applies throughout the transition. For at ambient
temperature stable metal hydrides, re-establishing a pressure
of 1 bar above the sorbent requires the (higher) temperature
T1bar = ∆H/∆S. This makes the van’t Hoff ∆H scale a possible
tool for ranking all reversible hydrogen sorbents by their
featured excursion µH2.
Figure 1 shows how the relation –∆H = µH2 can be employed
for information about the maximum possible reversible mass
transfer until equilibrium at 1 bar is reached if the logarithmic
van’t Hoff ∆H scale is a) linearly calibrated to b) the chemical
potential shift attributable to the transfer of 1 % w/w H
between sorbent and gas phase. This new reference chemical
potential is designated as µ1%H°° in order to distinguish it from
µ°. For general validity, emphasis of mass and not volume is
due since the former is independent of temperature.
Figure 1 Schematic display of the envisaged recalibration of the van’t Hoff scale to yield
information about the maximum reversible mass transfer possible until equilibrium at 1
bar pressure is reached.
Equation 5 shows the anticipated linear relation between the
maximum reversible hydrogen amount and reaction enthalpy
(∆H positive) with reference to µH2 and µ1%H°°.
–∆H
µ1%H°° =
µH2
µ1%H°° [1 % w/w H]rev, max (5)
The feasibility of the linear-logarithmic transformation implicit
to equation 5 is demonstrated by the example of the chemical
potential for the pressure gradient between 0.005 bar and 1
bar at 273.15 K. The figure 0.005 is expressible as power to the
golden ratio Φ ≈ 1.618, as 1.618X with X = -11.01036 ≈ –11.
This transformation eliminates the logarithm of pressure as
variable what is displayed in equation 6.
µ0.005 bar – µ° = X R T ln
1.618 p°
p° with X = –11 (6)
Since the chemical potential µ represents the maximum
available isothermal pV-energy exploitable as volume work,
the expansion must result for an ideal gas in a full conversion
to entropy. Averaging of µ0.005 by X must therefore yield the
arithmetic mean of the isothermal entropies of hydrogen gas
at the respective pressures of the gradient. For a temperature
of T = 273.15 K combine all constants to 1093 J (mol H2)-1
and
division by X = –11 yields –99 J (mol H2)-1
for the mean molar
entropy between 0.005 bar and 1 bar pressure. Due to the
symmetry of the ln-function is the negative of –99 J (mol H2)-1
the reciprocal of the quotient in the ln-pressure term (200
bar). Interpolating the arithmetic mean entropy of 1 bar and
200 bar at 273.15 K from tabulated thermodynamic hydrogen
data yields in fine agreement 99 J (mol H2)-1
.12
This example features the changing of the base of the ln-term
from e to Φ via the basic relation loga (x)/loga (y) = logy (x). The
unique qualities of Φ, also showing in the golden number
sequence respective ΦY/ΦX = Φ(Y-X)
, can be exploited to create
direct proportionality between µH2 and µ1%H°° in the sense of
equation 5 if in µ1%H°° the ln-pressure term is transformed
accordingly to p = ΦX·p°. Therefore, the proportionality from
this transformation is expected to become visible in an isolable
quotient of logarithms (Y/X) to the base of Φ, eventually.
µ1%H°° must be anchored to IUPAC Standard Pressure and
Temperature (STP) what places µ1%H°° at T° = 273.15 K and sets
one end of its pressure gradient to p° = 1 bar. The tricky task is
the meaningful definition of the remaining pressure since by
that means the quality of 1 % w/w H reversible mass transfer
needs to materialize with general validity.
Results
In order to transform the logarithmic van’t Hoff ∆H scale into a
linear number line of reversible storage capacity, (µ1%H°° – µ°)
must mark out its origin (Figure 1). This requires that the mass
transfer of 1 % w/w H must occur at the maximum possible
off-equilibrium distance from µ°. A two-phase gas-sorbent
system cannot be any more off-equilibrium than all gas being
contained in the sorbent while surrounded by a zero-pressure
vacuum.
The molecular mass of the hydrogen atom is virtually equal to
those of a proton and a neutron and thus represents the unit
by which the atomic masses of all elements scale.
Therefore, 1 gram as the mass of 1 mole of hydrogen atoms
respective 1 mole of nuclear particles is the reference for the
mass transfer of 1 % w/w H. The chemical potential µ1%H°°
does actually not describe the reversible transfer of 1 % w/w
hydrogen between the two phases but 1 % w/w of nuclear
particle mass as (ideal) hydrogen gas! This fine yet important
distinction constitutes the general validity for all possible
hydrogen sorbents by the periodic table.

3/5
The system constituting µ1%H°° is a perfectly evacuated vessel
at T° = 273.15 K, comprising 1 g of hydrogen sorbent and a free
volume of 22.71 L, the molar ideal gas volume at p° and this
temperature. This 1 gram of sorbent reversibly releases 1 %
w/w as hydrogen gas into the vacuum, corresponding to 0.01 g
or 0.005 mol H2. This results in a pressure increase from zero-
vacuum to 0.005 bar due to the boundary conditions. The
pressure gradient between 0.005 bar and 1 bar at 273.15 K
thus constitutes the shift (µ1%H°° – µ°) resulting from the
reversible mass transfer of 1 % w/w H from the sorbent into
the zero-chemical potential of the gas phase (equation 7):
µ1%H°° – µ° = R · 273.15 K · ln
0.005 bar
1 bar =
–12033 J (mol H2)-1
[1 % w/w H]-1
max, rev (7)
Taking up the thread how µ1%H°° can linearly predict the
maximum reversible hydrogen storage capacity as by equation
5, it is shown in equation 6 that the pressure of 0.005 bar can
be expressed as ΦX·p° with Φ = 1.618 and X = –11. Equations 5,
6 and 7 combine to equation 8, with {p} = (p/p°).
− ∆H
µ1%H°° =
µH2
µ0.005 bar, 273 K [1 % w/w H]max, rev =
T ln {p}
T° X ln (1.618) [1 % w/w H]max, rev │ X = –11 (8)
Equation 8 contains with T/T° a Charles’ law proportionality
term but it is more expedient to substitute T and T° by their
respective ideal gas law expressions T = pVm/R. The negative
arithmetic sign of X cancels out what moves the pressure
gradient related to µ1%H°° above 1 bar due to the symmetry of
the ln-function. With the basic logarithmic relation loga (x)/loga
(y) = logy (x), equation 8 is transformed to equation 9.
−∆H
µ1%H°° =
p Vm
p° V0,m Y
X [1 % w/w H]max, rev
p° = 1 bar; T° = 273.15 K; V0, m = 22.71 L;
Y = log1.618
p
p° ; X = 11 (9)
Equation 9 shows that the division of a negative equilibrium
desorption enthalpy –∆H (respective a µH2) by µ1%H°° leads to
an ideal gas pVm-energy proportionality term which is
multiplied with the quotient of the logarithms to the base of Φ
and the obtained maximum reversible gravimetric storage
capacity notes relative to 1 bar pressure.
The according maximum volumetric storage capacity is
calculable via the apparent density of the sorbent phase since
equal to the quotient of volumetric and gravimetric hydrogen
storage capacity. Since desorption at reduced pressure can
pretence a higher reversible hydrogen storage capacity,
emancipation from the intrinsic 1 bar constraint is reasonable.
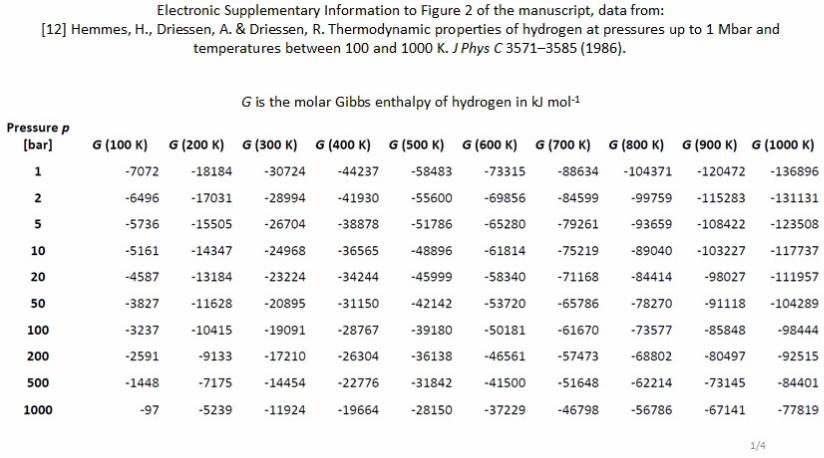
The molar Gibbs enthalpy of hydrogen gas at a distinct
pressure and temperature is identical to the chemical potential
µH2 and HEMMES et al calculated and tabulated these data for
temperatures ranging from 100 K to 1000 K at pressures from
1 bar to 1 Mbar.12
Figure 2 shows the dependency of the
isothermal molar Gibbs enthalpy of hydrogen between 100 K
and 1000 K from pressure in 100 K increments. The array of
curves fits to the general form shown in equation 10.
Gm, H2(T, p) = a(T)·ln {p} – b(T) (10)
The functions for the coefficients a(T) and b(T) are determined
graphically from the respective data set, available as electronic
supplementary information (ESI). Coefficient a(T) shows a
linear dependency to temperature (equation 11a). The
temperature dependency of the coefficient b(T) fits best to a
polynomial function of third order (equation 11b), for the
reason of clarity are the terms aligned as vertical sum.
Figure 2 Semi-logarithmic plot of the isothermal pressure dependency of the molar
Gibbs enthalpy of hydrogen based on the data of HEMMES et al.12
The curves fit the
general form shown in equation 10 (see ESI).
a(T) = 8.363 J (mol H2)-1
K-1·T + 140.447 J (mol H2)
-1 (11a)
b(T) = – 2.120 10-5
J (mol H2)-1
K-3
T3
+ 6.519 10-2
J (mol H2)-1
K-2
T2
+ 9.620 101 J (mol H2)
-1 K
-1 T
– 3.065 103 J (mol H2)
-1 (11b)
Equation 12 combines equation 10 with equations 11a and 11b
to a numerical expression for the molar Gibbs enthalpy of
hydrogen as function of pressure and temperature alone; in
the prime pressure and temperature domain p ≤ 100 bar and T
≥ 300 K of reversible metal hydride hydrogen sorption is the
deviation to the data of HEMMES et al below ±1.0 %.
4/5
Gm, H2 (T, p) = + 8.363 J (mol H2)-1
K-1
T ln {p}
+ 1.404 102
J (mol H2)-1
ln {p}
+ 2.120 10-5
J (mol H2)-1
K-3
T3
– 6.519 10-2
J (mol H2)-1
K-2
T2
– 9.620 101 J (mol H2)
-1 K
-1 T
+ 3.065 103
J (mol H2)-1
(12)
Division of equation 12 by µ1%H°° = –12033 J (mol H2)-1
[1 %
w/w H]-1
max, rev gives the maximum reversible hydrogen storage
capacity of a sorbent as function of pressure and temperature.
[∆ % w/w H]max,rev (T, p) =
– 6.950 10-4
[1 % w/w H]max, rev K-1
T ln {p}
– 1.167 10-2
[1 % w/w H]max, rev ln {p}
– 1.762 10-9
[1 % w/w H]max, rev K-3
T3
+ 5.418 10-6
[1 % w/w H]max, rev K-2
T2
+ 7.995 10-3
[1 % w/w H]max, rev K-1
T
– 2.547 10-1
[1 % w/w H]max, rev (13)
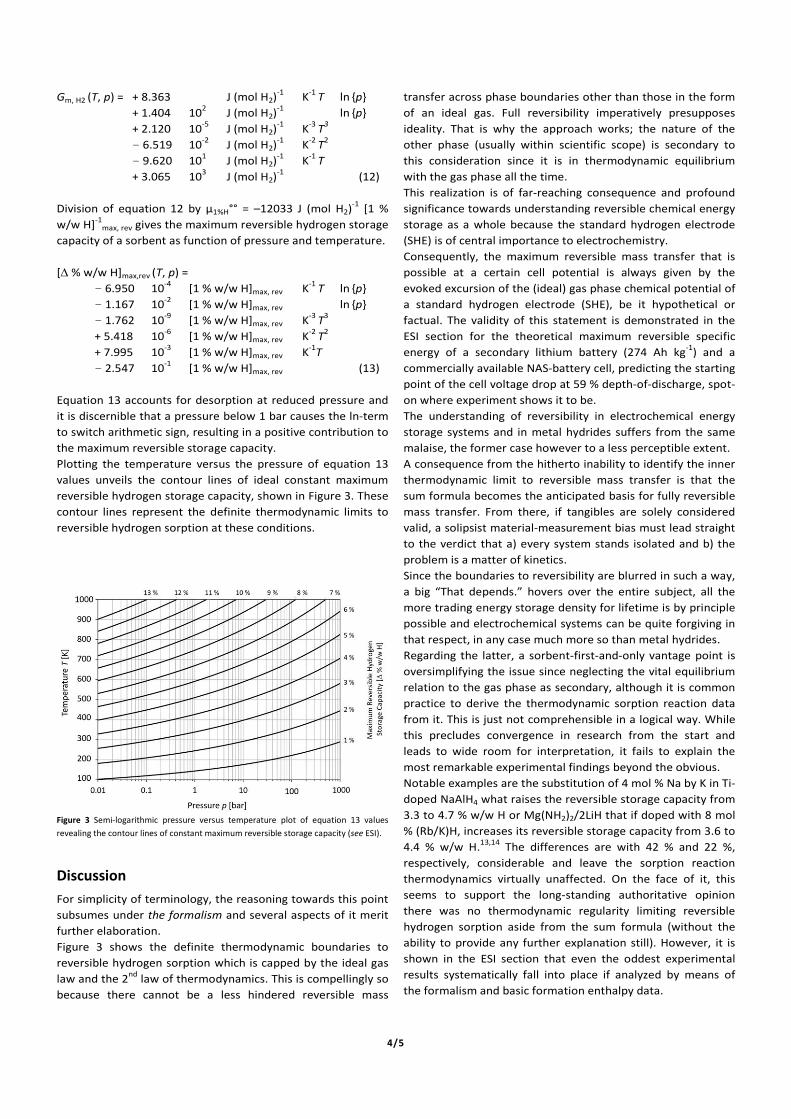
Equation 13 accounts for desorption at reduced pressure and
it is discernible that a pressure below 1 bar causes the ln-term
to switch arithmetic sign, resulting in a positive contribution to
the maximum reversible storage capacity.
Plotting the temperature versus the pressure of equation 13
values unveils the contour lines of ideal constant maximum
reversible hydrogen storage capacity, shown in Figure 3. These
contour lines represent the definite thermodynamic limits to
reversible hydrogen sorption at these conditions.
Figure 3 Semi-logarithmic pressure versus temperature plot of equation 13 values
revealing the contour lines of constant maximum reversible storage capacity (see ESI).
Discussion
For simplicity of terminology, the reasoning towards this point
subsumes under the formalism and several aspects of it merit
further elaboration.
Figure 3 shows the definite thermodynamic boundaries to
reversible hydrogen sorption which is capped by the ideal gas
law and the 2nd
law of thermodynamics. This is compellingly so
because there cannot be a less hindered reversible mass
transfer across phase boundaries other than those in the form
of an ideal gas. Full reversibility imperatively presupposes
ideality. That is why the approach works; the nature of the
other phase (usually within scientific scope) is secondary to
this consideration since it is in thermodynamic equilibrium
with the gas phase all the time.
This realization is of far-reaching consequence and profound
significance towards understanding reversible chemical energy
storage as a whole because the standard hydrogen electrode
(SHE) is of central importance to electrochemistry.
Consequently, the maximum reversible mass transfer that is
possible at a certain cell potential is always given by the
evoked excursion of the (ideal) gas phase chemical potential of
a standard hydrogen electrode (SHE), be it hypothetical or
factual. The validity of this statement is demonstrated in the
ESI section for the theoretical maximum reversible specific
energy of a secondary lithium battery (274 Ah kg-1
) and a
commercially available NAS-battery cell, predicting the starting
point of the cell voltage drop at 59 % depth-of-discharge, spot-
on where experiment shows it to be.
The understanding of reversibility in electrochemical energy
storage systems and in metal hydrides suffers from the same
malaise, the former case however to a less perceptible extent.
A consequence from the hitherto inability to identify the inner
thermodynamic limit to reversible mass transfer is that the
sum formula becomes the anticipated basis for fully reversible
mass transfer. From there, if tangibles are solely considered
valid, a solipsist material-measurement bias must lead straight
to the verdict that a) every system stands isolated and b) the
problem is a matter of kinetics.
Since the boundaries to reversibility are blurred in such a way,
a big “That depends.” hovers over the entire subject, all the
more trading energy storage density for lifetime is by principle
possible and electrochemical systems can be quite forgiving in
that respect, in any case much more so than metal hydrides.
Regarding the latter, a sorbent-first-and-only vantage point is
oversimplifying the issue since neglecting the vital equilibrium
relation to the gas phase as secondary, although it is common
practice to derive the thermodynamic sorption reaction data
from it. This is just not comprehensible in a logical way. While
this precludes convergence in research from the start and
leads to wide room for interpretation, it fails to explain the
most remarkable experimental findings beyond the obvious.
Notable examples are the substitution of 4 mol % Na by K in Ti-
doped NaAlH4 what raises the reversible storage capacity from
3.3 to 4.7 % w/w H or Mg(NH2)2/2LiH that if doped with 8 mol
% (Rb/K)H, increases its reversible storage capacity from 3.6 to
4.4 % w/w H.13,14
The differences are with 42 % and 22 %,
respectively, considerable and leave the sorption reaction
thermodynamics virtually unaffected. On the face of it, this
seems to support the long-standing authoritative opinion
there was no thermodynamic regularity limiting reversible
hydrogen sorption aside from the sum formula (without the
ability to provide any further explanation still). However, it is
shown in the ESI section that even the oddest experimental
results systematically fall into place if analyzed by means of
the formalism and basic formation enthalpy data.

5/5
The precision of this deed is astonishing: LI et al observed for 8
mol % (Rb/K)H-doped Mg(NH2)2/2LiH by DSC two overlapping
endothermic peaks, which can be attributed to the reversible
hydrogen release reactions, of 38.1 ± 0.4 kJ (mol H2)-1
and 38.4
± 0.4 kJ (mol H2)-1
.14
An analysis via the formalism predicts a desorption enthalpy of
38.23 kJ (mol H2)-1
on average for the new (Rb/K)H-catalyzed
pathways (resolving a further open issue in the event). Under
the justified assumption that each of the two DSC peaks
represents one reaction pathway, the arithmetic mean figures
to 38.25 kJ (mol H2)-1
; the deviation between theory and
practice is 0.5 per mille.
It deserves to be mentioned that said analysis of the (Rb/K)H-
doped Mg(NH2)2/2LiH system is founded on top of those of the
pristine one: a befitting image is blind-flying a plane from
Germany to Hawaii with an in-flight refuelling rendezvous and
then landing it spot-on.
This is only possible if the instruments are really up to the task.
Conclusions
Approaching the matter reversible chemical hydrogen storage
from the gas phase end unveils that there are clear and
definite thermodynamic limits to storage capacity in particular
and fully reversible mass transfer across phase boundaries in
general. Most remarkably, this fundamental recognition is not
accessible by any kind of sorbent material-based calculation or
experiment. The in such a way invisible thermodynamic limits
can be either realized by theory or must be fathomed by
experimentally bumping into them over and over again: even if
not stopped cold, there is no hope for ever seeing the global
picture. While reversibility might be traded for system lifetime,
the demarcation line for maximum reversible mass transfer
can be now made clearly visible by all means.
This offers an entirely new basis for decision-making and helps
to minimize friction in research.
What started as an effort towards resolving a long-standing yet
seemingly specific problem evolved after all into a full-fledged
paradigm for understanding reversible mass transfer globally;
this provides a hitherto sorely missing tool of tremendous
analytic and predictive power, complementary to experiment.
Acknowledgements
The partial funding of this work within the European Space
Agency Contract No. 4000105330/12/NL/CLP and European
Defence Agency Contract No. A-1341-RT-GP merits grateful
acknowledgement. I would like to thank Dr. Christoph Buchner
and Joachim Gerger for their assistance with the drawing of
Figure 3 in Python.
Conflicts of interest
There are no conflicts to declare.
Notes and references
1 N. A. A. Rusman and M. Dahari, Int. J. Hydrog. Energy, 2016, 41,
12108–12126.
2 M. V. Lototskyy, V. A. Yartys, B. G. Pollet and R. C. Bowman, Int.
J. Hydrog. Energy, 2014, 39, 5818–5851.
3 C. Weidenthaler and M. Felderhoff, Energy Environ. Sci., 2011, 4,
2495.
4 D. P. Broom, Hydrogen storage materials: the characterisation
of their storage properties, Springer, London ; New York, 2011.
5 S. Niaz, T. Manzoor and A. H. Pandith, Renew. Sustain. Energy
Rev., 2015, 50, 457–469.
6 A. Züttel, Naturwissenschaften, 2004, 91, 157–172.
7 P. Muthukumar and M. Groll, Int. J. Hydrog. Energy, 2010, 35,
3817–3831.
8 M. V. Lototskyy, I. Tolj, L. Pickering, C. Sita, F. Barbir and V.
Yartys, Prog. Nat. Sci. Mater. Int., 2017, 27, 3–20.
9 G. Walker, Ed., Solid-state hydrogen storage: materials and
chemistry, CRC Press, Boca Raton, Fla., 2008.
10 E. Burzo, Hydrogen storage materials, Springer Berlin
Heidelberg, New York, NY, 2017.
11 T. Y. Wei, K. L. Lim, Y. S. Tseng and S. L. I. Chan, Renew. Sustain.
Energy Rev., 2017, 79, 1122–1133.
12 H. Hemmes, A. Driessen and R. Driessen, J Phys C, 1986, 3571–
3585.
13 P. Wang, X.-D. Kang and H.-M. Cheng, J. Appl. Phys., 2005, 98,
074905.
14 C. Li, Y. Liu, R. Ma, X. Zhang, Y. Li, M. Gao and H. Pan, ACS Appl.
Mater. Interfaces, 2014, 6, 17024–17033.

download fileview on ChemRxivV5_12article.pdf (346.48 KiB)


download fileview on ChemRxivV5_12article_ESI_Figure2.pdf (0.98 MiB)

download fileview on ChemRxivV5_12article_ESI_Figure3.png (184.91 KiB)

1/2
Significance of the Formalism for Electrochemistry
(ESI to DOI:10.26434/chemrxiv.6940379.v5)
Roland H. Pawelke
The hydrogen atom represents nothing less than the foundation of the periodic table and the mass transfer at the
standard hydrogen electrode is of central importance to electrochemistry. Therefore, the significance of the formalism
stretches beyond reversible chemical hydrogen storage what is demonstrated by means of two examples from
electrochemistry. The theoretical upper specific energyy threshold of 274 Ah kg-1
for Li-batteries is derived from the
standard hydrogen potential and the same approach is used to predict the starting point of the cell voltage drop in a NAS-
battery precisely where experiment proves it to be.
Introducing Remarks
Full reversibility imperatively presupposes ideality. The nature
of the sorbent is secondary to this consideration since it is in
thermodynamic equilibrium with the gas phase all the time.
With reference to electrochemistry, the maximum reversible
mass transfer that is possible at a certain cell potential is thus
always given by the evoked excursion of the gas phase
chemical potential of a standard hydrogen electrode (SHE), be
it hypothetical or factual.
How this approach works by principle is outlined for the
example Li/Li+. Subsequently, it is applied to analyze the high-
temperature sodium/sulfur (NAS) battery cell, represented by
the T5 model manufactured by NGK Insulators Ltd.
The high-temperature NAS-cell is a well-suited item for several
reasons: first, its operating temperature of 300-350 °C makes it
a virtually perfect thermodynamic system devoid of kinetic
hindrance. Second, the NAS-cell is a well-investigated system
that has reached market maturity. Third, it features a well-
documented trade-off between specific energy and cell life.
1. The Thermodynamic Energy Storage Limits to a Li-Battery
It is well-known that the potential of the redox pair Li/Li+
relative to the SHE is –3.05 V.1 According to Faraday's law(s) of
electrolysis with the Faraday constant of 96485.33 As mol-1
this results in a reversible ∆G° of –294280 J (mol Li)-1
. Division
by –12033 J (mol H2)-1
[∆ % w/w H] yields equation 1; as a
reminder [∆ % w/w H] refers actually not to H but one nuclear
particle mass unit which are however virtually identical.
–294280 J (mol H2)
–12033 J (mol Li) [∆ % w/w H] = 24.456
(mol H2)
(mol Li) [∆ % w/w H]
(1)
Equation 1 correlates the maximum mass transfer resulting
from the excursion of the chemical potential at the SHE with
those occurring at the lithium electrode side and a relationship
to the by now rather historic concept of equivalent weight is
discernible which has been succeeded by those of molar mass.
Thus, the molar ratio term can be expressed by the respective
molar masses, 2.016 g mol-1
for H2 and 6.941 g mol-1
for Li. This
yields 24.456·(2.016/6.941) [∆ % w/w H] = 7.103 [∆ % w/w H].
Since [∆ % w/w H] actually refers to the reversible transfer of
nuclear particle mass percent this is synonymous to 7.103
g/100 g or 71.03 g kg-1
.
The maximum 71.03 g kg-1
reversible mass transfer equal
10.23 (mol Li) kg-1
and with the SHE equilibrium free enthalpy
of –294280 J (mol Li)-1
a maximum reversible specific energy
density of 836.25 Wh kg-1
is obtained as shown in equation 2:
10.23 –294280 J (mol Li)
(mol Li) kg = 3010.48 kJ kg
-1 = 836.25 Wh kg
-1 (2)
Normalizing this reversible specific energy density to 3.05 V
yields the theoretical reference value for the upper capacity
limit 274 Ah kg-1
for a Li-battery as shown in equation 3.2
836.25 Wh
3.05 V kg = 274.18 Ah kg
-1 ≈ 274 Ah kg
-1 (3)
While in fine agreement to the reference value,1,2
this result
implies that this is the maximum reversible specific energy
achievable for any type of a secondary Li-battery, not just for
those of the LiCoO2-type from which this figure has been
derived. However, trading reversibility respective battery
lifetime for specific energy is by principle possible for which
the NAS-battery represents a well-investigated example.
2. The NAS-battery cell
The specifications of the T5 NAS-battery cell by NGK Insulators
Ltd. are available in literature.3,4
However, much of the vital
background information bases on work done in the late 1970s
and early 1980s, SUDWORTH and TILLEY subsumed their results in
a seminal book.5 It is a well-investigated feature of the NAS-
cell that cell voltage drops linearly beyond a DOD of 59% and
that the decrease from 2.076 V to 1.78 V is accompanied by
the transition Na2S5 → Na2S4 →Na2S3 in the sulfur electrode
phase, with Na2S3 and not Na2S marking 100% DOD (see Fig
10.7, p. 322).5,*,#
*https://books.google.at/books?id=VIFnWIBq_wUC&printsec=frontcover&hl=de
&source=gbs_ge_summary_r&cad=0#v=onepage&q&f=false (by 3rd
April 2019) #https://www.eetimes.com/author.asp?section_id=36&doc_id=1323091&image
_number=3 (by 3rd
April 2019)

2/2
Na2S5 is the predominant sulphur electrolyte composition up
to 60 % DOD and the cell voltage stays virtually constant until
59% DOD is reached. Discharging the battery to 100% DOD is
known to take a toll on battery lifetime which is however still
considerable: 4500 cycles at 90% DOD and 2500 cycles at 100%
DOD are standard for the NAS T5 cell.3
Discharging beyond 100% DOD (since Na2S is the theoretical
end composition) strongly reduces cell lifetime as the
electrolyte becomes increasingly corrosive.
The NAS-cell is generally of a tubular design and the electrode
cavity dimensions have a profound influence on the attainable
specific energy (see Figures 9.3 to 9.6, p. 309-311).5,*
The optimization of both electrode dimensions with respect to
diameter and length yields maxima for the attainable specific
energy between 200 Wh kg-1
and 239 Wh kg-1
. This is very
remarkable because the NAS T5 cell shows a specific energy of
238.6 Wh kg-1
(see Table 1) what suggests that the NAS T5 cell
represents virtually the achievable optimum.
Table 1 Specifications of the NAS T5 Cell by NGK Insulators Ltd.3,4
It is now worthwhile to repeat the calculation in kind for the
NAS T5 cell under the tacit prerequisite that the maximum
fully reversible mass transfer possible along a potential of
2.076 V is given by a hypothetical same-size excursion of the
SHE chemical potential. Since the ln-function (in the expression
for µ of an ideal gas) shows planar symmetry at 1, the
arithmetic sign of the voltage is by meaning secondary to this
consideration; for formal reasons a negative arithmetic sign is
applied to the potential of 2.076 V. The reaction stoichiometry
requires the transfer of two sodium units (22.990 g mol-1
) and
the according ∆G° is –400607 J (mol Na)-1
. Equation 4 shows
the fundamental calculation for the NAS T5 cell:
–400607 J (mol H2)
–12033 J (mol Na) [∆ % w/w H] = 33.292
(mol H2)
(mol Na) [∆ % w/w H]
(4)
The term with the molar ratio in equation 4 is accordingly
expressed by the respective molar masses: 2.016 g mol-1
for H2
and 22.990 g mol-1
for Na, yielding 33.292·(2.016/6.941) [∆ %
w/w H] = 2.919 [∆ % w/w H].
This is synonymous to 2.919 g/100 g or 29.19 g kg-1
respective
equal to a maximum mass transfer limit of 1.27 (mol Na) kg-1
;
the multiplication with ∆G° = –400607 J (mol Na)-1
yields a
maximum reversible specific energy density of 141.3 Wh kg-1
.
This specific energy of 141.3 Wh kg-1
represents 59% of 238.6
Wh kg-1
.
References
1 R. A. Huggins, Energy storage, Springer, New York,
2010.
2 J. Garche, E. Karden, P. T. Moseley and D. A. J. Rand,
Eds., Lead-acid batteries for future automobiles,
Elsevier, Amsterdam Oxford Cambridge, 2017.
3 A. Bito, IEEE Power Eng. Soc. Gen. Meet. 2005, 2005,
1232-1235 Vol. 2.
4 J. Garche, Ed., Encyclopedia of electrochemical
power sources. Vol. 4: ..., Elsevier, Acad. Press,
Amsterdam, 2009.
5 J. L. Sudworth and A. R. Tilley, The sodium sulfur
battery, Chapman and Hall, London, 1985.
Capacity (100% DOD) 632 Ah
Nominal Voltage 2.076V
Weight 5.5 kg
Specific Energy 238.6 Wh kg-1
Dimensions 515 mm length
91 mm diameter

download fileview on ChemRxivV5_12article_ESI_Worked_electrochemistry_examples.... (116.69 KiB)

1/6
Application of the Formalism to Actual Problems from Metal
Hydride Chemistry (ESI to DOI:10.26434/chemrxiv.6940379.v5)
Roland H. Pawelke
The theoretical formalism for figuring the constraints to the reversible hydrogen storage capacity of a sorbent via gas
phase thermodynamics is pitted against odd findings and unresolved problems of actual metal hydride research. The most
difficult findings fall into place as the result of calculations using fundamental formation enthalpy data. Highlights are inter
alia why the substitution of 4 mol % Na by K in Ti-doped NaAlH4 raises the reversible storage capacity from 3.3 to 4.7 %
w/w H and the outlining of the additional reaction pathway in Mg(NH2)2/2LiH when doped with (Rb/K)H.
The Metal Hydride Systems
1. Hydralloy C5 (interstitial)
2. Ti-NaAlH4 (complex)
3. Mg(NH2)2/2LiH (complex)
4. LiNH2/LiH (complex)
5. MgH2 (salt-like)
1. Hydralloy C5
Hydralloy C5 is a AB2 – type Laves phase alloy hydride of the
composition Ti0.93Zr0.05(Mn0.73V0.22Fe0.04)2.1 According to the
material data sheet 1407EA01.119 by the manufacturer
Gesellschaft fuer Elektrometallurgie mbH (GfE), hydrogen
uptake is 1.88 % w/w H at 45.8 °C with a reversible hydrogen
storage capacity of 1.84 w/w H at 45.2 °C. The hydrogen
sorption reaction enthalpies of ∆Hdes = 23.8 kJ (mol H2)-1
and
∆Habs = –20.2 kJ (mol H2)-1
combine to an equilibrium sorption
enthalpy of ±22.0 kJ (mol H2)-1
which corresponds by the
formalism in fine agreement to a maximum reversible storage
capacity of 1.83 % w/w H relative to 1 bar pressure.
2. Ti-doped NaAlH4
Sodium aluminum hydride NaAlH4 comprises of two reaction
stages and decomposes first from NaAlH4 to Na3AlH6 and then
further to NaH and aluminum (equations 1a to 1c). The system
yields a total of 5.5 % w/w H by sum formula, split in a 2:1 ratio
between the tetra- and the hexa-hydride stage (3.6 % w/w H
and 1.9 % w/w H, respectively).2–4
However, pristine NaAlH4 is
practically not reversible but the seminal work of BOGDANOVIĆ
and SCHWICKARDI showed that presence of a few mole percent
of titanium allows for reversibility.2 Further studies identified
the reaction enthalpy values which are still a valid reference:5
3 NaAlH4 ⇌ 3 NaH + Al + 4.5 H2 (1a)
∆Hdes = 41.39 kJ (mol H2)-1
and ∆Habs = –38.71 kJ (mol H2)-1
∆Heq = ±40.05 kJ (mol H2)-1
≈ ±40 kJ (mol H2)-1
3 NaAlH4 ⇌ Na3AlH6 + 2 Al + 3 H2 (1b)
∆Hdes = 38.40 kJ (mol H2)-1
and ∆Habs = –35.10 kJ (mol H2)-1
∆Heq = ±36.75 kJ (mol H2)-1
≈ ±37 kJ (mol H2)-1
Na3AlH6 ⇌ 3 NaH + Al + 1.5 H2 (1c)
∆Hdes = 47.37 kJ (mol H2)-1
and ∆Habs = –45.93 kJ (mol H2)-1
∆Heq = ±46.65 kJ (mol H2)-1
≈ ±47 kJ (mol H2)-1
However, Ti-catalyzed NaAlH4 systems are inexplicably still not
fully reversible. The representational formalism provides an
explanation since the 36.75 kJ (mol H2)-1
of the tetra-hydride
stage correspond to a maximum reversible hydrogen storage
capacity of 3.054 w/w H ≈ 3.1 % w/w H relative to 1 bar.
This is just 86 % of the nominal hydrogen amount of equation
1b, suggesting that NaAlH4 is by sum formula initially in an
overcharged, meta-stable off-equilibrium condition. Only the
hexa-hydride stage shows with 47 kJ (mol H2)-1
more than
enough hydrogen fixation potential for full reversibility: 3.9 %
w/w H predicted by theory versus 2.9 % w/w H (equation 1c).
The global equilibrium enthalpy of 40.05 kJ (mol H2)-1
corresponds by the formalism to a maximum reversible
hydrogen storage capacity of 3.3 % w/w H.
WANG et al report perfectly in line 3.3 % w/w H for a sodium
alanate material obtained by direct synthesis from NaH and
aluminum doped with 4 mol % Ti-metal.6
However, substitution of 4 mol % NaH by KH in the synthesis
increases the stable reversible hydrogen storage capacity from
3.3 % w/w to 4.7 % w/w! No accountable explanation for this
remarkable finding exists to date, yet the result is solid and the
enhancing K-effect is in essence also confirmed by LIU et al.7
It is reasonable to relate this gain in storage capacity to the
next stable mixed potassium-sodium aluminum hydride
K2NaAlH6 (KNa2AlH6 is thermodynamically instable).8 Only the
decomposition enthalpy of K2NaAlH6 has been experimentally
determined so far, by GRAETZ et al to 97 kJ (mol H2)-1
and by
SØRBY et al to 98.2 kJ (mol H2)-1
.9,10
While it would be desirable to have also the absorption
enthalpy of K2NaAlH6 at hand, it is possible to work solely with
the desorption enthalpies of Na3AlH6 and K2NaAlH6 to assess
the effect of doping under the tacit premise that both show a
near-identical proportion between desorption and absorption
enthalpy. The difference <1.5 kJ (mol H2)-1
between absorption
and desorption enthalpy for Na3AlH6 suggests the effective
maximum error of that approach being ≤0.1 % w/w H.
For the higher precision, the figure of SØRBY et al is used and
the difference in hydrogen fixation potential between Na3AlH6
and K2NaAlH6 is thus: 47.37 kJ (mol H2)-1
– 98.20 kJ (mol H2)-1
=
–50.83 kJ (mol H2)-1
. Adjustment to the 2:1 ratio between
tetra- and hexa-hydride yields –16.9 kJ (mol H2)-1
which
correspond by the formalism to a gain of 1.4 % w/w H
reversible storage capacity, precisely the result reported by
WANG et al.6

2/6
It is important to recognize that this additional hydrogen
fixation potential of –16.9 kJ (mol H2)-1
is on reaction pathway
level and shows effect in the absorption reaction only. This
follows from the substantially higher stability of K2NaAlH6
compared to Na3AlH6 and the fact that both stages of the
mixed (Ti/K)-doped NaAlH4 show desorption enthalpies
virtually identical to those reported for the solely Ti-doped
system of BOGDANOVIĆ et al.5
The relation between macroscopic and reaction pathway
thermodynamics is the following: substitution of 4 mol % NaH
by KH results in the formation of 2 mol % K2NaAlH6 and thus a
2.1 mol % pathway availability on system level. Because
effective in the absorption reaction only, interpolation from
Na3AlH6 thermodynamic data suggests that the macroscopic
absorption enthalpy of the K-modified hexa-hydride stage
should be by 0.021 · –16.9 kJ (mol H2)-1
= –0.355 kJ (mol H2)-1
more negative. Therefore, the absorption enthalpy of the 4
mol % K-substituted Ti-Na3AlH6 estimates to: –45.930 kJ (mol
H2)-1
– 0.355 kJ (mol H2)-1
= –46.29 kJ (mol H2)-1
.
WANG et al determined this desorption enthalpy to +46.5 kJ
(mol H2)-1
by fitting of two overlapping DSC/TGA peaks. With
the above approximated value for the absorption enthalpy, a
reversible equilibrium enthalpy of ±46.4 kJ (mol H2)-1
for the
hexa-hydride stage is obtained. This worked example gives the
idea how macroscopic reaction thermodynamics can remain
virtually unaltered by a doping procedure while the maximum
reversible storage capacity increases from 3.3 % w/w H to 4.7
% w/w H, a raise by 42 %!
In discussing that exceptionally high storage capacity of 4.7 %
w/w H further and closing the circle, it is sensible to re-analyze
the Ti-catalyzed NaAlH4 system as a whole. The predicted 86 %
reversibility for the tetra-hydride stage will eventually leave 14
% sodium hydride spare. Since the hexa-hydride is by ~10 kJ
(mol H2)-1
more stable than the tetra-hydride, these 14 % NaH
will react with further 7 % of NaAlH4 to Na3AlH6.
Scheme 1 outlines the consequences of this partial reversibility
for system stoichiometry:
(NaAlH4)0.86 + (NaH)0.14 + Al0.14
→ (NaAlH4)0.79 + (Na3AlH6)0.07 + Al0.14
≡ (NaAlH4)2.37 + (Na3AlH6)0.21 + Al0.42
↿⇂ ∆rev = 2.86 % w/w H
(Na3AlH6)1.00 + 2 Al + 2.37 H2
↿⇂ ∆rev = 1.90 % w/w H
3 NaH + 3 Al + 1.5 H2
∆rev, max = 4.76 % w/w H
Scheme 1 The impact of 86 % tetra-hydride reversibility on the maximum reversible
hydrogen storage capacity of the sodium alanate system, limiting the maximum
reversible hydrogen storage capacity to 4.76 % w/w.
Scheme 1 shows the concert of thermodynamic constrain and
chemical reactivity capping the reversible storage capacity of
Ti-catalyzed NaAlH4 at 4.76 % w/w H, with a theoretical
maximum of 2.86 % w/w H at the tetra-hydride stage. The
latter is in fine agreement with 2.83 % w/w H reported by LI et
al respective 2.8 % w/w H by WANG and JENSEN for the tetra-
hydride stage upon prolonged cycling.11,12
With view to that,
the substitution of 4 mol % NaH by KH takes the Ti-NaAlH4
system close to this thermodynamic limit. While 5 % w/w H
should be possible by theory, no reversible storage capacity
exceeding 4.8 % w/w H for the nominal NaAlH4 stoichiometry
exists in literature to date.7,13–15
3. Mg(NH2)2/2LiH and 4.) LiNH2/LiH
The amide-imide transition of the Mg(NH2)2/2LiH system
(equation 2) has a hydrogen content by sum formula of 5.4 %
w/w with reported sorption reaction enthalpies ranging from
39 to 47 kJ (mol H2)-1
.16–19
2 LiH + Mg(NH2)2 ⇌ Mg(LiNH)2 + 2 H2 (2)
Equation 2 is actually the sum of a multi-reaction system
consisting of equations 3a and 3b.20,21
2 Mg(NH2)2 + 3 LiH ⇌ LiNH2 + Mg2(NH)(LiNH)2 + 3 H2 (3a)
LiNH2 + LiH + Mg2(NH)(LiNH)2 ⇌ 2 Mg(LiNH)2 + H2 (3b)
This Li-Mg-N-H system is a destabilized version of the earlier
all-lithium system,22
whose amide-imide transition is shown in
equation 4a and has a considerably higher sorption reaction
enthalpy of 67 kJ (mol H2)-1
.22–24
The reversible hydrogen
storage capacity of this all-lithium system is 5.5 % w/w H,25
in
concise agreement with the predicted figure. It is discernible
that the all-lithium system of equation 4a is still part of
equation 3b, which can be expressed as sum of equations 4a
and 4b without affecting the global stoichiometry.
LiNH2 + LiH ⇌ Li2NH + H2 (4a)
Li2NH + Mg2(NH)(LiNH)2 ⇌ 2 Mg(LiNH)2 (4b)
Drawing this connection is viable as multiple works identified a
key role of imides in one form or another to the Mg(NH2)2/2LiH
system.26–31
Equation 4a can be furthermore expressed as sum
of equations 5a and 5b what features the NH3-mediated
transport mechanism of ICHIKAWA et al.32,33
2 LiNH2 ⇌ Li2NH + NH3 (5a)
LiH + NH3 ⇌ LiNH2 (5b)
XIONG et al investigated the thermodynamics of Mg(NH2)2/2LiH
first,16
showing that hydrogen evolution proceeds via two
steps designated as sloping and plateau zone. The former
accounts for about one third of the total hydrogen yield while
the other two thirds originate from the plateau phase. No
individual sorption reaction enthalpy for the sloping region is
given,34
but XIONG et al determined the global desorption

3/6
enthalpy of equation 2 by DSC to 44.1 kJ (mol H2)-1
with 38.9 kJ
(mol H2)-1
accounting for the plateau region.16
Subsequently, HU et al identified the two partial reactions of
equations 3a and 3b of which both contribute to the sloping
zone while hydrogen evolution in the plateau region occurs
exclusively via equation 3a.20
For a desorption enthalpy of 44.1 kJ (mol H2)-1
, the formalism
predicts a maximum reversible hydrogen storage capacity of
3.7 % w/w but it must be considered that the figure is slightly
too high since based on the desorption enthalpy alone, which
suggests a deviation of about +0.1 % w/w H.
Long-term studies on reversible hydrogen storage capacity
support indeed 3.6 % w/w H being an upper threshold to the
Mg(NH2)2/2LiH system. Near-perfect matches represent the
results of MA et al,35
as well as the 264-cycle experiment by
Luo from the open-access Sandia Metal Hydride Center of
Excellence Report.36
VARIN et al and LIU et al report slightly
smaller figures for the pristine systems.19,21
IKEDA et al
demonstrate in a 300-cycle experiment an initial hydrogen
storage capacity of 4.6 % w/w which exponentially declines to
about 3.6 % w/w.37
LUO and SICKAFOOSE report a reversible
hydrogen storage capacity of 3.2 % w/w for the plateau region
(equation 3a),38
a figure in concise agreement to the storage
capacity predicted for to 38.9 kJ (mol H2)-1
.16
In sum, this leads to the conclusion that the Mg(NH2)2/2LiH
system, likewise Ti-doped NaAlH4, is by sum formula initially in
an off-equilibrium condition.
From this perspective appears the tendency towards ammonia
formation encountered in this system and the consequential
loss in storage capacity rather a side-effect of the shifting
towards equilibrium composition than a primary mode of
degradation.37
This also offers an explanation for the distinct
sensitivity of the system towards changes in stoichiometry;
adjustment of the formal 2:1 LiNH2 to MgH2 ratio in favor of a
slight LiNH2 excess (about 2.15:1) results in optimum hydrogen
yield,39,40
while rather small deviations cause disproportionate
reductions.39
This adds further weight to the notion that Li2NH
features a key role in this system.
The global situation encountered in the Mg(NH2)2/2LiH system
is thus quite complex: starting from a meta-stable initial off-
equilibrium condition, the LiNH2/LiH system may overlap
depending on reactant ratio, ammonia formation can occur
and desorption at reduced pressure may mixed it all up.
Such is the foundation on which some works report reversible
hydrogen yields in excess of 5 % w/w H for this system. But a
long story short, a fine study of ZHANG and WU untangles the
above threads organic to every paper of lofty claim.26
In contrast to these, ZHANG and WU provide well-documented
experimental details and proper analytics: the presence of an
Mg-equivalent of Li3N (a LiH and LiNH2 source) in MgH2/xLiNH2
raises the reversible hydrogen storage capacity from 3.2 to 5.1
% w/w H upon increasing the lithium amide proportion from x
= 0.13 to 2. Desorption at reduced pressure results in a stable
hydrogen storage capacity of 5.1 % w/w H over ten cycles.
However, analytics and the PCI-curve at 240 °C reveal that the
first plateau at <0.05 MPa belongs to the Li2NH reaction of the
all-lithium system (equation 4a) which accounts for a hydrogen
amount of 1.5 % out of 5.1 % w/w H. This leaves 3.6 % w/w H
for hydrogen evolution via the sloping and the plateau zone
respective equations 3a and 3b, concisely as theory predicts.
(Rb/K)H-doped Mg(NH2)2/2LiH
Leaving the pristine Mg(NH2)2/2LiH system, doping with 4 mol
% RbH and 4 mol % KH results in a remarkable raise in
reversible storage capacity from 3.6 % w/w H to 4.4 % w/w H,
demonstrated by LI et al.41
This figure is the topmost reversible
hydrogen storage capacity for a Mg(NH2)2/2LiH system, stable
after 50 cycles and accompanied by a profound increase in
kinetic performance.
The beneficial effects of doping with KH and RbH have been
demonstrated before,42,43
yet it is the merit of LI et al to have
put these pieces in a multiple cycle study together. However,
there is no plausible explanation for this remarkable finding to
date, the authors themselves seem to interpret the final
reversible 4.4 % w/w H as the result of degradation since 5.2 %
w/w H are possible by sum formula.
A feature immediately striking the eye as in the graphical
abstract is that the reversible hydrogen storage capacity of 4.4
% w/w is bound to a temperature of 130 °C during the
hydrogenation reaction. Over the first eight cycles at 120 °C
hydrogenation temperature there is a decline in storage
capacity from 4.8 % w/w H to 3.6 % w/w H.
LI et al merely mention the hydrogenation as more incomplete
under these conditions but in the context of this discourse, this
is a most notable observation. With reference to the maximum
of 3.6 % w/w H identified for the pristine system, this suggests
that there is a switch-on temperature at which alternate
reaction pathways opens up. Below that critical temperature,
the system falls within the thermodynamic boundaries of the
pristine system what in turn suggests that hydrogenation is far
from incomplete but always right at the thermodynamic limit.
The analysis under the formalism starts with considering the
4.4 % w/w H after 50 cycles the actual equilibrium hydrogen
amount of the modified system. There is an increase of 0.8 %
w/w H to the pristine system, corresponding to a gain in
hydrogen fixation potential of –8.4 kJ (mol H2)-1
.
The standard formation enthalpy ∆Hf° of LiNH2 figures to –182
kJ mol-1
,44
KNH2, and RbNH2 show –128.9 kJ mol-1
and –113.0
kJ mol-1
, respectively.45
The stabilities of the binary hydrides
LiH, KH and RbH file likewise with the formation enthalpies of
–90.5 kJ mol-1
, –57.7 kJ mol-1
and –52.3 kJ mol-1
, respectively.45
The formation enthalpy of magnesium amide figures to –167.1
kJ mol-1
based on calculations from those of MgH2 (–75.3 kJ
mol-1
) and NH3 (–45.9 kJ mol-1
).45
The gain of –8.4 kJ (mol H2)-1
in hydrogen fixation potential
must be traceable to at least one metathesis reaction. The new
reaction pathway must make for a clear difference in hydrogen
fixation potential likewise seen with (Ti/K)-doped NaAlH4 but
contrary to that case, a closed stoichiometric cycle is a further
requirement because of the accompanied catalytic effect.
Therefore, the sum of partial equations to that pathway must
leave the overall reaction of equation 2 unchanged but at the
same time allow for a clear distinction somewhere in the
equation reaction system.

4/6
Evidently, the first metathesis must be an exchange between a
Li-imide reactant and KH respective RbH, resulting in the
formation of LiH since the enthalpy differences between LiNH2
respective Mg(NH2)2 to RbNH2 and KNH2 are too large for
compensation by LiH formation. There is in equation 3a no
opportunity for that.
2 Mg(NH2)2 + 3 LiH ⇌ LiNH2 + Mg2(NH)(LiNH)2 + 3 H2 (3a)
Mg2(NH)(LiNH)2 offers the first opportunity for the formation
of LiH in a metathesis reaction. Since RbH and KH show
formation enthalpies of similar magnitude, the subsequent
reasoning refers to an average (Rb/K) cation (equation 6).
Mg2(NH)(LiNH)2 + (Rb/K)H ⇌ Mg2(NH)((Rb/K)NH)(LiNH) + LiH
(6)
This system may react further with the LiNH2 equivalent
generated in equation 3a and in analogy to equation 3b,
exchange the cation with the (Rb/K)-imide group.
Mg2(NH)((Rb/K)NH)(LiNH) + LiNH2 ⇌ Mg(LiNH)2 +
(Rb/K)Mg(NH)(NH2) (7)
The structure of RbMg(NH)(NH2) has been rather recently
resolved,46
being isostructural to its potassium analogue.47
Both phases are expected to play a vital role in the mechanism
of the improvements resulting from KH and RbH-doping of
Mg(NH2)2/2LiH.42,43
The reaction of (Rb/K)Mg(NH)(NH2) with lithium imide (with
reference to equation 3b being likely the sum of equations 4a
and 4b) leads to (Rb/K)NH2 and a further equivalent of
Mg(LiNH)2:
(Rb/K)Mg(NH)(NH2) + Li2NH ⇌ (Rb/K)NH2 + Mg(LiNH)2 (8)
The favorable effect of the presence of imides has been
already mentioned in the discussion of the pristine system, a
possible source of Li2NH is equation 4a.
LiNH2 + LiH ⇌ Li2NH + H2 (4a)
Finally, the large formation enthalpy of LiNH2 (∆Hf° = –182 kJ
mol-1
) favors the metathesis reaction between (Rb/K)NH2 from
equation 8 and lithium hydride what regenerates the catalyst
and takes the system the full cycle.
The reaction of equation 9 is irreversible and thus provides the
thermodynamic driving force for the fixation of additional
hydrogen.
(Rb/K)NH2 + LiH → (Rb/K)H + LiNH2 (9)
Thus, equations 3a, 4a and 6 to 9 constitute the elementary
reactions of the (Rb/K)-doped system, shown below. It is eye-
striking that this reaction system indeed suffices the closed-
loop requirement and except for the bold marked reactants
which sum up to equation 2, all other reactants cancel out.
2 Mg(NH2)2 + 3 LiH ⇌ LiNH2 + Mg2(NH)(LiNH)2 + 3 H2 (3a)
Mg2(NH)(LiNH)2 + (Rb/K)H ⇌ Mg2(NH)((Rb/K)NH)(LiNH) + LiH
(6)
Mg2(NH)((Rb/K)NH)(LiNH) + LiNH2 ⇌ Mg(LiNH)2 +
(Rb/K)Mg(NH)(NH2) (7)
(Rb/K)Mg(NH)(NH2) + Li2NH ⇌ (Rb/K)NH2 + Mg(LiNH)2 (8)
(Rb/K)NH2 + LiH → (Rb/K)H + LiNH2 (9)
LiNH2 + LiH ⇌ Li2NH + H2 (4a)
For figuring the additional hydrogen fixation potential resulting
from doping of the pristine system with 4 mol % RbH and 4
mol % KH, taking the mean formation enthalpy of KNH2 and
RbNH2 is sensible, (Rb/K)NH2 has thus an average formation
enthalpy of –121.0 kJ mol-1
; likewise the mean formation
enthalpy of (Rb/K)H is –55.0 kJ mol-1
. The formation enthalpy
of LiH figures to –90.5 kJ mol-1
and consequently, the balance
between right and left side of equation 9 reveals an enthalpy
gain for hydrogen fixation of –237.0 kJ mol-1
(right side eq. 9) +
211.5 kJ mol-1
(left side eq. 9) = –25.5 kJ mol-1
.
This enthalpy difference refers on system level to the three
moles of hydrogen of equation 3a since the single mole
hydrogen generated by equation 4a occurs in a separate
reaction pathway that is also vital to the pristine system.
Therefore, it is not relevant for the distinction between (Rb/K)-
doped and pristine system. Thus, the –25.5 kJ mol-1
difference
in formation enthalpy resulting from the doping with (Rb/K)H
is equal to an additional hydrogen fixation potential of –8.5 kJ
(mol H2)-1
, in excellent agreement with the initial theoretical
prediction of –8.4 kJ (mol H2)-1
by the formalism.
It is now interesting to see how the thermodynamics of this
new reaction pathway affect the enthalpy of the system at the
macroscopic level. Since equation 3a represents the baseline,
its desorption enthalpy of +38.9 kJ (mol H2)-1
is reduced by the
additional hydrogen fixation potential of –8.4 kJ (mol H2)-1
gained from the new reaction pathway, whose accessibility is
macroscopically limited to a concentration of 8 mol % (Rb/K)H.
Consequently, the global desorption enthalpy per mole
hydrogen is expected to be 0.672 kJ (mol H2)-1
smaller, equal to
38.23 kJ (mol H2)-1
. LI et al observed by DSC two overlapping
endothermic peaks, which can be attributed to the reversible
hydrogen release reactions, of 38.1 ± 0.4 kJ (mol H2)-1
and 38.4
± 0.4 kJ (mol H2)-1
. Under the justified assumption that each of
these DSC peaks represents the RbH- respective KH-catalyzed
pathway,46
taking the arithmetic mean of these experimental
values yields 38.25 kJ (mol H2)-1
. This is 0.5 per mille away from
the predicted figure of 38.23 kJ (mol H2)-1
.
5. MgH2
Magnesium hydride shows a hydrogen content of 7.7 % w/w
by sum formula and the reversible sorption reaction enthalpies
reported for MgH2 show a considerable spread between about
70 to 85 kJ (mol H2)-1
with 74 to 75 kJ (mol H2)-1
being the
commonly accepted figures.48–52
However, the reason behind
this spread failed to reveal itself in full to this day. For an
equilibrium sorption reaction enthalpy of 75 kJ (mol H2)-1
a
maximum reversible hydrogen storage capacity of 6.2 % w/w H
is expected and there is no trouble finding this assessment

5/6
vindicated by a vast multitude of papers. Most reversible MgH2
hydrogen storage capacities found in literature range between
5.5 % w/w H and 6.2 % w/w H.
Irrespective of the actual figure, it is a matter of fact that
virtually all reversible storage capacities reported in MgH2
literature fall substantially short of the theoretical 7.7 % w/w
H. This becomes understandable considering the generalized
form of the formalism predicts for reversible 7.7 % w/w H at a
final desorption pressure of 1 bar a minimum temperature of
720 K. These required conditions are often beyond the scope
of MgH2 desorption experiments. The experimental conditions
have thus a profound influence on the obtainable reversible
hydrogen yield and the generalized form of the formalism is an
apt tool for fathoming the boundaries:
The work of ZHENGLONG et al shows the reversible hydrogen
storage capacity of their Ni-doped MgH2 material stabilizing at
6.4 % w/w H within 50 sorption cycles.53
Desorption is done at
623 K and 1 bar pressure for which the generalized form of the
formalism states in concise agreement a maximum reversible
hydrogen storage capacity of 6.4 % w/w H.
An informative result showing an actually divergent relation
between kinetic performance and reversible storage capacity
is revealed by a work of DEHOUCHE et al for Cr2O3-doped
MgH2.54
The experiment comprises of 1000 sorption cycles.
Within the first 500 cycles the mean particle size increases
from 21 nm to 84 nm. This is accompanied by a decrease of
kinetics but a gain (!) in reversible hydrogen storage capacity,
from 5.9 % w/w H to 6.4 % w/w H (as by the authors).
However, a close examination of the presented pressure-
composition isotherms indicates reversible 6.3 % w/w H since
the zero-point of the desorption curves is visibly shifted.
This increased hydrogen storage capacity is stable for the
remainder 500 cycles. Desorption was done at 0.25 bar
hydrogen pressure and 573 K for which the generalized form
of the formalism predicts in fine agreement 6.3 % w/w H.
The authors explain both, the increased storage capacity and
diminished kinetic performance via the particle growth and it
is a proximate conclusion that the spread observed in MgH2
sorption reaction enthalpy may be rooted in that relation.
However, crystallite growth is not a self-sufficient feature of
the sorbent phase but a manifestation of the thermodynamic
equilibrium boundaries set in concert with the chemical
potential of the hydrogen gas phase.
By principle, the global thermodynamics of particle size growth
in the MgH2 system should be traceable via the difference in
reversible hydrogen storage capacity.
Concluding Remark
Developing the theorem of thermodynamics limiting reversible
hydrogen storage capacity requires virtually no reference to
metal hydride research literature but this demonstration
shows its significance to reality. The most odd and not self-
explanatory findings of metal hydride chemistry fall into place
as result of calculations using basic thermodynamic data.
References
1 A. Zuettel, Demonstration eines Metallhydrid Speichers in einem mit Wasserstoff angetriebenen Pistenfahrzeug, Contract No. 1005, Final Report, Publication No. 250046, Swiss Federal Office of Energy SFOE, 2004.
2 B. Bogdanović and M. Schwickardi, J. Alloys Compd., 1997, 253–254, 1–9.
3 G. Sandrock, K. Gross, G. Thomas, C. Jensen, D. Meeker and S. Takara, J. Alloys Compd., 2002, 330–332, 696–701.
4 G. Sandrock, K. Gross and G. Thomas, J. Alloys Compd., 2002, 339, 299–308.
5 B. Bogdanović, R. A. Brand, A. Marjanović, M. Schwickardi and J. Tölle, J. Alloys Compd., 2000, 302, 36–58.
6 P. Wang, X.-D. Kang and H.-M. Cheng, J. Appl. Phys., 2005, 98, 074905.
7 Y. Liu, C. Liang, H. Zhou, M. Gao, H. Pan and Q. Wang, Chem Commun, 2011, 47, 1740–1742.
8 O. M. Løvvik and O. Swang, Europhys. Lett. EPL, 2004, 67, 607–613.
9 M. H. Sørby, H. W. Brinks, A. Fossdal, K. Thorshaug and B. C. Hauback, J. Alloys Compd., 2006, 415, 284–287.
10 J. Graetz, Y. Lee, J. J. Reilly, S. Park and T. Vogt, Phys. Rev. B, 2005, 71, 184115–184122.
11 P. Wang and C. M. Jensen, J. Alloys Compd., 2004, 379, 99–102.
12 L. Li, Z.-C. Zhang, Y.-J. Wang, L.-F. Jiao and H.-T. Yuan, Rare Met., 2017, 36, 517–522.
13 L. Li, F. Qiu, Y. Wang, G. Liu, Y. Xu, C. An, Y. Wang, L. Jiao and H. Yuan, J. Mater. Chem., 2012, 22, 13782.
14 X. Xiao, X. Fan, K. Yu, S. Li, C. Chen, Q. Wang and L. Chen, J. Phys. Chem. C, 2009, 113, 20745–20751.
15 R. Wu, H. Du, Z. Wang, M. Gao, H. Pan and Y. Liu, J. Power Sources, 2016, 327, 519–525.
16 Z. Xiong, J. Hu, G. Wu, P. Chen, W. Luo, K. Gross and J. Wang, J. Alloys Compd., 2005, 398, 235–239.
17 J. Yang, A. Sudik and C. Wolverton, J. Alloys Compd., 2007, 430, 334–338.
18 S. Barison, F. Agresti, S. Lo Russo, A. Maddalena, P. Palade, G. Principi and G. Torzo, J. Alloys Compd., 2008, 459, 343–347.
19 R. A. Varin, R. Parviz, M. Polanski and Z. S. Wronski, Int. J. Hydrog. Energy, 2014, 39, 10585–10599.
20 J. Hu, Y. Liu, G. Wu, Z. Xiong and P. Chen, J. Phys. Chem. C, 2007, 111, 18439–18443.
21 Y. Liu, C. Liang, Z. Wei, Y. Jiang, M. Gao, H. Pan and Q. Wang, Phys. Chem. Chem. Phys., 2010, 12, 3108.

6/6
22 P. Chen, Z. Xiong, J. Luo, J. Lin and K. L. Tan, J. Phys. Chem. B, 2003, 107, 10967–10970.
23 Y. Kojima and Y. Kawai, J. Alloys Compd., 2005, 395, 236–239.
24 S. Isobe, T. Ichikawa, K. Tokoyoda, N. Hanada, H. Leng, H. Fujii and Y. Kojima, Thermochim. Acta, 2008, 468, 35–38.
25 T. Ichikawa, S. Isobe, N. Hanada and H. Fujii, J. Alloys Compd., 2004, 365, 271–276.
26 B. Zhang and Y. Wu, Int. J. Hydrog. Energy, 2015, 40, 9298–9305.
27 A. Sudik, J. Yang, D. Halliday and C. Wolverton, J. Phys. Chem. C, 2007, 111, 6568–6573.
28 Y. Liu, C. Liang, Z. Wei, Y. Jiang, M. Gao, H. Pan and Q. Wang, Phys. Chem. Chem. Phys., 2010, 12, 3108.
29 K. Okamoto, K. Tokoyoda, T. Ichikawa and H. Fujii, J. Alloys Compd., 2007, 432, 289–292.
30 B. Li, Y. Liu, Y. Zhang, M. Gao and H. Pan, J. Phys. Chem. C, 2012, 116, 13551–13558.
31 Y. Liu, B. Li, F. Tu, C. Liang, M. Gao, H. Pan and Q. Wang, Dalton Trans., 2011, 40, 8179.
32 T. Ichikawa, N. Hanada, S. Isobe, H. Leng and H. Fujii, J. Phys. Chem. B, 2004, 108, 7887–7892.
33 Y. H. Hu and E. Ruckenstein, J. Phys. Chem. A, 2003, 107, 9737–9739.
34 W. Luo, V. Stavila and L. E. Klebanoff, Int. J. Hydrog. Energy, 2012, 37, 6646–6652.
35 L.-P. Ma, P. Wang, H.-B. Dai and H.-M. Cheng, J. Alloys Compd., 2009, 468, L21–L24.
36 J. O. Keller and L. E. Klebanoff, Final report for the DOE Metal Hydride Center of Excellence, 2012.
37 S. Ikeda, K. Tokoyoda, T. Kiyobayashi and N. Kuriyama, Int. J. Hydrog. Energy, 2011, 36, 8373–8380.
38 W. Luo and S. Sickafoose, J. Alloys Compd., 2006, 407, 274–281.
39 Y. Chen, P. Wang, C. Liu and H. Cheng, Int. J. Hydrog. Energy, 2007, 32, 1262–1268.
40 J. Hu and M. Fichtner, Chem. Mater., 2009, 21, 3485–3490.
41 C. Li, Y. Liu, R. Ma, X. Zhang, Y. Li, M. Gao and H. Pan, ACS Appl. Mater. Interfaces, 2014, 6, 17024–17033.
42 J. Wang, T. Liu, G. Wu, W. Li, Y. Liu, C. M. Araújo, R. H. Scheicher, A. Blomqvist, R. Ahuja, Z. Xiong, P. Yang, M. Gao, H. Pan and P. Chen, Angew. Chem. Int. Ed., 2009, 48, 5828–5832.
43 T. Durojaiye, J. Hayes and A. Goudy, J. Phys. Chem. C, 2013, 117, 6554–6560.
44 S. Budavari, Ed., The Merck index: an encyclopedia of chemicals, drugs, and biologicals, Merck, Rahway, N.J., U.S.A, 11th ed., centennial ed., 1989.
45 Chemical Rubber Company and D. R. Lide, Eds., CRC handbook of chemistry and physics: a ready-reference book of chemical and physical data, CRC Press, Boca Raton, 84th ed., 2003.
46 A. Santoru, C. Pistidda, M. Brighi, M. R. Chierotti, M. Heere, F. Karimi, H. Cao, G. Capurso, A.-L. Chaudhary, G. Gizer, S. Garroni, M. H. Sørby, B. C. Hauback, R. Černý, T. Klassen and M. Dornheim, Inorg. Chem., 2018, 57, 3197–3205.
47 E. Napolitano, F. Dolci, R. Campesi, C. Pistidda, M. Hoelzel, P. Moretto and S. Enzo, Int. J. Hydrog. Energy, 2014, 39, 868–876.
48 I. P. Jain, C. Lal and A. Jain, Int. J. Hydrog. Energy, 2010, 35, 5133–5144.
49 J.-C. Crivello, B. Dam, R. V. Denys, M. Dornheim, D. M. Grant, J. Huot, T. R. Jensen, P. de Jongh, M. Latroche, C. Milanese, D. Milčius, G. S. Walker, C. J. Webb, C. Zlotea and V. A. Yartys, Appl. Phys. A, , DOI:10.1007/s00339-016-9602-0.
50 Y. Wang and Y. Wang, Prog. Nat. Sci. Mater. Int., 2017, 27, 41–49.
51 J. Zhang, S. Yan and H. Qu, Int. J. Hydrog. Energy, 2018, 43, 1545–1565.
52 Y. Sun, C. Shen, Q. Lai, W. Liu, D.-W. Wang and K.-F. Aguey-Zinsou, Energy Storage Mater., 2018, 10, 168–198.
53 L. Zhenglong, L. Zuyan and C. Yanbin, J. Alloys Compd., 2009, 470, 470–472.
54 Z. Dehouche, T. Klassen, W. Oelerich, J. Goyette, T. . Bose and R. Schulz, J. Alloys Compd., 2002, 347, 319–323.

download fileview on ChemRxivV5_12article_ESI_Worked_MH_problems.pdf (180.49 KiB)