the mathematical understandings of preservice and in-service teachers
TRANSCRIPT
The mathematical understandings of preservice and in-service teachersAuthor(s): THOMAS C. GIBNEY, JOHN L. GINTHER and FRED L. PIGGESource: The Arithmetic Teacher, Vol. 17, No. 2 (February 1970), pp. 155-162Published by: National Council of Teachers of MathematicsStable URL: http://www.jstor.org/stable/41186153 .
Accessed: 14/06/2014 22:37
Your use of the JSTOR archive indicates your acceptance of the Terms & Conditions of Use, available at .http://www.jstor.org/page/info/about/policies/terms.jsp
.JSTOR is a not-for-profit service that helps scholars, researchers, and students discover, use, and build upon a wide range ofcontent in a trusted digital archive. We use information technology and tools to increase productivity and facilitate new formsof scholarship. For more information about JSTOR, please contact [email protected].
.
National Council of Teachers of Mathematics is collaborating with JSTOR to digitize, preserve and extendaccess to The Arithmetic Teacher.
http://www.jstor.org
This content downloaded from 195.34.79.223 on Sat, 14 Jun 2014 22:37:15 PMAll use subject to JSTOR Terms and Conditions
С. Alan Riedesel Focus on research
Len Pikaart
The mathematical understandings of preservice and in-service teachers
THOMAS C. GIBNEY, JOHN L. GINTHER, and FRED L. PIGGE
Thomas Gibney is professor of education at the University of Toledo, Toledo, Ohio; John Ginther is professor of mathematics at Eastern Michigan University at Ypsilanti, Michigan; and Fred Pigge is professor of education at Bowling Green University, Bowling Green, Ohio.
Part I - Л Comparative Investigation
JLhe mathematics education of preservice and in-service elementary teachers has been the topic of several previous articles in the Arithmetic Teacher. Jack Sparks summarized articles in this area in 196 1,1 and J. Fred Weaver updated this summary in 1965.- The "Forum on Teacher Prep- aration" edited by Francis Mueller in 1968 and 1969 has kept the readers of the Arithmetic Teacher up to date with the topic. As Weaver (p. 72) stated in his article, "The direction taken [in in-service work] is very similar to that taken at the preservice level."3 The education of pros- pective teachers and the in-service educa- tion of teachers are two of the most impor- tant problems facing the profession today.
1. Jack N. Sparks, "Arithmetic Understandings Needed by Elementary School Teachers," The Arith- metic Teacher 8 (1961): 395-403.
2. J. Fred Weaver, 'The Mathematics Education of Elementary School Teachers: Preservice and In- service," The Arithmetic Teacher 12 (1965):71-75.
3. Ibid, p. 72.
All too often, curriculum leaders have at- tempted to treat these two activities as one problem and have attempted one solution. From the findings of the present study, one may infer that two unique problems do exist.
The problem
Did prospective elementary teachers without any teaching experience (pre- service) do better on a test (.05 level) designed to measure basic mathematical understandings than did teachers with ex- perience (in-service)?
Procedures
During the fall of 1967, a project was designed to compare the mathematical understandings of preservice and in-service elementary teachers.
The first major part of the project was the development of a test to employ as a measurement tool in the project. After several writing sessions and revisions that included a pilot testing session, a test of 65
Excellence in Mathematics Education - For All 155
This content downloaded from 195.34.79.223 on Sat, 14 Jun 2014 22:37:15 PMAll use subject to JSTOR Terms and Conditions
items was constructed to measure the basic mathematical understandings of preservice and in-service elementary teachers. Sample test items appear later in this article.
The test was administered to two dif- ferent groups, the first without teaching experience and the second with teaching experience. The preservice teachers were enrolled in elementary education at Bowl- ing Green State University, the University of Toledo, or Eastern Michigan University. These students had all completed at least one three-semester-hour course in mathe- matics, covering the real-number system and geometric topics. The in-service teachers were enrolled in undergraduate or graduate mathematics education courses at the three universities. An analysis of back- ground information supplied by the in- service teachers suggested that this group had about the same education and experi- ence patterns as the entire population of elementary teachers in the areas of the three universities.
The data-gathering period commenced with the second session of the 1967-68 academic year and continued through the spring session of 1969. During this period, 1,082 tests were administered. It was found that the responses of 887 preservice ele- mentary teachers without any teaching ex- perience and 177 in-service teachers con- tained usable data for this article. The proportions of teaching personnel from Bowling Green, Toledo, and Eastern Michigan areas were in the order of 2-2-1. That is, approximately 400 were from Bowling Green State University, 400 from the University of Toledo, and 200 from Eastern Michigan University.
The Test Instrument
A test composed of sixty-five items was used in this study. The test items were constructed to measure selected basic mathematical understandings in seven areas: (1) geometry, (2) number theory, (3) numeration systems, (4) fractional numbers, (5) structural properties for the set of whole numbers, (6) sets, and (7)
the four basic operations on the set of whole numbers.
An item discrimination index was com- puted for each item by comparing the correct answers for the top twenty-seven percent to the number of correct answers for the bottom twenty-seven percent. It was found that twenty-three items had an index between .40 and 1.00, twenty-seven items between .20 and .39, thirteen items be- tween .01 and .19, and two items between -1.00 and .00.
The median difficulty index (percent correct response) was fifty-two percent with a semi-interquartile range of fourteen percent.
The overall mean score for the test was 33.11 with a standard deviation of 8.99. The median for the test score distribution was 33. The Kuder-Richardson Formula 21 reliability estimate for the total test was .80.
Examples of test items follow -
Geometry: Is there just one line that can pass through point
R, or are there many lines:
*~~ff S f *
A. Just one B. Many C. A Few D. None
Number Theory: Which of the following is the prime product
expression for 24? A. 2 X 3 X 4 B. 2X2X3X2 C. 1X2X2X2X3 D. (3 X 3 X 3) - 3
Numeration Systems: Which example has a five in the hundredth's
place? A. 53.07 B. 115.51 C. 117.035 D. 7.0516 E. 5.005
Fractions: Which of the following fractions can you use to
represent the shaded part?
B. 2/3 ̂ ^H^^K^^ С 2/3 1/2 ШШФМ&-
d. 1/3 хшшт 1
156 The Arithmetic Teacher /February 1970
This content downloaded from 195.34.79.223 on Sat, 14 Jun 2014 22:37:15 PMAll use subject to JSTOR Terms and Conditions
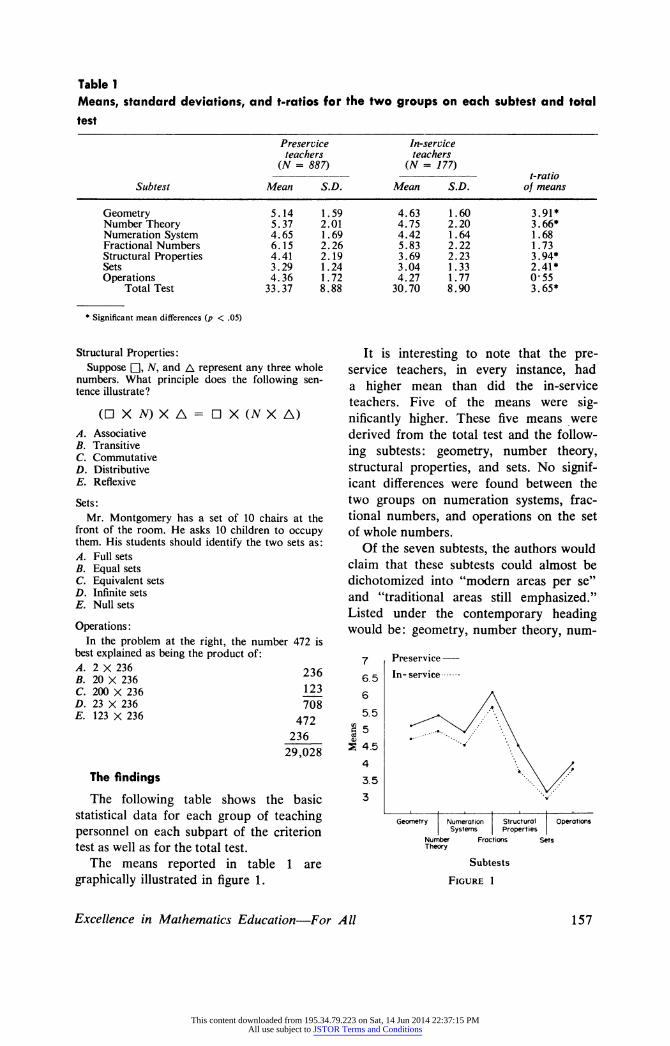
Table 1
Means, standard deviations, and t-ratios for the two groups on each subtest and total test
Preservice In-service teachers teachers
(N = 887) (N = 777) t-ratio Subtest Mean S.D. Mean S.D. of means
Geometry 5.14 1.59 4.63 1.60 3.91* Number Theory 5.37 2.01 4.75 2.20 3.66* Numeration System 4 . 65 1 . 69 4 . 42 1 . 64 1 . 68 Fractional Numbers 6.15 2.26 5.83 2.22 1.73 Structural Properties 4.41 2.19 3.69 2.23 3.94* Sets 3.29 1.24 3.04 1.33 2.41* Operations 4.36 1.72 4.27 1.77 0*55
Total Test 33.37 8.88 30.70 8.90 3.65*
* Significant mean differences (p < .05)
Structural Properties: Suppose □, N, and A represent any three whole
numbers. What principle does the following sen- tence illustrate?
(D X Л0 X Л = D X (N X Л) A. Associative B. Transitive C. Commutative D. Distributive E. Reflexive
Sets: Mr. Montgomery has a set of 10 chairs at the
front of the room. He asks 10 children to occupy them. His students should identify the two sets as: A. Full sets B. Equal sets C. Equivalent sets D. Infinite sets E. Null sets
Operations : In the problem at the right, the number 472 is
best explained as being the product of: A. 2 X 236 9o£ B. 20 X 236 С 200 X 236 123 D. 23 X 236 708 E. 123 X 236 472
236
29,028
The findings
The following table shows the basic statistical data for each group of teaching personnel on each subpart of the criterion test as well as for the total test.
The means reported in table 1 are graphically illustrated in figure 1.
It is interesting to note that the pre- service teachers, in every instance, had a higher mean than did the in-service teachers. Five of the means were sig- nificantly higher. These five means were derived from the total test and the follow- ing subtests: geometry, number theory, structural properties, and sets. No signif- icant differences were found between the two groups on numeration systems, frac- tional numbers, and operations on the set of whole numbers.
Of the seven subtests, the authors would claim that these subtests could almost be dichotomized into "modern areas per se" and "traditional areas still emphasized." Listed under the contemporary heading would be: geometry, number theory, num-
j Preservice
g 5 In-service
6 Л.
9 "
<V^' U 4.5
' '■*■ '' 4 • ' / i. ' A / 3.5 '''■'/// 3
Geometry Numeration Structural Operations Systems Properties
Number Fractions Sets Theory
Subtests
Figure 1
Excellence in Mathematics Education - For All 157
This content downloaded from 195.34.79.223 on Sat, 14 Jun 2014 22:37:15 PMAll use subject to JSTOR Terms and Conditions
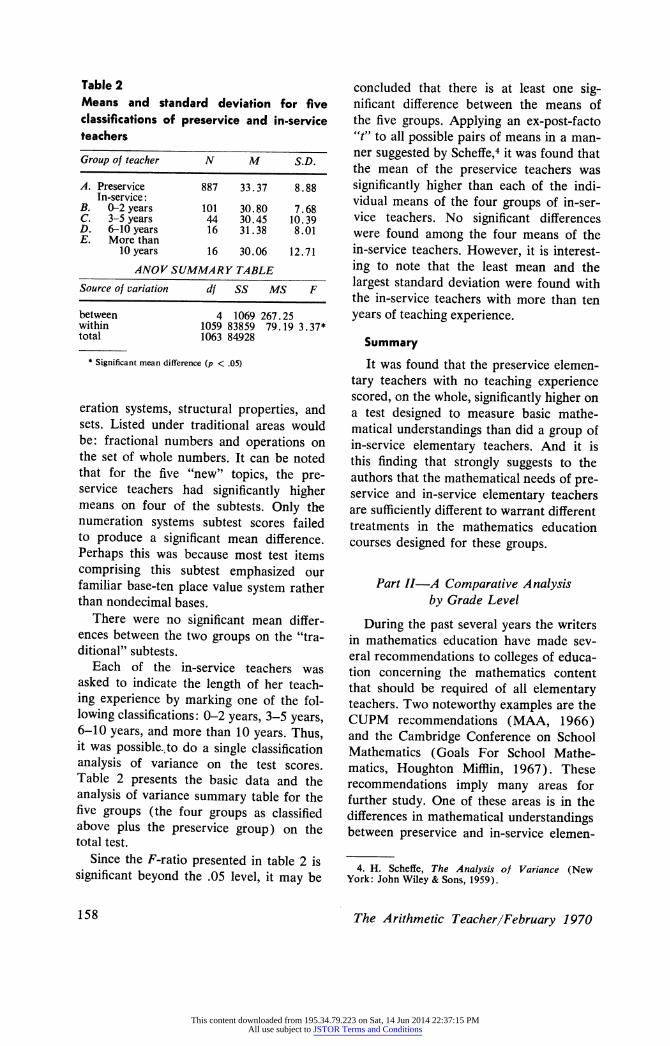
Table 2 Means and standard deviation for five classifications of preservice and in-service teachers
Group of teacher N M S.D.
A. Preservice 887 33.37 8.88 In-service :
B. 0-2 years 101 30.80 7.68 C. 3-5 years 44 30.45 10.39 D. 6-10 years 16 31.38 8.01 E. More than
10 years 16 30.06 12.71 ANOV SUMMARY TABLE
Source of variation df SS MS F
between 4 1069 267.25 within 1059 83859 79.19 3.37* total 1063 84928
* Significant mean difference (p < .05)
eration systems, structural properties, and sets. Listed under traditional areas would be: fractional numbers and operations on the set of whole numbers. It can be noted that for the five "new" topics, the pre- service teachers had significantly higher means on four of the subtests. Only the numeration systems subtest scores failed to produce a significant mean difference. Perhaps this was because most test items comprising this subtest emphasized our familiar base-ten place value system rather than nondecimal bases.
There were no significant mean differ- ences between the two groups on the "tra- ditional" subtests.
Each of the in-service teachers was asked to indicate the length of her teach- ing experience by marking one of the fol- lowing classifications: 0-2 years, 3-5 years, 6-10 years, and more than 10 years. Thus, it was possible., to do a single classification analysis of variance on the test scores. Table 2 presents the basic data and the analysis of variance summary table for the five groups (the four groups as classified above plus the preservice group) on the total test.
Since the F-ratio presented in table 2 is significant beyond the .05 level, it may be
concluded that there is at least one sig- nificant difference between the means of the five groups. Applying an ex-post-facto "ť to all possible pairs of means in a man- ner suggested by Scheffe,4 it was found that the mean of the preservice teachers was significantly higher than each of the indi- vidual means of the four groups of in-ser- vice teachers. No significant differences were found among the four means of the in-service teachers. However, it is interest- ing to note that the least mean and the largest standard deviation were found with the in-service teachers with more than ten years of teaching experience.
Summary It was found that the preservice elemen-
tary teachers with no teaching experience scored, on the whole, significantly higher on a test designed to measure basic mathe- matical understandings than did a group of in-service elementary teachers. And it is this finding that strongly suggests to the authors that the mathematical needs of pre- service and in-service elementary teachers are sufficiently different to warrant different treatments in the mathematics education courses designed for these groups.
Part II - A Comparative Analysis by Grade Level
During the past several years the writers in mathematics education have made sev- eral recommendations to colleges of educa- tion concerning the mathematics content that should be required of all elementary teachers. Two noteworthy examples are the CUPM recommendations (MA A, 1966) and the Cambridge Conference on School Mathematics (Goals For School Mathe- matics, Houghton Mifflin, 1967). These recommendations imply many areas for further study. One of these areas is in the differences in mathematical understandings between preservice and in-service elemen-
4. H. Scheffe, The Analysis of Variance (New York: John Wiley & Sons, 1959).
158 The Arithmetic Teacher /February 1970
This content downloaded from 195.34.79.223 on Sat, 14 Jun 2014 22:37:15 PMAll use subject to JSTOR Terms and Conditions
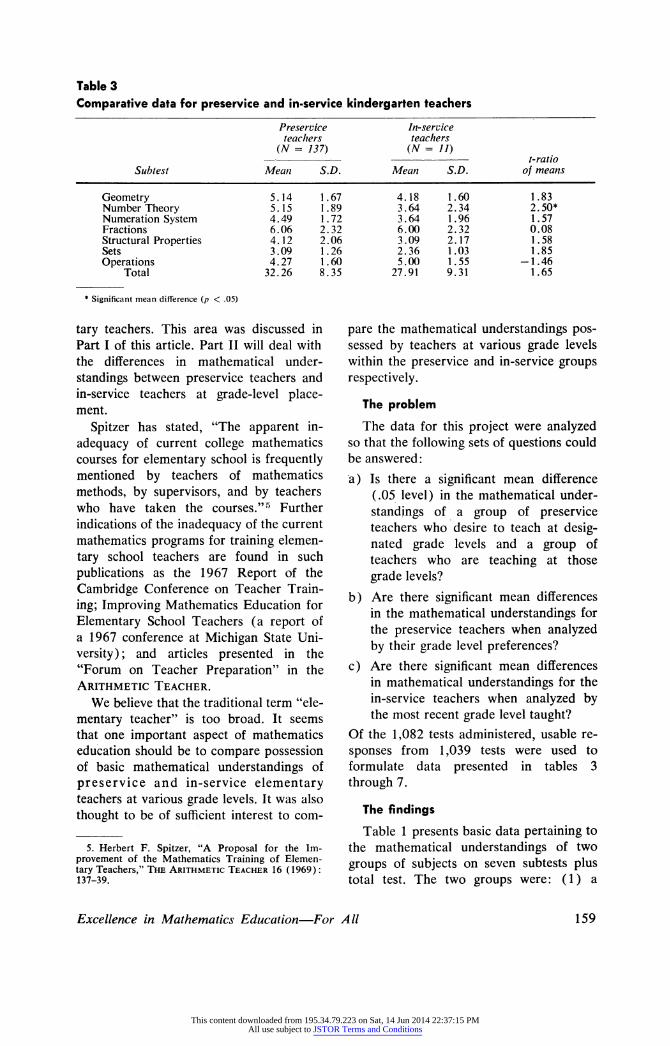
Table 3
Comparative data for preservìce and in-service kindergarten teachers
Preservice In-service teachers teachers
{N = 137) {N = 11) t-ratio S übtest Mean S.D. Mean S.D. of means
Geometry 5.14 1.67 4.18 1.60 1.83 Number Theory 5.15 1.89 3.64 2.34 2.50* Numeration System 4.49 1.72 3.64 1.96 1.57 Fractions 6.06 2.32 6.00 2.32 0.08 Structural Properties 4.12 2 . 06 3 . 09 2.17 1.58 Sets 3.09 1.26 2.36 1.03 1.85 Operations 4.27 1.60 5.00 1.55 -1.46
Total 32.26 8.35 27.91 9.31 1.65
* Significant mean difference (p < .05)
tary teachers. This area was discussed in Part I of this article. Part II will deal with the differences in mathematical under- standings between preservice teachers and in-service teachers at grade-level place- ment.
Spitzer has stated, "The apparent in- adequacy of current college mathematics courses for elementary school is frequently mentioned by teachers of mathematics methods, by supervisors, and by teachers who have taken the courses."5 Further indications of the inadequacy of the current mathematics programs for training elemen- tary school teachers are found in such publications as the 1967 Report of the Cambridge Conference on Teacher Train- ing; Improving Mathematics Education for Elementary School Teachers (a report of a 1967 conference at Michigan State Uni- versity); and articles presented in the "Forum on Teacher Preparation" in the Arithmetic Teacher.
We believe that the traditional term "ele- mentary teacher" is too broad. It seems that one important aspect of mathematics education should be to compare possession of basic mathematical understandings of preservice and in-service elementary teachers at various grade levels. It was also thought to be of sufficient interest to com-
5. Herbert F. Spitzer, "A Proposal for the Im- provement of the Mathematics Training of Elemen- tary Teachers," The Arithmetic Teacher 16 (1969) : 137-39.
pare the mathematical understandings pos- sessed by teachers at various grade levels within the preservice and in-service groups respectively.
The problem
The data for this project were analyzed so that the following sets of questions could be answered: a) Is there a significant mean difference
(.05 level) in the mathematical under- standings of a group of preservice teachers who desire to teach at desig- nated grade levels and a group of teachers who are teaching at those grade levels?
b) Are there significant mean differences in the mathematical understandings for the preservice teachers when analyzed by their grade level preferences?
c) Are there significant mean differences in mathematical understandings for the in-service teachers when analyzed by the most recent grade level taught?
Of the 1,082 tests administered, usable re- sponses from 1,039 tests were used to formulate data presented in tables 3 through 7.
The findings
Table 1 presents basic data pertaining to the mathematical understandings of two groups of subjects on seven subtests plus total test. The two groups were: (1) a
Excellence in Mathematics Education - For All 159
This content downloaded from 195.34.79.223 on Sat, 14 Jun 2014 22:37:15 PMAll use subject to JSTOR Terms and Conditions
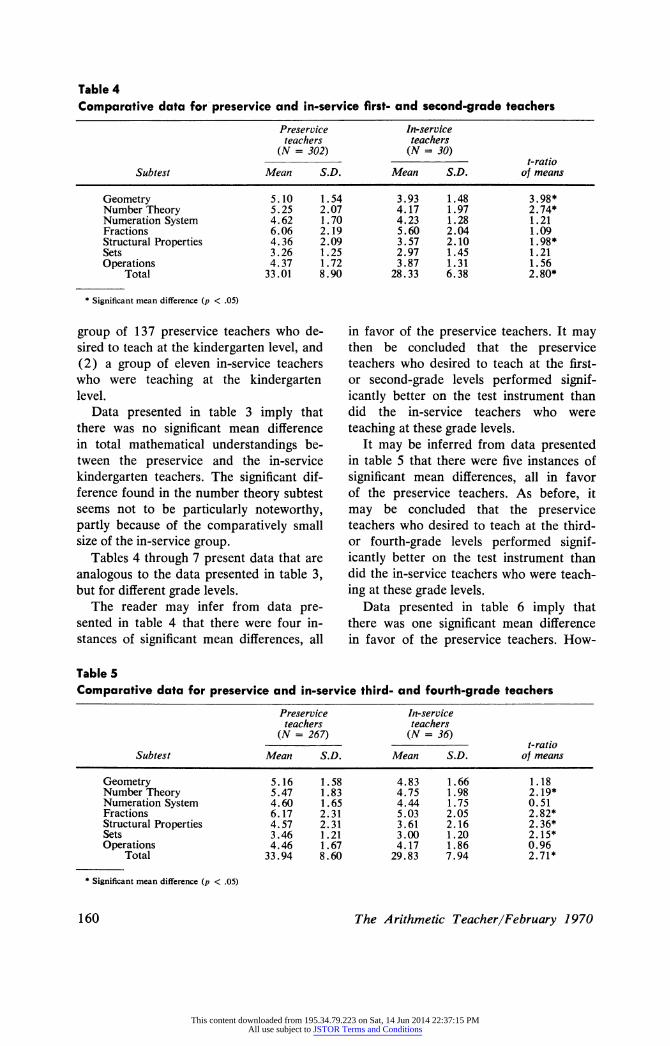
Table 4
Comparative data for preservice and in-service first- and second-grade teachers
Preservice In-service teachers teachers
(N = 302) (N » 30) t-ratio Subtest Mean S.D. Mean S.D. of means
Geometry 5.10 1.54 3.93 1.48 3.98* Number Theory 5.25 2.07 4.17 1.97 2.74* Numeration System 4.62 1.70 4.23 1.28 1.21 Fractions 6.06 2.19 5.60 2.04 1.09 Structural Properties 4.36 2.09 3.57 2.10 1.98* Sets 3.26 1.25 2.97 1.45 1.21 Operations 4.37 1.72 3.87 1.31 1.56
Total 33.01 8.90 28.33 6.38 2.80*
* Significant mean difference (p < .05)
group of 137 preservice teachers who de- sired to teach at the kindergarten level, and (2) a group of eleven in-service teachers who were teaching at the kindergarten level.
Data presented in table 3 imply that there was no significant mean difference in total mathematical understandings be- tween the preservice and the in-service kindergarten teachers. The significant dif- ference found in the number theory subtest seems not to be particularly noteworthy, partly because of the comparatively small size of the in-service group.
Tables 4 through 7 present data that are analogous to the data presented in table 3, but for different grade levels.
The reader may infer from data pre- sented in table 4 that there were four in- stances of significant mean differences, all
in favor of the preservice teachers. It may then be concluded that the preservice teachers who desired to teach at the first- or second-grade levels performed signif- icantly better on the test instrument than did the in-service teachers who were teaching at these grade levels.
It may be inferred from data presented in table 5 that there were five instances of significant mean differences, all in favor of the preservice teachers. As before, it may be concluded that the preservice teachers who desired to teach at the third- or fourth-grade levels performed signif- icantly better on the test instrument than did the in-service teachers who were teach- ing at these grade levels.
Data presented in table 6 imply that there was one significant mean difference in favor of the preservice teachers. How-
Table 5 Comparative data for preservice and in-service third- and fourth-grade teachers
Preservice In-service teachers teachers
(N = 267) (N = 36) t-ratio Subtest Mean S.D. Mean S.D. of means
Geometry 5.16 1.58 4.83 1.66 1.18 Number Theory 5.47 1.83 4.75 1.98 2.19* Numeration System 4. 60 1.65 4. 44 1.75 0.51 Fractions 6.17 2.31 5.03 2.05 2.82* Structural Properties 4.57 2.31 3.61 2.16 2.36* Sets 3.46 1.21 3.00 1.20 2.15* Operations 4.46 1.67 4.17 1.86 0.96
Total 33.94 8.60 29.83 7.94 2.71*
* Significant mean difference (p < .05)
160 The Arithmetic Teacher /February 1970
This content downloaded from 195.34.79.223 on Sat, 14 Jun 2014 22:37:15 PMAll use subject to JSTOR Terms and Conditions
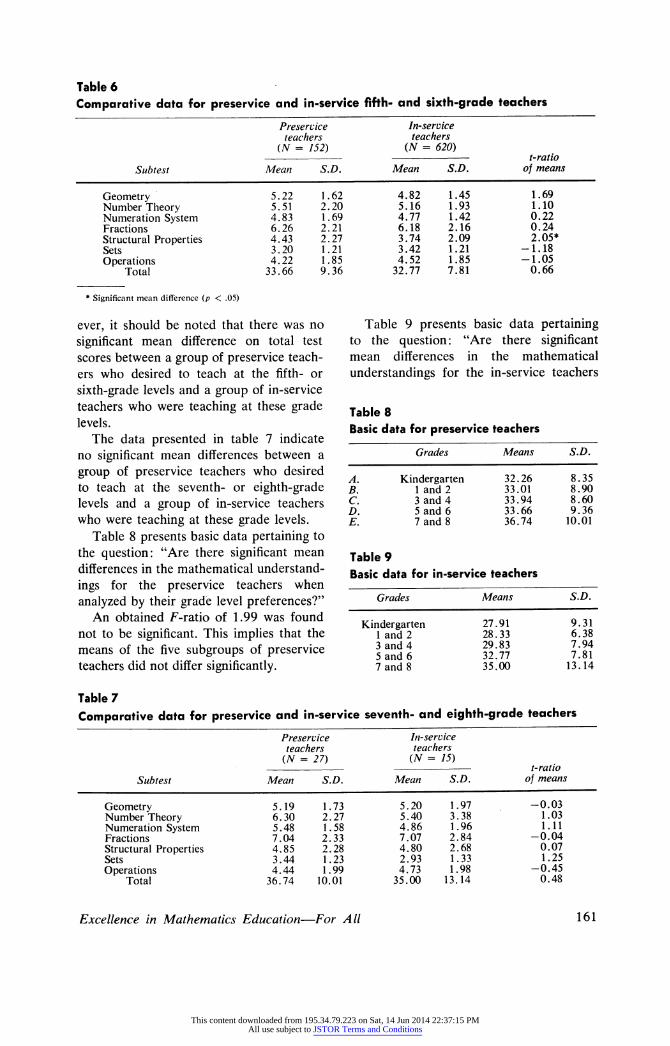
Table 6
Comparative data for preservice and ¡n-servke fifth- and sixth-grade teachers
Preservice In-service teachers teachers
(N = 152) (N = 620) t- rat io
S übt est Mean S.D. Mean S.D. о] means
Geometry 5.22 1.62 4.82 1.45 1.69 Number Theory 5.51 2.20 5.16 1.93 1.10 Numeration System 4.83 1.69 4.77 1.42 0.22 Fractions 6.26 2.21 6.18 2.16 0.24 Structural Properties 4.43 2.27 3.74 2.09 2.05* Sets 3.20 1.21 3.42 1.21 -1.18 Operations 4.22 1.85 4.52 1.85 -1.05
Total 33.66 9.36 32.77 7.81 0.66
* Significant mean difference (p < .05)
ever, it should be noted that there was no significant mean difference on total test scores between a group of preservice teach- ers who desired to teach at the fifth- or sixth-grade levels and a group of in-service teachers who were teaching at these grade levels.
The data presented in table 7 indicate no significant mean differences between a group of preservice teachers who desired to teach at the seventh- or eighth-grade levels and a group of in-service teachers who were teaching at these grade levels.
Table 8 presents basic data pertaining to the question: "Are there significant mean differences in the mathematical understand- ings for the preservice teachers when analyzed by their grade level preferences?"
An obtained F-ratio of 1.99 was found not to be significant. This implies that the means of the five subgroups of preservice teachers did not differ significantly.
Table 9 presents basic data pertaining to the question: "Are there significant mean differences in the mathematical understandings for the in-service teachers
Table 8 Basic data for preservice teachers
Grades Means S.D.
A. Kindergarten 32.26 8.35 B. land 2 33.01 8.90 С 3and4 33.94 8.60 D. 5 and 6 33.66 9.36 E. 7 and 8 36.74 10.01
Table 9 Basic data for in-service teachers
Grades Means S.D.
Kindergarten 27.91 9.31 land 2 28.33 6.38 3and4 29.83 7.94 5 and 6 32.77 7.81 7 and 8 35.00 13.14
Table 7
Comparative data for preservice and in-service seventh- and eighth-grade teachers
Preservice In-service teachers teachers (N = 27) (M = 15)
t- rat io Subtest Mean S.D. Mean S.D. of means
Geometry 5.19 1.73 5.20 1.97 -0.03 Number Theory 6.30 2.27 5.40 3.38 1.03 Numeration System 5.48 1.58 4.86 1.96 1.11 Fractions 7.04 2.33 7.07 2.84 -0.04 Structural Properties 4.85 2.28 4.80 2.68 0.07 Sets 3.44 1.23 2.93 1.33 1.25 Operations 4.44 1.99 4.73 1.98 -0.45
Total 36.74 10.01 35.00 13.14 0.48
Excellence in Mathematics Education - For All 161
This content downloaded from 195.34.79.223 on Sat, 14 Jun 2014 22:37:15 PMAll use subject to JSTOR Terms and Conditions
when analyzed by the most recent grade level taught?"
An obtained F-ratio of 3.88 was found to be significant at the .05 level. After ap- plying Scheffe "ťs", it was found that the seventh- and eighth-grade mean was greater than any of the other means. No other significant pair-wise differences were found.
A composite mean test was performed. A composite mean was obtained for the kindergarten and the first/second grade groups. Another composite mean was ob- tained for the third/fourth and fifth/sixth grade groups. It was found that the com- posite mean for the third through sixth grade group was significantly greater than the composite mean for the kindergarten through second grade group. Might this imply that educators responsible for ele- mentary in-service teacher education have two different populations with which to work?
37 I^siTviro
36 Iii-srrvicp . 35 /> 34 ^
</ z'' 33
^ ^~^^ ^
» 32 ^
Í 31 ^ 30
29 28 .-■•••"■■"
27 26 . . - _ _._ _.
К 1Ö2 384 5Ö6 788
(irado Lrvols Figuri: 2
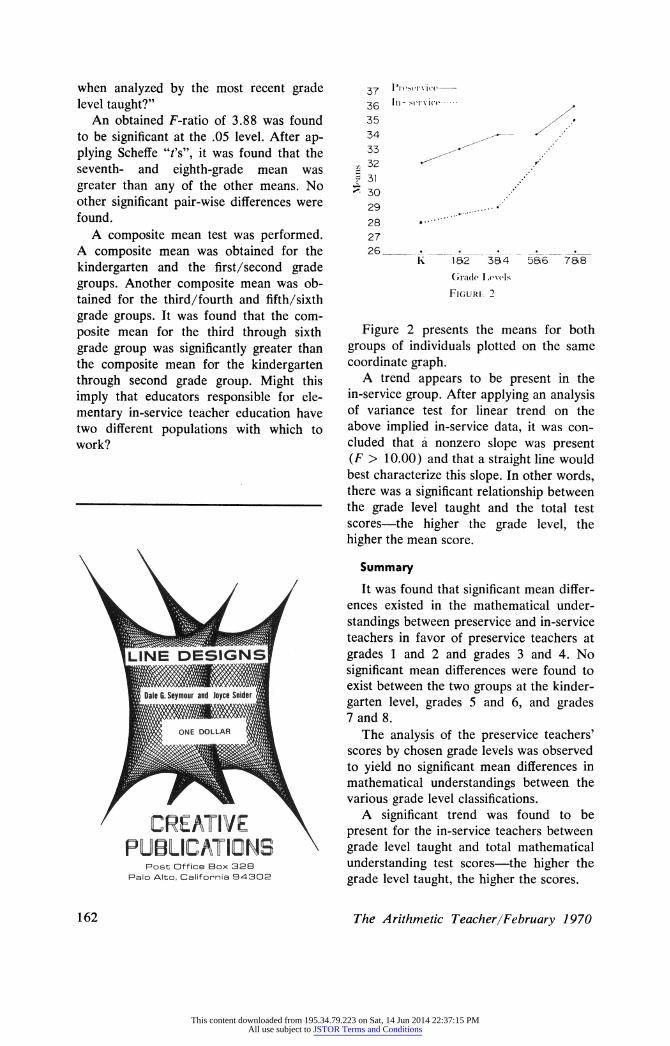
Figure 2 presents the means for both groups of individuals plotted on the same coordinate graph.
A trend appears to be present in the in-service group. After applying an analysis of variance test for linear trend on the above implied in-service data, it was con- cluded that á nonzero slope was present (F > 10.00) and that a straight line would best characterize this slope. In other words, there was a significant relationship between the grade level taught and the total test scores - the higher the grade level, the higher the mean score.
Summary It was found that significant mean differ-
ences existed in the mathematical under- standings between preservice and in-service teachers in favor of preservice teachers at grades 1 and 2 and grades 3 and 4. No significant mean differences were found to exist between the two groups at the kinder- garten level, grades 5 and 6, and grades 7 and 8.
The analysis of the preservice teachers' scores by chosen grade levels was observed to yield no significant mean differences in mathematical understandings between the various grade level classifications.
A significant trend was found to be present for the in-service teachers between grade level taught and total mathematical understanding test scores - the higher the grade level taught, the higher the scores.
162 The Arithmetic Teacher /February 1970
This content downloaded from 195.34.79.223 on Sat, 14 Jun 2014 22:37:15 PMAll use subject to JSTOR Terms and Conditions