the merits of a general numeracy test as a predictor of statistics exam performance alistair j....
TRANSCRIPT

The merits of a general numeracy test as a predictor of statistics exam performance
Alistair J. Harvey
University of Winchester
The importance of numeracy in psychology
• Quantitative methods central to study of psychology.• BA/BSc Psychology Entry criteria includes GCSE
Maths Grade C (or equivalent).
• Mulhern & Wylie (2006) obtained numeracy baselines from about 1000 psychology students across a range of HE institutions.
• Identified students’ conceptual difficulties in mathematical thinking.

Possible implications of poor numeracy for learning statistics
• Arithmetic calculation:• Basic skills should not be assumed.• If r=.3, then r²=.09 (not .9!).
• Algebraic reasoning• Difficulties distinguishing between variant and
invariant formulas [e.g. for (a+b)/(a-b), doubling a and b leads to same solution].
• Suggests some may have problems reasoning with transformed or rescaled variables and their changing effects on mean, sd, distributions, etc.

Possible implications of poor numeracy for learning statistics
Few would argue that this is one of the most important skills required for psychology; yet less than half the students made the correct correspondence.
• Graphical interpretation:

Does numeracy ability predict statistics performance?
• Gnaldi (2006) investigated this relationship on an undergraduate introductory statistics course (University of Glasgow).
• Stepwise regression showed Numeracy Test A* (fractions, proportions, percentages) and Test B** (descriptive statistics, data displays) explained 25% of the variance in Introductory Stats Exam scores.
• But found no difference between statistics exam scores and maths entry grades (GCSE, A level, etc).
Note *p<.05; **p<.001

Does general numeracy ability predict statistics performance in psychology?
• Despite the GCSE Maths prerequisite, many students still perform badly in this core module (British Psychology Society, 2003).
• BPS QE quantitative methods syllabus requires little manual number manipulation.
• Students are not required to learn formulae.• Perform minimal calculations by hand with analyses
performed using SPSS, SAS, Minitab, etc. • Students must interpret computer-generated output
correctly. • Raises questions over predictive validity of general
numeracy skills/GCSE Maths performance.

Does GCSE Maths predict psychology degree success?
• Huws, Reddy, Talcott (2006):
1st Year 2nd Year FYP Final degree
Maths GCSE .15 .12 .07 .19
English GCSE .12 .14 .10 .29*
Science GCSE .27 .23 .35* .38**
Note: **p<.01; *p<.05; n=56.
A stepwise regression found GCSE science to be the single best predictor.

The Winchester Numeracy Diagnostic
• To what extent does the Winchester numeracy ‘diagnostic’ predict undergraduate statistics (exam) performance?
• Diagnostic is a one hour test based on GCSE level maths questions.
• Comprised of four sections:1. Arithmetic (e.g. 0.25 <= 25% > 0.1)2. Fractions/Decimals/Percentages (e.g. convert 1/5; 1/6; 3/20)3. Statistics/Graphs (e.g. descriptive stats, graph interpretation)4. Algebra (e.g. remove brackets and simplify:
5(2x + y) = 3(4x – 7y)
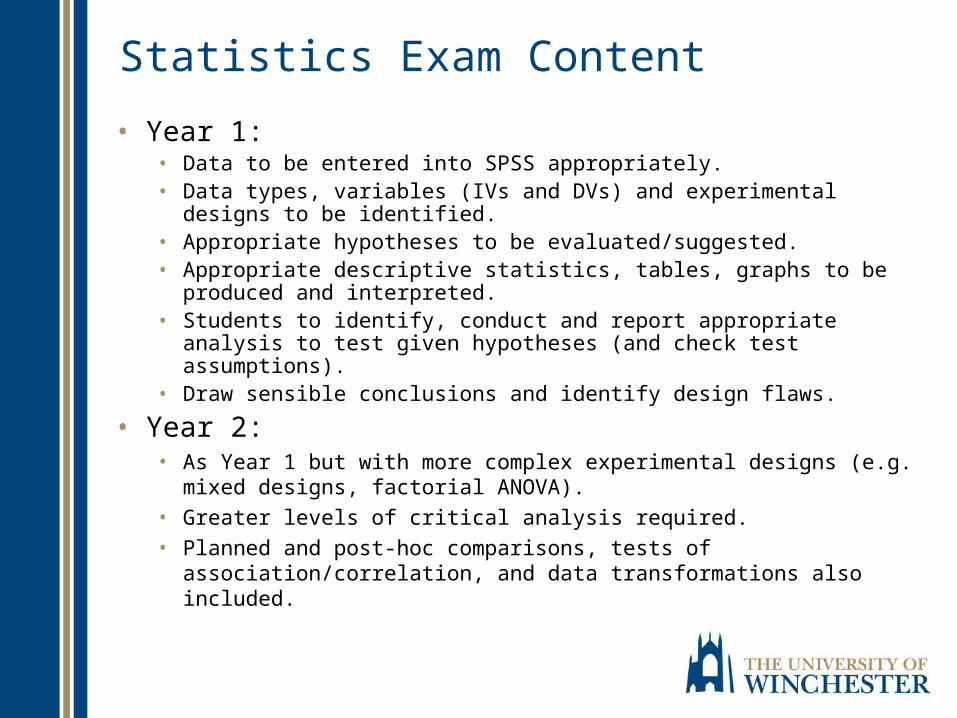
Statistics Exam Content
• Year 1:• Data to be entered into SPSS appropriately.• Data types, variables (IVs and DVs) and experimental designs to be
identified.• Appropriate hypotheses to be evaluated/suggested.• Appropriate descriptive statistics, tables, graphs to be produced and
interpreted.• Students to identify, conduct and report appropriate analysis to test
given hypotheses (and check test assumptions).• Draw sensible conclusions and identify design flaws.
• Year 2:• As Year 1 but with more complex experimental designs (e.g. mixed
designs, factorial ANOVA).
• Greater levels of critical analysis required.
• Planned and post-hoc comparisons, tests of association/correlation, and data transformations also included.
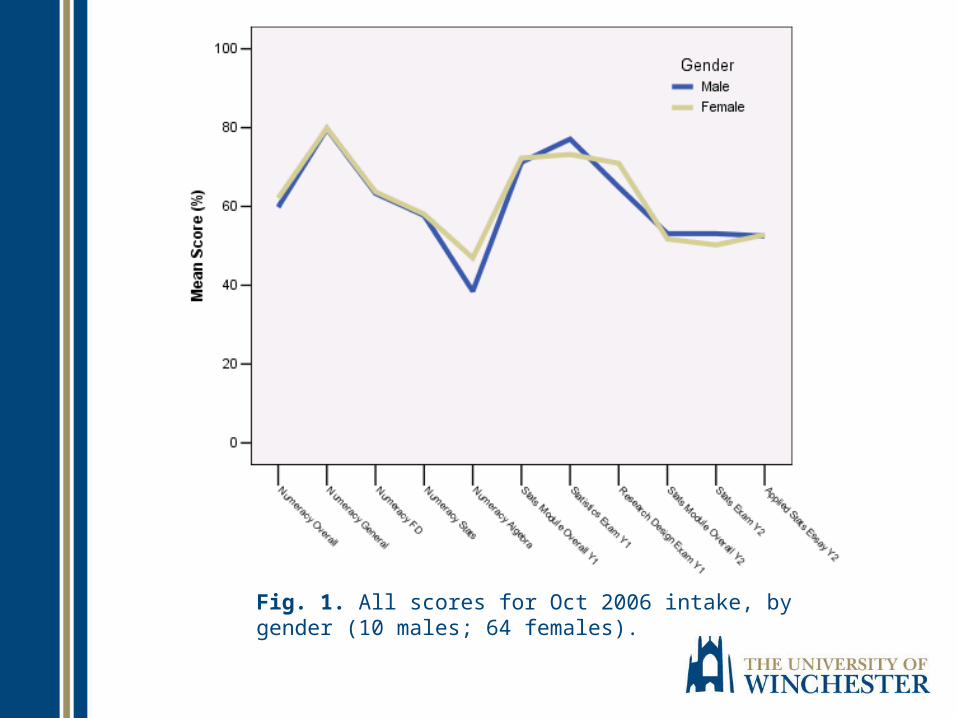
Fig. 1. All scores for Oct 2006 intake, by gender (10 males; 64 females).

2006 Intake (Y1 Stats Exam)Correlations:
Table 1. Correlation coefficients between numeracy subcomponents (IVs) and Y1 stats exam (DV)
Arithmetic Stats F/D Algebra
Stats Exam (Year 1) .46** .34** .12 .26*
Note n=74; **p<.01; *p<.05.

Forced Entry (Enter) Regression: 2006 Intake (Y1 Stats Exam)
Variable B SE B β
Constant 28.89 11.24
Arithmetic .50 .16 .40**
Statistics .12 .12 .14
Algebra .01 .08 .01
Fractions/Decimals -.04 .09 -.05
Note R² = .23; **p<.01.

2006 Intake (Y2 Stats Exam)Correlations:
Table 1. Correlation coefficients between numeracy subcomponents (IVs) and Y2 stats exam (DV)
Arithmetic Stats F/D Algebra
Stats Exam (Year 2) .23* .24* .21* .20*
Note n=74; *p<.05.

Forced Entry (Enter) Regression: 2006 Intake (Y2 Stats Exam)
Variable B SE B β
Constant 19.98 15.27
Arithmetic .18 .22 .12
Statistics .08 .17 .08
Algebra .04 .11 .05
Fractions/Decimals .15 .12 .16
Note R² = .09.

Fig. 2. All scores for Oct 2007 intake, by gender (19 males; 72 females); *p<.05.
*

2007 Intake (Y1 Stats Exam)Correlations:
Table 1. Correlation coefficients between numeracy subcomponents (IVs) and Y1 stats exam (DV)
Arithmetic Stats F/D Algebra
Stats Exam (Year 1) -.01 .05 -.06 -.20
Note n=91.

Forced Entry (Enter) Regression: 2007 Intake (Y1 Stats Exam)
Variable B SE B β
Constant 60.02 9.35
Arithmetic .06 .16 .05
Statistics -.05 .10 -.06
Algebra -.24 .10 .30
Fractions/Decimals .15 .11 .19
Note R² = .07.

Discussion
• No major gender differences in numeracy and stats performance found.
• Numeracy ‘diagnostic’ not successful at predicting performance on Year 1 and 2 Stats Exams.
• Only the Arithmetic sub-component was a significant predictor, but accounts for only 23% of the variance for Year 1 Stats Exam in 2006 cohort only.
• Gnaldi (2006) found descriptive stats numeracy sub-component accounted for most of the 25% of undergrad stats exam variance (followed by Fractions/Decimals/Percentages).
• Results lend some support to Gnaldi’s (2006) finding of no relationship between entry maths qualification (e.g. GCSE, A level) and stats test performance.
• And raise doubts over Mulhern and Wylie’s (2006) claim of an important relationship between general numeracy ability and stats performance.

Conclusions• Important difference between numeracy ability and “mathematical
literacy” (Hoyles et al., 2002). • Numeracy refers to abstract number manipulation and calculations,
which are now usually performed by computers.• Mathematical literacy refers to the application of maths to real data
outputs, work situations and practices (Hoyles et al., 2002). • Mathematical literacy (Hoyles, et al., 2002):
• Systematic and precise data-entry techniques and monitoring.• Context-dependent, multi-step calculations and estimations (esp. with IT).• Modelling of variables/relationships.• Interpreting/transforming graphical/symbolic data.• Extrapolating results/trends across different domains.• Recognising anomalous/erroneous results/effects.• Concise clear communication of judgements.
• These skills are more important for learning quantitative methods but are not well tested by the general numeracy tests (e.g. GCSE Maths).

Conclusions and Future Directions
• Is GCSE Maths a necessary pre-requisite for Psychology degree enrolment?
• Follow-up paper to include all GCSE grades as predictors.• Other factors may also be worth exploring:
• Cognitive style• Learning approach• Motivation/interest in subject• Personality/confidence• Emotional intelligence• Competitiveness

Overall numeracy and stats exam performance (%) – 2006 intake*
*n=74 (64 females; 10 males)

Overall numeracy and stats exam performance (%) – 2007 intake*
*n=91 (72 females; 19 males)