the metlife survey of the american teacher: preparing ... survey part 2_embargoed... · the metlife...
TRANSCRIPT

The MetLife Survey of the American Teacher: Preparing Students for College and Careers
Part 2: Teaching Diverse Learners
The information in this report is embargoed until March 23, 2011
The public version of the report will be available on that date at www.metlife.com/teachersurvey
The MetLife Survey of the American Teacher: Preparing Students for College and Careers The MetLife Survey of the American Teacher: Preparing Students for College and Careers examines the priority that all students graduate from high school prepared for college and careers, what being college- and career-ready entails, and the implications of this goal for teaching. The results are based on a national survey of 1,000 public school teachers (grades 6-12), 2,002 public school students (grades 6-12), 580 parents of public school students (grades 6-12), and 301 business executives from Fortune 1000 companies conducted in fall 2010. In addition, education thought leaders and teacher leaders participated in a related online strategy session. The findings are being released in two reports during the first quarter of 2011: Part 1: Clearing the Path examines the importance of being college- and career-ready, what this
level of preparation includes, and what it may take to get there. Part 2: Teaching Diverse Learners looks at differences in student needs, how teachers address them
and how well students feel their needs are being met.
Message from MetLife
In our lives and in our work, it is important to be prepared for new opportunities as well as the uncertainties of the future. By almost any measure, a good education is the best preparation for the opportunities and obstacles that may lie ahead. Unfortunately, too many students in the United States and many other nations are not gaining the knowledge and skills needed for future success. As a result, our nation is now engaged in an important debate about priorities and standards of education in the 21st century. There is also dialogue among the states and with other countries regarding how best to serve the needs of society, the economy, individual students, and the educators who nurture them. In this context the voices and findings shared in the new MetLife Survey of the American Teacher: Preparing Students for College and Careers truly resonate. A decade ago, the MetLife Teacher survey asked, “Are We Preparing Students for the 21st Century?” The responses revealed a misalignment between students’ aspirations and the expectations of parents and teachers. This time around, in addition to revisiting the issue, we also took a closer look at what adequate preparation actually entails. The results shed light on the opportunities and tools that might better prepare America’s students to be competitive in a global economy. MetLife has great respect for teachers. We have conducted this annual survey for 27 years in order to share their important voices with other educators, policymakers, and the public. This year for the first time, in addition to the opinions of students and parents, the survey adds the voice of employers by including corporate executives. All of us have a role to play in ensuring that students gain the knowledge and skills needed to be successful in their education, careers, and personal lives. We encourage you to join us in examining and sharing the results of this survey and in discussing its implications.
C. Robert Henrikson Chairman of the Board, President and Chief Executive Officer MetLife, Inc.

The MetLife Survey of the American Teacher: Preparing Students for College and Careers
Part 2: Teaching Diverse Learners Table of Contents Summary .......................................................................................................................................... 1 Background ...................................................................................................................................... 3 Addressing Needs of Diverse Learners is a High Priority – for Some ............................................... 4 Teacher Attention Makes a Difference to Students, But Not Enough ............................................. 6 Students Want Teacher Expectations to be Aligned with Their Own .............................................. 8 Diverse Learners Struggle with College and Career Readiness ....................................................... 9 Teachers Identify High-Impact Resources to Address Needs of Diverse Learners ........................ 11 High School Girls Have Higher Educational Aspirations than Boys ................................................ 13 Teachers, Parents and Business Executives Show Support for Efforts to Improve Teacher Quality .............................................................................................................................. 16 Teachers, Students and Parents Indicate a Need to Improve School and Teaching Quality ......... 17 Conclusion ...................................................................................................................................... 20 Endnotes ........................................................................................................................................ 21 About the 2010 Survey and The MetLife Survey of the American Teacher Series ............................................. Inside back cover

Part 2: Teaching Diverse Learners 1
The MetLife Survey of the American Teacher: Preparing Students for College and Careers
Part 2: Teaching Diverse Learners
Summary Part 2 of the survey examines views among middle and high school teachers, students, parents and business executives from Fortune 1000 companies on what it takes to graduate each and every student from high school ready for college and a career, and the implications for teaching diverse learners – students whose low income status, limited English fluency, or learning disabilities make learning more difficult. The survey also explores both teacher and student perceptions of differentiated instruction efforts and teacher attention to individual students, and compares opinions regarding school and teacher quality. Among the major findings are:
Addressing Needs of Diverse Learners is a High Priority – for Some Nine in ten teachers (91%) say that strengthening programs and resources to help diverse
learners with the highest needs meet college- and career-ready standards should be a priority in education, including 59% who say this must be done as one of the highest priorities.
Fewer Fortune 1000 executives see this as a highest priority than do teachers, with 31% of executives identifying strengthening programs and resources to help diverse learners as one of the highest priorities in education.
Parents share a view similar to that of teachers; 57% say that strengthening programs and resources to help diverse learners must be done as one of the highest priorities in education.
Teacher Attention Makes a Difference to Students, But Not Enough Six in ten teachers (61%) say they are able to differentiate instruction a great deal to address
the different learning needs of students within a class. Math teachers are the least likely to say they can differentiate instruction a great deal (46%
vs. 60% of English teachers and 65% of teachers of other subjects). On average, students give their teachers a grade of B- for teaching individual students
according to their different needs and abilities. High-need students grade their teachers lower in this area. Students who have considered
dropping out of school are four times as likely as other students to give their teachers a grade of D or F (45% vs. 11%).
Opinions of School Quality and How to Assess Teacher Effectiveness Differ Significantly
Only one-quarter of students (26%) rate the overall quality of the education that they receive at school as excellent.
Students who plan on getting at least a bachelor’s degree are more likely than those planning for a technical, trade or two-year postsecondary education or those not planning for any education beyond high school to rate their school’s education quality as excellent

2 The MetLife Survey of the American Teacher: Preparing Students for College and Careers
(29% vs. 19% vs. 13%). A plurality of students (57%) rates the overall quality of the education that they receive at school as good.
Low-income students are more likely than others to rate the overall quality of education at their school as fair or poor (22% vs. 14%), as are learning-challenged students (24% vs. 16%).
There is a significant split among adult stakeholders as to whether using measurements of teacher effectiveness that are based in significant part on student achievement growth should be a priority. More than nine in ten parents (92%) and Fortune 1000 executives (97%) believe such measurements should be a higher- or lower-level priority. In contrast, 69% of teachers say that this is a priority.
Teachers in Schools with Many High-Need Students Place Higher Value on Reforms and Resources Teachers in schools with high proportions of low-income students are more likely than those
with few low-income students to consider reform efforts to improve teacher quality to be a top priority. Teachers in schools with mostly low-income students (two-thirds or more) are more likely than those with few low-income students (one-third or fewer) to say that the following reform efforts must be done as one of the highest priorities in education: using measurements of teacher effectiveness that are based in significant part on student growth (35% vs. 19%); and giving schools more ability to remove teachers who are not serving students well (49% vs. 38%).
Teachers in schools with many high-need students value a range of resources to address the different learning needs of individual students. Teachers with two-thirds or more low-income students are more likely than those with one-third or fewer low-income students to say the following resources would have a major impact on their ability to address these needs: access to online and other technology-based resources to help personalize education (72% vs. 59%); better tools for understanding students’ learning strengths and needs (70% vs. 56%); instructional strategies to teach effectively in a classroom where many students speak a language other than English (69% vs. 58%); and the availability of a learning expert (57% vs. 42%).
Diverse Learners Differ on College Aspirations Learning-challenged students are less likely than others to say it is very likely they will go to
college (62% vs. 78%); and are less likely to be very confident that they will achieve their goals for the future (30% vs. 50%).
Low-income students are three times as likely to say their highest level of education will be no more than a high school diploma (19% vs. 4%) and are less likely to be very confident they will achieve their goals for the future (39% vs. 50%).
A gender gap on college aspiration emerges in high school. While girls and boys in middle school do not differ in their aspirations for college, high school girls are more likely than boys to say it is very likely they will go to college (83% vs. 71%) and to say that they plan on getting a bachelor’s or higher degree (83% vs. 72%).

Part 2: Teaching Diverse Learners 3
Background Educating all students to high standards – specifically, readying them for college and careers – is not only a compelling ideal for education; it is an emerging policy mandate. Part 1 of this year’s survey report, Clearing the Path, compares views on what those standards mean and on the priority of the goal that all students graduate from high school ready for college and a career. In Part 2, Teaching Diverse Learners, the survey looks at the second half of the policy mandate – educating each and every student “regardless of their income, race, ethnic or language background, or disability status” – including the priority level it is given and the implications of helping diverse learners achieve higher standards of readiness on teaching.
Of course, meeting the needs of diverse learners is challenging. In the 2008 MetLife Survey of the American Teacher, half (49%) of middle and high school teachers agreed that the learning abilities of their students have become so varied that they can’t teach them effectively.1 Current trends predict “a steady increase in students who come to school from backgrounds of poverty, as second language learners, or those with special learning needs.”2 Some experts also believe that if the nation can succeed in educating English language learners, this will lead to solutions for other student learning needs.3 As we look at college and career preparation and at varied student learning needs, it is important to note that math education represents a particular challenge. As many as 60 percent of community college students place into remedial or developmental classes in this subject, and the number approaches 90 percent for low-income and minority students. In addition, “up to 70 percent of the community college students who were referred to developmental mathematics do not successfully complete the sequence of required courses. Some spend semesters repeating courses; others simply drop out.”4 Part 2 of this year’s survey report, Teaching Diverse Learners, explores in more depth the challenge of addressing differences among students and the needs of diverse learners. Four groups of key stakeholders – middle and high school teachers, students, and parents, as well as business executives from Fortune 1000 companies – weigh in on challenges in the classroom, needed resources and tools, and school effectiveness as an indicator of effective teaching.
We will set a clear goal: Every student should graduate from high school ready for college
and a career, regardless of their income, race, ethnic or language background, or
disability status. – President Barack Obama, A Blueprint for Reform: Reauthorization of
the Elementary and Secondary Education Act (March 2010).

4 The MetLife Survey of the American Teacher: Preparing Students for College and Careers
Addressing Needs of Diverse Learners is a High Priority – for Some Teachers place the highest priority on addressing the needs of diverse learners. Nine in ten teachers (91%) say that strengthening programs and resources to help diverse learners with the highest needs meet college- and career-ready standards should be a priority in education, including 59% who say this must be done as one of the highest priorities. For teachers, none of the other education reform strategies examined garnered as much consensus. This reform component is of particular interest to middle school teachers, who are more likely than high school teachers to consider this to be one of the highest priorities (65% vs. 54%). New teachers with less than 5 years of experience also see this as a critical issue, with 69% saying this must be one of the highest priorities. Fewer teachers who have more than five years of experience share this view (compared to 55% of teachers with 6-20 years of experience and 58% of teachers with more than 20 years of experience). Teachers in schools with large proportions of high-need students are the most likely to consider addressing the needs of diverse learners to be a top priority. Teachers are more likely to say this must be done as one of the highest priorities in education when they teach in schools where more than two-thirds of students come from low-income families (65% vs. 56% of teachers in schools with one-third or fewer low-income students) and when they teach in schools where more than two-thirds of students are minorities (68% vs. 54% of teachers in schools with one-third or fewer minority students).
Figure 2.1 Teachers’ Priority to Meet Needs of Diverse Learners
Q900: Many solutions have been suggested for improving public education in America. Given that there are limited resources, do you think that strengthening programs and resources to help diverse learners with the highest needs - such as low-income students, English language learners and students with disabilities - meet college-and career-ready standards is something that must be done as one of the highest priorities in education, should be done as a lower priority, or should no additional resources be devoted to it? Base: Teachers (n=1000)
54%
59%
68%
56%
55%
65%
58%
55%
69%
54%
65%
59%
37%
34%
21%
35%
36%
26%
30%
35%
27%
35%
28%
32%
9%
4%
9%
8%
8%
8%
11%
8%
2%
9%
6%
8%
0-33%
34-66%
67% or more
0-33%
34-66%
67% or more
21 or more
6-20
5 or less
High school
Middle school
Total Teachers
Must be done Should be done No additional resources
Percentage of
minority
students
Percentage of
low-income
students
Years of
teaching
experience
School Type

Part 2: Teaching Diverse Learners 5
Parents also believe that strengthening programs and resources to help diverse learners is of critical importance, with six in ten (57%) saying this must be done as one of the highest priorities in education. Parents who have low incomes themselves (a household income of less than $35,000) are among those most likely to consider this a top priority (76%), as are parents who are African-American (73%). Fortune 1000 executives see this issue as a much lower priority, with only 31% saying this reform must be done as one of the highest priorities in education.
Figure 2.2
Parents’ Priority to Meet Needs of Diverse Learners
Q1020: Many solutions have been suggested for improving public education in America. Given that there are limited resources, do you think that strengthening programs and resources to help diverse learners with the highest needs - such as low-income students, English language learners and students with disabilities - meet college-and career-ready standards is something that must be done as one of the highest priorities in education, should be done as a lower priority, or should no additional resources be devoted to it? Base: Parents (n=580)
54%
73%
56%
45%
63%
50%
76%
57%
29%
20%
27%
29%
24%
31%
19%
27%
17%
7%
17%
25%
13%
18%
5%
16%
Hispanic
Black/AfricanAmerican
White
$75,000 or more
$50,000-$74,999
$35,000-$49,999
Less than $35,000
Total Parents
Must be done Should be done No additional resources
Race/
Ethnicity
Income
Level
6 The MetLife Survey of the American Teacher: Preparing Students for College and Careers
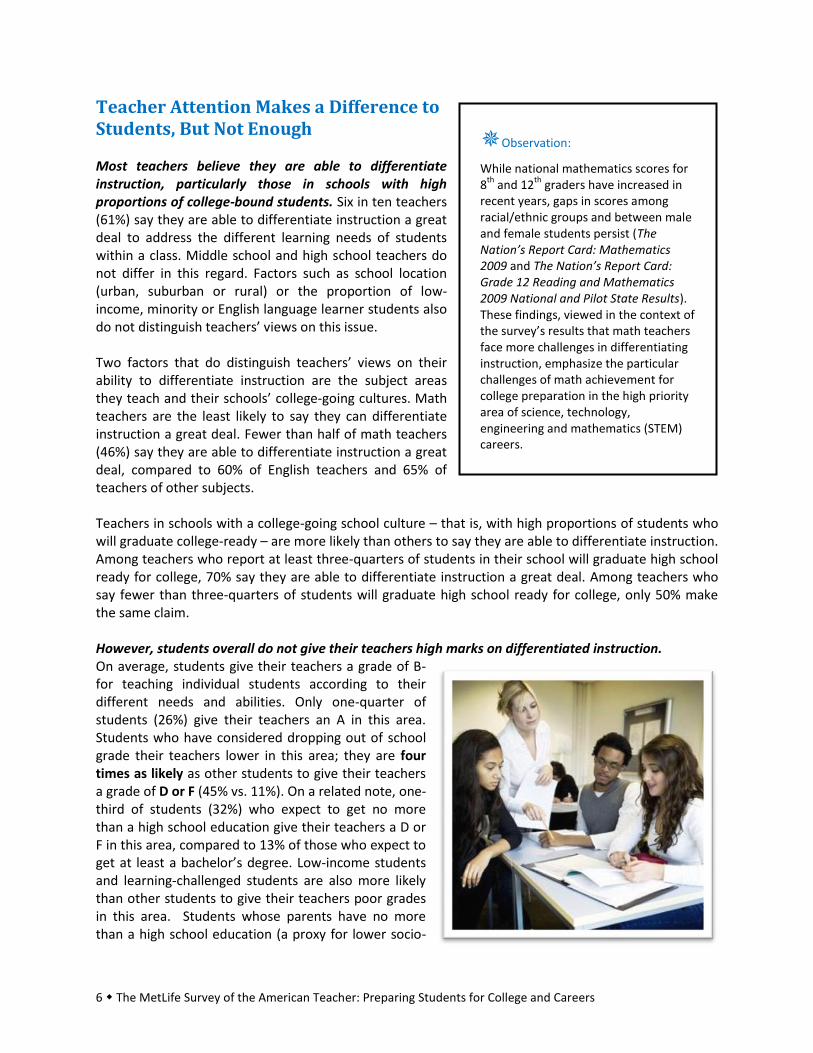
Teacher Attention Makes a Difference to Students, But Not Enough Most teachers believe they are able to differentiate instruction, particularly those in schools with high proportions of college-bound students. Six in ten teachers (61%) say they are able to differentiate instruction a great deal to address the different learning needs of students within a class. Middle school and high school teachers do not differ in this regard. Factors such as school location (urban, suburban or rural) or the proportion of low-income, minority or English language learner students also do not distinguish teachers’ views on this issue. Two factors that do distinguish teachers’ views on their ability to differentiate instruction are the subject areas they teach and their schools’ college-going cultures. Math teachers are the least likely to say they can differentiate instruction a great deal. Fewer than half of math teachers (46%) say they are able to differentiate instruction a great deal, compared to 60% of English teachers and 65% of teachers of other subjects. Teachers in schools with a college-going school culture – that is, with high proportions of students who will graduate college-ready – are more likely than others to say they are able to differentiate instruction. Among teachers who report at least three-quarters of students in their school will graduate high school ready for college, 70% say they are able to differentiate instruction a great deal. Among teachers who say fewer than three-quarters of students will graduate high school ready for college, only 50% make the same claim. However, students overall do not give their teachers high marks on differentiated instruction. On average, students give their teachers a grade of B- for teaching individual students according to their different needs and abilities. Only one-quarter of students (26%) give their teachers an A in this area. Students who have considered dropping out of school grade their teachers lower in this area; they are four times as likely as other students to give their teachers a grade of D or F (45% vs. 11%). On a related note, one-third of students (32%) who expect to get no more than a high school education give their teachers a D or F in this area, compared to 13% of those who expect to get at least a bachelor’s degree. Low-income students and learning-challenged students are also more likely than other students to give their teachers poor grades in this area. Students whose parents have no more than a high school education (a proxy for lower socio-
Observation:
While national mathematics scores for 8
th and 12
th graders have increased in
recent years, gaps in scores among racial/ethnic groups and between male and female students persist (The Nation’s Report Card: Mathematics 2009 and The Nation’s Report Card: Grade 12 Reading and Mathematics 2009 National and Pilot State Results). These findings, viewed in the context of the survey’s results that math teachers face more challenges in differentiating instruction, emphasize the particular challenges of math achievement for college preparation in the high priority area of science, technology, engineering and mathematics (STEM) careers.

Part 2: Teaching Diverse Learners 7
economic status) are more likely than those whose parent is a college graduate to give their teachers a D or F for teaching individual students according to their different needs and abilities (17% vs. 11%). Learning-challenged students – those who have been told by a teacher or other adult at school that they have learning problems or a learning disability, or ADHD or that they should have an individualized education plan (IEP) – are also more likely to give their teachers a D or F in this area (19% vs. 14%). Students who say they frequently receive enough attention from teachers are less likely to consider dropping out of school and more likely to plan on getting a college degree. Four in ten students (42%) say they very often receive enough attention from their teachers in class, an increase from 1997, when 31% of secondary school students said they very often receive enough attention from their teachers.5 Today, while four in ten say they very often receive enough attention, an additional 44% report that this sometimes occurs and 12% say this rarely or never occurs. Students who have considered dropping out of school are half as likely as other students to say they very often receive enough attention from their teachers (21% vs. 44%). Similarly, students who expect to get no more than a high school education are nearly half as likely as those planning on earning at least a bachelor’s degree to say they very often receive enough attention from teachers (26% vs. 46%).
Figure 2.3
Frequency with Which Students Receive Enough Attention from Teachers Figure x.x
Student Attention from Teachers Q815: How often do you receive enough attention from your teachers in class? Base: Students (n=2002)
44%
21%
46%
32%
26%
42%
44%
42%
43%
49%
40%
44%
9%
35%
8%
17%
31%
12%
No
Yes
Bachelor's Degree
Associate's Degree
High School or less
Total Students
Very Often Sometimes Rarely/Never
Highest Level of Education
Planned
Considered
Dropping Out

8 The MetLife Survey of the American Teacher: Preparing Students for College and Careers
Students Want Teacher Expectations to be Aligned with Their Own Lower-performing students believe that their teachers’ expectations are too high. A plurality of students (48%) says that their teachers’ expectations for them are the same as their own expectations. However, four in ten students (38%) say that their teachers’ expectations for them are higher than they think they can meet. Students who get lower grades in school or who have considered dropping out or who have learning challenges are more likely to report that their teachers’ expectations for them are higher than their own.
Figure 2.4 Student Views’ on Teacher Expectations
Q805: Which of the following statements best describe your teachers’ expectations for you as a student? Base: Students (n=2002)
Q805: Which of the following statements best describe your teachers’ expectations for you as a student? Base: Students (n=2002)
37%
43%
37%
46%
50%
39%
24%
38%
50%
41%
49%
36%
37%
49%
57%
48%
14%
16%
14%
18%
12%
13%
19%
14%
No
Yes
No
Yes
C's or below
Mostly B's
Mostly A's
Total Students
Higher than what I think I can do Same as my expectations Lower than what I think I can do
Grades in
School
Learning
Challenged
Considered
Dropping Out
Observation:
These findings about “expectations” seem to imply that high expectations without the necessary supports and demonstrated success may lead to frustration more than high achievement. In The MetLife Survey of the American Teacher: Collaborating for Student Success (2009), fewer than half of middle and high school students strongly agreed that all of the teachers in their school want them to succeed.

Part 2: Teaching Diverse Learners 9
A striking gender difference in perception of expectations exists in middle school, but not in high school. Middle school boys are more likely than girls to report that their teachers’ expectations are higher than they think they can meet (44% vs. 29%), while middle school girls are more likely than boys to say that their teachers’ expectations are the same as their own (54% vs. 44%). In contrast, high school boys are just as likely as high school girls to report that their teachers’ expectations are the same as their own (46% vs. 49%).
Diverse Learners Struggle with College and Career Readiness Among diverse learners, two high-need groups indicate that, while they believe in the importance of college, they are less optimistic about their futures, and they report that their needs are not currently well-served by their schools. In this section, we provide a profile of the following two groups:
Learning-challenged students: students who have been told by a teacher or other adult at school that they have learning problems or a learning disability or ADHD or that they should have an individualized education plan (IEP); and
Low-income students: students whose parents have no more than a high school education (used as a proxy for socio-economic status).
Learning-challenged students place the same importance on a college education as other students. However, they have lower aspirations regarding their own postsecondary education and less confidence that they will achieve their goals for the future. They are also less likely to have received support or guidance from teachers and school counselors about how to prepare for college. While they are just as likely as other students to say they receive enough attention from teachers, they are less likely to give high ratings to their teachers or schools. Low-income students also place the same importance on a college education as other students. However, they too have lower aspirations regarding their own postsecondary education and less confidence and more worries about achieving their goals for the future. Yet they report similar levels of support as other students do from a teacher or school counselor regarding how to prepare for college.

10 The MetLife Survey of the American Teacher: Preparing Students for College and Careers
Profile of Learning-Challenged Students
College and Career Expectations and Worries: Twice as likely to say their highest level of education will be no more than a high school diploma (15% vs. 7%)
More likely to have thought about dropping out of school (16% vs. 9%)
More likely to worry a lot about being able to get a good job when they finish school (47% vs. 40%) and being able to get into (38% vs. 29%) or succeed in (39% vs. 32%) college
Less likely to say it is very likely they will go to college (62% vs. 78%)
Just as likely to think it is absolutely essential that each and every student graduates from high school ready for college and a career (37% vs. 42%)
Less likely to be very confident that they will achieve their goals for the future (30% vs. 50%)
Preparation and Support for College Less likely to have spoken with a teacher (43% vs. 50%) or school counselor (43% vs. 51%) about what classes they should take and other things to do to be ready for college
Less likely to have seen examples of real college- level assignments and student work (33% vs. 41%)
Teaching and School Quality Give their teachers a B- on teaching individual students according to their needs and abilities – similar to other students
More likely to say their teachers’ expectations are higher than what they think they can meet (43% vs. 37%)
More likely to rate the overall quality of education at their school as fair or poor (24% vs. 16%)
Just as likely to say they very often receive enough attention from their teachers in class (37% vs. 43%)
Less likely to give their teachers an A for believing all children can learn (35% vs. 46%)
Less likely to say their teachers make learning exciting (65% vs. 72%)
Less likely to give their teachers an A on preparing them in English (34% vs. 51%) and math (35% vs. 48%)
Profile of Low-Income Students
College and Career Expectations and Worries: More than three times as likely to say their highest level of education will be no more than a high school diploma (19% vs. 4%)
More likely to have thought about dropping out of school (13% vs. 8%)
More likely to worry a lot about being able to get a good job when they finish school (51% vs. 37%) and being able to get into (41% vs. 26%) or succeed in (44% vs. 28%) college
Less likely to say it is very likely they will go to college (58% vs. 83%)
Just as likely to think it is absolutely essential that each and every student graduates from high school ready for college and a career (38% vs. 43%)
Less likely to be very confident that they will achieve their goals for the future (39% vs. 50%)
Preparation and Support for College Just as likely to have spoken with a teacher (53% vs. 46%) or school counselor (50% vs. 48%) about what classes they should take and other things to do to be ready for college
Just as likely to have seen examples of real college- level assignments and student work (41% vs. 38%)
Teaching and School Quality Give their teachers a B- on teaching individual students according to their needs and abilities – similar to other students
More likely to say their teachers’ expectations are higher than what they think they can meet (44% vs. 35%)
More likely to rate the overall quality of education at their school as fair or poor (22% vs. 14%)
Less likely to say they very often receive enough attention from their teachers in class (36% vs. 44%)
Just as likely to give their teachers an A for believing all children can learn (44% vs. 45%)
Just as likely to say their teachers make learning exciting (71% vs. 71%)
Less likely to give their teachers an A on preparing them in English (43% vs. 50%) and math (40% vs. 49%)
Other Characteristics More likely to have a language other than English spoken most often at home (21% vs. 4%)
Less likely to have been told by a teacher or other adult at school that they are gifted or academically talented (37% vs. 47%)

Part 2: Teaching Diverse Learners 11
Teachers Identify High-Impact Resources to Address Needs of Diverse Learners Teachers believe that a range of resources and tools will help them meet the needs of diverse learners. A majority of teachers believes that the following resources would have a major impact on their ability to effectively address the different learning needs of individual students:
Opportunities for collaborative teaching (65%);
Access to online and other technology-based resources that allow them to help personalize education according to the learning profiles of their students (64%);
Better tools for understanding students’ learning strengths and needs (63%); and
Instructional strategies to teach effectively in a classroom where many students speak a language other than English (62%).
Fewer teachers believe that the following two resources would have a major impact: availability of a learning expert to help them assess student-learning profiles and develop targeted learning management plans (47%) or more knowledge about neuroscience, brain development and how students learn (46%). However, having a learning expert available is a resource that both new teachers with less than 5 years of experience and teachers in schools with two-thirds or more low-income students say would be particularly helpful. A narrow majority of teachers in these two groups believes that the availability of a learning expert would have a major impact on their ability to effectively address the different learning needs of students (new teachers: 60%; teachers in schools with mostly low-income students: 57%). Teachers in schools with many high-need students value these resources. Teachers in schools with more than two-thirds students who are low-income are more likely than those with one-third or fewer low-income students to say that the following resources would have a major impact on their ability to effectively address the different learning needs of individual students: access to online and other technology-based resources to help personalize education (72% vs. 59%); better tools for understanding students’ learning strengths and needs (70% vs. 56%); instructional strategies to teach effectively in a classroom where many students speak a language other than English (69% vs. 58%); and the availability
of a learning expert (57% vs. 42%). A similar pattern is seen among teachers in schools with high proportions of minority students. Teachers in urban schools are more likely than those in suburban or rural schools to say that opportunities for collaborative teaching (71% vs. 65% vs. 61%), instructional strategies to teach in a classroom where many students speak a language other than English (72% vs. 57% vs. 61%), and access to online and other technology-based resources (74% vs. 57% vs. 64%) would have a major impact on their ability to effectively address the different learning needs of individual students.
From the Survey Archives:
In The MetLife Survey of the American Teacher: Collaborating for Student Success (2009), middle and high school teachers indicated that they spend an average of 2.9 hours per week in structured collaboration with other teachers and school leaders, and a majority (57%) said that greater collaboration among teachers and school leaders would have a major impact on improving student achievement.
Observation:
Are online courses an opportunity to provide differentiated instruction? Nearly one in ten middle and high school students (9%) has taken an online course for school.

12 The MetLife Survey of the American Teacher: Preparing Students for College and Careers
Figure 2.5 Impact of Resources on Student Learning Needs
Total Teachers
% Low-Income Students % Minority Students
0-33% 34-66%
67% or
more 0-33%
34-66%
67% or
more
Base n=1000 n=337 n=327 n=305 n=490 n=225 n=267
Opportunities for collaborative teaching
Major impact 65% 62% 62% 69% 60% 70% 69%
Minor impact 30% 32% 34% 26% 35% 25% 27%
No impact at all 4% 5% 4% 4% 4% 5% 4%
Access to online and technology resources to personalize education to learning profiles of students
Major impact 64% 59% 60% 72% 59% 67% 70%
Minor impact 31% 36% 33% 25% 36% 28% 27%
No impact at all 4% 4% 5% 4% 5% 5% 3%
Better tools for understanding students’ learning strengths and needs
Major impact 63% 56% 62% 70% 55% 66% 71%
Minor impact 33% 39% 33% 27% 39% 29% 26%
No impact at all 3% 3% 4% 3% 4% 4% 2%
Instructional strategies to teach effectively in a classroom where many students speak a language other than English
Major impact 62% 58% 60% 69% 59% 63% 69%
Minor impact 28% 32% 30% 22% 30% 30% 21%
No impact at all 7% 8% 9% 6% 9% 4% 7%
Availability of a learning expert to help assess student learning profiles and develop targeted learning management plans
Major impact 47% 42% 41% 57% 43% 45% 55%
Minor impact 41% 45% 46% 33% 44% 42% 35%
No impact at all 10% 11% 12% 9% 11% 11% 9%
More knowledge about neuroscience, brain development and how students learn
Major impact 46% 44% 45% 48% 44% 46% 50%
Minor impact 46% 49% 46% 43% 47% 47% 42%
No impact at all 7% 6% 8% 9% 8% 7% 7% Q805: How much of an impact would the following have on your ability to address different learning needs of individual students? Base: Teachers (n=1000)

Part 2: Teaching Diverse Learners 13
High School Girls Have Higher Educational Aspirations than Boys A gender gap exists in college aspirations. The MetLife Survey of the American Teacher: Collaborating for Student Success (2009) found that girls have higher expectations for their education and more confidence about achieving their goals.6 These findings reflect the current enrollment proportion by gender in higher education, which is 57% women and 43% men.7 This year’s survey finds that a gender gap in college aspirations emerges in high school. While girls and boys in middle school do not differ in their aspirations for college, high school girls are more likely than boys to say it is very likely they will go to college (83% vs. 71%) and to say that they plan on getting a bachelor’s or higher-level degree (83% vs. 72%). While gender plays a role in college aspirations, race or ethnic background does not. African-American and Hispanic girls and boys are as likely as their white counterparts to say they are very likely to go to college or that they plan on getting a bachelor’s or higher-level degree.
From the Experts:
Education thought leaders and teacher leaders, convened in a strategy session as part of the survey development process, described several challenges in preparing boys to be college- and career-ready:
“Boys respond to peer pressure to underperform – don't want to be seen as smart.”
“Schools tend to reward quiet, calm behaviors. That's not what most boys do. We have ‘girl-friendly’ schools.”
“It is difficult to teach them to work together and support each other. The focus on competition is a major roadblock.”
“*A+ lack of openness to learning or vulnerability. Stereotypes to the effect that boys don't need to read, write, etc.”
Observation:
Teachers in schools with higher proportions of English language learners (ELL) report higher levels of students dropping out of school, lower levels of students graduating high school ready for college and lower levels of students graduating college. Teachers in schools with more than one-third ELL students report that, on average, 16% of students in their school will drop out of high school before graduating, 52% will graduate high school ready for college without the need for remedial coursework, and 44% will graduate from college. In contrast, these numbers are 11%, 65% and 52%, respectively, for teachers in schools with one-third or fewer ELL students.
Teachers and principals in the MetLife Survey of the American Teacher: Collaborating for Student Success (2009) noted this gap. Three-quarters of K-12 teachers (74%) and principals (79%) believed that addressing the needs of students who are English Language Learners is very important for improving student achievement.

14 The MetLife Survey of the American Teacher: Preparing Students for College and Careers
Figure 2.6 Likelihood to Go to College
Q720: How likely is it you will go to college? Base: Students (n=2002)
Figure 2.7 Highest Level of Education Planned
Q750: What is the highest level of education that you plan to get? Base: Students (n=2002)
8% 9% 7% 10%
19% 19%10%
17%
73% 72%83%
72%
Girls Boys Girls Boys
Bachelor's or more
Technical/Trade/Two-year school
High School or less
Middle School High School
4% 5% 2% 7%
16%21%
14%
19%
71% 70%83%
71%
Girls Boys Girls Boys
Very likely
Somewhat likely
Not very/Not at all likely
Middle School High School

Part 2: Teaching Diverse Learners 15
College aspirations for boys have shown a 10-point increase since 1997, from 61% to 71% of boys saying that it is very likely they will go to college. Girls’ college aspirations showed a five-point increase during that time, from 74% to 79% saying it is very likely they will go to college. The increase in college aspirations is found among both white and minority girls and boys.8
Figure 2.8
Students Very Likely to go College
Q720: How likely is it you will go to college? Base: Students (2010: n=2002; 1997: n=1295)
During this same time period, teachers’ estimation of the percentage of boys in their classes who will graduate from college has also increased, from an average of 43% to an average of 51%. Their estimate of the percentage of girls in their classes who will graduate from college has increased from an average of 48% to an average of 58%. While teachers’ overall estimation of the percentage of girls and boys who will graduate from college has increased over time, the gender gap today is comparable to that seen in 1997.9
52%
67%
60%
76%
71%
77%
71%
79%
Boys
Girls
Boys
Girls
2010
1997
White
Minority
16 The MetLife Survey of the American Teacher: Preparing Students for College and Careers
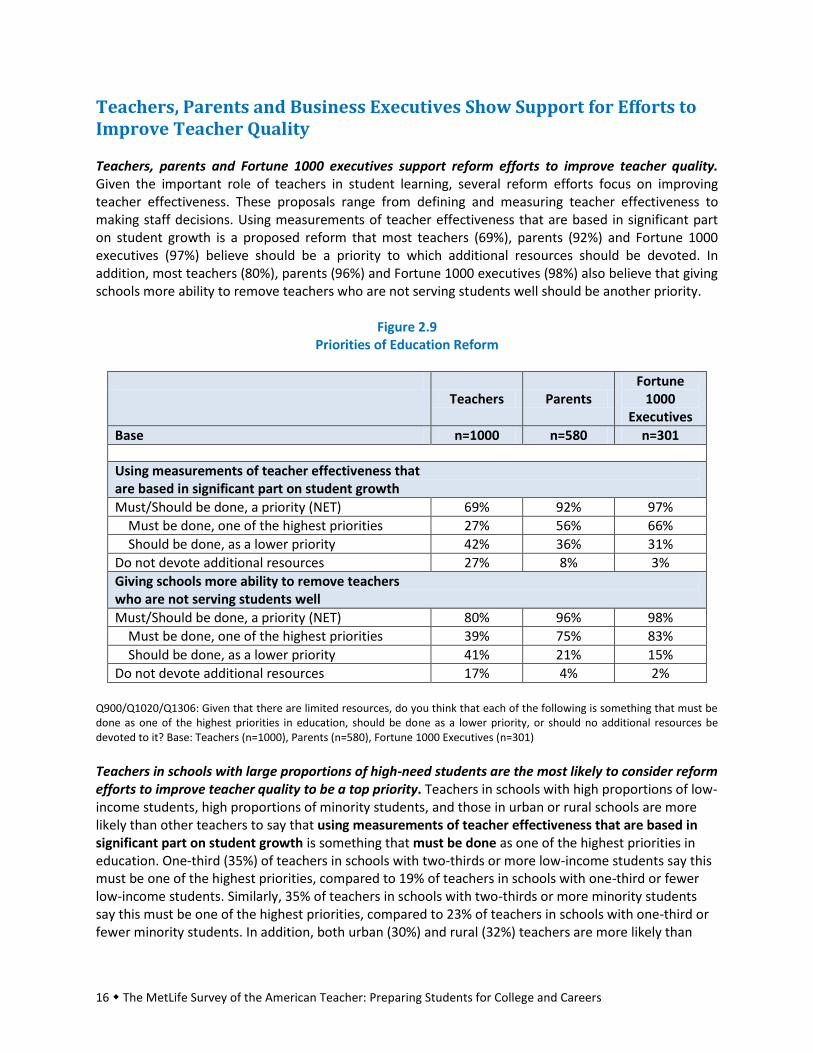
Teachers, Parents and Business Executives Show Support for Efforts to Improve Teacher Quality Teachers, parents and Fortune 1000 executives support reform efforts to improve teacher quality. Given the important role of teachers in student learning, several reform efforts focus on improving teacher effectiveness. These proposals range from defining and measuring teacher effectiveness to making staff decisions. Using measurements of teacher effectiveness that are based in significant part on student growth is a proposed reform that most teachers (69%), parents (92%) and Fortune 1000 executives (97%) believe should be a priority to which additional resources should be devoted. In addition, most teachers (80%), parents (96%) and Fortune 1000 executives (98%) also believe that giving schools more ability to remove teachers who are not serving students well should be another priority.
Figure 2.9 Priorities of Education Reform
Teachers Parents
Fortune 1000
Executives
Base n=1000 n=580 n=301
Using measurements of teacher effectiveness that are based in significant part on student growth
Must/Should be done, a priority (NET) 69% 92% 97%
Must be done, one of the highest priorities 27% 56% 66%
Should be done, as a lower priority 42% 36% 31%
Do not devote additional resources 27% 8% 3%
Giving schools more ability to remove teachers who are not serving students well
Must/Should be done, a priority (NET) 80% 96% 98%
Must be done, one of the highest priorities 39% 75% 83%
Should be done, as a lower priority 41% 21% 15%
Do not devote additional resources 17% 4% 2%
Q900/Q1020/Q1306: Given that there are limited resources, do you think that each of the following is something that must be done as one of the highest priorities in education, should be done as a lower priority, or should no additional resources be devoted to it? Base: Teachers (n=1000), Parents (n=580), Fortune 1000 Executives (n=301)
Teachers in schools with large proportions of high-need students are the most likely to consider reform efforts to improve teacher quality to be a top priority. Teachers in schools with high proportions of low-income students, high proportions of minority students, and those in urban or rural schools are more likely than other teachers to say that using measurements of teacher effectiveness that are based in significant part on student growth is something that must be done as one of the highest priorities in education. One-third (35%) of teachers in schools with two-thirds or more low-income students say this must be one of the highest priorities, compared to 19% of teachers in schools with one-third or fewer low-income students. Similarly, 35% of teachers in schools with two-thirds or more minority students say this must be one of the highest priorities, compared to 23% of teachers in schools with one-third or fewer minority students. In addition, both urban (30%) and rural (32%) teachers are more likely than

Part 2: Teaching Diverse Learners 17
suburban (20%) teachers to say that using measurements of teacher effectiveness that are based in significant part on student growth is something that must be done as one of the highest priorities in education. Teachers in schools with high proportions of low-income students are also more likely than other teachers to say that giving schools more ability to remove teachers who are not serving students well is something that must be done as one of the highest priorities in education. Half (49%) of teachers in schools with two-thirds or more low-income students say this must be one of the highest priorities, compared to 38% of teachers in schools with one-third or fewer low-income students. However, teachers’ views on this issue do not vary significantly based on the proportion of minority students in their school or whether their school is in an urban, suburban or rural location.
More Views on Reform Strategies: Additional information on teachers’, parents’ and business executives’ assessment of a total of six reform strategies is available in Part 1 of this year’s survey report, Clearing the Path, available at www.metlife.com/teachersurvey.
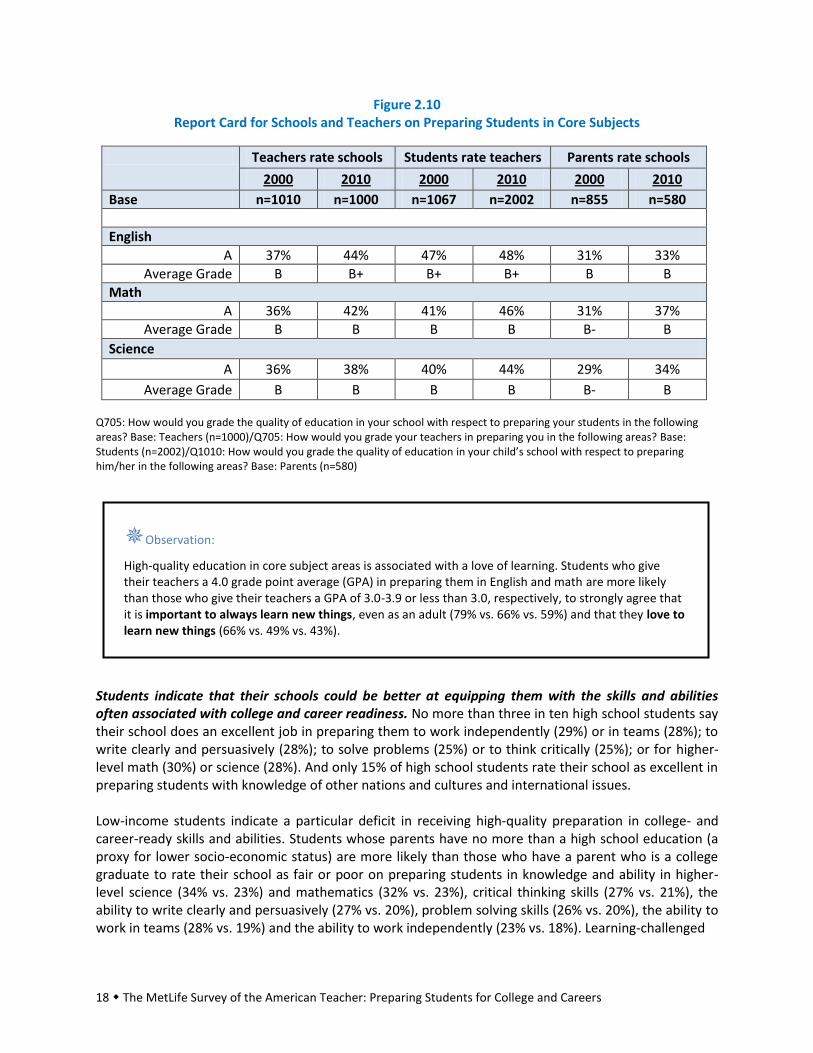
Teachers, Students and Parents Indicate a Need to Improve School and Teaching Quality Only one-quarter of students (26%) rate the overall quality of the education that they receive at school as excellent. Students who plan on getting at least a bachelor’s degree are more likely than those planning for a technical, trade or 2-year education or those not planning for any education beyond high school to rate their school’s education quality as excellent (29% vs. 19% vs. 13%). A plurality of students (57%) rates the overall quality of the education that they receive at school as good, while 15% rate their education as fair and 2% rate it as poor. Fewer than half of teachers, students or parents would give their schools and teachers an “A” for preparing students in critical college-readiness areas as English, math or science. On average, parents give their child’s school a “B” in each of these areas. Teachers also give their schools a “B” in preparing students in math and science, although they give their schools a B+ in English. Students show a similar pattern, giving their teachers a B in preparing them for math and science and a B+ in English. Overall, these grades are similar to ratings a decade ago. All three stakeholder groups note some improvements in math; teachers, students and parents today are more likely than these groups were in 2000 to give their schools and teachers an A for preparation in this area (teachers: 42% vs. 36%; students: 46% vs. 41%; parents: 37% vs. 31%). Parents today are also more likely than those in 2000 to give schools an A in science preparation (34% vs. 29%), while teachers are more likely to give an A in English (44% vs. 37%).
18 The MetLife Survey of the American Teacher: Preparing Students for College and Careers
Figure 2.10 Report Card for Schools and Teachers on Preparing Students in Core Subjects
Teachers rate schools Students rate teachers Parents rate schools
2000 2010 2000 2010 2000 2010
Base n=1010 n=1000 n=1067 n=2002 n=855 n=580
English
A 37% 44% 47% 48% 31% 33%
Average Grade B B+ B+ B+ B B
Math
A 36% 42% 41% 46% 31% 37%
Average Grade B B B B B- B
Science
A 36% 38% 40% 44% 29% 34%
Average Grade B B B B B- B Q705: How would you grade the quality of education in your school with respect to preparing your students in the following areas? Base: Teachers (n=1000)/Q705: How would you grade your teachers in preparing you in the following areas? Base: Students (n=2002)/Q1010: How would you grade the quality of education in your child’s school with respect to preparing him/her in the following areas? Base: Parents (n=580)
Students indicate that their schools could be better at equipping them with the skills and abilities often associated with college and career readiness. No more than three in ten high school students say their school does an excellent job in preparing them to work independently (29%) or in teams (28%); to write clearly and persuasively (28%); to solve problems (25%) or to think critically (25%); or for higher-level math (30%) or science (28%). And only 15% of high school students rate their school as excellent in preparing students with knowledge of other nations and cultures and international issues. Low-income students indicate a particular deficit in receiving high-quality preparation in college- and career-ready skills and abilities. Students whose parents have no more than a high school education (a proxy for lower socio-economic status) are more likely than those who have a parent who is a college graduate to rate their school as fair or poor on preparing students in knowledge and ability in higher-level science (34% vs. 23%) and mathematics (32% vs. 23%), critical thinking skills (27% vs. 21%), the ability to write clearly and persuasively (27% vs. 20%), problem solving skills (26% vs. 20%), the ability to work in teams (28% vs. 19%) and the ability to work independently (23% vs. 18%). Learning-challenged
Observation:
High-quality education in core subject areas is associated with a love of learning. Students who give their teachers a 4.0 grade point average (GPA) in preparing them in English and math are more likely than those who give their teachers a GPA of 3.0-3.9 or less than 3.0, respectively, to strongly agree that it is important to always learn new things, even as an adult (79% vs. 66% vs. 59%) and that they love to learn new things (66% vs. 49% vs. 43%).

Part 2: Teaching Diverse Learners 19
students are also more likely than other students to rate their school as fair or poor in these areas, particularly on preparing them in the ability to write clearly and persuasively (32% vs. 22%) and in knowledge and ability in higher-level mathematics (36% vs. 25%).
Figure 2.11 School Ratings for Preparing Students
Total Students Middle School High School
Base n=2002 n=711 n=1291
Ability to work independently
Excellent/Good (NET) 80% 81% 80%
Excellent 29% 30% 29%
Ability to work in teams
Excellent/Good (NET) 78% 79% 77%
Excellent 28% 29% 28%
Problem solving skills
Excellent/Good (NET) 78% 77% 78%
Excellent 26% 28% 25%
Ability to write clearly and persuasively
Excellent/Good (NET) 77% 75% 78%
Excellent 27% 26% 28%
Critical thinking skills
Excellent/Good (NET) 76% 75% 76%
Excellent 25% 25% 25%
Knowledge and ability in higher-level mathematics
Excellent/Good (NET) 73% 68% 75%
Excellent 26% 19% 30%
Knowledge and ability in higher-level science
Excellent/Good (NET) 72% 67% 75%
Excellent 25% 19% 28%
Knowledge of other nations and cultures and international issues
Excellent/Good (NET) 63% 61% 63%
Excellent 15% 16% 15% Q760: How would you rate your school on preparing students in each of these areas? Base: Students (n=2002)

20 The MetLife Survey of the American Teacher: Preparing Students for College and Careers
Conclusion Key stakeholders, including teachers, students, parents and business executives, are embracing a new mandate for education that includes both world-class standards for college and career readiness and a commitment to assure that all students reach them. Given the current dropout problem, and the shortfalls in academic achievement and college success, this mandate represents a major challenge for the nation’s communities, families, schools and classrooms – especially for those with the greatest concentrations of need. The MetLife Survey of the American Teacher: Preparing Students for College and Careers reveals some troubling gaps in perceptions and differences on priorities that will need to be better understood and addressed if the nation’s educational aspirations are to be realized. While students and adults in the survey agree on the importance of being prepared, students’ expectations for college-going on average are higher than the expectations their teachers and potential employers have for them. Teachers and employers also send mixed messages about what knowledge and skills constitute college and career readiness. In addition, students’ and teachers’ confidence in how well students are prepared for success beyond high school, and particularly in college, is greater than what actual achievement statistics indicate. The perceptions of both students with greater needs and the teachers in schools where needs are greatest differ significantly from those of other students and teachers, and may offer helpful insights for accomplishing the goal for all and not just for some. Looking toward solutions to improve education and college and career readiness, parents and business executives place emphasis on individual teacher accountability among policy proposals. By contrast, teachers emphasize the importance of better programs and resources to help diverse learners with the highest needs meet the new standards. Given limited resources, teachers say that more opportunities for collaboration with other teachers and greater access to technology and other instructional tools would significantly improve their ability to help diverse learners succeed, both now and in the future.

Part 2: Teaching Diverse Learners 21
Endnotes 1 The MetLife Survey of the American Teacher: Past, Present, and Future. (2008). Retrieved from
http://www.metlife.com/assets/cao/contributions/citizenship/teacher-survey-25th-anniv-2008.pdf 2 Barnett, Berry, et al. (2011). Teaching 2030: What We Must Do for Our Students and Our Public Schools--Now and
in the Future. Teachers College Press. 3Noguera, Pedro. (2011). As quoted in Investing in Our Next Generation. Grantmakers for Education.
4 Carnegie Foundation for the Advancement of Teaching. (2011, February). Developmental Math. Retrieved from
http://www.carnegiefoundation.org/problem-solving/developmental-math. 5 The Metropolitan Life Survey of the American Teacher: Examining Gender Issues in Public Schools. (1997).
Retrieved from http://www.eric.ed.gov/PDFS/ED504809.pdf 6 The MetLife Survey of the American Teacher: Collaborating for Student Success.(2009).Retrieved from
http://www.metlife.com/assets/cao/contributions/foundation/american-teacher/MetLife_Teacher_Survey_2009.pdf 7 American Council on Education. (2010). Gender Equity in Higher Education: 2010.
8 The Metropolitan Life Survey of the American Teacher: Examining Gender Issues in Public Schools. (1997).
Retrieved from http://www.eric.ed.gov/PDFS/ED504809.pdf 9 The Metropolitan Life Survey of the American Teacher: Examining Gender Issues in Public Schools. (1997).
Retrieved from http://www.eric.ed.gov/PDFS/ED504809.pdf
Additional Sources ___________________________________
National Center for Education Statistics. (2009). The Nation’s Report Card: Grade 12 Reading and Mathematics 2009 National and Pilot State Results: National Assessment of Educational Progress. Retrieved from http://nces.ed.gov/nationsreportcard/pdf/main2009/2011455.pdf National Center for Education Statistics. (2009). The Nation's Report Card: Mathematics 2009: National Assessment of Educational Progress at Grades 4 and 8. Retrieved from http://nces.ed.gov/nationsreportcard/pdf/main2009/2010451.pdf The MetLife Survey of the American Teacher: Collaborating for Student Success. (2009). Retrieved from http://www.metlife.com/assets/cao/contributions/foundation/american-teacher/MetLife_Teacher_Survey_2009.pdf U.S. Department of Education, Office of Planning, Evaluation and Policy Development. (2010). ESEA Blueprint for Reform. Retrieved from http://www2.ed.gov/policy/elsec/leg/blueprint/blueprint.pdf


About the 2010 Survey and The MetLife Survey of the American Teacher Series The MetLife Survey of the American Teacher: Preparing Students for College and Careers (2010) was conducted by Harris Interactive among a national sample of 1,000 public school teachers of grades 6 through 12 by telephone, and among 2,002 public school students in grades 6 through 12, 580 parents of students in grades 6 through 12 and 301 business executives from Fortune 1000 companies online between October 4 and November 11, 2010. The data were weighted to key demographic variables to align with the national population of the respective groups. No estimates of theoretical sampling error can be calculated. The 2010 Fortune 1000 is a list of the 1000 largest American companies, ranked on revenues alone. In addition, an online strategy session was conducted on August 24, 2010, among a group of 21 public school teacher leaders and public education thought leaders to inform the development of the survey. MetLife has sponsored the MetLife Survey of the American Teacher series since 1984 to give voice to those closest to the classroom. The reports for the entire series are available online at www.metlife.com/teachersurvey with links to the ERIC (Education Resources Information Center) website: http://eric.ed.gov. About MetLife MetLife is a leading global provider of insurance, annuities and employee benefit programs, serving 90 million customers in more than 60 countries, with leading market positions in the United States, Japan, Latin America, Asia Pacific, and Europe. MetLife Foundation places strong emphasis on education and draws on the findings of the annual MetLife Survey of the American Teacher to inform its grantmaking. For more information about MetLife, please visit the company’s web site at www.metlife.com. Additional information about the Foundation is available at www.metlife.org. About Harris Interactive Harris Interactive is one of the world’s leading custom market research firms, leveraging research, technology and business acumen to transform relevant insight into actionable foresight. Known widely for the Harris Poll and for pioneering innovative research methodologies, Harris offers expertise in a wide range of industries and serves clients in over 215 countries and territories. For more information, please visit www.harrisinteractive.com.