the microstructure of the ... - pesquisa-eaesp.fgv.br
TRANSCRIPT

The Microstructure of the Brazilian Market
for Corporate Bonds
(September 2019)
Antonio Gledson de Carvalho
Fundacao Getulio Vargas Sao Paulo School of Business Administration
Felipe Tumenas Marques
Federal University of Bahia School of Administration
ARTIGO CLÍNICO NO. 1

1
The Microstructure of the Brazilian Market for Corporate Bonds
Antonio Gledson de Carvalho
Fundacao Getulio Vargas
Sao Paulo School of Business Administration
Felipe Tumenas Marques
Federal University of Bahia School of Administration
Abstract. We describe the evolution of the Brazilian bond market, the characteristics of
issues and issuers. We find that Bond proceeds are small and have short maturity.
International agencies are the main providers of rating. Fixed-yield bonds are rare.
Generally, bonds are linked to the Brazilian interbank-offered interest rate (DI or CDI).
Two local banks dominate the underwriting activity. These banks and their related parties
receive more than half of the allocation. Less than half of issues have an investment-grade
rating, and more than half are not rated at all. The incidence renegotiation of terms and
default is also high. Liquidity in the secondary market is low.
Keywords: Brazil, bonds, bond market, capital markets
JEL codes: G18, G30
1FGV-EAESP, Rua Itapeva, 473 – sala 802, São Paulo, SP, Brasil 01313-902. Email:
[email protected].. ** FGV-EESP, Rua Itapeva, 474 – 9 andar, São Paulo, SP, Brazil 01313-902.
Tel: (5511) 3799-7755. Carvalho acknowledges support from FAPESP (2016-06826-6 and 2018-14159-
5).

2
1. Introduction
The microstructure of bond markets is a subject of research in a wide range of
markets. In the United States, Fleming and Krishnan (2012), for government bonds; and
Biais and Green (2019), for corporate and municipal bonds. In Asia and Africa,
Gyntelberg, Ma and Remolona (2006); and Mo, Phelps and Slotsky (2013). Some authors
have found key factors for the development of a corporate bond market. Ong (2005)
indicates that good corporate governance fosters the development of local bond markets,
while high levels of government debt issuance works in the opposite direction. Hawkins
(2002) points out that banks have a crucial role in bond markets in emerging economies.
First, banks are competitors, because bond markets can replace bank lending and reduce
deposits in banks. Second, banks play an important role in the allocation and issuance of
corporate bonds. This creates conflicts of interest among lending, underwriting and asset
management activities. Nonetheless, there is a paucity of studies on the Brazilian bond
market and its role in the funding of non-financial corporations. This article starts to fill
this gap, providing a description of the microstructure of the Brazilian bond market.
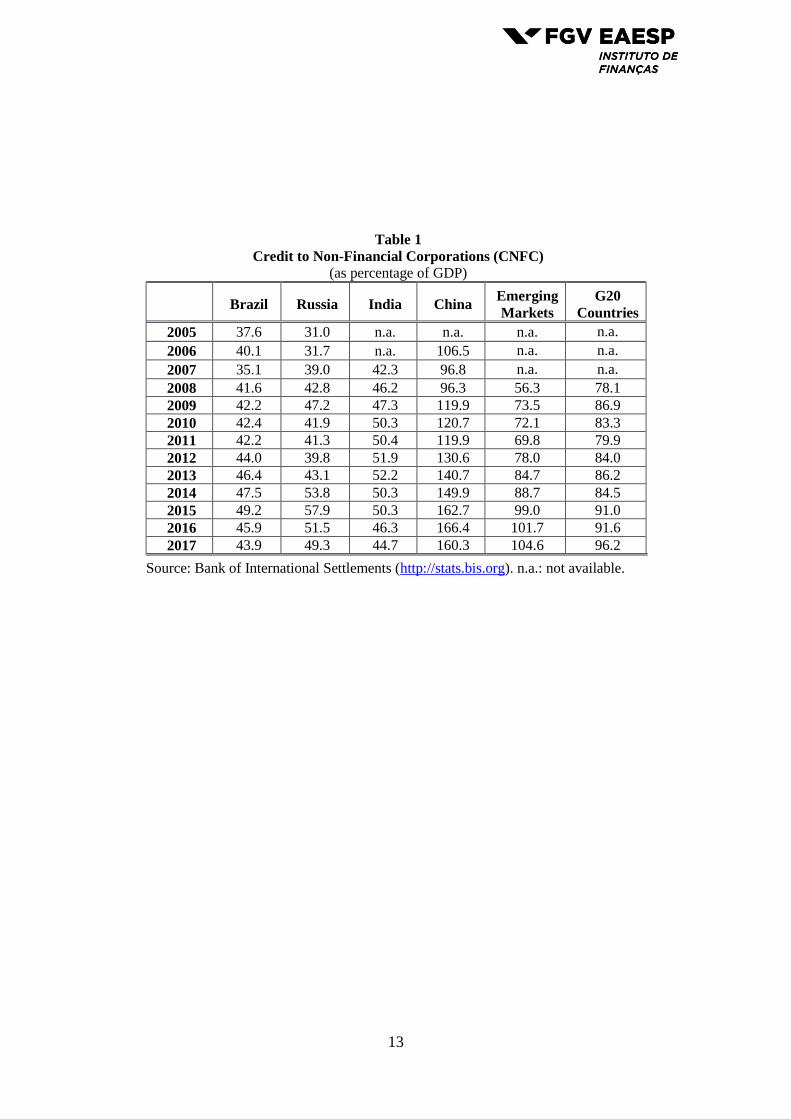
Credit to non-financial corporations (CNFC) in Brazil has been low (de Carvalho,
2005; and Torres-Filho and Macahyba, 2014). Table 1 illustrate this point. It reports
CNFC as a percentage of GDP from 2005 to 2017. CNFC in Brazil ranges from 35% to
40% of the GDP. This is below the averages of emerging markets, G20, and of other
BRIC countries (Brazil, Russia, India and China). For decades, the low CNFC has been
a concern for the Brazilian government. Several measures have been undertaken to
improve CNFC, most notably, the revision of the Bankruptcy Law in 2005 (Lei Federal
11.101), that increased creditors’ rights.
The Brazilian corporate bond market, as part of CNFC, has also had little
relevance (de Carvalho, 2000; and Torres-Filho and Macahyba, 2014). Table 2 reports
yearly aggregate bond issuance from 2005 to 2017. In the 2005-2008 period, bond
issuance was very modest. Proceeds averaged BRL $14.5 bi per year (nearly 44 issues
per year), representing, in average, only 0.6% of the GDP and 5.3% of CNFC.
Until 2009, the only mechanism to issue bonds was CVM-400 (Instrução 400
from Comissão de Valores Mobiliários, the Brazilian securities and exchange
commission). Under it, issues needed to be registered at CVM and prospectuses needed

3
to be very detailed. In 2009, with the purpose of fostering the corporate bond market, the
Brazilian CVM issued CVM-476 (Instrução CVM 476). This new regulation created an
alternative, simplified procedure for bond issuance. CVM-476 does not require previous
issue registration at CVM. With the same purpose, Law 12.431 of 2011 created
Infrastructure bonds (or Infra-bonds) with tax exemption for individual and foreign
investors.
CVM 476 and Infra-bonds together caused a significant change in the size of the
bond market. As Table 2 shows, the in the 2005-2008 period, aggregate proceeds and
number of issues were modest. The yearly average of aggregate proceed (issues) was
BRL $14.5 bi (43.5 issues). In the 2009-2017, average yearly proceeds (issues) increased
to BRL $71.4 bi (270 issues). These numbers, represent a jump of 0.8% in term of GDP
(from 0.6% in the 2005-2008 period to 1.4% in the 2009-2017 period) and 5% in terms
of CNFC (from 5% to 10%).
CVM 476 and Infra-bonds also caused a significant change in the structure of the
bond market. Over the 2009-2017 period, bonds issued under CVM-476 became
predominant, accounting for 87% of the proceeds and 82% of the number of issues.
Issuance of Infra-bonds began in 2012. During the 2012-2017 period, Infra-bonds
accounted for 7% of the proceeds and the number of issues. After 2014, CVM-400 lost
relevance for the issuance of Regular bonds (as a reference to non-Infra-bonds). As Table
1 reports, during the 2015-2017 period, it accounts for less than 10% of the issuance.
However, CVM-400 is still significant for the issuance of Infra-bonds. It accounted for
44% of the proceeds (35% of the number of issues) of the Infra-bonds issued between
2012 and 2017.
The fast change in the size and structure of the Brazilian bond market motivates
this article. We aim to provide a broad picture of this market. Section 2 briefly describes
the legal provisions for bond issuance. Section 3 presents our data sources. Section 4
explores the characteristics of bond issues and their performance. Finally, Section 5
critically evaluates the recent changes that occurred in the bond market.

4
2. Brazilian provisions and regulation for bonds issuance
Brazilian regulations have two provisions for bond issuance, both established by
the Brazilian Securities and Exchange Commission (Comissão de Valores Imobiliários,
CVM). These provisions are known as Instrução CVM 400 (ICVM-400 or CVM-400) and
Instrução CVM 476 (ICVM-476 or CVM-476).
CVM-400, issued in 2003, regulates the traditional form of bond issuance. To
begin with, issues must be previously registered at CVM. Issuers must be public
corporations2 (Portuguese: empresa aberta) and fill in a detailed prospectus. The
prospectus contains (i) complete information on the issuers’ business, main advantages
and competitive strategies; (ii) a description of the issuer’s five main risk factors, in order
of relevance; (iii) details on the uses of the proceeds; and, (iv) financial statements for the
previous three years. Bonds issued under CVM-400 can be distributed to any investors
and bear no restriction on trading. The only exception applies to bonds from pre-
operational issuers that cannot float within the first eight months from issuance. These
pre-operational bonds can be placed only among qualified investors (QI, from the
Portuguese, investidores qualificados: those with more than BRL $1 mi invested in
securities).
In 2009, CVM issued Rule-476 that provides a broader, faster and cheaper track
for bond issuance than CVM-400. Under CVM-476, issuers are not required to be public
corporations, and neither detailed prospectus nor registration at CVM is needed.
However, some constraints apply: the placement is restricted to professional investors
(PI, from the Portuguese, investidores profissinais, those with investment in securities
above BRL $10 mi); the prospectus can be distributed to at most 75 PI investors; the issue
can be placed among at most 50 PI;3 and bonds cannot float within the first 90 days after
the issuance. However, after this lockup period, QI can also trade on the bond.
2 In Brazil, public corporations are subject to the rules established in Law 6404/1976. Principal
requirements for public corporations: bylaws in accordance with Law 6404/1976; creation of an investors’
relations department; nomination of an officer for investors’ relations; and financial statements audited by
an independent auditor, and of public domain.
3 At first, these limits were 50 and 25 QI, respectively. The current limits date from 2014.
5
In 2011, Law 12.431 created Infrastructure bonds (Infra-bonds). Proceeds of these
bonds must be used to fund infrastructure projects. Before issuing Infra-bonds,
corporations must have their projects approved by the government. Infra-bonds’ maturity
cannot be less than 4 years. The interval between coupon payments cannot be less than
180 days. Infra-bonds can be inflation-linked (effective interest rate pegged to the
consumer price index, IPCA), but not interest rate-linked. Only Specific Purpose Entities
(SPE) are allowed to issue floating-rate Infra-bonds. In this case, the rate is pegged to the
Brazilian interbank offered interest rate, CDI (Portuguese: certificado de depósito
interbancário). During the first two years after issuance, issuers cannot trade in their own
Infra-bonds. Call provisions are not allowed. Infra-bonds can be issued under both CVM-
400 and CVM-476. Individuals (Portuguese: pessoas físicas) and foreign investors are
tax-exempt and legal investors (Portuguese: pessoas jurídicas) pay 15% rather than the
usual 25% tax-rate.
3. Data
Prospectuses and data on aggregate issuance, characteristics of issues, the
secondary market, default and renegotiation come from the national association of capital
markets agents (Associação Brasileira das Entidades dos Mercados Financeiro e de
Capitais, ANBIMA).4 Data on the placement of issues come from the offer-closing
announcements (anúncios de encerramento de oferta).5
4. The bond market
4.1. Bond characteristics
In this section, we characterize bonds issued in Brazil from 2009 to 2017.
Maturity: Table 3 lists maturity across types of bonds. The last column reports
aggregate values. The majority of the bonds have maturity between 5-10 years,
representing 53% of the proceeds and 46% of the number of issues. Bonds with maturity
between 3-5 years represent 22% of the proceeds and 20% of the number of issues. Bonds
with maturity below 3 years are also common, representing 22% of the issues, but only
4 Available at www.debentures.com.br. 5 Available at www.cvm.gov.br.
6
14% of the proceeds). Only a small proportion of bonds have maturity above 10 years,
12% of proceeds and 11% of the number of issues. This maturity profile is largely driven
by regular bonds. Infra-bonds have longer maturity than regular bonds, only rarely do
they have maturity below 5 years (their maturity cannot be less than 4 years). However,
this bond type represents a small share of the pool.
Fixed- versus Linked-yields (Portuguese: retorno pré- and pós-fixado): in general,
Brazilian bonds have linked yields. Table 4 report the types of yields. Fixed-yield bonds
account for only 2.3% of the aggregate proceeds (0.8% of the number of issues). The vast
majority of bonds, nearly 78% of the proceeds and number of issues, are linked to the
Brazilian interbank offered rate (Certificado de Depósito Interbancário, CDI or DI).
Inflation-linked bonds account for 11% of proceeds and 17% of issues. Inflation-linkage
prevails among Infra-bonds (69% of proceeds and 91% of number of issues). Inflation-
linkage is also frequent among Regular-CVM-400 bonds (28.5% of proceeds and 36.7%
of number of issues). US-Dollar-linked bonds are rare, accounting for only 6.4% of
proceeds and 0.3% of number of issues. Thus, US-Dollar-linked issues are large ones.
Proceeds: proceeds are relatively low. Only 13.5% of the issues have proceeds
above BRL $500 mi. However, the aggregate proceeds of such bonds correspond to
54.2% of the total (Table 5, last column). On the opposite side, small issues (proceeds
below BRL $100 mi) represent only 6.5% of aggregate proceeds, but this corresponds to
38% of number of issues. CVM-476 seems to be most frequently used for small issues:
40.1% of issues have proceeds below BRL $100 mi, but this corresponds to only 6.9% of
proceeds. This characteristic is relatively uniform across the two types of bonds.
Underwriting: unlike other bond markets, where underwriting of bonds is usually
competitive and dominated by international investment banks (Manconi et al., 2018; and
Carbo-Valverde et al., 2016), underwriting in the Brazilian bond market is dominated by
only two local universal banks. Table 6 reports underwriting in the Brazilian bond market.
Bradesco has the largest share: 53.3% of proceeds and 49.6% of issues. Itau-Unibanco
has 43.5% of proceeds and 45.5% of issues. Banco do Brasil comes next with only 0.8%
of proceeds and 0.4% of issues. This pattern is consistent across Regular and Infra bonds,
and CVM-400 and CVM-476 issues.
4.2. Ex-ante issuers’ performance

7
Rating: Brazilian bond ratings come predominantly from global rating agencies
(Standard and Poors S&P, Moodys, and Fitch). However, ratings also come from local
rating agencies (mainly, LF Rating and Austin Rating). Global rating agencies use a local
rating scale: corresponding to their global scale with suffix or prefix BR to indicate a local
rating. For instance, the S&P best rating for Brazilian bonds is brAAA, which bears the
same risk as the Brazilian Sovereign bonds (thus, brAAA is not equivalent to global
AAA). The reference for local investment grade is the same as for the global. For instance,
the S&P lowest local investment-grade rating is brBBB-.
Table 7 reports ratings. It is remarkable that more than half of the issues: 55.9%
of the proceeds (61.3% of the number of issues) have no rating at all. Issues with no rating
prevail almost exclusively among Regular-CVM-476 bonds: 66% of proceeds and 70.5%
of issues. Infra-bonds usually have an investment grade: less than 10% of the Infra-bonds
do not have investment grade.
Ex-ante credit event (EACE: default or renegotiation): reported EACE
complements rating as indicator of bond issuer creditworthiness. Table 8 shows EACE
for two separate periods: 2009-2013 and 2014-2017. CVM-400 was predominant in the
first period, and CVM-476 in the second (we exclude issues before 2009, when there was
no CVM-476). Strikingly, the frequency of EACE is high, regardless of the period.
Overall, EACE was reported for nearly 25% of proceeds, representing 23 to 30% of
number of issues. EACE is relatively more frequent for CVM-476 than for CVM-400
bonds, and for Regular than for Infra-bonds. Focusing on Regular bonds in the second
period, the EACE rate was higher for CVM 476 than for CVM-400 bonds: 26.8% versus
17.6% of the proceeds. Reported EACE was still frequent among Infra-bonds (6.3% for
CVM-400 and 11.7% for CVM 476).
To further investigate ex ante credit events, Table 9 splits them into strict default
and renegotiation. The sample period is 2014-2017. By considering a more recent sample
period, we increase issuers’ EACE track record. Panel A shows that renegotiation was
quite frequent, reaching 23.4% of the proceeds and 29.0% of the issues. This is surprising,
given the efforts and coordination involved in the negotiation of bond terms. As expected,
overall strict default rate is low (Panel B): 2.7% of the aggregate proceeds and 2.4% of
the issues. Strict default occurs only among Regular-CVM-467 bonds (2.9% of aggregate

8
proceeds and 2.6% of issues) and Infra-CVM-400 (4.0% of aggregate proceeds and 2.3%
of issues).
One would expect a negative correlation between EACE and investment grade.
In particular, issuers that receive investment grade are not expected to have reported
EACE. We investigate this. Table 10 reports cross-tabulation between investment grade
and EACE in the 2014-2017 period. As expected, the EACE rate is lower among
investment grade bonds than among bonds with no investment grade or a without rating:
20.0% versus 55.5% and 34.1% of issues in each category, respectively. Strikingly, 20%
(63 of 315 issues) is a very high rate of EACE for investment grade bonds. However, only
3 of these 63 issues (0.9%) were from issuers with reported strict default. Thus,
surprisingly, it seems that ratings do not reflect renegotiation as a credit event.
4.2. Ex-post bond performance
Ex-post credit events (EPCE: either default or renegotiation). The main indicator for bond
performance is the occurrence of EPCE. Table 11 reports EPCE for two separate periods:
2009-2013 and 2014-2017. One would expect frequency of EPCE to be lower in the more
recent period, because the sample includes recently issued bonds. However, overall EPCE
is very similar in both periods: nearly 20% of proceeds and number of issues. The
unexpectedly high frequency of EPCE in the second period comes mostly from Regular-
CVM-476 bonds that represent 89% of proceeds in the period (307.6/344.4). Thus,
Regular-CVM-476 bonds begin to present credit events from quite an early period after
their issuance. For the other types of bonds, the result is as expected: a very low rate of
EPCE in the recent period. Also surprisingly, the rate of EPCE among Infra-bonds in the
first period is very high: 34.8% of proceeds among CVM-400 and 45.9% among CVM-
476. These high values are driven by two factors: the small size of the Infra-bond market
and EPCE of a few issuers (2 issues from OAS and OGX that filed for financial distress,
and four other issues from Termeletrica Pernambuco).
To further investigate ex-post credit events, Table 12 splits them into strict default
and renegotiation. The sample period is 2009-2013. Panel A shows that renegotiation was
quite frequent, reaching 16.4% of proceeds and 17.20% of issues. As expected, the overall
strict default rate is smaller, but still considerable (Panel B): 6.2% of aggregate proceeds
and 8.7% of issues. Since the EPCE among Infra-bonds is biased by a few cases, we focus

9
only on Regular bonds. Strict default occurs mostly among Regular-CVM-467 bonds
(5.7% of proceeds and 8.8% of issues).
Table 13 reports cross-tabulation between investment grade and EPCE in the
2009-2013 period. As expect, EPCE rate is lower among investment-grade bonds than
among non-investment grade (bonds bearing a non-investment rating or not rated): 11.2%
versus 77.2% and 28.8% of issues in each category, respectively. This proportion, 11.2%
(66 of 586 issues), is a very high rate of EPCE for investment-grade bonds. However,
only 3.9% (23 of 586 issues) resulted from strict default (most of EPCE is renegotiation).
Nonetheless, this seems to be a very high default rate. For comparison, consider the S&P
default rate for global investment-grade corporate bonds for the 1981-2016 period
(Standard and Poors, 2017). The average EPCE (default rate) rate among BBB- bonds (the
lowest investment grade) is only 0.26%; among B- bonds, 9.6%; and for junk bonds with
ratings below CCC, 23.9% (recall that in Brazil, the default rate among non-investment
grade bonds is 77.2%).
Liquidity: Our measure of liquidity is the percentage of days for which there was
some trade on the bond. Table 14 reports liquidity for bonds issued before 2013. 51.7%
of issues (38.2% of proceeds) are never traded. Another 38.6% are traded on, at most, 5%
of the days. Only 1.5% of the issues are traded on more than 20% of the days. Liquidity
varies across bond types. There is very little trade on Regular-CVM-476: 58.8% of these
issues are never traded. This is expected, considering that these issues are allocated to, at
most, 50 investors.
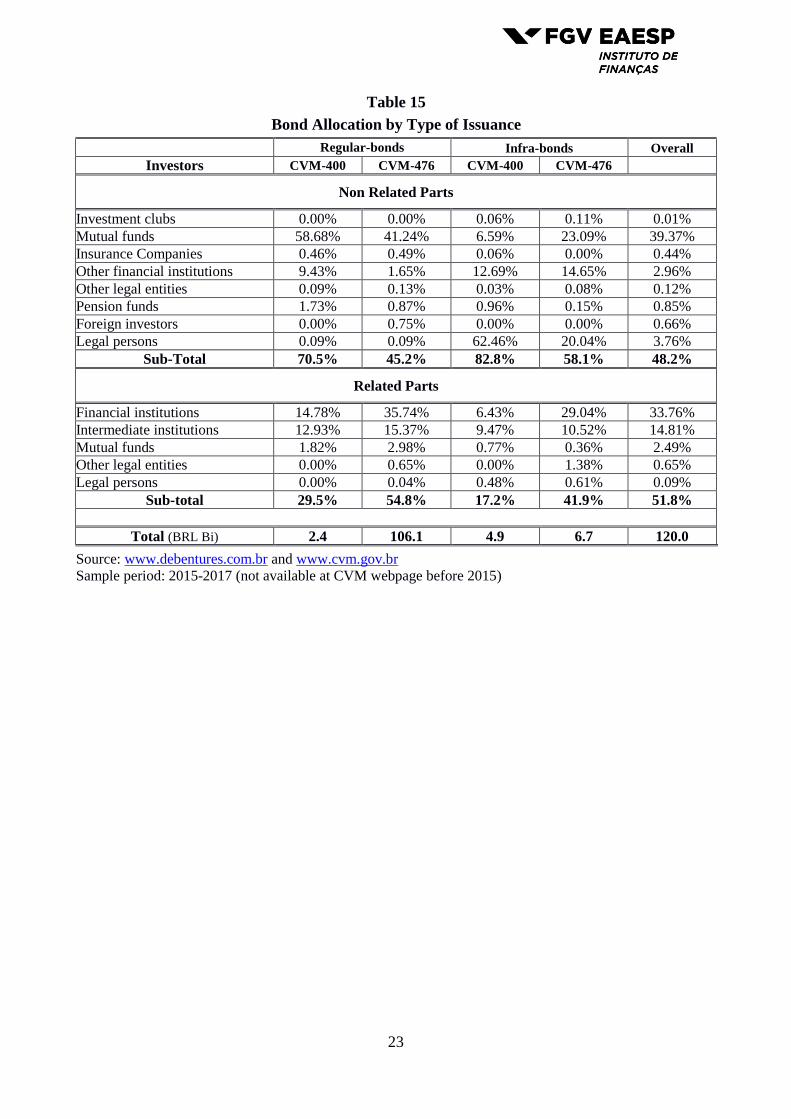
Clientele: CVM requires that underwriters publish detailed information on issues’
allocation across groups of investors (referred to as clientele). This information is
available in the anuncios de encerramento de oferta, AEO. We obtained AEO for the
2015-2017 period only. We divided the clientele into two main gruops: related to and not-
related to the syndicate of underwriters. Related organizations include all financial
institutions, brokerage houses, and investment funds managed by the underwriter. Table
15 reports allocation across clienteles. Remarkably, on average, nearly half of the
proceeds are allocated to related organizations. There is a strong cross-sectional variation
over the different bonds. CVM-476 bonds tend to be allocated to related organizations
more than CVM-400 are. For instance, among Regular-CVM-400 bonds, 70.5% of the
proceeds go to not-related organizations, while among Regular-CVM-476, this

10
proportion is 45.2%. For Infra-bonds, this difference is 82.8% among CVM-400 versus
58.1% among CVM-476. The main clienteles for Brazilian bonds are investment funds
not related to the underwriter (39.4% of the allocation) and financial institutions related
to the underwriter (33.7% of the allocation). Investment clubs, insurance companies,
pension funds and foreign investors receive less than 1% each. Curiously, investment
funds managed by the underwriter receive only 2.49% of the proceeds.
5. Final remarks
This article describes the microstructure of the market for corporate bonds in
Brazil. We focus on the 2009-2017 period, following two major changes in the bond
market: the institution of legislation CVM-476 and infrastructure bonds. These new
regulations fostered the corporate bond market in Brazil. We have examined some of the
main characteristics of the bond market. First, bond proceeds tend to be small (70% of
the issues are less than BRL $250 mi). Also, bonds have short maturity. For nearly 90%
of the issues, it is below 10 years. International agencies are the main providers of rating.
However, they use a Brazilian-adjusted rating scale. Fixed-yield bonds are rare. The vast
majority of regular bonds (non-infrastructure bonds) are linked to the Brazilian interbank-
offered interest rate (DI or CDI). Infrastructure bonds are most commonly inflation-
linked.
The most striking aspects of the Brazilian bond market concerns underwriting,
allocation and bond performance. Only two local universal banks dominate the
underwriting activity. These banks and their related parties receive more than half of the
allocation. This pattern is more frequent among bonds issued under CVM-476. In
contrast, the majority of the CVM-400 bonds is allocated to non-related parties.
Less than half of issues have an investment-grade rating, and more than half are
not rated at all. The exception are Infra-bonds that almost always bear an investment-
grade rating. Even more curiously, investment-grade rating seems not to take into account
recent credit events in the bond market: 20% of the issues with investment grade come
from issuers with a recently reported credit event (most commonly in the form of bond
terms renegotiation).

11
The incidence of ex post credit events (EPCE) is high: nearly 20% of bonds. EPCE
occurs mostly in the form of renegotiation of bond terms. However, strict default is also
high, reaching 6% of bonds. Even among investment-grade bonds, EPCE and strict
default are large, at 11% and 3.9% of issues. Finally, liquidity for bonds in the secondary
market is low, with the exception of Infra-bonds issued under CVM-400.
The combination of high frequency of renegotiation of bond terms, the frequent
link to the DI rate (which is the reference for bank loans), low liquidity, and the use of
CVM-476 (that waives, among other things, registration and the need for a detailed
prospectus) possibly reflect the replacement of bank loans by corporate bonds. This was
described in Torres-Filho and Macahyba (2014). Accordingly, banks recommend that
their larger corporate clients issue corporate bonds whenever their short-term credit lines
are fully used. In this process, banks offer guarantee of placement (acquiring part of the
issue, if needed). The securities are placed in several portfolios under the underwriter’s
management, from bank treasury to the investment funds under its management. This
explains the abnormally high frequency of bond terms renegotiation. This operation
results in a regulatory arbitrage. By doing so, banks pay fewer taxes and do not have to
make provision for credit risk. This scheme raises a question about the existence of an
effective bond market in Brazil. Our results are in line with those of Hawkins (2002), who
points out a conflict of interest of banks as participants of the bond market.

12
6. References
Biais, Bruno, and Richard Green. 2019. The microstructure of the bond market in the 20th
century. Review of Economic Dynamics (forthcoming).
Carbo-Valverde, Santiago, Francisco Rodriguez-Fernandez and Anthony Saunders, 2016.
Underwriting as certification of bank bonds. Working paper available at
https://papers.ssrn.com/sol3/papers.cfm?abstract_id=2665917
Comissão de Valores Mobiliários. CVM 400 Instruction, 2003. Retrieved from:
http://www.cvm.gov.br/legislacao/instrucoes/inst400.html
Comissão de Valores Mobiliários. CVM 476 Instruction, 2009. Retrieved from:
http://www.cvm.gov.br/legislacao/instrucoes/inst476.html
de Carvalho, Antonio Gledson, 2000. Ascensão e declínio do mercado de capitais no
Brasil, a experiência dos anos 90. Revista de Economia Aplicada 4, 595-632.
de Carvalho, Antonio Gledson, 2005. Lei de Falência, acesso ao crédito empresarial e
taxas de juros no Brasil. Revista de Economia Política 25, 112-132.
Fleming, Michael, and Neel Krishnan, 2012. The microstructure of the TIPS
market, Economic Policy Review, Federal Reserve Bank of New York, issue Mar,
pages 27-45.
Gyntelberg, Jacob, Guonan Ma, and Eli Remolona, 2006. Developing corporate bond
markets in Asia. BIS Papers 26: 13-21.
Hawkins, John, 2002. Bond markets and banks in emerging economies. BIS papers 11:
42-48.
Law 14.231, 2011. Retrieved from: http://www.planalto.gov.br/ccivil_03/_Ato2011-
2014/2011/Lei/L12431.htm
Manconi, Alberto, Ekaterina Neretina and Luc Renneboog, 2018, Underwriter
Competition and Bargaining Power in the Corporate Bond. European Corporate
Governance Institute (ECGI) - Finance Working Paper No. 548/2018.
Mu, Yibin, Peter Phelps, and Janet Stotsky, 2013. Bond markets in Africa. Review of
Development Finance 3: 121-135.
Ong, Li L, 2005. An anatomy of corporate bond markets: Growing pains and knowledge
gains. International Monetary Fund working paper 05/152.
Standard and Poors, 2017, 2016 Annual Global Corporate Default Study and Rating
Transitions. Available at
https://www.spratings.com/documents/20184/774196/2016+Annual+Global+
Corporate+Default+Study+And+Rating+Transitions.pdf/.
Torres-Filho, Ernani and Luiz Macahyba, 2014. Os mercados brasileiro e britânico de
títulos corporativos. Confederação Nacional da Indústria, Brasilia.
13
Table 1
Credit to Non-Financial Corporations (CNFC)
(as percentage of GDP)
Brazil Russia India China Emerging
Markets
G20
Countries
2005 37.6 31.0 n.a. n.a. n.a. n.a.
2006 40.1 31.7 n.a. 106.5 n.a. n.a.
2007 35.1 39.0 42.3 96.8 n.a. n.a.
2008 41.6 42.8 46.2 96.3 56.3 78.1
2009 42.2 47.2 47.3 119.9 73.5 86.9
2010 42.4 41.9 50.3 120.7 72.1 83.3
2011 42.2 41.3 50.4 119.9 69.8 79.9
2012 44.0 39.8 51.9 130.6 78.0 84.0
2013 46.4 43.1 52.2 140.7 84.7 86.2
2014 47.5 53.8 50.3 149.9 88.7 84.5
2015 49.2 57.9 50.3 162.7 99.0 91.0
2016 45.9 51.5 46.3 166.4 101.7 91.6
2017 43.9 49.3 44.7 160.3 104.6 96.2
Source: Bank of International Settlements (http://stats.bis.org). n.a.: not available.

14
Table 2
Bond Issuance over Time (proceeds and number of issues)
Year Total
BRL$ Bi
(# issues)
percent of Regular bonds (%) Infra-bonds (%)
GDP CNFC CVM-400 CVM-476 CVM-400 CVM-476
2005 14
(46) 0.66 6.69
100
(100)
2006 22
(42) 0.92 8.51
100
(100)
2007 13
(49) 0.49 3.90
100
(100)
2008 9
(37) 0.29 1.90
100
(100)
2009 29
(113) 0.88 6.04
45
(35) 55
(65)
2010 55
(197) 1.41 9.88
29
(17) 71
(83)
2011 52
(210) 1.20 8.01
6
(7) 94
(93)
2012 92
(321) 1.90 12.96
16
(10) 79
(87) 1
(1) 4
(2)
2013 71
(346) 1.33 9.30
11
(7) 81
(87) 5
(3) 4
(3)
2014 123
(354) 2.12 15.46
2
(2) 94
(90) 2
(3) 2
(5)
2015 66
(270) 1.10 7.92
11
(2) 79
(88) 5
(4) 4
(6)
2016 60
(243) 0.96 8.07
0
(1) 92
(88) 3
(2) 5
(9)
2017 95
(354) 1.46 13.02
3
(1) 88
(85) 4
(5) 6
(9)
Average
2005-08
14.5
(43.5) 0.6 5
Average
2009-17
71.4
(270) 1,4 10
Total 2009-2017 BRL Bi
(# issues) 125,7
(340)
542,0
(2,080)
15,4
(56)
19,3
(106)
Year total amount issued in BRL billions, year total number of issues (in parentheses), percentage of year total BRL value and percentage of year total issues (in parentheses). Infra-bonds: bonds issued to fund priority infrastructure projects (created by Law 12.431 of 2011); Regular bonds: Non-infra bonds; CVM-400: bonds issued under Instruction CVM-400 (required registration and broad distribution); and CVM-476: bonds issued under Instruction CVM-476 (registration not required and distribution restricted to a limited number of professional investors); CNFC: credit to non-financial corporations. Source: Brazilian Association of Capital Markets Participants (ANBIMA). Available at www.debentures.com.br.

15
Table 3
Bond Issuance by Maturity
Maturity Regular bonds Infra-bonds
Overall CVM-400 CVM-476 CVM-400 CVM-476
< 3 years 5.9 (15)
86.4
(549) - -
14%
(22%)
3 to 5 years 18.5 (32)
127.6
(471) -
0.27
(3)
22%
(20%)
5 to 10 years 33.9 (96)
276.1
(890)
11.1
(39)
8.7
(39)
53%
(46%)
> 10 years 8.5 (23)
51.8
(170)
4.2
(17)
10.3
(64)
12%
(11%)
Total
(100%) BRL Bi
(# issues) 66.8 (166)
542 (2,088)
15.5 (56)
19.3 (106)
643.6 (2,408)
Total in BRL billions, total number of issues (in parentheses), percentage of total BRL value and percentage of the total number of issues (in parentheses).

16
Table 4
Types of Yields
(sample period 2009-2017)
Index Regular bonds Infra-bonds Overall (%)
CVM-400 CVM-476 CVM-400 CVM-476
Fixed rate 2.3%
(1.8%) 1.4%
(0.4%) -
28.1% (7.5%)
2.3% (0.8%)
Interest rate (DI) 64.1%
(57.8%) 84.1%
(87.1%) - -
77.5% (79.2%)
Inflation index
(anyone)
28.5% (36.7%)
4.4% (9.2%)
100%
(100%) 69.7%
(91.5%) 11.1%
(16.9%) Government-
arbitrated
3.1% (2.4%)
1.1% (2.5%) -
2.2% (0.9%)
1.3% (2.3%)
Dollar - 7.6%
(0.4%) - -
6.4% (0.3%)
Other 1.9%
(1.2%) 1.3%
(0.4%) - -
1.3% (0.4%)
Total BRL bi
(# issues) 66.8 (166)
542 (2,088)
15.5 (56)
19.3 (106)
643.6 (2,408)
Total in BRL billions, total number of issues (in parentheses), percentage of total BRL value and percentage of the total number of issues (in parentheses). Infra-bonds: bonds issued to fund priority infrastructure projects (created by Law 12.431 of 2011); Regular bonds: Non-infra bonds; CVM-400: bonds issued under Instruction CVM-400 (required registration and broad distribution); and CVM-476: bonds issued under Instruction CVM-476 (registration not required and distribution restricted to a limited number of professional investors). Source: Brazilian Association of Capital Markets Participants (ANBIMA). Available at www.debentures.com.br.
Table 5
Issues’ Size
(sample period: 2009-2017)
BRL mi Regular bonds Infra-bonds Overall
CVM-400 CVM-476 CVM-400 CVM-476
< 100 2.6%
(16.3%) 6.9%
(40.1%) 4.5%
(19.6%) 12.2%
(41.5%) 6.5%
(38.0%)
100 to 250 11.2%
(27.7%) 18.0%
(31.2%) 21.8%
(35.7%) 31.9%
(38.7%) 17.8%
(31.4%)
250 to 500 25.6%
(29.5%) 20.4%
(15.8%) 34.1%
(28.6%) 28.3%
(15.1%) 21.5%
(17.0%)
> 500 60.5%
(26.5%) 54.8%
(12.9%) 39.6%
(16.1%) 27.7% (4.7%)
54.2% (13.5%)
Total BRL Bi
(# issues) 66.8 (166)
542 (2,088)
15.5 (56)
19.3 (106)
643.6 (2,408)
Total in BRL billions, total number of issues (in parentheses), percentage of total BRL value and percentage of the total number of issues (in parentheses). Infra-bonds: bonds issued to fund priority infrastructure projects (created by Law 12.431 of 2011); Regular bonds: Non-infra bonds; CVM-400: bonds issued under Instruction CVM-400 (required registration and broad distribution); and CVM-476: bonds issued under Instruction CVM-476 (registration not required and distribution restricted to a limited number of professional investors). Source: Brazilian Association of Capital Markets Participants (ANBIMA). Available at www.debentures.com.br.

17
Table 6
Leading Underwriters
(sample period: 2009-2017)
Bank Regular bonds Infra-bonds Overall
CVM-400 CVM-476 CVM-400 CVM-476
Banco do Brasil 0.8%
(0.6%) 0.8%
(0.4%) 0 0
0.8% (0.4%)
Bradesco 53.5%
(46.4%) 53.7%
(50.0%) 59.4%
(62.5%) 33.7%
(38.7%) 53.3%
(49.6%)
Itaú 44.8%
(51.8%) 42.8%
(44.8%) 40.6%
(37.5%) 59.5%
(53.8%) 43.5%
(45.5%)
Others 1.73% (1.8%)
3.43% (5.1%)
0 6.8%
(7.5%) 3.27% (4.9%)
Total BRL Bi
(# issues) 66.8 (166)
542 (2,088)
15.5 (56)
19.3 (106)
643.6 (2,408)
Total in BRL billions, total number of issues (in parentheses), percentage of total BRL value and percentage of the total number of issues (in parentheses). Infra-bonds: bonds issued to fund priority infrastructure projects (created by Law 12.431 of 2011); Regular bonds: Non-infra bonds; CVM-400: bonds issued under Instruction CVM-400 (required registration and broad distribution); and CVM-476: bonds issued under Instruction CVM-476 (registration not required and distribution restricted to a limited number of professional investors). Source: Brazilian Association of Capital Markets Participants (ANBIMA). Available at www.debentures.com.br.
Table 7
Bond Issuance by Rating
(sample period 2009-2017)
Percent
Regular-bonds Infra-bonds Overall (%)
CVM-400 CVM-476 CVM-400 CVM-476
Investment grade 97.6%
(98.2%) 33.6%
(28.2%) 100%
94.2% (91.5%)
43.6% (37.5%)
Non-investment grade 0.9%
(1.2%) 0.5%
(1.3%) - -
0.5% (1.2%)
Not rated 1.5%
(0.6%) 66.0%
(70.5%) -
5.8% (8.5%)
55.9% (61.3%)
Total BRL bi
(# issues) 66.8 (166)
542 (2,088)
15.5 (56)
19.3 (106)
643.6 (2,408)
Total in BRL billions, total number of issues (in parentheses), percentage of total BRL value and percentage of the total number of issues (in parentheses). Infra-bonds: bonds issued to fund priority infrastructure projects (created by Law 12.431 of 2011); Regular bonds: Non-infra bonds; CVM-400: bonds issued under Instruction CVM-400 (required registration and broad distribution); and CVM-476: bonds issued under Instruction CVM-476 (registration not required and distribution restricted to a limited number of professional investors). Source: Brazilian Association of Capital Markets Agents (ANBIMA). Available at www.debentures.com.br.

18
Table 8
Ex-ante Credit Event (EACE)
(renegotiation and default)
Panel A: Sample period 2009-2013
Regular bonds Infra-bonds
Overall CVM-400 CVM-476 CVM-400 CVM-476
EACE 21.1%
(20.4%) 27.8%
(24.4%) -
8.4% (16.7%)
25.8% (23.5%)
No EACE 78.9%
(79.6%) 72.2%
(75.6%) 100% 91.6%
(83.3%) 74.2%
(76.5%)
Total BRL Bi
(# issues) 54.4 (147)
234.4 (1,009)
3.9 (13)
6.4 (18)
299.2 (1,187)
Panel B: Sample period: 2014-2017
Regular bonds Infra-bonds
Overall CVM-400 CVM-476 CVM-400 CVM-476
EACE 17.6%
(26.3%) 26.8%
(33.4%) 6.3%
(7.0%) 11.7% (9.1%)
25.2% (30.6%)
No EACE 82.4%
(73.7%) 73.2%
(66.6%) 93.7%
(93.0%) 88.3%
(90.9%) 74.8%
(69.4%)
Total BRL bi
(# issues) 12.3 (19)
307.6 (1,071)
11.6 (43)
13.0 (88)
344.4 (1,221)
Total in BRL billions, total number of issues (in parentheses), percentage of total BRL value and percentage of the total number of issues (in parentheses). Infra-bonds: bonds issued to fund priority infrastructure projects (created by Law 12.431 of 2011); Regular bonds: Non-infra bonds; CVM-400: bonds issued under Instruction CVM-400 (required registration and broad distribution); and CVM-476: bonds issued under Instruction CVM-476 (registration not required and distribution restricted to a limited number of professional investors). Source: Brazilian Association of Capital Markets Participants (ANBIMA). Available at www.debentures.com.br.

19
Table 9
Ex-ante Credit Event: Renegotiation versus Strict Default
(sample period: 2014-2017)
Panel A: Renegotiation
Regular bonds Infra-bonds
Overall CVM-400 CVM-476 CVM-400 CVM-476
Renegotiation 17.6%
(26.3%) 24.9%
(31.7%) 2.3%
(4.7%) 11.7% (9.1%)
23.4% (29.0%)
No renegotiation 82.4%
(73.7%) 75.1%
(68.3%) 97.7%
(95.3%) 88.3%
(90.9%) 76.6%
(71.0%)
Total BRL Bi
(# issues) 12.3 (19)
307.6 (1,071)
11.6 (43)
13.0 (88)
344.4 (1,221)
Panel B: Strict Default
Regular bonds Infra-bonds
Overall CVM-400 CVM-476 CVM-400 CVM-476
Strict default - 2.9%
(2.6%) 4.0%
(2.3%) -
2.7% (2.4%)
No default 100% 97.1%
(97.4%) 96.0%
(97.7%) 100%
97.3% (97.6%)
Total BRL bi
(# issues) 12.3 (19)
307.6 (1,071)
11.6 (43)
13.0 (88)
344.4 (1,221)
Total in BRL billions, total number of issues (in parentheses), percentage of total BRL value and percentage of the total number of issues (in parentheses). Infra-bonds: bonds issued to fund priority infrastructure projects (created by Law 12.431 of 2011); Regular bonds: Non-infra bonds; CVM-400: bonds issued under Instruction CVM-400 (required registration and broad distribution); and CVM-476: bonds issued under Instruction CVM-476 (registration not required and distribution restricted to a limited number of professional investors). Source: Brazilian Association of Capital Markets Participants (ANBIMA). Available at www.debentures.com.br.
Table 10
Bond Rating versus Ex-ante Credit Event (EACE)
(sample period 2014-2017)
Number of issues No EACE EACE EACE
Renegotiation Strict Default
Investment grade 252
(80%)
63
(20.0%)
60
(19.0%) 3
(0.9%)
Non-investment grade 4
(45.5%)
5
(55.5%)
5
(55.5%) 2
(22.2%)
Not rated 591
(65.9%)
306
(34.1%)
289
(32.2%) 24
(2.6)
Number of issues and the percentage of the total number of issues (in parentheses). Investment grade: bonds with credit rating equal to or higher than BBB-, in the Brazilian local scale. Non-investment grade: bonds with credit rating lower than BBB-. Not rated: bonds issued without credit rating. Ex-Ante Credit Event (EACE): existence of previous events of renegotiation or strict default of the issuer before the issuance. Source: Brazilian Association of Capital Markets Agents (ANBIMA). Available at www.debentures.com.br.

20
Table 11
Ex-post Credit Event (EPCE)
(Default and Renegotiation)
Panel A: Sample period 2009-2013
Regular-bonds Infra-bonds
Overall CVM-400 CVM-476 CVM-400 CVM-476
EPCE 9.8%
(8.8%) 20.3%
(22.4%) 34.8%
(38.5%) 45.9%
(33.3%) 19.1%
(21.1%)
No EPCE 90.2%
(91.2%) 79.7%
(77.6%) 65.2%
(61.5%) 54.1%
(66.7%) 80.9%
(78.9%)
Total BRL bi
(# issues) 54.4 (147)
234.4 (1,009)
3.9 (13)
6.4 (18)
299.2 (1,187)
Panel B: Sample period 2014-2017
Regular-bonds Infra-bonds
Overall CVM-400 CVM-476 CVM-400 CVM-476
EPCE 2.2%
(5.3%) 23.0%
(25.0%) 2.6%
(2.3%) 2.5%
(2.3%) 20.8%
(22.3%)
No EPCE 97.8%
(94.7%) 77.0%
(75.0%) 97.4%
(97.7%) 97.5%
(97.7%) 79.2%
(77.7%)
Total BRL bi
(# issues) 12.3 (19)
307.6 (1,071)
11.6 (43)
13.0 (88)
344.4 (1,221)
Total in BRL billions, total number of issues (in parentheses), percentage of total BRL value and percentage of the total number of issues (in parentheses). Infra-bonds: bonds issued to fund priority infrastructure projects (created by Law 12.431 of 2011); Regular bonds: Non-infra bonds; CVM-400: bonds issued under Instruction CVM-400 (required registration and broad distribution); and CVM-476: bonds issued under Instruction CVM-476 (registration not required and distribution restricted to a limited number of professional investors). Source: Brazilian Association of Capital Markets Participants (ANBIMA). Available at www.debentures.com.br.

21
Table 12
Ex-post Credit Event (EPCE): Renegotiation versus Default
(2009-2013)
Panel A: Renegotiation
Regular-bonds Infra-bonds
Overall CVM-400 CVM-476 CVM-400 CVM-476
Renegotiation 8.8%
(7.5%) 18.3%
(18.5%) 32.9%
(30.8%) 1.6%
(11.1%) 16.4%
(17.2%)
No-renegotiation 91.2%
(92.5%) 81.7%
(81.5%) 67.1%
(69.2%) 98.4%
(88.9%) 83.6%
(82.8%)
Total BRL Bi
(# issues) 54.4 (147)
234.4 (1,009)
3.9 (13)
6.4 (18)
299.2 (1,187)
Panel B: Strict Default
Regular-bonds Infra-bonds
Overall CVM-400 CVM-476 CVM-400 CVM-476
Strict Default 1.7%
(2.0%) 5.7%
(8.8%) 34.8%
(38.5%) 45.9%
(33.3%) 6.2%
(8.7%)
No-Default 93.8%
(98.0%) 94.3%
(91.2%) 65.2%
(61.5%) 54.1%
(66.7%) 93.8%
(91.3%)
Total BRL Bi
(# issues) 54.4 (147)
234.4 (1,009)
3.9 (13)
6.4 (18)
299.2 (1,187)
Total in BRL billions, total number of issues (in parentheses), percentage of total BRL value and percentage of the total number of issues (in parentheses). Infra bonds: bonds issued to fund priority infrastructure projects (created by Law 12.431 of 2011); Regular bonds: Non-infra bonds; CVM-400: bonds issued under Instruction CVM-400 (required registration and broad distribution); and CVM-476: bonds issued under Instruction CVM-476 (registration not required and distribution restricted to a limited number of professional investors). Source: Brazilian Association of Capital Markets Participants (ANBIMA). Available at www.debentures.com.br.
Table 13
Bond Rating versus Ex-post Credit Event (EPCE)
(sample period 2009-2013)
Number of issues No-EPCE EPCE EPCE
Renegotiation Strict Default
Investment grade 520
(88.8%)
66
(11.2%)
50
(8.5%) 23
(3.9%)
Non-investment grade 5
(22.8%)
17
(77.2%)
15
(68.2%) 4
(18.2%)
Not Rated 412
(71.2%)
167
(28.8%)
139
(24.0%) 76
(13.1)
Number of issues and its percentage of the total number of issues (in parentheses). Investment grade: bonds issued credit rating equal or higher than BBB- in Brazilian local scale; Non-investment grade: bonds issued with credit rating lower than BBB- in Brazilian local scale; Not rated: bonds issued without credit rating; Ex-Post Credit Event (EPCE): event of renegotiation or default after the issuance. Source: Brazilian Association of Capital Markets Agents (ANBIMA). Available at www.debentures.com.br.

22
Table 14
Liquidity
(bonds issued during 2009-2013 period)
Regular-bonds Infra-bonds Overall
CVM-400 CVM-476 CVM-400 CVM-476
x = 0% 7.2%
(8.8%) 45.4%
(58.8%) -
62.2% (44.4%)
38.2% (51.7%)
0% < x ≤ 5% 27.3%
(43.5%) 49.3%
(38.4%) 7.7%
(7.7%) 23.3%
(33.3%) 44.2%
(38.6%)
5% < x ≤ 10% 31.0%
(24.5%) 3.5%
(2.2%) 11.3%
(38.5%) 9.8%
(16.7%) 8.8%
(5.6%)
10% < x ≤ 20% 21.7%
(15.0%) 1.5%
(0.6%) 13.1%
(15.4%) 4.7%
(5.6%) 5.4%
(2.6%)
x > 20% 12.8% (8.2%)
0.3% (0.1%)
67.9% (38.5%)
- 3.4%
(1.5%)
Total BRL Bi
(# issues) 54.4
(147)
234.4
(1,009)
3.9
(13)
6.4
(18)
299.2
(1,187)
Number of days with trading over the number of days since issuance. Total in BRL billions, total number of issues (in parentheses), percentage of total BRL value and percentage of the total number of issues (in parentheses). Infra bonds: bonds issued to fund priority infrastructure projects (created by Law 12.431 of 2011); Regular bonds: Non-infra bonds; CVM-400: bonds issued under Instruction CVM-400 (required registration and broad distribution); and CVM-476: bonds issued under Instruction CVM-476 (registration not required and distribution restricted to a limited number of professional investors). Source: Brazilian Association of Capital Markets Participants (ANBIMA). Available at www.debentures.com.br and www.cvm.gov.br
23
Table 15
Bond Allocation by Type of Issuance
Regular-bonds Infra-bonds Overall
Investors CVM-400 CVM-476 CVM-400 CVM-476
Non Related Parts
Investment clubs 0.00% 0.00% 0.06% 0.11% 0.01%
Mutual funds 58.68% 41.24% 6.59% 23.09% 39.37%
Insurance Companies 0.46% 0.49% 0.06% 0.00% 0.44%
Other financial institutions 9.43% 1.65% 12.69% 14.65% 2.96%
Other legal entities 0.09% 0.13% 0.03% 0.08% 0.12%
Pension funds 1.73% 0.87% 0.96% 0.15% 0.85%
Foreign investors 0.00% 0.75% 0.00% 0.00% 0.66%
Legal persons 0.09% 0.09% 62.46% 20.04% 3.76%
Sub-Total 70.5% 45.2% 82.8% 58.1% 48.2%
Related Parts
Financial institutions 14.78% 35.74% 6.43% 29.04% 33.76%
Intermediate institutions 12.93% 15.37% 9.47% 10.52% 14.81%
Mutual funds 1.82% 2.98% 0.77% 0.36% 2.49%
Other legal entities 0.00% 0.65% 0.00% 1.38% 0.65%
Legal persons 0.00% 0.04% 0.48% 0.61% 0.09%
Sub-total 29.5% 54.8% 17.2% 41.9% 51.8%
Total (BRL Bi) 2.4 106.1 4.9 6.7 120.0
Source: www.debentures.com.br and www.cvm.gov.br Sample period: 2015-2017 (not available at CVM webpage before 2015)