the money navigator - august 2015
DESCRIPTION
This month edition focuses on the current situation in global markets , including India , is uncertain and unforeseeable due to de-growth in China and fear of interest rate hike by Fed.TRANSCRIPT

Current situation in Global Markets, including India, is uncertain and unforeseeable due to de-growth in China and fear of Interestrate hike by Fed. As of now these two events have puzzled the world. There will be certain negative impact on the world marketsbut how much, time will tell. However, we believe that India can be differentiate itself among other EMs if India speed ups its MacroEconomic reforms as compared to other EMs.
1st September-2015 to 30th September-2015 www.jhaveritrade.com
PSU BankingSectorPg. 3-6
For
Priv
ate
Cir
cula
tion
Onl
y
Global Markets & India:Foggy TransitionPg. 1
Ahluwalia Contracts(India) LtdPg. 8-11
AHLUWALIACONTRACTS(INDIA) LTD.
Global Markets & India

No Hidden Charges Easy to Operate Live Price Movement Live Chart
Trade in EQUITY / EQ Derivative / Currency Derivative / Commodity Derivative Trading*
Track your DP Holding & Balance Global Market Jhaveri Research
Common Market Watch for all Segment i.e. BSE, NSE & NSEFO, CD NSE, MCX.
| | |
| |
Compatible with All Operating Systems
APPLE ANDROID MICROSOFT
Trade Whenever & WhereverFaster Smarter Simpler
Jhaveri Securities Ltd. All Rights Reserved
AllA
Give Missed Call : 08049336177SMS JeTrade to : 9601336677 | Call : 9925420000
JHAVERI SECURITIES LTD301/302, Payal Tower-II, Sayajigunj Vadodara - 390020, Web.: www.jhaveritrade.com I www.jetrade.in
Ph.: + 91 265-3071200
*through group company JCCL.
www.jhaveritrade.com
From The MD’s Desk
Recently, the devaluation of Yuan by China triggered heavy selloff in the world market including India.
The world market is waiting for one meaningful correction as the rally was mainly driven by liquidity.
Valuations of many sectors and companies are at unsustainable level in China as well as in other
countries. FIIs have sold equities to the tune of 15 to 18 thousand crores of shares and still are in selling
mode. Majority of emerging markets have seen outflow from ETF and hot money. The figures suggest
that still there is no respite and every bounce is seen as a relief rally.
The market is cautious on back of lack of rain in the month ofAugust, the uncertainty around GST rollout
and the outcome of Bihar election. The uncertainty around the rate hike by Fed is also keeping the
market sentiment weak. The market is waiting for next level of trigger.
Under the circumstances, international events will be driving the market in near term. The RBI decision
on rate cut on 29th September will also be a decisive event for the market. It is suggested to keep an eye
on the data coming out of China and USA.
Technically, the broad range of the market is 7600 to 8100.
Kamlesh Jhaveri ( MD )Jhaveri Securities Ltd.
International events & RBI rate cut hopes will
drive the market – either Way
www.jhaveritrade.com
Issu
e Th
eme
Global Markets & India : Foggy Transition
1
Currency devaluation and its likely impact
Effects of devaluation
Why did China opt for currency devaluation ???
A devaluation occurs in a fixed exchange rate regime (like in China). A depreciation occurs in a floating exchange ratesystem (like in India). Both means a fall in the value of the currency.
Devaluation means a deliberate downward or adjustment to the value of a country's currency relative to another currency orgroup of currencies which is decided by the government who issues the currency. Depreciation is a result of non-governmental activities and open market forces. Devaluation is a monetary policy tool of countries that have a fixedexchange rate regime.
Cheaper exports: A devaluation of the exchange rate will make exports more competitive and become cheaper forforeigners. This will increase demand for exports.
Expensive imports :Adevaluation means imports will become more expensive. This will reduce demand for imports.
Increased Aggregate (total) Demand (AD) : A devaluation could cause higher economic growth. Therefore part of ADis (X-M) higher exports and lower imports should increase total demand (assuming demand is relatively elastic).
Improvement in the current account : Competitive exports and expensive imports leads to higher exports and lowerimports, which will reduce the current account deficit.
The effects of a devolution depends onDemand for exports and imports : If demand is price inelastic (No change), than a fall in the price of exports will leadto only a small rise in quantity.
State of the global economy : If the global economy is in recession, then a devaluation may be insufficient to boostexport demand.
Inflation : It depends why the currency is being devalued. If it is due to a loss of competitiveness, then a devaluation canhelp to restore competitiveness and economic growth. If the devaluation is aiming to meet a certain exchange ratetarget, it may be inappropriate for the economy.
Unlike most countries that allow the value of their currency to be determined in world markets or open market (like India),China’s government uses the U.S. dollar as a benchmark against which they manage their currency’s value.
For decades, China had an unsustainable growth rate (higher GDP growth rate than usual). For example investments madeup 48 percent of economic activity in 2014, in most countries the number is between 15 and 30 percent.
However, recently China’s economy, the world’s second largest after the U.S, has been slowing down. China’s growthrate has dropped to 7 percent, a high number as compared to any country in the world, but low in a country that averaged10.6 percent growth in 2010.
Evaluation of Devaluation
www.jhaveritrade.com
Issue Theme
2
Global Markets & India : Foggy Transition
There has been a slowdown in property and in construction market and consumer spending is down. China’s stockmarket crashed in June.
To strengthen the economy, monetary policy is the only tool to revive the economy,People Bank of China has cut interest rates four times in the past 12 months, increased the amount of money bankscan lend out—measures meant to boost domestic demand. However, there will have adverse impact also and this scopeis limited up to certain extent.
China has kept the Yuan tied to a strong dollar, other countries’ exports have gained an edge over China’s as theircurrencies have fallen against the Yuan over the past year.
China signaled with its currency devaluation that the domestic economic slowdown and it has failed to reverse it is no longera problem only restrict to China. It is now the world’s problem.
China has demand for natural resources (biggest consumer of commodity) and has been a key factors supporting theprice of oil in recent years.
There will be an indirect impact on the countries which are having heavy debt – because while wages and profits fall in adeflationary period, the value of debts remains fixed, making them harder to service (to pay interest on).
The recent China’s decision is an evidence of lack of demand in the global economy, which will unleash deflation. Briefperiods of falling prices can be good news but consistent fall can be danger for world economy also. Which canundermine spending and investment and feed through to wages, as consumers and businesses delay spending,expecting goods to be even cheaper in future.
As the cheaper a country’s currency, the more competitive its exports. With such a weak Yuan, China is a “fiercecompetitor” — more so than ever to rest of export countries. It’s possible that countries will depreciate their owncurrencies in order to compete with China.
Canada, New Zealand, Australia, Korea, Thailand, and Malaysia are likely to be hardest hit. They export a lot to China,but with a weakened Chinese economy, there is less demand for their goods.
We believe that the current situation of global markets, including India in spite of better macros, are uncertain and confusingbecause of China. China has taken various steps to bolster its economy but these steps are not enough to support economy.China, being a largest economy in the word and largely depended on exports, is always a Black Box for global economy andalways being difficult to predict, understand and analyze. So there will be a only perception based analysis and which kind ofscenario will emerge from this situation that only time will tell. We also believe that However, as far as India is concerned,market valuations are going to be attractive if nifty will reach 7400-7500. Long term investors should wait a while for freshentry and traders should strictly follow the Index trend on daily basis.
China’s currency devaluation and its impact on world economy
Conclusion
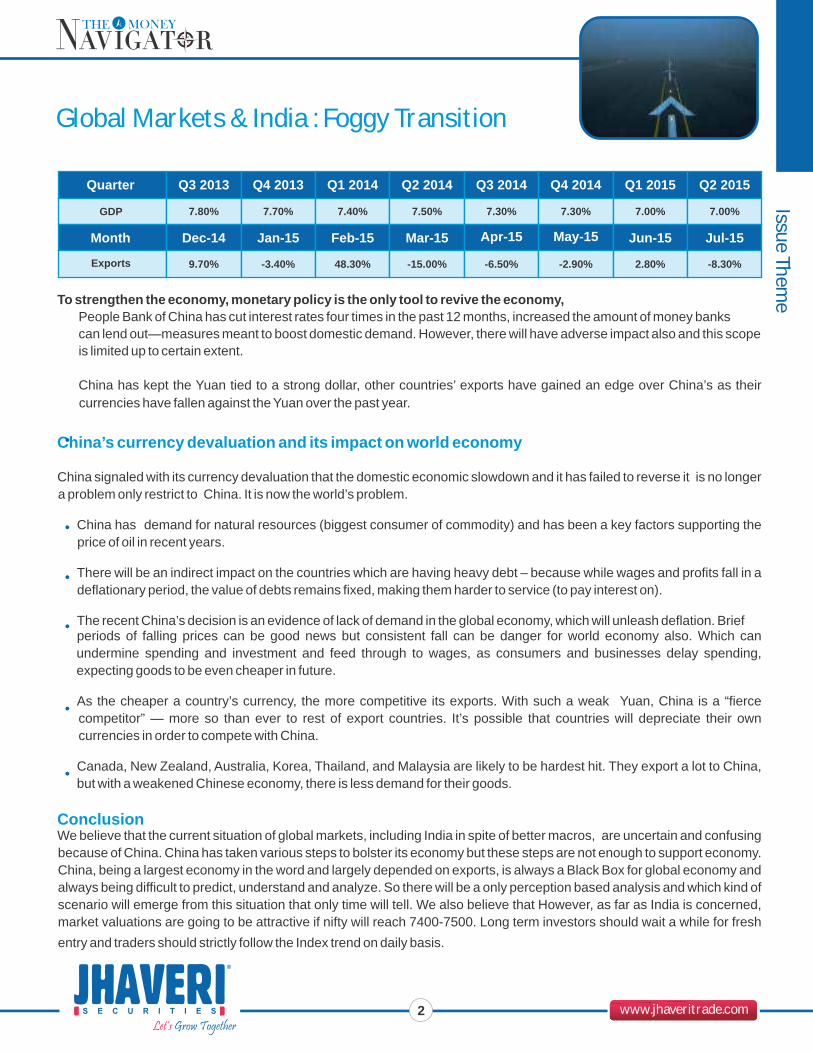
Quarter Q3 2013 Q4 2013 Q1 2014 Q2 2014 Q3 2014 Q4 2014 Q1 2015 Q2 2015
GDP 7.80% 7.70% 7.40% 7.50% 7.30% 7.30% 7.00% 7.00%
Month Dec-14 Jan-15 Feb-15 Mar-15 Apr-15 May-15 Jun-15 Jul-15
Exports 9.70% -3.40% 48.30% -15.00% -6.50% -2.90% 2.80% -8.30%

PSU Banking Sector
www.jhaveritrade.com
Sect
or U
pdat
e
3
Introduction
Why revamping of PSU Banks are important ?
The Public Sector Banks (PSBs) play a vital role in India’s economy. In the past few years, because of a variety of issuessuch as banks own performance, delay in various approvals, low global and domestic demand, many large projects stalled.Public Sector Banks which have got predominant share of infrastructure financing and prior sector lending have been badlyaffected. This has resulted in lower profitability for PSBs, mainly due to provisioning for the restructured projects as well asfor gross NPAs.The performance of public sector bank (PSB) stocks can be understand by a single parameter. In the past year, while theBSE India Bankex (both public and private sector banks) rose 22.2 per cent, the CNX PSU Bank index is down 1.5 per cent.
Making 70% of the system credit.
Low growth at all the PSU banks are running at low level and deposit growth at moderate level.
Asignificant pile up of stressed assets has been seen over the last three years.
The stressed assets pool has large contribution from the power (particularly SEBs) and infra sectors partlydue to the implied onus on PSBs to support government initiatives. Therefore, it also the onus of thegovernment to reciprocate through constructive policy measures.
To come out from this vicious loop of low capital - low growth - low profitability - low valuation, an effectiveintervention in the functioning and capital infusion by the promoter (GOI) had become necessary.
Company Name Monthly Quarterly Half Yearly Yearly
CNX NIFTY
CNX PSU Bank
-3.86
5.22
-1.88
-0.87
-6.04
-9.85
5.18
-1.50
CNX PSU Bank Bank of Baroda
St Bk of India
Oriental Bank
IDBI Bank
Canara Bank
Union Bank (I)
Syndicate Bank
Bank of India
Allahabad Bank
Andhra Bank
I O B
Punjab Natl.Bank
30.75
-0.39
-8.68
4.27
15.16
20.86
-2.64
-3.25
-0.62
5.79
-2.32
14.60
28.47
-5.29
-21.08
-2.54
-7.22
22.49
-7.71
-17.64
-12.65
-2.54
-10.10
6.30
8.92
-11.51
-34.33
-12.00
-20.42
11.15
-17.10
-30.23
-21.10
-15.55
-23.69
-4.70
10.74
8.40
-41.29
-16.49
-15.53
-6.11
-22.59
-42.40
-28.73
-1.12
-41.99
-17.49
Note : Absolute Return in % (Monthly, Quarterly, Half Yearly, Full Year)All absolute return calculated from CMP (*CMP as on 21/08/2015 )

www.jhaveritrade.com
Sector Update
PSU Banking Sector
4
To revamp the performance of PSU Bank- Government has introduced INDRADHANUSH
Key takeaways from this revamp strategy
Appointment
Bank Board Bureau
Likely Impact
Capitalization
To revive the fortunes of public sector banks, the Government has finally announced a concrete plan towardsrevamping the functioning, improving competitive positioning and elevating long-term profitability of the PublicSector Banks (PSBs). Government has launched a seven pronged / steps plan- Indradhanush - to revamp functioning ofpublic sector banks. The seven elements include :
According to Crisil, “The government’s plan to revamp public sector banks could be a game-changer and will help banks address problems which are impacting their performance including governance, accountability and capitalization. Thefocus on capital efficiency rather than business growth marks a paradigm (big) shift.”
The Government has decided to separate the post of Chairman and Managing Director. The subsequent vacancies ( theother ) to be filled up by the CEO and will get the designation of MD & CEO. There would be another person who would beappointed as non-Executive Chairman of PSBs.
The entire process of selection for MD & CEO was revamped. This approach is based on global best practices and as perthe guidelines in the CompaniesAct . Private sector candidates were also allowed to apply for the position of MD & CEOof the five top banks i.e. Punjab National Bank, Bank of Baroda, Bank of India, IDBI Bank and Canara Bank.
The BBB will be a body of eminent professionals and officials, which will replace the Appointments Board for appointment ofWhole-time Directors as well as non-Executive Chairman of PSBs. The BBB will start functioning from the 01st April, 2016.
They will also constantly engage with the Board of Directors of all the PSBs to formulate appropriate strategies for theirgrowth and development.
: The Bank Board Bureau will be responsible for board-level appointments and performancemonitoring of PSBs on the key indicators. The bureau will advise banks and act as a link with the government.
The PSBs are adequately capitalized and meeting all the Basel III and RBI norms. However, all the banks should have asafe buffer over and above the minimum norms of Basel III. Therefore, govt. has estimated how much capital will berequired this year and in the next three years till FY 2019. The capital requirement of extra capital for the next four yearsup to FY 2019 is likely to be about `1,80,000 Cr.
INDRADHNUSH1
Appointments
3 4 5 6 72
Bank BoardBureau Capitalization De-Stressing
PSBs Empowerment Framework ofAccountability
GovernanceReforms

PSU Banking Sector
www.jhaveritrade.com
Sect
or U
pdat
e
5
Out of the total requirement, the Government proposes to make available ` 70,000 Cr. out of budgetary allocations forfour years as per the figures. These are : 2015-16 and 2016-17 ( `25,000 Cr.) , 2017-18 and 2018-19 ( `10,000 Cr.).
For FY15-16, The manner of allotting ` 25,000 crore capital this year, as announced earlier, is as follows :
About 40% of this amount will be given to those banks which require support, and every single PSB will be brought to thelevel of at least 7.5% by Financial Year 2016.
40% capital will be allocated to the top six big banks viz. SBI, BOB, BOI, PNB, Canara Bank, and IDBI Bank in order tostrengthen them to play a vital role in the economy.
The remaining portion of 20% will be allocated to the banks based on their performance during the three quarters in thecurrent year judged on the basis of certain performance.
In order to reduce asset quality stress of PSBs, the government would take various policy level action such as gettingprojects moving through expeditious approvals altering duty structure to support stressed sectors, improving financialhealth of SEBs.
Asset Reconstruction Companies will be strengthen so that they can take over bad loans from PSBs. The Governmentintends to deepen the corporate debt market so that long term infra projects could be funded through it reducing the onus onPSBs.
Phase : 1
Phase : 2
Phase : 3
De-stressing
Name of Bank Capital Allocation(Rs. in Cr.)
Capital AdequacyRatio (in %) Name of Bank Capital Allocation
(Rs. in Cr.)Capital Adequacy
Ratio (in %)
State Bank of India
Bank of India
IDBI
Bank of Baroda
Punjab National Bank
Allahabad Bank
Dena Bank
5531
2455
2229
1786
1,732
283
407
12
11.2
11.9
13.1
12.9
10.4
10.9
Canara Bank
Indian Overseas Bank
Union Bank of India
Corporation Bank
Andhra Bank
Bank of Maharashtra
Total Amt. ( `. in Cr.)
947
2,009
1,080
857
378
394
10.7
10.1
10.2
11.1
10.7
11.9
20,088

www.jhaveritrade.com
Sector Update
Empowerment of PSBs
Frame work ofAccountability and Governance reforms
Conclusion
Stocks to watch in PSBs
In this rule , there will be no interference from Government and Banks are encouraged to take their decisionindependently keeping the commercial interest of the organization in mind.
The Government intends to provide greater flexibility in hiring manpower to Banks. The Government is committed toprovide required professionals
The present system for the measurement of bank’s performance was a system called “SoI—Statement of Intent” wherebased on certain criteria decided by Ministry of Finance, the banks used to come up with their annual target figures. Inthis programme, a new framework of Key Performance Indicators (KPIs) to be measured ( with various tools andtechniques for performance of PSBs.
In governance, the Government has been constantly engaging with the Banks through review meeting and sessions forstrategic reviews.
We believe that PSU banks' revival plan 'Indradhanush' could help the lenders register higher growth rate than earlierestimated and effectively deal with the issue of NPAs.
Stock Book Value RoA (%) RoE (%) Comments
FY 16E FY 17E FY 16E FY 16EFY 17E FY 17E
State Bank of India
Bank ofBaroda
AndhraBank
Punjab National Bank
230
184
180
220
258
206
196
258
0.72
0.66
0.55
0.57
Asset quality performance relatively stable ,Completechange of the troubled SME , Focus on reducing costto income ratio, better in Tier-I capital adequacy ratiothan peers, A focus on profitable growth and a strongliability ty franchise (largely low-cost retaildeposits)
Credit growth to be led by domestic book in next twoyears, Healthy deposit franchise, NIM to stay steady ahead, Improvement contingent on asset quality.
Mid Sized bank with stable asset quality and strongearnings growth potential, Earnings are likely to growby 47.2 per cent over FY14-17.
More levered to economic recovery and best bet oneconomic recovery , PNB’s tier-I is healthy at 8.5 percent and government fund infusion will strengthenthis.
0.80
0.78
0.62
0.70
12.20
12.50
9.50
12.20
13.90
15.00
11.90
13.90
6
PSU Banking Sector

Why Equity Sip ?Transparency Cost Effective Goal Based
Investment of `1000 per month
cond
ition
app
ly*
Call+91 265 3071200, +91 99254 20000Email : [email protected] Web : www.Jetrade.in

Ahluwalia Contracts (India) Ltd
www.jhaveritrade.com8
AHLUWALIACONTRACTS(INDIA) LTD.
“Buy” CMP : `234 TGT : `368Company Basics
BSE ID NSE Symbol Group EQUITY (` in Cr.) MKT.CAP(` in Cr.)
532811AHLUCONT
B13.40
1594.97
Financial BasicsFV ( )EPS ( ) (TTM)P/E (x) (TTM)P/BV (x) (TTM)BETARONW (%)
`
`
2.009.56
24.914.74
1.68173.55
Investment Rationale
Share Holding PatternHolder's Name
Foreign
Institutions
Promoters
Govt. Holding
Public & OthersNon Promoter Corp. Hold.
% Holding
15.49
5.92
66.87
6.44
5.29
0.00
ROI : 57%
Valuations
AHLUCONT is currently trading at17.76X FY16E EPS of `13.20 and14.63x FY17E of `16.00, Valued thestock at 23x FY17E with target priceof ` 368.
Investment Horizon : 12 to 15 Months
Company Overview
Industry Overview
Investment Rational
ACIL is an integrated construction company, offering turnkey solutions in engineeringand designing to public and private sectors. The company is primarily in the business ofconstruction of wide range of structural building and manufacture of Ready MixConcrete. They are having business interests in varied segments including IT Parks,Retail, Multi Storied Housing Complexes, Industrial Complexes, LuxuryHotels, Hospitals and Commonwealth Games Village & Stadium. In the past five years,ACILhas executed more than 50 projects.
Construction activity is an integral part of the country’s infrastructure and industrialdevelopment. The construction industry covers some vital sectors such as hospitals,schools, urban infrastructure, highways, roads, ports, railways, airports, powersystems, irrigation and agriculture systems, telecommunications etc. with such a widespectrum covered, the sector becomes the basic input for the socio-economicdevelopment. construction sector contributes to about 65% of the total investmenttowards infrastructure.
Relaxation on FDI norms in construction industry
Incubement government’s “Housing for all by 2022”
Rs. 48000 Cr. for building 100 smart cities under smart cities mission
Rs. 500 Cr. allocated in budget towards 3P India to rejuvenate the PPP model
ACL with over 80 ongoing projects across 50 cities has superior execution capabilities,having executed slew of projects across residential and commercial complexes overthe past five decades. competition is now limited to only 3-4 players namely shapoorjipallonji, L&T, simplex and NCC as the most of the other compansies do not have thebalance sheet strength to bid for composite EPC contracts.
PSU’s have made their norms more stringent to weed out faltering contractors
Many contractors have entered into CDR
Government initiatives
Superior execution and declining competition
Com
pany Analysis
9
Ahluwalia Contracts (India) Ltd
www.jhaveritrade.com
AHLUWALIACONTRACTS(INDIA) LTD.
Com
pany
Ana
lysi
s
Revival of ordering in other infra sectors like roads has reduced focus from buildingssegments
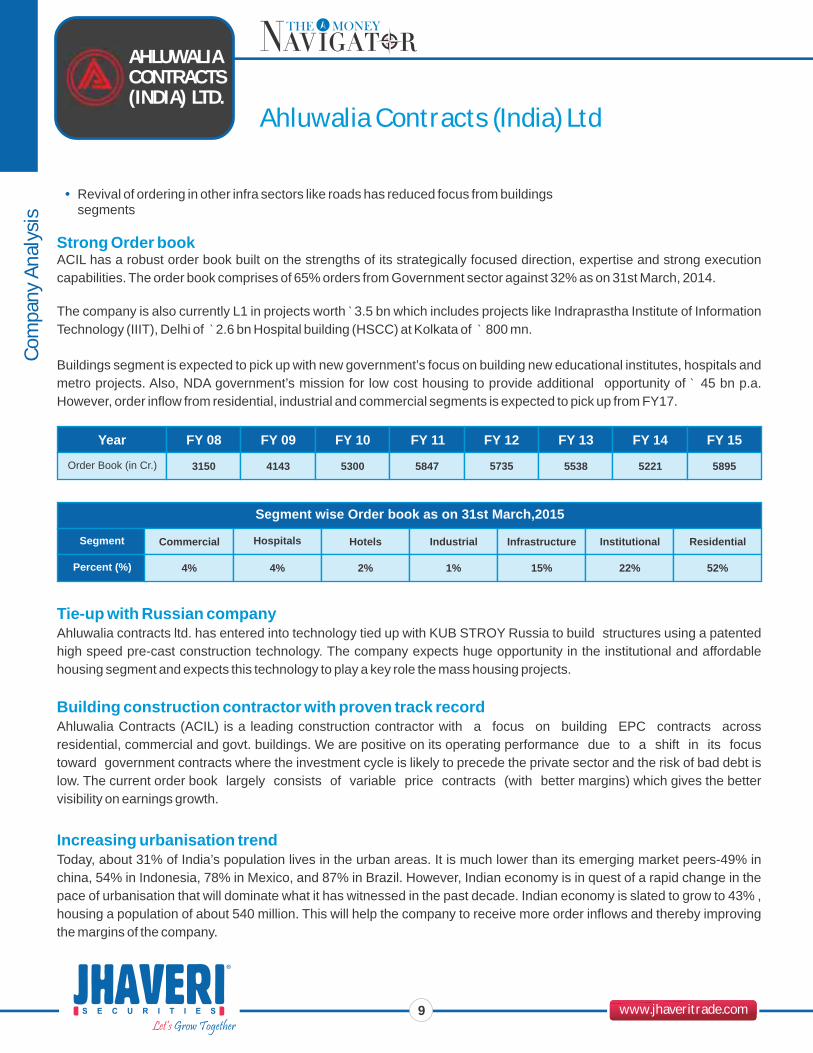
ACIL has a robust order book built on the strengths of its strategically focused direction, expertise and strong executioncapabilities. The order book comprises of 65% orders from Government sector against 32% as on 31st March, 2014.
The company is also currently L1 in projects worth `3.5 bn which includes projects like Indraprastha Institute of InformationTechnology (IIIT), Delhi of `2.6 bn Hospital building (HSCC) at Kolkata of ` 800 mn.
Buildings segment is expected to pick up with new government’s focus on building new educational institutes, hospitals andmetro projects. Also, NDA government’s mission for low cost housing to provide additional opportunity of ` 45 bn p.a.However, order inflow from residential, industrial and commercial segments is expected to pick up from FY17.
Ahluwalia contracts ltd. has entered into technology tied up with KUB STROY Russia to build structures using a patentedhigh speed pre-cast construction technology. The company expects huge opportunity in the institutional and affordablehousing segment and expects this technology to play a key role the mass housing projects.
Ahluwalia Contracts (ACIL) is a leading construction contractor with a focus on building EPC contracts acrossresidential, commercial and govt. buildings. We are positive on its operating performance due to a shift in its focus toward government contracts where the investment cycle is likely to precede the private sector and the risk of bad debt islow. The current order book largely consists of variable price contracts (with better margins) which gives the bettervisibility on earnings growth.
Today, about 31% of India’s population lives in the urban areas. It is much lower than its emerging market peers-49% inchina, 54% in Indonesia, 78% in Mexico, and 87% in Brazil. However, Indian economy is in quest of a rapid change in thepace of urbanisation that will dominate what it has witnessed in the past decade. Indian economy is slated to grow to 43% ,housing a population of about 540 million. This will help the company to receive more order inflows and thereby improvingthe margins of the company.
Strong Order book
Tie-up with Russian company
Building construction contractor with proven track record
Increasing urbanisation trend
Year FY 08 FY 09 FY 10 FY 11 FY 12 FY 13 FY 14 FY 15
Order Book (in Cr.) 3150 4143 5300 5847 5735 5538 5221 5895
Segment wise Order book as on 31st March,2015
Commercial Hospitals Hotels Industrial Infrastructure Institutional ResidentialSegment
Percent (%) 4% 4% 2% 1% 15% 22% 52%

Ahluwalia Contracts (India) Ltd
www.jhaveritrade.com8
AHLUWALIACONTRACTS(INDIA) LTD.
10
KOTABOT projects starts to generate revenues from FY 16ACIL has leased 45-50% of the space and would start earning rentals from H2FY16 onwards. The company is expected toearn lease rentals of `100 mn / p.a. from this project for next 40 years.
Better quality orders to improve the margins
As more than 90% of new orders are being given on composite basis vs earlier practice of awarding separate packages forcivil works, electrical works, etc. composite orders enjoy higher margins owing to higher value projects and sensible biddingfrom players due to low competition. The company has suffered losses in both FY12 and FY13 due to delayed execution ofprojects in the private sector. The EBITDA margin rose to 11.94% in FY15 due to successful completion of theprojects and strong execution capabilities. The company has shifted its focus from private sector to government orders(50:50) currently. Due to increasing portion of the government orders and operating efficiencies with better utilizations of capital equipment has further scope of margin improvement.
The company maintains revenue growth of 20-25% for FY16 and FY17 as well. The company will maintain EBITDAmargin of 12-12.5% for FY 16.
Slow-moving or low margin orders amount Rs 250 Cr. Some of these orders are not at all moving and the company islooking at exiting these project.
In metro segment the company is looking for elevated stations orders which is the forte of the company.
Q1 FY16 Conference Call Update
Quarter Q1 FY14 Q2 FY14 Q3 FY14 Q4 FY14 Q1 FY15 Q2 FY15 Q3 FY15 Q4 FY15
Total Sales 2202 2495 2408 2498 2389 2398 2672 3141
Sales Growth (YoY) -36.01% -29.10% -24.02% -33.02% 8.54% -3.90% 11.00% 26%
Com
pany Analysis
200
150
100
50
0
-50
148.9
12.79% 174.5
11.13%
157.1
9.30%
1.78%
24.3-11.7
-0.84%
6.81%65.4
126.5
11.94%
FY 09 FY 10 FY 11 FY 12 FY 13 FY 14 FY 15-2.00%
0.00%
-2.00%
4.00%
6.00%
8.00%
10.00%
12.00%
14.00%
EBITDA (Rs in Cr.) EBITDA Margin (%)

11
Ahluwalia Contracts (India) Ltd
www.jhaveritrade.com
AHLUWALIACONTRACTS(INDIA) LTD.
FY 1112.55321.4611.95202.79344.38290.57833.08542.511154.461752.981752.98
7.861741.161551.1
6.73169.87145.99132.45108.5772.05
FY 1212.55274.97546.87248.3384.17150.51772.43621.921168.791445.851445.85
9.181511.081441.63
3.8429.99-0.96-17.46-48.41-46.43
FY 1312.55
203.66512.81
274358.24169.74729.72559.98
1072.791432.521430.87
42.671416.551468.27
4.356.25
-30.83-34.23-71.31-71.31
Equity Paid UpNetworthCapital EmployedTotal DebtGross Block (Excl. Reval. Res.)Net Working Capital ( Incl. Def. Tax)Current Assets ( Incl. Def. Tax)Current Liabilities and Provisions ( Incl. Def. Tax)Total Assets/Liabilities (excl Reval & W.off)Gross SalesNet SalesOther IncomeValue Of OutputCost of ProductionSelling CostPBIDTPBDTPBITPBTPAT
FY 1412.55
225.39531.39238.59338.24184.02702.4
518.381049.78960.63960.626.9
977.36908.59
4.3472.7934.1560.3821.7421.74
Key Financials
Financial Performance
Ratio Analysis
(` in Cr.)
FY 110.620.091.173.455.559.697.568.336.244.1126.125.12
FY 120.760.091.032.49-0.562.07-1.21-0.070.07-3.21-3.01
-15.57
FY 131.090.2
0.932.7
-1.49-1.03-3.86-3.62-3.62-6.45
-10.43-38.58
Key Ratios Debt-Equity Ratio(x) Long Term Debt-Equity Ratio(x) Current Ratio(x)Total Asset Turnover Ratio(x) Interest Cover Ratio(x) PBIDTM (%) PBITM (%) PBDTM (%) CPM (%)APATM (%) ROCE (%) RONW (%)
FY 141.190.260.971.840.935.013.720.990.99-0.36.85-1.34
Com
pany
Ana
lysi
s
www.jhaveritrade.com
Monthly Technical Picks
12
Monthly Technical Picks
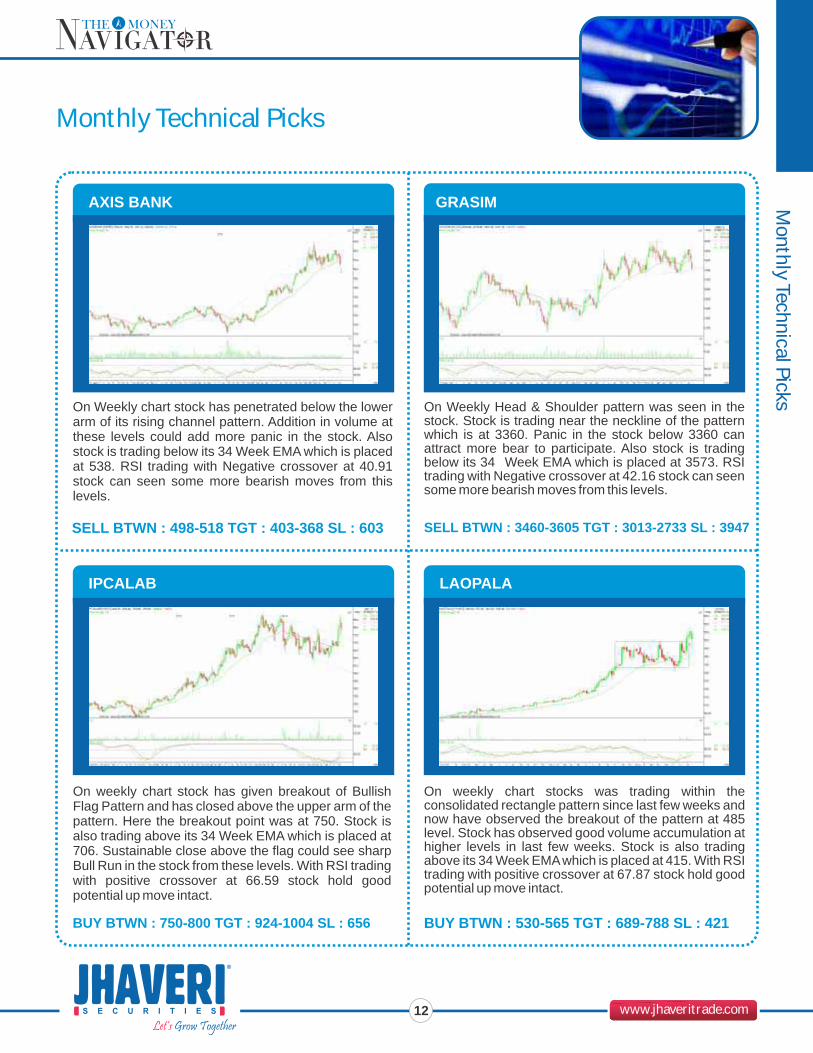
On Weekly chart stock has penetrated below the lowerarm of its rising channel pattern. Addition in volume atthese levels could add more panic in the stock. Alsostock is trading below its 34 Week EMA which is placedat 538. RSI trading with Negative crossover at 40.91stock can seen some more bearish moves from thislevels.
On Weekly Head & Shoulder pattern was seen in thestock. Stock is trading near the neckline of the patternwhich is at 3360. Panic in the stock below 3360 canattract more bear to participate. Also stock is tradingbelow its 34 Week EMA which is placed at 3573. RSItrading with Negative crossover at 42.16 stock can seensome more bearish moves from this levels.
On weekly chart stock has given breakout of BullishFlag Pattern and has closed above the upper arm of thepattern. Here the breakout point was at 750. Stock isalso trading above its 34 Week EMA which is placed at706. Sustainable close above the flag could see sharp Bull Run in the stock from these levels. With RSI tradingwith positive crossover at 66.59 stock hold goodpotential up move intact.
On weekly chart stocks was trading within theconsolidated rectangle pattern since last few weeks andnow have observed the breakout of the pattern at 485level. Stock has observed good volume accumulation athigher levels in last few weeks. Stock is also tradingabove its 34 Week EMAwhich is placed at 415. With RSItrading with positive crossover at 67.87 stock hold goodpotential up move intact.
AXIS BANK GRASIM
IPCALAB LAOPALA
BUY BTWN : 750-800 TGT : 924-1004 SL : 656
SELL BTWN : 498-518 TGT : 403-368 SL : 603
BUY BTWN : 530-565 TGT : 689-788 SL : 421
SELL BTWN : 3460-3605 TGT : 3013-2733 SL : 3947

www.jhaveritrade.com
Mut
ual F
und
Can Balanced Funds be Your Best Bet
The perpetual question that investors are faced with is: Debt or Equities.As an investor should one opt for the volatility and toget high returns of equities? Or one should seek safety in debts while gathering moderate returns? What if there was a wayto invest in both - equities and debts, generate high returns with moderate risk? That sounds like perfection and that is whatBalanced Funds strive to be.
These are a fund that constitutes of investments in equities, debt and occasional investments in short term money market allin a single fund. Balanced funds have a fixed percentage of investment in every asset class. An Equity Oriented BalancedFund will have minimum 65% of equity and 35% of Debt investment. A Debt Oriented Balanced Fund will have 70 - 85% indebt and 15 - 30% investments in equity.Abalanced fund is ideal for investors who are looking for a mix of safety, income andmodest returns on their investment.
Diversification is one aspect you have probably heard your financial planners and experts talk about when they discuss‘successful ways of building a portfolio’. You are constantly thinking of ways to rebalance and diversify and moving aroundyour funds and not allowing your investments to settle at one place. Investing in balanced funds reduces the need toconstantly move around funds as it auto rebalances the allocation.
Getting the asset allocation right is the biggest challenge for any investor. People spend years in the industry and still fail tobe sure if the asset allocation will yield the right results as it has often been on a slippery ground. One of the major factorstaken into consideration during asset allocation is the current age and risk appetite of the investor.
While the Balance Funds rebalances the risk, the return difference between pure Diversified Equity Mutual Funds andEquity Oriented Balanced Funds is very less. See the chart below and you will notice that investors can still make goodreturns from Equity Oriented Balanced Funds by not taking as much risk as they would have taken in case of Diversified Equity Funds.
What are Balanced Funds
Reduces the Need to Diversify
AssetAllocation has been done
13
Hybrid Equity Oriented Diversified Equity Funds
1 Year 3 Years 5 Years 10 Years
16.64%
19.08% 19.22%
22.33%
12.41% 12.96%14.57%
17.80%
www.jhaveritrade.com14
Promises Returns and Safety
The Flipside
Conclusion
It would be an ideal scenario if an investor could maximize returns by undertaking zero risk. The Balanced Fund balancesout the risk imposed by equities by investing in debts and thus making this a moderately safe investment. The sudden rise ordrop in performances is never appreciated as it points towards volatility and the investors must try to avoid it. So let us take alook at the past performances of various types of Balanced Funds.
The table above shows balanced funds with various asset allocations and the category performances over the years. It canbe seen in the last ten or so years the funds have delivered decent returns and in some cases stellar returns. Equity orientedBalanced Funds have given a stellar performance and generated cumulative returns of over 270%. So do you want tobelieve the experts? That is alright! But numbers do not lie and your bank accounts statements definitely do not.
Asset Allocation is often considered to be a personalized task where investors and advisors discuss and design a portfoliowhich is especially suited to the investor’s need. While Balanced Funds have asset allocation inbuilt in the funds they are notcustomized to fit into the individual investor’s needs. Hence, these funds are not tailor made and cater to a larger objectiveand not to personalized objectives or needs. So an investor has to make an investment decision to design a portfolio withasset allocation which will generate the stellar returns as the funds or invest in Balanced Funds.
Balanced Funds are excellent option for investing for the long term. Balanced Funds make a good investment choice even ina falling market as the fixed returns on debts keep the returns steady. Therefore, investors with the help of the debtcomponent often get ahead of falling markets. The investors again can take advantage of rising markets due to the exposurein equities. Hence, investors can gain much more than they have to lose by investing in balanced funds.
With automatic rebalancing of your portfolio and tax efficient returns, equity oriented Balanced Fund could be one of yourbest investing choices if you are able to take moderate risk. However, if you are a conservative investor then you canconsider debt oriented balanced funds like Monthly Income Plans (MIP), etc. So, instead of pouring hours over differentfunds and schemes and figuring the right asset allocation and the ways to rebalance go for the Balanced Fund options andsee your investments grow steadily.
Can Balanced Funds be Your Best Bet
Debt Oriented Aggressive
Return : 1Year
CumulativeReturn: 2 YearType of Balanced Fund Cumulative
Return: 5 YearCumulative
Return: 10 Year
11.63% 32.04% 51.61% 139.57%
Debt Oriented Conservative 10.72% 28.47% 53.58% 128.46%
Equity Oriented 18.59% 60.68% 78.07% 270.04%
Mutual Fund
www.jhaveritrade.com
Com
mod
ity
Commodity
15
Bullion
Recommendation
Energy
Recommendation
Bullion prices plummeted last week with the gold off by more than 2% to settle at 26623 amid expectations the FederalReserve will start raising interest rates at its next policy meeting in September. Comments by Federal Reserve ViceChairman Stanley Fischer on Friday suggested that the door was still open for a rate hike at the Fed's next meeting due totake place September 16-17. Fischer said that the case for a rate increase in September was "pretty strong", though it wasstill too soon to say what the central bank might do. The timing of a Fed rate hike has been a constant source of debate in themarkets in recent months. Expectations of higher borrowing rates going forward is considered bearish for gold, as theprecious metal struggles to compete with yield-bearing assets when rates are on the rise. While Silver dropped more than -5% tracking weakness from Comex Silver plunged to $13.91 on Wednesday, a level not seen since August 2009 on theweek, the biggest weekly decline since mid- February. Last week’s damage was due mainly to the continued deflating ofthe stock market bubble in China in the early part of the week, which also triggered some dramatic movements in globalequity markets. This is likely due to the fact that silver is more of an industrial metal than a monetary metal,whereas gold is viewed significantly more as a safe haven asset during times of financial distress. Last week dollar index,inched up 0.4% on Friday to close at 96.15, the strongest level sinceAugust 20. The index rose 1.2% on the week as upbeatU.S. economic data fanned expectations that the Fed will raise interest rates next month. Meanwhile hedge funds andmoney managers hiked a bullish bet in Comex gold and raised their net long position in silver Futures and Options in theweek ended Aug. 25, US CFTC data showed on Friday. In the week ahead, investors will be focusing on Friday’s U.S. jobsreport for August, which could help to provide clarity on the likelihood of a near-term interest rate hike. Markets will also bewatching surveys of the manufacturing and service sectors, factory orders and trade data from the world’s largest economyfor fresh indications on the timing of a rate hike.
SELLGOLD OCT ON JUMP @ 26850 SL27100 TGT 26450-26100.In energy market Crude oil rose nearly 12% on geopolitical instability in Yemen and worries about weather in the Gulf ofMexico. While Natural Gas regained strength as forecasts for warm weather across key consumption regions of the U.S. Inthe week ahead boosted demand expectations for the fuel. Crude prices rallied as market was saturated with short sellerswhich can be seen from the drop in open interest by -49.30% to settle at 18975 against previous week’s 37472. Crude oilprices rebounded from steep declines suffered earlier in the week as Chinese equity markets bounced back from a brutalselloff, easing jitters over an ongoing stock market collapse. China's central bank boosted liquidity, cut interest rates andlowered the reserve requirement ratio for large lenders earlier this week in a bid to boost economic growth and halt a stockmarket rout. The turmoil in markets began when China unexpectedly devalued the yuan on August 11, sparking fears thatthe economy may be slowing at a faster than expected rate. Crude oil prices have been under heavy selling pressurein recent months, as ongoing concerns over a glut in world markets drove down prices. Global oil production is outpacingdemand following a boom in U.S. shale oil production and after a decision by the OPEC last year not to cut production.Worries over high domestic U.S. oil production are likely to remain in focus after industry research group Baker Hughes saidlate Friday that the number of rigs drilling for oil in the U.S. increased by one last week to 675, the sixth straight weekly gain.The rig count dropped for 29 straight weeks before rebounding modestly in recent weeks. While Natural gasregained strength on Friday, as forecasts for warm weather across key consumption regions of the U.S. in the week aheadboosted demand expectations for the fuel. Updated weather forecasting models released Friday showed that mostparts of the southern and western U.S. will be engulfed by hot temperatures in the coming days. However, coolerweather was expected across most parts of the Great Lakes, Northeast and Midwest-regions as the week progresses.Markets will also be watching surveys of the manufacturing and service sectors, factory orders and trade data from theworld’s largest economy for fresh indications on the timing of a rate hike.
SELL GOLD OCT ON JUMP @ 26850 SL 27100 TGT 26450-26100.SELL SILVER DEC @ 35900 SL 36800 TGT 34800-33800.
BUY CRUDE OIL SEPT @ 2920 SL 2800 TGT 3060-3180.SELL NAT.GAS SEPT @ 185 SL 192 TGT 177-172.

Member: NSE / BSE / NSDL / MCX / NCDEX
To get registered for Online IPO,Missed Call: 080 49336 177or SMS “JeTrade IPO” on 9601336677
Can be Applied Anywhere Anytime
Can be Applied against the Ledger Balance / RTGS
Shorter IPO Cycle
ONLINE
IPOONLINEONLINE
IPO
Saves Time
How can I capitalize on this Opportunity?Apply in multiple family a/c to maximize allotmentApply on click – First cum first serve basisGreater allotment without any rejection

301/302, Payal Tower-II, Sayajigunj Vadodara - 390020, Ph.: + 91 265-3071200Web.: www.jhaveritrade.com I www.jetrade.in
DISCLAIMER : Trading and Investment decision taken on your consultation are solely at the discretion of the traders/investors.We are not liable for any loss, which occur as a result of our recommendations. This document hasbeen prepared on the of publicly available information, internally developed data and other sources believed to be reliable.
NSE:INB/F/E 230823233 BSE: INB/F 010823236 NSDL: IN-DP-NSDL-166-2000, MCX-SX: INE 26082333 AMFI ARN 3524 MCX: TM 29040 / FMC REG NO. MCS / TC / CORP / 0963 MCDEX: TM 00749 / FMC REG NO.NCDEX / TCM / CORP / 0736 / NSELTM 10110* Note: Dealing in Commodity Segment through its group company Jhaveri Credits & capital Ltd.Distributors for IPOs & Mutual Funds. Past performance is not a measure for future returns.
Date Time in IST Country/EventCurrency6:30am
11:30am
7:15am
11:30am
11:30am
11:30am
12:30am
11:00am
11:00am
12:15pm
2:30pm
7:15am12:45pm1:25pm2:30pm7:30pm
12:30pm5:45pm6:00pm
7:30pm8:00pm
12:45pm2:30pm5:15pm6:00pm
7:30pm
5:40pm6:00pm
2:00pm7:30pm
3:30pm
7:00am
7:30pm8:00pm11:30pm
12:15pm6:00pm
7:30pm8:00pm
6:00pm
7:30pm
1:30pm2:30pm
6:00pm
6:45pm
7:30pm
CNY
EUR
CNY
EUR
EUR
EUR
USD
EUR
CNY
EUR
EUR
CNYCNYEUREUREURUSD
EURUSDUSDUSDUSDUSD
EUREUREUREURUSDUSDUSD
USDUSDUSDUSD
EURUSD
USD
CNYCNYUSDUSDUSD
EURUSDUSDUSDUSD
CNYUSDUSDUSD
EUREUR
EURUSDUSDUSDUSDUSDUSD
Manufacturing PMI
German Retail Sales m/m
Caixin Services PMI
German Factory Orders m/m
German Industrial Production m/m
German Trade Balance
Consumer Credit m/m
French Final Non-Farm Payrolls q/q
Industrial Production y/y
French CPI m/m
German ZEW Economic Sentiment
Non-Manufacturing PMICaixin Final Manufacturing PMISpanish Manufacturing PMIGerman Unemployment ChangeUnemployment RateISM Manufacturing PMI
Spanish Unemployment ChangeADP Non-Farm Employment ChangeRevised Nonfarm Productivity q/qRevised Unit Labor Costs q/qFactory Orders m/mCrude Oil Inventories
Spanish Services PMIRetail Sales m/mMinimum Bid RateECB Press ConferenceTrade BalanceUnemployment ClaimsISM Non-Manufacturing PMI
FOMC Member Lacker SpeaksNon-Farm Employment ChangeUnemployment RateAverage Hourly Earnings m/m
Sentix Investor ConfidenceLabor Market Conditions Index m/m
NFIB Small Business Index
CPI y/yPPI y/yJOLTS Job OpeningsCrude Oil InventoriesFederal Budget Balance
French Industrial Production m/mUnemployment ClaimsImport Prices m/mWholesale Inventories m/mNatural Gas Storage
Fixed Asset Investment ytd/yPPI m/mCore PPI m/mPrelim UoM Consumer Sentiment
Italian Trade BalanceIndustrial Production m/m
ZEW Economic SentimentCore Retail Sales m/mRetail Sales m/mEmpire State Manufacturing IndexCapacity Utilization RateIndustrial Production m/mBusiness Inventories m/m
Tue Sep 1
Wed Sep 2
Thu Sep 3
Fri Sep 4
Mon Sep 7
Tue Sep 8
Wed Sep 9
Thu Sep 10
Fri Sep 11
Mon Sep 14
Tue Sep 15
Date Time in IST Country/EventCurrencyWed Sep 16
Thu Sep 17
Fri Sep 18
Mon Sep 21
Tue Sep 22
Wed Sep 23
Thu Sep 24
Fri Sep 25
Mon Sep 28
Tue Sep 29
Wed Sep 30
1:30am
1:30pm
12:00am
2:00am
7:15am
1:30pm
2:30pm
11:30am
6:00pm
11:30am
1:25pm
11:30am2:30pm6:00pm
8:00pm
6:00pm
7:30pm8:00pm11:30pm
1:30pm7:30pm
3:30pm7:30pm
7:30am12:30pm
1:00pm
1:30pm
8:00pm
2:45pm6:00pm
6:30pm7:30pm8:00pm
1:30pm
6:00pm
7:30pm
7:30pm
12:15pm12:30pm1:30pm2:30pm6:00pm7:30pm
2:30pm
5:45pm7:15pm8:00pm
TIC Long-Term Purchases
ECB Economic Bulletin
FOMC Press Conference
German PPI m/m
Caixin Flash Manufacturing PMI
German Ifo Business Climate
Italian Retail Sales m/m
GfK German Consumer Climate
Core PCE Price Index m/m
German Import Prices m/m
German Unemployment Change
German WPI m/mFinal CPI y/yCPI m/mCore CPI m/mCrude Oil Inventories
Building PermitsUnemployment ClaimsCurrent AccountPhilly Fed Manufacturing IndexNatural Gas StorageFOMC Economic ProjectionsFOMC Statement
Current AccountCB Leading Index m/m
German Buba Monthly ReportExisting Home Sales
CB Leading Index m/mFrench Flash Manufacturing PMIFrench Flash Services PMIGerman Flash Manufacturing PMIGerman Flash Services PMIFlash Manufacturing PMIFlash Services PMI
Crude Oil Inventories
Targeted LTROCore Durable Goods Orders m/mUnemployment ClaimsDurable Goods Orders m/mBelgian NBB Business ClimateNew Home SalesNatural Gas Storage
M3 Money Supply y/yPrivate Loans y/yFinal GDP q/qFinal GDP Price Index q/qRevised UoM Consumer Sentiment
Personal Spending m/mPersonal Income m/mPending Home Sales m/m
French Consumer Spending m/mSpanish Flash CPI y/yItalian Monthly Unemployment RateItalian Prelim CPI m/mGoods Trade BalanceCB Consumer Confidence
CPI Flash Estimate y/yCore CPI Flash Estimate y/yUnemployment RateADP Non-Farm Employment ChangeChicago PMICrude Oil Inventories
USD
EUR
USD
EUR
CNY
EUR
EUR
EUR
USD
EUR
EUR
EUREURUSDUSDUSD
USDUSDUSDUSDUSDUSDUSD
EURUSD
EURUSD
CNYEUREUREUREUREUREUR
USD
EURUSDUSDUSDEURUSDUSD
EUREURUSDUSDUSD
USDUSDUSD
EUREUREUREURUSDUSD
EUREUREURUSDUSDUSD