the monty hall problem: a study -...
TRANSCRIPT
The Monty Hall Problem: A Study
Michael Mitzenmacher
Research Science Institute 1986
Abstract
The Monty Hall problem is based on apparent paradox that is commonly misun-
derstood, even by mathematicians. In this paper we define the Monty Hall problem
and use a computer simulation to shed light on it. We then provide a mathematical
explanation that fits the experimental results.
1

1 Introduction
The Monty Hall problem is based on the following scenario familiar to those who have watched
the show Let’s Make a Deal. The host (Monty) points to three doors and tells you that
behind two of the doors await hungry goats, while behind the third door sits a brand new
automobile. If you choose the automobile, you get to keep it, and otherwise you are stuck
with a goat. Monty asks you to choose a door. After you make your choice, Monty opens a
different door and shows you a goat.1 He now gives you the option of changing doors. What
should you do?
A common response, even among professional mathematicians, is to say that there is no
difference between switching and not switching. After all, we knew that there was a goat
behind one of the two doors we did not choose anyway. Monty’s showing us a goat does
not give us any new information. Since there are two doors left, the probability of the car
being behind each remaining door is now fifty percent. In fact, this argument is wrong, as
we shall demonstrate. The correct strategy is to switch, and the odds of winning the car
double when the switch is made.
In the rest of this paper, we define the problem carefully, and show the results of a
computer simulation. We then explain our results, demonstrating the fallacy in the above
argument.
2 Materials and Methods
We began to test two possible strategies (always switch or always stay) using playing cards.
Three cards (an ace, king, and queen) were shuffled randomly by a dealer who knew the
position of each card, while a player tried to find the ace. Preliminary results demonstrated
1A possible misconception is that Monty opens a random door for you. This is not the case; Monty,knowing what lies behind all doors, chooses a door with a goat behind it in order to build suspense for boththe studio audience and the viewers at home.
2
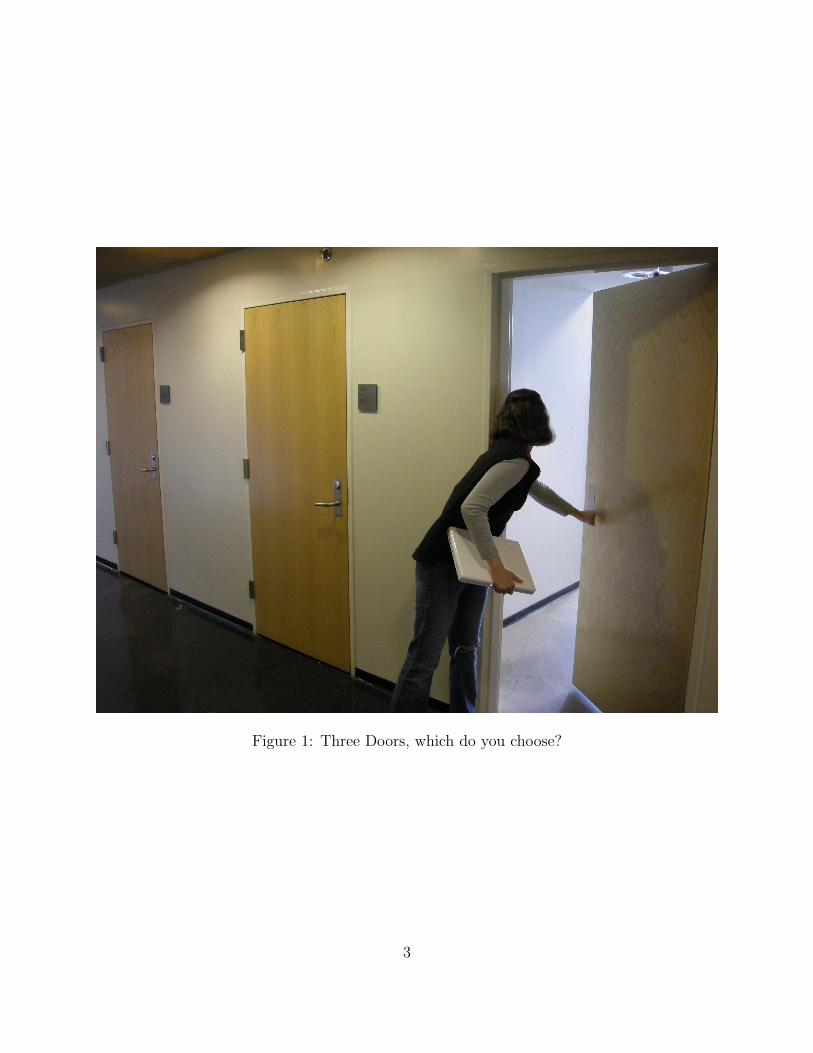
Figure 1: Three Doors, which do you choose?
3

Game Stay Switch
Original 33.326% 66.708%13 Cards 7.68% 8.39%
Table 1: Success rates in the original Monty Hall scenario
that the strategy of always switching fared better, but playing it out by hand proved too
slow to get meaningful results.
To get more data, we wrote a program in C to play the game repeatedly. The program
uses pseudo-random numbers generated by the functions rand and srand [2], available in
standard Unix-based systems. Although the numbers generated are not truly random, they
are sufficiently random for the purposes of this experiment. The program is designed so that
it is easy to change the number of times the game is played and the number of cards used.
3 Results
The program was set to generate samples of one million games. In ten runs, the average
percentage of times the switching strategy proved successful was 66.708%, with a standard
deviation of of 0.033%. In a separate set of ten runs, the strategy of always staying with
the original choice succeeded 33.326% of the time with a standard deviation of 0.056%. (See
Figure 2)
We also changed the program to simulate the game with thirteen cards. Here the switch-
ing strategy still provides an edge, although less dramatically so. The switching strategy
succeeded an average of 8.39% (approximately 12/143) of the time over ten trials of one
million games, while staying succeeded on average 7.68% (approximately 1/13) of the time.
The results of both strategies are shown in Table 1.
4

1 2 3 4 5 6 7 8 9 1066.4
66.5
66.6
66.7
66.8
Trial
Perc
ent S
ucce
ssAlways Switching
1 2 3 4 5 6 7 8 9 1033.2
33.3
33.4
33.5
33.6
Trial
Perc
ent S
ucce
ss
Always Staying
Figure 2: Success rates in Monte Carlo simulation of the Monty Hall problem
5

4 Discussion
We now provide both the intuition and a mathematical justification for our results. The
fallacious argument described in the introduction suggests that by showing us a goat, Monty
has not given us any new information, since we knew there was a goat behind one of the
doors anyway. This reasoning is faulty. Simply by listing the possibilities one finds in the
three-door case one finds that the switching strategy works whenever the staying strategy
fails. Staying clearly succeeds one time out of three, so switching works two times out of
three, matching the experimental evidence.
One way to see the problem with this logic is to expand the problem to one hundred
doors. After we choose a door, suppose Monty shows us ninety-eight goats, leaving just our
door and one other. Surely one would want to switch in this case. Even though we knew
that ninety-eight doors hid goats, by showing us the goats, it seems that Monty has given
us something.
The key to the problem is a restricted choice. Suppose you choose the first door. If it
hides a goat, Monty now has no choice of which door to open for you. His choice was thus
restricted. If instead your door holds the car, Monty does have a choice of doors to open for
you.
So suppose that Monty opens the second door and shows you a goat. You have, in fact,
gained some information, namely that the second door did not originally hide the car. But
why does this make the third door more likely to hold the car? Because if a goat waited
behind the third door, Monty might have shown you it instead of opening the second door.
This is a difficult point to understand, yet it is the key to the problem. Essentially, it pays to
assume Monty did not have a choice of which door to open, because if he did, he might have
chosen differently. This phenomenon of restricted choice occurs in many game situations.
For example, it is a well-known phenomenon in the game of bridge. [1] A more mathematical
6

derivation is provided in the appendix.
Finally, what would we expect our standard deviations to be for percent success over
a million trials? If we always stay with the door we initially pick, then our probability of
success is 2/3. The standard deviation σ of a binomial distribution with mean p is given by:
σ =√
(p)(1− p) (1)
In our case, p is 2/3, so σ is√
2/3. However, since we are making one million observations
of p at a time, the standard deviation of the percentage of success is 100 × σ/√
1000000 =√
2/30 ≈ 0.047%. The expected standard deviation for always switching will be the same,
since in this case p is now 1/3 and 1− p is 2/3. Our observed standard deviations of 0.033%
and 0.056% match well with the predicted value of 0.047%.
5 Conclusion
We have explained the Monty Hall problem and given evidence based on a computer program
for the correct answer to the puzzle. Besides providing a mathematical treatment, we suggest
that the intuitive concept of restricted choice is the key to understanding the Monty Hall
problem and similar situations.
6 Acknowledgments
I would like to thank the other teachers for offering valuable corrections to the early drafts
of the paper.
7

Appendix
We give a mathematical justification of our results. More formally, suppose one begins with
n doors. The probability of choosing correctly to begin with is thus 1/n and the probability
of choosing incorrectly is (n− 1)/n. When you are wrong initially, if you switch after Monty
shows a goat you win 1/(n−2) of the time. Thus the total probability of success by switching
is (n − 1)/(n × (n − 2)). A simple check shows that switching is preferable and that this
formula matches our results extremely well.
8
References
[1] The Official Bridge Encyclopedia, 1982.
[2] UNIX manual pages.
9